accelerating high-speed broadband in turkey … · foundations, barriers, and policy considerations...
TRANSCRIPT
Foundations, barriers, and policy considerations
Strategy& is part of the PwC network
Accelerating high-speed broadband in Turkey

2 Strategy&
Dubai
Mahmoud MakkiPrincipal [email protected]
Jad El [email protected]
Istanbul
Bahjat El-Darwiche Partner +90-212-376-5356bahjat.eldarwiche @strategyand.ae.pwc.com
Mustafa Uçar Principal +90-212-376-5356 mustafa.ucar @strategyand.tr.pwc.com
London
Alastair MacphersonPartner+44-20-7583-5000alastair.macpherson@strategyand.uk.pwc.com
Contacts

3Strategy&
The Strategy& Digital Prosperity Project brings together leading experts to provide thought leadership at the intersection of technology and economics. The project has developed measures of digitization and digital maturity to better inform policymakers and business leaders on how to use digitization to further economic and social progress.
The members of the project for the Turkey broadband study are: Bahjat El-Darwiche, Alastair Macpherson, Mahmoud Makki, Mustafa Ucar, and Jad El Mir. The following external experts also participated in the project for this report: Andrew Haire, Professor Raul Katz, and Paul Reynolds.
Bahjat El-Darwiche leads the communications, media, and technology practice in the Middle East for Strategy&. He is a partner with PwC Middle East. He provides advice to policymakers and regulators in the areas of sector policy, regulatory management, sector development, socioeconomic impact, and public–private partnerships. He advises telecom and technology players on business development and strategic investments, corporate strategy, digitization, governance, operating models, and restructuring.
Alastair Macpherson is a specialist in regulatory policy, economics, and strategy for the telecoms sector with Strategy&. Based in London, he is a partner with PwC UK, and is the leader of the firm’s International Telecommunications Regulatory Centre of Excellence.
Mahmoud Makki is a member of the communications, media, and technology practice with Strategy&. He is a principal with PwC Middle East, based in Dubai. He specializes in integrated broadband strategy development, commercial turnaround, analytical marketing, and business performance management for telecom operators, as well as over-the-top service providers. He also advises policymakers and regulatory bodies on national broadband plan development and execution.
Mustafa Uçar is a member of the communications, media, and technology practice with Strategy&. He is a principal with PwC Turkey, based in Istanbul. He brings extensive experience in the Turkish telecommunications and ICT markets. With his strategy-to-execution experience, he provides advice to telecom players about business planning, operating model and organization design, integration, and large-scale transformation programs.
Jad El Mir is a member of the communications, media, and technology practice with Strategy&. He is based in Dubai and is a manager with PwC Middle East. He works on strategy, business development, and transformation for telecom operators and technology clients. He focuses on customer-facing strategies, large-scale business transformations, and operating models. He also advises clients on sector strategies and national broadband plans.
About the Strategy& digital prosperity project
4 Strategy&
Andrew Haire is a globally renowned expert in telecommunications policy and regulation, with a 30-year career spanning the U.S., Europe, and Asia. Between 2000 and 2010 he served as the deputy-DG of the Infocomm Development Authority (IDA) in Singapore — the local policy, regulatory, and sector development body of the country — during which time he led the delayering of the telecom-sector structure leading to the structural separation of SingTel.
Professor Raul Katz is adjunct professor in the Division of Economics and Finance at Columbia Business School. He is a globally renowned expert in telecommunications economics and finance, with special focus on national broadband network investments and demand stimulation. He has published five books and more than 20 articles; and he advises multilateral organizations such as the World Bank and the International Telecommunications Union and industry bodies such as GSMA and the World Economic Forum.
Paul Reynolds is a leading international telecom company chief executive with deep experience in separating networks. He has been a leader in two well-known separation cases: first, as CEO of Telecom New Zealand, overseeing the de-merger of the Chorus access network business from Telecom NZ and the creation of two completely separate listed companies; second, as CEO of BT Wholesale, leading BT’s functional separation program with the spin-off of the access network and operations, creating BT Openreach.
This report (“Report”) has been prepared by Strategy& (formerly Booz & Company), part of the PwC network (“Strategy&”), for Türk Telekomunikasyon A.S. (“Türk Telekom”). Although funded by Türk Telekom, this report represents Strategy&’s independent analysis and perspective. The contributing experts reviewed this report to provide an additional independent test of its findings.
This report contains information about mechanisms to accelerate national broadband in Turkey. The report is for informational purposes only and is not advice and should not be treated as such.
In compiling this report, Strategy& has used publicly available information and information in other reports and materials provided by third parties. Strategy& does not assume responsibility for and has relied, without independent verification, on the accuracy and completeness of any such information available at the time of writing the report. Any results from the analysis contained in this report are therefore based on Strategy&’s best professional judgment using the available information; it is possible to reach other reasonable judgments and recommendations.
The reader agrees that Strategy& neither owes nor accepts any duty or responsibility to it, whether in contract or in tort (including but not limited to, negligence and breach of statutory duty), and shall not be liable in respect of any loss, damage or expense of whatsoever nature which is caused by any use (or non-use) the reader may choose to make of this report and its contents, or which is otherwise consequent upon the gaining of access to this report by the reader, including any action or decision taken as a result of such use (or non-use).
Strategy& excludes all representations, warranties, undertakings and guarantees relating to the report. Specifically, Strategy& does not represent, warrant, undertake or guarantee (i) that the information in the report is correct, accurate, complete or non-misleading and (ii) that the use of guidance in the report will lead to any particular outcome or is fit for any particular purpose.
All copyrights and other proprietary rights in this report are reserved and no license, expressed or implied, is granted or intended.
Contributing experts
Important notice from Strategy& (Formerly Booz & Company)
5Strategy&
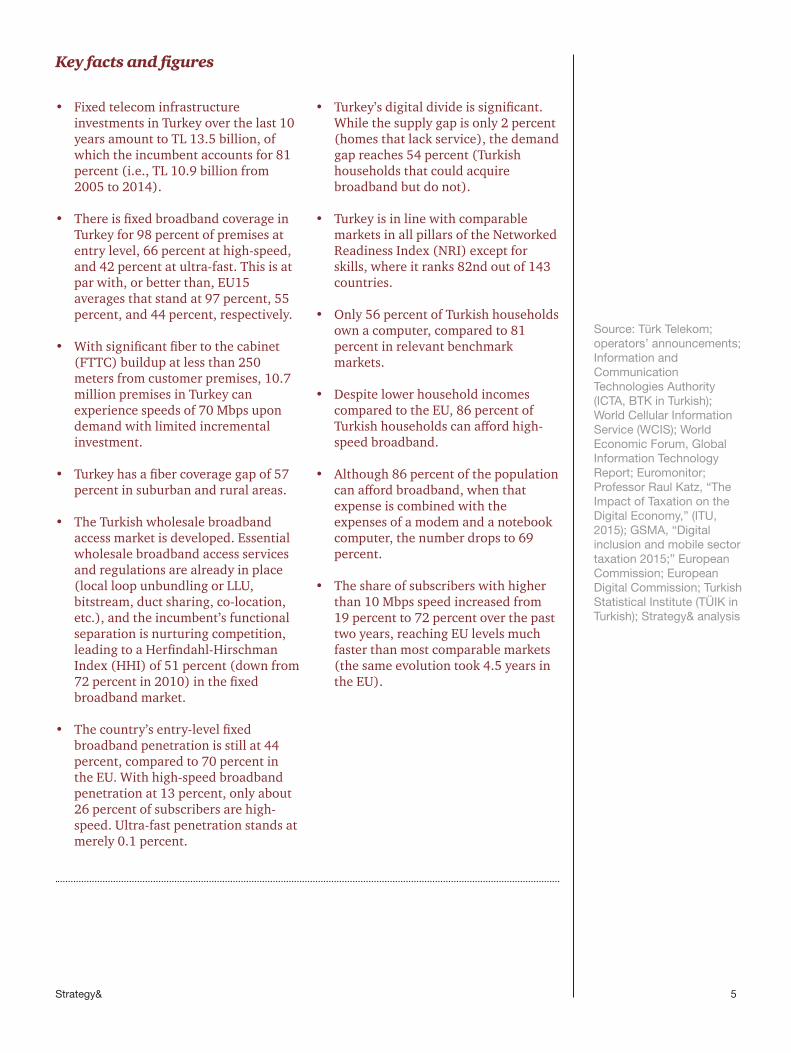
• Fixed telecom infrastructure investments in Turkey over the last 10 years amount to TL 13.5 billion, of which the incumbent accounts for 81 percent (i.e., TL 10.9 billion from 2005 to 2014).
• There is fixed broadband coverage in Turkey for 98 percent of premises at entry level, 66 percent at high-speed, and 42 percent at ultra-fast. This is at par with, or better than, EU15 averages that stand at 97 percent, 55 percent, and 44 percent, respectively.
• With significant fiber to the cabinet (FTTC) buildup at less than 250 meters from customer premises, 10.7 million premises in Turkey can experience speeds of 70 Mbps upon demand with limited incremental investment.
• Turkey has a fiber coverage gap of 57 percent in suburban and rural areas.
• The Turkish wholesale broadband access market is developed. Essential wholesale broadband access services and regulations are already in place (local loop unbundling or LLU, bitstream, duct sharing, co-location, etc.), and the incumbent’s functional separation is nurturing competition, leading to a Herfindahl-Hirschman Index (HHI) of 51 percent (down from 72 percent in 2010) in the fixed broadband market.
• The country’s entry-level fixed broadband penetration is still at 44 percent, compared to 70 percent in the EU. With high-speed broadband penetration at 13 percent, only about 26 percent of subscribers are high-speed. Ultra-fast penetration stands at merely 0.1 percent.
• Turkey’s digital divide is significant. While the supply gap is only 2 percent (homes that lack service), the demand gap reaches 54 percent (Turkish households that could acquire broadband but do not).
• Turkey is in line with comparable markets in all pillars of the Networked Readiness Index (NRI) except for skills, where it ranks 82nd out of 143 countries.
• Only 56 percent of Turkish households own a computer, compared to 81 percent in relevant benchmark markets.
• Despite lower household incomes compared to the EU, 86 percent of Turkish households can afford high-speed broadband.
• Although 86 percent of the population can afford broadband, when that expense is combined with the expenses of a modem and a notebook computer, the number drops to 69 percent.
• The share of subscribers with higher than 10 Mbps speed increased from 19 percent to 72 percent over the past two years, reaching EU levels much faster than most comparable markets (the same evolution took 4.5 years in the EU).
Key facts and figures
Source: Türk Telekom; operators’ announcements; Information and Communication Technologies Authority (ICTA, BTK in Turkish); World Cellular Information Service (WCIS); World Economic Forum, Global Information Technology Report; Euromonitor; Professor Raul Katz, “The Impact of Taxation on the Digital Economy,” (ITU, 2015); GSMA, “Digital inclusion and mobile sector taxation 2015;” European Commission; European Digital Commission; Turkish Statistical Institute (TÜIK in Turkish); Strategy& analysis

6 Strategy&
Executive summary
Now is the time to accelerate the reach of national broadband in Turkey. Turkey has laid the groundwork for this acceleration. Broadband reach, speed, and affordability have been established, all abetted by a competitive market, a regulatory framework conducive to broadband development, and significant investments.
The barriers that are holding back the Turkish broadband market are: low demand among entry-level users, lagging demand for higher speeds, high taxation on devices, patchy coverage in suburban and rural areas, a challenging wholesale market, and inefficiencies in distribution. Drawing on the examples of successful policy interventions in markets similar to Turkey’s, our research recommends six policy measures that could propel the expansion of Turkey’s broadband reach by overcoming these barriers:
1 Stimulate demand by increasing broadband awareness and digital literacy, emphasizing promotion of high-touch distribution channels, and accelerating the uptake of high-speed broadband.
2 Increase relevant local content and applications, particularly those related to education, government services, and economic productivity.
3 Revise the taxation regime on broadband-related devices and services to reduce the cost of ownership, making broadband more affordable.
4 Infrastructure-based competition can be encouraged through the extension/redefinition of the regulatory holiday and introduction of other regulatory incentives.
5 Extend current subsidies (Universal Service Fund) and bridge coverage gaps in low-density areas.
6 Cooperate with municipalities to aggregate demand and ease right-of-way fees.
At this stage of Turkey’s market development, these six interventions would be more effective, and less disruptive, than alternative supply-restructuring measures such as structural separation.

7Strategy&
Building nationwide high-speed broadband access infrastructure in a timely and efficient manner would propel Turkey into a digital economy. This means providing nationwide access to high-speed Internet and high-value applications, including those that are bandwidth-hungry. This advance would support equitable socioeconomic advancement of Turkey and reinforce the country’s competitive global position, which will reap the related upside on GDP, job creation, competitiveness, and social welfare.
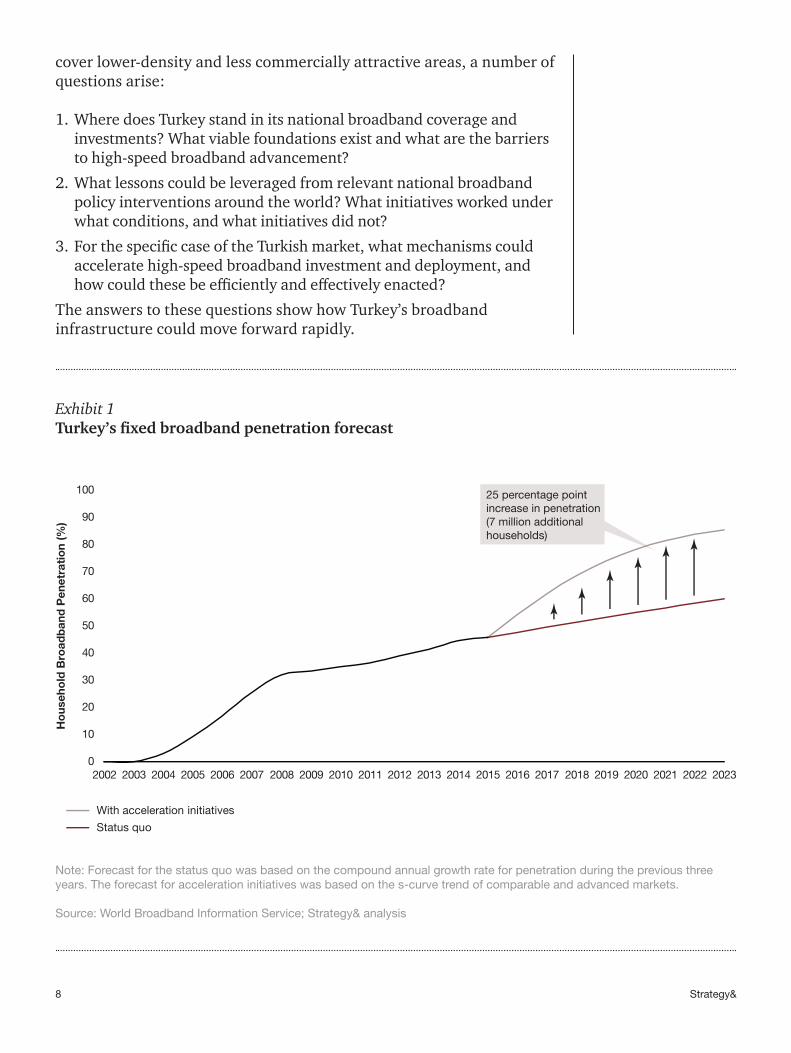
Turkey has the ability to make this change. The acceleration of the high-speed broadband market in Turkey by 25 percentage points is attainable within eight years with the right mechanisms. With this acceleration, 85 percent of households would have broadband by 2023, compared to 60 percent if the current conditions prevail.1 Global studies indicate that even an increase of 10 percent in broadband penetration would result in an increase of 0.3 percent to 1.4 percent in GDP growth.2 Expanding broadband creates jobs, increases worker productivity, and leads to an increase in consumer surplus. In Turkey, increasing fixed broadband uptake by 7 million homes3 could add a cumulative US$130 billion to Turkey’s GDP by 2023, and lead to an additional 0.5 million net jobs4 (see Exhibit 1, page 8).
Other leading markets around the world have benefited from effectively accelerating high-speed national broadband coverage and adoption. Their examples suggest that this change requires balance among demand stimulation, magnitude of investments, and policies and regulations. This type of balance is feasible for Turkey, and can be developed through partnership between government and the private sector.
Given the recent release of Turkey’s 64th government plan and the emphasis it puts on national broadband advancement, the recently granted LTE (Long Term Evolution) spectrum, and the imminent launch of 4.5G services by the country’s telecom operators, as well as the country’s current transition into the second stage of fiber deployment to
Turkey’s broadband opportunity
The acceleration of the high-speed broadband market in Turkey by 25 percentage points is attainable within eight years with the right mechanisms.
8 Strategy&
cover lower-density and less commercially attractive areas, a number of questions arise:
1. Where does Turkey stand in its national broadband coverage and investments? What viable foundations exist and what are the barriers to high-speed broadband advancement?
2. What lessons could be leveraged from relevant national broadband policy interventions around the world? What initiatives worked under what conditions, and what initiatives did not?
3. For the specific case of the Turkish market, what mechanisms could accelerate high-speed broadband investment and deployment, and how could these be efficiently and effectively enacted?
The answers to these questions show how Turkey’s broadband infrastructure could move forward rapidly.
Exhibit 1Turkey’s fixed broadband penetration forecast
Note: Forecast for the status quo was based on the compound annual growth rate for penetration during the previous three years. The forecast for acceleration initiatives was based on the s-curve trend of comparable and advanced markets.
Source: World Broadband Information Service; Strategy& analysis
Status quo
With acceleration initiatives
0
10
20
30
40
50
60
70
80
90
100
2002 2003 2004 2005 2006 2007 2008 2009 2010 2011 2012 2013 2014 2015 2016 2017 2018 2019 2020 2021 2022 2023
Ho
useh
old
Bro
adb
and
Pen
etra
tio
n (%
)
25 percentage pointincrease in penetration(7 million additionalhouseholds)
9Strategy&
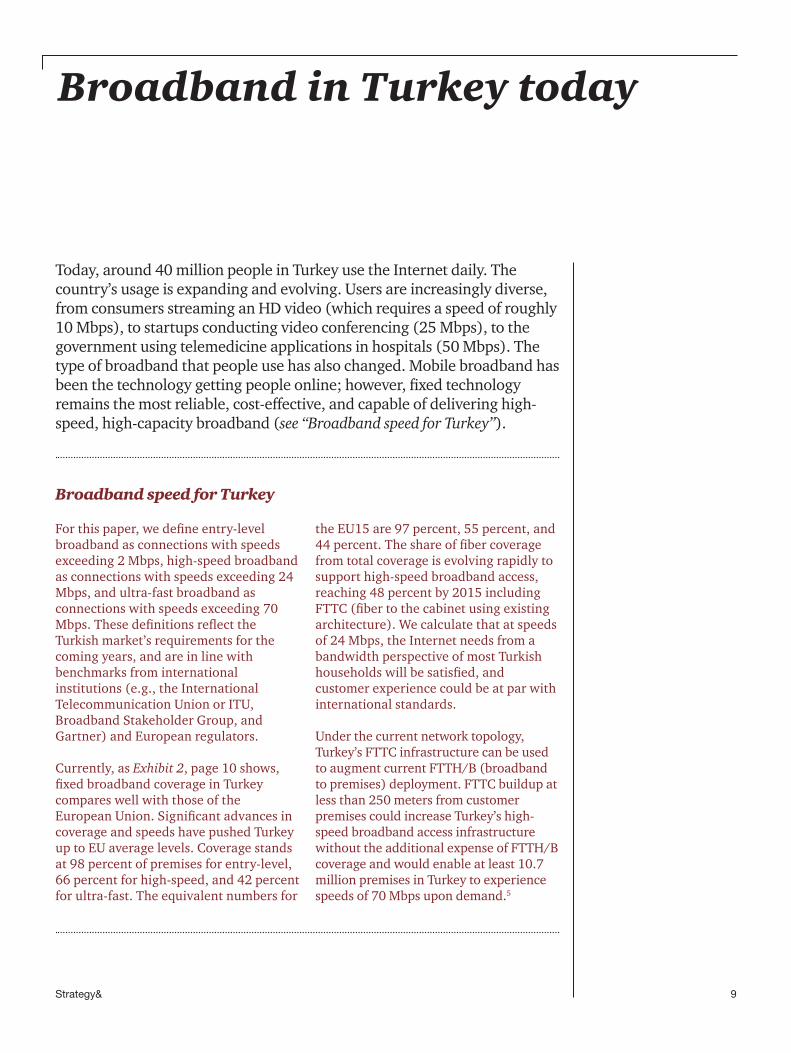
Today, around 40 million people in Turkey use the Internet daily. The country’s usage is expanding and evolving. Users are increasingly diverse, from consumers streaming an HD video (which requires a speed of roughly 10 Mbps), to startups conducting video conferencing (25 Mbps), to the government using telemedicine applications in hospitals (50 Mbps). The type of broadband that people use has also changed. Mobile broadband has been the technology getting people online; however, fixed technology remains the most reliable, cost-effective, and capable of delivering high-speed, high-capacity broadband (see “Broadband speed for Turkey”).
Broadband in Turkey today
For this paper, we define entry-level broadband as connections with speeds exceeding 2 Mbps, high-speed broadband as connections with speeds exceeding 24 Mbps, and ultra-fast broadband as connections with speeds exceeding 70 Mbps. These definitions reflect the Turkish market’s requirements for the coming years, and are in line with benchmarks from international institutions (e.g., the International Telecommunication Union or ITU, Broadband Stakeholder Group, and Gartner) and European regulators.
Currently, as Exhibit 2, page 10 shows, fixed broadband coverage in Turkey compares well with those of the European Union. Significant advances in coverage and speeds have pushed Turkey up to EU average levels. Coverage stands at 98 percent of premises for entry-level, 66 percent for high-speed, and 42 percent for ultra-fast. The equivalent numbers for
the EU15 are 97 percent, 55 percent, and 44 percent. The share of fiber coverage from total coverage is evolving rapidly to support high-speed broadband access, reaching 48 percent by 2015 including FTTC (fiber to the cabinet using existing architecture). We calculate that at speeds of 24 Mbps, the Internet needs from a bandwidth perspective of most Turkish households will be satisfied, and customer experience could be at par with international standards.
Under the current network topology, Turkey’s FTTC infrastructure can be used to augment current FTTH/B (broadband to premises) deployment. FTTC buildup at less than 250 meters from customer premises could increase Turkey’s high-speed broadband access infrastructure without the additional expense of FTTH/B coverage and would enable at least 10.7 million premises in Turkey to experience speeds of 70 Mbps upon demand.5
Broadband speed for Turkey

10 Strategy&
Fixed broadband market overview
Over the last five years,6 infrastructure based competition have attracted major investments (exceeding TL 20 billion from operators). The sector accounts for 2.2 percent of Turkey’s GDP, in line with the EU, and employs more than 100,000 people.7
There are reasons to be impressed with Turkey’s progress in fixed broadband to date. Significant advances in coverage and speed have boosted Turkey up to EU average levels over the past five years. Coverage stands at 98 percent of premises for entry-level, 66 percent for high-speed, and 42 percent for ultra-fast. The equivalent numbers for the EU15 are 97 percent, 55 percent, and 44 percent.8 The share of fiber coverage within total coverage has evolved rapidly to support high-speed broadband access, reaching 48 percent by 2015, including FTTC.9
Essential open access services and the accompanying regulations are in place - duct sharing, co-location, LLU, SLU, and bitstream. The current infrastructure-sharing market is developed. Türk Telekom, the fixed broadband incumbent, offers other companies access to ducts and to LLU, bitstream, and sub-loop unbundling (SLU) services. Of more than 1,900 applications received to share infrastructure in the past five years (2011-2015), 75 percent have been approved or are in the process of approval. Applications are generally rejected due to lack of infrastructure in a given route.10
Exhibit 2Fixed broadband coverage in Turkey by speed
Note: Entry-level is 2 Mbps and above, high-speed is 24 Mbps and above, and ultra-fast is 70 Mbps and above.
BB = broadband
Source: Türk Telekom; World Cellular Information Service; Strategy& analysis
Entry-level
98%
EU 15Turkey
97%
High-speed
EU 15
55%
Turkey
66%
Ultra-fast
42% 44%
Turkey EU 15
(% of premises, 2015)

11Strategy&
Yet, despite these advances, fixed broadband infrastructure presents several challenges in terms of deployment economics, geographical dependency, and speed of deployment. Although the current infrastructure-sharing market is developed, the incumbent incurs access deficit from infra-structure sharing services.11 Access prices should be adjusted to ensure sustainability. Both the fixed broadband and the mobile markets have become more competitive in the past five years. The mobile market’s HHI score (which measures market concentration, with a lower score corresponding to higher competitiveness) has dropped from 40 to 37 between 2010 and 2015. The fixed broadband market has changed more dramatically; its HHI score fell from 72 to 51 between 2011 and 2015. Türk Telekom exhibited the most significant change in the fixed market competitiveness score, with its market share dropping from 84 percent to 69 percent between 2011 and 2015, confirming that the market is on the right trajectory in terms of competition development.
The current market structure with infrastructure based competiton, as well as the supportive policies and regulations, have led to significant high-speed broadband deployment. The regulatory holiday for the incumbent, exempting fiber access from the market analysis process, has incentivized Türk Telekom to increase fiber investments from 0.7 million homes in 2011 to 3.3 million in 2015, and is in effect until October 2016 or until fiber subscribers exceed 25 percent of total fixed broadband subscribers.¹²
Turkey’s regulatory framework is still geared to managing market dominance and imposes more obligations than incentives on the incumbent’s fixed business. While incentives are the regulatory holiday and the absence of virtual unbundled local access (VULA) and IP interconnection remedies, obligations include access to infrastructure, regulation of resale products and fixed calls, co-location and facility sharing, and a single geographic definition.
In short, Turkey has passed the first stage in its high-speed broadband journey: deployment in urban and economically attractive areas. It is now embarking on its second stage: universal coverage. The fiber network in urban and suburban areas has been extended; the challenge is to cover unserved suburban areas and rural areas in a cost-effective way for operators. The coverage gap is currently at 57 percent in suburban and rural areas. But as deployment reaches deeper areas in Turkey, capital expenditures per home rise sharply, and the business case becomes less attractive. Once these issues are addressed, the country will see its digitally related economic growth accelerate.
Turkey has passed the first stage in its high-speed broadband journey: deployment in urban and economically attractive areas. It is now embarking on its second stage: universal coverage.

12 Strategy&
Filling the Gaps
Turkey has two gaps to fill. First, the current topology of high-speed coverage in suburban and rural areas is patchy. Turkey has a fiber coverage gap of 57 percent in suburban and rural areas. Operators have focused primarily on deployment in dense urban, and urban areas, which is economical. Rolling out FTTH in suburban areas in Turkey is estimated to cost twice as much as in dense urban areas; in rural areas, the figure is four times as much.13 Operator-funded infrastructure expansion into those less economically viable geographies will require more guarantees to render the business case appealing.
Second, Turkey has a large demand gap due to slow uptake. The country’s entry-level fixed broadband penetration is still at 44 percent compared to 70 percent for the EU. Fifty-four percent of the Turkish population could be online but is not (see Exhibit 3).14
Exhibit 3Fixed broadband uptake in Turkey by speed
Note: Entry-level is 2 Mbps and above, high-speed is 24 Mbps and above, and ultra-fast is 70 Mbps and above.
pp = percentage points
Source: WCIS; BTK; Türk Telekom; Strategy& analysis
Entry-level penetration
98%
44%
54 pp
70%
EU 15Turkey
High-speed penetration
EU 15
55%
Turkey
66%
13% 13%
Ultra-fast penetration
42% 44%
11%0.1%
Turkey EU 15
CoveragePenetration
97%
27 pp
53 pp42 pp
42 pp 33 pp
(% of households, 2015)

13Strategy&
This digital divide is significant and holding back the country’s potential economic growth. The fundamental issue is not supply; only about 2 percent of Turkish homes lack access to broadband service. However, 54 percent of households have not taken advantage of any level of service that they can already access, leading to a significant demand gap (see Exhibit 4).
Exhibit 4Turkey’s digital divide
Note: Entry-level is 2 Mbps and above, high-speed is 24 Mbps and above, and ultra-fast is 70 Mbps and above.
Source: BTK; Türk Telekom; Strategy& analysis
Entry-level broadband
High-speed broadband
100%
Total market
0.421.2
14.0
6.8
6.6
Total broadbandcoverage
Supply gap
20.8
2.7
9.3
Total broadbanddemand
0.4(2%)
11.5(54%)
Digital divide
Supply gap11.9
Demand gap
Demand Gap= 11.5 million(54% of totalhouseholds)
High-SpeedDemand Gap= 11.2 million(53% of totalhouseholds)

14 Strategy&
The three principal reasons for the gap include low digital literacy, limited device penetration, and lack of relevant local content. Turkey is in line with comparable markets15 in all pillars of the WEF’s Networked Readiness Index except for skills, where it ranks 80th out of 143 countries.16 In terms of devices for broadband access, only 56 percent of Turkish households own a computer, compared to 81 percent in comparable markets (see Exhibit 5).17 For people in Turkey who are connected to broadband, there is a lack of content relevant to their needs and interests. Turkey has advanced e-health services and a high percentage of its population is on Facebook. However, the country has room for improvement in developing relevant e-government services and retail offerings. Turkey’s content maturity18 is roughly 10 points
Exhibit 5Skills and device penetration in Turkey
1 Ranking is from best (i.e., 1) to worst (i.e., 143)
Source: Euromonitor; World Economic Forum, Global Information Technology Report (WEF, GITR); WCIS; Strategy& analysis
Desktop & portable computer ownership(% of households) (2010–2014)
2015 NRI ranking1 across pillars
+6.1%
2014
56.0%
2010
44.2%
2014
81.4%
2010
73.7%
2014
80.7%
2010
73.9%
Turkey
EU
Comparable markets
Ranking range of EUand comparable markets
Turkey's rank
Tota
l
Pol
icy
&re
gula
tion
Bus
ines
s &
inno
vatio
n
Infr
astr
uctu
re
Aff
ord
abili
ty
Ind
ustr
yus
age
Bus
ines
sus
age
Gov
ernm
ent
usag
e
Eco
nom
icim
pac
t
Soc
ial
imp
act
Ski
lls
2
73
3
108
4
72
3
71
5 1
69
1
61
2
96
3
118
1
85
3
84
122
48 5437
53
8
80
67
53 55 6350
+2.5% +2.2%

15Strategy&
lower than that of comparable markets on a 100-point scale. Increasing its content maturity, through the creation and promotion of relevant content, could raise Turkey’s Internet penetration to more than 70 percent of the population.
Turkey’s demand gap is relevant at all speeds. Even homes that are connected to the Internet are largely not opting for the higher speeds. With current high-speed broadband penetration at 13 percent, only about 26 percent of subscribers are on high-speed. Ultra-fast penetration stands at merely 0.1 percent.19 However, the share of subscribers with higher than 10 Mbps speed increased from 19 percent to 72 percent over the past two years, reaching EU levels much faster than most, if not all, comparable markets. The same evolution took 4.5 years in the EU (see Exhibit 6).20
Exhibit 6Turkey has rapidly attained EU levels of fast broadband subscribers
Source: Türk Telekom Wholesale (December 2015), Superonline Fiber subscribers (Dec 2015) , Cable subscribers (June 2015); EU Commission; European Digital Commission; BTK market reports; Turkish Statistical Institute; Türk Telekom, Strategy& analysis
0
5
10
15
20
25
30
35
40
45
50
55
60
65
70
75
9%13%
Q32008
Q12012
10%
0%
13%
23%
8%
16%
5%
49%
56%
64%
39%
Q32009
Q32010
Q12013
14%
4%
Q32011
2%
Q12011
45%
59%
29%
8%
47%
28%
72%72%
74%
Q32013
66%
19%
70%
Q12009
EU
Turkey
Fix
ed B
road
ban
d S
ubsc
rip
tio
ns w
ith
hig
her
than
10
Mb
ps
spee
d (
% o
f to
tal)
Around 2 years
Q32014
4.5 years
Q42015
Q32012
Q12008
Q12010
Q12014
Q12015

16 Strategy&
Affordability of access offering is not an issue. Turkey’s high-speed broadband prices are lower than other EU nations’ prices, even when purchasing power parity is taken into account. Despite lower household incomes compared to the EU, 86 percent of Turkish households can afford high-speed broadband, and the prices are reasonable compared to other essential household expenses such as water, gas, and electricity.21
Nonetheless, even though high-speed broadband access itself is relatively affordable in Turkey, high taxes on devices put connection out of the reach of many people. Although 86 percent of the population can afford broadband, when that expense is combined with a modem and a notebook computer, the number drops to 69 percent.22
To address slow uptake, many government-led and operator-led demand stimulation initiatives are under way. The government is opening thousands of free Internet centers and education centers and has distributed about 1.3 million devices to students and teachers. Commercial operators have joined the education and school initiatives, and are providing free coverage packages to first-time users. However, operators’ commercialization of fiber deployment across value proposition and sales process needs to improve. Broadband packages tend to be sold on volume, rather than speed, which has led consumers to dismiss speed as unimportant. Fiber prices are significantly reduced through promotions, to prices lower than ADSL (asymmetrical digital subscriber line) in some cases, showing that fiber investment is not properly commercialized. Commercial staff input has not been properly taken into account in demand planning exercises. Coordination between field operations and sales has been suboptimal. In addition, the broadband multi-play market is still in its infancy; most products are sold separately as voice, data, and content services, or commercially camouflaged into a bundle with no single bill across services.

17Strategy&
Turkey’s broadband demand and supply s-curves are not far apart. With supply exceeding demand, it is now time to accelerate Turkey’s demand s-curve to catch up with supply, while smartly pushing supply to fill the remaining gaps with the optimal technology.
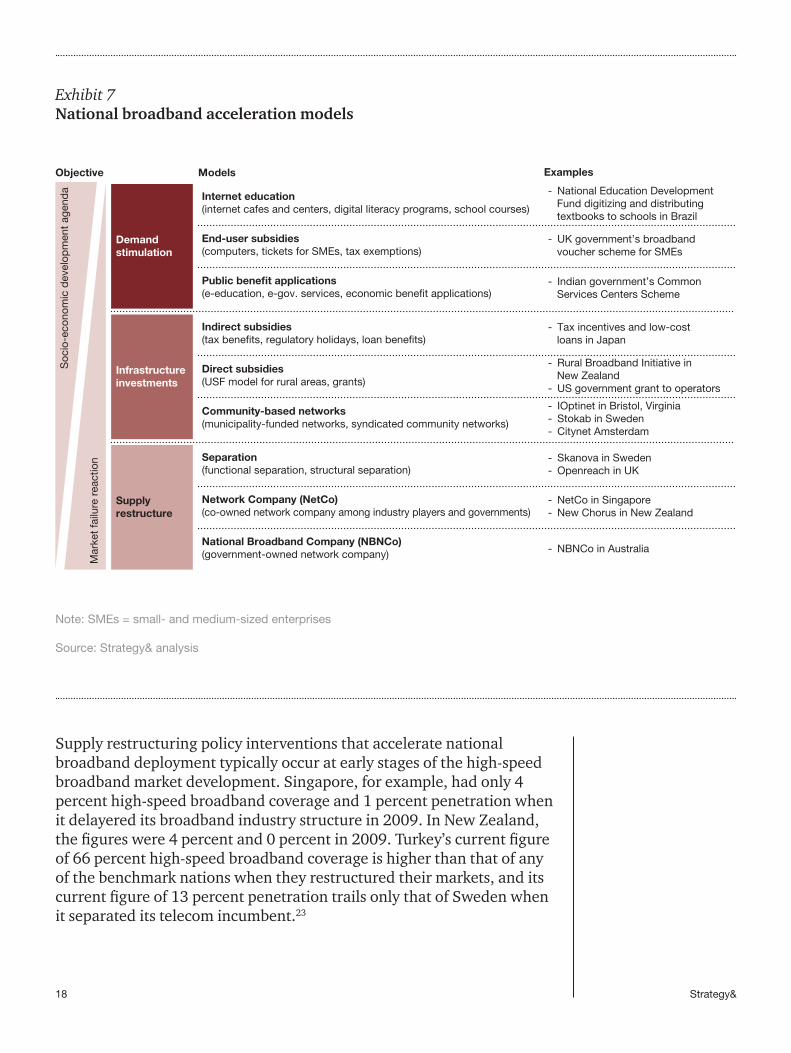
To bring about the next stage of universal high-speed broadband coverage, identifying the measures that are appropriate for the Turkey’s market is key. Nations typically advance their broadband capabilities with three goals in mind: increasing the health of the sector, increasing availability of infrastructure, and optimizing return on investments. They accomplish these goals using three acceleration models: supply restructuring, infrastructure investment, and demand stimulation (see Exhibit 7, page 18). The appropriate choice for a given nation depends on the current condition of its broadband market, and on whether the policy objective is to promote socioeconomic development or to correct a market failure. The Turkish market will need well-tailored strategies to advance the second stage of broadband deployment and bridge the digital divide in order to make the Internet more attractive and affordable to the general population.
Supply restructuring. Policymakers typically consider supply restructuring when trying to fix problems of limited broadband supply and an unresponsive incumbent that monopolized the sector. Should policy intervention aim to restructure the broadband supply market, three models have been observed across international case studies: functional or structural separation of the incumbent operator; creation of a co-owned company among industry players and government (NetCo); or creation of a government-owned national broadband company (NBNCo).
Looking to the future
18 Strategy&
Supply restructuring policy interventions that accelerate national broadband deployment typically occur at early stages of the high-speed broadband market development. Singapore, for example, had only 4 percent high-speed broadband coverage and 1 percent penetration when it delayered its broadband industry structure in 2009. In New Zealand, the figures were 4 percent and 0 percent in 2009. Turkey’s current figure of 66 percent high-speed broadband coverage is higher than that of any of the benchmark nations when they restructured their markets, and its current figure of 13 percent penetration trails only that of Sweden when it separated its telecom incumbent.23
Exhibit 7National broadband acceleration models
ExamplesModels
Soc
io-e
cono
mic
dev
elop
men
t ag
end
a
Mar
ket
failu
re r
eact
ion
Objective
Demandstimulation
Internet education(internet cafes and centers, digital literacy programs, school courses)
End-user subsidies(computers, tickets for SMEs, tax exemptions)
Public benefit applications(e-education, e-gov. services, economic benefit applications)
- National Education Development Fund digitizing and distributing textbooks to schools in Brazil
- UK government’s broadband voucher scheme for SMEs
- Indian government’s Common Services Centers Scheme
Infrastructureinvestments
Indirect subsidies(tax benefits, regulatory holidays, loan benefits)
Direct subsidies(USF model for rural areas, grants)
Community-based networks(municipality-funded networks, syndicated community networks)
- Tax incentives and low-cost loans in Japan
- Rural Broadband Initiative inNew Zealand
- US government grant to operators
- IOptinet in Bristol, Virginia- Stokab in Sweden- Citynet Amsterdam
Supplyrestructure
Separation(functional separation, structural separation)
Network Company (NetCo)(co-owned network company among industry players and governments)
National Broadband Company (NBNCo)(government-owned network company)
- Skanova in Sweden- Openreach in UK
- NetCo in Singapore- New Chorus in New Zealand
- NBNCo in Australia
Note: SMEs = small- and medium-sized enterprises
Source: Strategy& analysis
19Strategy&
Supply restructuring as a mechanism to accelerate high-speed national broadband infrastructure deployment requires significant investment and execution excellence to realize objectives. Australia’s national broadband network initiative, for example, is far from delivering its promised impact, despite budget overruns and stretched execution time lines. In Singapore, OpenNet and its shareholders (CityNet, NetLink Trust, and SingTel) submitted a consolidated application in 2013 for CityNet (wholly owned by SingTel) to acquire 100 percent of OpenNet. Key regulatory requirements will continue to be upheld in order to maintain competition in the market and benefit the public interest. IDA (Infocomm Development Authority of Singapore) further imposed additional regulatory conditions to safeguard competition, and noted industry and public concerns over OpenNet’s performance issues.24
Infrastructure investment. The mechanism of infrastructure investment has more relevance for Turkey, since it directly addresses the problem of how to reach the final, most hard-to-reach 2 percent of homes with no service, and the 34 percent that lack high-speed service. Government can provide services that are uneconomical for any single company, either through direct subsidy, indirect subsidy and regulatory incentives, or community-based networks.
Coordinated approaches between governments and operators have produced success stories. Such approaches can be indirect for example, Spain’s decision to remove significant market power (SMP) regulation in areas with heavy broadband competition and introduce a speed-based regulatory holiday exempting operators from sharing infrastructure that achieves port speeds greater than 30 Mbps; or direct, such as France’s co-financing agreement with the incumbent to cover less densely populated areas. At the city or state level, the Swedish capital, Stockholm, created Stokab to develop an open and neutral fiber network; and municipalities in the Netherlands aggregate demand from 30 to 40 percent of households in the region for Reggefiber to deploy.25
Supply restructuring as a mechanism to accelerate high-speed national broadband infrastructure deployment requires significant investment and execution excellence to realize objectives.
Spanish regulation has reduced roll-out costs for operators and has incentivized deployment in rural areas. In the most competitive cities, FTTH regulation has been removed, allowing Spanish operators to better monetize super-fast broadband deployment.26
In Stockholm, the Stokab network company exclusively leases dark fiber on equal and transparent terms. By 2015, FTTB/H coverage reached 45 percent and penetration reached 26 percent.27

20 Strategy&
Demand stimulation. The approach that provides the greatest return for the least investment in Turkey is demand stimulation. It addresses the identified problem of the demand gap and provides concrete, immediate techniques to extend the socioeconomic benefits of broadband connection to the entire country.
Many countries have enjoyed successful results with moderate effort and investment. For example, education programs can have a wide reach, such as Tamil Nadu’s partnership with the Ford Foundation in India to launch a rural digital literacy program, connecting over 10,000 people since its inception. To make Internet access more affordable, Malaysia established 2,522 broadband centers, enabling computers to be shared by many citizens, ensuring high usage of each device.
To extend greater public benefits via the Internet, governments can digitize several functions simultaneously, such as healthcare, pensions, etc. Estonia introduced a universal electronic identification card that has become the key to access government services. Internet penetration in Estonia has exceeded 80 percent, and 75 percent of people obtain public administration information online. South Korea provided homeless shelters with free smartphones and wireless Internet services, allowing homeless citizens to search for jobs from any location, as well as reconnect with their families.

21Strategy&
For a decade, nations around the world have been pursuing national broadband acceleration plans. Motives have included increasing the health of the telecom sector, developing the national broadband infrastructure, and optimizing return on investment. We can extract five key lessons.
1 . Address barriers and stage of market development. It is helpful to think of a developing broadband market in terms of axes that show expected growth of supply and expected growth of demand. In very early stages of broadband development, market growth develops well organically (see Exhibit 8, page 22). Later, growth is optimal when governments stimulate demand to drive uptake to commercialize the high supply availability, while investing in infrastructure to push supply to non-economical areas. These patterns of growth can push the market to a mature, ideal state; a disruptive supply restructuring is necessary only to address market failure, when expected demand cannot be met due to lack of supply.
Bridging the gap: Lessons learned from other countries
The U.K. was lagging in fixed broadband penetration in 2005, when incumbent British Telecom had limited competition. In anticipation of mounting regulatory pressure, British Telecom created Openreach, a functionally separate business division, to operate its local access networks. Openreach adopted a policy of product equivalence, requiring nondiscriminatory support of all providers’ retail activities. Wholesale customers could buy services from Openreach or from BT Wholesale.
Although Openreach achieved the target coverage after a halt in investment for several years, customer satisfaction remained low, and setup costs were high. Recently, OfCom, the U.K. regulator, assessed whether BT should be compelled to structurally separate Openreach into an
independent company. The outcome was that Openreach was not forcibly spun off; instead it was compelled to offer duct sharing and pole sharing in order to stimulate infrastructure sharing. It also was compelled to meet tougher service standards for wholesale broadband. In terms of governance, the BT Group will be the holding company of Openreach, with a separate board of directors and financial reporting. BT claimed that it had voluntarily accepted further regulation in order to settle the matter speedily, and said it will proceed with fiber investment plans that keep the U.K. at the forefront of fiber deployment in the G20. In summary, British regulators are avoiding structural separation and adopting other avenues such as healthy regulations and quality of service guarantees as better alternatives.

22 Strategy&
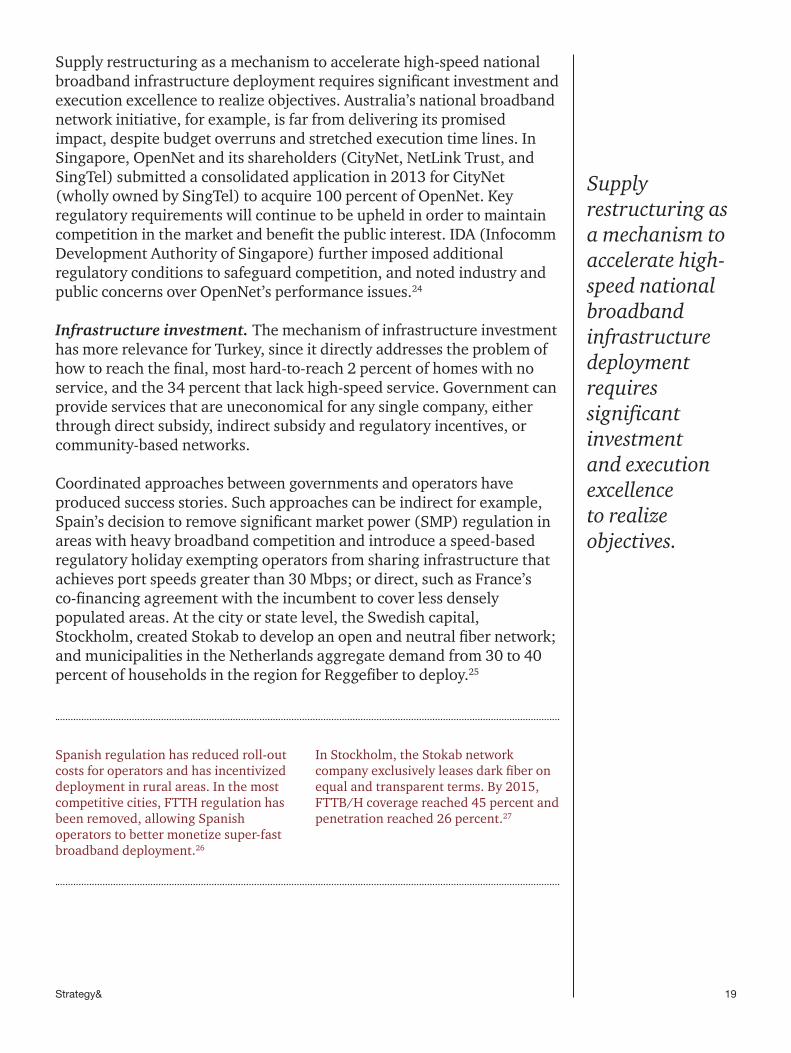
2. Build competitiveness through industry structure. The national benefit from competitiveness, in most cases, stems from broader coverage and greater adoption of high speed. South Korea, Japan, and the U.S., with infrastructure-based competition, are among the world leaders in average download speed and Fiber to the X (FTTX) coverage (see Exhibit 9, page 23). Nations with a common wholesale and a structurally separate network, such as New Zealand, Australia, and South Africa, lag well behind in both categories. The impact of industry structure on increasing average download speed and fiber coverage helps define the optimal national broadband plan.
Exhibit 8National broadband models selection approach
Source: Strategy& analysis
Low
Expected demand
Typical evolution of supply and demand
Ideal stateDemand stimulation
Infrastructureinvestments
Supply restructuring
Exp
ecte
d s
upp
ly
Nas
cent
Dev
elop
edA
dva
nced
Medium High
Demand stimulation& infrastructureinvestment
Infrastructure investments
Supplyrestructuring
Organic marketdevelopment
Demand stimulation
- Allow the market to develop organically since it is still in its early development stages
- Introduce demand stimulation mechanisms to drive demand uptake to commercialize the high supply availability
- Introduce demand stimulation mechanisms coupled with infrastructure investments to push supply to non-economical areas
- Address market failure of not meeting expected demand due to lack of supply availability, through a disruptive supply restructure
- Inject infrastructure investments to increase supply to non-economical areas where demand is available
Demand stimulation & infrastructureinvestment
Organic marketdevelopment
23Strategy&
Exhibit 9Impact of industry structure on efficiency
1 Although FTTC rollout exceeded 80% of premises in New Zealand, it was superseded by the government co-funded FTTN network after 2011 (which now reached 37% of premises). Chorus was therefore disincentivized from upgrading the FTTC network beyond ADSL2+ technology, so it’s peak speed is only around 20 Mbps
Source: Akamai; Analysys Mason; Strategy& analysis
Commonwholesalenetwork
Obligatorywholesalesharing atcost
Infrastructurebasedcompetition
Commonwholesalenetwork
Obligatorywholesalesharing atcost
Infrastructurebasedcompetition
0
10
20
30
40
50
60
70
80
90
100 South Korea
U.S.Sweden
France
Japan
New Zealand1
Australia
Italy
Spain
Germany
South Africa
UK
0
2
4
6
8
10
12
14
16
18
20
22
Sweden
U.S.
Australia
South Africa
South Korea
Italy
GermanySpain
France
Japan
UK
Ave
rag
e d
ow
nlo
ad S
pee
d (M
bp
s)
FTT
X C
ove
rag
e (%
of p
rem
ises
)
New Zealand
3. Be diligent about aligning stakeholders. The incumbent is the natural partner for the governments’ national broadband plan. The capabilities that the incumbent brings in terms of fixed broadband infrastructure and operations should be leveraged in the government’s agenda. As Exhibit 10, page 24 and the Singapore case study indicate, the success of a national broadband plan is highly correlated with fixed incumbent involvement.

24 Strategy&
Singapore was concerned about being left behind amidst the emergence of national networks in South Korea and Japan, and chose to create a separate NetCo to design, build, and operate the passive national fiber infrastructure. IDA, the regulator, championed network open access to incentivize operators to provide competitive access and prices. The government issued a grant to help build a national FTTH network in 2008. The contract was awarded to a structurally separate NetCo, and a separate contract was awarded six month later to an operationally separate operating company for active access services.
OpenNet succeeded in achieving coverage and penetration targets due to
proper regulatory support and risk mitigation. Frequent collaboration between public and private stakeholders led to strong alignment among the government, the regulator, and network operators. The consortium approach spread risk and broadened the experience among several stakeholders. However, OpenNet took three years to launch, and the incumbent, SingTel, neither aligned with nor encouraged NetCo’s objectives.
The Singapore experience illustrates the importance of close collaboration between public and private stakeholders to design and execute national broadband acceleration mechanisms.
Exhibit 10Correlation between incumbent’s involvement and national broadband plan success
1 Success is defined as the ability to reach aspirational targets through the supply restructuring model
Source: Strategy& analysis
HighNone / Low
Incumbent’s involvement / alignment
Success1
Res
ult
Failure
Success of national broadband plan is highlycorrelated with incumbentinvolvement
UKSweden
Italy
Qatar Australia
New Zealand Singapore
25Strategy&
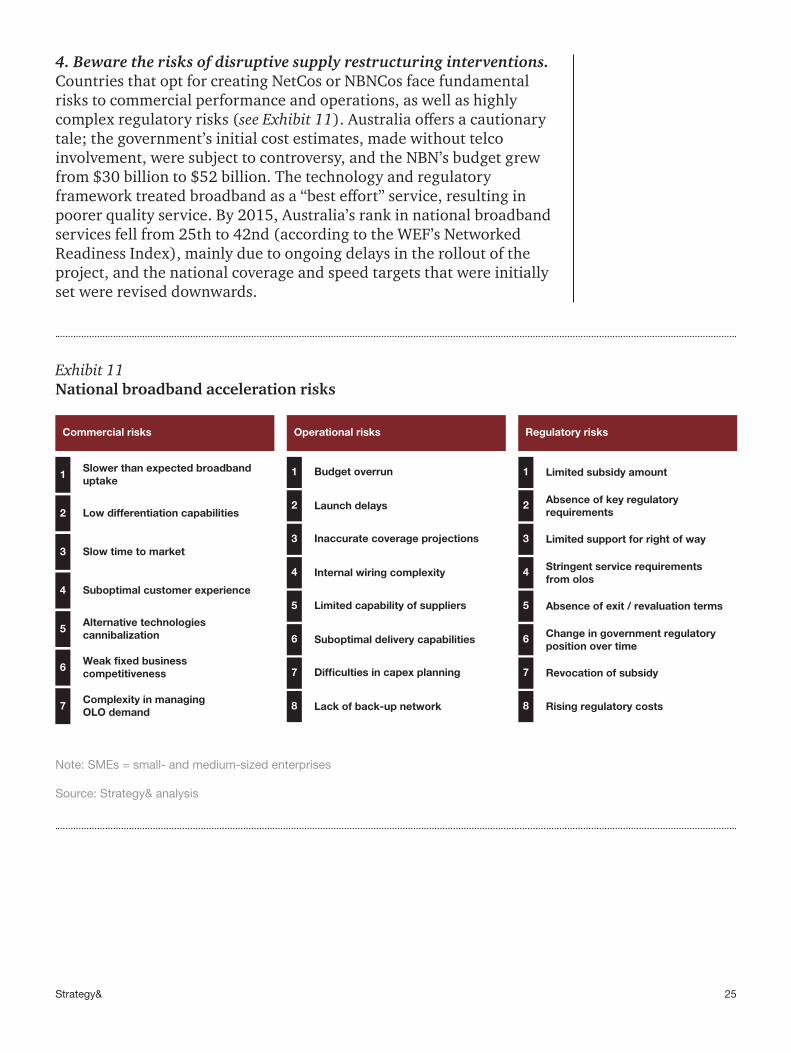
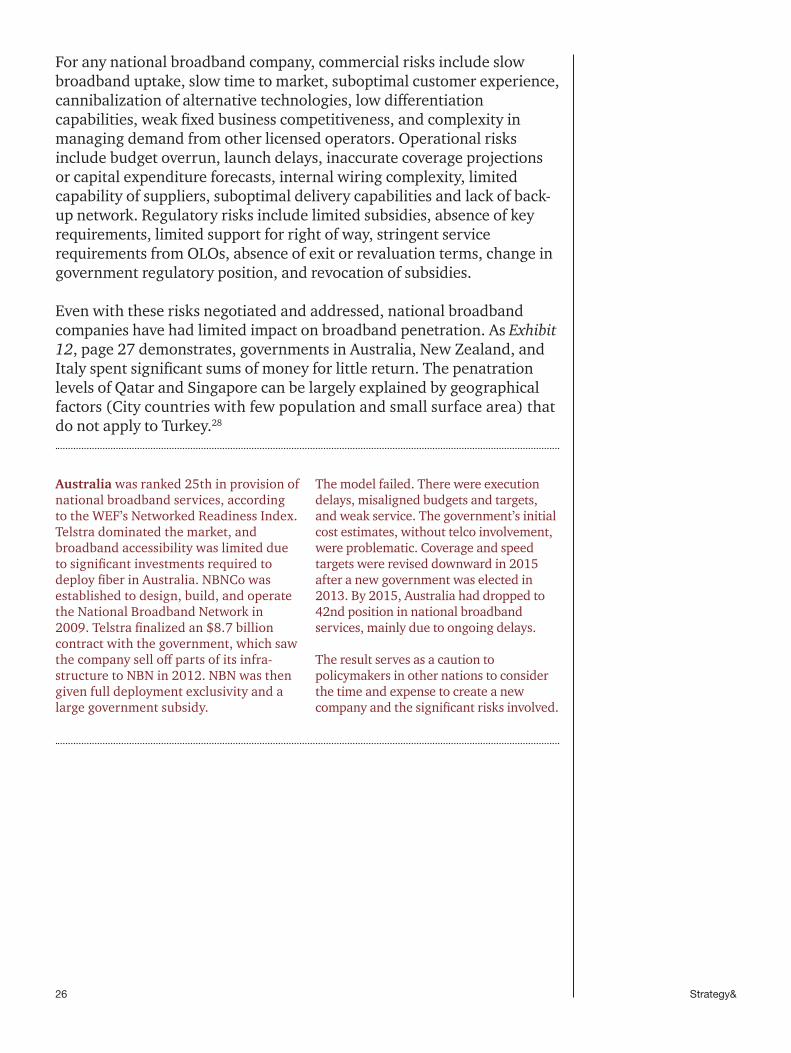
4. Beware the risks of disruptive supply restructuring interventions. Countries that opt for creating NetCos or NBNCos face fundamental risks to commercial performance and operations, as well as highly complex regulatory risks (see Exhibit 11). Australia offers a cautionary tale; the government’s initial cost estimates, made without telco involvement, were subject to controversy, and the NBN’s budget grew from $30 billion to $52 billion. The technology and regulatory framework treated broadband as a “best effort” service, resulting in poorer quality service. By 2015, Australia’s rank in national broadband services fell from 25th to 42nd (according to the WEF’s Networked Readiness Index), mainly due to ongoing delays in the rollout of the project, and the national coverage and speed targets that were initially set were revised downwards.
Exhibit 11National broadband acceleration risks
Note: SMEs = small- and medium-sized enterprises
Source: Strategy& analysis
Commercial risks
1Slower than expected broadbanduptake
2 Low differentiation capabilities
3 Slow time to market
4 Suboptimal customer experience
5Alternative technologiescannibalization
6Weak fixed businesscompetitiveness
7Complexity in managingOLO demand
1 Limited subsidy amount
2 Absence of key regulatoryrequirements
3 Limited support for right of way
4 Stringent service requirementsfrom olos
5 Absence of exit / revaluation terms
6 Change in government regulatoryposition over time
7 Revocation of subsidy
8 Rising regulatory costs
1 Budget overrun
2 Launch delays
3 Inaccurate coverage projections
4 Internal wiring complexity
5 Limited capability of suppliers
6 Suboptimal delivery capabilities
7 Difficulties in capex planning
8 Lack of back-up network
Operational risks Regulatory risks
26 Strategy&
For any national broadband company, commercial risks include slow broadband uptake, slow time to market, suboptimal customer experience, cannibalization of alternative technologies, low differentiation capabilities, weak fixed business competitiveness, and complexity in managing demand from other licensed operators. Operational risks include budget overrun, launch delays, inaccurate coverage projections or capital expenditure forecasts, internal wiring complexity, limited capability of suppliers, suboptimal delivery capabilities and lack of back-up network. Regulatory risks include limited subsidies, absence of key requirements, limited support for right of way, stringent service requirements from OLOs, absence of exit or revaluation terms, change in government regulatory position, and revocation of subsidies.
Even with these risks negotiated and addressed, national broadband companies have had limited impact on broadband penetration. As Exhibit 12, page 27 demonstrates, governments in Australia, New Zealand, and Italy spent significant sums of money for little return. The penatration levels of Qatar and Singapore can be largely explained by geographical factors (City countries with few population and small surface area) that do not apply to Turkey.28
Australia was ranked 25th in provision of national broadband services, according to the WEF’s Networked Readiness Index. Telstra dominated the market, and broadband accessibility was limited due to significant investments required to deploy fiber in Australia. NBNCo was established to design, build, and operate the National Broadband Network in 2009. Telstra finalized an $8.7 billion contract with the government, which saw the company sell off parts of its infra-structure to NBN in 2012. NBN was then given full deployment exclusivity and a large government subsidy.
The model failed. There were execution delays, misaligned budgets and targets, and weak service. The government’s initial cost estimates, without telco involvement, were problematic. Coverage and speed targets were revised downward in 2015 after a new government was elected in 2013. By 2015, Australia had dropped to 42nd position in national broadband services, mainly due to ongoing delays.
The result serves as a caution to policymakers in other nations to consider the time and expense to create a new company and the significant risks involved.

27Strategy&
Exhibit 12Risk vs. reward matrix
1 UK, Italy and Malaysia are calculated based on FTTC while for other countries calculation is based on FTTP2 Qatar’s high coverage and penetration results were not achieved by the national broadband network (Q.NBN) but rather the incumbent Ooredoo3 HSBB coverage at the date of supply restructuring launch4 Numbers in parenthesis show total government subsidy plan
Source: Analysys Mason; IDATE; Strategy& analysis
0%
20%
40%
60%
80%
100%90%80%70%60%50%40%30%20%10%0
HS
BB
pen
etra
tio
n (2
015)
HSBB Coverage (2015)
Australia(1% in 2009)3
(US$20 bn)
UK1
(0% in 2005)3
(US$1.5 bn)
New Zealand(4% in 2011)3
(US$1.5 bn)
Singapore(4% in 2009)3
(0.7 bn USD)
Malaysia1
(12% in 2010)3
(0.6 bn USD)
Sweden(24% in 2008)3
(US$0)
Italy1
(9% in 2008)3
(US$6.5 bn)
Qatar2
(11% in 2011)3
(US$0.55 bn)
Relatively smallcountries witheasy topology
Average coverage pp. increase per year
0%-5%
6%-10%
11%-25%
Bubble size shows government subsidy per capita
Turkey
28 Strategy&
5. Understand the time and complexity a national broadband company requires. Australia and New Zealand took three years to get their NBNs off the ground; Singapore took two years. In any country, stakeholders must resolve questions of scope and coverage, business model, government subsidy, operational and commercial model, and regulation. Due diligence is not quick or easy. In separating IT networks, all product sets must be re-engineered, which can incur costs of $1 billion or more. Regulatory environments require detailed revision to ensure that legacy copper services do not impede uptake of fiber services. Substantial government funding is needed to extend FTTP service into rural areas that do not meet commercial investment criteria, at a per-home cost of up to five times as much as urban areas.29
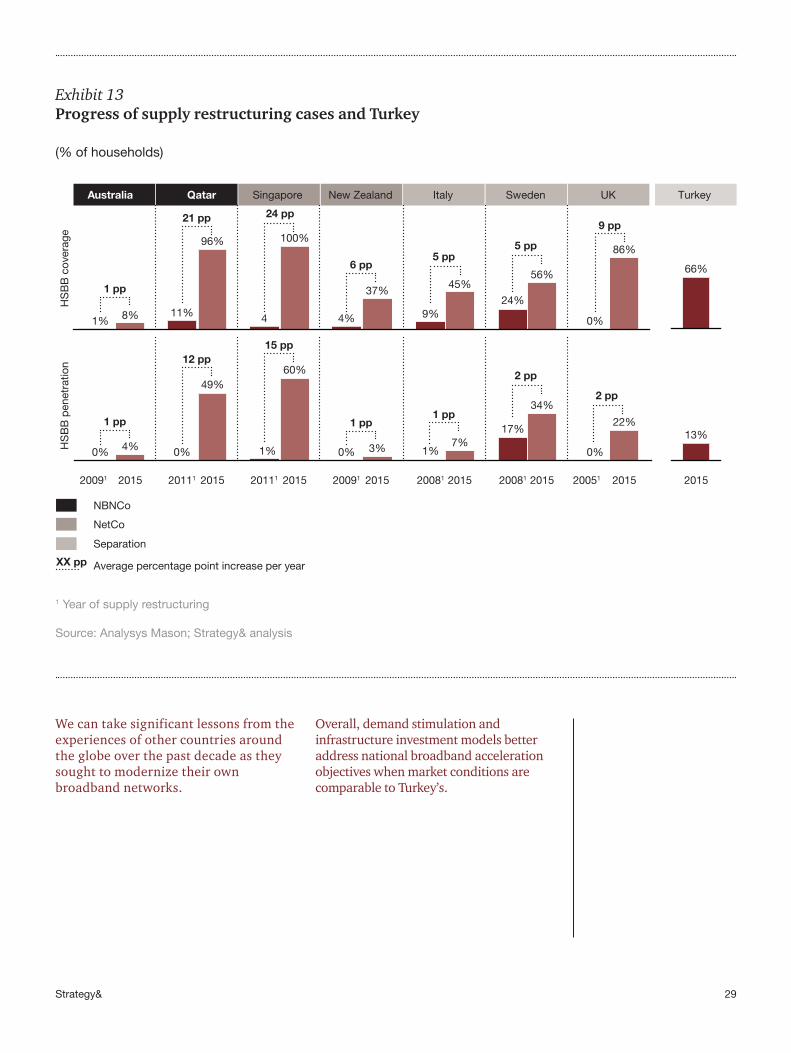
As Exhibit 13 demonstrates, most supply restructuring cases did not accelerate national broadband deployment and adoption — the average percentage point increase per year is low. This confirms that the time to execute supply restructuring and its complexity can lead to lower impact on the market. In addition, the cases were all at earlier stages of market development than Turkey is at today.
New Zealand’s citizens and government were unhappy with the level of telecommunications industry investment. The digital divide between urban and rural areas was increasing, but the private sector was reluctant to invest widely in FTTP due to New Zealand’s geography and dispersed population. As a solution, in 2008, New Zealand created an Ultra-Fast Broadband program that distributed deployment to public–private partnerships. In 2011, structural separation of the existing businesses into New Telecom (retail) and New Chorus (infrastructure) was finally completed (Telecom is now known as Spark New Zealand). The New Zealand government subsidized 25 percent of the cost of deploying FTTH to 70 percent of the country.
New Zealand’s model failed to achieve strong results due to misalignment of regulatory policy and infrastructure policy, leading to very low copper broadband pricing undermining the take up of high-speed broadband (HSBB), execution delays, large financial risks, and low uptake. Separation of the Chorus network business, first as functional separation, then full structural separation, took three years. There were clear disconnections between retailers’ incentives and Chorus’ objectives to capitalize on scale economy benefits. ISPs were slow to develop fiber plans, leading to low uptake and large financial risk to network operators (particularly Chorus).
These lessons, both positive and negative, from 15 national broadband case studies,30 as well as the current Turkish market foundations and barriers, provide the framework for our six policy recommendations to accelerate Turkish broadband adoption.
Most supply restructuring cases did not accelerate national broadband deployment and adoption.
29Strategy&
We can take significant lessons from the experiences of other countries around the globe over the past decade as they sought to modernize their own broadband networks.
Overall, demand stimulation and infrastructure investment models better address national broadband acceleration objectives when market conditions are comparable to Turkey’s.
Exhibit 13Progress of supply restructuring cases and Turkey
1 Year of supply restructuring
Source: Analysys Mason; Strategy& analysis
0%
0%
1%1%
17%
0%0% 3%
60%
7%
49%
34%
22%
4% 0%
Australia Singapore New Zealand Italy Sweden UK
20091 2015 2015
56%
24%8%
86%
45%
100%96%
37%
1%11%
21 pp 24 pp
XX pp
9%4%4
HS
BB
cov
erag
eH
SB
B p
enet
ratio
n
Average percentage point increase per year
NBNCo
NetCo
Separation
20111 2015 20111 2015 20091 2015 20081 2015 20081 2015 20051 2015
Qatar Turkey
66%
13%
12 pp15 pp
9 pp
6 pp5 pp
5 pp
2 pp
2 pp
1 pp1 pp
1 pp
1 pp
(% of households)

30 Strategy&
Turkey needs a national broadband plan. Under its own steam, the market has passed the first stage of development, as private companies have built the infrastructure to provide Internet service to almost every home, and high-speed service to most. The country is on its way to being fully connected, and to realizing all the economic and social benefits that will follow.
At its current stage of development, with developed supply but demand below expectations, Turkey does not need a supply restructuring. Restructuring will not address the country’s real barriers; it has proved to have weak market impact, to be risky and complex to execute, and to be costly and slow.
In addition, establishing a national broadband company requires careful analysis of many critical considerations (see Exhibit 14, page 31).
These considerations are formidable and fraught with risks for even the most carefully laid plans, as we have seen in other jurisdictions. Even the most noble of intentions fail under the complexity of such a project.
Turkey’s remaining barriers will not be overcome without deliberate decisions by policymakers. Of the three overarching models — demand stimulation, infrastructure investment, and supply restructure — the balanced approach between demand stimulation and infrastructure investment will most efficiently move the country toward full Internet participation.
We have identified six mechanisms that deliver impact, based on benchmarks and expert input, and taking into consideration Turkey’s market specifics. Three concentrate on demand stimulation and three address deep deployment incentives.
A national broadband plan

31Strategy&
Risks must be evaluated against potential impact. A decision that is complex to execute, or that requires high investment and major regulatory changes, may not achieve its end as quickly as planned. In Turkey’s case, demand stimulation offers
the strongest, fastest impact for the lowest risk, the lowest cost, and the least change in policy. Supply restructuring, even if it reaches its goals, will take a long time to achieve, with associated high costs and complexity and major regulatory changes.
Exhibit 14Key considerations for national broadband company establishment
Source: Strategy& analysis
Scope &investment
- What is the service / geographic scope of the NBC business and which assets are transferred?- How do you value the current assets to be transferred? How is the financial transfer structured?- What will ensure assets separation with minimum disruption? Who covers separation cost?- What ownership structure would balance the interests of various stakeholders involved?- What government funding is required to ensure sustainability and achieve socio-economic goals?
Operationalperformance
- How is the company incentivized to innovate and invest in new technology?- How are people incentivized to improve performance given monopoly position?- How is the interface with retail operators managed for planning, SLAs, and QoS? - Who gets the access to the cabinet and how is that operationally controlled?- How are national security risks mitigated and managed?
Regulatoryregime
- What new laws and regulations should be enacted with the new monopoly?- What adjustments would be needed on existing regulatory and competition regime?- How will equivalence of services be set, governed, and enforced?- How will internal differences in goals be managed, and under what power?- What institutional adjustments are needed to handle such a regime?
32 Strategy&
1 . Evolve and boost commercialization channels. A hands-on, consultative broadband distribution approach, particularly in low-income areas, can promote digital literacy as it has in other countries. Current operators can improve their distribution to better commercialize their broadband deployment, upgrading people from entry-level to high-speed packages.
In Brazil, the Computers for All program established over 90,000 “LAN houses,” which offered access to 68 percent of the population in the lowest income brackets by 2013. In Sri Lanka, the government established more than 700 communication centers in rural areas, which helped increase computer literacy from 10 percent to 40 percent over a 10-year period. In the U.S., Comcast launched its Internet Essentials plan to offer entry-level broadband and digital literacy training to low-income households for $10 per month, and later increased the speed offered from 1.5 to 5 Mbps while increasing to a higher, but still discounted, price. By 2015, 250,000 households were enrolled in the program. In Italy, Vodafone Italia partnered with a third party specializing in door-to-door sales of non-telco products and revamped its incentive scheme to reward those agents.
To execute this initiative in Turkey, stakeholders could leverage the strong distribution network of fast-moving consumer goods and electronics brands to promote Internet education, and target community entrepreneurs and influencers to increase awareness of broadband services. Strategy& estimates that such a policy in Turkey could increase awareness of broadband in rural areas by 25 percent and increase entry-level penetration by 18 percentage points.
2. Reduce cost of ownership for end users. Distributing subsidized devices and broadband subscriptions to students, cutting taxation on entry-level broadband devices, and subsidizing in-building access facilities installation, will have a sizable positive impact on device ownership. From 2009 to 2012, China ran a PC subsidy program for rural areas where per capita income was $700, offering 13 percent rebate on selected products that cost less than $500. The program was estimated to generate sales of 800,000 computers. In Malaysia, the government offered tax relief of up to $165 on broadband subscriptions, which made access more affordable for 100,000 students. Singapore’s OpenNet contacts home and business owners to pull optical fiber and install fiber terminal points for free, and IDA offers subsidies up to 90 percent of the cost of in-building fiber infrastructure to businesses in Singapore.
Such a program would need participation of several vendors with solid government support, and effective marketing to spread awareness of the subsidy mechanism. In Turkey, if 10 percent of students who do not own computers received subsidized devices, and if the tax contribution of total cost of ownership of broadband were cut half, entry-level penetration
A hands-on, consultative broadband distribution approach, particularly in low-income areas, can promote digital literacy as it has in other countries.

33Strategy&
could rise by 7 percentage points, and high-speed could rise by 2 percentage points, according to Strategy& research.
3. Scale up relevant local applications and content. The applications and content most likely to bring people online that have proven to be successful in other countries are those related to: education; e-government services; and economic benefit. Farmers in India have improved their incomes by up to 15 percent by using broadband to view weather forecasts, commodity prices, and advice on agricultural techniques. The Brazilian Ministry of Education has partnered with Amazon and the National Education Development Fund to digitize and distribute free textbooks to hundreds of thousands of Brazilian educators. In Estonia, a unique electronic identification card and digital signature for each citizen now grants nearly universal access to government services.
Turkey could digitize public services with strong social and welfare impact (e.g., e-education and e-government services) and launch a marketing campaign to make citizens aware of what was available. A supportive ecosystem for entrepreneurs to develop local applications would be necessary. Strategy& estimates that a 10 percent increase in the Turkish content maturity index could raise entry-level penetration by 11 percentage points.
Aside from demand, Turkey can use three separate mechanisms to incentivize deeper deployment into suburban and rural areas. Commercially viable wholesale and infrastructure sharing services should incentivize investment by operators that offer faster broadband speeds. Extension of current subsidies (Universal Service Fund) to high-speed broadband should help bridge the coverage gap in low-density areas. Last but not least, partnerships between operators and municipalities to aggregate demand and ease right-of-way fees should enhance economic viability and accelerate coverage.
4. Promote wholesale and infrastructure sharing services that make commercial sense. Infrastructure-based competition can be encouraged through extension/redefinition of the regulatory holiday. In Spain, the regulator applied a speed-based regulatory holiday above 30 Mbps and removed all SMP regulations in competitive markets, after splitting the country into regional markets. In the Netherlands, the regulator withdrew wholesale access remedies on KPN after redefining the broadband market to include cable.
For such a strategy, regulators should offer acceptable commercial prices to encourage operators to deploy their own networks; offer strong service level agreements in providing backhaul services; and review SMP regulations in regional markets to incentivize

34 Strategy&
infrastructure-based competition. The results, according to Strategy& research, could be a 1.5-fold increase in HSBB coverage for Turkish rural areas, and an increase of 4 percentage points in high-speed penetration and 11 percentage points in high-speed coverage in Turkey.
5. Leverage the Universal Service Fund (USF) to support broadband deployment in pre-defined low-density areas. Turkey should leverage the USF to support broadband deployment in pre-defined low density areas. A targeted list of low-coverage cities should be identified based on expected investment and estimated uptake of broadband services, with clear alignment between operators and policymakers on the required funding and execution time line.
In the U.S., 10 carriers have accepted US$1.5 billion in annual support for rural broadband development from the Connect America Fund, which, together with private investment, will expand broadband to an additional 12 percent of the rural population. Venezuela’s USF subsidized the Puntos de Acceso program, which aims to bring fixed-line and Internet services to people who lack access to ICT services.
To make the same approach work in Turkey, operators and policymakers should be aligned on the conditions for using the USF, and rural areas should be the targets for investment. Strategy& estimates that the initiative could increase high-speed rural penetration by 6 percentage points, and rural coverage by 25 percentage points.
6. Drive municipality-led demand aggregation and incentives. Turkish operators would need to partner with municipalities to support deployment and demand aggregation while offering free access to selected municipality centers. High-revenue-generating municipalities should be targeted first in order to build up momentum. This mechanism would encourage cities to coordinate demand among local institutions. Tactics could also include national competitions on broadband adoption, uniformly lower licensing costs (or right-of-way fees) enforced by municipalities on operators, and an update of building standards and codes to address in-house wiring.
In the Netherlands, as previously mentioned, Reggefiber targets an area for potential fiber deployment only if at least 30 percent of households commit to purchase a connection. Provincial authorities in La Pampa, Argentina, enlisted 21 municipalities, most of them rural communities, to aggregate demand from local governments, hospitals, schools, and libraries for connectivity before building the broadband network.
If the plan is rolled out in rural and suburban areas across all cities, it could increase high-speed penetration by 11 percentage points in rural and suburban areas, and coverage by 20 percentage points.

35Strategy&
A successful national broadband acceleration plan requires collaboration to balance three essential drivers: market competitiveness and sustainability; increasing availability of infrastructure at the right price; and optimizing investment. Policymakers need to define a national broadband plan with clear initiatives and actions including financing demand stimulation and deep deployment mechanisms. Regulators need to facilitate a conducive environment for infrastructure investment and sharing. Operators need to increase and accelerate fiber commercialization investments and support demand stimulation. NGOs need to champion demand stimulation mechanisms and support aggregation guarantees. This collaboration can create consensus on strategy and tactics. Implementing these initiatives requires well-developed institutional capabilities; policies for perpetual execution going beyond the political electoral cycle; and cross-ministerial coordination.
Turkey needs a national broadband plan that sets targets specifically based on its market dynamics and that involves economically sound infrastructure investment to eliminate current barriers. If properly implemented, the six mechanisms described above will fulfill all three drivers and aggressively accelerate Turkey’s high-speed broadband adoption without disruption.
In the first phase, demand stimulation will increase broadband penetration in covered areas, drive upgrade to higher-speed broadband leveraging existing infrastructure, and improve HSBB infrastructure coverage in urban areas. Next, HSBB infrastructure will expand to uncovered suburban areas while demand stimulation increases penetration in newly covered areas. The final phase uses a mix of technologies to bring universal HSBB while continuing to motivate consumers to upgrade to higher speeds. Over the course of the next decade, the plan should raise HSBB supply from 66 percent to 95 percent, and demand should increase even more sharply, from 13 percent to 80 percent (see Exhibit 15, page 36).
Success factors
Turkey needs a national broadband plan that sets targets specifically based on its market dynamics and that involves economically sound infrastructure investment to eliminate current barriers.

36 Strategy&
Turkey does not need a major supply restructuring, thanks to the current state of market development (high supply, low demand), and given the associated complexities, risks, and investments required.
Exhibit 15High-speed broadband evolution trajectory
Source: Strategy& analysis
HS
BB
pen
etra
tio
n/co
vera
ge
66%
13%
95%
60%
70%
80%75%
85%
Today 2018 2023 2028
Drive uptake Expand coverage & uptake Achieve universal coverageI II III
∆53%
∆20%
∆15%
∆10%
∆10%
∆10%
∆10%
+9pp
+47pp
1. Demand stimulation to increase broadband penetration in covered areas
2. Upgrade and migration of current BB subscribers to high-speed
3. Infrastructure investment for HSBB in uncovered urban areas
1. Infrastructure investment for high-speed BB in uncovered sub-urban areas
2. Demand stimulation to increase BB penetration in newly covered areas
1. Infrastructure investment for HSBB in rural areas through a mix of technologies (FTTX, LTE)
2. Strong push on upgrading customer to higher speeds
HSBB supplyHSBB demand
37Strategy&
Turkey’s existing telecom outlook has the foundation on which to build a vibrant, truly national broadband network that reaches and benefits all people. To leverage that foundation and address current barriers, many measures have been identified that are impactful, affordable, and minimally disruptive. All of these measures have succeeded in other countries whose situations parallel Turkey’s — countries that had a good supply of broadband capacity but worked to build demand through wider distribution channels, reduced costs, and better local content.
International experience suggests that Turkey does not need supply restructuring. Instead, a coordinated effort by all stakeholders — policymakers, regulators, telecom companies, and content providers — can raise the supply of local online content, and increase demand among those who either lack broadband access or have previously seen no need for it. Stakeholders can follow proven policies and regulations to fill in the remaining gaps between supply of high-speed broadband and citizens’ demand, such as aggregating local demand, using mobile technologies as a supplement to fixed lines in remote areas, and doubling down on commercialization efforts to improve monetization of current infrastructure.
Connectivity-aided economic growth offers greater possibilities and prosperity for all sectors of society. If all stakeholders work together on evidence-based strategies to achieve it, while minimizing disruption, Turkey can hasten a highly connected future that benefits everyone.
Conclusion

38 Strategy&
Endnotes
1 Strategy& estimate
2 International Telecommunication Union (ITU)
3 The impact of acceleration measures on the penetration curve is estimated as the difference between the status quo forecast (based on Turkey’s penetration CAGR) and the improvement forecast (based on the s-curve trend of comparable and advanced markets). The source of current numbers is WBIS.
4 Cumulative impact includes years from 2016 to 2023. Strategy& analysis
5 Türk Telekom
6 The years 2005–2014.
7 Tübisad; Invest in Turkey; Strategy& analysis
8 ICTA (BTK); Türk Telekom; World Cellular Information Service (WCIS). EU numbers are for the EU15 nations.
9 Türk Telekom
10 Türk Telekom
11 Türk Telekom
12 Türk Telekom
13 Türk Telekom estimates
14 WCIS; BTK; Türk Telekom; Strategy& analysis
15 Comparable markets are countries with population size between 25 million and 150 million, GDP per capita equal or higher than Turkey’s, and fixed broadband penetration higher than 30 percent. Selected countries are: Australia, Canada, France, Germany, Italy, Japan, Saudi Arabia, Malaysia, Poland, Russia, Spain, South Korea, and U.K.
16 World Economic Forum, Global Information Technology Report.
17 Euromonitor; WCIS
18 Refer to Strategy& Content Maturity Index in WEF GITR 2015

39Strategy&
19 BTK; Türk Telekom
20 EU Commission; European Digital Commission; BTK market reports; Turkish Statistical Institute (TÜIK in Turkish); Türk Telekom
21 The affordability index is computed based on the share of households with a broadband package that is less than 5 percent of the average household income.
22 Strategy& analysis
23 Analysys Mason; Strategy& analysis
24 Infocomm Development Authority (IDA), Singapore
25 Bronwyn E. Howell, “Separation Anxieties: Structural Separation and Technological Diffusion in Nascent Fibre Networks,” SSRN 2014.
26 David Bernal, “Providing broadband services through PPP (Public Private Partnership) models,” ITU 2013; James Allen, Ceri Tinine, Final report for Ofcom: International case studies, Analysys Mason, 2015.
27 FTTH Council; Stokab; ICT Regulation Toolkit; InterConnect Communications; Analysys Mason; Strategy& analysis
28 Analysys Mason; IDATE; Strategy& analysis
29 Strategy& analysis
30 Cases analyzed include Australia, Estonia, France, Italy, Japan, Malaysia, New Zealand, Portugal, Singapore, South Korea, Spain, Sweden, Qatar, U.K., and the U.S.

© 2016 PwC. All rights reserved. PwC refers to the PwC network and/or one or more of its member firms, each of which is a separate legal entity. Please see www.pwc.com/structure for further details. Mentions of Strategy& refer to the global team of practical strategists that is integrated within the PwC network of firms. For more about Strategy&, see www.strategyand.pwc.com. No reproduction is permitted in whole or part without written permission of PwC. Disclaimer: This content is for general purposes only, and should not be used as a substitute for consultation with professional advisors.
www.strategyand.pwc.com
Strategy& is a global team of practical strategists committed to helping you seize essential advantage.
We do that by working alongside you to solve your toughest problems and helping you capture your greatest opportunities.
These are complex and high-stakes undertakings — often game-changing transformations. We bring 100 years of strategy consulting experience and the unrivaled industry and functional capabilities of the PwC network to the task. Whether you’re
charting your corporate strategy, transforming a function or business unit, or building critical capabilities, we’ll help you create the value you’re looking for with speed, confidence, and impact.
We are part of the PwC network of firms in 157 countries with more than 208,000 people committed to delivering quality in assurance, tax, and advisory services. Tell us what matters to you and find out more by visiting us at strategyand.pwc.com/me.