accelerated learning in oregon: access and impact · accelerated learning, or the earning of...
TRANSCRIPT
-0
Accelerated Learning in Oregon:
Access and Impact

This report was prepared by Amy G. Cox, Elizabeth Martinez, Shiyan Tao, Olga Levadnaya, Vern Mayfield, Paul
Schroeder, and Betsy Simpkins of the Oregon Higher Education Coordinating Commission. November 2019.
iii
PREFACE
Accelerated learning, or the earning of college credit while in high school, has a longstanding area of student
engagement in Oregon and nationally. Accelerated learning programs have expanded in recent years, as educators,
policymakers, students, and families have placed growing interest in them as a mechanism for postsecondary access,
success, and affordability. In 2018, the Oregon Legislature passed House Bill 4053, requiring public colleges and
universities to track and submit data to Oregon’s Higher Education Coordinating Commission (HECC) on
accelerated learning credits that new, incoming students bring with them. One requirement of the legislation is the
submission of an annual report to the Legislature by December 1 of each year. Beginning in 2019, the HECC is
responsible for these reports. This report is the second report submitted for House Bill 4053 and the first submitted
by the HECC. It takes a wide view of accelerated learning and examines many aspects of earning college credit during
high school, in addition to the aspects required under the legislation. The report should be of interest to Legislators
and the Governor; to students, to leadership and staff at Oregon’s community colleges, public universities, and K-12
education system, and to policymakers and scholars in the fields of secondary and postsecondary education.
This report was undertaken by staff in HECC’s Office of Research and Data with data supplied by Oregon’s 17
community colleges and seven public universities. As the single state entity responsible for ensuring pathways to
higher educational success for Oregonians statewide, the HECC sets state policy and funding strategies, administers
numerous programs and over $1.2 billion annually of public funding, and convenes partners working across the public
and private higher education arena to achieve state goals. More information about HECC can be found at
www.oregon.gov/highered. Questions about the HECC should be directed to [email protected], and questions
about this report should be directed to the Director of the Office of Research and Data, Amy Cox, at

iv
TABLE OF CONTENTS
PREFACE iii
TABLES v
FIGURES vi
EXECUTIVE SUMMARY vii
Background vii
Summary of Findings vii
Conclusions and Implications viii
ACKNOWLEDGMENTS x
ABBREVIATIONS xi
INTRODUCTION 1
The Anticipated Pay-off of Earning College Credit in High School 1
Multiple Ways to Earn College Credit in High School: Types of Accelerated Learning Programs 1
Previous Findings 3
Main Questions 4
Data and Methods 4
Summary 5
ACCESS TO ACCELERATED LEARNING IN OREGON 6
Differing Rates of Access 6
High School-Based College Credit Partnerships 9
Summary 13
IMPACT ON POSTSECONDARY OUTCOMES 14
Postsecondary Enrollment 14
Acceptance of Accelerated Learning Credits at Public Universities 14
Accelerated College Credit Earned through Community Colleges 19
Time to Completion & the Cost of Postsecondary Education 21
Summary 22
SUMMARY AND CONCLUSIONS 24
REFERENCES 26

v
TABLES
Table 1. Oregon public high school twelfth graders, AP test takers, and HS-based partnerships with community
colleges, and public universities, by race/ethnicity and gender, 2018-19. ........................................................ 7
Table 2. Percent of new Oregon public university freshmen arriving with accelerated learning credits and
average number of credits among all new freshmen, by student characteristics, fall 2017 or fall 2018............... 8
Table 3. Estimated credits earned per high school graduate from HS-based partnerships at Oregon community
colleges and public universities, averaged across all graduates, 2010-11 through 2017-18. .............................. 9
Table 4. College and university enrollment rates of 2016-17 public high school graduates, by whether graduates
earned community college or public university credit before graduation, fall 2017. ........................................ 14
Table 5. Accelerated learning credits presented to and accepted by Oregon public universities for new high
school graduates, by race/ethnicity and gender, fall 2018. ........................................................................... 15
Table 6. Accelerated learning credits accepted as general education requirements by Oregon public universities
for new high school graduates, by race/ethnicity and gender, fall 2018. ........................................................ 17
Table 7. Accelerated learning credits presented to, accepted by, and applied to general education requirements
by Oregon public universities for new high school graduates, by university, fall 2018. .................................... 18
Table 8. Accelerated learning credits presented to, accepted by, and applied to general education requirements
at Oregon public universities, by type of accelerated learning program, fall 2018. .......................................... 19
Table 9. Accelerated learning credits earned at Oregon community colleges by recent high school graduates,
among incoming college students, by race/ethnicity and gender, fall 2018. ................................................... 20
Table 10. Enrollment in Oregon community college after high school among students who earned community
college credit during high school, fall 2018. ................................................................................................ 21
Table 11. Median years to bachelor’s degree for new, first-time freshmen at Oregon public universities who
completed degrees, by accelerated learning credits, fall 2009 cohort. ........................................................... 22
Table A.1. Number of students enrolled in accelerated learning courses at Oregon public universities and
community colleges, 2009-10 through 2018-19. .......................................................................................... 27
Table A.2. Number of students enrolled in accelerated learning courses at Oregon public universities and
community colleges, by gender, 2009-10 through 2018-19. ......................................................................... 28
Table A.3. Number of students enrolled in accelerated learning courses at Oregon public universities and
community colleges, by race/ethnicity, 2009-10 through 2018-19. ................................................................ 30
Table B.1. Accelerated learning credits of 2017-18 Oregon high school graduates presented to, accepted by, and
applied to general education requirements by Oregon public universities, by institution, gender, and
race/ethnicity, fall 2018. ............................................................................................................................ 40
Table C.1. Accelerated learning credits presented to, accepted by, and applied to general education
requirements at Oregon public universities, by high school of incoming student, fall 2018. ............................. 47
vi
Table D.1. Accelerated learning credits earned at any Oregon community college by 2017-18 high school
graduates who then enrolled in community college after high school, by college, race/ethnicity, and gender, fall
2018. ....................................................................................................................................................... 56
FIGURES
Figure 1. Number of high school students enrolled for college credit through HS-based partnerships at Oregon
community colleges and public universities, 2009-10 through 2018-19. ......................................................... 10
Figure 2. Number of high school students enrolled for college credit through HS-based partnerships at Oregon
community colleges, by students’ race/ethnicity, 2009-10 through 2018-19. ................................................. 11
Figure 3. Number of high school students enrolled for college credit through HS-based partnerships at public
universities, by students’ race/ethnicity, 2009-10 through 2018-19. .............................................................. 11
Figure 4. Number of high school students enrolled for college credit through HS-based partnerships at
community colleges and public universities, by students’ gender, 2009-10 through 2018-19. .......................... 12
Figure 5. Number of high school students enrolled for college credit through HS-based partnerships at
community colleges and public universities, by geography, 2009-10 through 2018-19. ................................... 13

vii
EXECUTIVE SUMMARY
BACKGROUND
Earning college credit while in high school has become increasingly popular both nationally and in Oregon.
Known as “accelerated learning,” the vast majority of public high schools across the state provide students
with educational opportunities to earn college credit while in high school. The primary goal of accelerated
learning programs is to provide a bridge to postsecondary education that promotes a college-going culture,
expands access to postsecondary education, and helps prepare students academically for that postsecondary
education. Through these programs, students can be exposed to the benefits of postsecondary education and
be better prepared for those experiences and expectations.
Whether accelerated learning programs ensure timely completion of a postsecondary credential is also of
interest because of its potential to mitigate the rising costs of postsecondary education. To this end, the
transferability of accelerated learning credits into the postsecondary career is of particular importance, and in
2018, the Oregon Legislature passed House Bill (HB) 4053 to examine the acceptance of accelerated college
credit by Oregon’s public colleges and universities. Without seamless transfer, accelerated learning credits
could count against the credit limit of federal financial aid without contributing to degree requirements. The
bill calls for an evaluation of the extent to which accelerated college credits are (a) successfully transferred to
Oregon public postsecondary institutions and (b) applied to general education requirements.
This report offers a current analysis of two fundamental aspects of accelerated learning in Oregon and includes
answers to the questions posed by HB 4053 (2018) in these analyses. Specifically, we ask:
1. Who has access to accelerated learning, and how has this changed over time?
2. What is the impact of accelerated learning on postsecondary outcomes such as college-going rates,
transferability of credits, time to completion, and financial cost?
The report presents the current status of accelerated learning in Oregon with particular emphasis on whether
accelerated learning access and impact are equitably distributed across student groups. The report focuses on
accelerated learning programs that are (a) high school-based college credit partnerships, (b) Advanced
Placement, (c) International Baccalaureate, and (d) a category referred to as “undifferentiated college credit,”
which may include any of the first three kinds of programs or another kind of program but is not clearly
recorded. We examined high school-based partnerships (in which students earn credit from an Oregon
community college or public university in a program based at their high school) in the greatest depth, as these
programs are most common and data on them are most available.
SUMMARY OF FINDINGS
We found that accelerated learning programs and enrollment have increased over time. In 2018-19, 22 of the
24 public colleges and universities offer high school-based college credit partnership programs, enrolling over
40,000 students in more than 4,000 class sections each year. Students from all backgrounds participate in these
and other kinds of accelerated learning, but many in historically underserved groups appear to be
underrepresented. Students who are Black/African American, Hispanic/Latinx, Native American/Alaska
Native, Native Hawaiian/Pacific Islander, from rural counties, or from low-income families appear less likely
to be accessing accelerated learning, compared to white, urban, and higher-income students, and the gap

viii
appears to be widening in some cases. However, we note that high schools and colleges report students’
race/ethnicity and income status differently, which limits our understanding of how equitable access is.
Nonetheless, there is no strong evidence that accelerated learning has helped close racial/ethnic and other gaps
in education, with regard to participation rates and trends, credit earned, and type of program. By gender, we
find that girls are more likely to participate in accelerated learning than boys are and that this difference
appears to be widening. This is consistent with gender differences and trends in postsecondary enrollment and
completion.
With regard to impacts, participation in accelerated learning appears related to students’ college-going rates.
Oregon high school students who earned college credits from a public university or community college were
much more likely to continue their education after high school than students who had not earned credit from a
high-school-based partnership. Other factors are likely related to these differences in college-going rates (e.g.,
the selectivity of students taking college credit in high school), but the findings are consistent with previous
studies that control for many of these factors. Moreover, the apparent inequities in access to accelerated
learning suggest that at least some of this selectivity is situational (e.g., which students are prepared to and
encouraged to take accelerated learning) rather than aptitudinal.
We also found that students who do continue their education bring substantial credit into public universities
and community colleges, and nearly all of this credit is accepted by the receiving institution. At the public
universities, about three-quarters of the accelerated learning credits that universities accept are applied to
students’ general education requirements. This includes credits from all types of accelerated learning programs.
Finally, we also found that students entering public universities with at least ten accelerated learning credits
completed their bachelor’s degrees sooner, by one-half year, than students who entered with fewer than ten
credits. This has financial impacts both on educational costs and on the opportunity costs of lost wages.
In both access and impact, students from historically underserved groups, especially Black/African American,
Hispanic/Latinx, Native American/Alaska Native, and Native Hawaiian/Pacific Islander, appear to enjoy the
potential benefits of accelerated learning less than other students. They have lower participation rates in
accelerated learning, bring fewer credits into their postsecondary careers, are then at a disadvantage for pre-
filling general education requirements, and subsequently take longer to complete a bachelor’s degree and enter
their careers. These compounding effects occur in the context of other inequities in education.
CONCLUSIONS AND IMPLICATIONS
Accelerated learning, as it exists today in Oregon, appears to be both beneficial for those enrolled and
inequitable for which students gain these benefits. The underlying causes of these inequities are undeniably
complex and not limited to the secondary and postsecondary education systems. Nevertheless, accelerated
learning offers a valuable opportunity to address these challenges. Investing in the postsecondary education of
underserved students while they are still in high school presents a strategic opportunity to help close equity
gaps in education.
Given the apparent benefits of accelerated learning for students’ college-going rates, affordability, and time to
completion, expanded opportunities to access these benefits seem warranted. These opportunities include
investment both in programs and in educational processes of student engagement and support. The results
shown here indicate that programmatic investments include: (1) designing programs to be more available
students underrepresented in higher education to close equity gaps and (2) further aligning accelerated learning

ix
opportunities with general education requirements to increase the amount of accelerated learning that fulfills
degree requirements.
This report answers questions about the current participation and impact of accelerated learning in Oregon,
and it raises new questions. We encourage continued research on accelerated learning, especially with regard to
how access and impact can be made more equitable, how programs can be successful, and how different
programs provide different outcomes.

x
ACKNOWLEDGMENTS
We wish to acknowledge the many people who made this report possible. Several staff at the Higher
Education Coordinating Commission provided useful comments on earlier drafts, and Alix Hubert providing
indispensable formatting assistance. We are also grateful for the hard work of high school, college, and
university faculty and staff, who together make accelerated learning programs happen. Finally, we appreciate
and commend the students in high schools, colleges, and universities, whose hard work inspires all of us.
xi
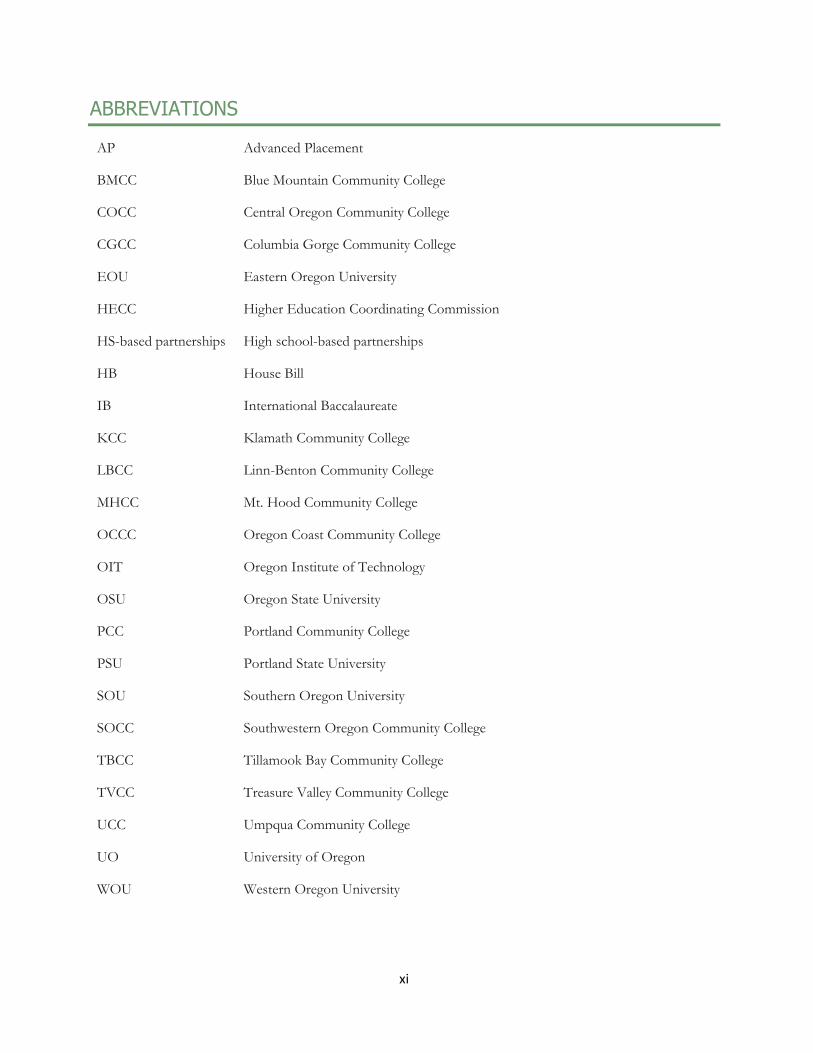
ABBREVIATIONS
AP Advanced Placement
BMCC Blue Mountain Community College
COCC Central Oregon Community College
CGCC Columbia Gorge Community College
EOU Eastern Oregon University
HECC Higher Education Coordinating Commission
HS-based partnerships High school-based partnerships
HB House Bill
IB International Baccalaureate
KCC Klamath Community College
LBCC Linn-Benton Community College
MHCC Mt. Hood Community College
OCCC Oregon Coast Community College
OIT Oregon Institute of Technology
OSU Oregon State University
PCC Portland Community College
PSU Portland State University
SOU Southern Oregon University
SOCC Southwestern Oregon Community College
TBCC Tillamook Bay Community College
TVCC Treasure Valley Community College
UCC Umpqua Community College
UO University of Oregon
WOU Western Oregon University

1
INTRODUCTION
THE ANTICIPATED PAY-OFF OF EARNING COLLEGE CREDIT IN HIGH SCHOOL
Earning college credit while in high school has become increasingly popular both nationally and in Oregon.
Known in Oregon as “accelerated learning,” the vast majority of public high schools across the state provide
students with educational experiences that offer the opportunity to earn college credit while in high school
(Hodara and Pierson, 2018). The primary goal of accelerated learning is to provide a bridge to postsecondary
education to “support and encourage a college-going culture” as well as “reduce gaps in college access and
academic achievement” (Higher Education Coordinating Commission, n.d.). By earning college credit while
in high school, students can be exposed to the benefits of postsecondary education and be better prepared for
postsecondary experiences and expectations.
In response to these advantages—and with the hope that accelerated learning programs can help alleviate
equity gaps within postsecondary education (Hodara and Pierson, 2018; Karp, 2015)—the past ten years have
seen an incredible growth in accelerated learning programs in Oregon. Through these programs, Oregon high
school students are able to earn college credit—often within the doors of their own high schools—and enter
postsecondary education with college credits already accumulated. College credits earned in high school help
equip students for future success by exposing them to the academic rigor of postsecondary education and by
potentially shortening their time to credential completion and reducing the costs of postsecondary education
(Iatarola, Conger, & Long, 2011; Long, Conger, & Iatarola, 2012; Karp, 2015).
Whether accelerated learning programs ensure timely completion of a postsecondary credential is of particular
interest and importance given the rising cost of postsecondary education. To this end, the transferability of
accelerated learning credits once students enroll in a college or university after high school has received
increasing attention as well. In 2018, the Oregon Legislature passed House Bill (HB) 4053 to examine the
acceptance of accelerated college credit by Oregon’s public colleges and universities. Without seamless
transfer, accelerated learning credits would count against the credit limit of federal financial aid without
contributing to course requirements. HB 4053 (2018) calls for an evaluation of the extent to which
accelerated college credits are (a) successfully transferred to Oregon public postsecondary institutions and (b)
applied to general education requirements. In this way, the spirit of the law not only assesses whether high
school students participating in accelerated learning programs are able to transfer these credits to Oregon
public colleges and universities, but whether accelerated learning credits help students meet degree
requirements more quickly and efficiently.
MULTIPLE WAYS TO EARN COLLEGE CREDIT IN HIGH SCHOOL: TYPES OF
ACCELERATED LEARNING PROGRAMS
In Oregon, accelerated learning programs include a variety of educational models. In 2018, the Higher
Education Coordinating Commission (HECC) adopted the following definitions (Oregon Administrative
Rule OAR 715-017-0005):
High School-Based College Credit Partnerships (HS-based college partnerships). These programs are defined as dual
credit, sponsored dual credit, and assessment-based learning credit partnerships. They are taught by high
school instructors at a high school during regular school hours and offer students both secondary and
postsecondary credit. The partnerships include career and technical education (CTE) programs, sometimes

2
referred to as “Two Plus Two" or "Tech Prep," that offer career-focused pathways aligning curriculum and
articulation of credit between high school and postsecondary programs. At the local level, some examples of
these programs include: College Now, the Willamette Promise, Advanced Credit, and others.
Dual Credit (OAR 715-017-0005): “Dual credit” means secondary and postsecondary credit
awarded for a course offered in a high school, which course is sufficiently similar to the
college or university course as to enable the enrolled students to be described as taking the
course from an Oregon community college or public university as set forth in ORS 340.310.
The course must be taught by a high school teacher who has been approved by the college
or university and who meets the qualifications to teach the course for the college or
university. Dual Credit may include Career and Technical Education courses.
Sponsored Dual Credit (OAR 715-017-0005): “Sponsored dual credit” means secondary and
postsecondary credit awarded for a course offered in a high school, which course is
sufficiently similar to the college or university course as to enable the enrolled students to be
described as taking the course from an Oregon community college or public university as set
forth in ORS 340.310. The course must be taught by a high school teacher who, in
partnership with a sponsoring college or university faculty member, meets the qualifications
to teach the course for the college or university. Sponsored Dual Credit may include Career
and Technical Education courses.
Assessment-Based Learning Credit (OAR 715-017-0005): “Assessment-based learning credit”
means secondary and postsecondary credit awarded for enhanced high school courses or
other activities offered at the high school, that focuses on student attainment of specific,
college or university defined student learning outcomes, and the opportunity for students to
demonstrate, through college or university assessments, that they have obtained those
student learning outcomes and thereby are eligible to earn credit for a course from the
partnering college or university. The course must be taught by a high school teacher in a
secondary-postsecondary partnership that focuses on the above assessment criteria.
Assessment based learning credit shall be identified on student transcripts. Assessment
Based Learning Credit may include Career and Technical Education courses.
Expanded Options. These programs allow students to attend an eligible postsecondary institution either full- or
part-time to complete their high school diplomas and earn college credits with costs paid for by the local
school district.
Online College Courses. These courses are offered by a postsecondary institution and specifically designed for
high school students.
Advanced Placement (AP). This national program has courses taught at the high schools that use approved
syllabi and national examinations that are created in partnership with college faculty copyrighted by the
College Board. Students can earn college credit once they enroll in college.
International Baccalaureate (IB). This program provides an internationally benchmarked course of study that
trains teachers to use in high schools. It uses ongoing program review and international student assessments.
Students can earn credit when they enroll in college.

3
Due to the availability of data, colleges, universities, and the State are not yet able to distinguish between
these types of accelerated learning programs for incoming students. This report focuses on accelerated
learning programs that are (a) HS-based college credit, (b) Advanced Placement, (c) International
Baccalaureate, and (d) an unknown category referred to as “undifferentiated college credit,” which may
include any of the first three kinds of programs or another kind but the source is not clearly recorded. Data
sources and availability are discussed in further detail in the Data and Methods section.
PREVIOUS FINDINGS
In line with the goals of the programs, prior research has found that students who earn accelerated learning
credit do, indeed, have higher rates of high school graduation, postsecondary enrollment, and postsecondary
retention (Development Services Group, 2017; Hodara and Pierson, 2018). In a report focused on accelerated
learning in Oregon, Hodara and Pierson (2018) found that accelerated learning participants were 30
percentage points more likely to graduate from high school compared to similar students who had not
participated in accelerated learning. Moreover, accelerated learning participants were also 25 percentage
points more likely to enroll in a college or university and 22 percentage points more likely to remain enrolled
in college through the following fall term. These positive impacts of accelerated learning programs were
similar across racial/ethnic groups. They held even after controlling for many differences between the groups
in socioeconomic, academic, and family characteristics (Hodara and Pierson, 2018).
The potential pay-off of participating in accelerated learning raises the question of whether all Oregon
students have access to these educational opportunities. Analysis of data from the 2015-16 academic year
found that 97% of Oregon public high schools had at least one student participating in an accelerated
learning program (Hodara and Pierson, 2018). The greatest participation rates were found in Oregon high
schools in urban areas. On average, among schools in urban locations, 36% of students participated in
accelerated learning programs in 2015-16. In comparison, among schools in rural locations, 26% of students
participated in accelerated learning programs on average (Hodara and Pierson 2018).
Beyond its impact on high school graduation or postsecondary enrollment, a primary goal of accelerated
learning is to help students achieve timely completion of a postsecondary degree. In order to achieve this
objective, accelerated learning credits must transfer to the student’s chosen college or university and ideally
apply toward specific course requirements, such as general education requirements. Previous studies have
observed mixed success in the transferability of accelerated learning credits. Hodara and Pierson (2018) found
that among students who earned college credit while in high school and went on to enroll at an Oregon
public university, 11% had none of their accelerated learning credits accepted by their respective university.
This study did not distinguish whether students who had accumulated these credits in high school had
planned to present them at college or university (i.e., students might not present credits because they did not
realize they could, because they knew the credits would not be accepted, or because of some other reason).
Another study found that most accelerated learning credits that were accepted did apply to course
requirements; roughly 60% of the credits accepted at Oregon public colleges and universities were applied
toward general education requirements (Chief Education Office, 2018). The goals of accelerated learning
would be considerably undermined if credits earned during high school were not applicable at students’
chosen colleges and universities.
Recent research on accelerated learning points to the continued need to track the access to and impact of
earning college credit while in high school. Understanding the effect of accelerated learning requires

4
continued understanding of the degree to which it is increasing, and for whom; the transferability of credits
earned; and its impact on the timely completion of degrees.
MAIN QUESTIONS
This report offers a current analysis of two fundamental aspects of accelerated learning in Oregon and include
answers to the questions posed by HB 4053 (2018). Specifically, it asks:
1. Who has access to accelerated learning, and how has this changed over time?
2. What is the impact of accelerated learning on postsecondary outcomes, such as college-going rates,
transferability of credits, time to completion, and financial cost?
DATA AND METHODS
To answer these questions, we draw on two sources of student-level data. The first is the set of student
records from Oregon’s community colleges and public universities that these institutions regularly submit to
the HECC. These records include information on accelerated learning programs offered through community
colleges and public universities as well as broader information about student characteristics, enrollment, and
completion.
The second source of data is a supplemental collection of data submitted by the institutions to fulfill the
requirements of HB 4053 (2018). This supplemental data collection contains information from the public
universities on (a) the number of accelerated learning credits presented for transfer by new Oregon high
school graduates, (b) the number of these accelerated learning credits that were accepted, and (c) the number
of accelerated learning credits that were applied toward general education requirements. While the bill
mandates both public universities and community colleges to submit these data, we formally solicited the data
only from the universities this year. This is because community colleges do not require students to present
high school transcripts before enrolling after high school, and students typically present accelerated learning
credits only at the time of petitioning for a certificate or degree. Therefore, colleges do not have data on the
number of incoming students presenting credits. However, we do supplement the HB 4053 (2018) special
collection with additional analyses of the regular student record data.
Within these two sources of data, the ability to track and measure each specific type of accelerated learning
program varies. Public universities are often—though not always—able to distinguish between accelerated
college credit earned through AP, IB, and the general category of high school-based college credit through
partnerships (HS-based college credit). However, public universities are not all able to distinguish and tabulate
whether college credit earned through HS-based college credit programs are from dual-credit, sponsored
dual-credit, and/or assessment based learning credit programs. Further, some institutions are not able to
determine the type of accelerated college credit program a student participated in at all. Based on these
constraints, among the public universities, this report distinguishes between four types of accelerated college
credit: (a) HS-based college credit, (b) AP, (c) IB, and (d) undifferentiated college credit, which may refer to
these or other types of programs. The student could have earned the credit through a number of channels:
directly (on campus or online), through Expanded Options or early college, or through a partnership where
the high school teacher taught the course.
Community colleges have even less insight into the types of accelerated learned credit earned by their
students, due to their open-enrollment nature and mission to serve all students. In order to minimize barriers
5
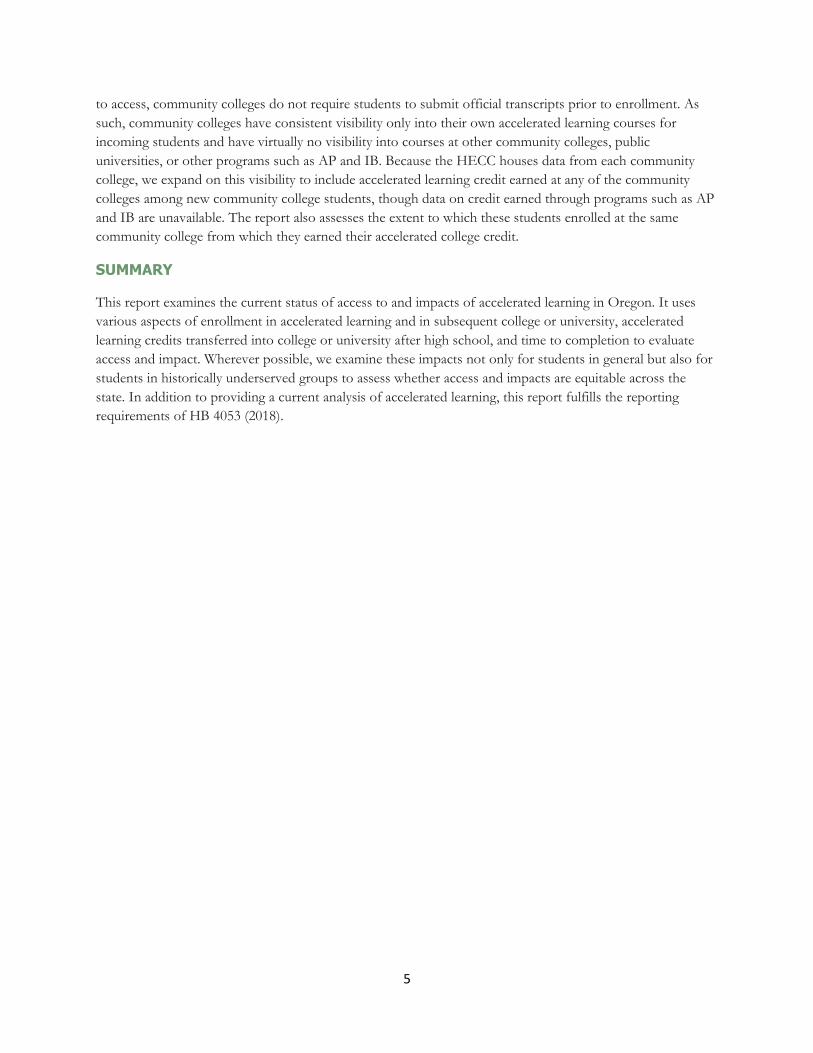
to access, community colleges do not require students to submit official transcripts prior to enrollment. As
such, community colleges have consistent visibility only into their own accelerated learning courses for
incoming students and have virtually no visibility into courses at other community colleges, public
universities, or other programs such as AP and IB. Because the HECC houses data from each community
college, we expand on this visibility to include accelerated learning credit earned at any of the community
colleges among new community college students, though data on credit earned through programs such as AP
and IB are unavailable. The report also assesses the extent to which these students enrolled at the same
community college from which they earned their accelerated college credit.
SUMMARY
This report examines the current status of access to and impacts of accelerated learning in Oregon. It uses
various aspects of enrollment in accelerated learning and in subsequent college or university, accelerated
learning credits transferred into college or university after high school, and time to completion to evaluate
access and impact. Wherever possible, we examine these impacts not only for students in general but also for
students in historically underserved groups to assess whether access and impacts are equitable across the
state. In addition to providing a current analysis of accelerated learning, this report fulfills the reporting
requirements of HB 4053 (2018).

6
ACCESS TO ACCELERATED LEARNING IN OREGON
DIFFERING RATES OF ACCESS
For policymakers, equitable access to earning college credit during high school points to accelerated learning
programs as a tool for closing education equity gaps. For students, it means having received the academic,
socio-economic, and developmental preparation to view accelerated learning as applicable to their futures and
possible to achieve. If students of all backgrounds experience this level of access, it would be evident in
proportionate numbers engaging in the programs. We observe whether this is the case by comparing the
racial/ethnic and gender distributions of all Oregon twelfth graders with the racial/ethnic and gender
distributions of students taking AP exams and of students earning credit through HS-based partnerships.
Unfortunately, comparable data on other characteristics related to equity (e.g., geography, income) and on
students taking IB exams are not available.
The results in Table 1 indicate that Black/African American, Hispanic/Latinx, Native American/Alaska
Native, and Native Hawaiian/Pacific Islander students are underrepresented in AP and HS-based partnership
programs. However, we note an important limitation that prevents us from drawing a certain conclusion that
this is the case, especially with HS-based partnership programs. The number of students not reporting a
race/ethnicity is large in these programs; 15% of students earning community college credit and 14% of
students earning university credit do not report their race/ethnicity. Among AP students, the number is much
smaller, one percent, but is still present. This is because students self-report their racial/ethnic identity to the
accelerated learning programs. In contrast, high school records always show a racial/ethnic identity for each
student because if students or their families decline to choose a racial/ethnic group, federal law requires school
staff to designate a racial/ethnic group for students on their records. Because we do not know the
racial/ethnic identities of students who do not self-report them in the college and university records (i.e., the
“not reported” group), direct comparisons between high school records and postsecondary records are
difficult. Nevertheless, the results suggest inequities, and they raise questions to be examined more fully.

7
Table 1. Oregon public high school twelfth graders, AP test takers, and HS-based partnerships with community
colleges, and public universities, by race/ethnicity and gender, 2018-19.
Percent of
twelfth graders
Percent of AP
test takers
Percent of
students earning
community
college credit
Percent of
students earning
public university
credit
Race/ethnicity
Asian American 4.5% 11.4% 4.9% 7.0%
Black/African American 2.6% 1.3% 1.4% 1.2%
Hispanic/Latinx 22.7% 16.1% 17.4% 19.9%
Native American/Alaska Native 1.5% 0.3% 1.0% 1.0%
Native Hawaiian/Pacific Islander 0.7% 0.3% 0.5% 0.5%
Multi-racial 5.9% 6.3% 5.1% 3.5%
White 61.9% 63.1% 54.4% 52.9%
Not reported N/A 1.3% 15.3% 14.1%
Total 100% 100% 100% 100%
Gender
Female 48.0% 55.0% 55.5% 58.8%
Male 52.0% 45.0% 44.5% 41.2%
Total 100% 100% 100% 100%
Source: Oregon Department of Education, 2019; College Board, 2019; HECC Office of Research and Data.
In contrast to access by racial/ethnic group, Table 1 shows a different result for gender. Although just over
half of twelfth graders are boys, just over half of students taking AP exams and earning credit through
community colleges and public universities are girls. Unlike historically underserved racial/ethnic groups, girls
are not underrepresented in accelerated learning opportunities. The same forces driving greater college
enrollment and completion among young women than among young men appear to be operating during high
school as well.
To the extent that historically underserved groups are underrepresented in accelerated learning opportunities,
students in these groups would end up with less educational capital when they enter college and university.
This would indicate accelerated learning is widening educational inequities rather than reducing them. Indeed,
most of these groups start their public university careers with fewer credits, on average, than white students.
This is particularly problematic given that these groups face other opportunity gaps in education. Table 2
shows the proportion of new incoming freshmen at public universities in fall 2018 with any accelerated
learning credits accepted and the average number of credits accepted for all students, including those with
none. Fewer Black/African American students, Hispanic/Latinx students, and Native American/Alaska
Native students arrive at the universities with college credits already completed than students in general. The
difference is particularly stark for Black/African American students and Native American/Alaska Native
students. Not surprisingly, these groups also arrive with fewer credits, on average, than incoming freshmen in

8
general. On average, Black/African American students arrive with 10.4 credits; Hispanic/Latinx students
arrive with 12.3 credits, and Native American/Alaska Native students arrive with 5.1 credits. This compares to
all incoming freshmen, who arrive with 15.8 credits on average, or more than a term of college credit
completed.
Table 2. Percent of new Oregon public university freshmen arriving with accelerated learning credits and
average number of credits among all new freshmen, by student characteristics, fall 2017 or fall 2018.
Number of
students
Percent with
any accelerated
learning credit
Average number
of accelerated
learning credits
Race/ethnicity (fall 2018)
Asian American 705 64% 20.9
Black/African American 169 37% 10.4
Hispanic/Latinx 1,154 50% 12.3
Native American/Alaska Native 57 26% 5.1
Native Hawaiian/Pacific Islander 35 54% 15.2
Multi-racial 607 57% 15.4
White 4,753 57% 16.2
Not reported 160 53% 16.8
Geography (fall 2018)
Rural 987 59% 17.2
Urban 6,529 55% 15.6
Income status (fall 2017)
Received Pell grant in 2017-18 2,824 50% 13.4
No Pell grant in 2017-18 4,627 60% 17.3
Total 7,645 56% 15.8
Source: HECC Office of Research and Data.
Table 2 also shows the same information for two other characteristics related to equity, geography and income
status. The difference in access to accelerated learning that is evident by race/ethnicity is not evident by
geography, at least as measured by the percentage of new freshmen who arrive with accelerated learning credits
nor by the average number of credits. Freshmen from rural and urban counties arrive with similar rates of
some accelerated learning credits, and the rate is even slightly higher among rural students, 59%, than among
urban students, 55%. They also arrive with similar numbers of credits: 17.2 credits for rural students and 15.6
credits for urban students (including those with zero accelerated learning credits).
Finally, Table 2 shows the same information for students by income status. We define income status as having
received a federal Pell grant at any point in their freshman year, and we examine new freshmen arriving in fall
2017 (not fall 2018) because of the availability of financial aid data. The results indicate a gap in access to

9
accelerated learning by income status. Half of lower income students arrived at the university with some
accelerated learning credit, compared to 60% of higher income students. In addition, lower income students
arrived with 13.4 credits on average (including those with zero credits), compared to 17.3 credits among higher
income students.
HIGH SCHOOL-BASED COLLEGE CREDIT PARTNERSHIPS
Another way to examine access to accelerated learning is by investigating how this access has changed over
time. To do this, we take a closer look at HS-based partnerships offered by public colleges and universities in
the state. First we provide a general overview of HS-based partnerships, and then we examine what their
growth over time suggests about the access to earning college credit in high school.
HS-based college credit partnerships are the most common way to earn college credit in high school. The
number of these programs has risen in recent years, and for several years, all 17 community colleges and all but
two of the seven public universities (Oregon State University and the University of Oregon) offer accelerated
college credit programs, typically dual-credit programs. Across the state, these programs offer thousands of
classes at hundreds of high schools. In 2017-18, 4,098 different classes (i.e., course sections) were offered,
enrolling about one in four high school students. Students participating in one of these partnerships take three
to four classes per year, on average.
By the time students complete twelfth grade, they earn, on average, an estimated 10.4 college credits through
these programs.1 This average includes all graduates, whether or not they participated in accelerated learning,
and whether or not they earned any credit. The estimated amount of college credit high school graduates
earned through HS-based partnerships rose steadily from 2010-11 to 2015-16 and has remained stable for the
last three years (Table 3). This suggests continued opportunities to expand access to accelerated learning
equitably.
Table 3. Estimated credits earned per high school graduate from HS-based partnerships at Oregon community
colleges and public universities, averaged across all graduates, 2010-11 through 2017-18.
High school graduation year 2010-
11
2011-
12
2012-
13
2013-
14
2014-
15
2015-
16
2016-
17
2017-
18
Estimated university credits earned 0.8 0.9 1.0 1.0 1.2 1.5 1.6 1.8
Estimated community college
credits earned 6.0 6.6 7.5 7.8 8.7 9.1 8.9 8.6
Total estimated public institution
credits earned 6.8 7.5 8.5 8.8 9.9 10.6 10.5 10.4
Source: HECC Office of Research and Data; Oregon Department of Education.
The number of high school students enrolled in dual credit and other HS-based partnership programs has
steadily increased over the past decade, as shown in Figure 1 below. Appendix A shows the number of
1 This number is calculated by dividing the total number of credits earned by all high school students in 2017-18 by the number of graduates in that year’s high school graduating class (for the four-year graduating cohort, as defined by the Oregon Department of Education). Credits earned include only those where students earned a grade of C- or better. This number is an estimate, as the numerator and denominator in the calculation do not represent the same student cohort and as some students with credit may not graduate. The numerator includes credits earned by high school seniors, juniors, sophomores, freshmen and possibly younger students in a single academic year. The denominator is the number of graduating seniors in the academic year shown.
10
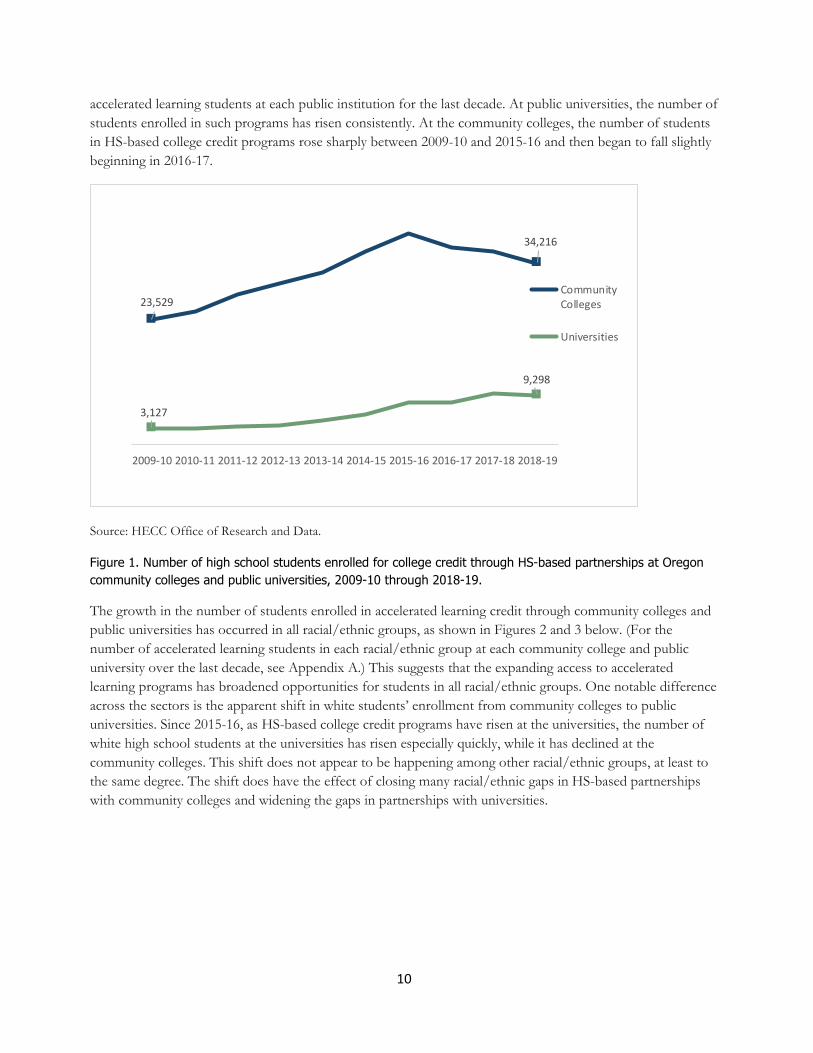
accelerated learning students at each public institution for the last decade. At public universities, the number of
students enrolled in such programs has risen consistently. At the community colleges, the number of students
in HS-based college credit programs rose sharply between 2009-10 and 2015-16 and then began to fall slightly
beginning in 2016-17.
Source: HECC Office of Research and Data.
Figure 1. Number of high school students enrolled for college credit through HS-based partnerships at Oregon
community colleges and public universities, 2009-10 through 2018-19.
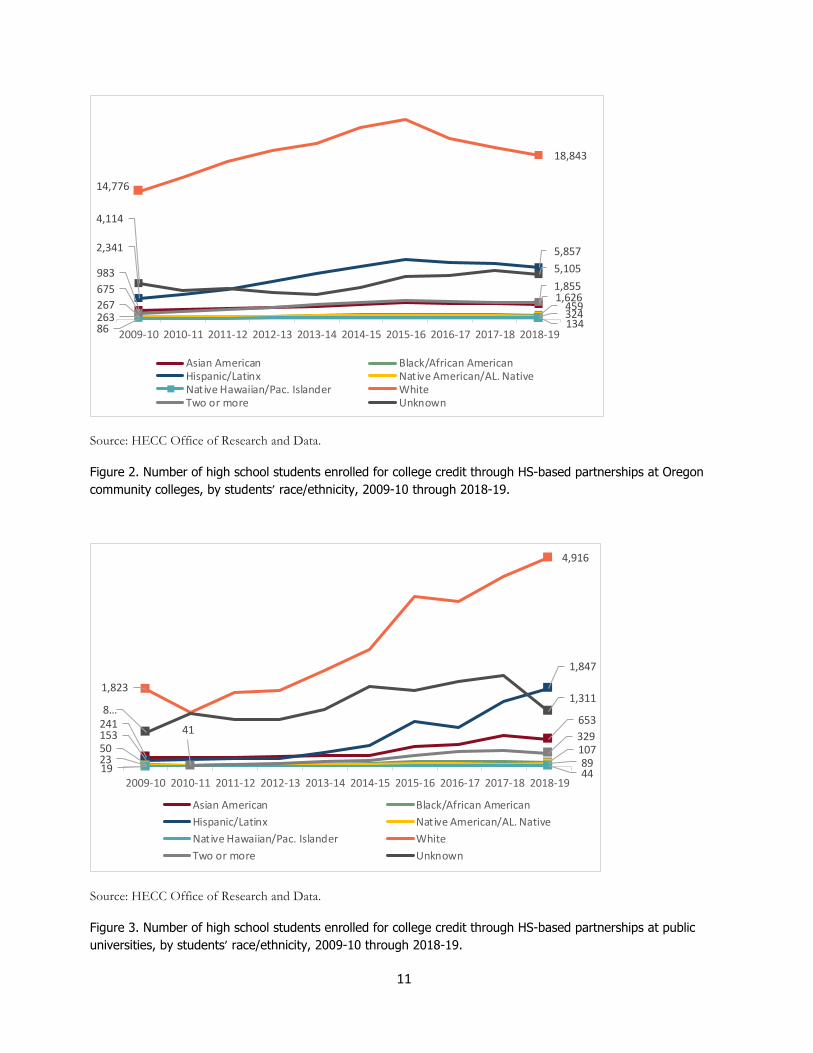
The growth in the number of students enrolled in accelerated learning credit through community colleges and
public universities has occurred in all racial/ethnic groups, as shown in Figures 2 and 3 below. (For the
number of accelerated learning students in each racial/ethnic group at each community college and public
university over the last decade, see Appendix A.) This suggests that the expanding access to accelerated
learning programs has broadened opportunities for students in all racial/ethnic groups. One notable difference
across the sectors is the apparent shift in white students’ enrollment from community colleges to public
universities. Since 2015-16, as HS-based college credit programs have risen at the universities, the number of
white high school students at the universities has risen especially quickly, while it has declined at the
community colleges. This shift does not appear to be happening among other racial/ethnic groups, at least to
the same degree. The shift does have the effect of closing many racial/ethnic gaps in HS-based partnerships
with community colleges and widening the gaps in partnerships with universities.
23,529
34,216
3,127
9,298
2009-10 2010-11 2011-12 2012-13 2013-14 2014-15 2015-16 2016-17 2017-18 2018-19
CommunityColleges
Universities
11
Source: HECC Office of Research and Data.
Figure 2. Number of high school students enrolled for college credit through HS-based partnerships at Oregon
community colleges, by students’ race/ethnicity, 2009-10 through 2018-19.
Source: HECC Office of Research and Data.
Figure 3. Number of high school students enrolled for college credit through HS-based partnerships at public
universities, by students’ race/ethnicity, 2009-10 through 2018-19.
983
1,626
263 459
2,341 5,857
267 324
86 134
14,776
18,843
675 1,855
4,114
5,105
2009-10 2010-11 2011-12 2012-13 2013-14 2014-15 2015-16 2016-17 2017-18 2018-19
Asian American Black/African AmericanHispanic/Latinx Native American/AL. NativeNative Hawaiian/Pac. Islander WhiteTwo or more Unknown
241 653
50 107153
1,847
23 8919 44
1,823
4,916
41329
8…1,311
2009-10 2010-11 2011-12 2012-13 2013-14 2014-15 2015-16 2016-17 2017-18 2018-19
Asian American Black/African American
Hispanic/Latinx Native American/AL. Native
Native Hawaiian/Pac. Islander White
Two or more Unknown

12
As with race/ethnicity, the overall rise in accelerated learning enrollment through community colleges and
public universities was evident among both young women and men, as shown in Figure 4. (Appendix A shows
this same information by specific college and university.) As noted previously, the greater participation among
girls is consistent with higher college-going rates among young women. The gap between girls and boys in
accelerated learning at universities appears to have widened in the last five years.
Source: HECC Office of Research and Data.
Figure 4. Number of high school students enrolled for college credit through HS-based partnerships at
community colleges and public universities, by students’ gender, 2009-10 through 2018-19.
Figure 5 breaks out the number of high school students enrolled in dual credit and other HS-based college
credit programs by whether students’ county of residence is primarily urban/suburban or rural. Appendix A
shows the same information by institution. Both urban and rural students experienced growth in earning
college credit through high-school based partnerships over the last decade, but more recently, the increase has
occurred largely among urban students. The increase in HS-based college credit programs at the universities
since 2015-16 has expanded urban student enrollment much more than rural student enrollment. This parallels
the same shift observed in white students’ enrollment. Moreover, if we combine the sectors, we find that total
enrollment in these HS-based partnerships has stabilized since 2015-16 for urban students but has begun to
decline slightly for rural students (see Appendix A). This greater access for urban students is consistent with
findings from prior studies (Hodara and Pierson 2018). Moreover, the widening gap between urban and rural
students suggests that access to accelerated learning may be becoming less equitable for students in terms of
geography.
12,651
18,141
1,853
5,335
10,106
14,650
1,246
3,623
2009-10 2010-11 2011-12 2012-13 2013-14 2014-15 2015-16 2016-17 2017-18 2018-19
Female Community College Female University
Male Community College Male University

13
Source: HECC Office of Research and Data.
Figure 5. Number of high school students enrolled for college credit through HS-based partnerships at
community colleges and public universities, by geography, 2009-10 through 2018-19.
SUMMARY
Overall, the findings regarding access to accelerated learning programs appear mixed. While groups from all
backgrounds are participating in many kinds of accelerated learning, many who are historically underserved
appear underrepresented. Students who are Black/African American, Hispanic/Latinx, Native
American/Alaska Native, Native Hawaiian/Pacific Islander, or from rural counties appear less likely to be
accessing the potential benefits of accelerated learning, compared to white and urban students. In some cases
this gap appears to be widening. Differences in how race/ethnicity is included in student records prevent full
understanding of how equitable access is, but the potential for accelerated learning to help close racial/ethnic
gaps in postsecondary education and training does not necessarily appear to be realized. In addition, consistent
with gender differences in postsecondary enrollment and completion, girls are more likely to participate in
accelerated learning than boys are, and this difference appears to be widening.
The underlying sources of differential access to accelerated learning are undoubtedly complex and certainly
stem from inequities in both education and the broader society. Nevertheless, addressing these challenges
within accelerated learning offers an important opportunity to invest in educational outcomes for underserved
students and close equity gaps in both secondary and postsecondary education and training.
We turn next to an exploration of the impact that accelerated learning can have on students’ college and
university careers.
4,446 6,774
18,233
25,063
579 1,754 2,541
7,520
2009-10 2010-11 2011-12 2012-13 2013-14 2014-15 2015-16 2016-17 2017-18 2018-19
Community College Rural Community College Urban
University Rural University Urban

14
IMPACT ON POSTSECONDARY OUTCOMES
By expanding high school students’ experiences, preparation, and investment in postsecondary education,
earning college credit before high school graduation carries the potential to increase college enrollment,
affordability, and success. In this section, we examine four potential impacts of accelerated learning: college
enrollment rates, fulfillment of course requirements, time to degree completion, and financial impacts
associated with the time to degree.
POSTSECONDARY ENROLLMENT
Consistent with previous studies, our analysis of student records shows a strong positive correlation between
accelerated learning participation and postsecondary enrollment. Table 4 compares the college enrollment rates
of students who earned some credit from a community college or public university during high school with the
college enrollment rates of students who earned no credit from these HS-based partnerships. Among Oregon
students who graduated high school in 2016-17, about 33% enrolled in an Oregon community college in fall of
2017, compared to about 23% of those who earned no credit. The difference in university enrollment rates is
even starker: 24% of those who earned any community college or public university credit enrolled in an
Oregon public university, compared to only nine percent of students with no credit from HS-based
partnerships. Although these findings suggest that participation in accelerated learning may increase the
likelihood of enrolling in postsecondary education, we note that multiple intervening factors may also explain
the difference in these rates. These include selectivity of students taking accelerated learning (i.e., those already
planning to attend college or university may be more likely to enroll in accelerated learning programs) and
selectivity of the availability of HS-based partnerships (i.e., HS-based partnerships may be more available in
schools that already have higher college-going rates). Previous findings controlled for characteristics related to
both of these factors and still found higher college-going rates among accelerated learning participants
(Development Services Group, 2017; Hodara and Pierson 2018).
Table 4. College and university enrollment rates of 2016-17 public high school graduates, by whether graduates
earned community college or public university credit before graduation, fall 2017.
Enrolled in community
college, fall 2017
Enrolled in public
university, fall 2017
Students who took some community
college or public university credits 33% 24%
Students who took no community
college or public university credits 23% 9%
Source: HECC Office of Research and Data.
ACCEPTANCE OF ACCELERATED LEARNING CREDITS AT PUBLIC UNIVERSITIES
Once enrolled at a postsecondary institution, accelerated learning credits will ideally contribute to a student’s
progress toward a degree. To do this, accelerated learning credits should successfully transfer and be applied
toward course requirements such as general education requirements. To assess the transferability of accelerated
college credit for HB 4053 (2018), Oregon public universities submitted data to the HECC on first-time
students enrolled at their institution in fall 2018 who were 2017-18 Oregon public high school graduates and
had attempted to transfer accelerated college credit. Most institutions provided data on the entire population
of interest; one institution provided data on a random, representative sample, as allowed by the legislation. As
mentioned previously, public universities have limited insight into the types of accelerated college credit

15
programs their students participated in. Based on these constraints, this report distinguishes between four
types of accelerated college credit transferred to the public universities: (a) HS-based college credit, (b)
Advanced Placement (AP), (c) International Baccalaureate (IB), and (d) undifferentiated college credit.
Student Characteristics – Race/Ethnicity and Gender
In fall 2018, 4,894 new graduates from Oregon public high schools enrolled in the public universities with
accelerated learning credits. The number of credits they presented and their racial/ethnic and gender
distributions are shown in Table 5. Appendix B provides the same information for each university. All
racial/ethnic and gender groups were represented among students who attempted to transfer credit, and the
proportions of many groups are aligned with the overall distributions of students taking accelerated learning
through community colleges and public universities. Two underrepresented exceptions are Hispanic/Latinx
and Native American/Alaska Native students. Hispanic/Latinx students comprise about 18% of students
earning credit through HS-based partnerships but 15% of the students presenting credits, and Native
American/Alaska Native students are one percent of the students earning credit through HS-based
partnerships but only one-half of a percent of those presenting credits. We note, however, the relatively large
group of high school students not reporting a racial/ethnic identity while enrolled in HS-based partnerships,
which makes direct comparisons difficult.
Table 5. Accelerated learning credits presented to and accepted by Oregon public universities for new high
school graduates, by race/ethnicity and gender, fall 2018.
Percent of
students in
2017-18 HS-
based
partnerships
Percent of
students
presenting
credits
Range of
credits
presented
Average
credits
presented
Range of
credits
accepted
Average
credits
accepted
Percent of
credits
presented
that were
accepted
Race/ethnicity, totals 100%
Asian American 5.4% 10.4% 1 – 123 33.5 0 – 122 31.9 95.4%
Black/African American 1.3% 1.5% 3 – 81 26.6 3 – 81 25.6 96.0%
Hispanic/Latinx 18.2% 14.8% 1 – 124 26.0 1 – 124 25.2 96.9%
Native American/Alaska
Native 1.0% 0.4% 2 – 102 33.1 2 – 97 30.7 92.8%
Native Hawaiian/Pacific
Islander 0.5% 0.4% 4 – 88 28.7 4 – 88 28.4 99.0%
Multi-racial 5.0% 8.3% 3 – 124 30.1 3 – 109 28.5 94.5%
White 55.1% 62.3% 1 – 166 30.7 0 – 166 29.4 95.7%
Not reported 13.5% 2.0% 4 – 133 29.8 4 – 121 29.0 97.5%
Gender, totals 100%
Female 54.1% 53% 1 – 166 29.9 0 – 166 28.8 96.5%
Male 39.8% 47% 1 – 144 30.7 1 – 144 29.1 94.8%
Not reported 3.8% 0.3% 4 – 37 18.8 4 – 37 18.8 100.0%
TOTAL 100%
(45,882)
100%
(4,894) 1 – 166 30.2 1 – 166 28.9 95.8%
Source: HECC Office of Research and Data.

16
The number of credits students presented ranged widely, from a single credit to well over half of the 180
credits required to earn a bachelor’s degree. The average number of credits students presented was 30, but this
ranged across the racial/ethnic and gender groups. The average number of credits presented was lowest for
Hispanic/Latinx students (26.0 credits) and Black/African American students (26.7 credits) and highest for
Asian American (33.5 credits) and Native American/Alaska Native students (33.1 credits). We note that the
number of Native American/Alaska Native students was small enough that their total might vary more in
coming years. Men presented about one credit more than women.
Nearly all credits presented were accepted, 95.8% overall, and the acceptance rate was nearly 100% for all
racial/ethnic and gender groups. The number of credits accepted, about 29 overall and from 25 to 32 across
the groups, is about two terms worth of credits, suggesting a substantial impact on these students’
undergraduate experience and success. That there is a difference of nearly seven credits across the groups also
suggests that there continues to be a need for more equitable access to accelerated learning opportunities.
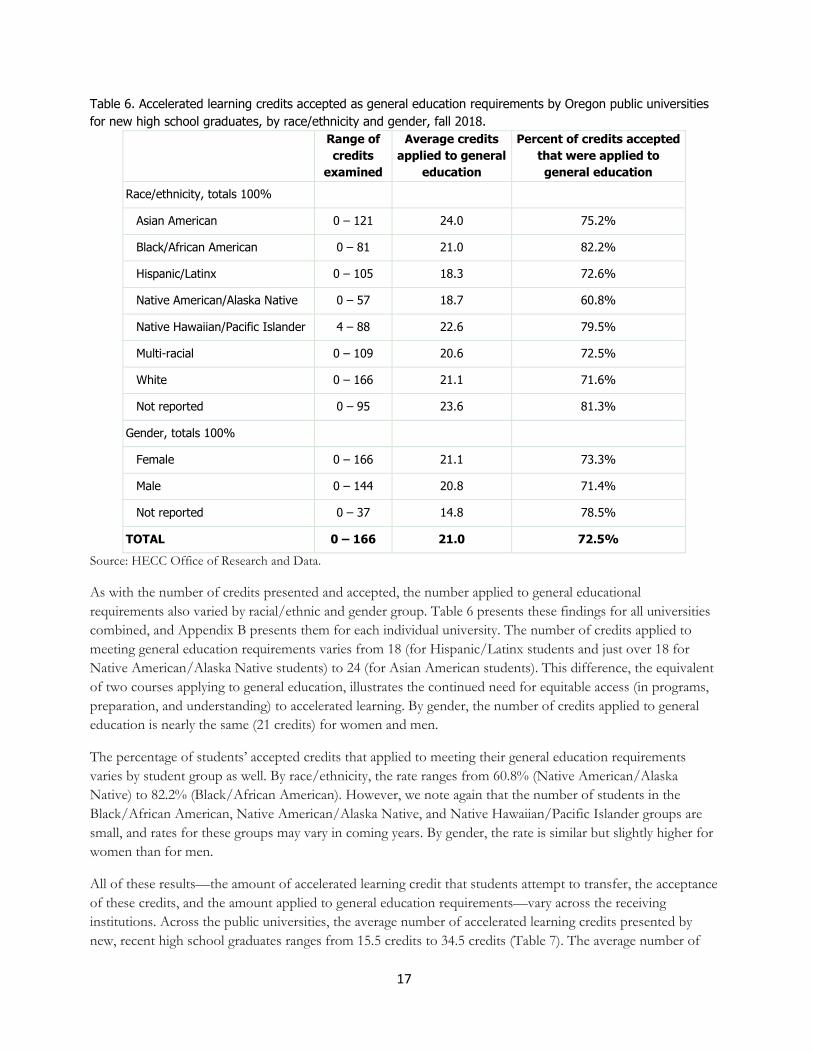
Accelerated Learning Credit Applied Toward General Education Requirements
Of the accelerated learning credits that universities accept, how many fulfilled course requirements, such as
general education requirements, rather than being accepted as electives? Overall, the seven public universities
report they applied 72.5% of the accelerated learning credits they accepted toward general education
requirements (Table 6). The remaining 27.5% of credits likely counted primarily as electives, with some
courses possibly applying toward major requirements (institutions were not asked to differentiate these two
latter categories). Appendix B shows this same information for each university. Together with the high rate of
acceptance overall, these findings suggest that, in general, accelerated college credits are welcomed at public
universities and are frequently applied toward a student’s general education requirements. At the same time,
the nearly 30% of credits applying mostly as elective credits illustrates the need for continued alignment
between accelerated learning coursework and university requirements. Further, it suggests that the nearly two
terms of college credit that students bring to the university already completed largely fills foundational
curriculum requirements, which would offer considerable help in the timely completion of their degree.
17
Table 6. Accelerated learning credits accepted as general education requirements by Oregon public universities
for new high school graduates, by race/ethnicity and gender, fall 2018.
Range of
credits
examined
Average credits
applied to general
education
Percent of credits accepted
that were applied to
general education
Race/ethnicity, totals 100%
Asian American 0 – 121 24.0 75.2%
Black/African American 0 – 81 21.0 82.2%
Hispanic/Latinx 0 – 105 18.3 72.6%
Native American/Alaska Native 0 – 57 18.7 60.8%
Native Hawaiian/Pacific Islander 4 – 88 22.6 79.5%
Multi-racial 0 – 109 20.6 72.5%
White 0 – 166 21.1 71.6%
Not reported 0 – 95 23.6 81.3%
Gender, totals 100%
Female 0 – 166 21.1 73.3%
Male 0 – 144 20.8 71.4%
Not reported 0 – 37 14.8 78.5%
TOTAL 0 – 166 21.0 72.5%
Source: HECC Office of Research and Data.
As with the number of credits presented and accepted, the number applied to general educational
requirements also varied by racial/ethnic and gender group. Table 6 presents these findings for all universities
combined, and Appendix B presents them for each individual university. The number of credits applied to
meeting general education requirements varies from 18 (for Hispanic/Latinx students and just over 18 for
Native American/Alaska Native students) to 24 (for Asian American students). This difference, the equivalent
of two courses applying to general education, illustrates the continued need for equitable access (in programs,
preparation, and understanding) to accelerated learning. By gender, the number of credits applied to general
education is nearly the same (21 credits) for women and men.
The percentage of students’ accepted credits that applied to meeting their general education requirements
varies by student group as well. By race/ethnicity, the rate ranges from 60.8% (Native American/Alaska
Native) to 82.2% (Black/African American). However, we note again that the number of students in the
Black/African American, Native American/Alaska Native, and Native Hawaiian/Pacific Islander groups are
small, and rates for these groups may vary in coming years. By gender, the rate is similar but slightly higher for
women than for men.
All of these results—the amount of accelerated learning credit that students attempt to transfer, the acceptance
of these credits, and the amount applied to general education requirements—vary across the receiving
institutions. Across the public universities, the average number of accelerated learning credits presented by
new, recent high school graduates ranges from 15.5 credits to 34.5 credits (Table 7). The average number of

18
credits that were accepted ranges from 15.5 credits to 31.7 credits, and the average number of credits applied
to filling general education requirements ranges from 12.1 credits to 30 credits (see Appendix B for further
detail). The percentage of accepted credits that were ultimately applied to general education requirements
ranged from 52% to 100%.
Table 7. Accelerated learning credits presented to, accepted by, and applied to general education requirements
by Oregon public universities for new high school graduates, by university, fall 2018.
University
Percent of
students
presenting
credits
Range of
credits
presented
Average
credits
presented
Average
credits
accepted
Average
credits
applied to
general
education
Percent of
credits accepted
that applied to
general
education
Eastern Oregon University 2.1% 1 – 103 21.8 21.8 12.9 59.0%
Oregon Institute of Technology 4.2% 1 – 133 30.4 30.1 26.1 87.0%
Oregon State University 39.1% 3 – 139 34.5 31.7 19.2 60.4%
Portland State University 15.0% 1 – 166 30.0 30.0 30.0 100.0%
Southern Oregon University 3.2% 3 – 88 15.5 15.5 13.5 87.5%
University of Oregon 30.4% 1 – 124 28.2 27.6 21.2 77.0%
Western Oregon University 6.0% 3 – 92 23.4 23.3 12.1 52.0%
TOTAL 100%
(4,894) 1 – 166 30.2 28.9 21.0 72.5%
Source: HECC Office of Research and Data.
Acceptance by Type of Accelerated Learning Program
The credits incoming students presented to the universities (shown above) include credits from many kinds of
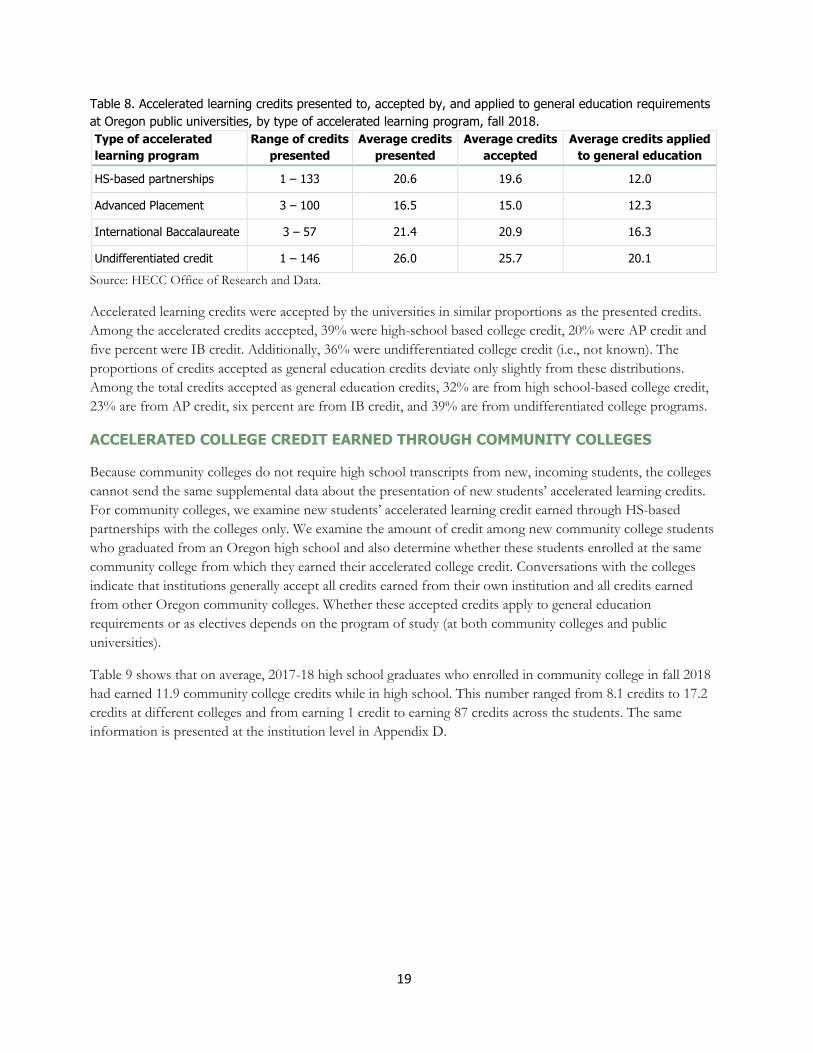
accelerated learning programs. Among these, HS-based college credit was the most prevalent, comprising 39%
of all credits presented. AP credits made up an additional 21% of the credits presented, while IB credits
comprised just five percent of those presented. A significant portion of the presented credit—35%—was
unable to be tracked within a specific accelerated learning model because it is not distinguished as different on
students’ college transcripts. Because assessment-based learning, AP, and IB should all be distinguished as
such on transcripts, undifferentiated college credit likely includes undifferentiated dual-credit, undifferentiated
sponsored dual-credit, Expanded Options credit, and credit earned through online courses. These results are
shown in Table 8, with additional detail by sending high school and by receiving university in Appendix C.
19
Table 8. Accelerated learning credits presented to, accepted by, and applied to general education requirements
at Oregon public universities, by type of accelerated learning program, fall 2018.
Type of accelerated
learning program
Range of credits
presented
Average credits
presented
Average credits
accepted
Average credits applied
to general education
HS-based partnerships 1 – 133 20.6 19.6 12.0
Advanced Placement 3 – 100 16.5 15.0 12.3
International Baccalaureate 3 – 57 21.4 20.9 16.3
Undifferentiated credit 1 – 146 26.0 25.7 20.1
Source: HECC Office of Research and Data.
Accelerated learning credits were accepted by the universities in similar proportions as the presented credits.
Among the accelerated credits accepted, 39% were high-school based college credit, 20% were AP credit and
five percent were IB credit. Additionally, 36% were undifferentiated college credit (i.e., not known). The
proportions of credits accepted as general education credits deviate only slightly from these distributions.
Among the total credits accepted as general education credits, 32% are from high school-based college credit,
23% are from AP credit, six percent are from IB credit, and 39% are from undifferentiated college programs.
ACCELERATED COLLEGE CREDIT EARNED THROUGH COMMUNITY COLLEGES
Because community colleges do not require high school transcripts from new, incoming students, the colleges
cannot send the same supplemental data about the presentation of new students’ accelerated learning credits.
For community colleges, we examine new students’ accelerated learning credit earned through HS-based
partnerships with the colleges only. We examine the amount of credit among new community college students
who graduated from an Oregon high school and also determine whether these students enrolled at the same
community college from which they earned their accelerated college credit. Conversations with the colleges
indicate that institutions generally accept all credits earned from their own institution and all credits earned
from other Oregon community colleges. Whether these accepted credits apply to general education
requirements or as electives depends on the program of study (at both community colleges and public
universities).
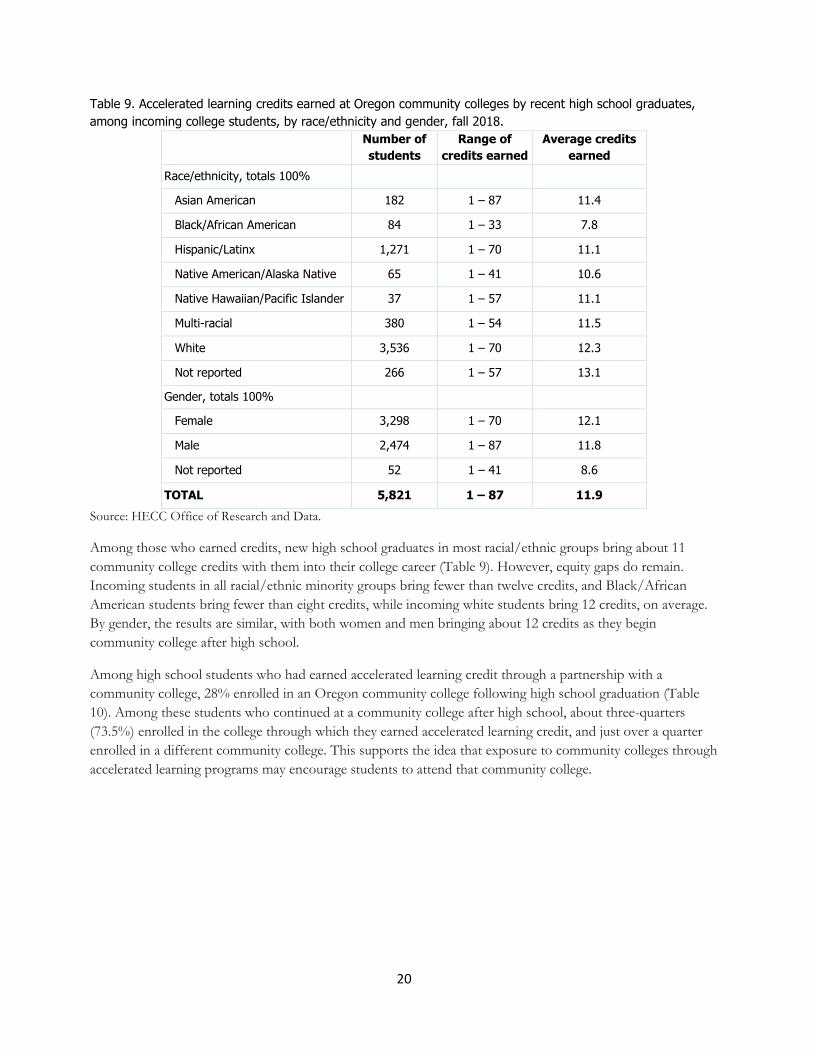
Table 9 shows that on average, 2017-18 high school graduates who enrolled in community college in fall 2018
had earned 11.9 community college credits while in high school. This number ranged from 8.1 credits to 17.2
credits at different colleges and from earning 1 credit to earning 87 credits across the students. The same
information is presented at the institution level in Appendix D.
20
Table 9. Accelerated learning credits earned at Oregon community colleges by recent high school graduates,
among incoming college students, by race/ethnicity and gender, fall 2018.
Number of
students
Range of
credits earned
Average credits
earned
Race/ethnicity, totals 100%
Asian American 182 1 – 87 11.4
Black/African American 84 1 – 33 7.8
Hispanic/Latinx 1,271 1 – 70 11.1
Native American/Alaska Native 65 1 – 41 10.6
Native Hawaiian/Pacific Islander 37 1 – 57 11.1
Multi-racial 380 1 – 54 11.5
White 3,536 1 – 70 12.3
Not reported 266 1 – 57 13.1
Gender, totals 100%
Female 3,298 1 – 70 12.1
Male 2,474 1 – 87 11.8
Not reported 52 1 – 41 8.6
TOTAL 5,821 1 – 87 11.9
Source: HECC Office of Research and Data.
Among those who earned credits, new high school graduates in most racial/ethnic groups bring about 11
community college credits with them into their college career (Table 9). However, equity gaps do remain.
Incoming students in all racial/ethnic minority groups bring fewer than twelve credits, and Black/African
American students bring fewer than eight credits, while incoming white students bring 12 credits, on average.
By gender, the results are similar, with both women and men bringing about 12 credits as they begin
community college after high school.
Among high school students who had earned accelerated learning credit through a partnership with a
community college, 28% enrolled in an Oregon community college following high school graduation (Table
10). Among these students who continued at a community college after high school, about three-quarters
(73.5%) enrolled in the college through which they earned accelerated learning credit, and just over a quarter
enrolled in a different community college. This supports the idea that exposure to community colleges through
accelerated learning programs may encourage students to attend that community college.

21
Table 10. Enrollment in Oregon community college after high school among students who earned community
college credit during high school, fall 2018.
Student group Number and percent
Number of accelerated learning students 21,105
Accelerated learning students who enrolled in
community college after high school
5,881
27.9% of 21,105
Subset who enrolled in the same community college 4,323
73.5% of 5,881
Subset who enrolled in a different community college 1,558
26.5% of 5,881
Source: HECC Office of Research and Data.
TIME TO COMPLETION & THE COST OF POSTSECONDARY EDUCATION
In addition to expanding access to postsecondary education and enabling students to enter college or
university with accumulated credits, accelerated learning programs can help students achieve timely completion
of their degree. We examined the time to bachelor’s degree completion for freshmen entering a public
university by whether students entered with some accelerated learning credits.2 We restrict this analysis to
bachelor’s degree completions because of the availability of university data on the number of credits students
had when they entered the university; we lack similar data for community college students. We calculated the
time to degree completion for the cohort of resident, first-time freshman who entered Oregon public
universities in fall 2009. To calculate time to degree completion, we track students for nine years. This is longer
than the typical four, five, or six years it takes most students to complete a bachelor’s degree in order to
account for the minority of students who take longer to complete their degree. We compared those freshmen
who entered with 10 or more accelerated learning credits accepted to those who entered with fewer than 10
credits accepted. We chose 10 credits as the comparison point because it is the equivalent of less than one full
term of college credits. A full term of college credits could enable students to graduate and enter a career job
early.
We found the median time to earning a bachelor’s degree for those with 10 or more accelerated learning
credits accepted was 3.7 years, while the median time for those with fewer than 10 credits accepted was 4.2
years. Put another way, students who arrive on campus with more than just a few accelerated learning credits
graduate half a year earlier than their counterparts with zero or just a few accelerated learning credits. These
findings are shown below in Table 11. The findings hold for all racial/ethnic groups.3
2 Among those who earned their bachelor’s degree within nine years of their first enrollment as new, admitted freshmen to the university. 3 We averaged results from three years’ of data for Native American/Alaska Native students and for Native Hawaiian/Pacific Islander students because of small numbers of students in these groups.

22
Table 11. Median years to bachelor’s degree for new, first-time freshmen at Oregon public universities who
completed degrees, by accelerated learning credits, fall 2009 cohort.
Student group
Students entering with 0
to 9 credits accepted
Students entering with 10
or more credits accepted
Race/ethnicity, totals 100%
Asian American 4.2 3.7
Black/African American 4.9 3.5
Hispanic/Latinx 4.7 3.9
Native American/Alaska Native* 4.4 4.0
Native Hawaiian/Pacific Islander* 4.4 4.0
Multi-racial N/A N/A
White 4.2 3.7
Not reported 4.5 3.7
Gender
Female 3.9 3.7
Male 4.7 3.9
Not reported 5.7 4.0
TOTAL 4.2 3.7
Source: HECC Office of Research and Data.
Note: Data for Native American/Alaska Native and Native Hawaiian/Pacific Islander students average the 2007, 2008,
and 2009 cohorts because of variations resulting from small numbers of students.
These findings not only suggest that students with ample accelerated learning credits students save time, they
also suggest such credits save costs. Students who graduate more quickly pay fewer costs for their university
education. Assuming the differences in time to degree completion maintain to current cohorts of students,
these costs can be sizable. In 2018-19, a half year at a public university for a full-time credit load cost about
$5,700 for resident tuition and books alone. Moreover, students who graduate sooner incur fewer opportunity
costs of being out of the labor force longer. They can enter their careers sooner and enjoy the bachelor’s
degree wage boost sooner.
SUMMARY
In this chapter, we examined the impacts of accelerated learning on students’ college and university enrollment
after high school, the amount of credit they were able to transfer into college and university, the applicability
of that credit to fulfill general education requirements, their time to completing a bachelor’s degree, and some
of the financial impacts of time to completion. We found that Oregon students who had earned college credits
from a public university or community college while in high school were much more likely to continue their
education after high school than students who had not earned credit through one of these HS-based
partnerships. We also found that students who do continue their education bring substantial credit into public

23
universities and community colleges, and nearly all of this credit is accepted by the receiving institution. At the
public universities, about three-quarters of accelerated learning credits that are accepted by the university are
applied to students’ general education requirements. Finally, we found that students entering public universities
with at least ten credits earned while in high school completed their bachelor’s degrees about half of a year
faster than students who entered with fewer than ten credits.
All of these impacts contribute to inequitable outcomes for students. In many cases, they exacerbate inequities
because they are the results of a system where access to accelerated learning opportunities is not equitable. In
particular, students from historically underserved groups, especially Black/African American, Hispanic/Latinx,
Native American/Alaska Native, and Native Hawaiian/Pacific Islander, bring fewer credits into their
postsecondary careers, which puts them at a continued disadvantage for filling general education requirements
and enjoying the lower costs of a shorter time to degree completion.

24
SUMMARY AND CONCLUSIONS
Accelerated learning, or earning college credit while in high school, has increased in popularity and has been
hailed as a key mechanism for increasing high school students’ college-going rates, reducing opportunity gaps
to make education more equitable, increasing college affordability, and improving student success both in high
school and in college or university. This report presents the current status of accelerated learning in Oregon to
examine these issues. We focus on measures of students’ access to accelerated learning and student impacts of
accelerated learning, and we place particular emphasis on whether access and impact are equitably distributed
across students. In addition to providing a current analysis of accelerated learning, this report also fulfills the
reporting requirements of HB 4053 (2018).
We examine four types accelerated learning: HS-based partnerships, AP, IB, and undifferentiated programs.
We examine HS-based partnerships (in which students earn credit from an Oregon community college or
public university in a program based at their high school) in the greatest depth, as these programs are most
common and data on them are most available.
We found that accelerated learning programs and enrollment have increased over time, with 22 of the 24
public postsecondary institutions currently offering HS-based partnerships with high schools that enroll over
40,000 students in over 4,000 different class sections each year. Students from all backgrounds are participating
in these and other kinds of accelerated learning, but many in historically underserved groups appear
underrepresented. Students who are Black/African American, Hispanic/Latinx, Native American/Alaska
Native, Native Hawaiian/Pacific Islander, from rural counties, or from low-income families appear less likely
to be accessing accelerated learning, compared to white and urban students, and the gap appears to be
widening in some cases. However, we note that high schools and colleges report students’ race/ethnicity and
income status differently, which limits our understanding of how equitable access is. Nonetheless, there is no
strong evidence that accelerated learning has helped close racial/ethnic gaps in education. By gender, we find
that girls are more likely to participate in accelerated learning than boys are, and this difference appears to be
widening. This is consistent with gender differences in postsecondary enrollment and completion.
With regard to impacts, participation in accelerated learning appears related to students’ college-going rates.
Oregon high school students who earned college credits from a public university or community college were
much more likely to continue their education after high school than students who had not earned credit from a
HS-based partnership. Although other factors are likely related to these differences in college-going rates (e.g.,
the selectivity of students taking college credit in high school), the findings are consistent with previous studies
that control for many of these factors. Moreover, the evidence of inequitable access to accelerated learning
suggests that at least some of this selectivity is situational (e.g., which students are prepared to and encouraged
to take accelerated learning) rather than aptitudinal.
We also found that students who do continue their education bring substantial credit into public universities
and community colleges, and nearly all of this credit is accepted by the receiving institution. At the public
universities, about three-quarters of accelerated learning credits that are accepted by a university are applied to
students’ general education requirements. This includes credits from all forms of accelerated learning.
We also found that students entering public universities with at least ten credits earned in high school
completed their bachelor’s degrees sooner, by one-half year, than students who entered with fewer than ten
credits. This has financial impacts both on educational costs and on the opportunity costs of lost wages.

25
In both access and impact, students from historically underserved groups, especially Black/African American,
Hispanic/Latinx, Native American/Alaska Native, and Native Hawaiian/Pacific Islander, appear to enjoy the
potential benefits of accelerated learning less than other students. They have lower participation in accelerated
learning, subsequently bring fewer credits into their postsecondary careers, are then at a disadvantage for pre-
filling general education requirements, and subsequently take longer to complete a bachelor’s degree and enter
their careers. These compounding effects occur in the context of other inequities in education.
Accelerated learning, as it exists today in Oregon, appears to be both beneficial for those enrolled and
inequitable for which students gain these benefits. The underlying causes of these inequities are undeniably
complex and not limited to the secondary and postsecondary education system. Nevertheless, accelerated
learning offers a valuable opportunity to address these challenges. Investing in the postsecondary education of
underserved students while they are still in high school presents a strategic opportunity to help close equity
gaps in education.
Given the apparent benefits of accelerated learning for students’ college-going rates, affordability, and time to
completion, expanded opportunities to access these benefits seem warranted. These opportunities include
investment both in programs and in processes of student engagement and support, as successful high school-
to-college transitions require both a doorway to walk through and the means to walk through it. The results
here indicate that programmatic investments include: (1) designing programs to be more available students
underrepresented in higher education to close equity gaps and (2) further aligning accelerated learning
opportunities with general education requirements to increase the amount of accelerated learning that fulfills
degree requirements.
Finally, the analyses provided here raise as many questions as they answer. We encourage continued research
into accelerated learning, especially with regard to how access and impact can be made more equitable, how
programs can be successful, and how different programs might provide different outcomes.

26
REFERENCES
Chief Education Office. 2018. Accelerated College Credit Transferability: House Bill 4053 (2018) Legislative
Report. Salem, OR: Chief Education Office.
Development Services Group. (2017). Dual Enrollment Programs: What Works Clearinghouse Intervention
Report. Washington, DC: U.S. Department of Education, Institute of Education Sciences, What Works
Clearinghouse. http://eric.ed.gov/?id=ED572842
Hodara, Michelle and Ashley Pierson. 2018. Supporting the Transition to College: Accelerated learning
access, outcomes, and credit transfer in Oregon. Portland, OR: Education Northwest.
Higher Education Coordinating Commission. (n.d.) College Credit while in High School. Retrieved October
30, 2019 from https://www.oregon.gov/highered/policy-collaboration/Pages/college-credit-high-
school.aspx.
Iatarola, Patrice, Conger, Dylan, & Long, Mark C. (2011). Determinants of high schools’ advanced course
offerings. Educational Evaluation and Policy Analysis, 33(3), 340–359. http://eric.ed.gov/?id=EJ935251
Karp, Melinda Mechur. (2015). Dual enrollment, structural reform, and the completion agenda. New
Directions for Community Colleges, 169, 103–111. http://eric.ed.gov/?id=EJ1053007
Long, Mark C., Conger, Dylan, & Iatarola, Patrice. (2012). Effects of high school course-taking on secondary
and postsecondary success. American Educational Research Journal, 49(2), 285–322.
https://eric.ed.gov/?id=EJ960491
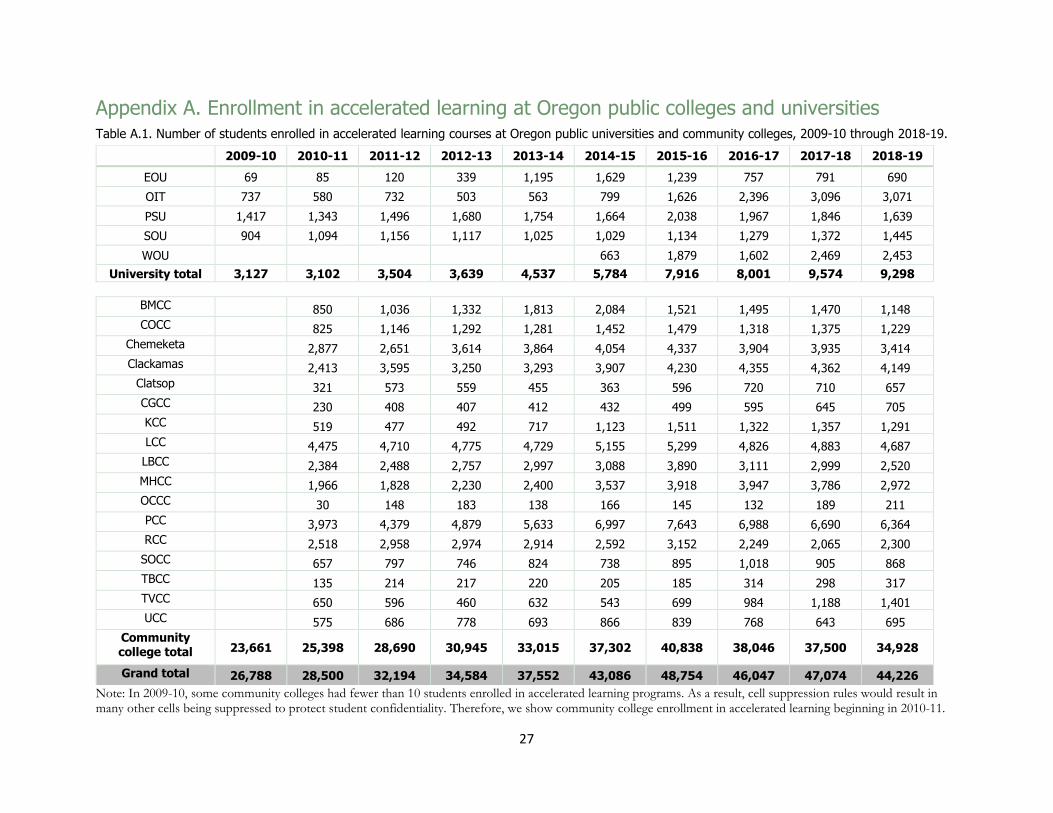
27
Appendix A. Enrollment in accelerated learning at Oregon public colleges and universities
Table A.1. Number of students enrolled in accelerated learning courses at Oregon public universities and community colleges, 2009-10 through 2018-19.
Note: In 2009-10, some community colleges had fewer than 10 students enrolled in accelerated learning programs. As a result, cell suppression rules would result in many other cells being suppressed to protect student confidentiality. Therefore, we show community college enrollment in accelerated learning beginning in 2010-11.
2009-10 2010-11 2011-12 2012-13 2013-14 2014-15 2015-16 2016-17 2017-18 2018-19
EOU 69 85 120 339 1,195 1,629 1,239 757 791 690
OIT 737 580 732 503 563 799 1,626 2,396 3,096 3,071
PSU 1,417 1,343 1,496 1,680 1,754 1,664 2,038 1,967 1,846 1,639
SOU 904 1,094 1,156 1,117 1,025 1,029 1,134 1,279 1,372 1,445
WOU 663 1,879 1,602 2,469 2,453
University total 3,127 3,102 3,504 3,639 4,537 5,784 7,916 8,001 9,574 9,298
BMCC 850 1,036 1,332 1,813 2,084 1,521 1,495 1,470 1,148
COCC 825 1,146 1,292 1,281 1,452 1,479 1,318 1,375 1,229
Chemeketa 2,877 2,651 3,614 3,864 4,054 4,337 3,904 3,935 3,414
Clackamas 2,413 3,595 3,250 3,293 3,907 4,230 4,355 4,362 4,149
Clatsop 321 573 559 455 363 596 720 710 657
CGCC 230 408 407 412 432 499 595 645 705
KCC 519 477 492 717 1,123 1,511 1,322 1,357 1,291
LCC 4,475 4,710 4,775 4,729 5,155 5,299 4,826 4,883 4,687
LBCC 2,384 2,488 2,757 2,997 3,088 3,890 3,111 2,999 2,520
MHCC 1,966 1,828 2,230 2,400 3,537 3,918 3,947 3,786 2,972
OCCC 30 148 183 138 166 145 132 189 211
PCC 3,973 4,379 4,879 5,633 6,997 7,643 6,988 6,690 6,364
RCC 2,518 2,958 2,974 2,914 2,592 3,152 2,249 2,065 2,300
SOCC 657 797 746 824 738 895 1,018 905 868
TBCC 135 214 217 220 205 185 314 298 317
TVCC 650 596 460 632 543 699 984 1,188 1,401
UCC 575 686 778 693 866 839 768 643 695
Community college total 23,661 25,398 28,690 30,945 33,015 37,302 40,838 38,046 37,500 34,928
Grand total 26,788 28,500 32,194 34,584 37,552 43,086 48,754 46,047 47,074 44,226

28
Table A.2. Number of students enrolled in accelerated learning courses at Oregon public universities and community colleges, by gender, 2009-10
through 2018-19.
2009-10 2010-11 2011-12 2012-13 2013-14
Female Male Female Male Female Male Female Male Female Male
EOU 43 26 55 30 76 44 211 123 698 495
OIT 455 282 374 206 492 240 323 180 324 239
PSU 781 615 760 564 811 675 912 743 966 763
SOU 574 323 669 417 721 428 698 405 607 385
WOU
University total 1,853 1,246 1,858 1,217 2,100 1,387 2,144 1,451 2,595 1,882
BMCC 540 369 496 351 597 435 774 555 1,094 719
COCC 538 360 485 336 645 491 714 566 676 575
Chemeketa 1,736 1,177 1,653 1,199 1,588 1,042 2,055 1,518 2,192 1,597
Clackamas 1,564 1,262 1,417 978 1,930 1,537 1,819 1,374 1,869 1,374
Clatsop 154 167 283 290 271 276 262 189
CGCC 158 97 151 79 243 164 243 162 256 156
KCC 393 244 316 203 292 185 288 204 411 306
LCC 2,212 1,931 2,151 1,774 2,239 1,909 2,330 1,976 2,210 1,993
LBCC 1,383 989 1,407 1,066 1,578 1,151 1,758 1,210
MHCC 1,035 594 1,237 715 1,147 668 1,339 875 1,452 947
OCCC 63 48 14 16 83 65 107 76 87 51
PCC 2,180 2,158 1,897 2,070 2,105 2,271 2,409 2,461 2,680 2,944
RCC 1,411 1,177 1,406 1,112 1,669 1,284 1,602 1,372 1,488 1,419
SOCC 287 234 375 274 394 363 411 318 484 326
TBCC 62 44 77 58 110 104 96 121 111 109
TVCC 217 22 337 307 344 249 271 186 348 279
UCC 340 251 345 230 420 266 444 333 389 303
Community collegetotal
12,736 10,168 13,894 10,858 15,496 12,389 16,751 13,524 17,767 14,497
Grandtotal 14,589 11,414 15,752 12,075 17,596 13,776 18,895 14,975 20,362 16,379 Note: In 2009-10, some community colleges had fewer than 10 students enrolled in accelerated learning programs. As a result, cell suppression rules would result in many other cells being suppressed to protect student confidentiality. Therefore, we show community college enrollment in accelerated learning beginning in 2010-11. Data current as of November 2019.

29
TableA.2.continued.
Note: In 2009-10, some community colleges had fewer than 10 students enrolled in accelerated learning programs. As a result, cell suppression rules would result in many other cells being suppressed to protect student confidentiality. Therefore, we show community college enrollment in accelerated learning beginning in 2010-11. Data current as of November 2019.
2014-15 2015-16 2016-17 2017-18 2018-19
Female Male Female Male Female Male Female Male Female Male
EOU 1,008 613 761 456 479 264 496 270 430 220
OIT 505 294 878 719 1,418 976 1,758 1,338 1,823 1,248
PSU 881 756 1,086 939 976 852 969 743 927 694
SOU 607 394 674 433 605 413 379 230 726 444
WOU 398 261 1,072 799 935 662 1,479 986 1,429 1,017
University total 3,399 2,318 4,471 3,346 4,413 3,167 5,081 3,567 5,335 3,623
BMCC 1,225 853 896 625 861 634 884 586 684 464
COCC 762 645 824 616 760 532 773 555 681 471
Chemeketa 2,285 1,663 2,319 1,883 2,105 1,639 2,123 1,609 1,852 1,409
Clackamas 2,213 1,622 2,305 1,884 2,320 1,990 2,395 1,942 2,266 1,842
Clatsop 183 180 311 285 310 410 328 382 278 379
CGCC 264 166 278 221 344 251 373 272 415 290
KCC 680 432 859 649 737 578 800 554 790 499
LCC 2,396 2,087 2,345 2,012 2,029 1,759 2,174 1,799 2,236 1,775
LBCC 1,783 1,261 2,241 1,566 1,821 1,185 1,742 1,132 1,415 987
MHCC 2,029 1,506 2,301 1,617 2,299 1,648 2,261 1,525 1,796 1,176
OCCC 98 68 92 53 79 53 109 80 125 86
PCC 3,570 3,401 3,735 3,866 3,505 3,434 3,292 3,309 3,164 3,054
RCC 1,392 1,198 1,726 1,424 1,227 1,010 1,213 833 1,303 977
SOCC 422 307 498 385 577 411 505 372 448 352
TBCC 115 90 103 81 182 132 174 124 174 142
TVCC 286 257 365 334 536 448 565 623 616 782
UCC 473 389 472 350 409 349 331 243 345 229
Community college total
20,176 16,125 21,670 17,851 20,101 16,463 20,042 15,940 18,588 14,914
Grand total 23,575 18,443 26,141 21,197 24,514 19,630 25,123 19,507 23,923 18,537

30
Table A.3. Number of students enrolled in accelerated learning courses at Oregon public universities and community colleges, by race/ethnicity, 2009-10
through 2018-19.
2009-10
Asian American Black/ African American
Hispanic/ Latinx
Native American/ Alaska Native
Native Hawaiian/ Pacific Islander
White Two or more
Unknown
EOU * * * * * * * *
OIT * * 42 16 * 609 * 52
PSU 220 44 71 * * 888 * 178
SOU * * * * * 289 * 569
WOU * * * * * * * *
University total 241 50 153 23 19 1,823 0 818
BMCC * 178 20 * 625 23 47
COCC * 66 13 * 743 17 50
Chemeketa 20 410 25 18 1858 85 427
Clackamas 21 164 * * 1914 67 519
Clatsop * * * * * * *
CGCC * 85 * * 156 * *
KCC * 82 18 * 478 14 27
LCC 36 389 67 21 2940 152 1037
LBCC * * * * * * *
MHCC 38 121 * * 995 52 218
OCCC * * * * 93 * *
PCC 101 496 36 18 2291 167 953
RCC 22 227 29 8 1459 63 742
SOCC * 49 14 * 389 17 43
TBCC * * * * 92 * *
TVCC * 46 * * 370 * 24
UCC * 32 10 * 470 * 28
Community college total
990 264 2,350 269 86 14,873 677 4,128
Grand Total 1,231 314 2,503 292 105 16,696 677 4,946 Note: In 2009-10, some community colleges had fewer than 10 students enrolled in accelerated learning programs. As a result, cell suppression rules would result in many other cells being suppressed to protect student confidentiality. Therefore, we show community college enrollment in accelerated learning beginning in 2010-11. Data current as of September 2019.

31
TableA.3.continued.
2010-11
Asian American Black/ African American
Hispanic/ Latinx
Native American/ Alaska Native
Native Hawaiian/ Pacific Islander
White Two or more
Unknown
EOU * * * * * * * *
OIT 14 * 47 11 * 471 * 17
PSU 217 33 77 * 15 671 27 295
SOU * * 19 * * 118 * 946
WOU * * * * * * * *
University total 238 37 168 22 20 1,305 41 1,271
BMCC * * 169 23 * 611 21 17
COCC 11 * 49 * * 638 20 96
Chemeketa 97 25 459 29 16 1780 87 383
Clackamas 103 * 152 15 * 1683 112 332
Clatsop * * 32 * * 158 * 107
CGCC * * 73 * * 140 * *
KCC 11 * 74 11 * 368 11 41
LCC 133 27 436 55 13 2699 183 925
LBCC 108 20 134 * * 1928 52 98
MHCC 220 30 239 * * 1170 56 224
OCCC * * * * * 22 * *
PCC 288 100 578 35 21 2409 269 266
RCC 37 21 232 26 15 1450 69 668
SOCC * * 56 18 * 487 21 60
TBCC * * * * * 102 * *
TVCC 15 * 67 * * 503 * 45
UCC * * 47 19 * 446 * 43
Community college total
1,057 249 2,817 294 111 16,594 923 3,311
Grand Total 1,295 286 2,985 316 131 17,899 964 4,582 Note: In 2009-10, some community colleges had fewer than 10 students enrolled in accelerated learning programs. As a result, cell suppression rules would result in many other cells being suppressed to protect student confidentiality. Therefore, we show community college enrollment in accelerated learning beginning in 2010-11. Data current as of September 2019.

32
TableA.3.continued.
2011-12
Asian American Black/ African American
Hispanic/ Latinx
Native American/ Alaska Native
Native Hawaiian/ Pacific Islander
White Two or more
Unknown
EOU * * 26 * * * * 24
OIT 14 * 63 15 * 610 * *
PSU 222 49 110 * * 976 48 66
SOU * * * * * 105 * 1,016
WOU * * * * * * * *
University total 244 52 222 38 10 1,753 57 1,128
BMCC 10 * 209 35 * 738 26 15
COCC 12 * 106 * * 802 21 191
Chemeketa 77 24 591 24 11 1709 107 108
Clackamas 157 28 318 30 13 2331 187 531
Clatsop 12 * 51 12 * 378 12 100
CGCC * * 98 * * 270 * 16
KCC * * 85 * * 323 14 38
LCC 144 39 471 58 22 2645 195 1,130
LBCC 108 24 184 * * 1957 60 121
MHCC 205 35 185 19 13 1105 63 203
OCCC * * 11 * * 107 * *
PCC 375 126 617 29 25 2578 309 316
RCC 47 19 315 35 12 1881 101 547
SOCC * * 55 19 * 540 30 138
TBCC * * 16 * * 171 * *
TVCC 15 * 79 * * 457 * 26
UCC 15 * 49 12 * 534 * 61
Community college total
1,205 321 3,440 327 116 18,526 1,161 3,556
Grand Total 1,449 373 3,662 365 126 20,279 1,218 4,684 Note: In 2009-10, some community colleges had fewer than 10 students enrolled in accelerated learning programs. As a result, cell suppression rules would result in many other cells being suppressed to protect student confidentiality. Therefore, we show community college enrollment in accelerated learning beginning in 2010-11. Data current as of September 2019.
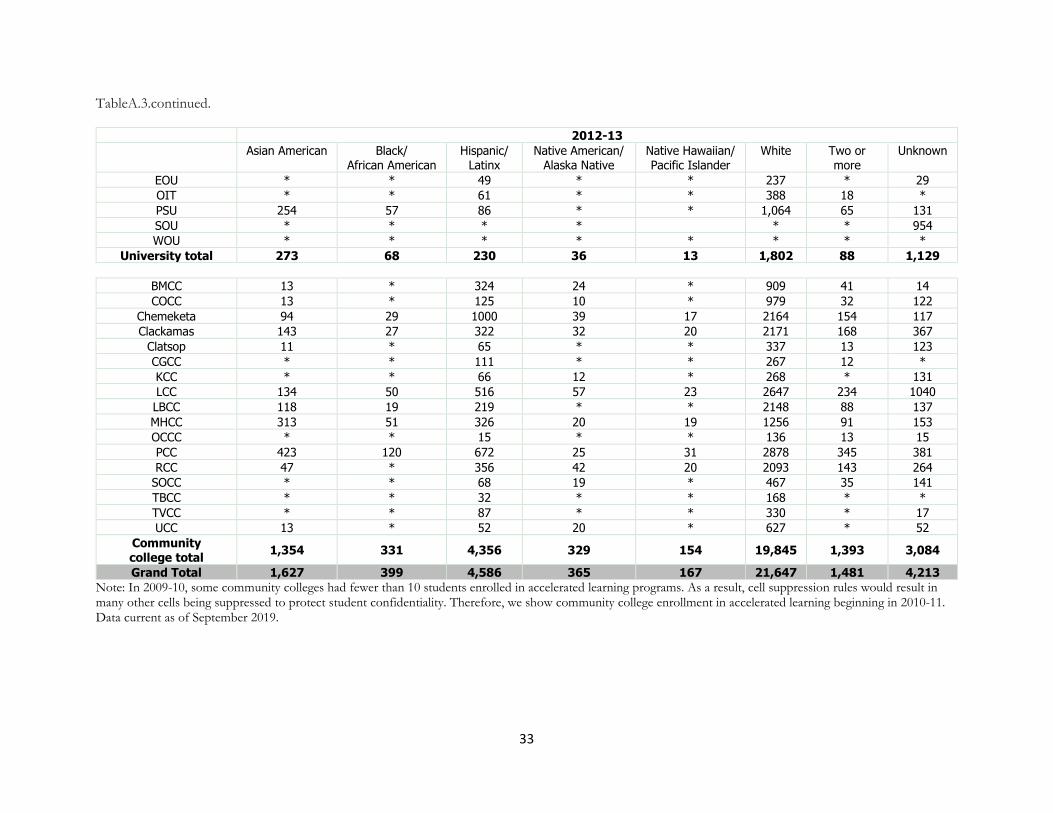
33
TableA.3.continued.
2012-13
Asian American Black/ African American
Hispanic/ Latinx
Native American/ Alaska Native
Native Hawaiian/ Pacific Islander
White Two or more
Unknown
EOU * * 49 * * 237 * 29
OIT * * 61 * * 388 18 *
PSU 254 57 86 * * 1,064 65 131
SOU * * * * * * 954
WOU * * * * * * * *
University total 273 68 230 36 13 1,802 88 1,129
BMCC 13 * 324 24 * 909 41 14
COCC 13 * 125 10 * 979 32 122
Chemeketa 94 29 1000 39 17 2164 154 117
Clackamas 143 27 322 32 20 2171 168 367
Clatsop 11 * 65 * * 337 13 123
CGCC * * 111 * * 267 12 *
KCC * * 66 12 * 268 * 131
LCC 134 50 516 57 23 2647 234 1040
LBCC 118 19 219 * * 2148 88 137
MHCC 313 51 326 20 19 1256 91 153
OCCC * * 15 * * 136 13 15
PCC 423 120 672 25 31 2878 345 381
RCC 47 * 356 42 20 2093 143 264
SOCC * * 68 19 * 467 35 141
TBCC * * 32 * * 168 * *
TVCC * * 87 * * 330 * 17
UCC 13 * 52 20 * 627 * 52
Community college total
1,354 331 4,356 329 154 19,845 1,393 3,084
Grand Total 1,627 399 4,586 365 167 21,647 1,481 4,213 Note: In 2009-10, some community colleges had fewer than 10 students enrolled in accelerated learning programs. As a result, cell suppression rules would result in many other cells being suppressed to protect student confidentiality. Therefore, we show community college enrollment in accelerated learning beginning in 2010-11. Data current as of September 2019.

34
TableA.3.continued.
2013-14
Asian American Black/ African American
Hispanic/ Latinx
Native American/ Alaska Native
Native Hawaiian/ Pacific Islander
White Two or more
Unknown
EOU 22 * 196 27 * 812 * 121
OIT * * 36 * * 464 20 *
PSU 255 51 107 * * 921 85 313
SOU * * * * * * * 910
WOU * * * * * * * *
University total 296 62 352 51 11 2,286 118 1,361
BMCC 15 * 583 30 * 1104 53 18
COCC 24 * 171 16 * 896 38 130
Chemeketa 74 19 1258 35 21 2230 148 76
Clackamas 158 32 353 40 15 2294 180 221
Clatsop 10 * 54 * * 308 17 56
CGCC * * 126 * * 257 12 *
KCC * * 118 18 * 446 10 111
LCC 120 43 539 54 25 2501 272 1021
LBCC 110 * 245 22 * 2313 136 135
MHCC 339 42 413 15 10 1385 125 71
OCCC * * 13 * * 104 10 *
PCC 465 193 699 37 39 3226 453 518
RCC 40 16 450 44 12 2058 145 148
SOCC 17 * 91 26 * 539 33 107
TBCC * * 30 * * 177 * *
TVCC * * 126 13 * 428 25 22
UCC 12 * 52 10 * 470 * 142
Community college total
1,413 385 5,321 371 149 20,736 1,664 2,792
Grand Total 1,709 447 5,673 422 160 23,022 1,782 4,153 Note: In 2009-10, some community colleges had fewer than 10 students enrolled in accelerated learning programs. As a result, cell suppression rules would result in many other cells being suppressed to protect student confidentiality. Therefore, we show community college enrollment in accelerated learning beginning in 2010-11. Data current as of September 2019.

35
TableA.3.continued.
2014-15
Asian American Black/ African American
Hispanic/ Latinx
Native American/ Alaska Native
Native Hawaiian/ Pacific Islander
White Two or more
Unknown
EOU 20 12 160 23 * 675 * 733
OIT 18 * 70 * * 629 42 27
PSU 247 52 111 20 * 979 85 161
SOU * * 15 * * 74 * 924
WOU * * 163 * * 404 22 50
University total 302 73 519 56 19 2,761 159 1,895
BMCC 12 * 690 39 * 1247 62 18
COCC 29 * 186 15 * 825 50 340
Chemeketa 114 26 1291 30 18 2358 151 66
Clackamas 185 33 397 46 19 2682 244 300
Clatsop 10 * 40 * * 245 14 44
CGCC * * 155 * * 243 14 *
KCC 23 * 225 31 * 744 14 72
LCC 129 53 606 74 28 2722 323 1202
LBCC 101 * 307 26 * 2261 140 227
MHCC 459 92 642 32 25 1923 200 163
OCCC * * 16 * * 119 18 *
PCC 579 252 932 47 59 3877 571 673
RCC 38 16 379 41 17 1853 134 115
SOCC 14 * 77 21 * 491 39 82
TBCC * * 24 * * 162 * *
TVCC * * 122 * * 364 17 21
UCC 12 * 86 10 * 487 * 260
Community college total
1,727 530 6,175 428 194 22,603 2,002 3,599
Grand Total 2,029 603 6,694 484 213 25,364 2,161 5,494 Note: In 2009-10, some community colleges had fewer than 10 students enrolled in accelerated learning programs. As a result, cell suppression rules would result in many other cells being suppressed to protect student confidentiality. Therefore, we show community college enrollment in accelerated learning beginning in 2010-11. Data current as of September 2019.

36
TableA.3.continued.
2015-16
Asian American Black/ African American
Hispanic/ Latinx
Native American/ Alaska Native
Native Hawaiian/ Pacific Islander
White Two or more
Unknown
EOU * * 225 * * 697 * 264
OIT 109 * 155 24 * 1,143 99 71
PSU 330 89 189 24 13 1,101 131 161
SOU * * 13 * * 82 * 1,027
WOU 40 * 506 17 * 976 49 276
University total 503 123 1,088 79 35 3,999 290 1,799
BMCC * 11 543 25 * 852 53 23
COCC 28 * 213 14 * 951 61 206
Chemeketa 101 17 1503 37 23 2408 171 75
Clackamas 215 30 497 42 11 2734 293 408
Clatsop 17 * 67 * * 303 29 168
CGCC * * 161 * * 302 15 10
KCC 24 * 320 45 * 1019 49 39
LCC 126 65 557 56 23 2576 274 1,605
LBCC 147 18 427 34 10 2552 201 500
MHCC 512 100 708 21 31 2114 207 225
OCCC * * * * * 104 14 *
PCC 644 272 1125 39 55 4110 619 775
RCC 39 14 508 46 20 2010 161 354
SOCC 12 * 95 25 * 568 44 146
TBCC * * * * * 143 * *
TVCC * * 169 * * 455 26 27
UCC * * 87 13 * 419 * 304
Community college total
1,901 563 7,015 420 192 23,620 2,223 4,875
Grand Total 2,404 686 8,103 499 227 27,619 2,513 6,674 Note: In 2009-10, some community colleges had fewer than 10 students enrolled in accelerated learning programs. As a result, cell suppression rules would result in many other cells being suppressed to protect student confidentiality. Therefore, we show community college enrollment in accelerated learning beginning in 2010-11. Data current as of September 2019.
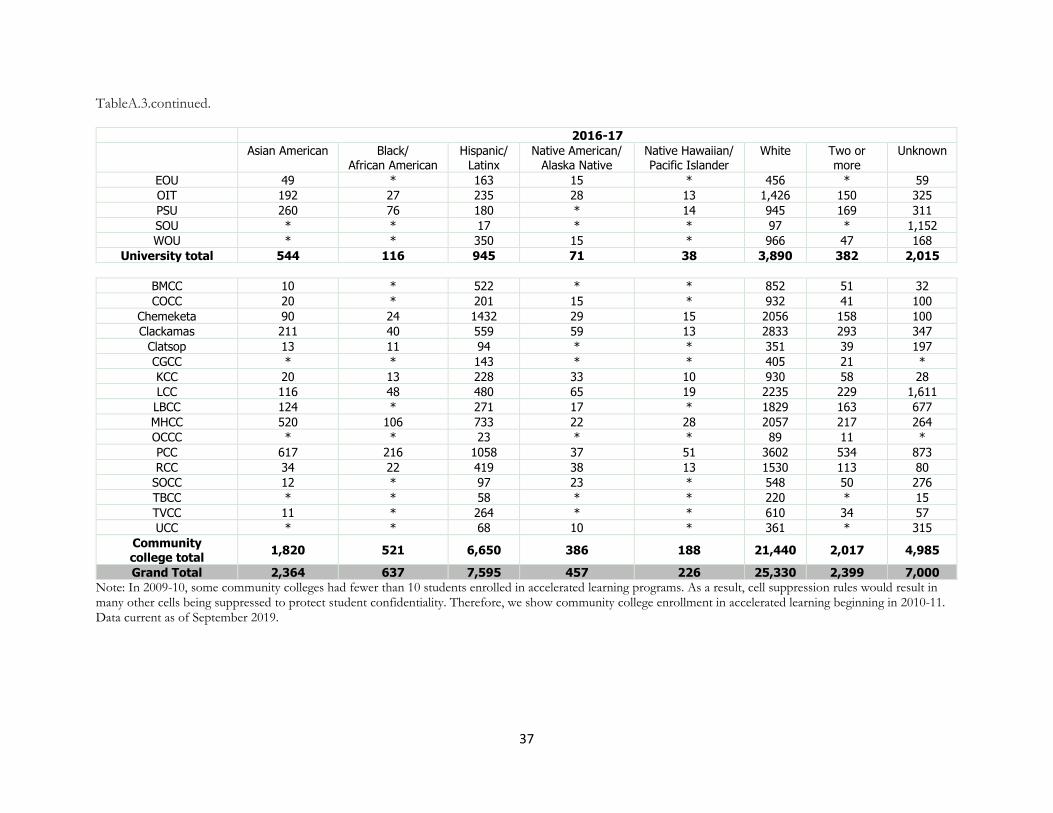
37
TableA.3.continued.
2016-17
Asian American Black/ African American
Hispanic/ Latinx
Native American/ Alaska Native
Native Hawaiian/ Pacific Islander
White Two or more
Unknown
EOU 49 * 163 15 * 456 * 59
OIT 192 27 235 28 13 1,426 150 325
PSU 260 76 180 * 14 945 169 311
SOU * * 17 * * 97 * 1,152
WOU * * 350 15 * 966 47 168
University total 544 116 945 71 38 3,890 382 2,015
BMCC 10 * 522 * * 852 51 32
COCC 20 * 201 15 * 932 41 100
Chemeketa 90 24 1432 29 15 2056 158 100
Clackamas 211 40 559 59 13 2833 293 347
Clatsop 13 11 94 * * 351 39 197
CGCC * * 143 * * 405 21 *
KCC 20 13 228 33 10 930 58 28
LCC 116 48 480 65 19 2235 229 1,611
LBCC 124 * 271 17 * 1829 163 677
MHCC 520 106 733 22 28 2057 217 264
OCCC * * 23 * * 89 11 *
PCC 617 216 1058 37 51 3602 534 873
RCC 34 22 419 38 13 1530 113 80
SOCC 12 * 97 23 * 548 50 276
TBCC * * 58 * * 220 * 15
TVCC 11 * 264 * * 610 34 57
UCC * * 68 10 * 361 * 315
Community college total
1,820 521 6,650 386 188 21,440 2,017 4,985
Grand Total 2,364 637 7,595 457 226 25,330 2,399 7,000 Note: In 2009-10, some community colleges had fewer than 10 students enrolled in accelerated learning programs. As a result, cell suppression rules would result in many other cells being suppressed to protect student confidentiality. Therefore, we show community college enrollment in accelerated learning beginning in 2010-11. Data current as of September 2019.

38
TableA.3.continued.
2017-18
Asian American Black/ African American
Hispanic/ Latinx
Native American/ Alaska Native
Native Hawaiian/ Pacific Islander
White Two or more
Unknown
EOU * * 162 14 * 509 * 33
OIT 316 34 389 22 15 1,913 207 200
PSU 234 76 219 * 11 799 127 369
SOU * * 27 * * 115 * 1,211
WOU 156 * 764 14 * 1125 55 341
University total 758 133 1,561 66 32 4,461 409 2,154
BMCC 11 * 553 15 * 803 46 30
COCC 20 * 227 17 * 850 61 196
Chemeketa 101 31 1243 27 20 2046 144 322
Clackamas 235 33 591 46 * 2916 257 282
Clatsop * 12 68 * * 237 24 350
CGCC 15 * 171 * * 424 17 *
KCC 22 * 240 37 * 924 94 19
LCC 108 46 516 56 14 2182 240 1,657
LBCC 88 * 255 21 * 1588 127 898
MHCC 551 101 710 26 26 1781 202 321
OCCC * * 37 * * 126 * *
PCC 616 207 988 36 46 3366 519 912
RCC 28 17 436 27 13 1395 90 59
SOCC 12 * 98 23 * 493 39 225
TBCC * * 46 * * 215 * 16
TVCC 12 * 274 11 * 795 42 43
UCC 10 * 68 * * 295 * 262
Community college total
1,841 504 6,521 364 167 20,436 1,920 5,606
Grand Total 2,599 637 8,082 430 199 24,897 2,329 7,760 Note: In 2009-10, some community colleges had fewer than 10 students enrolled in accelerated learning programs. As a result, cell suppression rules would result in many other cells being suppressed to protect student confidentiality. Therefore, we show community college enrollment in accelerated learning beginning in 2010-11. Data current as of September 2019.

39
TableA.3.continued.
2018-19
Asian American
Black/ African American
Hispanic/ Latinx
Native American/ Alaska Native
Native Hawaiian/ Pacific Islander
White Two or more
Unknown
EOU 31 * 144 14 * 459 * 21
OIT 286 35 394 17 16 1,817 185 319
PSU 168 33 178 17 11 586 78 568
SOU 33 15 187 23 * 1,021 * 147
WOU 135 * 944 18 * 1,033 48 256
University total 653 107 1,847 89 44 4,916 329 1,311
BMCC 10 * 415 19 * 640 36 18
COCC 25 * 229 12 * 703 33 222
Chemeketa 64 32 1,021 25 13 1,771 153 334
Clackamas 223 41 585 35 18 2,780 259 208
Clatsop * * 52 * * 188 19 374
CGCC 13 * 210 * * 418 36 16
KCC 19 * 240 25 * 899 79 15
LCC 113 39 576 62 11 2,336 275 1,275
LBCC 75 21 189 * * 1,442 113 656
MHCC 457 89 598 21 22 1,331 169 285
OCCC * * 42 11 * 131 18 *
PCC 576 175 841 35 25 3,360 490 861
RCC 40 21 447 31 10 1,549 135 67
SOCC * * 80 * * 402 21 340
TBCC * * 65 * * 215 * *
TVCC 12 * 334 14 * 875 54 103
UCC 10 * 65 * * 290 * 318
Community college total
1637 418 5989 290 99 19330 1890 5092
Grand Total 2290 525 7836 379 143 24246 2219 6403 Note: In 2009-10, some community colleges had fewer than 10 students enrolled in accelerated learning programs. As a result, cell suppression rules would result in many other cells being suppressed to protect student confidentiality. Therefore, we show community college enrollment in accelerated learning beginning in 2010-11. Data current as of November 2019.

40
Appendix B. Accelerated learning credits of incoming freshmen at public universities Table B.1. Accelerated learning credits of 2017-18 Oregon high school graduates presented to, accepted by, and applied to general education
requirements by Oregon public universities, by institution, gender, and race/ethnicity, fall 2018.
Eastern Oregon University
Number of students
Number of credits presented
Number of credits accepted
Percent of credits presented that were accepted
Number of credits applied to general
education
Percent of credits accepted applied to
general educ.
Min. Max. Average Min. Max. Average Min. Max. Average
Race/ethnicity
Asian American * * * * * * * * * * * *
Black/African American
* * * * * * * * * * * *
Hispanic/Latinx 18 3.0 34.0 20.6 3.0 34.0 20.6 100.0% 0.0 31.0 13.4 65.2%
Multi-racial * * * * * * * * * * * *
Native American/ Alaska Native
* * * * * * * * * * * *
Native Hawaiian/ Pacific Islander
* * * * * * * * * * * *
Unknown * * * * * * * * * * * *
White 74 1.0 103.0 22.2 1.0 103.0 22.2 100.0% 0.0 72.0 12.9 58.2%
Gender
Female 73 1.0 103.0 23.0 1.0 103.0 23.0 100.0% 0.0 72.0 13.8 60.0%
Male * * * * * * * * * * * *
Not Reported * * * * * * * * * * * *
Total 102 1.0 103.0 21.8 1.0 103.0 21.8 100.0% 0.0 72.0 12.9 59.0%
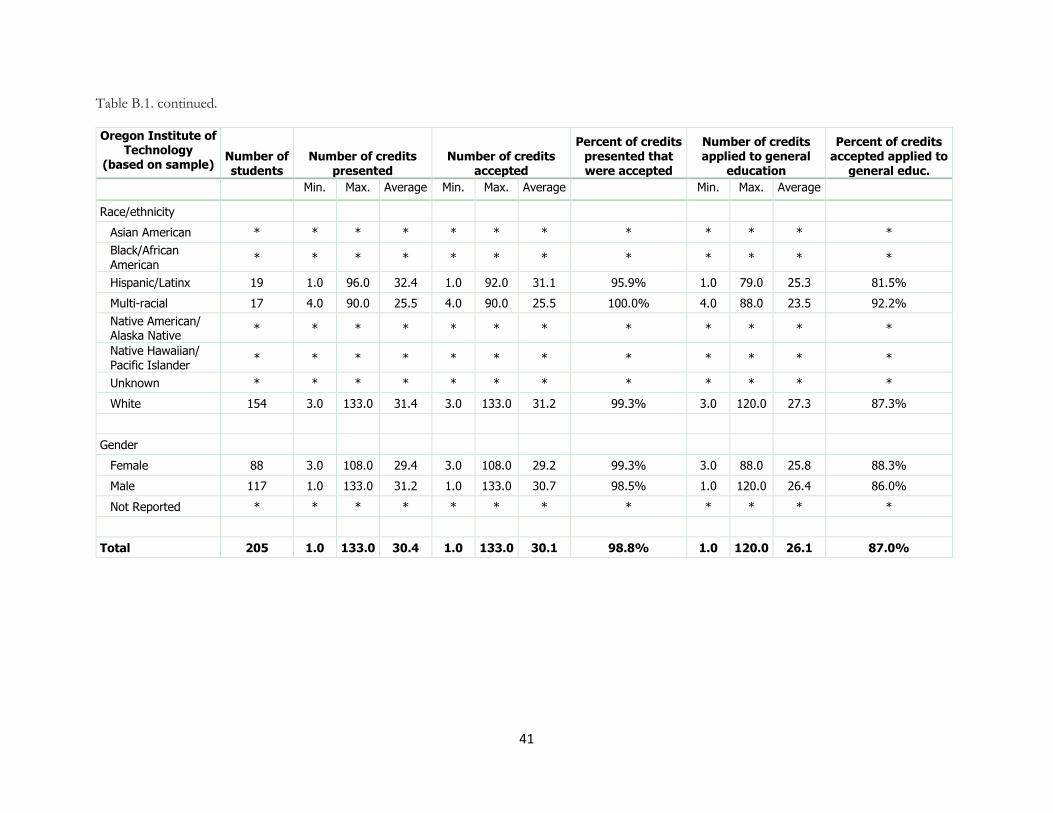
41
Table B.1. continued.
Oregon Institute of Technology
(based on sample) Number of students
Number of credits presented
Number of credits accepted
Percent of credits presented that were accepted
Number of credits applied to general
education
Percent of credits accepted applied to
general educ.
Min. Max. Average Min. Max. Average Min. Max. Average
Race/ethnicity
Asian American * * * * * * * * * * * *
Black/African
American * * * * * * * * * * * *
Hispanic/Latinx 19 1.0 96.0 32.4 1.0 92.0 31.1 95.9% 1.0 79.0 25.3 81.5%
Multi-racial 17 4.0 90.0 25.5 4.0 90.0 25.5 100.0% 4.0 88.0 23.5 92.2%
Native American/ Alaska Native
* * * * * * * * * * * *
Native Hawaiian/ Pacific Islander
* * * * * * * * * * * *
Unknown * * * * * * * * * * * *
White 154 3.0 133.0 31.4 3.0 133.0 31.2 99.3% 3.0 120.0 27.3 87.3%
Gender
Female 88 3.0 108.0 29.4 3.0 108.0 29.2 99.3% 3.0 88.0 25.8 88.3%
Male 117 1.0 133.0 31.2 1.0 133.0 30.7 98.5% 1.0 120.0 26.4 86.0%
Not Reported * * * * * * * * * * * *
Total 205 1.0 133.0 30.4 1.0 133.0 30.1 98.8% 1.0 120.0 26.1 87.0%

42
Table B.1. continued.
Oregon State University
Number of students
Number of credits presented
Number of credits accepted
Percent of credits presented that were accepted
Number of credits applied to general
education
Percent of credits accepted applied to
general educ.
Min. Max. Average Min. Max. Average Min. Max. Average
Race/ethnicity
Asian American 219 3.0 123.0 37.1 3.0 115.0 33.9 91.3% 0.0 63.0 20.1 59.4%
Black/African
American 15 4.0 81.0 26.3 4.0 81.0 24.2 91.9% 0.0 48.0 16.7 69.1%
Hispanic/Latinx 187 3.0 106.0 30.4 3.0 87.0 28.0 92.2% 0.0 60.0 15.6 55.6%
Multi-racial 153 3.0 124.0 37.3 3.0 108.0 33.7 90.5% 0.0 68.0 20.3 60.2%
Native American/ Alaska Native
* * * * * * * * * * * *
Native Hawaiian/ Pacific Islander
* * * * * * * * * * * *
Unknown * * * * * * * * * * * *
White 1325 3.0 139.0 34.2 3.0 127.0 31.6 92.5% 0.0 87.0 19.3 61.1%
Gender
Female 918 3.0 133.0 34.6 3.0 121.0 32.1 92.8% 0.0 79.0 19.2 59.9%
Male 998 3.0 139.0 34.3 3.0 127.0 31.4 91.5% 0.0 87.0 19.1 60.8%
Not Reported * * * * * * * * * * * *
Total 1,916 3.0 139.0 34.5 3.0 127.0 31.7 92.1% 0.0 87.0 19.2 60.4%

43
Table B.1. continued.
Portland State University
Number of students
Number of credits presented
Number of credits accepted
Percent of credits presented that were accepted
Number of credits applied to general
education
Percent of credits accepted applied to
general educ.
Min. Max. Average Min. Max. Average Min. Max. Average
Race/ethnicity
Asian American 127 1.0 102.0 27.7 1.0 102.0 27.7 100.0% 1.0 102.0 27.7 100.0%
Black/African
American 23 3.0 81.0 33.7 3.0 81.0 33.7 100.0% 3.0 81.0 33.7 100.0%
Hispanic/Latinx 184 1.0 73.0 23.5 1.0 73.0 23.5 100.0% 1.0 73.0 23.5 100.0%
Multi-racial 47 4.0 109.0 27.8 4.0 109.0 27.8 100.0% 4.0 109.0 27.8 100.0%
Native American/ Alaska Native
* * * * * * * * * * * *
Native Hawaiian/ Pacific Islander
* * * * * * * * * * * *
Unknown 35 4.0 95.0 28.7 4.0 95.0 28.7 100.0% 4.0 95.0 28.7 100.0%
White 309 3.0 166.0 34.9 3.0 166.0 34.9 100.0% 3.0 166.0 34.9 100.0%
Gender
Female 477 1.0 166.0 30.1 1.0 166.0 30.1 100.0% 1.0 166.0 30.1 100.0%
Male * * * * * * * * * * * *
Not Reported * * * * * * * * * * * *
Total 732 1.0 166.0 30.0 1.0 166.0 30.0 100.0% 1.0 166.0 30.0 100.0%

44
Table B.1. continued.
Southern Oregon University
Number of students
Number of credits presented
Number of credits accepted
Percent of credits presented that were accepted
Number of credits applied to general
education
Percent of credits accepted applied to
general educ.
Min. Max. Average Min. Max. Average Min. Max. Average
Race/ethnicity
Asian American * * * * * * * * * * * *
Black/African
American * * * * * * * * * * * *
Hispanic/Latinx 15 4.0 40.0 13.0 4.0 40.0 13.0 100.0% 4.0 35.0 10.9 83.6%
Multi-racial 16 4.0 32.0 14.3 4.0 32.0 14.3 100.0% 0.0 28.0 12.3 86.0%
Native American/ Alaska Native
* * * * * * * * * * * *
Native Hawaiian/ Pacific Islander
* * * * * * * * * * * *
Unknown * * * * * * * * * * * *
White 116 3.0 88.0 15.7 3.0 88.0 15.7 100.0% 0.0 80.0 13.9 89.0%
Gender
Female 98 3.0 88.0 16.1 3.0 88.0 16.1 100.0% 0.0 80.0 14.0 87.1%
Male * * * * * * * * * * * *
Not Reported * * * * * * * * * * * *
Total 157 3.0 88.0 15.5 3.0 88.0 15.5 100.0% 0.0 80.0 13.5 87.5%

45
Table B.1. continued.
University of Oregon
Number of students
Number of credits presented
Number of credits accepted
Percent of credits presented that were accepted
Number of credits applied to general
education
Percent of credits accepted applied to
general educ.
Min. Max. Average Min. Max. Average Min. Max. Average
Race/ethnicity
Asian American 143 4.0 122.0 33.8 0.0 122.0 33.3 98.6% 0.0 121.0 27.2 81.7%
Black/African
American 31 4.0 53.0 24.2 4.0 53.0 23.0 94.8% 0.0 35.0 16.7 72.6%
Hispanic/Latinx 215 3.0 124.0 26.3 3.0 124.0 25.9 98.3% 0.0 105.0 19.1 73.7%
Multi-racial 154 4.0 90.0 26.6 3.0 90.0 25.8 96.7% 0.0 72.0 20.2 78.6%
Native American/ Alaska Native
* * * * * * * * * * * *
Native Hawaiian/ Pacific Islander
* * * * * * * * * * * *
Unknown 40 4.0 83.0 27.8 4.0 79.0 26.7 96.0% 0.0 68.0 20.0 74.9%
White 895 1.0 123.0 28.3 0.0 123.0 27.7 97.9% 0.0 115.0 21.2 76.7%
Gender
Female 912 1.0 123.0 28.4 0.0 123.0 27.8 97.9% 0.0 115.0 21.3 76.8%
Male 577 2.0 124.0 28.0 0.0 124.0 27.3 97.7% 0.0 121.0 21.1 77.2%
Not Reported * * * * * * * * * * * *
Total 1,489 1.0 124.0 28.2 0.0 124.0 27.6 97.8% 0.0 121.0 21.2 77.0%

46
Table B.1. continued.
Western Oregon University
Number of students
Number of credits presented
Number of credits accepted
Percent of credits presented that were accepted
Number of credits applied to general
education
Percent of credits accepted applied to
general educ.
Min. Max. Average Min. Max. Average Min. Max. Average
Race/ethnicity
Asian American * * * * * * * * * * * *
Black/African
American * * * * * * * * * * * *
Hispanic/Latinx 84 3.0 90.0 23.2 3.0 86.0 23.1 99.4% 0.0 45.0 12.0 52.0%
Multi-racial 13 4.0 91.0 25.7 4.0 91.0 25.7 100.0% 0.0 74.0 14.8 57.8%
Native American/ Alaska Native
* * * * * * * * * * * *
Native Hawaiian/ Pacific Islander
* * * * * * * * * * * *
Unknown * * * * * * * * * * * *
White 176 3.0 92.0 22.5 3.0 92.0 22.5 99.8% 0.0 59.0 11.5 51.3%
Gender
Female 207 3.0 92.0 24.1 3.0 92.0 24.0 99.6% 0.0 59.0 12.2 51.1%
Male * * * * * * * * * * * *
Not Reported * * * * * * * * * * * *
Total 293 3.0 92.0 23.4 3.0 92.0 23.3 99.7% 0.0 74.0 12.1 52.0%

47
Appendix C. Accelerated learning credits presented to Oregon public universities by high school. Table C.1. Accelerated learning credits presented to, accepted by, and applied to general education
requirements at Oregon public universities, by high school of incoming student, fall 2018.
High school
College entrance
exam code STATE
Number of
students
Sum of total
credits presented
Sum of total
credits accepted
Sum of total credits
applied to general educ.
Academy for Character Education 380224 Oregon * * * *
Academy of Arts and Academics 381114 Oregon * * * *
Academy of International Studies at Woodburn
381287 Oregon * * * *
Adrian C Wilcox High School 053276 California * * * *
Alliance Charter Academy 380779 Oregon * * * *
Alliance High School at Benson 380922 Oregon * * * *
Aloha High School 380073 Oregon 56 1868 1799 1382
Alsea Charter School 380010 Oregon * * * *
Amity High School 380015 Oregon * * * *
Aptos High School 050119 California * * * *
Armijo High School 050910 California * * * *
Arts and Communication Magnet Academy
380081 Oregon * * * *
Ashland High School 380025 Oregon 43 1040 1009.5 821
Astoria Senior High School 380028 Oregon 16 486 481 366
Baker Early College 380061 Oregon 19 1492 1400 1118
Baker High School 380053 Oregon 12 417 396 316
Bandon Senior High School 380065 Oregon * * * *
Banks High School 380070 Oregon * * * *
Beaverton High School 380075 Oregon 89 2282 2213 1607
Bend Senior High School 380085 Oregon 23 411 399 253
Benson Polytechnic High School 380840 Oregon 25 355 305 244
Blanchet Catholic School 381016 Oregon 10 106 106 76
Boise High School 130042 Idaho * * * *
Bonanza High School 380105 Oregon * * * *
Brighton Academy 380427 Oregon * * * *
Brookings-Harbor High School 380110 Oregon * * * *
Burns High School 380120 Oregon * * * *
Camas Senior High School 480140 Washington * * * *
Camas Valley School 380130 Oregon * * * *
Canadian Academy 680160 Inter-
national * * * *
Canby High School 380135 Oregon 27 1028 989 618
Casa Grande High School 052448 California * * * *

48
Cascade Christian High School 380647 Oregon 11 216 200 171
Cascade Senior High School 381180 Oregon 11 267 252 150
Catalina Foothills High School 030476 Arizona * * * *
Centennial High School 380848 Oregon 46 1726 1705 1439
Center School 481060 Washington * * * *
Central Catholic High School 380850 Oregon 53 1358 1202 886
Central Christian High School 380966 Oregon * * * *
Central High School 380505 Oregon 32 826 789 371
Central Linn High School 380440 Oregon * * * *
Century High School 380482 Oregon 38 675 629 463
Cherry Creek High School 060515 Colorado * * * *
Chiloquin High School 380165 Oregon * * * *
Churchill High School 380323 Oregon 44 1284 1265 911
Clackamas Academy of Industrial Sciences
380789 Oregon * * * *
Clackamas High School 380673 Oregon 101 2575 2510 1698
Clackamas Middle College 380786 Oregon 18 1604 1596 1338
Clackamas Web Academy 380780 Oregon * * * *
Clatskanie Middle/High School 380170 Oregon * * * *
Cleveland High School 380855 Oregon 33 853.5 819.5 643
Colony High School 052384 California * * * *
Colton High School 380185 Oregon * * * *
Coquille Junior Senior High 380200 Oregon * * * *
Corbett High School 380205 Oregon 18 754 702 521
Coronado High School 050680 California * * * *
Corvallis High School 380210 Oregon 62 2541 2451 1774
Cottage Grove High School 380215 Oregon 28 1169 1120 753
Country Christian School 380687 Oregon * * * *
Cove Charter School 380220 Oregon * * * *
Crane Union High School 380225 Oregon * * * *
Crater Academy of Health and Public Services
380154 Oregon * * * *
Crater Renaissance Academy 380152 Oregon * * * *
Crater School of Business Innovation and Science
380153 Oregon * * * *
Crescent Valley High School 380211 Oregon 48 2044 1905 1484
Creswell High School 380228 Oregon 10 461 443 253
Crook County High School 380955 Oregon * * * *
Crow Middle/High School 380325 Oregon * * * *
Culver High School 380240 Oregon * * * *
Dallas High School 380245 Oregon 11 246 242 128
Dalles Wahtonka High School 381155 Oregon 21 374 361 272
Damien High School 052502 California * * * *
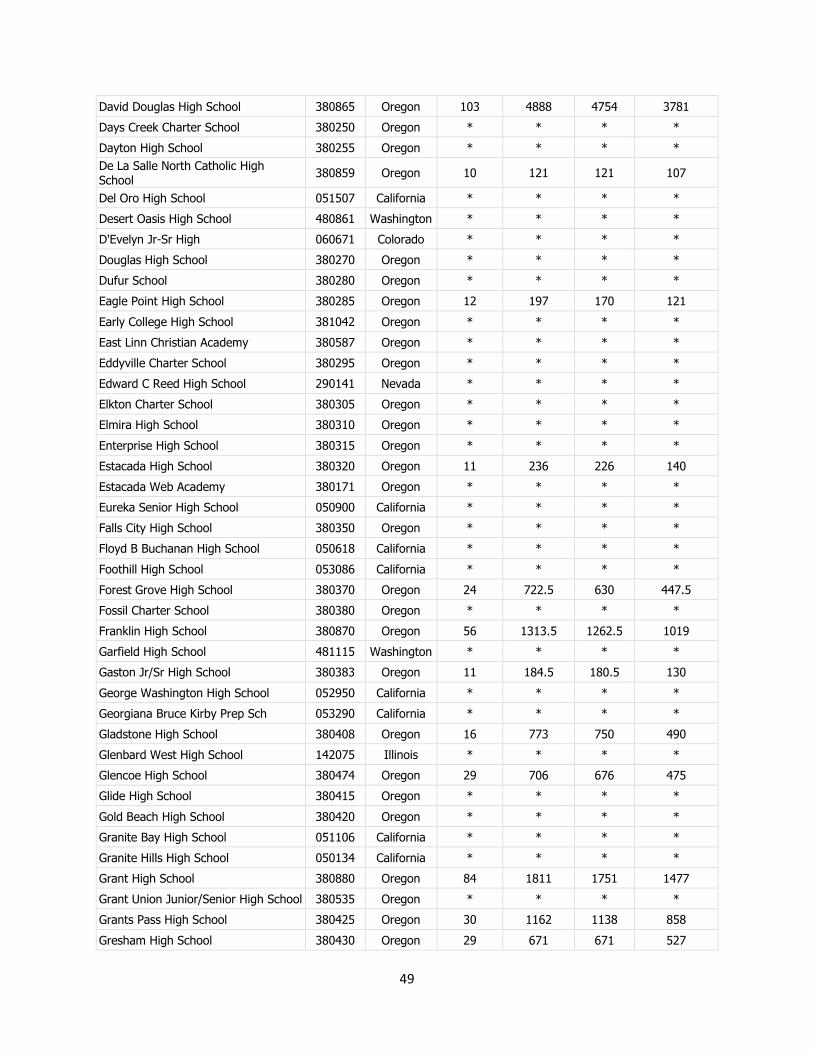
49
David Douglas High School 380865 Oregon 103 4888 4754 3781
Days Creek Charter School 380250 Oregon * * * *
Dayton High School 380255 Oregon * * * *
De La Salle North Catholic High School
380859 Oregon 10 121 121 107
Del Oro High School 051507 California * * * *
Desert Oasis High School 480861 Washington * * * *
D'Evelyn Jr-Sr High 060671 Colorado * * * *
Douglas High School 380270 Oregon * * * *
Dufur School 380280 Oregon * * * *
Eagle Point High School 380285 Oregon 12 197 170 121
Early College High School 381042 Oregon * * * *
East Linn Christian Academy 380587 Oregon * * * *
Eddyville Charter School 380295 Oregon * * * *
Edward C Reed High School 290141 Nevada * * * *
Elkton Charter School 380305 Oregon * * * *
Elmira High School 380310 Oregon * * * *
Enterprise High School 380315 Oregon * * * *
Estacada High School 380320 Oregon 11 236 226 140
Estacada Web Academy 380171 Oregon * * * *
Eureka Senior High School 050900 California * * * *
Falls City High School 380350 Oregon * * * *
Floyd B Buchanan High School 050618 California * * * *
Foothill High School 053086 California * * * *
Forest Grove High School 380370 Oregon 24 722.5 630 447.5
Fossil Charter School 380380 Oregon * * * *
Franklin High School 380870 Oregon 56 1313.5 1262.5 1019
Garfield High School 481115 Washington * * * *
Gaston Jr/Sr High School 380383 Oregon 11 184.5 180.5 130
George Washington High School 052950 California * * * *
Georgiana Bruce Kirby Prep Sch 053290 California * * * *
Gladstone High School 380408 Oregon 16 773 750 490
Glenbard West High School 142075 Illinois * * * *
Glencoe High School 380474 Oregon 29 706 676 475
Glide High School 380415 Oregon * * * *
Gold Beach High School 380420 Oregon * * * *
Granite Bay High School 051106 California * * * *
Granite Hills High School 050134 California * * * *
Grant High School 380880 Oregon 84 1811 1751 1477
Grant Union Junior/Senior High School 380535 Oregon * * * *
Grants Pass High School 380425 Oregon 30 1162 1138 858
Gresham High School 380430 Oregon 29 671 671 527

50
Gresham-Barlow Web Academy Public Charter School
380437 Oregon 10 868 860 749
Half Moon Bay High School 051120 California * * * *
Harrisburg High School 380450 Oregon * * * *
Health and Science School 380104 Oregon 15 494 492.5 357
Henley High School 380555 Oregon 19 693 654 413
Heppner Junior/Senior High School 380460 Oregon * * * *
Heritage High School 481492 Washington * * * *
Hermiston High School 380470 Oregon 26 812 774 451
Hidden Valley High School 380723 Oregon 15 477 425 301
Highland School 472311 Virginia * * * *
Hillsboro High School 380475 Oregon 38 700 692 594
Hillsboro Online Academy 380487 Oregon * * * *
Holy Family Catholic High School 242548 Minnesota * * * *
Home-Schooled in Oregon 99999A Oregon * * * *
Hood River Valley High School 380480 Oregon 48 912.5 858.5 599.5
Horizon Christian High School 381181 Oregon * * * *
Hosanna Christian School 380557 Oregon * * * *
Illinois Valley High School 380150 Oregon * * * *
Imbler Charter School 380500 Oregon * * * *
International School of Beaverton 380049 Oregon 32 919 883 683
Ione High School 380510 Oregon * * * *
Irrigon Junior Senior High School 380520 Oregon * * * *
James Campbell High School 120003 Hawaii * * * *
Jefferson High School 380525 Oregon 20 788 700 468.5
Jesuit High School 380897 Oregon 48 846 745 519
John F Kennedy High School 380713 Oregon * * * *
Joseph Charter School 380545 Oregon * * * *
Junction City High School 380550 Oregon 24 307 297 112
Kailua High School 120185 Hawaii * * * *
Kaiser High School 050942 California * * * *
Kamehameha School - Hawaii 120169 Hawaii * * * *
Kamehameha School - Kapalama 120055 Hawaii * * * *
Kapaa High School 120160 Hawaii * * * *
King Kekaulike High School 120218 Hawaii * * * *
Kings Valley Charter School 380822 Oregon * * * *
Klamath Union High School 380560 Oregon 14 595 579 432
Knappa High School 380030 Oregon * * * *
La Grande High School 380570 Oregon 28 591 580 303
La Salle Catholic College Preparatory 380678 Oregon 16 629 581 360
Lake Oswego Senior High School 380795 Oregon 57 1280 1188 799
Lakeridge High School 380573 Oregon 46 1451 1325 955
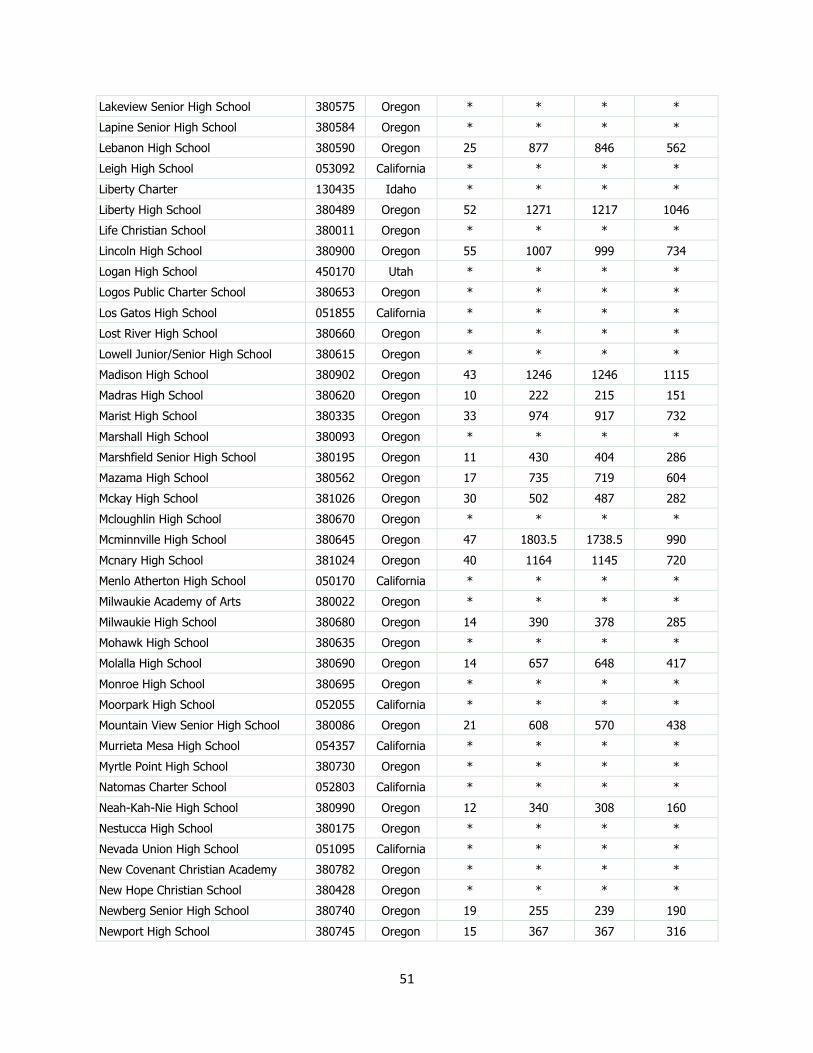
51
Lakeview Senior High School 380575 Oregon * * * *
Lapine Senior High School 380584 Oregon * * * *
Lebanon High School 380590 Oregon 25 877 846 562
Leigh High School 053092 California * * * *
Liberty Charter 130435 Idaho * * * *
Liberty High School 380489 Oregon 52 1271 1217 1046
Life Christian School 380011 Oregon * * * *
Lincoln High School 380900 Oregon 55 1007 999 734
Logan High School 450170 Utah * * * *
Logos Public Charter School 380653 Oregon * * * *
Los Gatos High School 051855 California * * * *
Lost River High School 380660 Oregon * * * *
Lowell Junior/Senior High School 380615 Oregon * * * *
Madison High School 380902 Oregon 43 1246 1246 1115
Madras High School 380620 Oregon 10 222 215 151
Marist High School 380335 Oregon 33 974 917 732
Marshall High School 380093 Oregon * * * *
Marshfield Senior High School 380195 Oregon 11 430 404 286
Mazama High School 380562 Oregon 17 735 719 604
Mckay High School 381026 Oregon 30 502 487 282
Mcloughlin High School 380670 Oregon * * * *
Mcminnville High School 380645 Oregon 47 1803.5 1738.5 990
Mcnary High School 381024 Oregon 40 1164 1145 720
Menlo Atherton High School 050170 California * * * *
Milwaukie Academy of Arts 380022 Oregon * * * *
Milwaukie High School 380680 Oregon 14 390 378 285
Mohawk High School 380635 Oregon * * * *
Molalla High School 380690 Oregon 14 657 648 417
Monroe High School 380695 Oregon * * * *
Moorpark High School 052055 California * * * *
Mountain View Senior High School 380086 Oregon 21 608 570 438
Murrieta Mesa High School 054357 California * * * *
Myrtle Point High School 380730 Oregon * * * *
Natomas Charter School 052803 California * * * *
Neah-Kah-Nie High School 380990 Oregon 12 340 308 160
Nestucca High School 380175 Oregon * * * *
Nevada Union High School 051095 California * * * *
New Covenant Christian Academy 380782 Oregon * * * *
New Hope Christian School 380428 Oregon * * * *
Newberg Senior High School 380740 Oregon 19 255 239 190
Newport High School 380745 Oregon 15 367 367 316
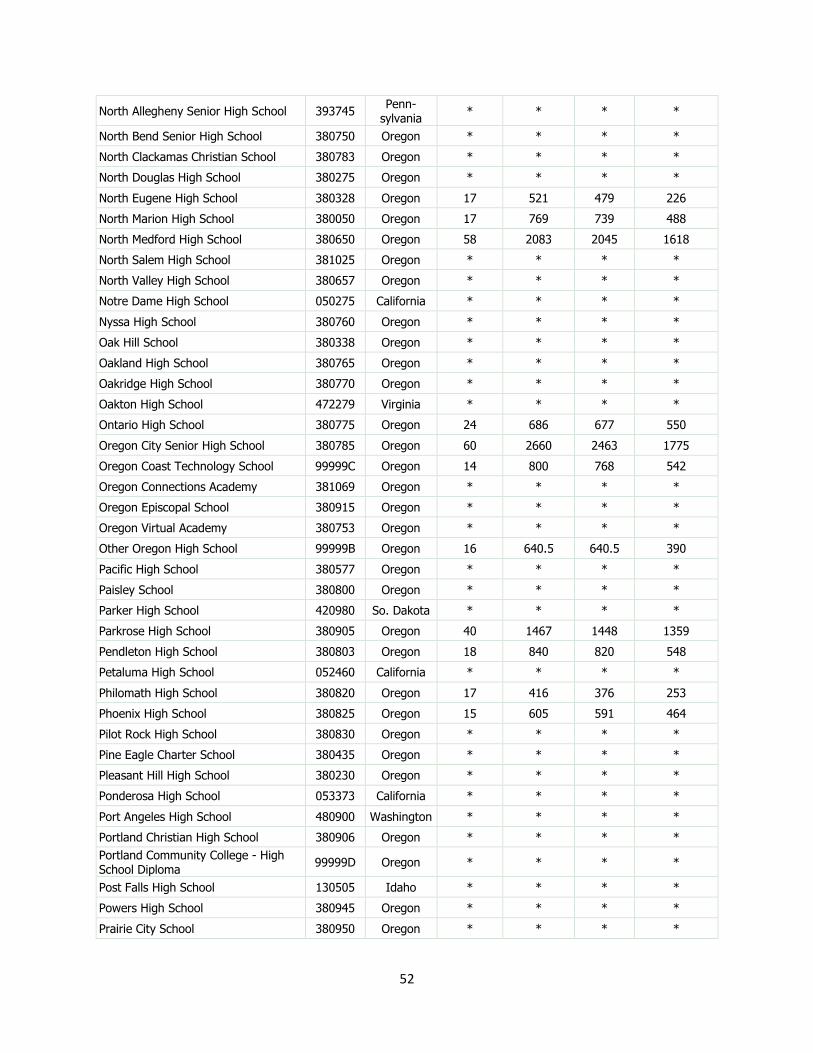
52
North Allegheny Senior High School 393745 Penn-
sylvania * * * *
North Bend Senior High School 380750 Oregon * * * *
North Clackamas Christian School 380783 Oregon * * * *
North Douglas High School 380275 Oregon * * * *
North Eugene High School 380328 Oregon 17 521 479 226
North Marion High School 380050 Oregon 17 769 739 488
North Medford High School 380650 Oregon 58 2083 2045 1618
North Salem High School 381025 Oregon * * * *
North Valley High School 380657 Oregon * * * *
Notre Dame High School 050275 California * * * *
Nyssa High School 380760 Oregon * * * *
Oak Hill School 380338 Oregon * * * *
Oakland High School 380765 Oregon * * * *
Oakridge High School 380770 Oregon * * * *
Oakton High School 472279 Virginia * * * *
Ontario High School 380775 Oregon 24 686 677 550
Oregon City Senior High School 380785 Oregon 60 2660 2463 1775
Oregon Coast Technology School 99999C Oregon 14 800 768 542
Oregon Connections Academy 381069 Oregon * * * *
Oregon Episcopal School 380915 Oregon * * * *
Oregon Virtual Academy 380753 Oregon * * * *
Other Oregon High School 99999B Oregon 16 640.5 640.5 390
Pacific High School 380577 Oregon * * * *
Paisley School 380800 Oregon * * * *
Parker High School 420980 So. Dakota * * * *
Parkrose High School 380905 Oregon 40 1467 1448 1359
Pendleton High School 380803 Oregon 18 840 820 548
Petaluma High School 052460 California * * * *
Philomath High School 380820 Oregon 17 416 376 253
Phoenix High School 380825 Oregon 15 605 591 464
Pilot Rock High School 380830 Oregon * * * *
Pine Eagle Charter School 380435 Oregon * * * *
Pleasant Hill High School 380230 Oregon * * * *
Ponderosa High School 053373 California * * * *
Port Angeles High School 480900 Washington * * * *
Portland Christian High School 380906 Oregon * * * *
Portland Community College - High School Diploma
99999D Oregon * * * *
Post Falls High School 130505 Idaho * * * *
Powers High School 380945 Oregon * * * *
Prairie City School 380950 Oregon * * * *

53
Prospect Charter School 380960 Oregon * * * *
Putnam High School 380681 Oregon 20 504 501 338
Rainier Jr/Sr High School 380965 Oregon * * * *
Raisbeck Aviation High School 481071 Washington * * * *
Redmond High School 380970 Oregon 15 306 299 226
Redmond Proficiency Academy 380973 Oregon * * * *
Redondo Union High School 052600 California * * * *
Reedsport Community Charter School 380975 Oregon * * * *
Regis High School 381125 Oregon * * * *
Reno High School 290145 Nevada * * * *
Reynolds High School 381178 Oregon 54 1628 1550 1314
Ridgeview High School 380972 Oregon 17 708 664 521
Riverdale High School 380917 Oregon * * * *
Riverside High School 380208 Oregon * * * *
Riverside Junior/Senior High School 380100 Oregon * * * *
Roaring Fork High School 060210 Colorado * * * *
Rocky Mountain High School 130399 Idaho * * * *
Rogue River Junior/Senior High 380995 Oregon * * * *
Roosevelt High School 380910 Oregon 32 858.5 843.5 842.5
Roseburg High School 381000 Oregon 21 761.5 738 504
Saint Helena High School 052740 California * * * *
Saint Mary's Academy 380920 Oregon 27 368 368 305
Saint Mary's School 380655 Oregon 11 364 364 300
Salem Academy 381031 Oregon * * * *
Sam Barlow High School 380432 Oregon 46 2275 2123 1574
San Marin High School 052172 California * * * *
Sandy High School 381055 Oregon 17 599 574 315
Santa Fe High School 053300 California * * * *
Santiam Christian High School 380214 Oregon 19 474 457 341
Santiam Junior/Senior High School 380665 Oregon * * * *
Scappoose High School 381060 Oregon 12 200 183 107
School of Science & Technology 380095 Oregon 10 232 224 109
Scio High School 381065 Oregon 10 287.5 287.5 148.5
Seaside High School 381070 Oregon * * * *
Selah High School 481180 Washington * * * *
Sentinel High School 051745 California * * * *
Shasta High School 052585 California * * * *
Sheldon High School 380326 Oregon 80 3620 3436 1809
Sheridan High School 381080 Oregon * * * *
Sherman County School 380705 Oregon * * * *
Sherwood High School 381085 Oregon 77 2972 2646.5 1854

54
Siletz Valley Early College Academy 381092 Oregon * * * *
Silverton High School 381095 Oregon 26 917 879 462
Sisters High School 381100 Oregon * * * *
Siuslaw High School 380365 Oregon 15 511 468 292
Skyline High School 380035 Oregon * * * *
South Albany High School 380003 Oregon 26 723 699 499
South Anchorage High School 020365 Alaska * * * *
South Eugene High School 380330 Oregon 82 2505 2447 1612
South Medford High School 380656 Oregon 41 1035 999 906
South Salem High School 381040 Oregon 42 1080.5 1076.5 842.5
South Umpqua High School 380725 Oregon * * * *
South Wasco County High School 380640 Oregon * * * *
Southridge High School 380079 Oregon 90 2635 2554 1952
Southwest Christian School 381159 Oregon * * * *
Sprague High School 381043 Oregon 51 1514 1452 986
Springfield High School 381110 Oregon 22 902 890 588
Springwater Trail High School 380436 Oregon * * * *
St Helens High School 381015 Oregon * * * *
St Paul High School 381020 Oregon * * * *
Stanfield Secondary School 381115 Oregon * * * *
Stayton High School 381120 Oregon * * * *
Summit High School 380096 Oregon 71 1322.5 1239.5 984
Summit Learning Charter 380319 Oregon 17 1652 1632 1374
Sunset High School 380082 Oregon 93 2174 2130 1563
Sutherlin High School 381130 Oregon 10 231 231 134
Sweet Home High School 381135 Oregon 10 299 265 191
Taft High School 381140 Oregon * * * *
Technology High School 053849 California * * * *
Temecula Valley High 053499 California * * * *
The Northwest Academy 380912 Oregon * * * *
Thompson Valley High School 060952 Colorado * * * *
Thurston High School 381112 Oregon 30 805 754 491
Tigard High School 381160 Oregon 79 2020 1994 1511
Tillamook High School 381172 Oregon 15 373 359 277
Timberline High School 480572 Washington * * * *
Toledo Senior High School 381175 Oregon * * * *
Triad High School 380567 Oregon * * * *
Trinity Lutheran High School 380099 Oregon * * * *
Tualatin High School 381163 Oregon 84 2056 1994 1526
Tulare Union High School 053550 California * * * *
Umatilla High School 381195 Oregon * * * *
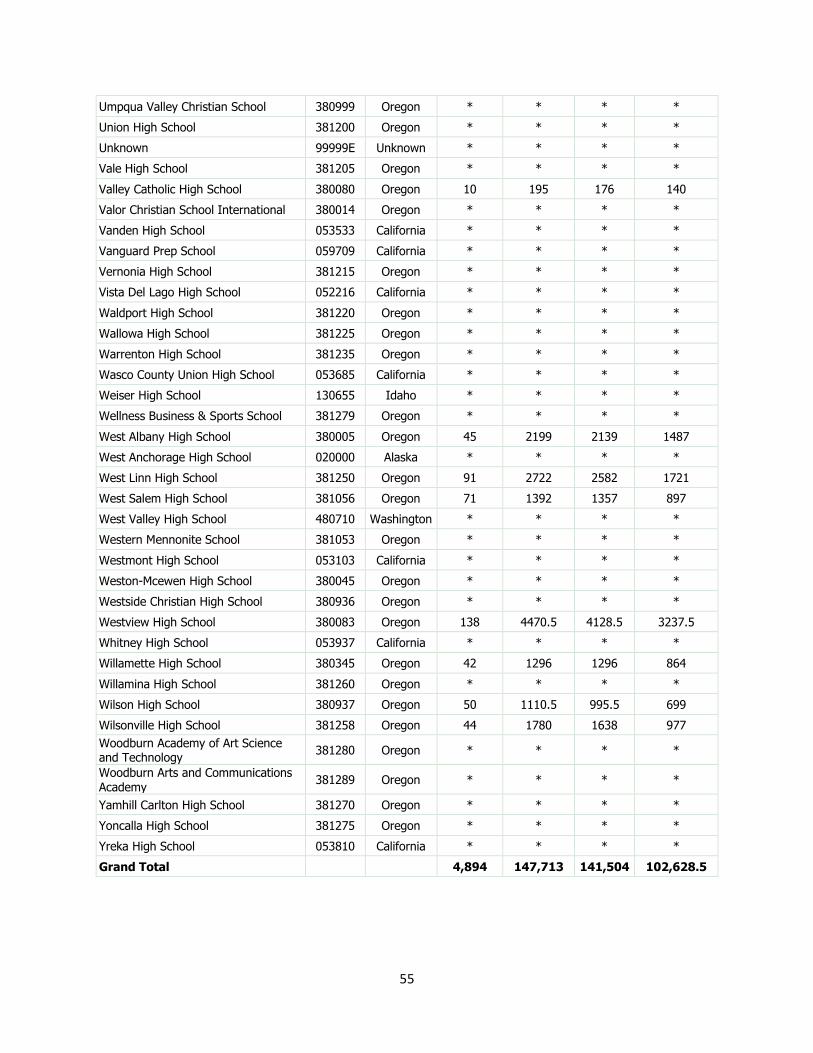
55
Umpqua Valley Christian School 380999 Oregon * * * *
Union High School 381200 Oregon * * * *
Unknown 99999E Unknown * * * *
Vale High School 381205 Oregon * * * *
Valley Catholic High School 380080 Oregon 10 195 176 140
Valor Christian School International 380014 Oregon * * * *
Vanden High School 053533 California * * * *
Vanguard Prep School 059709 California * * * *
Vernonia High School 381215 Oregon * * * *
Vista Del Lago High School 052216 California * * * *
Waldport High School 381220 Oregon * * * *
Wallowa High School 381225 Oregon * * * *
Warrenton High School 381235 Oregon * * * *
Wasco County Union High School 053685 California * * * *
Weiser High School 130655 Idaho * * * *
Wellness Business & Sports School 381279 Oregon * * * *
West Albany High School 380005 Oregon 45 2199 2139 1487
West Anchorage High School 020000 Alaska * * * *
West Linn High School 381250 Oregon 91 2722 2582 1721
West Salem High School 381056 Oregon 71 1392 1357 897
West Valley High School 480710 Washington * * * *
Western Mennonite School 381053 Oregon * * * *
Westmont High School 053103 California * * * *
Weston-Mcewen High School 380045 Oregon * * * *
Westside Christian High School 380936 Oregon * * * *
Westview High School 380083 Oregon 138 4470.5 4128.5 3237.5
Whitney High School 053937 California * * * *
Willamette High School 380345 Oregon 42 1296 1296 864
Willamina High School 381260 Oregon * * * *
Wilson High School 380937 Oregon 50 1110.5 995.5 699
Wilsonville High School 381258 Oregon 44 1780 1638 977
Woodburn Academy of Art Science and Technology
381280 Oregon * * * *
Woodburn Arts and Communications Academy
381289 Oregon * * * *
Yamhill Carlton High School 381270 Oregon * * * *
Yoncalla High School 381275 Oregon * * * *
Yreka High School 053810 California * * * *
Grand Total 4,894 147,713 141,504 102,628.5
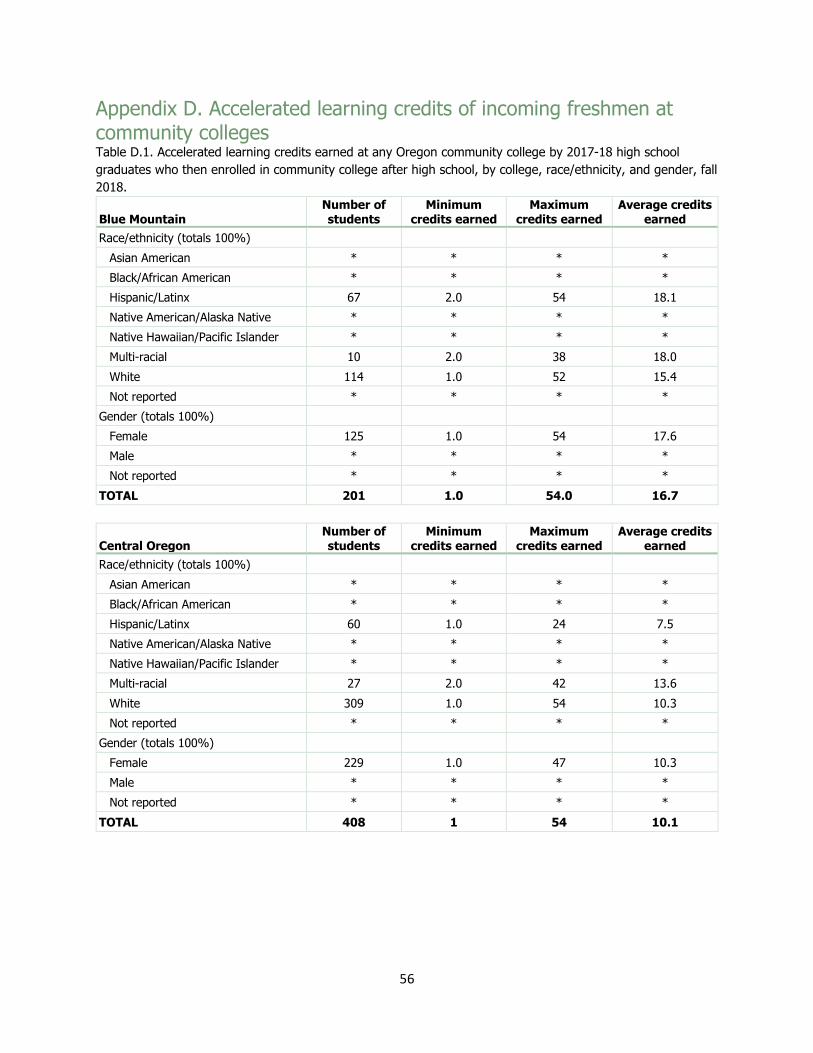
56
Appendix D. Accelerated learning credits of incoming freshmen at community colleges Table D.1. Accelerated learning credits earned at any Oregon community college by 2017-18 high school
graduates who then enrolled in community college after high school, by college, race/ethnicity, and gender, fall
2018.
Blue Mountain Number of students
Minimum credits earned
Maximum credits earned
Average credits earned
Race/ethnicity (totals 100%)
Asian American * * * *
Black/African American * * * *
Hispanic/Latinx 67 2.0 54 18.1
Native American/Alaska Native * * * *
Native Hawaiian/Pacific Islander * * * *
Multi-racial 10 2.0 38 18.0
White 114 1.0 52 15.4
Not reported * * * *
Gender (totals 100%)
Female 125 1.0 54 17.6
Male * * * *
Not reported * * * *
TOTAL 201 1.0 54.0 16.7
Central Oregon Number of students
Minimum credits earned
Maximum credits earned
Average credits earned
Race/ethnicity (totals 100%)
Asian American * * * *
Black/African American * * * *
Hispanic/Latinx 60 1.0 24 7.5
Native American/Alaska Native * * * *
Native Hawaiian/Pacific Islander * * * *
Multi-racial 27 2.0 42 13.6
White 309 1.0 54 10.3
Not reported * * * *
Gender (totals 100%)
Female 229 1.0 47 10.3
Male * * * *
Not reported * * * *
TOTAL 408 1 54 10.1
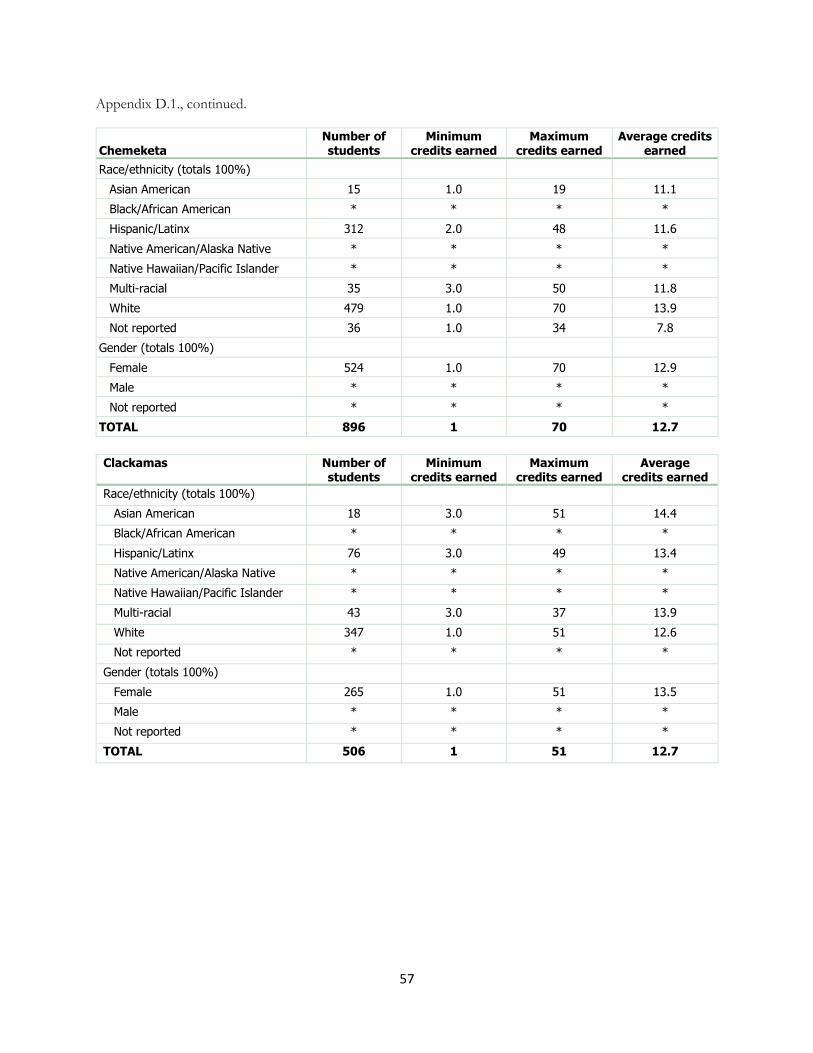
57
Appendix D.1., continued.
Chemeketa Number of students
Minimum credits earned
Maximum credits earned
Average credits earned
Race/ethnicity (totals 100%)
Asian American 15 1.0 19 11.1
Black/African American * * * *
Hispanic/Latinx 312 2.0 48 11.6
Native American/Alaska Native * * * *
Native Hawaiian/Pacific Islander * * * *
Multi-racial 35 3.0 50 11.8
White 479 1.0 70 13.9
Not reported 36 1.0 34 7.8
Gender (totals 100%)
Female 524 1.0 70 12.9
Male * * * *
Not reported * * * *
TOTAL 896 1 70 12.7
Clackamas Number of students
Minimum credits earned
Maximum credits earned
Average credits earned
Race/ethnicity (totals 100%)
Asian American 18 3.0 51 14.4
Black/African American * * * *
Hispanic/Latinx 76 3.0 49 13.4
Native American/Alaska Native * * * *
Native Hawaiian/Pacific Islander * * * *
Multi-racial 43 3.0 37 13.9
White 347 1.0 51 12.6
Not reported * * * *
Gender (totals 100%)
Female 265 1.0 51 13.5
Male * * * *
Not reported * * * *
TOTAL 506 1 51 12.7

58
Appendix D.1., continued.
Clatsop Number of students
Minimum credits earned
Maximum credits earned
Average credits earned
Race/ethnicity (totals 100%)
Asian American * * * *
Black/African American * * * *
Hispanic/Latinx 12 1.0 22 5.8
Native American/Alaska Native * * * *
Native Hawaiian/Pacific Islander * * * *
Multi-racial * * * *
White 39 1.0 25 10.7
Not reported * * * *
Gender (totals 100%)
Female 36 1.0 24 8.7
Male * * * *
Not reported * * * *
TOTAL 60 1 25 8.7
Columbia Gorge Number of students
Minimum credits earned
Maximum credits earned
Average credits earned
Race/ethnicity (totals 100%)
Asian American * * * *
Black/African American * * * *
Hispanic/Latinx 27 4.0 27 8.9
Native American/Alaska Native * * * *
Native Hawaiian/Pacific Islander * * * *
Multi-racial * * * *
White 28 3.0 20 7.2
Not reported * * * *
Gender (totals 100%)
Female 44 3.0 27 8.6
Male * * * *
Not reported * * * *
TOTAL 57 3 27 8.2

59
Appendix D.1., continued.
Klamath Number of students
Minimum credits earned
Maximum credits earned
Average credits earned
Race/ethnicity (totals 100%)
Asian American
Black/African American * * * *
Hispanic/Latinx 29 3.0 29 9.5
Native American/Alaska Native * * * *
Native Hawaiian/Pacific Islander * * * *
Multi-racial * * * *
White 56 1.0 46 12.0
Not reported
Gender (totals 100%)
Female 56 3.0 46 12.3
Male 38 1.0 39 10.3
Not reported
TOTAL 94 1 46 11.5
Lane Number of students
Minimum credits earned
Maximum credits earned
Average credits earned
Race/ethnicity (totals 100%)
Asian American 15 3.0 50 16.5
Black/African American * * * *
Hispanic/Latinx 129 2.0 42 12.4
Native American/Alaska Native * * * *
Native Hawaiian/Pacific Islander * * * *
Multi-racial 41 3.0 45 13.2
White 451 1.0 60 14.2
Not reported * * * *
Gender (totals 100%)
Female 376 1.0 54 13.5
Male * * * *
Not reported * * * *
TOTAL 666 1 60 13.7

60
Appendix D.1., continued.
Linn-Benton Number of students
Minimum credits earned
Maximum credits earned
Average credits earned
Race/ethnicity (totals 100%)
Asian American 17 3.0 87 14.3
Black/African American * * * *
Hispanic/Latinx 110 1.0 61 12.3
Native American/Alaska Native * * * *
Native Hawaiian/Pacific Islander * * * *
Multi-racial 46 1.0 41 11.8
White 532 1.0 64 13.7
Not reported 62 1.0 57 16.0
Gender (totals 100%)
Female 422 1.0 57 13.4
Male * * * *
Not reported * * * *
TOTAL 782 1 87 13.6
Mt. Hood Number of students
Minimum credits earned
Maximum credits earned
Average credits earned
Race/ethnicity (totals 100%)
Asian American * * * *
Black/African American * * * *
Hispanic/Latinx 18 3.0 70 13.7
Native American/Alaska Native * * * *
Native Hawaiian/Pacific Islander * * * *
Multi-racial * * * *
White 32 1.0 38 13.8
Not reported * * * *
Gender (totals 100%)
Female * * * *
Male 36 1.0 38 12.3
Not reported * * * *
TOTAL 62 1 70 14.5

61
Appendix D.1., continued.
Oregon Coast Number of students
Minimum credits earned
Maximum credits earned
Average credits earned
Race/ethnicity (totals 100%)
Asian American * * * *
Black/African American * * * *
Hispanic/Latinx 10 3.0 18 7.5
Native American/Alaska Native * * * *
Native Hawaiian/Pacific Islander * * * *
Multi-racial * * * *
White 18 3.0 21 9.2
Not reported * * * *
Gender (totals 100%)
Female 23 3.0 21 8.0
Male * * * *
Not reported * * * *
TOTAL 33 3 21 8.1
Portland Number of students
Minimum credits earned
Maximum credits earned
Average credits earned
Race/ethnicity (totals 100%)
Asian American 100 1.0 59 9.6
Black/African American 48 1.0 18 6.4
Hispanic/Latinx 266 1.0 55 7.9
Native American/Alaska Native 13 1.0 12 4.9
Native Hawaiian/Pacific Islander 13 1.0 22 7.8
Multi-racial 125 1.0 54 8.9
White 622 1.0 57 9.2
Not reported 56 1.0 45 7.1
Gender (totals 100%)
Female 685 1.0 57 8.6
Male 537 1.0 59 8.9
Not reported 21 1.0 14 5.2
TOTAL 1243 1 59 8.7

62
Appendix D.1., continued.
Rogue Number of students
Minimum credits earned
Maximum credits earned
Average credits earned
Race/ethnicity (totals 100%)
Asian American * * * *
Black/African American * * * *
Hispanic/Latinx 71 1.0 22 7.4
Native American/Alaska Native * * * *
Native Hawaiian/Pacific Islander * * * *
Multi-racial 18 2.0 23 6.8
White 228 1.0 42 9.5
Not reported * * * *
Gender (totals 100%)
Female 201 1.0 42 9.3
Male * * * *
Not reported * * * *
TOTAL 336 1 42 8.9
Southwestern Number of students
Minimum credits earned
Maximum credits earned
Average credits earned
Race/ethnicity (totals 100%)
Asian American * * * *
Black/African American 2 7.0 17 12.0
Hispanic/Latinx 26 2.0 51 16.1
Native American/Alaska Native * * * *
Native Hawaiian/Pacific Islander * * * *
Multi-racial 16 2.0 53 19.4
White 119 1.0 54 17.5
Not reported * * * *
Gender (totals 100%)
Female 106 1.0 54 17.8
Male * * * *
Not reported * * * *
TOTAL 175 1 54 17.2

63
Appendix D.1., continued.
Tillamook Bay Number of students
Minimum credits earned
Maximum credits earned
Average credits earned
Race/ethnicity (totals 100%)
Asian American * * * *
Black/African American * * * *
Hispanic/Latinx * * * *
Native American/Alaska Native * * * *
Native Hawaiian/Pacific Islander * * * *
Multi-racial * * * *
White 17 4.0 25 11.9
Not reported * * * *
Gender (totals 100%)
Female 13 3.0 25 12.4
Male * * * *
Not reported * * * *
TOTAL 26 3 25 12.1
Treasure Valley Number of students
Minimum credits earned
Maximum credits earned
Average credits earned
Race/ethnicity (totals 100%)
Asian American * * * *
Black/African American * * * *
Hispanic/Latinx 26 2.0 38 8.8
Native American/Alaska Native * * * *
Native Hawaiian/Pacific Islander * * * *
Multi-racial * * * *
White 57 2.0 47 12.6
Not reported * * * *
Gender (totals 100%)
Female 60 2.0 47 11.3
Male * * * *
Not reported * * * *
TOTAL 88 2 47 11.3

64
Appendix D.1., continued.
Umpqua Number of students
Minimum credits earned
Maximum credits earned
Average credits earned
Race/ethnicity (totals 100%)
Asian American * * * *
Black/African American * * * *
Hispanic/Latinx 26 4.0 51 21.6
Native American/Alaska Native * * * *
Native Hawaiian/Pacific Islander * * * *
Multi-racial * * * *
White 88 1.0 43 13.5
Not reported 71 3.0 54 17.9
Gender (totals 100%)
Female 107 1.0 54 16.0
Male * * * *
Not reported * * * *
TOTAL 191 1 54 16.2

65