academy of strategic management … iii academy of strategic management journal, volume 13, number...
TRANSCRIPT
Volume 13, Number 2 Print ISSN: 1544-1458 Online ISSN: 1939-6104
ACADEMY OF STRATEGIC MANAGEMENT JOURNAL
SHAWN CARRAHER OXFORD JOURNAL DISTINGUISHED RESEARCH PROFESSOR
EDITOR
The Academy of Strategic Management Journal is owned and published by Jordan Whitney Enterprises, Inc.. Editorial Content is controlled by the Allied Academies, a non-profit association of scholars, whose purpose is to support and encourage research and the sharing and exchange of ideas and insights throughout the world.

Page ii
Academy of Strategic Management Journal, Volume 13, Number 2, 2014
Authors execute a publication permission agreement and assume all liabilities. Neither Jordan Whitney Enterprises, Inc. nor Allied Academies is responsible for the content of the individual manuscripts. Any omissions or errors are the sole responsibility of the authors. The Editorial Board is responsible for the selection of manuscripts for publication from among those submitted for consideration. The Publishers accept final manuscripts in digital form and make adjustments solely for the purposes of pagination and organization.
The Academy of Strategic Management Journal is owned and published by Jordan Whitney Enterprises, Inc., PO Box 1032, Weaverville, NC 28787, USA. Those interested in communicating with the Journal, should contact the Executive Director of the Allied Academies at [email protected].
Copyright 2014 by the Jordan Whitney Enterprises, Inc., USA
Page iii
Academy of Strategic Management Journal, Volume 13, Number 2, 2014
EDITORIAL REVIEW BOARD
Peter Antoniou California State University San Marcos
Stephanie Huneycutt Bardwell Christopher Newport University
James Bishop New Mexico State University
ThomasBox Pittsburg State University
Marty Bressler Southeast Oklahoma State University
Steve Brown Eastern Kentucky University
Richard Caldarola Troy State University
Eugene Calvasina Southern University
Shawn Carraher Minot State University
Robert Carton Western Carolina University
Beth Castiglia Felician College
John James Cater Louisiana State University
Ronald Cheek University of Louisiana at Lafayette
Iain Clelland Radford University
Meredith Downes Illinois State University
Thomas Garsombke Claflin University
Edward Haberek Briarwood College
Paul Jacques Western Carolina University
Raghu Korrapati Walden University
Rick Koza Chadron State College
Catherine Levitt California State University at Los Angeles
Chris Lockwood Northern Arizona University
Lee Makamson Hampton University
Terry Maris Ohio Northern University
James Maxwell Indiana State University
David McCalman University of Central Arkansas

Page iv
Academy of Strategic Management Journal, Volume 13, Number2, 2014
EDITORIAL REVIEW BOARD
James McLaurin American University of Sharjah
Mohsen Modarres Humboldt State University
Chynette Nealy University of Houston-Downtown
John Kalu Osir Washington State University
Mildred Golden Pryor Texas A&M University-Commerce
Oswald Richards Lincoln University
Stanley Ross Bridgewater State College
Robert Scully Barry University
Claire Simmers Saint Joseph's University
Prasanna Timothy Karunya Institute of Technology & Sciences
Jennifer Villa New Mexico State University

Page v
Academy of Strategic Management Journal, Volume 13, Number 2, 2014
TABLE OF CONTENTS EDITORIAL REVIEW BOARD .................................................................................................. III LETTER FROM THE EDITOR .................................................................................................. VII STRATEGIC ORIENTATIONS AND THEIR RELATIONSHIP WITH PERFORMANCE: A CASE OF A MEXICAN FAMILY FIRM .................................................................................. 1
Alberto D. Malpica Romero, Tecnológico de Monterrey Edgar R. Ramírez Solís, Tecnológico de Monterrey Verónica I. Baños Monroy, Tecnológico de Monterrey
IMPACT OF MANAGEMENT BASICS ON EMPLOYEE ENGAGEMENT........................... 21
Bobby Medlin, University of Arkansas-Fort Smith Kenneth W. Green, Jr., Southern Arkansas University
A STRATEGY FOR CLIMBING THE ORGANIZATIONAL LADDER ................................. 37
Jan P. Muczyk, Cleveland State University Terry R. Adler, New Mexico State University
IS WAL-MART A SOCIAL ENTERPRISE? AN EXPLORATION OF THE RELATIONSHIP BETWEEN CORPORATE REPUTATION, CORPORATE SOCIAL RESPONSIBILITY & FINANCIAL PERFORMANCE ............................................................. 51
Leon C. Prieto, Clayton State University Simone T. A. Phipps, Middle Georgia State College Isaac Y. Addae, Morgan State University
A PROFILE OF SOCIAL MEDIA USE BY FORTUNE 500 AND INC. 500 CORPORATIONS ........................................................................................................................ 61
Janet M. Ratliff, Morehead State University Michelle B. Kunz, Morehead State University
HOW FIRM CHARACTERISTICS AFFECT THE SPEED OF PATENTING ......................... 75
Derek Ruth, Northern Illinois University

Page vi
Academy of Strategic Management Journal, Volume 13, Number2, 2014
DOUBLE DEALING: THE INFLUENCES OF DIVERSE BUSINESS PROCESSES ON ORGANIZATIONAL AMBIDEXTERITY .......................................................................... 87
Janet K. Tinoco, Embry-Riddle Aeronautical University ORGANIZATIONAL IMPLOSION – A THREAT TO LONG-TERM VIABILITY .............. 111
Mildred Golden Pryor, Texas A&M University-Commerce Randal Y. Odom, Texas A&M University-Commerce Leslie A. Toombs, Texas A&M University-Commerce

Page vii
Academy of Strategic Management Journal, Volume 13, Number 2, 2014
LETTER FROM THE EDITOR Welcome to the Academy of Strategic Management Journal. The Journal is owned and published by Jordan Whitney Enterprises, Inc.. The Editorial Board and the Editors are appointed by the Allied Academies, Inc., a non profit association of scholars whose purpose is to encourage and support the advancement and exchange of knowledge, understanding and teaching throughout the world. The editorial mission of the Journal is to advance the field of strategic management. To that end, the journal publishes theoretical and empirical manuscripts pertaining to the discipline. The manuscripts contained in this volume have been double blind refereed. The acceptance rate for manuscripts in this issue, 25%, conforms to our editorial policies. Our editorial review policy maintains that all reviewers will be supportive rather than destructive, helpful versus obtrusive, mentoring instead of discouraging. We welcome different points of view, and encourage authors to take risks with their research endeavors. The Editorial Policy, background and history of the organization, and calls for conferences are published on our web site. In addition, we keep the web site updated with the latest activities of the organization. Please visit our site at www.alliedacademies.org and know that we welcome hearing from you at any time.
Shawn Carraher Oxford Journal Distinguished Research Professor

Page viii
Academy of Strategic Management Journal, Volume 13, Number2, 2014

Page 1
Academy of Strategic Management Journal, Volume 13, Number 2, 2014
STRATEGIC ORIENTATIONS AND THEIR RELATIONSHIP WITH PERFORMANCE: A CASE OF A
MEXICAN FAMILY FIRM
Alberto D. Malpica Romero, Tecnológico de Monterrey Edgar R. Ramírez Solís, Tecnológico de Monterrey
Verónica I. Baños Monroy, Tecnológico de Monterrey
ABSTRACT Despite abundant literature on strategic orientations, little has been done regarding qualitative studies that investigate on the nature of the relationships between strategic orientations (market orientation, entrepreneurial orientation, learning orientation and technology orientation) and their linkage with business performance in a family firm. Based on Hakala’s (2011) framework for organizing the different approaches to analyze multiple strategic orientations studies, using the resource-based view (RBV) and contingency theory (CT) as theoretical framework, this research presents an exploratory case study that intends to advance the comprehension on how enterprises set a competitive strategy; how top management contributes to set up this competitive strategy and how a firm relates strategic orientations in order to enhance its performance, with an emphasis on technology orientation. A discussion of the findings and some possible future research, as well as conclusions and managerial implications are provided. Keywords: strategic orientations, technology orientation, market orientation, entrepreneurial orientation, learning orientation, firm performance, innovativeness
INTRODUCTION Strategic orientations in a firm have attracted the attention of scholars in diverse disciplines like marketing, entrepreneurship and management. They are seen as principles that direct and influence the activities of a business organization in their effort to achieve a better performance in the marketplace and ensure its viability (Noble, Sinha and Kumar, 2002; Hakala, 2011). Having their roots in the strategy research field, the concept of Strategic Orientation of a Business Enterprises (STROBE) has been studied as a multidimensional construct trying to advance in the operationalization of measures that test theoretical relationships proposed by researchers (Venkatraman, 1989; Morgan and Strong, 2003).

Page 2
Academy of Strategic Management Journal, Volume 13, Number2, 2014
Strategy –as an academic field- has been considered as fragmented and lacked of coherence identity (Nag, Hambrick and Chen, 2007); however, strategic management is undoubtedly a successful emerging field producing a rich research line for scholars. There is a tacit agreement that argues that the strategic management concept can be categorized in a three-level mode: business, corporate and functional (Venkatraman, 1989). According to this, business strategy can be characterized as the manner in which a firm decides to compete (Morgan and Strong, 2003). Several approaches have been used in order to develop a strategy measurement (narrative, classificatory and comparative). For the comparative approach, Venkatraman (1989) specifies six a priori dimensions: aggressiveness, analysis, defensiveness, futurity, proactiveness and riskiness. As an example of the use of this approach, Morgan and Strong (2003) found that firms’ emphasis upon analysis, defensiveness and futurity are related to business performance. For a more detailed description of each of the six dimensions, see Venkatraman (1989). One typology of strategic orientations used in strategy research-that is widely adopted- is suggested by Miles and Snow (1978; cited by Morgan and Strong, 2003):
1. Prospector: firms that conduct externally oriented business. 2. Defender: organizations internally oriented, focusing on efficiency and low cost
operations. 3. Analyzer: firms that have the characteristics of prospector as well as defender,
depending on the market environment. 4. Reactor: firms that respond to competitive circumstances when they are forced.
Another typology of strategic orientations mainly used in the marketing research area, was proposed by Narver and Slater’s (1990) and Slater and Narver’s (1994) articles that are considered pioneer studies of the impact of market orientation (MO) on firm performance; Lumpkin and Dess (1996) pioneering entrepreneurial orientation (EO); Gatignon and Xuereb’s (1997) technology orientation (TO) and Sinkula, Baker and Noordewier (1997) studying learning orientation. Other strategic orientations have been acknowledged, such as employee orientation, customer orientation, competitor orientation, and production orientation or selling orientation (Grinstein, 2008; Calantone, Cavusgil and Zhao, 2002; Noble et al., 2002; Gatignon and Xuereb, 1997). However, for the purposes of this study, only market orientation, entrepreneurial orientation, learning orientation and technology orientation are considered. Research in marketing has focused almost exclusively on maintaining a market orientation emphasis, based on the adoption and implementation of the marketing concept (Noble et al., 2002; Hult, Ketchen and Slater, 2005); however, some scholars have addressed a caution point about relying only on market orientation because customers do not necessarily know what they really want, due to the lack of information about the latest market trends or technologies (Zhou, Yim and Tse, 2005). Little is reported about multiple orientations studies and how strategic orientations are related between them and its relationship with performance (Lee, 2011; Hakala, 2011). For

Page 3
Academy of Strategic Management Journal, Volume 13, Number 2, 2014
instance, Hakala (2011) reports that he did not find studies relating entrepreneurial and technology orientation or entrepreneurial, technology and learning orientation and their relationship with the firm performance, declaring that a window is open for future research, not only through empirical studies, but also through the use of qualitative research. Many authors have researched the relationship between market orientation and performance with the purpose of contradicting or fortifying the paradigm in marketing research about the superior contribution of market orientation to performance (Grinstein, 2008). However, empirical studies have shown mixed results about the linkage between market orientation and performance, several studies have tried to assess how alternative strategic orientations are related to market orientation and how these relationships have an impact on the firm performance (Noble et al., 2002; Grinstein, 2008). These studies suggest that research should be shifted from the binomial relationship of market orientation-performance toward the multiple orientations-performance form. However, few studies have used more than one strategic orientation (Grinstein, 2008; Hakala, 2011), so this field remains open and researchers are encouraged to deepen in this research field. Even though a significant amount of literature has been developed over the last two decades regarding strategic orientations, few qualitative studies can be founded. The present case study has the purpose of collaborating to the understanding of how managers set up a competitive strategy for the firm; how top management contributes to set up this competitive strategy and how a firm relates strategic orientations in order to enhance its performance. Company X (Real name is disguised for confidentiality reasons ) was selected for the case study by two main reasons; on April of 2012, they received from Endeavor Global -an international organization devoted to catalyze long-term economic growth by selecting, mentoring and accelerating the best high-impact entrepreneurs around the world (Endeavor, 2013)-the International Endeavor Entrepreneur Certificate, which is an international distinction for innovative enterprises around the world. Second, this company received the highest number of mentions when it was asked what firm was considered an extraordinary example of success in the metropolitan area of Guadalajara, considering the opinion of several local businessmen. The study is organized as follows: section two describes the theoretical framework for the case study, setting the knowledge background. In section three, the methodology is presented and the results are presented in section four. The discussion, theoretical and practical implications are presented in the final section.
THEORETICAL FRAMEWORK
Resource-based View Businesses are always trying to advance in their competitive advantage in order to survive and thrive. The resource-based view theory (RBV) claims that firm’s resources influence
Page 4
Academy of Strategic Management Journal, Volume 13, Number2, 2014
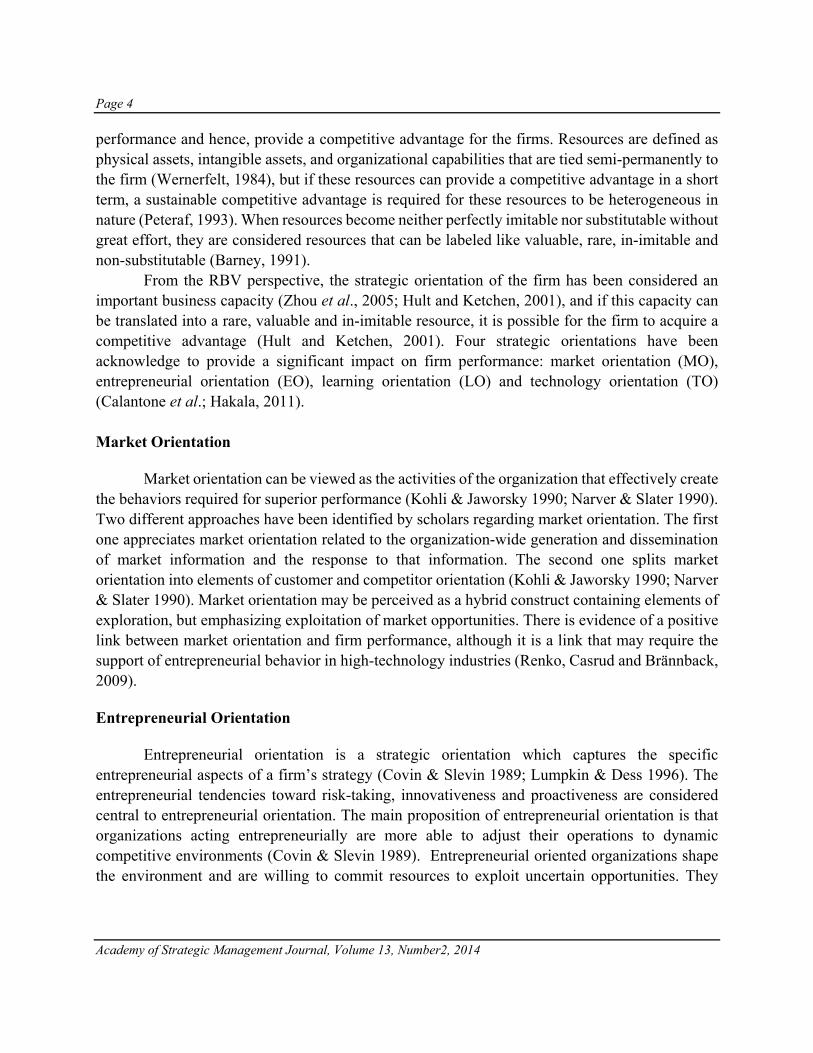
performance and hence, provide a competitive advantage for the firms. Resources are defined as physical assets, intangible assets, and organizational capabilities that are tied semi-permanently to the firm (Wernerfelt, 1984), but if these resources can provide a competitive advantage in a short term, a sustainable competitive advantage is required for these resources to be heterogeneous in nature (Peteraf, 1993). When resources become neither perfectly imitable nor substitutable without great effort, they are considered resources that can be labeled like valuable, rare, in-imitable and non-substitutable (Barney, 1991). From the RBV perspective, the strategic orientation of the firm has been considered an important business capacity (Zhou et al., 2005; Hult and Ketchen, 2001), and if this capacity can be translated into a rare, valuable and in-imitable resource, it is possible for the firm to acquire a competitive advantage (Hult and Ketchen, 2001). Four strategic orientations have been acknowledge to provide a significant impact on firm performance: market orientation (MO), entrepreneurial orientation (EO), learning orientation (LO) and technology orientation (TO) (Calantone et al.; Hakala, 2011). Market Orientation
Market orientation can be viewed as the activities of the organization that effectively create the behaviors required for superior performance (Kohli & Jaworsky 1990; Narver & Slater 1990). Two different approaches have been identified by scholars regarding market orientation. The first one appreciates market orientation related to the organization-wide generation and dissemination of market information and the response to that information. The second one splits market orientation into elements of customer and competitor orientation (Kohli & Jaworsky 1990; Narver & Slater 1990). Market orientation may be perceived as a hybrid construct containing elements of exploration, but emphasizing exploitation of market opportunities. There is evidence of a positive link between market orientation and firm performance, although it is a link that may require the support of entrepreneurial behavior in high-technology industries (Renko, Casrud and Brännback, 2009).
Entrepreneurial Orientation
Entrepreneurial orientation is a strategic orientation which captures the specific entrepreneurial aspects of a firm’s strategy (Covin & Slevin 1989; Lumpkin & Dess 1996). The entrepreneurial tendencies toward risk-taking, innovativeness and proactiveness are considered central to entrepreneurial orientation. The main proposition of entrepreneurial orientation is that organizations acting entrepreneurially are more able to adjust their operations to dynamic competitive environments (Covin & Slevin 1989). Entrepreneurial oriented organizations shape the environment and are willing to commit resources to exploit uncertain opportunities. They

Page 5
Academy of Strategic Management Journal, Volume 13, Number 2, 2014
explore new and creative ideas which may lead to changes in the market place, and do so proactively ahead of the competition in anticipation of future demand.
Learning Orientation
Learning may be viewed as the development or acquisition of new knowledge which has the potential to influence behavior; a more rigorous view states that learning results in new behaviors or value creation (Hakala, 2011). Learning orientation is viewed as the organization’s propensity to create and use knowledge in order to attain competitive advantage. Sinkula, Baker and Noordewier (1997) conceptualize organizational learning orientation in the dimensions of shared vision, open-mindedness and a commitment to learn. It is possible to understand learning orientation as the intersection between technology orientation and marketing knowledge. The development of new technologies can be seen as specific forms of learning; however, the commonly used measures of learning orientation do not deal with the aspects of customers, competitors or technologies (Hakala, 2011).
Technology Orientation
Technology orientation or the closely related terms of innovation and product orientation (Grinstein, 2008), refers to a firm’s inclination to introduce or use new technologies, products or innovations. A technology orientation is said to improve business or new product performance, but studies have not always identified positive effects (Hakala, 2011). At the heart of technology orientation is the interest in new solutions that create superior customer value, and some authors tried to incorporate this on the view of market orientation (Hakala, 2011); however, the commonly used scales for measuring market orientation do not incorporate any new technology, product or innovation dimensions, thus technology orientation is viewed separately from market orientation. Gatignon and Xuereb (1997) state that a technology oriented firm can be defined as a firm with the ability and will to acquire a substantial technological background and use it in the development of new products, meaning also to build new technical solutions for new needs of clients. Contingency Theory
Classified as a class of behavioral theory, contingency theory asserts that there is no best way to organize a corporation, to lead a company, or to make decisions under all conditions (Ginsberg and Venkatraman, 1985); “It is perhaps a truism that any theory of corporate or business strategy must be, by definition, contingency-based” (Ginsberg and Venkatraman, 1985, p. 421). Hakala (2011) suggests that research on orientation configuration can be performed both, universal and contingency-dependent. For instance, if a firm sees strategic orientations as alternatives to choose from, it is because they think that there is a best orientation depending on the contingency (competitive intensity, technology turbulence, demand uncertainty, etc.). Another

Page 6
Academy of Strategic Management Journal, Volume 13, Number2, 2014
example is what Gao, Zhou and Yim (2007) found regarding the wide notion that customer orientation represents the most critical component of market orientation, and in consequence it always has a positive impact on the firm performance. In China, it improves performance when demand uncertainty is low, but harms performance when demand uncertainty is high. In an attempt to better understand the interaction between multiple strategic orientations, Hakala (2011) proposed three approaches to understand market, entrepreneurial, learning and technology orientations (see figure 1). 67 scholarly articles that were published between 1987 and 2010 (Tranfield, Denyer and Smart, 2003) were reviewed using a systematic review method. It tries to identify the key scientific contributions by the construction of an evidence base that would be beyond the parameters of a single study. Figure 1. Framewok for organizing different approaches to analyzing multiple strategic orientations
Source: Hakala (2011)

Page 7
Academy of Strategic Management Journal, Volume 13, Number 2, 2014
Orientations as sequences in development The orientation of the firm evolves over time or through its life cycle; orientations develop into other orientations; it is thought as an evolution from an internal orientation towards an external strategic orientation. Based technology firms can be the best representation of this because of its initial entrepreneurial orientation (Renko et al., 2009). Orientations as alternatives to choose from Some orientations work better than others in certain contingencies, depending on the effects they produce; there is a number of effective orientation alternatives. External environmental factors can be thought as one of the major reasons why a company decides to choose among different orientations (Gao et al., 2007). Orientations as complementary patterns Orientations are different but work together in configuration; different configurations may suit different contingencies; the orientation configuration evolves. Different strategy topologies can be devised using different dimensions of the overall strategic orientation (Berthon, Hulbert and Pit, 1999). The contingency approach appears in two of the three options of the framework proposed, suggesting that this theoretical framework could better explain the relationships between the different strategic orientations. Hakala (2011) suggests that orientations as complementary patterns would be the most productive way to enhance understanding of orientations as principles and activities of adaptation that support the performance of a firm. Finally, the three options proposed are just one way to better understand the different purposes of the strategy defined by the firm. Technology orientation and alternative strategic orientations As one of the latest strategic orientations to be formally considered in the research field, technology orientation and its association with related terms such as innovation has been increasing its relevance in the research field because of its importance as a potential source of competitive advantage (Gatignon and Xuereb, 1997; Zhou et al., 2005). Table 1 shows the articles where technology orientation is related with alternative strategic orientations. Appendix I shows a summary of the articles of table 1 containing: title, author, objective, theoretical framework, data/analysis and results. The first interesting finding when analyzing articles in table 1 is that more than a half of the articles (62.5%) do not have an explicitly theoretical framework. Contingency theory (16.6%) and Resource-Based View (12.5%) appear as

Page 8
Academy of Strategic Management Journal, Volume 13, Number2, 2014
the most frequent theories used to support the hypothesis proposed. This can lead to an intuitive conclusion, that more theoretical research is needed in order to robust the research field.
Table 1. Studies relating technology orientation and alternative strategic orientations
Investigated Orientations Number of articles Articles Market and technology orientations 18 Appiah-Adu and Singh 1998; Berry 1996;
Berthon et al. 1999, 2004, 2008; Fritz 1996; Gao et al. 2007; Izquierdo and Samaniego 2007; Jeong et al. 2006; Knotts et al. 2008; Marinov et al. 1993; Paladino 2009; Pearson 1993; Shaw 2000; Shipley et al. 1995; Suh 2005; Voss and Voss 2000; Zaharieva et al. 2004.
Market, technology and entrepreneurial orientations
3 Aloulou and Fayolle 2005; Kaya and Seyrek 2005; Li 2005.
Market, technology and learning orientations
2 Noble et al. 2002; Salavou 2005.
Market, technology, entrepreneurial and learning orientations
1 Zhou et al. 2005.
Total 24 Source: adapted from Hakala (2011) Although performance-orientations appears in 45.8% of the articles, it is clear that strategic orientations open a new window of research for scholars, particularly in untraditional research areas like non-profit or social organizations (Voss and Voss, 2000; Izquierdo and Samaniego, 2007). Another interesting group of studies are related with the relationship between innovation-new product development (Berthon, Hulbert and Pitt, 2004; Jeong, Pae and Zhou, 2006; Zhou, Yim and Tse, 2005). Particularly Berthon et al. (2004) with the development of the scale to measure the innovation-customer orientation (ICON); this represented an advance management research. Regarding empirical analysis techniques, an evolution over time can be seen from a linear regression analysis through structural equation modeling, and the number of studies relating more than two strategic orientations is scarce, with market orientation leading the mainstream. Finally, nine out of the twenty four articles demonstrate some type of diagram or graphic that illustrates the relationships among strategic orientations. Some empirical studies state implicitly that the relationships are one to one, so there is no need of any conceptual model. Leadership and Business Performance in Family Firms Recently, researchers using the strategic management approach have begun to rely more and more on two theoretical perspectives that represent a confluence of insights from the fields of strategic management, finance, and economics: the RBV of the firm and agency theory. We believe

Page 9
Academy of Strategic Management Journal, Volume 13, Number 2, 2014
that this focus is both appropriate and entirely consistent with a strategic management view of the field because RBV and agency theory potentially assist in explaining important strategic management issues such as the formulation and content of goals and strategies, strategy implementation and control, leadership, and succession in family firms. Furthermore, both theoretical perspectives have a performance orientation. The agency theory approach to explain the distinctiveness of family firms is based on altruism and entrenchment. Of the two, altruism is a credible attribute for distinguishing family and nonfamily firms because it is easier to accept its possible existence among family owners and family managers than its existence among nonfamily owners and managers. The strong indications that there are contingencies that might influence the relationship between altruism, paternalism and performance are also important because it implies that the variations are not random (Chrisman, Chua and Sharma, 2005). One of the biggest issues with the agency theory is the managerial opportunism which can be presented within the members of the family, this can cause a major managerial problem; when a family member is seen by other employees and the rest of the family as an impediment for the business this phenomenon has been denominated “Fredo Effect” (Kidwell et al., 2012). For this reason, it is very important the preparation of future leaders in the family. One of the greatest family challenges is to understand that the next generation of leaders will be leading a different company within a distinct environment than their predecessors had. This means that we cannot prepare the children in the same way that our parents prepared us. The leading styles that were successful in the past are not good enough to face a competitive and global environment, new employee values and radical technological changes. Carlock and Ward (2001) argue that the following are important abilities that the family leaders must have:
1. Good communicator 2. Conciliator between family’s needs 3. Abilities to plan fun and amusement activities 4. Conflict mediator 5. Organized 6. Committed with ethics and family business
EMPIRICAL STUDY
Methods and Sample As the purpose of the study is to identify how a firm relates strategic orientations in order to construct a competitive strategy that produce an improved performance using the example of Company X, an exploratory single case study is highly recommended, as long as the question “how” deals with the “operational links needed to be traced over time, rather than mere frequencies

Page 10
Academy of Strategic Management Journal, Volume 13, Number2, 2014
or incidence”. The case study is suitable to provide in-depth information from managers regarding the main motivations behind strategic orientations arrangements (Yin, 2009). The time period of analysis will cover from 2004 to 2013, a reasonable amount of time to look for changes in a competitive strategy and the reasons behind it. Finally, this case study is a great opportunity to research in a so-called “emerging economy” like Mexico; none study was found in the literature review that addressed a research project that included Latin American countries. The first step was to design the exploratory case study emphasizing on construct validity and reliability (Ying, 2009). An in-depth semi-structured interview was designed and performed between May 23rd and May 30th, 2013 (see appendix II). These interviews were performed on top management (president and CEO) as well as five direct reports to top management. It took an average of about 90 minutes, trying to get as much information as possible about the competitive strategy of Company X. Because of the interview method was semi-structured, three main open questions were asked:
1. In your experience, which are the key factors for the company to be competitive? 2. In your experience, what does the company require to become more competitive? 3. Describe –in a general way- the competitive strategy that the company uses in terms
of: market, human resource, technology and innovation, new products or services to the market.
Along with the in-depth semi-structured interview, it was also applied a strategic orientations and firm performance questionnaire to complement the interview information. Additional information was collected from public information like Company X’s web page and some other web based information like Youtube interviews and online news. It is also important to mention enquires were tried for media databases (like Factiva), but not significant results were retrieved. Finally, internal documents relating strategic planning and business model documentation were provided. A manual content analysis was performed for different printed material of Company X in order to deepen in information. It is important to consider that many of the documents provided by Company X do not have the expected temporal sequence (e.g., strategic planning documents). All of this material was used in combination with interviews in order to construct a robust body of evidence that could support the findings from different sources of information (triangulation). The case study analysis considers three aspects: what elements determine the competitive strategy for Company X; how top management and first line of executives support the competitive strategy and how strategic orientations are interrelated in order to execute the strategy devised by Company X.

Page 11
Academy of Strategic Management Journal, Volume 13, Number 2, 2014
The case of Company X The history of Company X could be similar to many family firms around the world. By this time, the company could be considered a second generation family business but in a process of professionalization and institutionalization. The following piece of history includes the actual president of Company X, Rene Freudenberg and the actual CEO, Roberto Iberri:
“In the early 1980s, the Mexican petrochemical industry operated under a system of import substitution, but no company was filling the void in specialized lubricants. In 1984 Rene’s father, Peter Freudenberg, decided to fill that niche. Peter did not know much about lubricants, so a few months after founding Company X, Peter met Roberto who was working in a larger lubricants company in Mexico. A chemical engineer from Guadalajara with a strong technical background and extensive experience in quality control. Roberto served as an advisor to Company X before joining fulltime in 1986. In 1994, a crisis was turned into an opportunity when within a week the Mexican peso lost nearly half its value. Company X confronted the situation and started testing their products internationally. Today its lubricants can be found in over 30 countries, most of them in their initial sales stage.”
While Roberto Iberri joined Company X in 1986, Rene Freudenberg did it in 2003, and by 2004 the following were the mission and vision of the company:
“Mission: to provide solutions and specialized services for lubrication, manufacturing processes and maintenance to improve the competitive and ecological situation of our customers. Vision: to become a world class company that adapts to our clients necessities.”
In 2012, Company X received the Endeavor Global Entrepreneur award, and Endeavor Global posted the following company snapshot:
“Company X seeks to be the world’s leader in developing and providing customized, environmentally oriented solutions for critical industrial processes and machinery, where friction and wear are involved. For large manufacturers in Mexico, Company X is smoothing out the road to success. Entrepreneurs Rene Freudenberg and Roberto Iberri improve the efficiency and longevity of their clients’ expensive industrial machinery by replacing conventional industrial lubricants with specialized solutions. Company X has been able to gain market share by avoiding the saturated conventional lubricants market, focusing instead on the minority of lubricant applications that demand high-touch service and specialized – often made-to-order – products. By helping customers to identify their needs through a high-touch customer service and consulting model, Company X has won over nine of the ten largest manufacturing companies in Mexico. With the support of these

Page 12
Academy of Strategic Management Journal, Volume 13, Number2, 2014
high profile clients, Company X’s brand recognition has spiked and sales have increased substantially since 2006. Company X has a history of seizing opportunities in challenging markets. In the early 1980s, the Mexican petrochemical industry operated under a system of import substitution, and specialized lubricants were not available. In 1984, Rene’s father, Peter Freudenberg, decided to fill that niche. Peter didn’t know much about lubricants, so a few months after founding Company X, Peter sought out Roberto, who was working in a larger lubricants company in Mexico at the time. A chemical engineer from Guadalajara with a strong technical background and extensive experience in quality control, Roberto served as an advisor to Company X before joining fulltime in 1986. In 1994, the Mexican crisis turned the market on its head, and in just a week the peso lost nearly half its value. Company X was able to pivot, maintain profitability, and begin exporting products, serving clients as far away as Japan. Peter’s son and current president of Company X, Rene, has built a fast-growing business on this resilient foundation. Raised in Guadalajara, Rene studied business administration in Germany before earning an MBA from Tias Nimbas in the Netherlands. He then went to work for the multinational tire company Continental AG. Rene gained valuable international experience working in Germany, Belgium, England, and Spain after graduation, but returned to Guadalajara in 2004 to rejoin the family business. Soon thereafter, he moved to Brazil to launch Company X’s Brazilian subsidiary and distributor. In 2006, Peter retired and Rene returned to Mexico to take over as president of Company X.”
By 2013, Company X´s competitive strategy is based on three main concepts:
1. Market contact (labeled C); that determines direction and rhythm 2. Technology (labeled T); taking advantage of experience and R&D 3. Production and Processes (labeled P); complex but flexible
The most operative part of the strategy is performed through a very specialized consultant, a leader that is identified with the following characteristics:
Reliable Creative Aspirational Charismatic Service oriented Systemic thinker Analytical Technically strong

Page 13
Academy of Strategic Management Journal, Volume 13, Number 2, 2014
Empathic Ambassador of the Company X culture Self drived
According to Company X´s data, it takes approximately two years to train this type of sales
force.
RESULTS Identified model The first significant result in the Company X case was the identification of a model corresponding to the strategy devise by the company. Figure 2 shows the model identified. This configuration of strategic orientations seems to agree with Hakala’s (2011) evidence that suggest that the complementary pattern is the most productive way to enhance understanding of orientations as principles and activities of adaptation that support the performance of a firm.
Figure 2. Strategic orientations model identified for Company X
Source: Compiled by the author
The model was constructed by interpreting the information gathered from different information sources. It is interesting that production orientation appears in the model like a “virtuous” loop with technology orientation and learning orientation. This finding also strengths the contingent nature of a firm addressed by Ginsberg and Venkatraman (1985), because Company X heavily relies on its technological experience and its sales force specially trained to detect and design an ad hoc solution for their customers.
T
L M
P
PERFORMANCE
E
Page 14
Academy of Strategic Management Journal, Volume 13, Number2, 2014
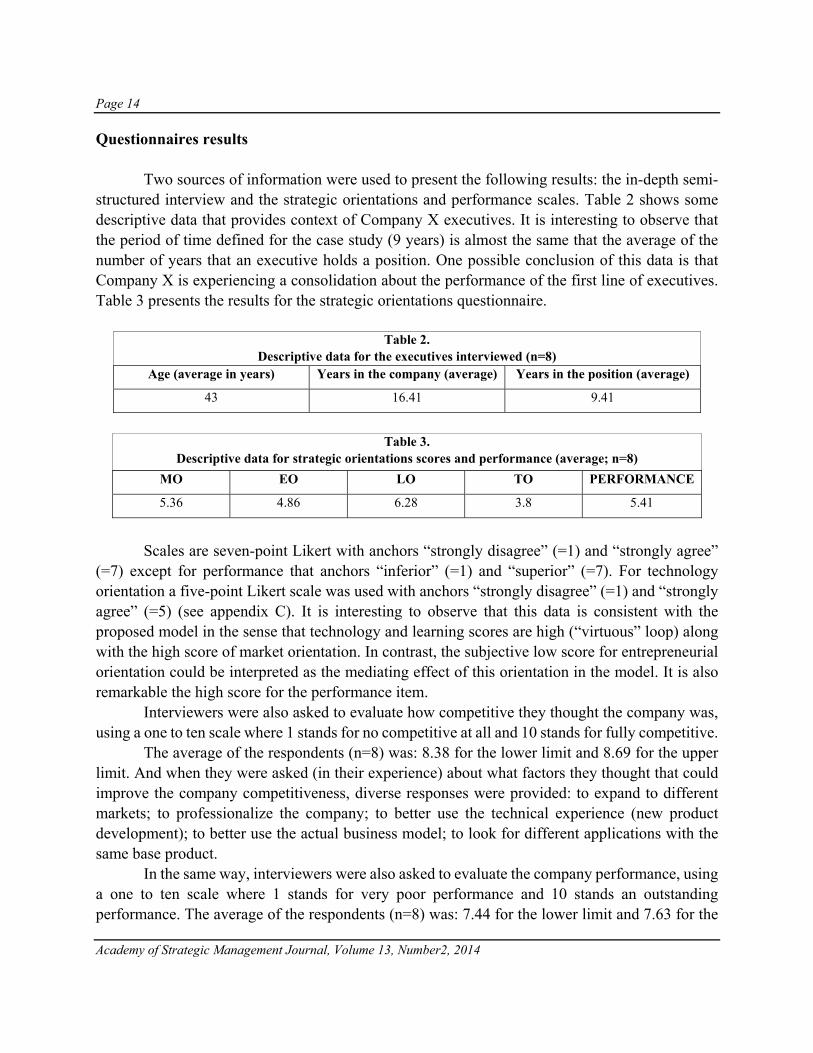
Questionnaires results Two sources of information were used to present the following results: the in-depth semi-structured interview and the strategic orientations and performance scales. Table 2 shows some descriptive data that provides context of Company X executives. It is interesting to observe that the period of time defined for the case study (9 years) is almost the same that the average of the number of years that an executive holds a position. One possible conclusion of this data is that Company X is experiencing a consolidation about the performance of the first line of executives. Table 3 presents the results for the strategic orientations questionnaire.
Table 2. Descriptive data for the executives interviewed (n=8)
Age (average in years) Years in the company (average) Years in the position (average)
43 16.41 9.41
Table 3.
Descriptive data for strategic orientations scores and performance (average; n=8)
MO EO LO TO PERFORMANCE
5.36 4.86 6.28 3.8 5.41
Scales are seven-point Likert with anchors “strongly disagree” (=1) and “strongly agree” (=7) except for performance that anchors “inferior” (=1) and “superior” (=7). For technology orientation a five-point Likert scale was used with anchors “strongly disagree” (=1) and “strongly agree” (=5) (see appendix C). It is interesting to observe that this data is consistent with the proposed model in the sense that technology and learning scores are high (“virtuous” loop) along with the high score of market orientation. In contrast, the subjective low score for entrepreneurial orientation could be interpreted as the mediating effect of this orientation in the model. It is also remarkable the high score for the performance item. Interviewers were also asked to evaluate how competitive they thought the company was, using a one to ten scale where 1 stands for no competitive at all and 10 stands for fully competitive. The average of the respondents (n=8) was: 8.38 for the lower limit and 8.69 for the upper limit. And when they were asked (in their experience) about what factors they thought that could improve the company competitiveness, diverse responses were provided: to expand to different markets; to professionalize the company; to better use the technical experience (new product development); to better use the actual business model; to look for different applications with the same base product. In the same way, interviewers were also asked to evaluate the company performance, using a one to ten scale where 1 stands for very poor performance and 10 stands an outstanding performance. The average of the respondents (n=8) was: 7.44 for the lower limit and 7.63 for the

Page 15
Academy of Strategic Management Journal, Volume 13, Number 2, 2014
upper limit. And when they were asked (in their experience) about what factors could improve the company performance, also two characteristics appeared: a better internal communication and a clear definition of key performance indicators (KPIs).
DISCUSSION The exploratory case study performed at Company X was designed to better understand: how a firm devises a competitive strategy, how leaders contribute to this competitive strategy and how strategic orientations interact in order to enhance the company performance. The identified model tries to capture Company X’s competitive strategy, based on what Rene Freudenberg labels as market contact. One possible alternative in the identified model is changing market orientation for more specific customer orientation. The concept of market contact is grounded through the specialized technical consultant and currently is the key resource for the company to enhance its performance. Under the RBV theory, the market contact concept can be seen as a source of competitive advantage. Regarding the question: how competitive is your company in the market? The average number can be considered high (8.69/10) however, the top management is not completely clear on how the competitiveness of the company can be enhanced. This is not the case for the question: how do you evaluate your company performance? The average number reflects a wider opportunity area (7.63/10), but executives have a clearest landscape on how performance can be improved: better internal communication and clearest KPIs. They also detected a lack of role definition that could be improved. Regarding strategic orientations, the evidence shows an agreement with Hakala’s (2011) framework and strategic orientations appear as complementary patterns in consistency with the contingency paradigm. Implications for theory As we saw in the case of company X the lack of leadership and a good internal communication can cause problems in the family and in the company. For this reason, preventive measures must be taken to avoid or minimize these problems. The problem in the family business is that many things can be assumed; there are many rules that are not written and many ideas that the founder has but they are never shared. For example, when one of the second generation members lets the family know about going to work for a different company, as in Company X, the father reacts saying: “And why don’t you join our company?” and the answer is: “Because you never told me that you wanted me to work there”. For this reason it is important to have an “employment agreement”. This is a document that establishes the conditions for the entry and exit of the family in the company. First at all, the founder must make clear his intention of offering employment to his children in the company, but

Page 16
Academy of Strategic Management Journal, Volume 13, Number2, 2014
without forcing the option; at the end the participation is voluntary (a very attractive career must be designed in order to attract the youngest members without being forced). It must also be cleared that the fact of being accepted in the company does not guarantee an executive position in the future, this will depend on the performance. This is a basic part if the company wants to be professionalized: avoid nepotism in any decision. The family can define the professional requirements that the members need in order to be part of the business or be promoted once they are part of the company. For example; one of the requirements is that the family members must have external experience or a bachelor degree. All these specifications are covered in the employment agreement. The employment agreement must be redacted before the youngest family members join the company and the opportunities must be described clearly in a way that even the children can understand. Not all the children and cousins can be directors; thus it must be clear that the highest positions will be assigned by performance, and not by last name. This agreement is as important as a contract; it is the tranquility between the current and future employees of the family business. And like any other agreement, it can be modified before the corresponding corporate governance and always under the family consensus. The “employment agreement” can be included in a family protocol, which highlights the rules and minimum requirements to participate in the company. Implications for practice Considering the results of this case analysis, some conclusions can be derived for management practice. As we noticed in the results of the interviews, Company X suffers a lack of role definition which can be an opportunity to improve its competitiveness and performance if this problem is solved. The definition of roles is a process more than an isolated activity. The definition of profiles goes along with the description of positions; they are two processes that we prefer calling “living processes”, they will allow the constant renewal and updating of the family business. These “living processes” are connected naturally with the creation of organizational charts during different stages of the family business. For example, the first organizational charts will be the ones that integrate the first family members to the company, however, when they integrate the family members it is very common not to describe each one of them, thus it is recommended that before incorporating family members or not family members to the next stage of the family business it is important to make an organizational chart and delimitate the functions that these new members will have in the business. One of the main and potential benefits of the definition of roles is the prevention of conflicts that can damage the company and the family. The company must be presented as a place with many challenges and growth opportunities; the children must know about the business possibilities in a globalized world. At home the family

Page 17
Academy of Strategic Management Journal, Volume 13, Number 2, 2014
must talk about the joy and achievements in the company. This is important and sometimes we read that several authors “forbid” the company owners to talk about business issues at home, but this is not appropriate; what it cannot be done is to take problems to home, this must be restricted to the labor space, but definitely the successes must be shared during family meals and toast for them (non-alcoholic beverages) with the purpose of sharing that energy and plenitude that will help the family communication. Limitations and future research First, the study cannot be thought as a comprehensive one because of the nature of the exploratory single case study. It is clear that this is one of the several limitations that the study has. Another limitation is that none of the results can be generalized; one natural research opportunity is to replicate the case and see what happen. It has been established that market orientation is related to the business performance and leadership in this case, but that relationship is still developing. Further studies could track any such development. Research is needed into cost-benefit ratios of any strategic orientations we mentioned in this paper. There is also need for further research into the extent to which family business are market orientated, as some components of market orientation seem better developed than others in emergent economies. The appropriate method would be to develop and apply a scale to measure strategic-orientation replicating methodologies that have been used successfully in other countries. One final conclusion is that strategic orientation research is still a fertile research field for those who try to better understand the improvement of the firm performance. Acknowledgements: The authors acknowledge the support received from Tecnológico de Monterrey on carrying out the research reported on this article.

Page 18
Academy of Strategic Management Journal, Volume 13, Number2, 2014
REFERENCES
Aloulou, W. and Fayolle, A. (2005), “A conceptual approach of entrepreneurial orientation within small business
context”, Journal of Enterprising Culture, 13(1), 21-45. Appiah-Adu, K. and Singh, S. (1998), “Customer orientation and performance: a study of SMEs”, Management
Decision, 36(6), 385-394. Baker, W.E. and Sinkula, J.M. (1999), “The Synergistic Effect of Market Orientation and Learning Orientation on
Organizational Performance”, Journal of the Academy of Marketing Science, 27(4), 411-427. Berry, M.M.J. (1996), “Technical entrepreneurship, strategic awareness and corporate transformation in small high-
tech firms”, Technovation, 16(9), 487-498. Berthon, J., Pitt, L., Abratt, R. and Nel, D. (2008), “Icon and Markor: Links and Performance in South African Firms”,
Journal of Applied Management and Entrepreneurship, 13(1), 15-34. Berthon, P., Hulbert, J.M. and Pitt, L. (1999), “To Serve or Create? Strategic Orientations toward Customers and
Innovation”, California Management Review, 42(1), 37-58. Berthon, P., Hulbert, J.M. and Pitt, L. (2004), “Innovation or customer orientation? An empirical investigation”,
European Journal of Marketing, 38(9/10), 1065-1090. Calantone, R.J., Cavusgil, S.T. and Zhao, Y. (2002), “Learning orientation, firm innovation capability, and firm
performance”, Industrial Marketing Management 31(6), 515-524. Carlock, R. and Ward, J. (2001). Strategic Planning for the Family Business: Parallel Planning to Unify the Family
and Business. USA: Palgrave Mc Millan Chrisman, J. J., Chua, J. H. and Sharma, P. (2005), “Trends and Directions in the Development of a Strategic
Management Theory of the Family Firm”. Entrepreneurship Theory and Practice, 29: 555–576. Covin, J.G. and Slevin, D.P. (1989), “Strategic Management of small firms in hostile and bening environments”,
Strategic Management Journal, 10(1), 75-87. Endeavor (2013), Retrieved from http://www.endeavor.org/model/ourmission Fritz, W. (1996), “Market orientation and corporate success: findings from Germany”, European Journal of
Marketing, 30(8), 59-74. Gao, G., Zhou, K. and Yim, C. (2007), “On what should firms focus in transitional economies? A study of the
contingent value of strategic orientations in China”, International Journal of Research in Marketing, 24(1), 3-15.
Gatignon, H. and Xuereb, J. (1997), “Strategic Orientation of the Firm and New Product Performance”, Journal of Marketing Research, 34(1), 77-90.
Ginsberg, A. and Venkatraman, N. (1985), “Contingency perspective of organizational strategy: a critical review of the empirical research”, Academy of Management Review, 10(3), 421-434.
Gristein, A. (2008), “The relationships between market orientation and alternative strategic orientations: A meta-analysis”, European Journal of Marketing, 42(1-2), 115-134.
Hakala, H. (2011), “Strategic Orientations in Management Literature: Three Approaches to Understanding the Interaction between Market, Technology, Entrepreneurial and Learning Orientations”, International Journal of Management Reviews, 13(2), 199-217.
Hult, G. T., Ketchen, D. J. (2001), “Does market orientation matter? A test of the relationship between positional advantage and performance”, Strategic Management Journal, 22(6), 899-906.
Hult, G. T., Ketchen, D. J. and Slater, S. F. (2005), “Market Orientation and Performance: an integration of disparate approaches”, Strategic Management Journal, 26(12), 1173-1181.
Izquierdo, C. and Samaniego, J. (2007), “How alternative marketing strategies impact the performance of Spanish museums”, Journal of Management Development, 26(9), 809-831.
Jeong, I., Pae, J.H. and Zhou, D. (2006), “Antecedents and consequences of the strategic orientation in new product development: The case of Chinese manufacturers”, Industrial Marketing Management, 35(3), 348-358.
Kaya, N. and Seyrek, I.H. (2005), “Performance Impacts of Strategic Orientations: Evidence from Turkish Manufacturing Firms”, The Journal of American Academy of Business, Cambridge, 6(1), 68-71.
Page 19
Academy of Strategic Management Journal, Volume 13, Number 2, 2014
Kholi, A.K. and Jaworski, B.J. (1990), “Market orientation: the construct, research propositions, and managerial implications”, Journal of Marketing, 54(2), 1-18.
Kidwell, R; Eddleeston, K; Cater III, J.J and Kellermanns, F (2013) “How one bad family member can undermine a Family Firm: The Fredo Effect” Business Horizons Vol 56, 5-12
Knotts, T.L., Jones, S. and Brown, K.L. (2008), “The effect of strategic orientation and gender on survival: a study of potential mass merchandising suppliers”, Journal of Developmental Entrepreneurship, 13(1), 99-113.
Lee, D.H. (2011), “The influence of strategic orientations on business performance and mediating role of entrepreneurial orientation relationship among technology, market orientations and business performance in Korean technology intensive SMEs”, PhD thesis, University of Portsmouth.
Li, J.J. (2005), “The Formation of Managerial Networks of Foreign Firms in China: The Effects of Strategic Orientations”, Asia Pacific Journal of Management, 22(4), 423-443.
Lumpkin, G.T. and Dess, G.G. (1996), “Clarifying the Entrepreneurial Orientation Construct and Linking It to Performance”, Academy of Management Review, 21(1), 135-172.
Marinov, M., Cox, T., Avlonitis, G. and Kouremenos, T. (1993), “Marketing Approaches in Bulgaria”, European Journal of Marketing, 27(11/12), 35-46.
Morgan, R.E. and Strong, C.A. (2003), “Business performance and dimensions of strategic orientation”, Journal of Business Research, 56(3), 163-176.
Nag, R., Hambrick, D.C. and Chen, M.-J. (2007), “What is strategic management, really? Inductive derivation of a consensus definition of the field”, Strategic Management Journal, 28(9), 935-955.
Narver, J. and Slater, S. (1990), “The effect of a market orientation on business profitability”, Journal of Marketing, 54(4), 20-35.
Noble, C.H., Sinha, R.K. and Kumar, A. (2002), “Market Orientation and Alternative Strategic Orientations: A Longitudinal Assessment of Performance Implications”, Journal of Marketing, 66(4), 25-39.
Paladino, A. (2009), “Financial Champions and Masters of Innovation: Analyzing the Effects of Balancing Strategic Orientations”, The Journal of Product Innovation Management, 26(6), 616-626.
Pearson G.J. (1993), “Business Orientation: Cliché or Substance?”, Journal of Marketing Management, 9(3), 233-243.
Peteraf, M. A. (1993), “The cornerstones of competitive advantages: a resource-based view”, Strategic Management Journal, 14(3), 179-191.
Renko, M., Carsrud, A. and Brännback, M. (2009), “The effect of Market Orientation, Entrepreneurial Orientation, and Technological Capability on Innovativeness: A Study of Young Biotechnology Ventures in The United States and in Scandinavia”, Journal of Small Business Management, 47(3), 331-369.
Salavou, H. (2005), “Do customer and Technology Orientations Influence Product Innovativeness in SMEs? Some new evidence from Greece”, Journal of Marketing Management, 21(3/4), 307-338.
Shaw, V. (2000), “The successful marketing strategies of German companies in the UK”, European Journal of Marketing, 34(1/2), 91-106.
Shipley, D., Graham, H., Beracs, J., Fonfara, K. and Kolos, K. (1995), “Marketing organizations in Hungarian and Polish firms: part 1”, Journal of Marketing Practice, 1(2), 39-54.
Sinkula, J.M., Baker, W.E. and Noordewier, T. (1997), “A framework for market-based organizational learning: Linking values, knowledge, and behavior”, Journal of the Academy of Marketing Science, 25(4), 305-318.
Slater, S. and Narver, J. (1994), “Does Competitive Environment Moderate the Market Orientation-Performance Relationship?”, Journal of Marketing, 58(1), 46-55.
Suh, T. (2005), “Exploring a Global Pattern of E-Business Activities and Strategic Orientation”, The Journal of American Academy of Business, Cambridge, 6(1), 309-314.
Trainor, K.J., Rapp, A., Beitelspacher, L.S. and Schillewaert, N. (2011), “Integrating information technology and marketing: An examination of the drivers and outcomes of e-
Marketing capability”, Industrial Marketing Management, 40(1), 162-174. Tranfield, D., Denyer, D. and Smart, P. (2003). “ Towards a methodology for developing evidence informed
management-knowledge by means of systematic review” British Journal of Management, 14(3), 207–222. Venkatraman, N. (1989), “Strategic Orientation of Business Enterprises: The Construct, Dimensionality, and
Measurement”, Management Science, 35(8), 942-962.
Page 20
Academy of Strategic Management Journal, Volume 13, Number2, 2014
Voss, G.B. and Voss, Z.G. (2000), “Strategic Orientation and Firm Performance in an Artistic Environment”, Journal of Marketing, 64(1), 67-83.
Wernerfelt, B. (1984), “A resource-based view of the firm”, Strategic Management Journal, 5(2), 171-180. Yin, R. K., (2009), “Case study research. Design and methods”, Thousand Oaks, Ca. Sage Publications. Zaharieva, E., Gorton, M. and Lingard, J. (2004), “An evaluation of Marketing Practices and Market Orientation in
the Bulgarian Wine Industry”, Post-Communist Economies, 16(2), 229-243. Zhou, K.Z., Yim, C.K. and Tse, D.K. (2005), “The Effects of Strategic Orientations on Technology- and Market-
Based Breakthrough Innovations”, Journal of Marketing, 69(2):42-60
Page 21
Academy of Strategic Management Journal, Volume 13, Number 2, 2014
IMPACT OF MANAGEMENT BASICS ON EMPLOYEE ENGAGEMENT
Bobby Medlin, University of Arkansas-Fort Smith
Kenneth W. Green, Jr., Southern Arkansas University
ABSTRACT Great management has always been about performance. Great managers get great performance from people. Over the past 100 years, countless approaches, practices, programs, ideas, strategies, fads, etc. have been developed and implemented by managers as ways to improve the performance of employees. During the past 15 years, few if any management topics or ideas have received more attention and discussion in the management literature than employee engagement. Countless numbers of articles or studies have been written or conducted regarding engagement. These range from attempts to explain the construct to providing evidence of the impact and benefits on enhancing or improving the level of engagement of workers. In addition, there have been numerous attempts to offer information regarding exactly how to improve employee engagement. This study attempts to add to the body of knowledge in this particular area. Specifically, the study examines the influence and impact that the basic principles of management and the management process have on employee engagement.
PURPOSE
With the importance of employee engagement well established in the management literature, it becomes important to identify management practices that lead to improved employee engagement. The purpose of this study is to empirically investigate the impact of the management basics (management principles and management process) on employee engagement.
DESIGN/METHODOLOGY/APPROACH The management principles and management process are hypothesized as positive antecedents to employee engagement. Using survey data collected from 166 full-time employees in the southern United States, the antecedent relationships are assessed following a partial least squares statistical methodology.

Page 22
Academy of Strategic Management Journal, Volume 13, Number2, 2014
FINDINGS
Both the management principles and the management process positively and directly impact employee engagement.
RESEARCH IMPLICATIONS/LIMITATIONS
The study sample is a convenience sample, rather than a random sample, which hampers the ability to generalize the study results.
PRACTICAL IMPLICATIONS
Organizations that adhere to the management principles and follow the management process are more likely to experience high levels of employee engagement.
SOCIAL IMPLICATIONS Engaged employees are both efficient and effective in the operation of organizational processes that produce products and services that meet customer demands. Management practices such as the management principles and the management process that support employee engagement serve to eliminate the waste of organizational resources.
ORIGINALITY/VALUE
The importance of employee engagement is well established. This study establishes the management principles and the management process as two approaches that managers can adopt and implement that will lead to improved employee engagement.
KEY WORDS
Employee engagement, management principles, management process, partial least squares
PAPER TYPE
Research paper

Page 23
Academy of Strategic Management Journal, Volume 13, Number 2, 2014
INTRODUCTION
Great management has always been about performance. Effective managers get great performance from people. Over the past 100 years, countless approaches, practices, programs, ideas, strategies, fads, etc. have been developed and implemented by managers as ways to improve the performance of employees. Stanley (2012) discusses the importance of building on the foundations of management delineated by such management greats as Fayol and Taylor. In particular, Fayol’s (1916) work to delineate the management principles and describe the management functions/process serves as the foundation of great management still today (Spatig, 2009; Brunsson, 2008).
More recently, few management topics have received more attention and discussion in the management literature than employee engagement (Medlin and Green, 2009). There is significant evidence that engagement leads to improved performance (Medlin and Green, 2009). With this in mind, it becomes important to identify antecedents to engagement. Specifically, in this study, we examine the impact that adherence to the traditional management principles and management process originally identified and described by Fayol (1916) on employee engagement. We theorize a structural model that incorporates the management principles and the management process as antecedents to employee engagement, collect data from a convenience sample of 166 full-time employees, and analyze the data following a partial least squares structural equation modeling methodology.
A review of the literature and discussion of the study hypothesis follows in the next section. A discussion of the methodology employed the structural equation modeling results. Finally, a conclusions section incorporating discussions of the contributions of the study, limitations of the study, recommendations for future research, and managerial implications is provided.
LITERATURE REVIEW
The principles of management and the management process are two topics that have been explored and discussed in the management literature for over a century (Fayol, 1916; Stanley, 2012). Fayol’s work related to the principles and process remains applicable today (McLean, 2011; Brunsson, 2008). Modern approaches to effective management depend to some extent upon the foundation provided by these two concepts (Rodrigues, 2001; Stanley, 2012). Employee engagement, a much more recently identified management construct, has probably received as much attention in the management literature over the past 15 years as any other single management approach to improving individual and organizational performance. An ABI/Inform search using the term employee engagement results in over 94,500 citations. Building upon the research in the areas of job satisfaction and organizational commitment, employee engagement has been explored by both academicians and practitioners as a vital mechanism toward improved performance (Medlin and Green, 2010; Green and Medlin, 2009).
Our general purpose is to identify managerial actions that improve employee engagement. More specifically, we propose that adherence to the principles of management and adoption of the management process will lead to improved employee engagement. In our review of the associated

Page 24
Academy of Strategic Management Journal, Volume 13, Number2, 2014
literature, we did not find any empirical investigations of the relationships among the principles, process, and engagement constructs. A description of the structural model under investigation here follows along with discussions of the literature relating to each of the constructs and logical support for the two study hypotheses. Theoretical model
Violations of the management principles place unnecessary frustrate employees impeding their progress and success. Not adhering to the steps in the management process results in employees who do not know what is expected of them also impeding progress and success. We propose that adherence to both the management principles and the management process will lead to improved employee engagement. The theoretical model is illustrated in Figure 1. The model includes three constructs: management principles, management process, and employee engagement. Both the management principles (hypotheses 1) and the management process (hypotheses 2) are hypothesized as positively associated with employee engagement.
Figure 1
Principles, Process, and Engagement Model with Hypotheses
Employee engagement
Since the Gallup Organization’s development of the Q12 (a survey instrument to measure employee engagement) over a decade ago (Buckingham and Coffman, 1999), articles in the area of employee engagement have appeared in great abundance in the management literature. These range from defining the concept to the benefits of increased employee engagement to ways to improve the level of engagement. The primary driver of this attention to engagement has undoubtedly been overwhelming evidence that high levels of employee engagement significantly impact employee and organizational performance. One recent study (among volumes of practitioner and academic articles or studies) by WorkUSA (2008/2009) found that highly engaged employees work at firms with 26 percent higher revenue per employee, 13 percent higher returns
Management Principles
Management Process
Employee Engagement
H1: (+)
H2: (+)

Page 25
Academy of Strategic Management Journal, Volume 13, Number 2, 2014
to shareholders over five years, and a 50 percent higher market premium--suggesting that higher employee engagement significantly leads to improved business performance.
Trahant (2009) states that the research is clear that “highly-engaged employees are twice as likely as less-engaged workers to be top performers in their organizations; three-quarters of highly engaged employees exceed or far exceed job performance expectations”. As was the case with organizational performance, volumes of evidence exist that indicate the same basic conclusions. Couple the organizational and individual performance findings with overwhelming evidence that the workforce is heavily represented by employees who are not engaged or disengaged and it’s easy to understand the increased focus on the construct.
The 2009 Gallup Employee Engagement Index (Fox, 2010) found that 33 percent of workers are engaged, 49 percent are not engaged, and 18 percent are actively disengaged. Note: The study identified engaged employees as those who “work with passion and feel a profound connection to their company, and non-engaged workers as those who have essentially checked out and sleepwalk through workdays” (Fox, 2010). According to a TowersPerrin (2009) study, only 21 percent of the global workforce is engaged while 38 percent are disengaged. Data from the U.S. Merit Systems Protection Board (2008) indicated that 35.3 percent of U.S. workers are engaged, 47.2 percent somewhat engaged, and 17.5 percent not engaged. Definitions of engagement have primarily been offered by consulting houses or in practitioner publications. Perhaps the most extensively used definition of an engaged worker was offered by the Gallup organization. They define an engaged employee as a worker who is fully involved in and enthusiastic about his or her work (Tritch, 2003). HR Magazine’s February 2004 cover story (Bates, 2004) focused on employee engagement and its role in the workplace. Engagement was essentially defined as “an innate human desire to contribute something of value in workplace.” Crawford (2006) defined engagement as a measure of the energy and passion workers have for their organization. The article stressed clearly that diminished individual performance was a consequence of lack of employee engagement. Gubman (2004) defined engagement as a heightened personal attachment to the organization.
Harley, Robinson, and Lee (2005), while not specifically defining the term, did identify a profile of an “engaged work” and also listed various aspects of engagement that have been used within organizations the measure engagement. Konrad (2006) discussed engagement as having a cognitive, an emotional, and a behavioral aspect. Seijts and Crim (2006) defined an engaged worker as one who is “fully involved in, and enthusiastic about, his or her work.” Shuck and Wollard (2010) defined engagement as “an individual employee’s cognitive, emotional, and behavioral state directed toward desired organizational outcomes.”
In addition to articles offering definitions/explanations of engagement, the literature offers a plethora of information regarding ways to improve engagement (Fenci and Masarech, 2008; Jakobson, 2008; Cartwright and Holmes, 2006; Konrad, 2006; Robison, 2006; Seijts and Crim, 2006; Richman, 2006; Harley, et al., 2005; Sensis, 2005; Erickson, 2004; Tritch, 2003). Numerous studies have linked high levels of employee engagement to improved employee or organizational performance (BlessingWhite Research, 2011; Christian, et al., 2011; Chalofsky, 2010; Shuck, Reio, and Rocco, 2011; Rich, LePine, and Crawford, 2010; Macey and Schneider, 2008; Smythe, 2008; Walters, 2008; Saks, 2006; Chang, 2006; Crawford, 2006; Echols, 2005; Crabtree, 2004; Tasker, 2004; Luthans and Peterson, 2003; Tritch, 2003; Harter, Schmidt, and Hayes, 2002;

Page 26
Academy of Strategic Management Journal, Volume 13, Number2, 2014
Maslach and Leiter, 2001). Grates (2009) summarizes that six principles have been shown to improve engagement at companies of all size. These include encouraging transparency, emphasizing multi-way interaction, sharing all news whether good or bad, integrating with other functions, framing the narrative, and understanding today’s business world. Management principles
The principles of management have been perhaps the foundational underpinning of the study of management since the early 1900’s—becoming almost synonymous with the term management (Schimmoellerc, 2012). As Yoo, Lemak, and Choi (2006) point out, Fayol viewed principle as “the code that represented the sum total of truths at any given moment,” providing a general management perspective for practitioners that were flexible and adaptable to change and need.
Articles and studies by academicians continue to address Fayol’s work. Rodrigues (2001) essentially concluded that, while many organizations’ application of the principles is different than originally described, the principles still have value. It was also pointed out that many small organizations continue to apply these principles in a way that greatly resembles Fayol’s original description. Fells (2000) pointed out that even though nearly 100 years have passed since Fayol’s original writings in the area of management principles, they still have significant value to managers today—and should not be ignored.
Clem and Mujtaba (2010) examined a very successful (in terms of managing effectively in the context of environmental change) organization and concluded that adherence to a number of Fayol’s principles have been valuable contributors in this success. Specifically, these include equity, order, remuneration of personnel, and stability of tenure of personnel. As pointed out in the previous section, employee engagement has been shown to be a vital element toward improving employee performance. A natural question to ask is this: will adherence to Fayol’s (1916) 14 principles of management serve to improve the engagement of employees? Management process
For the purpose of this study, the management process relates directly to the functions of management (planning, organizing, commanding, coordinating, and controlling) as described by Fayol (1916) . It also combines Locke’s goal setting theory (Locke, 1968) and Drucker’s MBO (Drucker, 1954). The process essentially requires the completion of four distinct activities on a regular, on-ongoing basis. These steps essentially include subordinates meeting with supervisors to discuss performance and set objectives; supervisors providing resources and support; supervisors and subordinates meeting to discuss completion status for objectives and to provide any needed additional resources or support; and another meeting as described in step one to continue the ongoing process.

Page 27
Academy of Strategic Management Journal, Volume 13, Number 2, 2014
Hypotheses
Because of the evidence that employee engagement leads to improved performance, it is important to identify antecedents to employee engagement. We theorize a model (Figure 1) in which the management principles and management process are antecedent to employee engagement. We did not find evidence in our review of the literature that these associations have been previously empirically assessed.
Managers who embrace and adhere to the principles of management create an organizational environment that is free of roadblocks to and conducive to the individual success of each employee. For example, adherence to the ‘unity of direction’ principle ensures that employees operate in an environment where the mission of the organization is well articulated and clear to all. This clarity leads to employees who are fully aware and fully focused on desired organizational outcomes. As another example, adherence to the ‘subordination of individual interests to the general interest’ principle ensures that employees are focused on organizational objectives and processes required for organizational success rather than on external individual goals. Employee engagement is supported by this subordinate of individual interests in favor of organization interests during work hours. We contend that, as a result of the adherence to the principles of management, employees are more fully engaged in the processes necessary for the organization to fulfill its stated mission.
H1: Adherence to the basic principles of management is a significant, positive predictor of employee engagement.
Managers who implement the management process ensure that their employees know what
is expected of them and have the resources necessary to fulfill those expectations. Further, through the process, managers work together with employees to periodically monitor progress toward organizational objectives making necessary adjustments as plans unfold. Employees operating within the context of the management process are focused on what the organization expects from them. Medlin and Green (2009) found a positive correlation between goal setting (a component of the management process) and employee engagement. We contend, therefore, that this focus and provision of necessary resources supports higher levels of employee engagement.
H2: Adherence to the management process is a significant, positive predictor of employee engagement.
METHODOLOGY Sample
Data were collected from a sample of 166 full-time employees in the southern United States. Students in senior level business strategy classes were asked to identify potential respondents and have those respondents complete the study survey. Fifty-nine percent of the

Page 28
Academy of Strategic Management Journal, Volume 13, Number2, 2014
respondents are compensated primarily on an hourly basis, 30% are primarily compensated on a salaried basis, and the remaining 3% are compensated primarily on a commission basis. Table 1 provides a more detailed profile of the respondents. The sample is relatively diverse as intended. Because the sample is a convenience sample, it is not possible to assess non-response bias.
It is important to assess common method bias when data are collected single respondents
through a survey questionnaire. Lindell and Brandt (2000) recommend that the smallest correlation among the variables be used as a proxy for common method variation. Following this approach, the smallest correlation among the study variables for which data were collected is .278 between the organizational behavior modification and organizational commitment. The smallest correlation among the relationships specified in the structural model is .664 for management principles and employee engagement. Substituting these correlations into the formulas provided by Malhotra et al. (2007) the computed z-score is 8.11. This computed z-score corresponds with significance at the .01 level. Adjusting for common method variance using the smallest correlation (.430), the smallest correlation among the hypothesized relationships (.600) remains significantly
Table 1 Sample Demographics Summary
Number Percent Full-time employees responding 166 100.00 Compensation basis: Hourly 95 57.2 Salaried 65 39.2 Commission 5 3.0 No Response 1 .6 Organization Type: Agriculture, Forestry, Fishing 2 1.2 Mining 1 .6 Construction 8 4.8 Manufacturing 29 17.5 Transportation, Communications, Electric, Gas, & Sanitary Services
16 9.6
Wholesale Trade 2 1.2 Retail Trade 12 7.2 Finance, Insurance, Real Estate 30 18.1 Local, State, or Federal Government 20 12.0 Lodging, Personal, & Business Services 6 3.6 Other 36 21.7 No Response 4 2.4 Distinct Job Titles 140 Distinct Products 127 Average Year in Current Position 7.10

Page 29
Academy of Strategic Management Journal, Volume 13, Number 2, 2014
different from zero at the .01 level. Based on the results of the proxy test, problems associated with common method bias are not considered significant (Lindell and Whitney, 2001). Measurement scales
The management principles scale was developed based on the work of Fayol (1916). The management process scale was developed based on the works of Fayol (1916), Drucker (1954), and Iacocca (1984). Both the principles and process scales were tested using a stage one sample. The employee engagement scale was previously developed and assessed by Buckingham and Coffman (1999). The measurement scales are displayed in Appendix I. Statistical analysis
A partial least squares (PLS) structural equation modeling (SEM) statistical methodology is used to assess the relationships in the model. PLS/SEM is selected because the focus is on hypothesis testing and prediction rather than theory development (Hair et al., 2011). The general process recommended by Wetzels et al. (2009) for PLS models with second-order constructs is followed. Specifically, SmartPLS 2.0 software developed by Ringle, Wende, and Will (http://SmartPLS.de) is used to conduct the PLS analysis.
RESULTS Measurement scale assessment
Because the measurement scales are either taken from previous research (Buckingham and Coffman, 1999) or from original sources in the management literature (Fayol, 1916; Drucker, 1954; Iacocca, 1984), the scales are assumed to exhibit sufficient content validity. Convergent validity is assessed by reviewing the standardized loadings for each of the first order constructs with loadings greater than .70 indicating sufficient convergent validity (Chaing et al., 2012). The standardized factor loadings are displayed in Table 2. It was necessary to remove some individual items from the measurement scales to achieve sufficient convergent validity. Those items are noted in Appendix 1. All remaining items have loadings that exceed the .70 limit with the exception of PRIN5 in the management principles scale that has a loading of .67. To assess for discriminant validity, the square root of the average variance extracted value for each construct is compared to the correlations with other constructs with square root values greater than the correlations signifying sufficient discriminant validity (Wetzel et al., 2009). Square root values and construct correlations are displayed in Table 3. The square root values for each of the constructs exceed correlation values with other constructs exhibiting sufficient discriminant validity.

Page 30
Academy of Strategic Management Journal, Volume 13, Number2, 2014
Table 2 Factor loadings for measurement items
Construct/Measures Construct/Measures Management Principles PRIN1 .75 PRIN2 .74 PRIN4 .81 PRIN5 .67 PRIN7 .81 Management Process PROC1 .80 PROC2 .90 PROC3 .86 PROC4 .85 Employee Engagement EE2 .71 EE3 .73 EE5 .73 EE6 .75 EE7 .79 EE8 .82 EE9 .74 EE12 .77
Table 3 Reliability Scores and Correlations among Latent Constructs
(CA Cronbach’s Alpha, CR Composite Reliability, AVE Average Variance Extracted, AVE square root in bold on diagonal)
CA CR AVE PRIN PROC EE Principles of Management (PRIN) .82 .87 .58 .76 Management Process (PROC) .87 .91 .73 .69 .85 Employee Engagement (EE) .89 .91 .57 .72 .70 .76
Scale reliability is assessed based on Cronbach’s alpha, composite reliability, and average
variance extracted values (see Table 2). All alpha, composite reliability, and average variance extracted values exceed the respective recommended minimums of .70, .70, and .50 recommended by Garver and Mentzer (1999) demonstrating sufficient scale reliability. Structural model assessment
Structural model results are presented in Figure 2. Bootstrapping is used to assess the significance levels of the standardized coefficients. As Hair et al. (2011) recommend, the number

Page 31
Academy of Strategic Management Journal, Volume 13, Number 2, 2014
of samples for the bootstrapping procedure is 5,000 with the number of observations set to 166. The global fit measure (Tenenhaus et al., 2005) for the model is .65 which exceeds the cutoff value for large effect sizes of .36, as recommended by Wetzels et al. (2009). The R2 value for employee engagement is .60. R2 values between .50 and .75 indicate that the model has a moderately strong explanatory capability (Hair et al., 2011). Both management principles and management process directly impact employee engagement. The standardized coefficient of .46 for hypothesis 1 (PRINEE) is positive and significant at the .01 level. The standardized coefficient of .39 for hypothesis 2 (PROCEE) is positive and significant at the .01 level.
Figure 2 Structural Results - Standardized Coefficients and (t-values)
The results support both hypothesis 1 and hypothesis 2. Managers who operate their
organizations in accordance with the principles of management and the management process can expect improved employee engagement. Such adherence to the management principles and management process represent actions that managers can take in an effort to enhance engagement.
CONCLUSIONS
We identify the principles of management and the management process as possible antecedents to employee engagement. The empirical results support our proposition. Organizations that adhere to the principles and operate in accordance with the management process exhibit higher levels of employee engagement. Combining these results with the overwhelming evidence that engagement leads to improved performance provides practicing managers with the evidence needed to tie the principles and process to engagement and engagement to performance. These results serve to support our argument that the original work of Fayol (1916) related to the management principles and the management process (functions) remain as relevant to successful management today as they did at the time of Fayol’s writing.
Management Principles
Management Process
Employee Engagement
.46 (6.40)
.39 (5.04)
R2 = .60

Page 32
Academy of Strategic Management Journal, Volume 13, Number2, 2014
Limitations of the study
The data supporting the statistical analysis are derived from a convenience sample, rather than a random sample, which may limit the ability to generalize from the results. The convenience sample procedure also precludes assessment for non-response bias. Additionally, all study measures draw on the perceptions of the respondents. As is always the case in survey research, there is concern related to how well these employee perceptions match reality within their organizations. Interpretation of the results should be made considering these limitations. Future research
We recommend that future research aim to further evaluate the impact of the management principles and management process on other human resource outcomes such as turnover, absenteeism, organizational commitment, and job satisfaction. Because this is the first empirical study to investigate the relationships among the management principles, management process, and employee engagement constructs, it is necessary that this study be replicated with additional samples to validate the results. Additionally, it will be necessary to assess the model within the context of samples from different countries to see if the results can be generalized outside the United States. Researchers might also consider evaluating possible differences between genders and within various age categories. Managerial implications
Managers work to identify and implement programs that enhance the engagement levels of the employees under their supervision. Managers can have confidence that their efforts to enhance engagement through adherence to the management principles and implementation of the management process originally identified and delineated by Fayol (1916) will result in improved employee engagement which has been previously linked to employee performance (Medlin and Green, 2009). The management principles are designed to remove roadblocks to employee success. Adherence to the principles results in the development of a work environment that is conducive to employee success. Adoption of the management process ensures that each employee understands his/her organizational objectives and has the necessary resources to support attainment of the objectives. Employees who know what is expected of them and who have the necessary resources to fulfill those expectations are more engaged in their work and with their organizations. Employees working within an environment that is absent roadblocks and who know what they are expected to accomplish are more engaged and more productive. To summarize, Fayol’s management principles and management process are still valid today. We recommend that managers desiring to improve employee engagement and thereby employee performance employ both the principles and the process.
Page 33
Academy of Strategic Management Journal, Volume 13, Number 2, 2014
REFERENCES Bates, S. (2004), “Getting engaged”, HR Magazine, Vol. 49 No. 2, pp. 44-51. BlessingWhite Research (2011), “Employee engagement report 2011: beyond the numbers: a practical approach
for individuals, managers, and executives.” Retrieved from http:// www.blessingwhite.com/content/reports/BlessingWhite_2011_EE_Report.pdf.
Brunsson, K. (2008), “Some effects of Fayolism”, International Studies of Management & Organization, Vol. 38 No. 1, pp. 30-47.
Buckingham, M. and Coffman, C. (1999), First, Break All the Rules, Simon and Schuster, New York, NY. Cartwright, S. and Holmes, N. (2006), “The meaning of work: the challenge of regaining employee engagement and
reducing cynicism”, Human Resource Management Review, Vol. 16 No. 2, pp. 199-208. Chalofsky, N. (2010), Meaningful Workplaces, Jossey-Bass, San Francisco, CA. Chang, J. (2006), “Rules of engagement”, Sales and Marketing Management, Vol. 158 No. 3, p. 18. Christian, M. S., Garza, A. S., Slaughter, J. E. (2011), “Work engagement: a quantitative review and test of its
relations with and contextual performance”, Personnel Psychology, Vol. 64 No. 1, pp. 89-136. Clem, A. and Mujtaba, B. (2010), “Infusing value: application of historical management concepts at a modern
organization”, Journal of Management and Marketing Research, Vol. 4 No. 1, pp. 1-15. Crabtree, S. (2004), “Getting personal in the workplace: are negative relationships squelching productivity in your
company?”, The Gallup Management Journal, Retrieved from http://govleaders.org/gallup_article_getting_personal.htm.
Crawford, N. (2006), “Managing employment engagement”, Canadian Manager, Vol. 31 No. 1, pp. 17-18. Drucker, P. F. (1954). The Practice of Management. Harper and Row, New York, NY. Erickson, B. (2004), “Nature times nurture: how organizations can optimize their people’s contributions,” Journal
of Organizational Excellence, Vol. 24 No. 1, pp. 21-30. Fayol, H. (1916), General and Industrial Management. Davis S. Lake, Publishers, Belmont, CA. Fells, M. (2000), “Fayol stands the test of time”, Journal of Management History, Vol. 6 No. 8, pp. 345-349 Fenci, W. and Masarech, M. A. (2008), “Stop spinning your wheels: increase employee engagement at your
company”, Workspan, Vol. 51 No. 9, p. 30-34. Fox, A. (2010), “Raising engagement”, HR Magazine, Vol. 55 No. 5, pp. 34-40. Garver, M. S. and Mentzer, J. T. (1999), “Logistics research methods: employing structural equation modeling to
test for construct validity”, Journal of Business Logistics, Vol. 20 No. 1, pp. 33-57. Green Jr., K. W. and Medlin, B. (2010), “The impact of recession-based workplace anxiety”, Journal of
Management and Enterprise Development, Vol. 9 No. 3, pp. 213-232. Grates, G. (2009), “Engagement: why it shouldn’t be forgotten”, Strategic Communication Management, Vol. 13
No. 1, p. 7. Gubman, E. (2004), “From engagement to passion for work: the search for the mission person”, Human Resource
Planning, Vol. 27 No. 3, pp. 42-46. Hair, J. F., Ringle, C. M., and Sarstedt, M. (2011), “PLS-SEM: indeed a silver bullet”, Journal of Marketing Theory
and Practice, Vol. 19 No. 2, pp. 139-151. Harley, A., Lee, D., and Robinson, D. (2005), “How 02 built the business case for engagement”, Strategic HR
Review, Vol. 4 No. 6, pp. 24-27. Harter, J. K., Schmidt, F. L., and Hayes, T. L. (2002), “Business-unit-level relationship between employee
satisfaction, employee engagement, and business outcomes: a meta-analysis.” Journal of Applied Psychology, Vol. 87, pp. 268-279.
Iacocca, Lee A., (1984), Iacocca, An Autobiography. Bantam Books, New York, NY, Jakobson, L. (2008), “Getting an A in engagement”, incentivemag.com, Vol. 182 No. 8, pp. 16-24. Konrad, A. (2006), “Engaging employee through high-involvement work practices”, Ivey Business Journal,
March/April, pp. 1-6. Lindell, M. K. and Brandt, C. J. (2000), “Climate quality and climate consensus as mediators of the relationship
between organizational antecedents and outcomes”, Journal of Applied Psychology, Vol. 85 No. 1, pp. 331-348.
Page 34
Academy of Strategic Management Journal, Volume 13, Number2, 2014
Lindell M. K. and Whitney, D. J. (2001), “Accounting for common method variance in cross-sectional research designs”, Journal of Applied Psychology, Vol. 86 No. 1, pp. 114-121.
Locke, E. (1968), “toward a theory of task motivation and incentives”, Organizational Behavior and Human Performance, Vol. 3 No. 2, pp. 157-89.
Luthans, F. and S. Peterson (2002), “Employee engagement and manager self-efficacy: implications for managerial effectiveness,” The Journal of Management Development, Vol. 21 Nos. 5/6, pp. 376-387.
Macey, W. H. and Schneider, B. (2008), “The meaning of employee engagement”, Industrial and Organizational Psychology, Vol. 1 No. 1, pp. 3-30.
Malhotra, N. K., Patil, A., and Kim, S. S. (2007), “Bias breakdown”, Marketing Research, Vol. 19 No. 1, pp. 24-29. Maslach, C. and Leiter, M. P. (2001), “Job burnout”, Annual Review of Psychology, Vol. 52, pp. 397-422. McLean, J. (2011), “Fayol - standing the test of time,” Manager: British Journal of Administrative Management,
Vol. 74, pp. 32-33. Medlin, B. and Green, K, W. (2009), “The impact of employee optimism and workplace engagement on employee
performance”, Industrial Management and Data Systems, Vol. 109 No. 7, pp. 943-956. Rich, B. L., LePine, J. A., and Crawford, E. R. (2010), “Job engagement: antecedents and effects on job
performance,” Academy of Management Journal, Vol. 53 No. 3, pp. 617-635. Richman, A. (2006), “Everyone wants an engaged workforce how can you create it?”, Workspan, Vol. 49, pp. 36-
39. Rodrigues, C. (2001), “Fayol’s 14 principles of management then and now: a framework for managing today’s
organizations effectively”, Management Decisions, Vol. 39 No. 10, pp. 880-889. Saks, A. M. (2006), “Antecedents and consequences of employee engagement”, Journal of Managerial Psychology,
Vol. 21, pp. 600-619. Schimmoellerc, L. (2012), “Henri Fayol and zero tolerance policies”, Review of International Comparative
Management, Vol. 13 No. 1, pp. 30-36. Seijts, G., and Crim, D. (2006), “What engages employees the most or, the ten c’s of employee Engagement”, Ivey
Business Journal, March/April, pp. 1-5. Sensis, G. E. (2005), “Building employee engagement at Sensis”, Strategic Management Review, Vol. 4 No. 2, pp.
19. Shuck, B., Reio, T., and Rocco, T. (2011), “Employee engagement: an antecedent and outcome approach to model
development”, Human Resource Development International, Vol. 14 No. 4, pp. 427-445. Shuck, B. and Wollard K. (2010), “Employee engagement and HRD: a seminal review of the foundations”, Human
Resource Development Review, Vol. 9 No. 1, pp. 89-110. Smythe, J. (2008), “Engaging employees to drive performance”, Communication World, Vol. 25 No. 3, pp. 20-22. Spatig, L. (2009), “Rediscovering Fayol: parallels to behavioralist management and transformational leadership”,
Proceedings of The Northeast Business & Economics Association, January, pp. 196-199. Stanley, T. L. (2012), "Management: a journey in progress", Supervision, Vol. 73 No. 8, pp. 18-21. Tasker, J. (2004), “Engagement equals productivity”, Personnel Today, October 5, pp. 8-9. TowersPerrin Consulting (2009), “Employee engagement underpins business transformation,” September, pp. 1-5. Trahant, B. (2009), “Driving better performance through continuous employee engagement”, Public Manager, Vol.
38, No. 1, pp. 54-58. Tritch, T. (2003), “Engagement drives results at new century”, Gallup Management Journal, September 11, p. 4. U.S. Merit Systems Protection Board (2008), “The power of federal employee engagement,” September, pp. 1-68 Wetzels, M., Odekerken-Schröder, G., and van Oppen, C. (2009), “Using PLS path modeling for assessing
hierarchical construct models: guidelines and empirical illustration”, MIS Quarterly, Vol. 33 No. 1, pp. 177-195.
Walters, D. (2008), “How I made a difference…employee engagement,” Personnel Today, Sept. 23, p. 33. Watson Wyatt Worldwide (2008/2009), “ Driving business results through continuous engagement,” WorkUSA
survey report. Yoo, J., Lemak, D., and Choi, Y. (2006), “Principles of management and competitive strategies: using Fayol to
implement Porter”, Journal of Management History, Vol. 12, No. 4, pp. 352-368.

Page 35
Academy of Strategic Management Journal, Volume 13, Number 2, 2014
Appendix I
Measurement ScalesManagement Principles Please indicate the extent to which you agree or disagree with each statement as it relates to your workplace (1= strongly disagree, 7 = strongly agree).
1. Workers in my organization specialize in particular tasks to produce more and better work with the same effort. 2. Disciplinary sanctions are fairly applied at work. 3. *I report directly to only one supervisor. 4. Everybody in this organization is focused on the same mission. 5. In my organization, the interest of one employee or group of employees does not prevail over that of the organization. 6. *My co-workers and I are compensated fairly for the work that we do. 7. My co-workers and I have sufficient authority to effectively fulfill our responsibilities.
Management Process Please indicate the extent to which you agree or disagree with each statement as it relates to your workplace (1= strongly disagree, 7 = strongly agree).
1. I meet periodically during the year with my supervisor to set my organizational objectives. 2. My supervisor delegates the authority to me that is necessary for me to accomplish my organizational objectives. 3. My supervisor provides resources and other support necessary for me to accomplish my organizational objectives. 4. My supervisor periodically assesses my performance based on accomplishment of my organizational objectives.
Employee Engagement Please indicate the extent to which you agree or disagree with each statement as it relates to your workplace (1= strongly disagree, 7 = strongly agree).
1. *I know what is expected of me at work. 2. I have the materials and equipment I need to do my work. 3. At work, I have the opportunity to do what I do best every day. 4. *In the last seven days, I have received recognition or praise for doing good work. 5. My supervisor, or someone at work, cares about me as a person. 6. There is someone at work who encourages my development. 7. At work, my opinions seem to count. 8. The mission/purpose of my organization makes me feel my job is important. 9. My co-workers are doing quality work. 10. *I have a best friend at work. 11. *In the last six months, someone at work has talked to me about my progress. 12. This past year, I have had opportunities at work to learn and grow. * Items removed to achieve dimensionality

Page 36
Academy of Strategic Management Journal, Volume 13, Number2, 2014

Page 37
Academy of Strategic Management Journal, Volume 13, Number 2, 2014
A STRATEGY FOR CLIMBING THE ORGANIZATIONAL LADDER
Jan P. Muczyk, Cleveland State University
Terry R. Adler, New Mexico State University
ABSTRACT While the leadership literature constitutes an embarrassment of riches, most of it focuses on the interaction of the leader with his/her subordinates, i.e., it is downward looking. However, it is superiors who decide which candidate gets the promotion. Hence, those candidates need to know what their superiors are looking for. Yet, there is a dearth of literature that focuses upward, and that would provide direction to those organizational members seeking advancement through the organizational hierarchy. Superiors are seeking attributes that make for successful managers, and leadership as it is narrowly defined – motivating and directing subordinates – is only one attribute of an effective manager. Thus, the purpose of this effort is to put in perspective all of the qualities that enhance promotability, thereby providing aspirants a viable strategy for climbing the organizational ladder. It also provides organizations the typical elements that organizations employ to construct their own filter for identifying high potential candidates.
INTRODUCTION While there are numerous articles and books on the topic of “leadership,” both academic and practitioner oriented addressing the relationship of the leader vis-à-vis the subordinates (Muczyk & Adler, 2002), there is a relative dearth of literature regarding the relationship of the leader with respect to his/her superiors. Of course, it is the superiors who decide which person is promoted, and there are many organizational members who desire promotions and would appreciate practical advice on the subject of climbing the organizational ladder – a common definition of organizational success. It is true that the interaction of the leader with subordinates is a partial determinant of promotability, but many other factors also come into play. Organizations do not advance their personnel randomly, and luck cannot be counted on. Practically every organization has an identifiable filter through which persons who wish to attain promotions must pass. While each organization’s filter is different in terms of its specific components and the weights placed on each component, it is still possible to identify and discuss the panoply of the most common factors that are frequently part of the filters that most organizations employ. Superiors when considering promotability of subordinates examine managerial attributes of the candidates, where leadership is just one of ten managerial roles, although arguably the most important one (Mintzberg, 1973). Yet, there is a void in the literature pertaining to how individuals can better prepare themselves for promotion. The principal purpose of this effort is to put all the factors related to promotability into perspective so that individuals

Page 38
Academy of Strategic Management Journal, Volume 13, Number2, 2014
seeking advancement have a viable strategy for climbing the organizational ladder. Individuals seeking promotion need to remember that in well-run organizations the person who is promoted is at best a little better than the candidates who are passed over. Therefore, every edge helps. The secondary purpose of this effort is to provide organizations with the elements to construct their own filter which at the same time has the potential to capture the value system of the organization in question by placing different weights on the components of the filter or omitting certain components entirely.
EDUCATION/EXPERIENCE While educational avenues to the top of an organization other than the Master in Business Administration (MBA) are available (e.g., Jack Welch of GE – PhD in Chemical Engineering and Andrew Grove of Intel – PhD in Chemical Engineering, Leonard Bosack of Cisco – M.S. Computer Science, Ed Whitacre of AT&T and GM – B.S. Industrial Engineering, and some notable leaders never completed college, Bill Gates of Microsoft and Michael Dell of Dell), the typical qualifying credential is an MBA from a leading business school. That is not to suggest that all MBAs from elite schools turn out to be a success – to wit, Rick Wagoner of GM – MBA Harvard and his successor, Fritz Henderson – MBA Harvard, led GM into bankruptcy which resulted in the U.S. government bailout. Entrepreneurs, CEOs of high tech companies, and executives of small enterprises are less likely to possess traditional academic credentials than leaders of large corporations. One thing is for certain, if one desires to climb the managerial ladder in a large organization, whether in the for profit sector, a government organization, a not-for-profit enterprise, or the military, formal education is paramount. Good examples are Robert Gates, former Secretary of Defense – PhD in Russian and Soviet History from Georgetown University and General David Petraeus, former Director of the CIA – PhD in International Relations from Princeton. Over eighty percent of U.S. Air Force majors and above have master degrees for example. Obviously, when leading specialized organizations the situation is different. Accounting organizations are led by accountants, engineering organizations by engineers, law firms by lawyers, etc. For example, T. Boone Pickens who became a billionaire through oil and natural gas exploration is a geologist. Most Air Force generals are pilots. Generally speaking, however, CEOs come through finance, operations, and marketing (Stuart, 2005). Frequently, high potential employees are rotated through the salient functional disciplines that give them valued experience as well as opportunities to succeed. Both the individual and his/her organization need to ensure that high potential employees continue building their value to the organization through mentoring, career planning, job rotation, training, and education. Progressive organizations place a premium on developing subordinates. Some even consider you indispensable in your present position until one or more of your subordinates can do your job as well or better than you. Are managers born or made? The answer is both. Some attributes such as intelligence, absence of dysfunctional neuroses, an agreeable personality, and the occasional charisma are genetically determined. The rest are developed through education, training, role modeling and experience (See Table 1). We need to keep in mind Muczyk & Adler’s (2002, p. 5) observation

Page 39
Academy of Strategic Management Journal, Volume 13, Number 2, 2014
that: “Many outstanding leaders get along quite well without charisma by focusing on the fundamentals of management.”
Table 1 Primary Determinants of Promotability Secondary Determinants of Promotability
Integrity Honor the social compact Self-confidence Focus on what is important Run to problems Keep all concerned informed Share the credit Remember recognition See for yourself Efficacy of role modeling Remember where the devil lives Saliency of a sponsor Telling truth to power No one likes a braggart Avoid one mistake syndrome Adopt a contingency approach Keep the ego grounded in reality Special cases
SALIENT CHARACTER ISSUES
Integrity as the sine qua non of organizational success In organizations it is imperative that people trust you – so much so that even one lie can jeopardize a person’s career. Ditto for a serious ethical lapse. While ambition is not held against a person, it needs to be fettered by a properly working moral compass. Create rules that are legal as well as ethical, and enforce those rules diligently. This is the best way to inculcate an ethical culture. Ignoring these rules or making exceptions creates a slippery slope to serious consequences. Typically, the more ingrained is an ethical culture, the less time, effort, and money need to be devoted to the organization’s formal control system. A good example is offered by the Siam Cement Group where long-term, socially responsible principles are incorporated in all aspects of the corporation’s decision-making processes (Kantabutra & Avery, 2011). Although easier said than done, practice a variant of the golden rule, i.e., treat everyone with courtesy, dignity, and respect. Also, avoid pretensions. Learn people’s names as this practice leads them to conclude that you care about them as individuals. As John McCain discusses, integrity and honesty are character traits that make a person remarkable (McCain & Salter, 1999). Recognize publicly but criticize privately, and avoid making criticism personal. That is, focus on the inappropriate act, not the person. This method of administering criticism creates less resentment and fewer enemies than alternative methods. While it would be nice, being loved is not important, but being respected is critical to effective leadership (Crocker III, 1999). George Washington’s adherence to this dictum served him well as a planter, politician, and military leader (Chernow, 2010). Personality matters General George Marshal, while Army chief of staff, beginning with 1939, transformed the U.S. Army by relieving wholesale the peacetime officer corps (Ricks, 2012, p. 33). While

Page 40
Academy of Strategic Management Journal, Volume 13, Number2, 2014
Marshall valued a number of attributes, close to the top was a willingness to cooperate. Simply failing to show a spirit of cooperation was reason enough to remove a senior officer (Ricks, 2012, p. 37). Cooperation proved invaluable during WWII, which an “allied” effort required; but inter-service cooperation was equally essential. In other words, victory is a function of teamwork so far as Generals Marshall and Eisenhower were concerned, thus, their preference for subordinates with a cooperative propensity and personality. One can easily make the case that organizational success is dependent on cooperation as well. However, no single personality profile is appropriate for all positions; therefore it is crucial to match the right personality with the situation. The selection of General George Patton, known for his aggressive personality rather than cooperative disposition, to lead the third army is a case in point. Former GE CEO, Jack Welch, considered self-confidence on the part of subordinates one of the most important assets an organization can possess and lack of it a damaging liability. Furthermore, while he was CEO building self-confidence was a key component of leadership training at all levels of the organization. It was highly unlikely for a GE employee to be a candidate for promotion if he/she did not evince self-confidence. In light of all of Jack Welch’s protégés who became CEOs of major U.S. companies, one is compelled to place considerable credence in the efficacy of self-confidence (Ireland et al., 1992). Clearly, the best strategy for imbuing employees with self-confidence is to create opportunities for them to build a track record of success. On the other hand, nothing destroys self-confidence as a history of failure. Setting challenging but attainable goals, enhances the likelihood of success, while unattainable goals increase the probability of failure. View your job description in an expansive manner and run to problems Henry Paulson, former CEO of Goldman Sachs and former Treasury Secretary, observed that a subordinate who views his/her job description in an expansive manner and who runs to problems or challenges rather than away from them will likely promote himself/herself before Mr. Paulson gets around to doing so. This is a strong endorsement indeed on behalf of individual initiative. Moreover, Mr. Paulson is not the only one who subscribes to this view. For example, the Norwegian Navy explicitly trains its cadets to attack problems in the hope of developing the characteristic of “hardiness” (Eid, Johnsen, Bartone & Nissestad, 2008). Hardiness in this sense is the ability to withstand stressful situations in transforming organizations by being proactive. Sometimes being proactive disrupts an organization, and is a fundamental quality of leadership. Lutz (2003, p. 98) describes how disruptive people are an asset since they change the way organizations operate. He also describes how people who run to problems saved Chrysler from disaster.

Page 41
Academy of Strategic Management Journal, Volume 13, Number 2, 2014
Share the credit Make certain you take the blame when things go wrong and be generous with the credit when things go right. After all, you can delegate authority but not responsibility. Follow this rule even though it may cost you an occasional unwarranted scolding. Leaders such as Harry Truman were amazed by what can be done when following Ralph Waldo Emerson’s sage counsel: You can accomplish anything in life providing you do not mind who gets the credit (Muczyk & Adler, 2002). Maxwell (1999) asserts that when you put people first it does not matter who gets the credit. His indispensable quality “Number 9” suggests that one’s candle loses nothing when it lights another. Sharing credit reflects a humble perspective that is valued in future leaders. Douglas MacArthur never understood this principle while Dwight Eisenhower certainly did. That is why the senior commanders under MacArthur today are relative unknowns, while those who served under Eisenhower are household names (Ricks, 2012, p. 100). See for yourself Do not automatically trust reports since for obvious reasons bad news has trouble percolating to the top, and good news is at times exaggerated. Moreover, by being an active player in the organization’s control system you send the message that attempts at deception are futile. Learn to become an effective listener. After all, effective listening is a precondition to problem identification and solution, as well as the trust quotient of the listener. Superiors when evaluating candidates for promotion are looking for such qualities as passion for one’s job, which motivates subordinates to do what you want done because they wish to do it – Dwight Eisenhower’s definition of effective leadership (Muczyk & Adler, 2002). More recently, passion for one’s job has been described as being a “fish monger” (Lundin, Paul & Christensen, 2000) because it facilitates getting involved in work even though it is messy so long as it produces desired results. Other desirable attributes are: Avoidance of procrastination, especially when it comes to difficult decisions and matters that fall into the drudgery category; leading by example; and perseverance – one of the most powerful forces in organizational life (Collins, 2001). Genghis Khan paid tribute to perseverance when he said: “The merit of an action lies in finishing it to the end.” Sir Francis Drake was of a similar mind when he opined: “there must be a beginning of any great matter, but the continuing until it be thoroughly finished yields the true glory.” Remember where the devil lives Napoleon Bonaparte observed that: “The art of war is simple; everything is a matter of execution” (Muczyk & Adler, 2002, p. 2). The art of management is no different. Everything is a matter of execution, and execution is about details (Heller & Darling, 2011). And as we already know, the devil is in the details. Do not just concern yourself with the big picture leaving details to others. Make certain you attend to details as well. Kim & Mauborgne (2005) describe how attending to details is an essential step in overcoming organizational hurdles. Future leaders can

Page 42
Academy of Strategic Management Journal, Volume 13, Number2, 2014
create fundamental change if they are willing and able to get into the minutia to implement what they call “Blue Ocean Strategy,” or the ability to bring new value to an organization. Loyalty may not be as important as it once was because lifetime employment is no longer as common as it once was, but it should not be underestimated. If you are not perceived as a valued employee, your organization won’t mind if you leave. If you are viewed as a valued member of the organization, loyalty enhances your value. If you do move on, make sure your move is considered a promotion. In that case, your move will not be held against you, since assumption is that everyone is entitled to improve himself/herself. Never burn bridges behind you because references are critical to your success. Telling truth to power High ranking military officers encounter this challenge when testifying before congress or briefing the president, but they are not the only ones. You owe your boss the best advice you are capable of providing. At times that advice may be contrary to your supervisor’s conclusion or what he/she wishes to hear. If it is a delicate matter, provide your advice privately. Otherwise, provide it respectfully, and once a decision is reached support it enthusiastically, even if it is contrary to your advice. If you cannot do that, then you should resign. At all cost avoid opposing the decision behind the scenes or criticize your boss for making it. Also, discourage your subordinates from making disparaging remarks about your superiors. That kind of “loyalty” you can do without. Do not be a sycophant by agreeing with everything your superiors propose or say. That is no way to gain respect. In all likelihood, such obeisance will result in ridicule and resentment. When you do disagree with your superiors or tell them what they do not wish to hear, make sure you can support your position convincingly. Asking questions and actively participating with your superiors disbands a “we-they” attitude that can easily be formed. That is the strategy for gaining trust and respect going forward. Avoid the one mistake syndrome For starters, perfection is not part of the human condition. Neither is it perfectible. Therefore, mistakes will be made, and most of the time they are unintentional. In those instances, effective managers resort to training not punishment. Once the person making a mistake or exercising a poor judgment knows better, the matter should be forgotten. Of course, if the mistake is egregious or the person is mistake prone, more than training is in order. Organizations that abort a career as the result of one mistake produce timid employees who are risk aversive and continuously practice “c.y.a.” Even General Marshall gave second chances to many of the officers whom he earlier relieved for cause, and they did not disappoint. John McCain in “Faith of My Fathers” describes three imperfect men who faced adversity and emerged successfully and with respect of their followers (McCain & Salter, 1999). Had they focused on their mistakes in their very stressful leadership positions, no one would have survived. This determinant of promotability is tantamount to an approval to experiment within boundaries, to develop leadership style and the ability to be hardy as discussed earlier.

Page 43
Academy of Strategic Management Journal, Volume 13, Number 2, 2014
ANCILLARY DETERMINANTS OF PROMOTABILITY
The ancillary determinants are also important. These provide support for the primary factors in increasing one’s chances for promotion. As the title of this section implies, accomplishing them well should also assist in attracting your superior’s attention. Once attained, the primary determinants seal the promotion with the help of the ancillary ones. Learning to highlight your abilities and accomplishments is necessary to attract attention to yourself in subtle, unobtrusive ways. In addition to the aforementioned character issues, make sure nobody outworks you. This includes doing appropriate research and careful risk/reward analysis. Obviously, there is a high price to be paid for this, such as not spending enough time with the family with all the attendant consequences. Effective time management might turn out to be your salvation. Likewise, know your business better than anyone else. That way your subordinates as well as peers will rely on you and your superiors will view you as an invaluable resource. Surround yourself with the best people you can afford, and ignore age. They make you look good and should not be viewed as a threat. Keep all concerned informed It is vital to keep people with a need to know informed regarding what is going on in the organization and the environment. Employees make better decisions when they possess the necessary information. Goleman et al. (2002) call the tendency of withholding relevant information from decision makers the “CEO Disease.” Of course, this is a two-way street. Subordinates have an equal obligation to keep their superiors informed. Encourage subordinates to present ideas and then evaluate them. The best solution is typically obvious after the fact, and is usually the product of common sense. Learn ahead of time about opportunities and take advantage of them. This may require volunteering to do things others wish to avoid, such as uprooting your family and moving to another location. Develop your subordinates through delegation. Perforce, the higher you climb the more you need to delegate. Social compact Exchange theory (Homans, 1958; Blau, 1964) implies that a person feels a moral obligation to repay any benefit that he or she is provided by another commitment. Social exchanges occur frequently between employees and their leaders in the form of a social compact. In these compacts the employees will make, including performing at a high level, if in return they receive their share of the rewards that the employer has to offer as well as considerate treatment from their superiors. More often than not, it is the lack of human relations skills rather than technical ones that constitutes a career killer. A strong nexus between performance and rewards is crucial in instrumental cultures such as in the U.S.A. (Muczyk, 1988). Organizations that make all employees salaried and provide the same benefits to all appear to do between those who divide their employees into salaried and hourly
Page 44
Academy of Strategic Management Journal, Volume 13, Number2, 2014
and treat the two groups differently. In other words, make sure as many people as possible have a stake in the game (Pickens, 2010). Whenever practicable, make the organization a family affair. Perhaps this is what is meant by the concept of “servant leader.” Focus on what is important For starters, effective managers telegraph what is important, measure what is important, and finally reward what is important. Performance should not be a guessing game. Measuring everything and rewarding everything equally is counterproductive because this practice does not provide direction and dilutes limited resources available for rewarding what is important. That is why having reliable and valid performance appraisals is so important, according to former Intel CEO, Andrew Grove (Grove, 1985). Employing Pareto’s 80-20 rule frequently is useful in separating the important from the routine. Continually ask yourself the question: What can I do to make a difference? You can make a difference by identifying “breakout” activities that lead to the next plateau of success and executing them well. Again, Pareto’s 80-20 rule is helpful. Furthermore, effective managers rely on the most powerful motivators at their disposal. First and foremost happens to be money because of all the values, material and symbolic, that it can buy (Muczyk, 1988). Remember recognition Napoleon observed that men will even die for a ribbon. Therefore, managers should not neglect recognition, but they should mindful that one can go to that well too often without backing up recognition with pay raises and promotions. Unless this is done, recognition can become an irritant. Position power is an inherent reward for those seeking advancement. High potential managers figure out what needs changing and how to bring about change with minimum disruption. This skill set is becoming more important as the rate of change increases in the market place as the result of innovation and globalization (Yukl, Gordon & Taber, 2002). Superiors give candidates for promotion considerable credit for running successful organizations, and fulfilling the social compact is instrumental when it comes to performance. Efficacy of role modeling One of the most useful approaches to gaining recognition as an effective manager and thereby becoming a serious candidate for promotion is to emulate the individual (s) who is widely considered the most effective manager. The reason this is an advisable approach is that by acquiring the style and practices of the successful manager, you too will display the proven attributes of success that are valued by your organization. Role modeling has risk associated with it when significant change occurs. For example, generals frequently fight the last war when the current war is quite different because their role models were from the last war. Corporate executives operating in an environment of unrelenting change face the same risk. One characteristic of effective managers that is worthwhile acquiring in all situations is the ability to maintain one’s composure no matter what the provocation – “sangfroid,” if you will.

Page 45
Academy of Strategic Management Journal, Volume 13, Number 2, 2014
The more exposure one has to desired leadership behaviors, the more likely an individual will become familiar with promotional requirements. As T. Boone Pickens (2010) observed: “A management style is an amalgamation of the best of other people you have known and respected – and eventually you develop your own style.” Saliency of a sponsor Because well run organizations have many talented people competing for a relatively small number of positions, having a sponsor gives the candidate an important edge. This is true for practically all organizations. The sponsor brings his/her candidate to the attention of decision makers at opportune moments even without the candidate’s knowledge. Other than marrying the boss’s daughter, of which there is a shortage, there is no special advice for attracting a sponsor. Typically, the sponsor selects the aspirant because he/she is concerned with the future welfare of the organization. One improves his/her chances by pursuing the strategy for negotiating the organizational ladder laid out in this effort. In this context, it is instructive to heed Theodore Roosevelt’s sage advice: “The best executive is the one who has sense enough to pick good men (and women) to do what he wants done, and self-restraint enough to keep from meddling with them while they do it” (Schultz, 1999). Adopting a contingency approach to leadership While it is most comfortable to practice the same leadership style in every circumstance, it is a risky proposition. For recommendations regarding situational or contingency leadership, see Muczyk & Reimann (1987); Muczyk & Steele (1998). Moreover, make certain that important leadership complements are aligned with the prevailing leadership approaches (Muczyk & Reimann, 1989). In like manner, view the organization as a system, and insure that all components are properly synchronized (Muczyk, 2004). Do not be misled by all the insinuations in the literature and all the organizational lore that democratic is the only way to go. Research evidence simply does not support this cultural bias (Muczyk & Reimann, 1987; Muczyk & Steele, 1998). Adaptability in leadership style is key to dealing with environmental complexity (Hotho & Dowling, 2010). Lastly, take cultural factors into consideration when managing abroad (Muczyk & Holt, 2008).
SPECIAL CASES OF PROMOTABILITY Turnaround and retrenchment, “Rainmaker,” and organizational ranks constitute special cases of promotability. Turnaround and retrenchment missions are concerned with a general shrinking or backward movement of the business, as the term “downsizing” implies. Reversing inertia requires doing things in a different, unfamiliar, and at times unpleasant ways. Because organizations faced with such missions are subjected to undesirable, often painful changes, the decisions that have to be made and goals that have to be set frequently run counter to employee self-interest. Managers are replaced, employees are terminated, and many disruptions are caused in the traditional ways of doing things. In addition, urgency precludes participative methods,

Page 46
Academy of Strategic Management Journal, Volume 13, Number2, 2014
which are inherently time-consuming. To make matters worse, managerial education, until recently, has neglected the whole topic of how to retreat effectively. Finally, turnaround and retrenchment missions fly in the face of the “bigger is better” ethos that is firmly ingrained in the U.S. culture and, in turn, has convinced many managers that being rewarded on the basis of size of their units is the norm. Thus, only the leader can make these difficult and unpopular decisions under extreme time pressures. While more power equalization exists in organizations today than before, most employees still concede to their superior the right to make decisions and set goals, as well as the authority to direct the processes leading to those results. The reader should be mindful that an autocratic leader is not some misanthrope or ogre, but merely a person who is paid to make the important decisions, set salient goals, and direct subordinates along the way. The human condition is such that followers look to the leader in time of danger. Autocratic and directive leaders still need to treat people with courtesy, dignity, and respect. While there exist situations that call for autocratic leadership, no occasion calls for a despot. The “Rainmaker” In specialized service organizations, e.g., public accounting firms, law firms, investment banking, etc., where the existence of the organization depends on attracting new clients, the members who do so are referred to as “Rainmakers.” While excellent technicians and accomplished managers are also promoted, they do not have the same chance to rise to senior positions as do the rainmakers. Persons running these organizations will let anyone who is interested know that the most difficult talent to attract are the rainmakers, and keeping them satisfied is a survival imperative. Organizations with ranks or grades and managerial positions One way to overcome limits on supervisory/managerial promotions forced by the pyramidal shape of traditional organizations is to create ranks or grades for organizational members. The military and governmental agencies are common examples. A person who advances from the rank of captain to rank of major receives a promotion with respect to pay and status without necessarily supervising anyone. Ditto for a federal government employee promoted from GS-8 to GS-9. As a practical matter, organizations try to avoid situations whereby persons of lower rank or grade supervise individuals of higher rank or grade.
CROSS CULTURAL CONSIDERATIONS A survey of Fortune 500 executives showed that having competent global leaders was the most important factor in business success, and that 85% of the executives did not think they had an adequate number of competent global leaders (Javidan & House, 2001). Given that the world is rapidly becoming a global economic village, adopting cultural imperatives serves managers working abroad quite well, indeed. Underlying the importance of being able to lead in a global

Page 47
Academy of Strategic Management Journal, Volume 13, Number 2, 2014
capacity is the growth of technology that is eliminating boundaries between countries and companies (Friedman, 2005). Javidan, Dorfman, de Luque, and House (2006) on the basis of evidence collected by Project GLOBE concluded that there are universal attributes that relate to leadership effectiveness and are instrumental to the advancement of candidates. Furthermore, they classified them into three categories (See Table 2). Clearly, candidates should acquire universal facilitators, avoid universal impediments, and utilize the third category where the culture dictates their relevance.
Table 2 Universal Attributes that Facilitate Leadership Effectiveness,
Impede Effectiveness, and Vary with Culture Universal facilitators Being trustworthy, just, and honest (integrity) Having foresight and planning ahead (charismatic-visionary) Being positive, dynamic, encouraging, and motivating Building confidence (charismatic-inspirational) Being communicative, informed, a coordinator. And a team integrator (team builder) Universal impediments Being a loner and asocial Being non-cooperative and irritable (malevolent) Being dictatorial (autocratic) Culturally contingent Being individualistic Being status conscious Being a risk taker (charismatic- self sacrificial)
SOURCE: Adapted from Javidan, Dorfman, de Luque, and House (2006)
Further evidence for considering culture is provided by Implicit Leadership Theories (ILTs) which stipulate that different cultural groups may have different conceptions of what leadership in organizations should entail. Specifically, implicit leadership theories refer to beliefs held about how leaders behave in general and what is expected of them (Lord & Maher, 1991), and culture is supposed to have an important impact on the formation of ILTs (Hunt, Boal, & Sorensen, 1990). For greater specificity, see Koopman et al. (1999).
CONCLUSION The academic literature tends to be theory and research centric, but at times pays short shrift to important topics. These gaps, however, can be filled by relying on practice found in successful organizations. We believe that the latter offers much utility as well as considerable wisdom, and rely on it in this effort. In order to provide guidance to individuals seeking advancement and to organizations wishing to construct customized promotional filters utilizing elements that have served successful organizations well, we made an attempt to offer what we believe are useful guidelines regarding climbing the organizational ladder.

Page 48
Academy of Strategic Management Journal, Volume 13, Number2, 2014
Most organizations are looking for managerial qualities that impact organizational efficiency, effectiveness, adaptability, and morale. In addition, persons making promotion decisions look for academic credentials, and relevant experience. Character issues are important as are functional leader behaviors, such as fulfilling the social compact between superiors and their subordinates. Do not become reliant on just one leadership style, and factor in cultural considerations when managing abroad. Learn to anticipate change and adapt to it in a timely fashion. Developing a global management skill set is important, especially in multinational and transnational organizations. In short, your superiors are observing not only what you have done for others but also what you have done for yourself.
REFERENCES Blau, P. (1964). Exchange and Power in Social Life. New York: Wiley. Chernow, R. (2010). Washington: A Life. New York: Penguin Press. Collins, J. (2001). Good to Great. New York: Harper Business. Crocker III, H. (1999). Robert E. Lee on Leadership: Executive Lessons in Character, Courage, and Vision. New
York: Three River Press. Eid, J., Johnsen, B., Bartone, P., & Nissenstad, O. (2008). Growing Transformational Leaders: Exploring the Role
of Personality Hardiness. Leadership & Organizational Development Journal, 29(1), 4-23. Freidman T. (2005). The World Is Flat – A Brief History of the Twenty-First Century. New York: Farrar, Straus &
Giroux. Goleman, D., Boyatzis, R. & McKee, A. (2002). Primal Leadership: Learning to Lead with Emotional Intelligence.
Boston: Harvard Business School Press. Grove, A. S. (1985). Keeping Favoritism and Prejudice Out of Employee Evaluations. The Wall Street Journal on
Management, edited by David Asman and Adam Meyerson. Homewood, Ill.: Dow Jones-Irwin, 102-105. Heller, V. & Darling, J. (2011). Toyota in Crisis: Denial and Mismanagement. Journal of Business Strategy, 32(5),
4-13. Homans, G. (1958). Social Behavior As Exchange. Journal of Sociology, 63, 597-606. Hotho, S. & Dowling, M. (2010). Revisiting Leadership Development: The Participant Perspective. Leadership &
Organizational Development Journal, 31(7), 609-629. Hunt, J., Boal, K., & Sorensen, R. (1990). Top Management Leadership: Inside the Box. Leadership Quarterly, 1,
41-65. Ireland, R., Hitt, M., & Williams, J. (1992). Self-Confidence and Decisiveness: Prerequisite for Effective
Management in the 1990s. Busines Horizons, January-February, 36-43. Javidan, M., Dorfman, P., de Luque, M. & House, R. (2006), In the Eye of the Beholder: Cross Cultural Lessons in
Leadership from Project GLOBE. Academy of Management Perspectives, 67-90. Javidan, M. & House, R. (2001). Cultural Acumen for the Global Manager: Lessons from Project GLOBE.
Organizational Dynamics, 29, 289-305. Kantabutra, S. & Avery, G. (2001). Sustainable Leadership at Siam Cement Group. Journal of Business Strategy,
32(4), 32-41. Kim, W. & Mauborgne, R. (2005). Blue Ocean Strategy: How to Create Uncontested Market Space and Make the
Competition Irrelevant. Boston: Harvard Business School Press. Koopman, P., Hartog, D. & Konrad, E. (1999). National Cultures and Leadership Profiles in Europe: Some Results
From the GLOBE Study. European Journal of Work and Organizational Psychology, 8(4),. 503-520.

Page 49
Academy of Strategic Management Journal, Volume 13, Number 2, 2014
Lord, R. & Maher, K. (1991). Leadership and Information Processing: Linking Perceptions and Performance: Boston: Unwin-Everyman.
Lundin, S., Paul, H. & Christensen, J. (2000). Fish: A Remarkable Way to Boost Morale and Improve Results. New York: Hyperion.
Maxwell, J. (1999). The 21 Indispensable Qualities of a Leader: Becoming the Person Others Will Want to Follow. Nashville, Tennessee: Thomas Nelson.
McCain, J. & Salter, M. (1999). Faith of My Fathers. New York: Random House. Mintzberg, H. (1973). The Nature of Managerial Work. New York: Harper & Row. Muczyk, J. & Holt, D. (2008). Toward a Cultural Contingency Model of Leadership. Journal of Leadership &
Organizational Studies, 14(4), 277-286. Muczyk, J. (2004). A Systems Approach to Organizational Effectiveness: The Alignment of Critical Organizational
Dimensions with Selected Business/Competitive Strategies. Journal of Comparative International Management, 7(1), 53-81.
Muczyk, J. & Adler, T. (2002). An Attempt at a Consentience Regarding Formal Leadership. Journal of Leadership & Organizational Studies, 9(2), 2-17.
Muczyk, J. & Steele, R. (1998). Leadership Style and the Turnaround Executive. Business Horizons, 39-45. Muczyk, J. & Reimann, B. (1989). MBO As a Complement to Effective Leadership. Academy of Management
Executive, 3(2), 131-138. Muczyk, J. (1988). The Strategic Role of Compensation. Human Resource Planning, 11(4), 225-239. Muczyk, J. & Reimann, B. (1987). The Case for Directive Management. Academy of Management Executive. 1(4),
301-311. Pickens, T.B. (2010). His Life. His Legacy. Accessed from: http://www.boonepickens.com/thoughts/default.asp,
June 16, 2010. Ricks, T. (2012). The Generals. New York: The Penguin Press. Schultz, H. (1999). Pour Your Heart Into It: How Starbucks Built a Company One Cup at a Time. New York:
Hyperion. Stuart, S. (2005). A Statistical Snapshot of S&P Leaders. Accessed from:
http://www.content.spencestuart.com/sswebsite/pdf/lib/2005_CEO_Study_JS.pdf, May 21, 2012. Yukl, G. Gordon, A. & Taber, T. (2002). A Hierarchical Taxonomy of Leadership: Integrating a Half Century of
Behavior Research. Journal of Leadership & Organizational Studies, 9(1), 15-32.

Page 50
Academy of Strategic Management Journal, Volume 13, Number2, 2014
Page 51
Academy of Strategic Management Journal, Volume 13, Number 2, 2014
IS WAL-MART A SOCIAL ENTERPRISE? AN EXPLORATION OF THE RELATIONSHIP BETWEEN CORPORATE REPUTATION, CORPORATE SOCIAL RESPONSIBILITY & FINANCIAL PERFORMANCE
Leon C. Prieto, Clayton State University
Simone T. A. Phipps, Middle Georgia State College Isaac Y. Addae, Morgan State University
ABSTRACT
The goal of this article is to introduce corporate social responsibility as a potential moderator in the relationship between corporate reputation and financial performance. This article also asks the question whether Wal-Mart can be perceived as a social enterprise based on the public’s perception of the retail giant’s reputation and their socially responsible behaviors (or lack thereof). Keywords: Corporate Reputation, Corporate Social Responsibility, Social Enterprise.
INTRODUCTION Wal-Mart has faced its fair share of criticism, which has negatively impacted their corporate reputation. Some have argued that Wal-Mart has destroyed communities by changing established living patterns in the United States (Zhang & Largay, 2009). Some also argued that because of the retail giant, shoppers drive to buy goods and services at locations on the outskirts of town, which results in downtown mom and pop stores losing their customer base and eventually closing down (Zhang & Largay, 2009). In order to avoid these negative effects on their communities, some county leaders do not allow Wal-Mart to enter (Zhang & Largay, 2009). In recent years Wal-Mart also faced intense scrutiny for its alleged discrimination against women and exploitation of low-wage workers (Garcia, Rovenport, & Osland, 2009). Wal-Mart also made Northwestern University business professor, Daniel Diermeier’s list of 2012 worst reputational crises. The retail giant made the list due to allegations of corruption in their Mexican operations and also due to the fire at the Tazreen Fashions factory in Bangladesh, a maker of clothing items for Wal-Mart and other retailers (Diermeier, 2012). Even a recent Forbes magazine article entitled “Oops, Five CEOs Who Should Have Already Been Fired” listed Wal-Mart Ceo, Mike Duke as someone who should have been fired long ago due to the management scandals, employee discontent due to low wages, and its negative effect on the communities (Hartung, 2012).

Page 52
Academy of Strategic Management Journal, Volume 13, Number2, 2014
The Reputation Institute compiles an annual list of the most reputable companies, where Wal-Mart recently placed 124th and was outranked by other retail firms, including Amazon (3rd place), Whole Foods (23rd place) and Target (37th place) (The Most Reputable Companies in the U.S., 2013). Organizations, such as Wal-Mart, should be concerned with their reputation, especially given prior research that suggests reputation can influence stakeholder perceptions (Rindova, Williamson, Petkova, & Sever, 2005), investor reactions (Pfarrer, Pollock, & Rindova, 2010), and long-term profitability (Roberts and Downing, 2002). Reputation is an important means by which companies can maintain a sustainable competitive advantage and endure a long term relationship with multiple stakeholder groups (Boyd, Bergh, & Ketchen, 2010). Therefore, companies have to play an active role in managing their reputation because it may result in superior financial performance or potential disaster. Warren Buffet, influential CEO, investor and philanthropist, stated “It takes 20 years to build a reputation and five minutes to ruin it.” In order to use reputation as a source of competitive advantage, companies need to showcase their capabilities in order to change stakeholder perspectives, and this can be done by publicizing their vision, mission, and values (Dowling & Moran, 2012). This is especially important for Wal-Mart because of the constant negative press facing the retail giant. One way to improve corporate reputation is through contributions to the community and society at large, because corporate social responsibility (CSR) may increase customer goodwill towards the firm (McGuire, Sundgren, and Schneeweis, 1988). CSR initiatives also help organizations to differentiate their products and services by creating a positive brand image, further safeguarding the firm’s reputation (Hsu, 2011). This approach makes CSR an important component in a firm’s differentiation strategies and is a form of strategic investment comparable to R&D and advertising (Gardberg and Fombrun, 2006). Wal-Mart, like many other large companies, does possess a corporate conscience and goes the extra mile to take positive actions toward the environment, social causes, and their communities (Creel, 2011). In spite of all the negative criticism, which has impacted the corporate reputation of Wal-Mart, some suggest that the retail giant has impacted society in positive ways as well. For example, according to the Chronicle of Philanthropy, Wal-Mart continues to make good on its 2010 $2 billion dollar pledge to help feed low-income people (Barton, Di Mento, Flandez, & Lopez-Rivera, 2012). This paper focuses on Wal-Mart as it explores the connection between reputation and financial performance, as well as CSR serving as a possible moderator of the reputation-financial performance relationship (see Figure 1). Furthermore, despite some negative public perceptions of the company, the authors also discuss the consideration of Wal-Mart as a social enterprise due to its CSR and commitment to community initiatives.
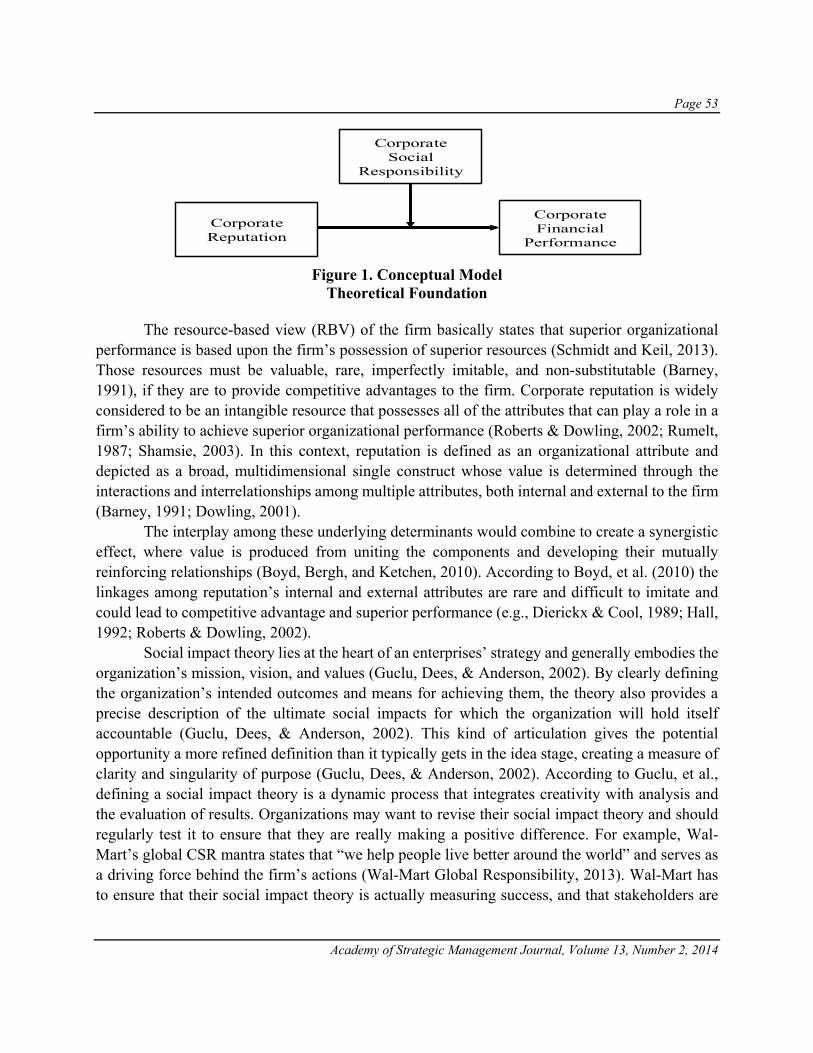
Page 53
Academy of Strategic Management Journal, Volume 13, Number 2, 2014
Figure 1. Conceptual Model Theoretical Foundation
The resource-based view (RBV) of the firm basically states that superior organizational performance is based upon the firm’s possession of superior resources (Schmidt and Keil, 2013). Those resources must be valuable, rare, imperfectly imitable, and non-substitutable (Barney, 1991), if they are to provide competitive advantages to the firm. Corporate reputation is widely considered to be an intangible resource that possesses all of the attributes that can play a role in a firm’s ability to achieve superior organizational performance (Roberts & Dowling, 2002; Rumelt, 1987; Shamsie, 2003). In this context, reputation is defined as an organizational attribute and depicted as a broad, multidimensional single construct whose value is determined through the interactions and interrelationships among multiple attributes, both internal and external to the firm (Barney, 1991; Dowling, 2001). The interplay among these underlying determinants would combine to create a synergistic effect, where value is produced from uniting the components and developing their mutually reinforcing relationships (Boyd, Bergh, and Ketchen, 2010). According to Boyd, et al. (2010) the linkages among reputation’s internal and external attributes are rare and difficult to imitate and could lead to competitive advantage and superior performance (e.g., Dierickx & Cool, 1989; Hall, 1992; Roberts & Dowling, 2002). Social impact theory lies at the heart of an enterprises’ strategy and generally embodies the organization’s mission, vision, and values (Guclu, Dees, & Anderson, 2002). By clearly defining the organization’s intended outcomes and means for achieving them, the theory also provides a precise description of the ultimate social impacts for which the organization will hold itself accountable (Guclu, Dees, & Anderson, 2002). This kind of articulation gives the potential opportunity a more refined definition than it typically gets in the idea stage, creating a measure of clarity and singularity of purpose (Guclu, Dees, & Anderson, 2002). According to Guclu, et al., defining a social impact theory is a dynamic process that integrates creativity with analysis and the evaluation of results. Organizations may want to revise their social impact theory and should regularly test it to ensure that they are really making a positive difference. For example, Wal-Mart’s global CSR mantra states that “we help people live better around the world” and serves as a driving force behind the firm’s actions (Wal-Mart Global Responsibility, 2013). Wal-Mart has to ensure that their social impact theory is actually measuring success, and that stakeholders are
Corporate Social
Responsibility
Corporate Reputation
Corporate Financial
Performance

Page 54
Academy of Strategic Management Journal, Volume 13, Number2, 2014
aware of the firm’s intentions regarding social impact. When this is articulated clearly to all stakeholders, it may then impact the corporate reputation of Wal-Mart.
CORPORATE REPUTATION Roberts and Dowling (2002, p. 1078) define reputation as a perceptual representation of a company’s past actions and future prospects that describe the firm’s overall appeal to all its key constituents when compared to other leading rivals. Robert and Dowling (2002) further explained that corporate reputation is a general organizational attribute that reflects the extent to which external stakeholders see the firm as ‘good’ and not ‘bad.’ Barnett, Jermier, and Lafferty (2006) defined corporate reputation as observers’ collective judgments of a corporation based on assessments of the financial, social, and environmental impacts attributed to the corporation over time. Top-level managers consider corporate reputation as the critical intangible resource that leads to competitive advantage, and the significance of that construct is supported by a positive relationship between an organization’s corporate reputation and its return on assets (Deephouse, 2000). According to Hsu (2012), an investment in reputation develops stakeholder’s support and increases consumer’s confidence in the firm’s offering. There seems to be consensus among academics and practitioners alike that the way in which the public perceives a company is very important in determining its success (e.g. Fombrum, 1996; Brown, 1998; Roberts & Dowling, 2002. Antunovich and Laster (1998) contend that the Fortune magazine reputation ratings are directly related to a firm's future equity performance in U.S. Their study showed that the most admired firms in the U.S. achieve high equity return performance after corporate reputation publication while the less admired firms generally underperform. Various benefits can be gained from possessing a good reputation, which have also been associated with increased financial performance. Providing an indicator of product quality when consumers are faced with a choice between competing products is a reputational benefit that can lead to increased sales, premium prices and customer retention (Shapiro, 1983). The attraction of a higher caliber workforce and higher staff retention rates is another benefit of good reputation, which may lead to reduced organizational costs (Roberts and Dowling, 2002). A favorable reputation can assist in the reduction of supplier and buyer exchange uncertainty, potentially leading to increased sales and reduced transaction costs (Kotha, Rajgogal, and Rindova, 2001). Also providing a reserve of goodwill as a competitive “barrier” in challenging operating times is a reputational benefit that may aid in maintaining sales (Michalisin, Kline, and Smith 2000). Proposition 1: There will be a positive relationship between corporate reputation and the financial performance of Wal-Mart.

Page 55
Academy of Strategic Management Journal, Volume 13, Number 2, 2014
CORPORATE SOCIAL RESPONSIBILITY
Corporate social responsibility (CSR) involves organizations going beyond legal obligations and their own interests to address and manage the impact their activities have on society and the environment (McWilliams & Siegel, 2001). According to Vallaster, Lindgreen, and Maon (2012, p. 35), this view includes how firms and their managers interact with stakeholders, who are commonly defined as those “persons or groups that have, or claim, ownership, rights, or interests in a corporation and its activities, past, present, or future” and includes customers, suppliers, employees, investors, and the communities in which they operate, as well as the degree to which they strive to care for the natural environment (Vallaster, Lindgreen, & Maon, 2012). A 2009 McKinsey survey of more than 1000 global corporate executives revealed that business leaders think the recent economic crisis has increased the public’s expectations of the role of organizations in society (Bonini and Miller 2009). Of these executives, 85% or more report that addressing environmental, privacy, health, safety, workplace conditions, and developing country investment issues creates value for their companies and shareholders (Madden, Roth, & Dillon, 2012). Attention to these societal concerns demonstrates corporate citizenship and influences the company’s reputation in the public eye as it reveals the company’s interest in more than just the bottom line. A poor social responsibility image, captured in ratings such as those of Kinder, Lydenberg, Domini Research & Analytics, can lead to sellouts of company shares by large investment funds, which can in turn negatively impact financial performance (Chatterji, Levine, and Toffel, 2009). Companies need to keep in mind that stakeholders want to affiliate with an organization with which they more closely identify and whose company’s values are consistent with their own (Akerlof and Kranton, 2010). CSR initiatives then provide an observable signal of the firm’s values (Sen and Bhattacharya, 2001). For example, stakeholders who value diversity will identify with CSR initiatives that focus on diversity. But if the firm also engages in a CSR initiative to, for example, protect the environment, then stakeholders who identify with the firm’s diversity values may find those enhanced by the firm’s environmental values (Janney and Gove, 2011). Corporate social responsibility is expected to play a role as a moderating variable in the relationship between corporate reputation and financial performance. Lin, Chen, Chiu, and Lee (2011) found a significant moderating effect of perceived CSR on the relationship between perceived negative publicity and trust, which suggests that customer’s trust is easily hurt by negative publicity when perceived CSR is absent. When there is a lack of trust among potential customers for a certain company, there is more of a propensity for them to refrain from supporting that company through sales (Lin et al., 2011). As long as CSR can be embraced and well demonstrated by a company (e.g. cause-related advertising and marketing), customer’s trust in that
Page 56
Academy of Strategic Management Journal, Volume 13, Number2, 2014
company is less likely destroyed merely based on negative publicity, and its financial performance will have a smaller likelihood of being hindered (Lin et al., 2011). Proposition 2: Corporate social responsibility will moderate the relationship between corporate reputation and the financial performance of Wal-Mart.
SOCIAL ENTERPRISES In the United States, academics conceptualize social enterprises as organizations that fall along a continuum from profit-oriented enterprises engaged in socially beneficial activities (corporate philanthropies or corporate social responsibility), to dual-purpose businesses that mediate profit goals with social objectives, or nonprofit organizations engaged in mission-supporting commercial activity (social purpose organizations) (Kerlin, 2006). As it pertains to the economic impact of social enterprises, one study reported results suggesting that social enterprises are very effective at job creation and that all forms of socially oriented organization create more jobs on average than mainstream entrepreneurial enterprises (Harding, 2004). The Social Enterprise Alliance defines social enterprises as businesses whose primary purpose is the common good. They use the methods and disciplines of business and the power of the marketplace to advance their social, environmental and human justice agendas (What’s a Social Enterprise, 2013). This definition, then, alludes to social enterprises possessing a sense of corporate social responsibility as they feel a sense of obligation to use their resources to improve societal conditions. According to the Social Enterprise Alliance, there are three characteristics that distinguish a social enterprise from other types of businesses, nonprofits and government agencies, and some scholars and practitioners may argue that Wal-Mart can be defined as a social enterprise based on the three characteristics listed below.
1. It directly addresses an intractable social need and serves the common good, either through its products and services or through the number of disadvantaged people it employs (What’s a Social Enterprise, 2013).
Wal-Mart recently announced plans to spend an extra $50 billion over the next ten years purchasing U.S.-made merchandise, to help reestablish American manufacturing after twenty years of steep job losses to China and other low-cost producers (Newman, 2013). The retail giant also offered to hire any honorably discharged military veteran who wants a job, estimating it could hire at least 100,000 vets over the next five years (Newman, 2013). “America needs an economic renewal,” Bill Simon, CEO of Wal-Mart's U.S. division, said in announcing the new initiatives. “Through our buying power we can play a role in revitalizing the communities we serve” (Newman, 2013, p. 26). Members of the U.S. military, and their spouses, are guaranteed transferrals to nearby Wal-Mart or Sam's Club locations if they are force to relocate for military purposes. This promise, made on Wal-Mart’s behalf, ensures that employees called away to active

Page 57
Academy of Strategic Management Journal, Volume 13, Number 2, 2014
duty will be paid any difference in their salary if they earn less money during their military assignment (Military family promise, 2013).
2. Its commercial activity is a strong revenue driver, whether a significant earned income stream within a nonprofit’s mixed revenue portfolio, or a for profit enterprise (What’s a Social Enterprise, 2013).
According to Wal-Mart’s website, consolidated net sales for the full fiscal year were $466.1 billion, an increase of 5.0 percent over fiscal 2012 (Fiscal 2013 results, 2013). Net sales included approximately $4.0 billion from acquisitions and approximately $4.5 billion of negative impact from currency exchange rate fluctuations. Membership and other income was $3.0 billion, a decrease of 1.6 percent from the prior year. Total revenue was $469.2 billion, an increase of 5.0 percent or $22.2 billion (Fiscal 2013 results, 2013).
3. The common good is its primary purpose, literally “baked into” the organization’s DNA, and trumping all others (What’s a Social Enterprise, 2013).
Some may argue that Wal-Mart’s slogan “Save money. Live Better” can be interpreted as a social mission embedded in the fabric of the organization. According to Wal-Mart’s website environmental sustainability has become an essential ingredient to doing business responsibly and successfully. Wal-Mart believes that their actions have the potential to save customers money and help ensure a better world for generations to come. Their three aspirational sustainability goals are: 1) To be supplied by 100% renewable energy, 2) To create zero waste, and 3) To sell products that sustain people and the environment (Environmental sustainability, 2013).
CONCLUSIONS, IMPLICATIONS AND FUTURE INQUIRY In conclusion, the verdict is still out on Wal-Mart as to whether or not they can be viewed as a social enterprise. Even though the retail giant has lead the way in corporate philanthropy, job creation, and other initiatives with the purpose of helping people and communities “live better,” they still have a bit of problem with their corporate reputation. As stated by Robert and Downing, (2002, p. 1078), “corporate reputation is a general organizational attribute that reflects the extent to which external stakeholders see the firm as good and not bad,” and it is very important for corporations to work on this organizational attribute because it may lead to superior financial performance. Corporate social responsibility may very well strengthen the relationship between reputation and financial performance because, intuitively, individuals will perceive a firm that gives back to the community and makes a positive difference in the lives of people as one that has a stronger corporate reputation.

Page 58
Academy of Strategic Management Journal, Volume 13, Number2, 2014
As firms engage in activities related to their corporate social responsibility agenda, they must be aware that their actions have great implications on corporate reputation. Organizations, such as Wal-Mart, that maintain a global footprint, must seek to balance the need to maximize profits with a focus on decision-making that is socially responsible. This can be challenging, especially considering the varying perspectives and values held by individuals across international markets. Achieving balance in regards to profitability and social responsibility can lead to the realization of superior performance, mainly due to the influence of reputational benefits. Future inquiry into the relationship between corporate reputation, social responsibility, and financial performance can seek to examine reverse effects, specifically the impact that sustained superior performance may have on corporate reputation and social responsibility. Could it be that firms, which have achieved industry dominance, tend to benefit from positive reputations due to their success? For example, given Wal-Mart’s global popularity and prominence, it is possible that their reputation is more a factor of their financial success. Also, could it be that firms embracing a social responsibility agenda are those that have achieved superior performance? One may discover that firms, such as Wal-Mart, maintaining higher levels of market performance are held to a higher standard, and are thus expected to embrace an agenda of social responsibility. Questions such as these can only be answered through further exploration of the relationships defined in this paper.
REFERENCES Akerlof, G. A., & Kranton, R. E. (2010). Identity economics: How our identities shape our work, wages, and well-
being. Princeton, NJ: Princeton University Press. Antunovich, P., & Laster, D. (1998). Do investors mistake a good company for a good investment?. Federal Reserve
Board of New York Staff Report, (60). Barnett, M. L., Jermier, J. M., & Lafferty, B. A. (2010). Corporate reputation: The definitional landscape. Corporate
Reputation Review, 9(1), 26-38. Barney, J. B. (1991). Firm resources and sustained competitive advantage. Journal of Management, 17(1), 99-120. Barton, N., Di Mento, M., Flandez, R., & Lopez-Rivera, M. (2012). 10 companies that gave the most cash in 2011.
Chronicle of Philantrophy: http://philanthropy.com/article/10-Companies-That-Gave-the/132991/. Boyd, B. K., Bergh, D. D., & Ketchen, D. J. (2010). Reconsidering the reputation-performance relationship: A
resource-based view. Journal of Management, 36(3), 588-609. Brown, T. J. (1998). Corporate associations in marketing, antecedents and consequences’, Corporate Reputation
Review, 1 (3), 215-233. Bonini, S., Koller, T. M., & Mirvis, P. H. (2009). Valuing social responsibility programs. McKinsey Quarterly, 4,
65-73. Chatterji, A. K., Levine, D. I., & Toffel, M. W. (2009). How well do social ratings actually measure corporate social
responsibility? Journal of Economics and Management Strategy, 18 (1), 125-69. Creel, T. (2011). Corporate social responsibility: An examination of practices in the retail industry. Management
Accounting Quarterly, 12(4), 23-28. Currás-Pérez, R., Bigné-Alcañiz, E., & Alvarado-Herrera, A. (2009). The role of self-definitional principles in
consumer identification with a socially responsible company. Journal of Business Ethics, 89(4), 547-564. Deephouse, D. L. (2000). Media reputation as a strategic resource: An integration of mass communication and
resource-based theories. Journal of Management, 26(6), 1091-1112.

Page 59
Academy of Strategic Management Journal, Volume 13, Number 2, 2014
Dierickx, I., & Cool, K. (1989). Asset stock accumulation and sustainability of competitive advantage. Management Science, 35(12), 1504-1511.
Dowling, G. R. (2001). Creating corporate reputations. Oxford, UK: Oxford University Press. Dowling, G., & Moran, P. (2012). Corporate reputations: Built in or bolted on. California Management Review,
54(2), 25-42. Fombrun, C.J. (1996). Reputation, realizing value from the corporate image. Boston, MA: Harvard Business School
Press. Garcia, D., Rovenport, J., & Osland, A. (2009). Wal-Mart’s new challenge: Reaching out to socially responsible
investors. Business Case Journal, 16(1), 27-54. Gardberg, N. A., & Fombrun, C. J. (2006). Corporate citizenship: Creating intangible assets across institutional
environments. Academy of Management Review, 31(2), 329-346. Guclu, A., Dees, J. G., & Anderson, B. B. (2002). The process of social entrepreneurship: Creating opportunities
worthy of serious pursuit. Center for the Advancement of Social Entrepreneurship (CASE), Fuqua School of Business, Duke University.
Hall, R. (1992). The strategic analysis of intangible resources. Strategic Management Journal, 13(2), 135-144. Harding, R. (2004). Social enterprise: The new economic engine? Business Strategy Review, 15(4), 39-43. Hsu, K. (2012). The advertising effects of corporate social responsibility on corporate reputation and brand equity:
Evidence from the life insurance industry in Taiwan. Journal of Business Ethics, 109(2), 189-201. Janney, J. J., & Gove, S. (2011). Reputation and corporate social responsibility aberrations, trends, and hypocrisy:
Reactions to firm choices in the stock option backdating scandal. Journal of Management Studies, 48(7), 1562-1585.
Zhang, R., & Largay, J. A. (2009). Wal-Mart and social capital: Builder, destroyer, or both. Academy of Management Perspectives, 23(2), 98-99.
Kotha, S., Rajgogal, S., & Rindova, V. (2001). Reputation building and performance: An empirical analysis of the top-50 pure internet firms. European Management Journal, 19(6), 570-586.
Lin, C., Chen, S., Chiu, C., & Lee, W. (2011). Understanding purchase intention during product-harm crises: Moderating effects of perceived corporate ability and corporate social responsibility. Journal of Business Ethics, 102(3), 455-471.
Madden, T., Roth, M., & Dillon, W. (2012). Global product quality and corporate responsibility perceptions: A cross-national study of halo effects. Journal of International Marketing, 20(1), 42-57.
McGuire J. B., Sundgren, A., & Schneeweis T. (1988). Corporate social responsibility and firm performance. Academy of Management Journal, 31(1), 854-872.
McWilliams A., & Siegel D. (2001). Corporate social responsibility: A theory of the firm perspective. Academy of Management Review, 26(1), 117-127.
Michalisin, M., Kline, D., & Smith, R. (2000). Intangible strategic assets and firm performance: a multi-industry study of the resource based view. Journal of Business Strategies, 17(2), 93-117.
National Research Council. (1991). Work and family: Policies for a changing workforce. Washington, DC: National Academy Press.
Newman, R. (2013). Wal-Mart’s well-timed good citizen campaign. U.S. News Digital Weekly, 5(3), 26. Pfarrer, M. D., Pollock, T. G., & Rindova, V. P. (2010). A tale of two assets: The effects of firm reputation and
celebrity on earnings surprises and investors' reactions. Academy of Management Journal, 53(5), 1131-1152.
Reputation Institute. (2013). The 2013 U.S. RepTrak Results and Report: The Most Reputable Companies in the U.S. https://www.reputationinstitute.com.
Rindova, V. P., Williamson, I. O., Petkova, A. P., & Sever, J. M. (2005). Being good or being known: An empirical examination of the dimensions, antecedents, and consequences of organizational reputation. Academy of Management Journal, 48(6), 1033-1049.

Page 60
Academy of Strategic Management Journal, Volume 13, Number2, 2014
Roberts, P. W., & Dowling, G. R. (2002). Corporate reputation and sustained superior financial performance. Strategic Management Journal, 23(12), 1077-1093.
Rumelt, R. P. (1987). Theory, strategy and entrepreneurship. In D. Teece (Ed.), The competitive challenge: Strategies for industrial innovation and renewal (pp. 137-157). Cambridge, MA: Ballinger.
Schmidt J., & Keil, T. (2013). What makes a resource valuable? Identifying the drivers of firm-idiosyncratic resource value. Academy of Management Review, 38(2), 206-228.
Sen, S., & Bhattacharya, C. B. (2001). Does doing good always lead to doing better? Consumer reactions to corporate social responsibility. Journal of Marketing Research, 38, 225-243.
Shamsie, J. (2003). The context of dominance: An industry-driven framework for exploiting reputation. Strategic Management Journal, 24(3), 199-215.
Shapiro, C. (1983). Premiums for high quality products as returns to reputations. Quarterly Journal of Economics, 98(4), 659-679.
Zhang, R., & Largay, J. A. (2009). Wal-Mart and social capital: Builder, destroyer, or both. Academy of Management Perspectives, 23(2), 98-99.
Social Enterprise Alliance. (2013). What’s a social enterprise? Social Enterprise Alliance: https://www.se-alliance.org/.
UNECA (2005). Economic report on Africa: Meeting the challenges of unemployment and poverty in Africa. Addis Ababa, Ethiopia: UNECA.
Vallaster, C., Lindgreen, A., & Maon, F. (2012). Strategically leveraging corporate social responsibility: A corporate branding perspective. California Management Review, 54(3), 34-60.

Page 61
Academy of Strategic Management Journal, Volume 13, Number 2, 2014
A PROFILE OF SOCIAL MEDIA USE BY FORTUNE 500 AND INC. 500 CORPORATIONS
Janet M. Ratliff, Morehead State University
Michelle B. Kunz, Morehead State University
ABSTRACT
This study examines the adoption of social media by Fortune 500 and Inc. 500 companies. Comparisons between the two corporate groups are made for adoption rate, corporate ranking, industry, and gender of corporate executive officers. Statistically significant differences were found regarding adoption of multiple social media, corporate ranking and gender influences of C-suite executives.
Keywords: social media, social network sites, gender differences, Fortune 500, Inc. 500.
INTRODUCTION
Social media, a general term for Web 2.0 technology, which allows consumer-generated content include blogs, wikis, RSS feeds, as well as social network sites (SNS) such as Facebook, LinkedIn, Flickr, or YouTube (Stuart, 2009). Early social media included blogs, RSS feeds and wikis and provided the means/technology for companies to communicate to and with customers and consumers quickly. Later social network sites “recruited” consumers to create personal profiles and share information with friends and family. Since inception, social network sites (SNSs) have attracted millions of users and become a part of their everyday life (Boyd & Ellison, 2008). What is unique for SNSs is the public posting of consumer information, including likes, dislikes as well as comments on brands, products and companies for other SNS members to view. From the corporate perspective, social media and SNS are effective in building brand awareness, generating word of mouth, and providing opportunities for specialized promotions (Hoffman & Fodor, 2010). The power of social media is in generating engagement and the opportunities to develop links with customers that has led to company and corporate participation in social media.
Different social media and social network sites may be more applicable for different consumers, industry, and corporate goals and strategy. For example, Cohen (2009) identifies LinkedIn as a social network site (SNS) and sees it as a good networking tool, while he views YouTube a good social media website. Furthermore, Cohen identified Twitter and Facebook as Web 2.0 sites with the whole package, as they have characteristics of both general social media, as well as being considered SNS. In fact, he goes on to explain that Facebook is primarily a networking site, but because it devotes so much of its layout to a space that allows individuals to include their own materials, it is perfect for media as well. Older social media, such as blogs and RSS feeds were originally used to provide news and frequently updated information. Today, these media are still appropriate for many corporate applications, such as news feeds (RSS) to financial

Page 62
Academy of Strategic Management Journal, Volume 13, Number2, 2014
customers. YouTube has long been a common source of video instruction, humor, special-interest subjects, as well as archived video content. This also provides a platform for corporate education and information broadcast which is enhanced using video content.
The purpose of this study is to examine the adoption of social media and social network sites (SNS) of major corporations appearing on the Fortune 500 and Inc. 500 lists of 2011. For the purposes of this study, the term social networking sites will be utilized to identify the following social media: Facebook, LinkedIn, Twitter, Tumblr, RSS Feeds, Blogs, and YouTube. Four of the social network sites mentioned in the study, Facebook, Twitter, YouTube, and LinkedIn are considered among the top social networks (Kumar & Sundaram, 2012).
CORPORATE BENEFITS OF SOCIAL NETWORK SITES
Social media and social networks are driven by discussions and conversations. Thus social
media provide a good venue for supporting the classic goal of corporate marketing and communication (Edosomwan, Prakasan, Kouame, Watson, & Seymour, 2011). Social media can support brand building as well as company reputation. Furthermore, the use of social media supports collaborative communication between current and potential customers, receiving customer feedback, and providing customer service and support. The key factor for success of social media is conversations. The fact that social media provide the ability to reach customers at multiple touch points, rather than through one channel (Quinton, 2011), is the most often cited benefit of social media adoption, according to 85% of the respondents to a survey conducted by Chief Marketer (chiefmarketer.com). Survey respondents indicated their target customers are spending increasing amounts of time in these channels. One significant aim for social media is to drive traffic to a brand website, with 15% of the survey respondents acquiring their web traffic from social media. The use of social media seems to be especially advantageous for small and medium-size enterprises (Pentina, Koh, & Le, 2012), due to moderate costs, and the flexibility with which smaller organizations can adapt social media for both marketing and new product development.
GROWTH AND ADOPTION OF SOCIAL NETWORK SITES
In 2011 Facebook, Twitter, LinkedIn and blogs were the top four social media tools used
by marketers, in that order (Stelzner, 2011). Larger businesses were more likely to use YouTube or other video platforms, and less likely to use blogs. For companies employing SMM for twelve months or less, Facebook and Twitter were the top two choices, while only three-percent indicated they did not plan to use Facebook. The continued recent growth of Facebook might be termed a phenomenon. eMarketer estimated that US growth for Facebook users was almost 39% in 2010 ("Facebook's US User Growth Slows but Twitter Sees Double-Digit Gains," 2012). However, it is predicted this growth will plateau, with 116.8 million US internet users logging on to the site at least once a month. Predictions for 2012 indicate the growth rate for Facebook will fall to single digits. However, Facebook is by far the most common channel for social marketing (Quinton, 2011), with over 90% using Facebook for marketing campaigns, either on their brand page or via

Page 63
Academy of Strategic Management Journal, Volume 13, Number 2, 2014
Facebook apps. Facebook had reached nearly 133 million US internet users by the end of 2011, with predictions it will surpass 150 million by 2014.
Quinton (2011) reported a large increase in the use of Twitter from 2010 (50%) to 2011, with more than three-fourths (77%) of companies surveyed using the platform to reach their audience, while another 15% planned to incorporate Twitter in 2011. Twitter growth remains strong, in fact recently overtaking Facebook growth ("Facebook's US User Growth Slows but Twitter Sees Double-Digit Gains," 2012). In 2011, the growth rate reported was almost 32%, with expectations it will remain nearly four times greater than Facebook’s growth rate in 2014. The percentage growth rate is based on Twitter’s current small base of users, with a US user base of less than 24 million the end of 2011. eMarketer predicts that Twitter will double its US user base between 2010 and 2014, reaching more than 37 million microbloggers. Twitter may have tipped beyond the point of early adoption, (Pentina et al., 2012), since the 2011 Social Media Marketing Industry Report indicated that large businesses are the most likely to increase Twitter activities (Stelzner, 2011). Given recent growth trends in social media, the question arises, is there a difference in the adoption of specific social networks by Fortune 500 versus Inc. 500 companies, since Fortune 500 corporations are older, larger and more financially mature, whereas Inc. 500 corporations are younger, rapidly growing and developing?
B2B marketers are slightly more likely to use LinkedIn (86%) than Facebook (85%) (Quinton, 2011). This is also supported by Stelzner (2011), with 71% of B2B more likely to increase their use of LinkedIn, as well as 68% of those who were self-employed (Stelzner, 2011). Dyrud (2011) reported that in business, primarily LinkedIn was used to manage professional images and network with one another as professionals. YouTube and video marketing may have more importance for B2C companies, rather than B2B, (Quinton, 2011) while it is currently used by almost two-thirds (61%) of those surveyed. Stelzner (2011) in the 2011 Social Media Marketing Industry Report indicated that more than three-fourths of those surveyed, planned to increase their use of YouTube and video marketing and that 82% of the large companies with 1000 or more employees recognized these social media as a key growth area. An earlier study (Barnes, 2010) also found Inc. 500 corporations differed in social media adoption, based upon industry. Specifically Barnes found that government and financial services, and energy companies were much more likely not to have adopted social media. Conversely speaking, Bottles and Sherlock (2011) contend that health care executives must incorporate social networks into their strategies, as there is an overwhelming need to provide consumers with information via the channel they frequent. Thus, the industry or type of corporation may influence which social network or social media adopted. Those industries and corporations that need to provide current news and information updates might find RRS feeds to the most efficient and effective means of communicating this information to their customers, while a company that finds instruction and information is best conveyed visually, might determine video demonstrations to be most effective. This leads one to wonder if there in an influence in the adoption of specific social networks or types of social media based upon industry.
Page 64
Academy of Strategic Management Journal, Volume 13, Number2, 2014
DEMOGRAPHICS OF SOCIAL MEDIA USERS
There is a direct relationship between age and time spent on social media. The younger the professional, the more time he or she spends on social media. In 2010 only 31% of marketers had used social media for one or more years, but a year later that number had grown to 50% (Quinton, 2011.) Sellers (2011) points out that women use social network sites more than men, and tend to stay on these sites longer. Furthermore, women provide the bulk of revenue at Facebook and gaming site Zynga, as well as most other fast-growing startups in consumer internet space. This is also supported by researchers (Gayen, McQuaid, & Raeside, 2010) who suggest that females are more inclined to use social media because they developed large networks of family, friend and business relationships, which they cultivate via social media. A 2012 Nielsen study ("State of the Media: The Social Media Report 2012," 2012) found females spend 36% more time on social media, using a PC, while they spend 46% more time via mobile device on social media than males. A recent study (Thomas, 2011) found female small business owners were more likely to use social media in the workplace; 43% of female business owners utilized at least one mode of social media in the workplace, and 48% indicated they would increase their focus on social media in the next year. Females are twice as likely to employ Facebook to generate sales and more likely than men to have a Twitter business account. Finally, women are more likely than men to have positioned their products/services to be purchased via their company website. Therefore, one questions if the gender of corporate leadership might influence the adoption of social media by the corporation.
TOP COMPANIES AND USE OF SOCIAL MEDIA/NETWORK SITES
Several researchers have examined top companies’ adoption and use of social media
(Barnes, 2006, 2010; Barnes & Andonian, 2011; Harris & Rae, 2009; Sarner, Collins, & Fletcher, 2011). Sarner et al. (2011) found that more than 80% of the top 100 companies appearing in the Fortune 500 have a presence on Facebook, and predicted that by the end of 2012 more than 60% of Fortune 500 companies will be actively engaging with their customers via Facebook. Given Facebook numbers, with more than 800 million active users, and 500 of those active each day, these researchers advocate the potential for Facebook to drive measurable benefits for both B2C and B2B organizations. A series of studies from the University of Massachusetts, Dartmouth have been examining the adoption and use of social media by corporations on the Fortune 500 and Inc 500 lists. A 2006 study (Barnes, 2006) examined blog adoption and uses. Results found the primary purpose of a blog was to serve as a platform or proxy for the CEO, and that blogs were not a fad, but a necessary means to develop online focus groups and to gather feedback and ideas for the corporation. Pitt, Parent, Steyn, Berthon, and Money (2011) reported that blogs were especially effective during a crisis, allowing corporations to connect with stakeholders and thereby strengthen their image, brand and customer loyalty. An Inc. 500 article (Schweitzer, 2009) referenced the Dartmouth research indicating that America’s fastest growing private companies were adopting social media marketing at a much higher rate than other companies, with 91% of the companies surveyed reporting they used at least one social media category. Twitter was the most widely used, while companies that did not then have a blog indicated they planned to initiate

Page 65
Academy of Strategic Management Journal, Volume 13, Number 2, 2014
one, and additionally, slightly more than one-third of the companies intend to use some form of online video. Eric Mattson, CEO of Financial Insite stated he believed that “Inc. 500 companies (fastest growing) are focused on growing faster, and social media is an innovative tool that could give these companies a competitive edge (para 5).” Furthermore, he indicated that private companies do not have to worry about the stock market reacting to someone’s Tweet, while smaller organizations can more easily adopt innovation because they are less process-oriented. Thus, one might ask if there is a difference between Fortune 500 (large) corporations, and Inc. 500 companies (fastest growing). As long as fifteen years ago, Christensen (1997) posited much the same perspective, stating that smaller companies are much more flexible in their routine and practices than large companies. Thus small companies should tend to be more innovative than large companies, which should have the advantage when more process-oriented innovations are concerned, and the need for greater financial resources. A recent study by Bhanot, (2012) supports this position, and it also found smaller companies were more likely to find customers via social networks than the relatively bigger business. These findings lead the current researchers to ask what influence ranking on the Fortune 500 or Inc. 500 list might have on adoption of social media.
Another University of Massachusetts study (Mora & Barnes, 2011) which examined the social media use of Inc. 500 companies in 2011 found the individual media usage patterns had changed during the 2006-2010 review period. The study also found a positive relationship between firm revenues and increasingly complex social networking sites (SNS) adoption. However, the use of SNS is strongly associated with blogs, but not with message boards (older technology). Companies with more resources prefer the adoption of more complex SNS-centered patterns. The researchers conclude that the use of Internet tools has grown as a result of increased adoption of social networking sites, representing a major shift from broadcast to interactive online media. This may be reflective of the general public’s adoption of social media, as well as the benefits firms are realizing from engaging in dialog with their customers. Another study from the University of Massachusetts, Dartmouth, (Barnes & Andonian, 2011) found that the adoption by Fortune 500 companies of Twitter, Facebook and blogs has leveled off in the past years. Thus these results may indicate a slowdown or retrenchment of the titans of business with regard to these three particular social network sites. Again, one might ask if there is a difference between the two corporate groups in adoption of specific social media/social network sites.
PURPOSE OF STUDY
The purpose of this study is to examine the adoption of social media and social network sites (SNS) of major corporations appearing on the Fortune 500 and Inc. 500 2011 lists. Based upon previous research findings the following research questions have been developed:
1. Is there a difference between the Fortune 500 and the Inc. 500 in adoption rate of social media?
2. Is there a difference between the Fortune 500 and the Inc. 500 in adoption of individual SNSs?
3. Is there a difference in adoption of social media based upon industry?
4. Is there a difference in adoption of social media based upon gender of the C-Suite officers?

Page 66
Academy of Strategic Management Journal, Volume 13, Number2, 2014
5. Is there a difference in adoption of social media based upon the ranking of the company in Fortune 500
or Inc. 500 list?
METHODOLOGY
The website for each of the corporations appearing on the 2011 Fortune 500 and Inc. 500 lists was examined for the presence of one or more application icons of a social media/SNS. Eight SNS or applications were identified across the corporations: blogs, Facebook, LinkedIn, RSS feeds, Twitter, Tumblr, and YouTube, as well as Myspace. However the frequency for MySpace was so small it was dropped from the data. Executive officers for each company were identified via Hoover’s database and/or the corporate website. Chief executive officers (CEO), chief information officers (CIO) and chief marketing officers (CMO) were identified by name, and classified by gender.
Results
All but two of the Fortune 500 corporations had a functioning website at the time of review, and all but five of the Inc. 500 websites were functional, resulting in a dataset of 993 corporations. A total of 890 CEOs were identified, 729 Chief Information Officers (CIO), and 346 Chief Marketing Officers (CMO). The majority of these officers were male (See Table 1), however the discrepancy between gender is not as large for Chief Marketing Officers. A comparison between Fortune 500 and Inc. 500 female executives shows that differences between the two groups exist. Specifically, the number of female CEOs and CIOs of the Inc. 500 corporations exceeds Fortune 500 corporations by a 3:1 and 4:1 ratio respectively. Conversely, female CMOs at Fortune 500 corporations exceed those at Inc. 500 by a ratio of 3:1.
Table 1 Sample Description/Frequencies
Item Websites Male CEO
Female CEO
Male CIO
Female CIO
Male CMO
Female CMO
Fortune 500 498 482 16 314 17 177 80
Inc 500 495 343 49 331 67 63 26
There were 124 (12.5%) corporations of the total 993 that did not have any social media presence. LinkedIn was the most frequently identified SNS, with 944 of the total 993 corporations having a LinkedIn presence. In decreasing order of frequency the number of companies with a SNS icon was: Facebook at 768, Twitter at 666, RSS fee at 486, YouTube at 416, blogs at 363, Tumblr at 208.

Page 67
Academy of Strategic Management Journal, Volume 13, Number 2, 2014
Table 2
Frequencies of Social Media by ListSocial Media Fortune 500 Inc. 500 Blog 232 131 Facebook 472 296 Twitter 398 268 LinkedIn 449 495 YouTube 320 96 RSS 387 99 Tumblr 200 8
In the process of data collection, it was noted that several corporations employed more than
one SNS. As a result, a new variable was created by summing the number of SNS’s adopted by individual corporations. This variable (Summed Multi) indicated that almost 60% of the companies have adopted between three to six different SNS’s.
Table 3 Frequency of Summed SM Applications
# SM Applications Frequency Percent 1 85 8.6 2 94 9.5 3 145 14.6 4 174 17.5 5 131 13.2 6 141 14.2 7 86 8.7 8 13 1.3 Total 993 100.0
Data Analysis
Statistical analysis using chi-square test of independence was used to examine adoption of individual SNS by list membership, and found a statistically significant difference. As noted in Table 4, Fortune 500 companies were more likely to adopt social media than Inc. 500 corporations. A chi-square test of independence was employed to determine if there were differences between the two corporate groups in the adoption of individual SNS. The results indicated that Fortune 500 companies were more likely to adopt all of the individual SNS or social media, with the exception of LinkedIn. The Inc. 500 companies were more likely to have adopted LinkedIn than the Fortune 500 corporations. Thus the answer to both research questions 1 and 2 is yes, there are differences based upon the corporate group in the adoption of social media overall as well as individual SNS.
The third research question asked if there is a difference in adoption of social media, based upon industry. The industries specified by each of the respective publications were examined, but the number of companies identified for each industry was too small to examine statistically.

Page 68
Academy of Strategic Management Journal, Volume 13, Number2, 2014
Further grouping of similar industries into merged industry categories again found no statistical significance. In fact, examination of the cross-tab frequencies found some industries with no social media adoptions. While there were no statistically significant differences found based upon industry, it should be noted that some industries, such as healthcare and medical related products/services, as well as financial institutions are under heavy regulation about the security of data and information, which may inhibit adoption of social media in these or similar industries.
Table 4 Chi-square Adoption of Individual SM or SNS
SM / SNS χ2 df p-value # Fort 500 #Inc 500 Blog 43.34 1 .000 232 131 Facebook 173.34 1 .000 472 296 Twitter 74.69 1 .000 398 268 LinkedIn 241.18 1 .000 449 495 YouTube 205.26 1 .000 320 96 RSS 330.87 1 .000 387 99 Tumblr 222.73 1 .000 200 8
In order to determine if there were differences between the two corporate groups regarding
adoption of multiple SNS, the Summed Multi variable was tested using chi-square test of independence. The results were statistically significant (χ2= 399.49, df=8, p <.000). When comparing the actual versus expected frequencies, Fortune 500 companies were more likely to employ higher numbers of different SNS, between 5-8 combined SNS’s. The Inc. 500 companies were more likely to have adopted between 1-3 SNS’s. There were no differences between the two groups of corporations who had adopted four SNS’s.
To determine if the ranking of individual corporations played a role in the adoption of social media, the companies on each of the two published lists were placed in quintiles, and a chi-square test of independence by quintiles within the respective list was performed. Results were statistically significant for the Fortune 500 companies with the exception of LinkedIn. The results of cross-tab analysis found the larger companies (higher ranked) were more likely to have adopted the individual SNS as indicated in Table 5. Conversely, chi-square analysis of the Inc. 500 companies found only adoption of LinkedIn was statistically significant, (χ2= 31.794, df=4, p <.000). Again, the larger corporations (higher ranked) were more likely to have adopted LinkedIn.
Table 5
Chi-square Adoption of SM by Quintile Fortune 500SM / SNS χ2 df p-value Blog 104.489 4 .000 Facebook 15.066 4 .005 Twitter 27.075 4 .000 YouTube 36.361 4 .000 RSS 15.856 4 .003 Tumblr 52.630 4 .000
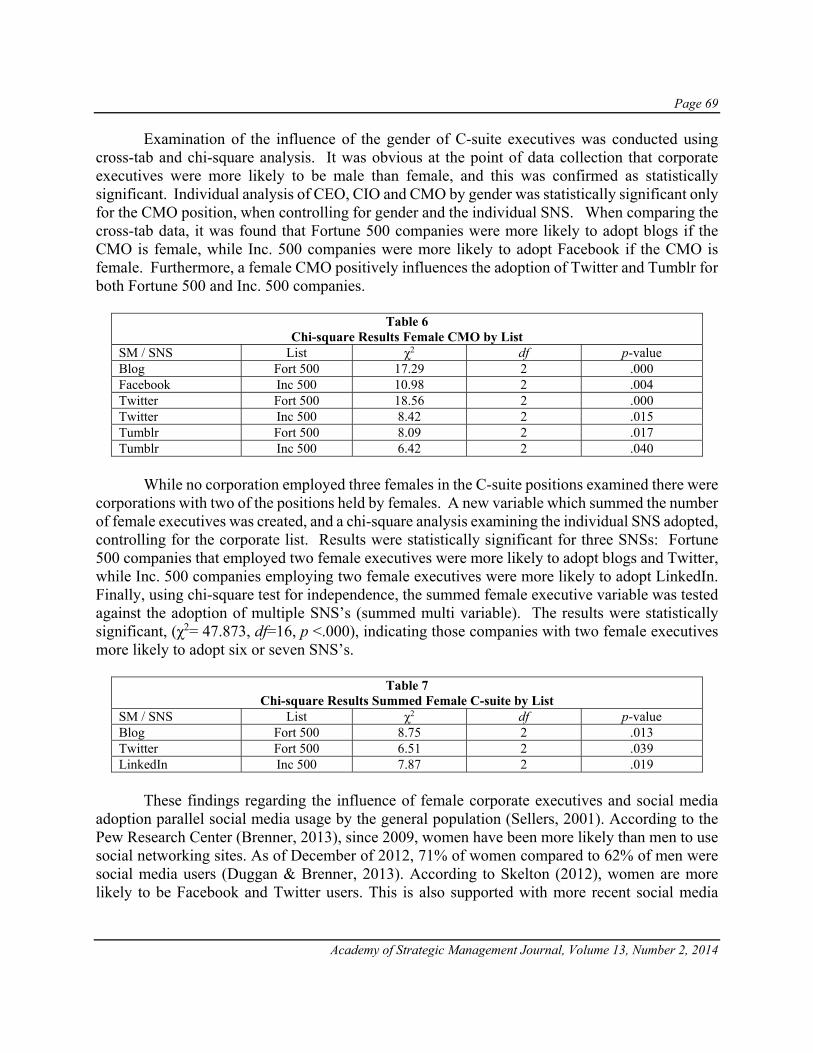
Page 69
Academy of Strategic Management Journal, Volume 13, Number 2, 2014
Examination of the influence of the gender of C-suite executives was conducted using cross-tab and chi-square analysis. It was obvious at the point of data collection that corporate executives were more likely to be male than female, and this was confirmed as statistically significant. Individual analysis of CEO, CIO and CMO by gender was statistically significant only for the CMO position, when controlling for gender and the individual SNS. When comparing the cross-tab data, it was found that Fortune 500 companies were more likely to adopt blogs if the CMO is female, while Inc. 500 companies were more likely to adopt Facebook if the CMO is female. Furthermore, a female CMO positively influences the adoption of Twitter and Tumblr for both Fortune 500 and Inc. 500 companies.
Table 6 Chi-square Results Female CMO by List
SM / SNS List χ2 df p-value Blog Fort 500 17.29 2 .000 Facebook Inc 500 10.98 2 .004 Twitter Fort 500 18.56 2 .000 Twitter Inc 500 8.42 2 .015 Tumblr Fort 500 8.09 2 .017 Tumblr Inc 500 6.42 2 .040
While no corporation employed three females in the C-suite positions examined there were
corporations with two of the positions held by females. A new variable which summed the number of female executives was created, and a chi-square analysis examining the individual SNS adopted, controlling for the corporate list. Results were statistically significant for three SNSs: Fortune 500 companies that employed two female executives were more likely to adopt blogs and Twitter, while Inc. 500 companies employing two female executives were more likely to adopt LinkedIn. Finally, using chi-square test for independence, the summed female executive variable was tested against the adoption of multiple SNS’s (summed multi variable). The results were statistically significant, (χ2= 47.873, df=16, p <.000), indicating those companies with two female executives more likely to adopt six or seven SNS’s.
Table 7 Chi-square Results Summed Female C-suite by List
SM / SNS List χ2 df p-value Blog Fort 500 8.75 2 .013 Twitter Fort 500 6.51 2 .039 LinkedIn Inc 500 7.87 2 .019
These findings regarding the influence of female corporate executives and social media adoption parallel social media usage by the general population (Sellers, 2001). According to the Pew Research Center (Brenner, 2013), since 2009, women have been more likely than men to use social networking sites. As of December of 2012, 71% of women compared to 62% of men were social media users (Duggan & Brenner, 2013). According to Skelton (2012), women are more likely to be Facebook and Twitter users. This is also supported with more recent social media

Page 70
Academy of Strategic Management Journal, Volume 13, Number2, 2014
demographic data (Garibian, 2013) which indicates women continue to dominate Facebook (57%) and Twitter (59%).
SUMMARY AND LIMITATIONS
Fortune 500 companies have a higher adoption rate of social media than the Inc. 500 companies, with the exception of LinkedIn; 100% of the Inc. 500 companies while 90 % of the Fortune 500 companies have adopted LinkedIn. The results indicate that 60% of the corporations have adopted multiple social networking sites/social media. While no statistical significance was found based upon industry, some patterns were revealed which support finding by Barnes (2010) regarding non-adoption of social media, particularly related to government and financial services as well as well as medical related industries. This is a limitation to the current study, which could not fully categorize sufficient numbers of companies by industry to statistically analyze the current data. Further research might re-align industry classifications with broader strokes and make additional analysis possible beyond this study. Fortune 500 companies with larger revenues, (higher rank on list) were more likely to have adopted social media. This is the case only for LinkedIn with the Inc. 500 corporations. Thus the overall size of the corporation is a positive influence in the adoption of social media.
Gender of C-suite officers was significant in specific applications. Female Chief Marketing Officers were the only individual executive position which positively influenced social media adoption. Multiple female executives also positively influenced social media adoption. There is a move toward integration and cooperation between IT and marketing in the corporate environment, which would indicate CIOs and CMOs work together in determining appropriate corporate strategy, technological implementation, and determination of data strategies and needs as well (Dupre, 2013) (Reda, 2012). In fact, Dupre suggests that forming a union between IT and marketing provides the opportunity to harness technology to the good of the overall corporation. With the advent of SNS, technology provides the platform for marketing communication and strategy implementation. The union of these two executives and their operations could be the supporting reason why female CMO’s and multiple female C-suite executives were influential in the adoption of SNS in this current study. Until recently, marketing and IT were very different disciplines, but now CMOs and CIOs know they need to support each other in order to improve performance and deliver higher returns on investment (Reda, 2012). Ultimately, it appears as though social networking sites and their adoption is going to be a continuing trend. Not only are Fortune 500 and Inc. 500 corporations on board, but women in key positions within the c-suite appear to be contributing positively to this increasingly important strategy to make the use of social networking sites even more profitable to their respective bottom lines. As stated previously, women in the general population have a higher adoption rate of social media than men. Thus, this could transfer to the corporate environment resulting in female executives being stronger proponents of incorporating social media in the overall corporate strategy.
The fact that executive officers identified for this study included only chief executive, chief information and chief marketing officers could be considered a limitation to the findings here. Future research might be more inclusive of executive officers and titles used within the corporations. Another limitation in this area is the fact that the organization and definition of

Page 71
Academy of Strategic Management Journal, Volume 13, Number 2, 2014
executive officers in the Inc. 500 companies is less consistent than that of the Fortune 500 companies. In addition, consideration for future research might include more and/or newer SNS. However, this appears to be a frequently changing target to define and identify, thus longitudinal consistency may be problematic as social media and SNS are rapidly growing and adapting applications and uses.
IMPLICATIONS
These results show that it is obvious Fortune 500 companies have adopted social media,
while Inc. 500 companies are more selective in their adoption pattern. However, it appears that in general corporations are realizing the significant role social media can play in the corporate communication strategy. Relevance of social media to the corporation and its strategy may be influenced by industry and pertinent regulations, as well as corporate resources. Baird & Parasnis (2011) consider social media use as a new corporate strategy, which recognizes that instead of managing customers, the role of business is to facilitate collaborative experiences which provide customer value. This study found that nearly 70% of executives believe their companies will be seen as out of touch if they don’t engage, and also believe their competitors are successfully reaching customers through social media. Baird and Parasnis further suggest that companies can take advantage of this dynamic by designing social media programs with the explicit goal of touching customers emotionally and motivating them to share their experiences with others. Witzig, Spencer and Galvin (2012) examined non-profit, large companies and small businesses to determine patterns regarding adoption and use of social media. These researchers determined this virtual environment has low entry costs, and that a digital platform like LinkedIn provides opportunity for organizations to connect on a more personal level with current and potential customers.
A recent Nielsen study ("State of the Media: The Social Media Report 2012," 2012) used the term proliferation in consumers’ life when reporting on current social media statistics. The number of social media and SNS has exploded, and continues to grow daily, with the addition and/or integration of social features on websites. For example, Pinterest was termed the “break out” SNS in 2012. The study also uses the term “hyper-informed consumer” to explain the impact social media has had on the way consumers across the globe make purchase decisions, search product information, as well as find out about brands, and purchase incentives. This would indicate social media and SNS should be included in design and development of corporate strategy beyond simple marketing strategy, to be considered across the corporate structure. By all indications, social medial is not just a fad, but is here for the duration, in some shape or form, so executives need to make it a priority in their strategic planning.

Page 72
Academy of Strategic Management Journal, Volume 13, Number2, 2014
REFERENCES
Baird, C. H., & Parasnis, G. (2011). From social media to social customer relationship management. Strategy and
Leadership, 39(5), 30-37. Barnes, N. G. (2006). Behind the scenes in the blogosphere: Advice from established bloggers. Dartmouth, MA:
University of Massachusetts. Barnes, N. G. (2010). The 2010 Inc. 500 update: Most blog, friend and tweet but some industries still shun social
media. In C. F. M. Research (Ed.). Dartmouth, MA: University of Massachusetts Dartmouth. Barnes, N. G., & Andonian, J. (2011). The 2011 Fortune 500 and social media adoption: Have America's largest
companies reached a social media plateau? Dartmouth, MA: University of Massachusetts Dartmouth. Bhanot, S. (2012). Use of social media by companies reach their customers. SIES Journal of Management, 8(1), 47-
55. Bottles, K., & Sherlock, T. (2011). Who should manage your social media strategy? Physician Executive, 37(2), 68-
72. Boyd, D. M., & Ellison, N. B. (2008). Social network sites: Definition, history, and scholarship. Journal of Computer-
Mediated Communication, 13, 210-230. Brenner, J. (2013). Pew Internet: Social networking (full detail) Retrieved April 8, 2013, from
pewinternet.org/Commentary/2012/March/Pew-Internet-Social-Networking-full-detail.aspx Christensen, C. M. (1997). Innovator's dilemma: When new technologies cause great firms to fail (Hardcover) (pp.
1). Cohen, L. S. (2009, April 30). Is there a difference between social media and social networking? Retrieved September
30, 201, from http://cohenside.blogspot.com/2009/03/is-there-difference-between-social.html Duggan, M., & Brenner, J. (2013). The demographics of social media users--2012. Washington, D.C.: Pew Research
Center’s Internet & American Life Project. Dupre, E. (2013, April). The new power couple. Direct Marketing News, 20-23. Dyrud, M. A. (2011). Social networking and business communication pedagogy: plugging into the Facebook
generation. Business Communication Quarterly, 74(4), 475-478. Edosomwan, S., Prakasan, S., Kouame, D., Watson, J., & Seymour, T. (2011). The history of social media and its
impact on business. Journal of Applied Management and Entrepreneurship, 16(3), 79-91. Facebook's US user growth slows but twitter sees double-digit gains. (2012). eMarketer.com. Retrieved from
http://www.emarketer.com/Article.aspx?R=1008879 Gayen, K., McQuaid, R., & Raeside, R. (2010). Social networks, age cohorts and employment. The International
Journal of Sociology and Social Policy, 30(5/6), 219-238. Harris, L., & Rae, A. (2009). Social networks: The future of marketing for small business. Journal of Business
Strategy, 30(5), 24-31. Hoffman, D., & Fodor, M. (2010). Can you measure the ROI of your social media marketing? MIT Sloan Management
Review, 52(1), 41-49. Kumar, V., & Sundaram, B. (2012). An evolutionary road map to winning with social media marketing. Marketing
Research, 4-7. Mora, J., & Barnes, N. G. (2011). Online media in fastest-growing companies: Adoption, usage, and relation to
revenues. Marketing Management Journal, 21(2), 128-144. Pentina, I., Koh, A. C., & Le, T. T. (2012). Adoption of social networks marketing by SMEs: exploring the role of
social influences and experience in technology acceptance. International Journal Internet Marketing and Advertising, 7(1), 65-82.
Pitt, L. F., Parent, M., Steyn, P. G., Berthon, P., & Money, A. (2011). The social media release as a corporate communication tool for bloggers. IEEE Transactions on Professional Communication, 54(2), 122-132.
Quinton, B. (2011). Social marketing goes mainstream. Chief Marketer, 3(5), 24-27. Reda, S. (2012, October). Mesh for success: Retail CMOs and CIOs are seeing the benefits of collaboration. Stores,
94, 20-23.

Page 73
Academy of Strategic Management Journal, Volume 13, Number 2, 2014
Sarner, A., Collins, K., & Fletcher, C. (2011) Predicts 2012: Marketers must adapt, differentiate and innovate in social CRM, SaaS and IMM. Gartner, Inc.
Schweitzer, T. (2009). Study: Inc. 500 CEOs aggressively use social media for business. Inc. Retrieved from http://www.inc.com/news/articles/2009/11/inc500-social-media-usage.html
Sellers, P. (2011). Will the next Facebook be founded by a woman? Fortune, 164(6), 154-154. Skelton, A. (2012, March 9). Social demographics: Who's using today's biggest networks. Retrieved April 10, 2013,
from http://mashable.com/2012/03/09/social-media-demographics/ . State of the media: The social media report 2012. (2012). The Nielsen Company. Stelzner, M. A. (2011). 2011 Social media marketing industry report: How marketers are using social media to grow
their business: SocialMediaExaminer.com. Stuart, D. (2009). Social media metrics. Online, 33(6), 22-24. Thomas, D. (2011). Aussie women prove more social at using social media in business arena. Lifehacker Australia,
(December 12). Retrieved from http://www.socialnomics.net/2011/12/12/aussie-women-proving-more-social-at-using-social-media-in-business-arena/
Witzig, L., Spencer, J., & Galvin, M. (2012). Organizations' use of LinkedIn: An analysis of nonprofits, large corporations and small businesses. Marketing Management Journal, 22(1), 113-121.

Page 74
Academy of Strategic Management Journal, Volume 13, Number2, 2014

Page 75
Academy of Strategic Management Journal, Volume 13, Number 2, 2014
HOW FIRM CHARACTERISTICS AFFECT THE SPEED OF PATENTING
Derek Ruth, Northern Illinois University
ABSTRACT One of the central tools that firms have at their disposal to protect their intellectual property via patents. Despite patents’ central importance in developing and maintaining competitive advantage, very little is known of how firm characteristics influence a firm’s ability to patent. Since time is so often of the essence in bringing in new technologies to market, and patents are so central to the protection of these technologies from competition, this paper looks that firm characteristics that affect the speed with which a patent is obtained, as measured by the pendency period. Using a sample of more than 250,000 individual patents, we find that firm size, and free cash flows help firms obtain patents more quickly, while overall, the length of time required to patent is increasing. Interestingly, prior experience with patenting does not appear to affect the pendency period.
INTRODUCTION Patents represent one of the key tools that firms can use to protect their intellectual property. In successfully prosecuting a patent, a firm gains exclusive rights to exclude others from “making, using, offering for sale or selling the invention throughout the United States or importing the invention into the United States" (USPTO, 2009) for a period of up to 20 years. By virtue of this ability to exclude others from infringing on the patent a firm is, in theory, better able to profit from their intellectual property and recover such things as monies invested in the research and development of said intellectual property. The patenting process begins with the filing of a patent application with the United States Patent and Trademark Office (USPTO, 2009). Once received, the application is examined to ensure that the claims made in the patent meet three key tests of being useful, non-obvious, and unique (USPTO, 2009). If the patent’s claims pass these three tests, the patent is issued. This lag between the application being filed and the patent being issued is referred to as the pendency period. In addition to the importance of patenting, which has been the topic of many different papers and studies, we argue in this paper that the speed with which firms are able to patent is also important. In other words, we believe that it is not just the successful issuance of a patent that is important, but also that the speed with which that patent is won is also important.
Page 76
Academy of Strategic Management Journal, Volume 13, Number2, 2014
In essence, a successful patent application is evidence of attempts to create new products (Hausman, Hall & Griliches, 1984) and evidence of new knowledge that has been created (Jaffe, Trajtenberg, and Henderson, 1993). In the management literature, the key to long-term success of a firm is not just achieving a competitive advantage, but rather achieving one that is sustainable over time (Penrose, 1959; Prahalad and Hamel, 1990; Barney, 1991; Peteraf,1993). By their very nature—explicitly excluding competition for up to 20 years—patents can be a key source of sustainable competitive advantage. The rights conferred to patent holders are valuable in a monetary sense as well, increasing the likelihood of obtaining financing and helping to improve their bargaining position in licensing deals (Grindley & Teece, 1997). In general, firms want the pendency period to be as short as possible. If an invention cannot be patented—or if certain claims made in the patent are denied—the potential value of the intellectual property is reduced, perhaps to the point that further development and marketing of products based on the technology may not be worthwhile in the absence of patent protection. In the case of a lengthy pendency period, a firm faces two choices: either forge ahead with product development and marketing efforts at the risk of being unable to prevent later competition; or scale back on the aforementioned outlays until the patent is issued and limits to competition are guaranteed. In either situation, a firm will prefer to know the fate of their patent application sooner rather than later (i.e., they prefer a shorter pendency period). The central purpose of this paper is to shed light on the factors that influence the speed with which firms obtain patents. With these results in hand, firms may be able to more quickly and efficiently protect their intellectual property with patents. In considering the factors affecting the pendency period, we consider two chief types of factors: firm-level and patent-level characteristics. The theoretical framework draws on two mean streams of literature: organizational learning and firm capabilities. Using data from the USPTO databases and publicly traded firms, we test the empirical link between firm- and patent-level characteristics on the pendency period of patents issued between 1980 and 2000. The remainder of this paper is divided into four sections. The first section, Theory and Hypotheses, reviews relevant theory and develops the hypotheses that are tested later in the paper. The Data and Methods section lays out the data collection process, sample construction, and statistical methods used to test the paper’s hypotheses. In the Results section, we summarize and present the findings of our empirical tests. The paper ends with Discussion and Conclusions, where we discuss the implications of our findings, both in terms of theory development as well as for managers involved in the patenting process. The section closes with suggestions for future research.
THEORY & HYPOTHESES Although it is difficult to determine directly, the chance that a given patent application will eventually be issued (i.e., a patent granted) is somewhere in the neighborhood of 40-70% (see

Page 77
Academy of Strategic Management Journal, Volume 13, Number 2, 2014
Table 1 below). The difficulty in estimation arises from the fact that the patents granted in a given year are overwhelmingly from applications that were filed in the previous year, and the ratio of patents granted relative to patent applications changes from year to year. Looking at USPTO records from 1980 to 2000, more than 90% of patents had pendency periods longer than 12 months. Table 1 lists the number of patents applied for and issued annually from 1980 to 2000. Although the number of both applications and issuances has tended to increase over the years (see Figure 1 below), the ratio of patents granted relative to applications filed in a given year has varied widely, from a low of 48.3% 1995 to a high of 64.7% in 1987 (see Table 1 for a list of annual success rates). Keep in mind that the vast majority of patents issued in a given year are from applications that were submitted in previous years, so the aforementioned percentages are not a direct reflection of a given application’s probability of success.
Table 1 Number of patent applications filed and patents granted annually from 1980 to 2000.
Year Applications Filed Patents Granted Ratio of Granted
to Filed*
1980 112,315 61,227 54.5%
1981 114,710 71,010 61.9%
1982 124,800 65,152 52.2%
1983 105,704 59,715 56.5%
1984 117,985 72,149 61.2%
1985 125,931 75,302 59.8%
1986 131,403 76,993 58.6%
1987 137,173 88,793 64.7%
1988 148,183 83,584 56.4%
1989 163,306 102,710 62.9%
1990 174,711 96,725 55.4%
1991 178,083 101,858 57.2%
1992 185,446 109,729 59.2%
1993 188,099 107,331 57.1%
1994 201,554 113,267 56.2%
1995 236,679 114,241 48.3%
1996 206,276 116,875 56.7%
1997 237,045 122,975 51.9%
1998 256,666 154,578 60.2%
1999 278,268 159,161 57.2%
2000 311,807 182,218 58.4%
* Note that applications filed are separate from patents granted due to the pendency period. In other words, the patent applications filed in a given year are overwhelmingly granted or rejected/withdrawn in the years after the one in which they were filed.

Page 78
Academy of Strategic Management Journal, Volume 13, Number2, 2014
Definition of pendency, explication of patent rights This paper is primarily concerned with the patenting pendency period—or the lag between application and issuance—which varies widely from patent to patent. In general, firms have multiple motivations to minimize the pendency period and have little reason to prefer a longer pendency period. As far as we know, this paper represents a first effort at exploring the antecedents of the pendency period, but other papers have also shown that speed is of the essence in other areas of patenting. For example, a recent study found a strong link between patents that cited more recently-granted patents and measures of patent quality (Nagaoka, 2007). That is, being better able to quickly assimilate current knowledge was associated with not only winning a higher number of claims, but also ended up being cited more widely by patents that followed (Nagaoka, 2007). One of the primary motivations to reduce the pendency period is simply one of cost. In many cases, the patenting process is an iterative one, requiring a back and forth process between the USPTO and the applicant (USPTO, 2009). In many cases, this back and forth is the result of claims being denied and/or a request by the patent examiner for the applicant to justify or adjust the content of the patent application (USPTO, 2009). To the extent that the pendency period drags on, applicants will incur a variety of costs. Among these costs are administrative costs needed to handle the application; legal fees; and other associated costs, such as those required to produce drawings or diagrams for the patent. In addition to the direct costs incurred as a result of a lengthy pendency period, patentability is often of prime import when deciding how to proceed with further product development, marketing, and production of a given piece of intellectual property. If a firm is unable to patent a given technology—or even if some of the claims made by the patent are denied—this can reduce, perhaps even to zero, the expected value of products and services that are based on the product. For example, a study of the premium associated with patents found that, on average, firms expect to earn 50% more from a patented innovation than from one that is unpatented (Arora et al, 2008). To the extent that this is true, a firm will prefer to know sooner rather than later whether or not their technology is fully protectable via patent before investing further resources in product development In addition to wanting to minimize monetary costs associated with a delayed patent application, firms are also motivated to move patents through to issuance for reasons related to timing. From a competitive standpoint, firms will want to have their technology patented first and the related products and services first to market in order to develop a first mover advantage (Gilbert & Harris, 1981; Spence, 1981; Barney, 1991; Lieberman & Montgomery, 1988). To the extent that first-to-patent and first-to-market pressures are intertwined, this adds to the motivation of firms to minimize the pendency period. One of the limitations of this paper is that it does not directly test this link between the rush to patent and the rush to market. Nonetheless, it is a potentially important motivation that may be driving our results and thus bears and bears mentioning. The establishment of such a link thus falls to other studies.

Page 79
Academy of Strategic Management Journal, Volume 13, Number 2, 2014
Many firms also use patenting as a way of continuing to protect a product whose original patent has or is about to expire, a process referred to as greenfielding. In the case of greenfielding, firms slightly tweak the original product and patent this slight modification in order to extend protection and ward off competing products. As with more traditional patenting strategies, time is still of the essence in greenfielding in order to maintain a firm’s ability to extract rents through the sale of the product. All of these things taken together build a compelling case that, in general, firms should prefer to minimize the pendency period. This paper represents a first attempt at identifying some of the factors that affect the pendency period. With a better understanding of these factors, firms may be able to change their patenting strategy in order to reduce the lag time between the application and ultimate issuance of their patents. Although patent protection is granted retroactively from the issuance date to the date of application, there is very strong motivation to move the patent forward to issuance as quickly as possible. In other words, inventors are motivated not only to be early-appliers, but also to minimize the pendency period. Moving the patent quickly from the pending to the issued stage can help a firm minimize the costs involved in the patenting process. These costs include such things as legal and administrative fees as well as time and other resources that are devoted to the patenting process. The second motivation for the rush to issuance lies in the double-edged-sword nature of the patenting. On the one hand, patents are valuable because of their ability to limit competition for a given piece of intellectual property. On the other hand, the exact nature of the intellectual property must be disclosed to the USPTO for evaluation, and will ultimately be publicly available within 18 months of application or when the patent is issued, whichever span of time is shorter. The nature of the patent protection system is such that the right to protection for a given piece of intellectual property outlined in a patent applies retroactively to the application date. In other words, a firm applies for a patent and must work to move the application through the patent inspection process to the end goal which is, ultimately, to have the patent issued (or granted). Once the patent has been issued, the holder of the patent is entitled to (in most cases) up to 20 years of protection from infringement by others. Over time, the volume of patents applied for and issued each year has risen dramatically (see Table 1). As well, the number of classification categories has also risen dramatically. Thanks in part to the rise of patent vultures there has been an increase in the number of patents that have been broken, as well as in the number of patent infringement lawsuits. Taken together, all of these forces undoubtedly increase the economic and political pressures faced by the USPTO, as well as increasing the information processing burden on the patent inspectors. As a result, we expect to see the average pendency period to increase over time:
H1: Over time, the delay between application and issuance of a patent will increase

Page 80
Academy of Strategic Management Journal, Volume 13, Number2, 2014
The adage that time is money is an apt one as it relates to patents. Although the USPTO fees for patents are relatively low, a successful patent application almost always requires the services of intellectual property attorneys, who have among the highest billing rates in the legal profession. As the patenting process drags out over time, a firm can expect to incur more fees. In the case of larger firms, they have more resources at hand to move a given patent forward to issuance (perhaps even having a fulltime patent lawyer in their employ). Whereas a larger firm may have an advantage in developing patentable ideas, a larger firm may have infrastructure better designed to move a patent application forward to issuance.
H2: The larger the firm, the shorter will be the pendency period
Given the high costs of obtaining a patent, it stands to reason that available resources may impinge upon a firm’s ability to move the patent application forward to issuance. One of the primary methods we have for gauging a firm’s available resources is through financial slack. There are other types of slack, including human resource slack (such as idle employees), but even in the absence of slack in human resources, financial slack could be used to bring more employees to bear upon a given patent application. This assumption seems fair given that all but the very largest firms outsource their intellectual property law management to external firms, meaning that the process is much more likely to be funded directly through financial resources than through slack in human resources.
H3: The more financial slack, the shorter will be the pendency period
Firm Capabilities and Speed of Granting In a study of European firms, Reitzig and Puranam (2009) advanced the idea that firms have heterogeneous capabilities for obtaining patents. While they emphasized the importance of speed of patenting, Reitzig and Puranam focused on functional specialization and its influence on the success of a given patent application. Here, we look only at successful patents and the speed with which they were obtained. Organizational capabilities—defined as a firm’s “capacity to deploy Resources… to effect a desired end” (Amit & Schoemaker, 1993) —improve with practice, and we expect to find evidence of this learning with a change in pendency periods. That is to say, the more often that a firm patents, the more efficient it will become at moving the patent forward from application to issuance, captured here by a shorter pendency period. In short, a firm may develop a capability in patent prosecution. This should be thought of as distinct from a capability in innovation or idea generation; this capability to patent refers specifically to a firm’s ability to move a patent forward from application to issuance. In Reitzig and Purinam’s terms, the former is a capability in value creation, whereas the latter is a capability in value appropriation (Reitzig & Purinam, 2009). On average, then, frequently-patenting firms should experience shorter pendency periods for their applications:

Page 81
Academy of Strategic Management Journal, Volume 13, Number 2, 2014
H4: The more patents a firm does per year, the shorter will be the pendency period
DATA & METHODS
Data collection Data was collected from two sources: the United States Patent and Trademark Office and the Compustat database of public companies. In order to be included in the analyses, values had to be present for all dependent and independent variables for the model at hand. The sample included data from all publicly traded firms from 1980 to 2000. One of the chief issues with combining both patent and Compustat data is that there is no common identifier that allows direct merging of the two data sets. Compustat and other databases us the Committee on Uniform Securities Identification Procedures (CUSIP) Number, but the USPTO uses a separate identifier called assignee and assignee number. The CUSIP numbers were mapped onto the assignees’ identities using a text matching algorithm. Sample The final sample consisted of 247,140 patents. Table 2 gives descriptive statistics and bivariate correlations for the variables used in the analyses. It should be noted that this is a study only of successful patent applications and, by construction, does not look at patents that were applied for but not granted during the sampling window (1980 to 2000). Since patent characteristics, particularly the Pendency Period, represent a central focus of the paper, it did not make sense to include unsuccessful patents in our analyses.
Table 2 Bivariate correlations of variables used in statistical analyses. All patent level variables, including Pendency Period (the dependent variable), are taken at time t. The remaining explanatory variables, all firm-level in nature, are from time t-1. Mean Std. Dev. 1 2 3 4 5 6 7
1. Fiscal Year 1992.36 5.78
2. Patents in Last 4 Years(t-1) 1167.37 1377.15 0.342
(<0.001)
3. Free Cash Flows(t-1) 0.21 2.43 0.012 0.028
(<0.001) (<0.001)
4. Total Sales(t-1) 19085.59 26931.34 0.183 0.479 0.029
(<0.001) (<0.001) (<0.001)
5. Total Assets(t-1) 21579.00 36976.91 0.184 0.380 0.030 0.957
(<0.001) (<0.001) (<0.001) (<0.001)
6. R&D(t-1) 1100.97 1426.15 0.299 0.648 0.027 0.924 0.877
(<0.001) (<0.001) (<0.001) (<0.001) (<0.001)
7. Net Income(t-1) 605.29 1739.53 0.117 0.092 0.031 0.254 0.219 0.248
(<0.001) (<0.001) (<0.001) (<0.001) (<0.001) (<0.001)
8. Return on Assets(t-1) 0.14 0.12 -0.062 -0.032 0.033 -0.072 -0.085 -0.055 0.209
(<0.001) (<0.001) (<0.001) (<0.001) (<0.001) (<0.001) (<0.001)

Page 82
Academy of Strategic Management Journal, Volume 13, Number2, 2014
Dependent Variable The dependent variable it a patent-level measure and was calculated as the difference, in days, between the date of application and its date of issuance. Figure 1 shows the distribution of pendency periods for patents issued from 1980 to 2000. The figure represents better than 99% of all patents issued during that time span, but excludes some problematic observations. For example, we excluded a small number of observations that gave pendency periods that were zero or negative in duration (the negative period being impossible to achieve). As well, we did not plot observations with pendency periods in excess of 79 months for ease of representation. That being said, there is a small number of patents whose pendency period stretches beyond ten years. Explanatory Variables Fiscal Year was taken to be the year in which the patent was ultimately granted. This year was then used to match patent up with the financial numbers of their parent companies. In order to measure the effect of firm size on Pendency Period, we used two different commonly used measures of firm size: Total Sales and Total Assets. Financial Slack was measured as the amount of free cash flows within the firm. Because the number of patents that a firm does can fluctuate widely from year to year, and because we expect the learning effect, if any, to persist more than a single year, we looked at firms’ total patenting output over the past four years. Figure 1 – Distribution of pendency periods (measured in weeks) for patents issued from 1980 to 2000. Although more than 99% of patents are represent on the chart, a small number of outliers were excluded, including those with a reportedly negative pendency period (something that is theoretically impossible and likely due to a clerical error), and those with a pendency period in excess of 80 weeks.
0.0%
1.0%
2.0%
3.0%
4.0%
5.0%
0 20 40 60 80
Per
cen
tage
of
Sam
ple
Pendency Period in Weeks

Page 83
Academy of Strategic Management Journal, Volume 13, Number 2, 2014
To test the notion that there may be economies of scale or learning that affect the pendency process, we look at the number of patents that a firm was awarded in the year prior (Prior Year Patents) to the patent of interest being granted. Our analyses included the number of patents awarded to the firm in the previous year (t-1). For robustness, we also ran the models using the number of patents earned in the past two year and three year periods as well, and obtained similar results (results not reported). As with other organizational research, we are concerned about possible alternate explanations for our results and attempt to control for them. Perhaps of biggest concern is the possibility that firm performance is a driver of the pendency period: that a firm performing well financially will have more resources available and better able to push an application forward to issuance. To control for this possibility, we use Return on Assets. In addition to overall firm performance, there is the possibility that a firm’s slack resources can be brought to bear on the problem of moving the patent toward issuance. Statistical Analysis All hypotheses were tested using least squares regression. In order to be included in the analyses, each observation had to have existing values for all variables included in the model. Missing values were deleted list-wise.
RESULTS Table 3 shows the results from the least squares regression used to test all of the hypotheses. Hypothesis 1 received strong support: as time has progressed, the pendency period has gotten longer. For every year of the sample, the pendency period was, on average, approximately 1.5 days longer. Hypothesis 2 received strong support as well: the larger the firm, the more quickly the company seems to be able to get a technology patented (i.e., the pendency period is shorter). Although we included both size measures in the model, we also ran the model with each size measure separately and received very similar results. Hypothesis 3 also received strong support: the more free cash flow that a firm as, the more quickly that firm is able to earn a patent, suggesting that there is a resource constraint involved in obtaining patents quickly. Our fourth and final hypothesis did not receive support, indicating that prior patenting activity does not lead to a lower pendency period.
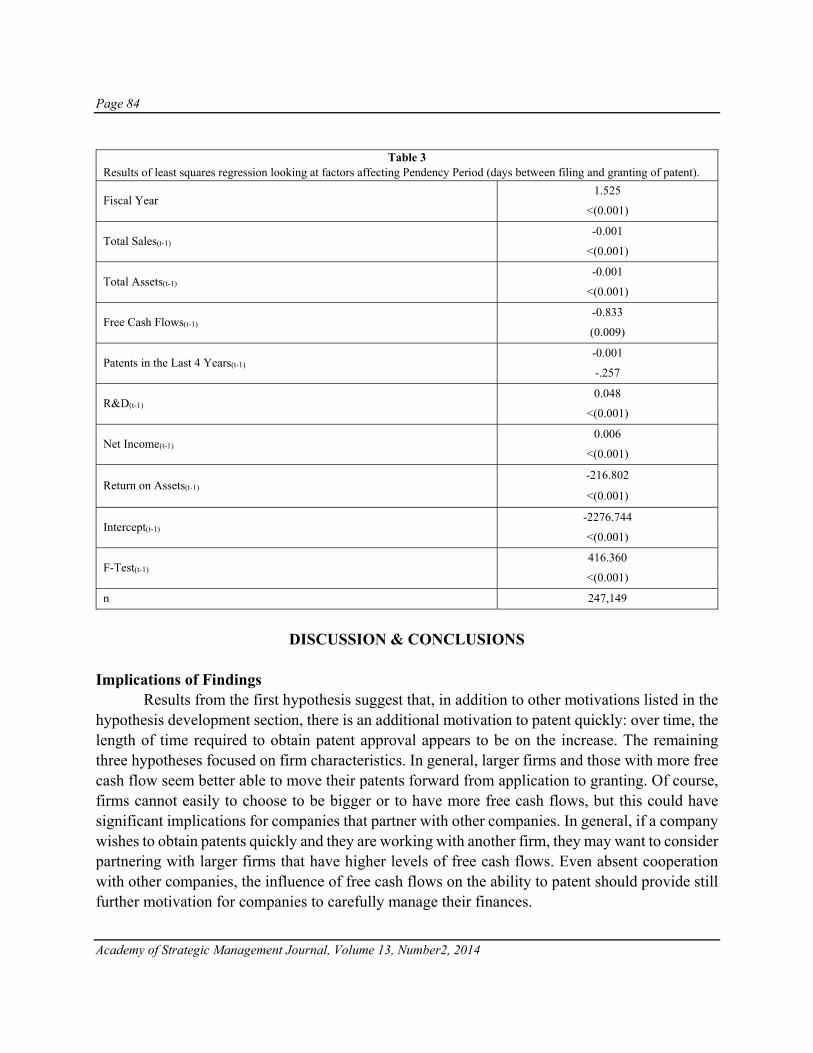
Page 84
Academy of Strategic Management Journal, Volume 13, Number2, 2014
Table 3
Results of least squares regression looking at factors affecting Pendency Period (days between filing and granting of patent).
Fiscal Year 1.525
<(0.001)
Total Sales(t-1) -0.001
<(0.001)
Total Assets(t-1) -0.001
<(0.001)
Free Cash Flows(t-1) -0.833
(0.009)
Patents in the Last 4 Years(t-1) -0.001
-.257
R&D(t-1) 0.048
<(0.001)
Net Income(t-1) 0.006
<(0.001)
Return on Assets(t-1) -216.802
<(0.001)
Intercept(t-1) -2276.744
<(0.001)
F-Test(t-1) 416.360
<(0.001)
n 247,149
DISCUSSION & CONCLUSIONS
Implications of Findings Results from the first hypothesis suggest that, in addition to other motivations listed in the hypothesis development section, there is an additional motivation to patent quickly: over time, the length of time required to obtain patent approval appears to be on the increase. The remaining three hypotheses focused on firm characteristics. In general, larger firms and those with more free cash flow seem better able to move their patents forward from application to granting. Of course, firms cannot easily to choose to be bigger or to have more free cash flows, but this could have significant implications for companies that partner with other companies. In general, if a company wishes to obtain patents quickly and they are working with another firm, they may want to consider partnering with larger firms that have higher levels of free cash flows. Even absent cooperation with other companies, the influence of free cash flows on the ability to patent should provide still further motivation for companies to carefully manage their finances.

Page 85
Academy of Strategic Management Journal, Volume 13, Number 2, 2014
The apparent effect of firm size on the pendency period would seem to have important implications for small firms in particular. Whereas as one large may obtain little if any benefit from partnering with another, larger firm, small firms may accrue large and significant benefits by partnering with larger companies in order to shepherd their patents through the Patent and Trademark Office. Suggestions for Further Research This study represents a broad overview of a large number of patents. The advantage of such an approach is that we are able to look at a very broad population of patents and firms over an extended period of time. The disadvantage is that such a study precludes a more fine-grained approach that would look deeper into both firm- and patent-level issues related to the pendency period. In choosing a narrower scope, future studies could select a smaller sample of patents and/or organizations and explore the influence of such issues as organizational structure and strategy on patenting. Implicit in our paper is an assumption of a linkage between patenting and actual product/service offerings by firms. Although this linkage is well-established, a more explicit look at how the pendency period affects product development—or the lack thereof—would undoubtedly be worthwhile. Do firms that with extensive experience in patenting simply forge ahead with product development, assuming that they will eventually earn a patent on their intellectual property? How many patents and, more narrowly, claims made by patents (remember that a single patent can make multiple claims) are turned down? How do failed patents and patent claims affect product development behavior in firms? All of these questions are important, under-explored ones that lie outside of the scope of this paper, but nonetheless worthy of further research.

Page 86
Academy of Strategic Management Journal, Volume 13, Number2, 2014
REFERENCES
Amit, R. & P.J.H. Schoemaker (1993). Strategic assets and organizational rent. Strategic Management Journal, 14(1):
33-46 Arora, A., M. Ceccagnoli & W.M. Cohen (2008). R&D and the patent premium. International Journal of Industrial
Organization, 26(5): 1153-1179. Barney, J. (1991). Firm resources and sustained competitive advantage. Journal of Management, 17: 99-120. Gilbert, R.J. & R.G. Harris (1981). Investment Decisions with Economies of Scale and Learning. American Economic
Review, 71(2): 172-177. Grindley, P.C. & D.J. Teece (1997). Managing intellectual capital: licensing and cross- licensing in semiconductors
and electronics. California Management Review, 39(2): 8-41. Hausman, J., Hall B.H., & Z. Griliches (1984). Econometric models for count data with an application to the patents-
R&D relationship. Econometrica, 52(4): 909-938. Jaffe, A.B., M. Trajtenberg & R. Henderson (1993). Geographic localization of knowledge spillovers as evidenced by
patent citations. Quarterly Journal of Economics, 108(3): 577-598. Penrose, E.T. (1959). The Theory of the Growth of the Firm. Oxford University Press: Oxford, UK. Prahalad, C.K. & G. Hamel (1990). The Core Competence of the Corporation. Harvard Business Review, 68(3): 79-
91. Lieberman, M. & D. Montgomery (1988). ‘Firstmover advantages’, Strategic Management Journal, 9(Summer): 41–
58. Nagaoka, S. (2007). Assessing the R&D Management of a Firm in Terms of Speed and Science Linkage: Evidence
from the US Patents. Journal of Economics & Management Strategy, 16(1): 129–156. Reitzig, M. & P. Puranam (2009). Value appropriation as an organizational capability: the case of IP protection
through patents. Strategic Management Journal, 30: 765–789. Spence, A.M. (1981). The learning curve and competition. Bell Journal of Economics, 12(1): 49-70. USPTO (2009). General Information Concerning Patents. USPTO: Alexandria, VA.

Page 87
Academy of Strategic Management Journal, Volume 13, Number 2, 2014
DOUBLE DEALING: THE INFLUENCES OF DIVERSE BUSINESS PROCESSES ON ORGANIZATIONAL
AMBIDEXTERITY
Janet K. Tinoco, Embry-Riddle Aeronautical University
ABSTRACT Organizational ambidexterity continues to intrigue both scholars and practitioners, especially in light of the turbulent and volatile business environment of today. Past research indicates that ambidexterity may be fulfilled through implementation of dual organizational structures and cultures. This research complements these efforts by analyzing diverse business processes and organizational ambidexterity in terms of product innovation and production process innovation. Using data collected from US high technology manufacturers, a model is tested which analyzes the influences of entrepreneurial processes necessary for product innovation and the operations management processes necessary for production process innovations and the resultant impacts to firm performance.
INTRODUCTION Organizational ambidexterity, defined as the ability to simultaneously pursue exploration and exploitation (Adler et al., 2009; Raisch & Birkenshaw, 2008; Tushman & O’Reilly, 1996), continues to draw interest from both the academic and practitioner communities as a viable solution to sustainable competitive advantage and a key element of organizational renewal in face of environment change (Danneels, 2002). Due to naturally occurring inherent tensions between exploration and exploitation, firms frequently find ambidexterity too challenging and often strategically embed themselves in either extreme, severely reducing their performance (e.g., March, 1991; Tushman & O'Reilly, 1996). The ability for an organization to be ambidextrous is not effortless, but is nurtured with focused leadership and direction in order to overcome the natural inclination for inertia and path-dependence (e.g.,Tushman & O'Reilly, 1996).
Raisch & Birkenshaw (2008) summarize prior research on organizational ambidexterity, highlighting that past efforts have effectively examined the influences of structure (e.g., Duncan, 1976), context (e.g., Gibson & Birkenshaw, 2004), and leadership (e.g., Smith & Tushman, 2006) on firm achievement. But, O’Reilly & Tushman (2008: 200) argue that the underpinning of ambidexterity is much more. “We do not believe that ambidexterity is rooted in an individual’s ability to explore and exploit as suggested by Gibson & Birkenshaw (2004); nor is ambidexterity simply a matter of organizational structure .... Rather, as a dynamic capability, ambidexterity embodies a complex set of routines,” that management must tradeoff and balance for ambidexterity

Page 88
Academy of Strategic Management Journal, Volume 13, Number2, 2014
to occur. It follows that routines or business processes wield a significant influence on the ability for firms to achieve organizational ambidexterity. Yet, there is a significant lack of research addressing routines or business process influences on exploration and exploitation. This perilous lack of research suggests that academicians and practitioners alike would benefit from empirical inquiry into a process-based path into organizational ambidexterity.
Recognizing that organizational ambidexterity spans across a wide range of critical business areas (Adler et al., 2009), this research seeks to expand upon prior efforts in operations management, innovation, and strategy and explores answers to the following questions: How do naturally opposing business processes in operations management and product development aid corporations in achieving organizational ambidexterity? Additionally, what specific influence does operations management, examined herein as quality process management and supplier channel bonding, have on innovations in product and production process? The answers to these questions not only directly respond to O’Reilly & Tushman’s (2008) conceptual idea that processes influence ambidexterity, but also allows for prescriptives to managers on how to “engage and execute innovation in a way that balances countervailing forces” as suggested by Gopalakrishnan, Kessler, and Scillitoe (2010: 274).
Specifically, the author analyzes operations management and corporate entrepreneurship by examining business processes across the R&D/engineering and operations disciplines in a manufacturing context. In this research exploration is defined as an innovation strategy that encompasses those decisions and activities aimed at entering or creating new product-market domains with radical product innovation while exploitation is defined as an innovation strategy that encompasses those decisions and activities aimed at improving existing product-market positions with incremental product innovations or production process innovations (e.g., He & Wong, 2004). For those firms attempting both exploration and exploitation in innovation, this exploratory study seeks to understand the nature and implications of the entrepreneurial processes inherent in product development and the efficiency and effectiveness processes inherent in operations management as they co-exist in high technology manufacturing organizations. With the knowledge of business process impacts on each of the product and process innovation strategies, one can provide prescriptives to firms as to how to successfully build ambidexterity based on business process implementation.
This paper proceeds as follows. First, a review of the relevant literatures in exploration and exploitation and business processes is presented. Next, a conceptual model and hypotheses are described. Data collection and research methods are then presented. Finally, discussion, implications, and avenues for future research are outlined.

Page 89
Academy of Strategic Management Journal, Volume 13, Number 2, 2014
THEORETICAL FOUNDATIONS AND FRAMEWORK OF ANALYSIS Exploration and exploitation
This study defines radical product innovation as a new product that incorporates a large new body of technical knowledge. It disrupts the current technological trajectory and has been described as explorative by several research streams (e.g., Abernathy & Clark, 1985, Tushman & Anderson, 1986; Tushman & Smith, 2002). Incremental product innovation is defined as a new product that incorporates relatively minor changes in technology or is a minor adaptation of existing products (e.g., Tushman & Smith, 2002). It involves refining, improving, and exploiting an existing firm technological trajectory. A production process innovation is a new system of process equipment, work force, task specifications, material inputs, and work and information flows that are employed to produce a product or service. In past life cycle research, it has been viewed as exploitative in nature (Utterback & Abernathy, 1975). Exploitation in manufacturing can include improvements in production equipment, process technologies, and operational practices (Jayanthi & Sinha, 1998).
In the current study three theoretical perspectives are reviewed for insight into firm exploration and exploitation: organizational learning, population ecology, and evolutionary economics. Although different in their theoretical bases, these three research streams essentially agree that exploration and exploitation are deeply different.
Organizational learning theorists examine the dynamic friction between exploitation and exploration, arguing that there is a fundamental trade-off between explorative and exploitative strategies, that is, firms typically choose one over the other, leading to “refinement of an existing technology” or “the invention of a new one” (March, 1991: 72). Availability of resources and established organizational structures, cultures, and processes often restrict firms in their strategic selection (March, 1991).
While it is more common for exploitation to drive out exploration, organizations create heightened exploration by a “dynamic of failure” (Levinthal & March, 1993). If failure in exploration leads to more exploration which subsequently fails, a dynamic of unending failure is set and difficult to break (Levinthal & March, 1993). This notion is further exemplified in the work by McCrea and Betts (2008) who found that the majority of firms did not learn from their innovation failures, and therefore did not change their initial strategies. Emphasis of both experimentation and exploitation, directed toward achieving ambidexterity, will preclude or reduce the detrimental impact of the dynamic of failure and excessive exploration.
Abernathy & Utterback (1978) proposed that efficiency and innovation are diametrically opposed. Similarly, economics research analyzes the inherent tension between exploitation and exploration via efficiency arguments with respect to search processes, categorizing efficiency as static or dynamic. Statically efficient organizations typically display efficiencies in production
Page 90
Academy of Strategic Management Journal, Volume 13, Number2, 2014
and incremental product improvements while dynamically efficient organizations display efficiencies in new product development and new technology (Ghemawat & Costa, 1993).
Exploration and exploitation is also characterized as fundamentally different search modes (March, 1991). Organizational search contributes to the learning process by which firms endeavor to solve problems (Katila & Ahuja, 2002). Local search is defined as the “behavior of any firm or entity to search for solutions in the neighborhood of its current expertise or knowledge” (Rosenkopf & Nerkar, 2001, p. 288). Conversely, distant search is the behavior of a firm or entity to search for solutions outside the neighborhood of its current expertise or knowledge (e.g., Rosenkopf & Nerkar, 2001).
Population ecologists frame exploration and exploitation in terms of variation and selection. Selection of forms, routines, and practices is essential for survival, but so is the generation of variation through new forms, routines, and practices (March, 1991). The population ecology perspective states that structural inertia may inhibit established firms in their flexibility and rapid adaptability to dynamic environments (Hannan & Freeman, 1977; Sorensen & Stuart, 2000). This “liability” manifests in low organizational exploration (Baum & Amburgey, 2002). Regarding the apparent dichotomy of high production efficiency or high rate of radical innovation, population ecology argues that certain types of firms (those that are highly innovative versus those that are highly efficient) have different survivability chances and performance depending on stage of life cycle and environmental conditions (Hannan & Freeman, 1977).
Evolutionary economics also draws on structural inertia as a factor in exploration versus exploitation, but strengthens the notion of routines. Existing organizations have an advantage over younger organizations in that it is easier to continue existing routines (exploitation) than to create new ones (exploration) or borrow old ones (Nelson & Winter, 1982). Yet, established routines may also have a certain amount of inertia associated with them, that is, a firm’s actions may be reflective of their behavior and actions of the past according to established routines. Since the innovation process itself can be a routine, older firms may have well-defined practices and procedures for the support and direction of their innovative efforts. These routines may exert a positive influence on exploration as they give direction to and smooth innovation development (Nelson & Winter, 1982). Conversely, routines may be so old and outdated that they lack effectiveness or are sluggish with respect to generating radical innovations.
CONCEPTUAL MODEL AND HYPOTHESES
Processes are those “routines [emphasis added] or patterns of current practice and learning” (Teece et al., 1997: 518). They play an influential role in strategic choice (Moorman, 1995; Srivastava et al., 1999). Day (1994)’s conceptual article on the capabilities and underlying processes of a market-driven organization was consulted for process constructs relevant to organizational ambidexterity in terms of exploration and exploitation. He categorizes processes as either “outside-in” or “inside-out.” Outside-in processes connect the organization to

Page 91
Academy of Strategic Management Journal, Volume 13, Number 2, 2014
information from its external environment while inside-out processes are those that are “deployed” from within the organization. This study analyzed two “outside in” processes, one from product development (technology monitoring) and one from operations management (supplier channel bonding), as well as two “inside out” processes, one from product development (technology competence) and one from operations management (quality process management). The technology monitoring process entails sensing state of the art technological advances outside the organization, critical for exploration, but also relevant for exploitation. The channel bonding process includes communication, collaboration, and coordination of activities with channel members and is studied in this study with respect to suppliers. Technology competence, an intangible process, includes skills and knowledge within the firm that pushes state of the art and is necessary for technological innovation. Quality process management activities (e.g., ISO9000) increase efficiencies and repeatability in manufacturing and product assembly.
The conceptual model of Figure 1 identifies the influences of the chosen business processes on exploration and exploitation in innovation and the outcomes of these strategies on innovation performance. In this model, it is argued that the product development process of technology competence positively influences exploration (H1a) but can have negative influences on exploitation (H1b, H1c) while technology monitoring positively influences all innovation strategies (H2a – H2c). It is also argued that quality process management (QPM) positively influences both exploitation in incremental product innovation (H3b) and production process innovation (H3c), but negatively influence exploration (H3a). It is also proposed that channel bonding positively influences both exploration (H4a) and both types of exploitation (H4b, H4c). It is also argued that both exploration and exploitation with product innovation positively influence exploitation with production process innovations (H5a and H5b, respectively). Logically, each innovation strategy should result in an increase in their related number of innovations (H6, H7, H8). Influences of diverse business processes Technology competence
Technology competence is defined as the set of technological skills, knowledge, and experience resident within the firm that is necessary to design the product innovation (e.g, Hamel & Prahalad, 1994). In this research, it is defined relative to the frontier such that organizations with high technology competence are technologically closer to the technology frontier than those with lower technology competence. Considered an intangible process (e.g., Hamel & Prahalad, 1994; Nelson & Winter, 1982), technology competence plays a significant role in the development and design of new product innovations for exploration and reinvigorating prior products through incremental product innovations.

Page 92
Academy of Strategic Management Journal, Volume 13, Number2, 2014
Technology competence has tremendous weight in directing organizational innovation
strategy. It has been noted that exploitation builds on a firm’s prior technology competences while exploration changes the technological trajectory, often forcing firms to acquire new competences if they cannot compete based on their resident technological know-how (Dosi, 1982). Unless carefully watched and managed by the firm, capabilities and investments from the development of a radical innovation will become obsolete or migrate over time towards core rigidities and away from the technological frontier (Leonard-Barton, 1992). A firm rich in exploration proactively and continuously builds technology competences that facilitate on-going radical product development pushing state of the art, while a firm that consistently employs its prior technological knowledge and experience on former radical innovations will tend toward more exploitation (Leonard-Barton, 1992). With respect to production process innovations, Peng et al., (2008) state that innovation in manufacturing processes and equipment development is often based on internal technology development, allowing for easier customization. This may signal a tendency toward more production process innovations. However, recall that process innovations go far beyond those that are technology-based, and include those that are based on new task specifications, material inputs, and work and information flows. As such, it is proposed that while technology competence pushes exploration, it negatively influences exploitation.

Page 93
Academy of Strategic Management Journal, Volume 13, Number 2, 2014
H1: a) The greater the degree of technology competence, the greater the degree of exploration with radical innovation. b) The greater the degree of technology competence, the lesser the degree of exploitation with incremental product innovations. c) The greater the degree of technology competence, the lesser the degree of exploitation with production process innovations.
Technology monitoring
Prior research indicates that technology monitoring is required for a firm to shift its technological trajectory (Gatignon & Xuereb, 1997; Han et al., 2001). Technology monitoring is defined as the process in which an organization acquires knowledge about and understands new technology developments in its external environment (Day, 1994; Srinivasan et al., 2002). Similar to environmental scanning of technological advances, technology monitoring aids the firm in forming a complete understanding of the current and future states of technology (Maier et al., 1997). Data acquired from monitoring the environment assists in opportunity and threat detection (Barringer & Bluedorn, 1999) and is used in problem definition and decision making (Maier et al., 1997), therefore technology monitoring has a direct influence on the organization’s strategic choices (Hambrick, 1982), including innovation strategies (Kanter, 1988). Monitoring the environment has been conceptualized on a continuum of intensity as ranging from irregular or passive (a state of alertness) to continuous or active (high vigilance) (Huber, 1991). Barringer & Bluedorn (1999) uncover empirical support that increasing scanning intensity and entrepreneurial behavior are positively correlated.
In order for exploration to occur, firms must make a conscious effort to monitor new technological developments outside the organization. Technology monitoring is a search process and enables the business to compete by sensing new technologies fundamental to radical innovation development. On the other hand, this “outside-in” process also enables firms to compete in exploitation as it aids firms in acquiring the latest information on incrementally innovative technologies that are fundamental to new paths of exploitation. Without employing this process key to innovation in general, exploitation will be limited to the firm’s prior efforts and experience. This limitation begets incremental product improvements that eventually cease or become obsolete unless new information on innovative technologies outside the firm is acquired. Thus, a strong technological orientation which includes systematic monitoring of technological improvements inside and outside the firm’s core industry should advance both explorative and exploitative innovation (Han et al., 2001).
It is also proposed that technology monitoring should lead to an increase of production process innovations. Some researchers argue that environmental monitoring is less critical for firm competitive advantage in stable environments (Covin 1991). These environments often correlate to more incremental product and process innovations. However, in market-driven organizations, regardless of environment, managers must actively scan the periphery to look for new opportunities (Day, 2002) that can impact process innovations as well as product innovations. Empirical research supports that manufacturing firms acquire new technologies and processes for
Page 94
Academy of Strategic Management Journal, Volume 13, Number2, 2014
innovations by searching external to the firm (Peng et al., 2008, Rosenkopf & Nerkar, 2001). Narrow limited technology monitoring may reduce the organization’s insight into new trends or opportunities that firms can seize with all types of innovation. Therefore, it is proposed that while technology monitoring is strongly tied to exploration, it can also lead to exploitation with incremental product and production process innovations.
H2: a) The greater the degree of technology monitoring, the greater the degree of exploration with radical product innovation. b) The greater the degree of technology monitoring, the greater the degree of exploitation with incremental product innovation. c) The greater the degree of technology monitoring, the greater the degree of exploitation with production process innovation.
Quality process management
Quality process management is defined as process management techniques, such as ISO9000, employed to improve the efficiency of operational processes and reduce variance (Benner & Tushman, 2002). These process techniques allow for increased customer satisfaction with higher quality and more reliable products and for standardization to ensure the customers consistently receive the same product (e.g., Syamil et al., 2004). Therefore, quality process management is highly tied to exploitation.
Past research indicates that increases of efficiency associated with process management also may reduce exploration for new radical innovations as they elicit internal firm biases for certainty, predictability, and reliability (e.g., Benner & Tushman, 2003). Process management techniques that improve efficiency and decrease costs are prevalent in manufacturing operations, visibly evident in statistical tools and techniques (Benner & Tushman, 2003; Rungtusanatham, 2001). Repeatable processes allow organizations to easily create incremental improvements (Hackman & Wageman, 1995), faster and more cost effectively. The committed use of process management in the organization directs innovation strategy to greater exploitation and reduces overall exploration efforts (Benner & Tushman, 2002). As a result, it is posited that
H3: a) The greater the degree of process management, the lesser the degree of exploration with radical innovation. b) The greater the degree of process management, the greater the degree of exploitation with process innovation. c) The greater the degree of process management, the greater the degree of exploitation with process innovation.
Channel bonding
Channel bonding is defined as the process in which durable relationships with channel members are created via activities of communication, joint problem solving, and coordination between the parties. Channel bonding is an “outside-in” process that allows firms to compete by creating long-lasting relationships with channel members, thus building competitive advantage (Day, 1994).
Page 95
Academy of Strategic Management Journal, Volume 13, Number 2, 2014
In this study, channel bonding between supplier and manufacturer is examined. Suppliers have been noted to be sources of innovation in several streams of literature, most notably in technology management studies and interorganizational relationship studies. Traditionally, technology management argues that supplier involvement in manufacturer innovation is largely apparent in the final phase of an industry life cycle when manufacturer’s concentrate on incremental improvements in product design, productivity, and quality (Utterback, 1994). Yet, as part of the value chain, suppliers can be involved in the manufacturer’s innovation development from its very early stages.
Innovation is increasingly viewed as a multi-disciplinary, multi-organizational effort. Scholars have long argued that interorganizational learning through collaboration and cooperative relationships is critical to competitive advantage (e.g., Dyer, 1998; March & Simon, 1958), citing that in some industries, the majority of innovations can be traced to the suppliers or the network in which the firm is embedded (Powell et al., 1996; von Hippel, 1988). Innovation alliances are often sought for their benefits through technology co-development, through the pooling and transfer of knowledge, through cooperative creation of new products, and through distribution and absorption of risk between parties (e.g, Dyer, 1998; Gulati, 1998).
Channel bonding creates long-term relationships which allow for stability and predictability (Hult et al., 2004). Firms that have successful bonding processes in place for managing collaborative relationships find their strategies are more integrated with channel members and can reap competitive advantage through quality improvement and a reduction in time to market for products as a result (Day, 1994). This may well be evidenced in exploitation with incremental product innovations and production process innovations where many of these innovations are based on improved quality and production efficiency (Utterback, 1994). Stability and predictability also bring inertia. Buyers who have established strong ties with suppliers perceive less technological change in the environment and have higher switching costs. These switching costs arise from buyer specialized investments that are tied to the supplier, as well as to prior contractual commitments. Ties may insulate manufacturers from detecting and/or acting on pertinent changes occurring in technology and in market environments (Weiss & Heide, 1993), challenging a firm’s efforts to explore.
These arguments above suggest that channel bonding may positive impact both exploration and exploitation, but at varying degrees. As such, it is posited that
H4: a) The greater the degree of channel bonding, the greater the degree of exploration with radical product innovation. b) The greater the degree of channel bonding, the greater the degree of exploitation with incremental product innovation. c) The greater the degree of channel bonding, the greater the degree of exploitation with production process innovations.
Page 96
Academy of Strategic Management Journal, Volume 13, Number2, 2014
Connection between product and production process innovation
The strategic influences of product innovation on process innovation have been studied with respect to cross-functional product development teams, as well as product/industry life cycles. Often process design is done concurrently with product design in cross-functional development teams (Brown & Eisenhardt, 1995). By including manufacturing and production early in the product design phase, the new product innovation can be designed with production in mind, significantly improving the overall innovation capabilities of the firm (e.g., Peng et al., 2008; Syamil et al., 2004).
In the dynamics of innovation theory, Utterback & Abernathy (1975) provide evidence that strategy, environment, and the choice of product or process innovation are strongly intertwined, subsequently outlining three basic strategies, that is, performance-maximizing strategy, sales-maximizing strategy, and cost minimizing strategy, based on the three phases of the product/industry life cycle (Utterback & Abernathy, 1975; Utterback, 1994). The linkage between product and process innovation grows stronger along the life cycle continuum. Utterback (1994) notes an industry rule of thumb that 70% of costs in manufacturing are determined by the design of the product, therefore they cannot be separated. In light of the arguments stated above, it is posited that both product innovations strategies positively impact exploitation with production process innovations.
H5: a) The greater the degree of exploration with radical product innovations, the greater the degree of exploitation with production process innovations. b) The greater the degree of exploitation with incremental product innovations, the greater the degree of exploitation with production process innovations.
Influence of innovation strategies on performance
The overwhelming majority of innovation research indicates that innovation is good for a firm (e.g., Han et al., 1998). It increases both financial and non-financial performance although the cost of developing, producing, and marketing the new product may cause a drop in short-term financial performance (Gatignon & Xuereb, 1997). It increases survivability while failure to innovate increases mortality (Jovanovic & MacDonald, 1994).
This study looks at firm performance in terms of number of innovations that each strategy reaps. Logically, each innovation strategy should have a positive relationship with the related number of innovation and is included in this model to test the nomological validity of the proposed innovation strategies. Hence, it is posited that
H6: The greater the degree of exploration with radical product innovations, the greater the number of radical innovations.

Page 97
Academy of Strategic Management Journal, Volume 13, Number 2, 2014
H7: The greater the degree of exploitation with incremental product innovations, the greater the number of incremental product innovations. H8: The greater the degree of exploitation with production process innovations, the greater the number of production process innovations.
RESEARCH METHOD Data collection
Cross-sectional survey research via self-administered questionnaire was chosen as the most appropriate avenue for this study. In this context, survey research allows a better depiction and understanding of multiple innovation strategies, their business process determinants, and innovation consequences from the viewpoint of the top executives leading the firm and making the strategic decisions. Although questionnaire use brings some disadvantages these disadvantages can be reduced by using response rate improvement methods promoted by Dillman (2000) and modified according to suggestions by Cycyota & Harrison (2006) for executive populations.
The sampling frame consisted of manufacturers, with a minimum firm age of five years, from US high technology industries based on definitions and links of the American Electronics Association (AEA) and the corresponding North American Industrial Classification System (NAICS) codes, limited by this study to manufacturers. Accordingly, nine high technology manufacturing industries were chosen for this study (communications equipment, computer equipment, consumer electronics, electronic components, semiconductors, defense electronics, measuring and control instruments, electromedical equipment and photonics).
Using the chosen industries, both public and private corporations for the sampling frame were drawn from CorpTech, Directory of Technology Companies. Once the sampling frame was constructed, a sample of 1000 corporations was drawn by systematic sampling in order to draw an equivalent sub-sample from each of the nine overarching industry categories to increase generalizability across high technology industries. Using this approach, it is believed that the constructed sample was representative of the population as a whole. The intended respondents for this study were chief executive officers (CEOs)/presidents/chairman and vice presidents at the corporate level. To ensure that individuals had an equal breadth and depth of firm knowledge, respondents were limited to these select individuals in the upper echelon of the corporation. 1000 CEOs/presidents/chairman and 838 second-level respondents were ultimately contacted.
Common method bias was controlled by surveying two respondents per firm (where possible), by using the suggested questionnaire improvement techniques of Dillman (2000) and Podsakoff et al. (2003), i.e., counterbalancing, reverse coding of items, etc., and by collecting secondary data on firm-specific variables, specifically data on firm sales over the most recent five year period, firm size, and age. Secondary data were collected from the same CorpTech database.
Page 98
Academy of Strategic Management Journal, Volume 13, Number2, 2014
All scales were chosen based on their relevance to this research, as well as their successful track record in previous research in terms of reliability and validity. All scales had a five-point scoring format (1=strongly disagree; 5 = strongly agree). The scale for channel bonding was developed to include a composite of items that accurately reflect the key elements of Day (1994). Technology monitoring was measured using a scale from Srinivasan et al. (2002) on technology sensing (a dimension of technological opportunism. Items for the technology competence scale were extracted from the Specialized Investments scale of Chandy & Tellis (1998) and modified to assess the technology competence of the firm based on the construct definition. Process management was measured by using from an existing scale based on ISO9000 by Huarng et al. (1999). The innovation strategies scales were based on the exploration and exploitation strategy scales of He & Wong (2004) and expanded by four items that reflected the incremental product innovation strategy as well. As an outcome measure of strategy, firms were asked to approximate the number of innovative products (radical and incremental) and production process innovations introduced in the past five years Controls included environmental turbulence and intensity, firm size, and firm age. Industry was not used as a control as the sampling frame was limited to high technology industries. Scales for environment control variables were borrowed from Jaworski & Kohli (1993) as adapted by Joshi & Sharma (2004). Firm size was measured in terms of number of full-time employees and firm age was measured using secondary data from the CorpTech database.
Elements from Bagozzi (1996), Dillman (2000), and Cycyota & Harrison (2006) were employed for questionnaire construction, pretest, and implementation targeting executive populations. At the firm level, 1000 corporations were contacted via a three-wave mailing. Mailings to 86 firms were returned as undeliverable and 37 firms indicated that for various reasons they could or would not participate for a total of 123 firms. From the effective sampling frame of 877 firms, 246 firms responded for an effective firm response rate of 28%. Methodology
Standard procedures for pre-analysis data screening were followed. Single item measures were transposed (inverse transformation) due to positive skewness. The measurement model was assessed by examining factor loadings, individual item reliability, composite reliability, and discriminant validity using SPSS 15.0. Individual item reliabilities were assessed by examining loadings of the measures on their respective constructs. Item reliabilities less than .7, but greater than .6, were assessed for theoretical importance and appropriateness. The remaining items demonstrate good individual-item reliabilities. Furthermore, all reflective constructs had three or more items retained. Table 1 provides the list of individual items used in the analysis for reflective constructs, their means, standard deviations, loadings, and construct composite reliability.

Page 99
Academy of Strategic Management Journal, Volume 13, Number 2, 2014
Table 1 Scales and Item Loadings
Construct Items Mean Standard Deviation
Loading αa
Technology Competence
.91
We have substantial investment in personnel dedicated to state of the art technology.
3.60 1.209 .857
Our current set of technological skills and knowledge is lagging state of the art. (R)
2.42 1.073 .777
We continuously reinvest to operate successfully in state of the art technology.
3.50 1.028 .859
Much of our technical expertise is in state of the art technology.
3.44 1.069 .864
Technology Monitoring
.84
We are often one of the first in our industry to detect technological developments that may potentially affect our business.
3.46 1.080 .792
We actively seek intelligence on technological changes that are likely to affect our business.
3.81 .990 .860
We are often slow to detect changes in technologies that might affect our business. (R)
3.72 1.012 .663
We actively monitor small technology changes that may impact our products.
3.44 .926 .677
We periodically review the likely effect of changes in technology on our business. b
3.57 .936 --
Quality Process Management
To what extent do you use process management techniques (e.g., ISO9000) to
.97
improve product reliability 3.52 1.321 .934 reduce process variance 3.37 1.258 .930
improve product quality 3.66 1.293 .965
reduce defect rate 3.61 1.283 .964
improve manufacturing efficiency 3.48 1.320 .901
Channel Bonding .90
We develop team-based mechanisms (joint meetings, conferences, etc.) with our major supplier for continuous exchange of information and activity coordination.
3.00 1.194 .808
Our major supplier participates in our product conceptualization and development.
2.51 1.133 .792
We use negotiations over joint problem solving with our major supplier. (R) b
3.14 1.156 --
Open communication between us and our major supplier occurs at many levels and functions.
3.30 1.171 .801
We have joint product planning and scheduling with our major supplier.
2.65 1.198 .894

Page 100
Academy of Strategic Management Journal, Volume 13, Number2, 2014
Table 1 Scales and Item Loadings
Construct Items Mean Standard Deviation
Loading αa
We have put in place information system links so that we know the others’ requirements and status in real-time.
2.24 1.149 .706
Exploration with Radical Product Innovation
.77
Introduced a new generation of products. 4.43 .945 .841 Develop completely new or different
technology knowledge bases. 3.42 1.141 .717
Enter new technology fields. 3.15 1.208 .622 Exploitation with Incremental Product Innovation
.83
Extend product range (product extension). 4.13 .939 .778 Make minor improvements in a current
technology. 3.49 1.104 .815
Reuse your existing technology knowledge. 3.95 .929 .767 Combine knowledge of different existing
technologies into a new product. 3.82 1.034 --
Exploitation with Production Process Innovations
.85
Improve production flexibility 3.60 1.072 .831 Improve yield 3.67 1.069 .829 Reduce material consumption 3.22 1.198 .751 a Internal consistency. b Item removed from consideration. (R) Reverse Coded
The measurement statistics reported in Tables 1 and 2 include a measure of composite
reliability, internal consistency (c), to assess construct validity. Overall, the measures demonstrate good reliability with composite reliabilities range from .77 to .97, exceeding the .5 – .6 range established by Nunnally (1978) for exploratory work. All constructs exhibit satisfactory discriminant validity, which represents the extent to which measures of a given construct differ from measures of other constructs in the same model. As shown in Table 2, the diagonal elements of the correlations matrix are significantly greater than the off-diagonal elements, that is, the square root of the average variance extracted is greater than all corresponding correlations (Barclay et al., 1995; Fornell & Larcker, 1981), thereby satisfying a major condition of discriminant validity.

Page 101
Academy of Strategic Management Journal, Volume 13, Number 2, 2014
Table 2 Internal Consistency, Square Roots of Average Variance Extracted, and Construct Correlation Matrix
Construct Internal Consis-tencya
1 2 3 4 5 6 7 8 9 10 11 12
(1) Technology Competence
.91 .84
(2) Technology Monitoring
.84 .580 .75
(3) Quality Process Management
.97 .154 .123 .94
(4) Channel Bonding
.90 .329 .287 .348 .80
(5) Exploration with radical product innovation
.77 .227 .231 .139 .037 .73
(6) Exploitation with incremental product innovation
.83 .148 .024 .127 .283 .084 .79
(7) Exploitation with production process innovation
.85 .070 .012 .225 .281 .235 .422 .77
(8) Number of radical innovations
Single Item
.256 .344 .313 .179 .197 -.007 .065 1.00
(9) Number of incremental product innovations
Single Item
.073 .117 .226 .255 -.066 .281 .114 .312. 1.00
(10) Number of process innovations
Single Item
-.198 -.159 -.206 -.258 .027 -.102 -.258 -.186 -.249 1.00
(11) Firm size Single Item
-.076 -.257 -313 -.260 -.033 -.011 -.035 -.315 -.287 .198 1.00
(12) Firm age Single Item
-.237 -.179 .030 .013 -.067 .129 .050 -.128 .034 -.041 -.137 1.00
a Internal consistency = ((yi)2 / ((yi)2 + var(i)) where var(i) = 1 - yi2. Diagonal (in bold) shows the square root of the
average variance extracted, where average variance extracted = yi2 / yi
2 + var(i). Reflective constructs are included in the table. Environmental Turbulence and Intensity is a formative construct. Firm size and age are controls.

Page 102
Academy of Strategic Management Journal, Volume 13, Number2, 2014
Tests of hypotheses and results Hypotheses were tested by a series of linear regression equations using SPSS 15.0. Due to
departures from multivariate normality, linear regression was chosen over structural equation modeling (SEM). Results of the hypotheses tests are reported in Table 3.
Table 3 Summary of Hypotheses Test Results
Exogenous Variables Hypothesis Standardized Coefficients
(t-values)
Result
Technology Competence H1a .137 (1.738)* Supported H1b -.134 (-1.730)* Supported H1c -.095 (-1.327) Not Supported
Technology Monitoring H2a .132 (1.704)* Supported H2b .186 (2.439)** Supported H2c -.034 (-.476) Not Supported Quality Process Management H3a -.022 (-.331) Not Supported H3b .273 (4.4145)** Supported H3c .143 (2.307)** Supported Channel Bonding H4a .063 (.894) Not Supported H4b .023 (.332) Not Supported H4c .142 (2.259)** Supported Exploration (Radical Innovation) H5a .210 (3.611)** Supported Exploitation (Incremental Product) H5b .305 (5.955)** Supported Exploration (Radical Innovation) H6 .149 (2.437)** Supported Firm Size (Control) -.305 (-4.980)** Firm Age (Control) -.147 (-2.327)** Environmental Turbulence and Intensity (Control) .119 (1.887)*
Adjusted R2 = .16
Exploitation (Incremental Product) H7 .285 (4.727)** Supported Firm Size (Control) -.298 (-4.822)** Firm Age (Control) -.047 (-.762) Environmental Turbulence and Intensity (Control) -.037 (-.602) Adjusted R2 = .15 Exploitation (Process Innovation) H8 -246 (-3.934)** Not Supported Firm Size (Control) .202 (3.162)** Firm Age (Control) .017 (.265) Environmental Turbulence and Intensity (Control) .071 (1.107) Adjusted R2 = .08 Note: *p<.05 (one-sided), **p<.01 (one-sided); R2 for endogenous variables: Exploration (.05); Exploitation with Incremental Product Innovation (.09); Exploitation with Process Innovation (.25)
Results supported the hypothesis that technology competence led to greater exploration
(H1a: β =.137, p<.05) and supported the hypothesis that it also led to less exploitation in incremental product innovation (H1b: β = -.134, p<.05), but not process innovation (H1c: β = -.095, p>.05) although the direction held. These results verify earlier research efforts that firms

Page 103
Academy of Strategic Management Journal, Volume 13, Number 2, 2014
with a high technology competence that approaches and pushes the technological frontier are less apt to exploit with incremental product innovation. Results also supported the hypothesis that technology monitoring led to greater exploration (H2a: β =.132, p<.05) and supported the hypothesis that it also led to greater exploitation in product innovation (H2b: β =.186, p<.01). However, clearly the greatest impact was to exploitation. Furthermore, the proposed positive impact on exploitation in process innovation was tested as negative and not significant (H2c: β = -.034, p>.05).
Quality process management was proposed to positively impact both types of exploitation, but negatively impact exploration. Results supported the hypothesis that quality process management led to greater exploitation with incremental product innovation (H3b: β =.273, p<.01) and process innovation (H3c: β =.143, p<.05). Interestingly, the greatest impact was to incremental product innovation. Results did not support the hypothesis that it led to less exploration although the direction held (H3b: β = -.022, p>.05). A possible explanation to the non-significant result is, of course, that there is no correlation between quality process management and exploration. In other words, these two factors are truly independent. Quality process management is highly tied to production efficiencies and manufacturing. On the other hand, concern with production efficiencies may be less noticeable in R&D prototypes and demonstration units. In order for these units to turn into commercialized products, they must first be “productionized,” that is turned into reproducible designs for the factory floor. At this point quality process management is more than likely to be a factor, that is, at the point in the product life cycle where incremental improvements and efficiencies begin to come into play.
Channel bonding was proposed to positively impact both exploration and exploitation. Results did not support the hypothesis that channel bonding led to greater exploration (H4a: β =.063, p>.05) or exploitation though incremental product innovations (H4b: β =.023, p>.05), but did support the hypothesis that it led to greater exploitation via process innovation (H4c: β =.142, p<.05). In light of these results, channel bonding may indeed reap the greatest benefits to operations management and process innovations and has less direct effect on product innovations.
The hypotheses that both exploration strategy through radical product innovation and exploitation strategy through incremental innovation positively impact exploitation strategy through production process innovation were positive and significant (H5a: β = .210, p<.01) and (H5b: β = .305, p<.01), respectively. Finally, the hypotheses that the exploration strategy has a positive impact on number of radical innovations was supported (H6: β = .149, p<.01) and exploitation strategy of incremental product innovation has a positive impact on number of incremental innovations was supported (H7: β = .285, p<.01). However, the hypothesis that exploitation with process innovations was surprisingly not supported (H8: β = -.246, p<.01), and, instead, statistically significant in the negative direction. Post hoc analysis was performed and is discussed further below.
The impact on environmental turbulence and intensity on innovation performance in terms of number of radical innovations was positive and significant (β = .119, p<.05) but not significant

Page 104
Academy of Strategic Management Journal, Volume 13, Number2, 2014
for either number of incremental product innovations (β = -.037, p>.05) or production process innovations (β = .071, p>.05). The influence of firm age on innovation performance was not significant for either number of incremental product innovations (β = .047, p>.05) or production process innovations (β = .017, p>.05), but negative and significant for number of radical innovations (β = -.147, p<.01). Lastly, the adjusted R2 for each endogenous construct is as follows: Exploration with Radical Innovation (.05); Exploitation with Incremental Product Innovation (.09); Exploitation with Process Innovation (.25); Number of Radical Innovations (.16); Number of Incremental Product Innovations (.15); Number of Process Innovations (.08).
The lack of support for the hypothesis that exploitation with process innovations positively influenced the number of process innovations was surprising. Instead, the relationship was statistically significant in the negative direction. Two post hoc analyses were performed to aid in explaining the unexpected results. First, further analysis also revealed a negative and significant bivariate correlation (r = -.231, p<.01; two tailed) between number of process innovations and the firm performance indicator of market share. No positive and significant bivariate correlations between number of process innovations and firm performance indicators of return on assets, sales growth, return on sales, profitability, or return on investments. Therefore, the unexpected results may be indicative of measurement error in the single item measure of number of process innovations. Second, additional analysis revealed that Environmental Turbulence and Intensity may be a moderator. This construct was tested, using linear regression, as a possible moderator for each innovation strategy-innovation performance link as shown in Figure 1. As noted earlier, environmental turbulence and competitive intensity typically have positive influences on innovation. Results did not support positive moderation between exploration and number of radical product innovations or exploitation with incremental product innovations and its respective innovation outcome. However, results did support moderation between exploitation with production process innovation and its respective innovation outcome [Main Effects: Exploitation with Production Process Innovation to Number of Process Innovations (β = -.253, p<.01; Environment to Number of Process Innovations (β =.073 p>.05); Interaction (β =.148 p<.05)]. This leads the researcher to believe there may also be a theoretical explanation with respect to external environment influences.
DISCUSSION
The accomplishment of ambidexterity in innovation, was, and remains today, a perplexing and challenging task for many firms in the competitive high technology climate. This is made strikingly apparent by the continued multidiscipline calls by academia and practitioners for further study of this area, and by the substantial number and quality of responses and comments made by top executives to this research effort.
Both structure and culture have been shown to positively influence organizational ambidexterity. However, until now, no research has been conducted with respect to impacts of
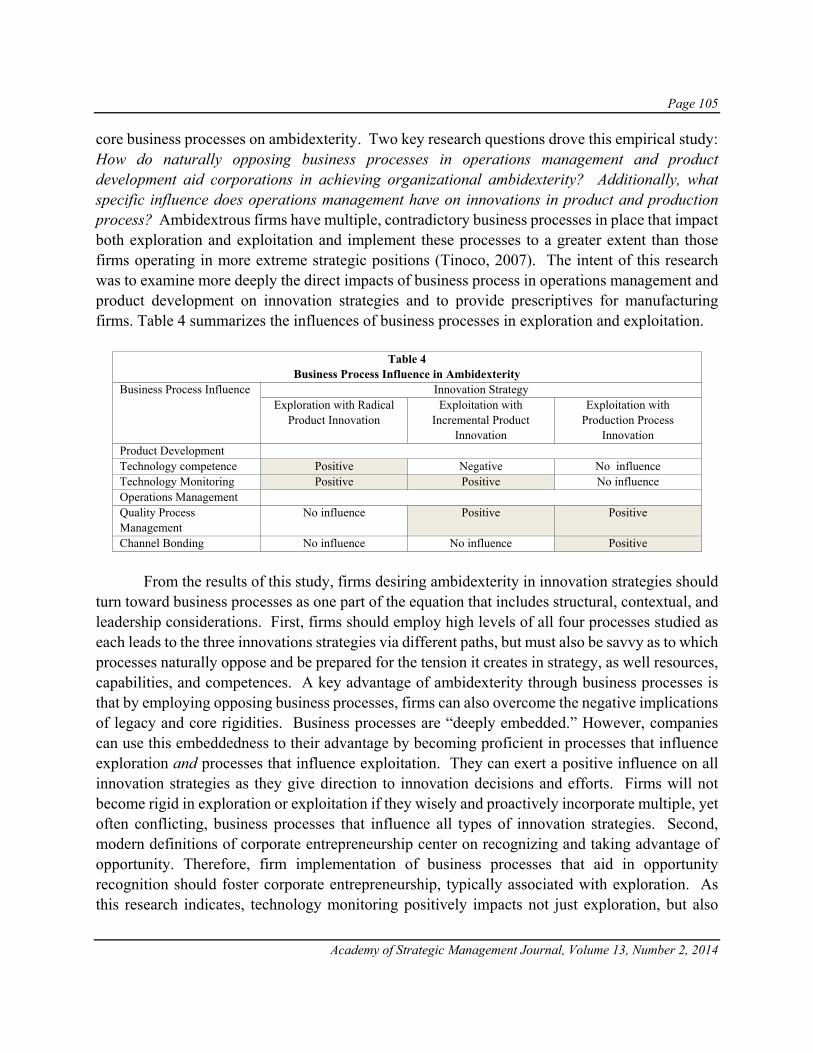
Page 105
Academy of Strategic Management Journal, Volume 13, Number 2, 2014
core business processes on ambidexterity. Two key research questions drove this empirical study: How do naturally opposing business processes in operations management and product development aid corporations in achieving organizational ambidexterity? Additionally, what specific influence does operations management have on innovations in product and production process? Ambidextrous firms have multiple, contradictory business processes in place that impact both exploration and exploitation and implement these processes to a greater extent than those firms operating in more extreme strategic positions (Tinoco, 2007). The intent of this research was to examine more deeply the direct impacts of business process in operations management and product development on innovation strategies and to provide prescriptives for manufacturing firms. Table 4 summarizes the influences of business processes in exploration and exploitation.
From the results of this study, firms desiring ambidexterity in innovation strategies should
turn toward business processes as one part of the equation that includes structural, contextual, and leadership considerations. First, firms should employ high levels of all four processes studied as each leads to the three innovations strategies via different paths, but must also be savvy as to which processes naturally oppose and be prepared for the tension it creates in strategy, as well resources, capabilities, and competences. A key advantage of ambidexterity through business processes is that by employing opposing business processes, firms can also overcome the negative implications of legacy and core rigidities. Business processes are “deeply embedded.” However, companies can use this embeddedness to their advantage by becoming proficient in processes that influence exploration and processes that influence exploitation. They can exert a positive influence on all innovation strategies as they give direction to innovation decisions and efforts. Firms will not become rigid in exploration or exploitation if they wisely and proactively incorporate multiple, yet often conflicting, business processes that influence all types of innovation strategies. Second, modern definitions of corporate entrepreneurship center on recognizing and taking advantage of opportunity. Therefore, firm implementation of business processes that aid in opportunity recognition should foster corporate entrepreneurship, typically associated with exploration. As this research indicates, technology monitoring positively impacts not just exploration, but also
Table 4 Business Process Influence in Ambidexterity
Business Process Influence Innovation Strategy Exploration with Radical
Product Innovation Exploitation with
Incremental Product Innovation
Exploitation with Production Process
Innovation Product Development Technology competence Positive Negative No influence Technology Monitoring Positive Positive No influence Operations Management Quality Process Management
No influence Positive Positive
Channel Bonding No influence No influence Positive

Page 106
Academy of Strategic Management Journal, Volume 13, Number2, 2014
exploitation. It is reasonable to conclude that this business process is extremely invaluable to ambidexterity. Firms that actively incorporate this process in their activities will not hinder ambidexterity in innovation, but help it. On the other hand, firms high in technology competence that push the technological frontier without considering smaller incremental technology advances will hinder exploitation efforts, thereby deterring ambidexterity efforts in its wake.
The operations management processes involve designing and managing the supply chains that facilitate the design, production, and delivery of the products. In this research, channel bonding with suppliers and quality process management were studied. Channel bonding activities can quicken the release of innovative products in the marketplace as firms join forces with suppliers for joint development (Srivastava et al., 1999). A conceptual study by Benner & Tushman (2003) proposes an increase in incremental product innovation and a decrease in radical innovation based on increasing levels of process management practices. However, while process management techniques exert a bias toward exploitation, ambidexterity firms can and do overcome this bias, using quality process management to their benefit, successfully achieving both exploration and exploitation.
Ambidexterity can partially explain the success of some incumbents in high technology industries. Incumbent firms often relegate entrepreneurial activity in radical innovation to inventors and new entrants, and naturally restrict subsequent innovation activities along the same technological trajectory as their original radical innovation. Incumbent portfolios are often severely tipped toward exploitation as businesses become preoccupied with incremental value increases and short term gains. This implies that many incumbents lack entrepreneurial thinking, intentionally choose not to pursue riskier entrepreneurship, or quite simply do not have multiple business processes in place to ensure both exploration and exploitation in innovation are considered in their strategic decision-making. Business processes bring knowledge that is instrumental to effective innovation strategy decision-making, knowledge that is crucial to ambidexterity attainment and ultimately for firm performance.
Within the firm, different functions take the lead in core business processes, for example, operations management leads quality processes and channel bonding, while R&D or engineering may lead technology competence, yet the task of monitoring the environment should span both departments. This research highlights the necessary communications and interactions between all functions and among the processes. Each function within the organization must sign up and actively incorporate these processes in order to attain ambidexterity, even as each process pulls for capital and human resources. Once in place, these multiple, conflicting processes can evolve into core competences, striking a competitive advantage over firms not able to grow, nourish, and sustain these processes.
Challenges to the reasoning, results, and contributions of this study will arise. Some academicians may argue that firms can achieve ambidexterity through alliances and partnerships rather than take it upon themselves. This is true, however they must first make the strategic decision that exploration and exploitation will be simultaneously pursued. Employing multiple
Page 107
Academy of Strategic Management Journal, Volume 13, Number 2, 2014
processes within the firm can aid in this first strategic step by ensuring the natural bias toward one or the other is reduced. Additionally, arguments against the process-strategy causal link may ensue, citing that firms must first strategically choose ambidexterity in innovation and then put appropriate processes in place to successfully fulfill their choice. This argument is somewhat shortsighted as it ignores the implications of legacy and core rigidity on strategic direction. Thus, this research effort also contributes to the strategy literature on turning core rigidities into core competences and the resulting sustainable competitive advantage. Successful firms can develop a sustainable competitive advantage that is difficult to imitate, valuable, rare, and for which there is no substitute by incorporating opposing businesses processes.
This research leads to several interesting subsequent studies. First, further investigation into business process influences that were not significant is warranted, as well as investigations into nonlinear relationships and interactions among the processes. Second, the research should be expanded to include other business processes not studied herein. Third, further investigations into the negative relationship between exploitation of production process innovations and the resulting number of innovations is necessary to tease out measurement error or theoretical explanations. Lastly, radical process innovations versus those of a more incremental nature were not examined, nor was there delineation between process innovations that were technological in nature or more administrative in nature. Research efforts should be expanded to include empirical studies that tease apart these very different process innovations that are still relevant to manufacturing strategy and competitive advantage.
CONCLUSION
This research undertakes the challenge put forth by multiple disciplines to study the ability of firms to attain ambidexterity in innovation. A conceptual model was proposed and tested, examining core business process impacts. The attainment of ambidexterity is challenging and calls for organizational architectures that include conflicting business processes. Firms that successfully embed these processes positively impact innovation strategies of both exploration and exploitation, resulting in a successful portfolio mix of innovations that maximize customer value and boost firm performance. Through core business processes, the influences of operation management and product development are noteworthy in guiding firm innovation strategy, ultimately increasing customer value creation in the resulting innovations, and produce a sustainable competitive advantage is hard to beat.
REFERENCES Abernathy, W.J. & J.M Utterback (1978). Patterns of innovation in technology. Technology Review, 80, 40-47. Abernathy, W.J. & K.B. Clark (1985). Innovation: mapping the winds of creative destruction. Research Policy, 14, 3-
22.

Page 108
Academy of Strategic Management Journal, Volume 13, Number2, 2014
Adler, P.S., Benner, M.J., Brunner, D.J., MacDuffie, J. P., Osono, E., Staats, B.R., Takeuchi, H., Tushman, M., & S.G. Winter (2009). Perspectives on the productivity dilemma. Journal of Operations Management, 27(2), 99-113.
Adler, P.S., Goldoftas, B., & D. Levine (1999). Flexibility versus efficiency? A case study of model changeovers in the Toyota production system. Organization Science, 10(1), 43-68.
Bagozzi, R. P. (1996). Measurement in marketing research: basic principles of questionnaire design, in Principles of marketing research. Oxford: Blackwell Publishers.
Barclay, D. W., Thompson, R., & C. Higgins (1995). The partial least squares (PLS) approach to causal modeling: personal computer adoption and use as an illustration. Technology Studies, 2(2), 285-309.
Barringer, B. & A. Bluedorn (1999). The relationship between corporate entrepreneurship and strategic management, Strategic Management Journal, 20(5), 421-444.
Baum, J. C.& T.L. Amburgey (2002). Organizational ecology. In J.A.C. Baum (Ed), Companion to organizations, Oxford: Blackwell Publishers.
Benner, M. J. & M.Tushman (2002). Process management and technological innovation: a longitudinal study of the photography and paint industries. Administrative Science Quarterly, 47(December), 676-706.
---- (2003). Exploitation, exploration, and process management: the productivity dilemma revisited. Academy of Management Review, 28(2), 238-256.
Brown, S. & K.M. Eisenhardt (1995). Product development: past research, present findings, and future directions. The Academy of Management Review, 20(2),343-78.
Chandy, R. K.& G. Tellis (1998). Organizing for radical product innovation: the overlooked role of willingness to cannibalize. Journal of Marketing Research, 35(4), 474-487
Cycyota, C. S. & D.A. Harrison (2006). What (not) to expect when surveying executives: a meta-analysis of top manager response rates and techniques over time. Organizational Research Methods, 9(2), 133-160.
Danneels, E. (2002). The dynamics of product innovation and firm competences. Strategic Management Journal, 23(12), 1095-1121.
Day, G. S. (1994). The capabilities of market driven organizations. Journal of Marketing, 58(4), 37-53. ---- (2002). Managing the market learning process. The Journal of Business and Industrial Marketing. 17(4), 240-252. Dillman, D. A. (2000). Mail and internet surveys: The tailored design method. New York: John Wiley & Sons, Inc. Dosi, G. (1982). Technological paradigms and technological trajectories. Research Policy, 11, 147-162. Duncan, R. B. (1976). The ambidextrous organization: designing dual structures for innovation. In Ralph H. Kilmann
and Louis R. Pondy and Dennis P. Slevin (Eds). The management of organization design, strategies and implementation (Vol. I), New York: North-Holland.
Durand, R. (2001). Firm selection: An integrative perspective. Organization Studies, 22(3), 393-418. Dyer, J. (1998). The relational view: cooperative strategy and sources of interorganizational competitive advantage.
Academy of Management Review, 22(4), 660-679. Fornell, C. & D. Larcker (1981). Evaluating structural equations models with unobservable variables and measurement
error. Journal of Marketing Research, 18, 39-50. Gatignon, H. & J.M. Xuereb (1997). Strategic orientation of the firm and new product performance. Journal of
Marketing Research, 36(1),77-90. Ghemawat, P.,Costa, J., & I. Ricart (1993). The organizational tension between static and dynamic efficiency.
Strategic Management Journal, 14(Special Issue), 59-73. Gibson, C. B. & J. Birkenshaw (2004). The antecedents, consequences, and mediating role of organizational
ambidexterity. Academy of Management Journal, 47(2), 209-226. Gopalakrishnan, S., Kessler, E.H., & J.L. Scillitoe (2010). Navigating the innovation landscape: Past research, present
practice, and future trends. Organization Management Journal, 7,262-277. Gulati, R. (1998). Alliances and networks. Strategic Management Journal, 19, 293-317.
Page 109
Academy of Strategic Management Journal, Volume 13, Number 2, 2014
Hackman, J.R. & R. Wageman (1995). Total quality management: empirical, conceptual, and practical issues: Administrative Science Quarterly, 40, 309-342.
Hambrick, D. C. (1982). Environmental scanning and organizational strategy. Strategic Management Journal, 3, 159-174.
Hamel, G.& C. Prahalad (1994). Competing for the future. Boston: Harvard Business School Press. Han, J. K., Kim, N., & H.B. Kim (2001). Entry barriers: A dull-, one-, or two-edged sword for incumbents? Unraveling
the paradox from a contingency perspective. Journal of Marketing, 65(1), 1-15. Han, J. K., Kim, N., & R.K. Srivastava (1998). Market orientation and organizational performance: Is innovation a
missing link? Journal of Marketing, 62(4), 35-45. Hannan, M. T. & J. Freeman (1977). The population of ecology of organizations. The American Journal of Sociology,
82(5), 929-964. He, Z.& P.Wong (2004). Exploration vs. exploitation: An empirical test of the ambidexterity hypothesis.
Organization Science, 15(4), 481-494. Huarng, F., Horng, C. & C. Chen (1999). A study of ISO 9000 process, motivation, and performance. Total Quality
Management, 19(7), 1009-1025. Huber, G. P. (1991). Organizational learning: The contributing processes and literatures. Organization Science, 2(1),
88-115. Hult, G. T., Ketchen, D.J., Jr., & S.F. Slater (2004). Information processing, knowledge development, and strategic
supply chain performance. Academy of Management Journal, 47(2), 241-253. Jaworski, B. J. and A. K. Kohli. (1993). Market orientation: Antecedents and consequences. Journal of Marketing.
57(July), 53-70. Jayanthi, S. & K.K. Sinha (1998). Innovation implementation in high technology manufacturing: a chaos-theoretic
empirical analysis. Journal of Operations Management, 16(4), 471-494. Joshi, A. & S. Sharma (2004). Customer knowledge development: antecedents and impact on new product
performance. Journal of Marketing, 68(4), 47-59. Jovanovic, B. & G.M. MacDonald (1994). The life cycle of a competitive industry. The Journal of Political Economy,
102, 322-347. Kanter, R.M. (1988). When a thousand flowers bloom: Structural, collective, and social conditions for innovations in
organizations. In B.M. Staw and L.L. Cummings (eds.), Research in organizational behavior. Greenwich, CT: JAI Press, 169-211.
Katila, R. & G. Ahuja (2002). Something old, something new: a longitudinal study of search behavior and new product introduction. Academy of Management Journal, 45(6),1183-1194.
Leonard-Barton, D. (1992). Core capabilities and core rigidities: a paradox in managing new product development. Strategic Management Journal, 13(Special Issue), 111-125.
Levinthal, D. A. & J.G. March (1993). The myopia of learning. Strategic Management Journal, 14(Winter), 95-112. Maier, J. L, Rainer, R K. Jr. & C.A. Snyder (1997). Environmental scanning for information technology: An empirical
investigation. Journal of Management Information Systems, 14(2), 177-201. March, J. G. & H.A. Simon (1958). Organizations. New York: Wiley. March, J.G. (1991). Exploration and exploitation in organizational learning. Organization Science, 2, 71-87. McCrea, E. & S. Betts (2008). Failing to learn from failure: An exploratory study of corporate entrepreneurship
outcomes. Academy of Strategic Management Journal, 7, 111-132. Moorman, C. (1995). Organizational market information processes: cultural antecedents and new product outcomes.
Journal of Marketing Research, 32(August), 318-335. Nelson, R.R. & S.G. Winter (1982). An evolutionary theory of economic change. Cambridge: MA, Harvard University
Press. Nunnally, J.C. (1978). Psychometric theory. New York, NY: McGraw-Hill.

Page 110
Academy of Strategic Management Journal, Volume 13, Number2, 2014
Peng, D., Schroeder, R. & R. Shah (2008). Linking routines to operations capabilities: a new perspective. Journal of Operations Management, 26(6), 730-748.
Podsakoff, P. M., MacKenzie, S.B., Lee, L.& N.P. Podsakoff ( 2003). Common method biases in behavioral research: a critical review of the literature and recommended remedies. Journal of Applied Psychology, 88(5), 879-903.
Powell, W. W., Koput, K.W., & L. Smith-Doerr (1996). Interorganizational collaboration and the locus of innovation: networks of learning in biotechnology. Administrative Science Quarterly, 41(1),116-145.
Raisch, S. & J. Birkenshaw (2008). Organizational ambidexterity: antecedents, outcomes, and moderators. Journal of Management, 34(2), 375-409.
Rosenkopf, L.& A. Nerkar (2001). Beyond local search: boundary spanning, exploration, and impact in the optical disc industry. Strategic Management Journal, 22(4), 287-306.
Rungtusanatham, M. (2001). Beyond improved quality: The motivational effects of statistical process control. Journal of Operations Management, 19(6), 653-673.
Smith, W.K. & M.L. Tushman (2006). Managing strategic contradictions: a top management model for managing innovation streams. Organization Science, 16(5), 522-536.
Sorensen, J. B. & T.E. Stuart (2000). Aging, obsolescence, and organizational innovation. Administrative Science Quarterly, 45(1), 81-112.
Srinivasan, R., Lilien, G.L. & A. Randaswamy (2002). Technological opportunism and radical technology adoption: an application to E-business. Journal of Marketing, 66(3), 47-60.
Srivastava, R. K., Shervani, & T.A, L. Fahey (1999). Marketing, business processes, and shareholder value: an organizationally embedded view of marketing activities and the discipline of marketing. Journal of Marketing, 63(Special Issue), 168-179.
Syamil, A., Doll, W.F.& C.H. Apigian (2004). Process performance in product development: measures and impacts. European Journal of Innovation Management, 7(3), 205-217.
Teece, D., Pisano, G., & A. Schuen (1997). Dynamic capabilities and strategic management. Strategic Management Journal, 18(7), 509-533.
Tinoco, J.K. (2007). Accomplishment of dual focus in exploration and exploitation: the influential role of the customer relationship management (CRM) process. Published dissertation. Orlando, FL: University of Central Florida.
Tushman, M.L. & W.K. Smith (2002). Organizational technology. In J. Baum (ed.) Companion to Organizations. Malden, MA: Blackwell, 386-414.
Tushman, M. & P. Anderson (1986). Technological discontinuities and organizational environments. Administrative Science Quarterly, 31(3), 439-465.
Tushman, M.L. & C.A. O’Reilly (1996). Ambidextrous organizations: managing evolutionary and revolutionary change. California Management Review, 38(4), 8-30.
Utterback, J. M. (1994). Mastering the dynamics of innovation, Boston, MA: Harvard Business School Press. Utterback, J. M. & W.J.Abernathy (1975). A dynamic model of process and product innovation, OMEGA, The
International Journal of Management Science, 3(6), 639-656. von Hippel, E. (1988). Sources of innovation. New York: Oxford University Press. Weiss, A. M. & J.B. Heide (1993). The nature of organizational search in high technology markets. Journal of
Marketing Research, 30(2), 220-233.
Page 111
Academy of Strategic Management Journal, Volume 13, Number 2, 2014
ORGANIZATIONAL IMPLOSION – A THREAT TO LONG-TERM VIABILITY
Mildred Golden Pryor, Texas A&M University-Commerce Randal Y. Odom, Texas A&M University-Commerce Leslie A. Toombs, Texas A&M University-Commerce
ABSTRACT
The concept of organizational implosion is not yet an integral part of the literature on
management, organizations, or leadership although problematic internal organizational scenarios have been addressed in the literature for many years. When an organization implodes, many of the stakeholders may initially be surprised. However, upon review of the organization in the period leading up to the implosion, it would be evident that there were many demolition charges (seeds of destruction) in place throughout the organization. Perhaps some of these seeds of destruction could exist in the short term. However, in the long term, they would eventually cause the organization to implode, to collapse from within. This article discusses various types of organizational issues that can function as demolition charges and suggests ways to eradicate them or at least minimize their impact. Keywords: Organizational implosion, leadership, 5P’s Strategic Leadership Model, deviancy, workplace hostility, social media, time theft.
INTRODUCTION
When a building implodes, it is demolished from within so that there is an inward collapse. It is destroyed by internally-placed explosive charges that weaken the structural capability of the building. A building implosion occurs in a controlled fashion as a result of planned explosive charges. Stakeholders know when, how, and why the building will implode. When an organization implodes, many of the stakeholders may initially be surprised. However, upon review of the organization in the period leading up to the implosion, it would be evident that there were many demolition charges in place throughout the organization. Perhaps some of these seeds of destruction could exist in the short term. However, in the long term, demolition charges would eventually cause the organization to implode. This article discusses the various types of organizational issues that can function as demolition charges and suggests ways to eradicate them or at least minimize their impact.
UNDERSTANDING ORGANIZATIONAL IMPLOSION This article identifies organizational implosion as the result of seeds of destruction which can function as demolition charges and cause an organization to implode (i.e., collapse inward).
Page 112
Academy of Strategic Management Journal, Volume 13, Number2, 2014
These demolition charges may have been deliberately set, or they may be the result of various inadvertent failures such as systemic problems, malfunction or misalignment of organizational elements, or even lack of timely responses. Bozeman (2013) offers the following definition of organizational implosion: “cases in which organizational members, acting in their official capacities, play a significant role in the havoc wreaked on their organization” (p. 119). He further clarifies organizational implosion as highly disruptive events caused in significant part by organizational members, generally in response to external constraints emanating from the organization’s environment and having ongoing extremely negative consequences for the organization and its stakeholders (Bozeman, 2013, p. 125). We take issue with the first definition in that acting in an official capacity is not a requirement for organizational members to play a role in organizational implosion. We also take issue with the latter definition in terms of the requirement of external constraints. While we surmise that implosions can be caused by a variety of organizational elements, we concur that people are the active ingredient that often triggers an implosion. Therefore, we offer leadership, management, work environment, and other potential causes of organizational implosion. Finally, we provide recommendations that will help eliminate the demolition charges when possible and otherwise to minimize their impact.
LEADERSHIP AND MANAGEMENT FAILURES Organizations are systems, holistic entities which exist to serve specific purposes. The strategic direction and execution are established by people who serve as organizational leaders and managers. However, these same leaders and managers may also put in place (or fail to put in place) items required by the organization for long term success and survival. Allio (2007) suggests that there are bad leaders and that there are strategic and tactical actions that must be taken if they are to improve or be eliminated. He mentions as malefactors Lay and Skilling (Enron), Kozlowski (Tyco), and Ebbers (WorldCom), and he suggests that “Good leaders find strategies that do right by all the stakeholders” (Allio, 2007, p. 12). Sometimes the problem is vision vacuity where the person is focused on day-to-day activities, but has limited or no capability and/or desire to be a visionary. When there is a vacuum in terms of where the organization will be in the future, this nothingness negatively impacts systems and subsystems from the perspective of Purpose, People, Principles, Processes, and Performance as described by Pryor, White and Toombs (1998, 2007) as elements of the 5P’s Strategic Leadership Model. See Figure 1. Gap between Expectations and Realities (p. 12) Jackson and Finkelstein (2005) caution that it is possible that positive financial indicators can serve as camouflage, masking other indicators such as high levels of employee turnover, and a culture of demoralization and discouragement, as well as internal conflicts. They give examples, one of which is “Morgan Stanley (which) is not the first – nor likely will it be the last – highly successful organization that sowed the seeds of its own demise” (p. 1). Other examples offered by Jackson and Finkelstein (2005) are “MassMutual, WorldCom, and Enron” (p. 1). We suggest that leaders and managers must focus on a variety of key performance indicators that can serve as warning signals. In so doing, they can purge any charges that may
Page 113
Academy of Strategic Management Journal, Volume 13, Number 2, 2014
have been deliberately or inadvertently set that might contribute to organizational implosion. Those indicators or measurements should be established and utilized as an integral part of the execution of strategic and tactical plans. Execution Fantasies
Pryor, Anderson, Toombs and Humphreys (2007) assert “whereas strategy formation has received robust examination in the literature, explicit guidance toward strategy implementation has been meager: (p. 3). As a result, it is not surprising that strategy execution is many times a dismal failure even though the strategic plans are impressive. Some leaders involve their people in developing impressive strategic plans. If executed properly, these strategic plans would make their organizations competitive and help ensure their long-term survival. However, execution requires more than simply communicating the elements of a strategic plan throughout an organization (Beer and Eisenstat, 2000). Otherwise, we suggest that strategic plans will become what we have entitled execution fantasies. These scenarios are where leaders talk about the strategies. However, they do not put in place the items necessary for the strategies to be implemented, i.e., tactics, action plans, and accountability systems that would ensure strategy implementation. Alignment Disruptions As mentioned previously, organizations are systems that have a variety of elements or sub-systems that must be aligned in order for them to function successfully. The 5P’s Strategic Leadership Model, Figure 1 (Pryor & White, 1996; Pryor, et al, 1998 and 2007) highlights those elements as follows:
Purpose includes various strategic intention ingredients such as mission, vision, goals, and strategies.
Principles include core values and operating guidelines. Processes are organizational structures, systems, and procedures as well as the
infrastructure and rules that support them. People, the only active ingredient in the 5P’s Strategic Leadership Model.
They are the individuals and teams who own the processes and do the work. Performance includes measurements and key performance indicators as well
as performance results.

Page 114
Academy of Strategic Management Journal, Volume 13, Number2, 2014
Figure 2 5P’s Strategic Leadership Model
Source: Mildred Golden Pryor and J. Chris White, Strategic Quality Management, Presentation to Texas Quality EXPO, ASQC, Dallas, Texas, October, 1996.
Lack of alignment among the 5Ps can cause organizational implosions, trigger external
disruptions and failures, and even result in human tragedies and deaths. Examples where strategic and tactical plans were either nonexistent or not well executed and/or where the 5P’s were not aligned are Bengazi (Griffin & Housley, 2012) and Fast and Furious (Attkisson, 2011). In both cases, there were significant leadership and process issues which resulted in people being killed. Of course, there were charges set which triggered internal organizational implosions as well. Much of this continues to be played out in news media as people testify before Congress, and attempts are made to eradicate future misalignments and failures in leadership and processes.
Ethical Dilemmas and Failures
When organizations are involved in situations that reflect ethical failures, their potential for implosion is increased. For this reason, it is incumbent upon leaders to ensure that their respective organizations have a foundation of ethical principles that are the basis for all decision making and actions. Those ethical principles or core values should be real, not espoused values, if they are to add stability to an organization. Lapin (2011) emphasizes that “the values crisis is not that we don’t have good values, it is that our values have atrophied; they have become impotent and irrelevant to our daily activities and choices. They do not manifest in the business cultures we craft, in the educational and other institutions we build or in the day-to-day economic decisions we make” (p.1). Sometimes, in workplaces, organizational injustice and sabotage exist. Ambrose, Seabright, and Schminke (2002) studied “the relationship between injustice and workplace
Purpose
Principles, Processes
People
Performance

Page 115
Academy of Strategic Management Journal, Volume 13, Number 2, 2014
sabotage” (p. 947). This could be in the section on deviants because sabotage is deviant behavior even if the saboteurs believe that they are responding to organizational injustices. Ambrose, et al (2002) go on to say that injustice was the most common cause of sabotage in their study. We would add that perceived organizational injustice could cause retaliatory sabotage as well. Zellars, Liu, Bratton, Brymer, and Perrewe (2004) examined “dysfunctional consequences of organizational injustice and escapist coping (p. 528). They note that employees “seeking to escape and avoid an unjust workplace experience . . . job dissatisfaction and strain” and that these “escapist coping behaviors are both directly and indirectly linked to their intentions to quit (their jobs)” (Zellars, et al, 2004, p. 538).
It is management’s job to ensure that their respective organizations have ethical foundations, i.e., core values, ethical cultures and work environments, ethical decision making and actions. The people who instigate ethical failures, whether sabotage or other ethical violations, are sometimes management personnel. Therefore, as Pryor, Oyler & Odom (2013) caution, since it is sometimes managers who violate the ethical standards of their organizations, it is they who thereby put in place some of the seeds of destruction that can trigger implosions.
DEVIANTS AND OTHER INTERESTING PHENOMENA
Organizations consist of the same elements that exist in society in general. So it is understandable that organizations would include deviant personalities, sycophants, and various other phenomena. Vaughan (1999) refers to these phenomena as part of the “dark side of organizations (that includes) mistakes, misconduct and disasters” (p. 271). Hogan and Hogan (2001) stated “We believe failure (management incompetence) is more related to having undesirable qualities than lacking desirable ones” (p. 41). They list various personality disorders or dysfunctional dispositions such as paranoid, schizoid, narcissistic, etc. They also caution that there are potentially dire consequences of dysfunctional dispositions including (1) “the inability to learn from past experience which results in repetition compulsion, i.e., repeatedly engaging in the same self-defeating behavior” and (2) “they erode trust (because they are) extremely self-centered . . . and will serve themselves before they serve others if they ever will” (Hogan and Hogan, 2001, p. 51). Through the title of their article (Organizational Sociopaths: Rarely Challenged, Often Promoted - Why?), Pech and Slade (2007) seem to suggest that being a sociopath may not negatively impact a person’s career. As long as the deviants, those with personality disorders, and other unique human elements are productive and do not serve as demolition charges, it is possible for them to co-exist within an organization. Some may even serve as innovators. However, they must not be allowed to plant seeds of destruction and interfere with the long term survival of the organization. Sycophants, Zombies, Robots, and Dementors When organizational leaders surround themselves with sycophants, they are laying throughout the organization demolition charges that can rapidly cause an organization to implode. While people may naturally enjoy having people around who validate their every idea as being wonderful, such input from sycophants will not help an organization to grow and thrive. It is much

Page 116
Academy of Strategic Management Journal, Volume 13, Number2, 2014
better for leaders to hire people who will challenge their ideas and provide innovative, reality-based input which is necessary for the long term survival of an organization. It is also the leader’s job to provide development opportunities so that people can become positive, contributing elements in the organization instead of potential demolition charges. While sycophants by nature are not likely to respond positively to the development opportunities, it is possible that they will learn to behave differently if their leader does not reward sycophant behavior. Sometimes people are not sycophants, but they function as robots or zombies. They perform their jobs in a perfunctory manner. The job gets done, but they don’t use any energy to provide innovative inputs or contribute ideas for improving work processes. Some robotic workers can be trained to work in more creative ways. Others will always function as robots. A decision must be made in terms of their long-term impact on the organization, i.e., whether they will contribute to long-term organizational survival or to organizational implosion. Some employees can be highly productive in terms of task accomplishment and yet negatively impact the work environment and other employees. Denton and Campbell (2009) call these employees Dementors and describe them as follows:
Dementors are high-knowledge, high-skill employees driven to overachieve by low self-esteem and other personality influences that can be exacerbated by situational characteristics. The highly productive Dementor deliberately attempts to lower the productivity of coworkers to alleviate the Dementor’s own performance anxiety (p. 3).
According to Denton and Campbell (2009), Dementors sow seeds of distrust and cynicism that “frequently produce discontent, stress, unhappiness, and overall reduction in organizational productivity (p. 19). We suggest that those seeds of distrust and cynicism and the negative results they produce are seeds of destruction that can drastically increase the potential for organizational implosion. Narcissistic Personalities Leaders and managers who are narcissistic often exhibit hubristic tendencies, including arrogance, excessive pride, excessive ambition, and a sense of entitlement. Many authors have written about narcissism and its correlation with destructive leadership (Humphreys, Zhao, Ingram, Gladstone & Basham, 2010; Padilla, Hogan, & Kaiser, 2007; Paulhus & Williams, 2002; Conger, 1990; House & Howell, 1992; Maccoby, 2000; O'Connor, Mumford, Clifton, Gessner, & Connelly, 1995; Rosenthal & Pittinskya, 2006; Sankowsky, 1995 and Bella, Bennett, & Aquino, 2011. Humphreys, et al (2010) clarified their position as follows: “We agree that reactive narcissists crave power, consistently attempt to secure more of it, and oftentimes, at great peril to themselves and their followers” (p. 127). We would add that it is also often at great peril to their organizations as well. As these narcissistic leaders and managers seek power, they may deliberately or inadvertently plant seeds of destruction that will help elicit organizational implosions.

Page 117
Academy of Strategic Management Journal, Volume 13, Number 2, 2014
Cliques, Insiders and Outsiders, and Would-be Heroes It is difficult for employees to feel comfortable at work if they have to contend with cliques that identify some of them as insiders and some as outsiders. Another potentially negative element is an employee who wants to always be “the hero” and avoids responsibilities that could make teams of people more successful. These cliques, insiders and outsiders, and “would be heroes” do not add value for an organization or its customers. Instead, they are negative elements that help trigger organizational implosions.
ENERGY-DRAINING SCENARIOS
In any organization, there may be people, processes, and/or scenarios that are energy enhancing, energy sustaining, and energy restraining or restricting. It is critical that energy restriction is minimized and energy enhancement is maximized. Therefore, the environment should be one that is positive and energy sustaining in order for people to flourish. When a work environment is replete with energy-draining decisions, actions, and scenarios, the organization will gradually be weakened so that it is in danger of imploding unless the negative seeds of destruction are eradicated. It is evident that some extraneous elements such as negativity and dysfunctional conflict would have a negative impact on the work environment. However, there are other extraneous, non-value-adding elements as well which may appear to be innocuous, but they are energy-draining because they negatively impact reality and the capability of learning from mistakes.
Negativity and Toxicity
Pryor, et al (2011) suggest that “conflict is not only unavoidable, but that (functional
conflict) is a healthy, necessary ingredient for innovation and long term organizational viability (p. 8). They go on to say that “Conflict exists on a continuum from mild disagreements or diverse opinions with little volatility to extremely destructive, dysfunctional conflict with intense, excessive volatility. Therefore, it is often difficult to manage, diffuse, and/or resolve (dysfunctional) conflict” (Pryor, et al, p. 8).
When a place of employment can be described as having negativism as thick as a heavy fog, this is a toxic environment. In addition to negatively impacting key performance indicators such as safety, quality, and productivity, such toxicity can cause stress and illness. Negativity increases with time if it is not addressed. Sometimes, members of an organization can work together to determine causes of the negativity and how to eliminate it. At other times, an expert should be brought in to assist the organization. The longer that negativity exists, the worse it gets. So in terms of negativity reduction, time is your enemy. Such negativity contributes to a toxic work environment and plants seeds of destruction which can contribute to organizational implosion. Mind-numbing constraints sometimes contribute to the negativity in a workplace. Constraints may be lack of the needed resources such as people or technology to get a job done.

Page 118
Academy of Strategic Management Journal, Volume 13, Number2, 2014
However, constraints may also be processes that are too lengthy, too complex, or not well defined. Empowering employees so that they can make decisions about streamlining processes will have a positive impact in terms of enhancing energy and employee morale. In addition, as processes are streamlined, this should help reduce costs, increase productivity, and improve other key performance indicators. Facades, Illusions, and Smokescreens Organizational leaders tend to want to hear success stories such as positive financial indicators and teams that make process improvement a reality. So people throughout an organization present the best possible results and scenarios when they submit reports upward through their respective chain of command. As a result, the organizational culture becomes one that supports facades, illusions, and smokescreens that provide “feel good” opportunities for organizational leaders as opposed to reality checks that serve as a basis for continuous improvement. “Pretense games”, however well intended, rapidly become demolition charges that can put an organization on the path to implosion. It is incumbent upon the leaders of an organization to understand and convey the message that they prefer reality checks and continuous improvement opportunities to game playing. Some of the best organizational leaders require updates on processes that require improvement as well as how and when the improvements will be made. The intent should be to promote an environment of openness where people learn from mistakes and where continuous improvement is a reality.
NON-PRODUCTIVE AND/OR DESTRUCTIVE ACTIONS Many actions of management and non-management employees are non-productive and/or destructive. Some of these have already been addressed in other sections of this article. Others which are addressed in this section are hostile actions, misuse of various types of social media, and time theft. Hostility, Bullying, and Employee Harassment Factors which contribute to negativity in a work environment, but which also may be categorized as time theft and non-productive, destructive actions are hostility, bullying and employee harassment. The results of hostile actions include decreases in morale and productivity as well as increases in employee turnover and time theft. When people’s actions are used for negative purposes, they serve as seeds of destruction and contribute to the ultimate collapse of an organization. In addition, many such actions are at best unethical and at worst illegal. Organizational values and operating guidelines should be established, and all employees should be trained on what they mean and how to comply with them. Organizational values should include civility and mutual respect, and operating guidelines should not allow for any time of bullying or harassment.
Page 119
Academy of Strategic Management Journal, Volume 13, Number 2, 2014
It is especially disconcerting when managers exhibit hostile, bullying, and harassing behavior. Hunter and Bandow (2009) indicated that (such) “managers have been characterized by their targets as being disrespectful to subordinates, rude to peers, difficult to get along with, temperamental, and emotionally unresponsive to problems of employees” (p. 32).
Various authors (Ghosh, Jacobs & Reio, 2011; Andersson & Pearson, 1999; Johnson & Indvik, 2001; Lim & Cortina, 2005; Porath & Erez, 2007; Reio & Ghosh, 2009) have studied the negative impact of workplace incivility and violence. According to Ghosh, Jacobs & Reio (2011), those detrimental outcomes include “poor employee health, low job satisfaction, low organizational productivity and commitment, high employee turnover, and poor application of learning at work” (p. 4). The negative consequences of workplace incivility, hostility, bullying, harassment, and violence are harmful to people, the work culture, and the organization itself. Therefore they are potentially major charges that can trigger an organizational implosion. In addition, some of the decisions and actions in terms of workplace hostility, harassment and violence may be illegal and bring external consequences as well as the internal organizational implosion. The “Downside” and Misuse of Social Media The best leaders have learned how to harness technological innovations for their respective organizations. Various types of social media are now being used to build positive relationships with employees, customers, and other stakeholders. Pryor, Alanaz, Alhamad, and Shomefun (2013) caution that there can often be limitations, ethical issues, and unintended consequences of social media. Some of the negatives associated with social media are as follows:
Some management and non-management employees misuse social media and waste time “playing” on social media sites such as Facebook. While the organization can benefit from organized work on such sites, employees often spend time interacting with personal friends as opposed to customers or other organizational stakeholders.
Once an organization participates in various social media for interaction with customers, employees, et al, that interaction can be negative as well as positive. Sometimes an inordinate amount of time has to be spent training people how to interact on social media, maintaining social media web sites, and interacting on social media sites with customers and other stakeholders.
If an organization experiences a crisis, the media impact is immediate which means that leaders have to be ready to simultaneously address both the crisis and the media coverage of the crisis.
In terms of social media, Dumenco (2010) notes that “We’ve automated time-wasting. We’ve made it look, and feel, like work. We try to convince ourselves of the business value of social networking . . . (but) when you get right down to it, we’re just playing” (p. 16). If management and non-management employees are playing games on the internet, interacting personally on Facebook and other such social media sites, and doing other, non-work online things, even personal reading, they are engaging in time theft

Page 120
Academy of Strategic Management Journal, Volume 13, Number2, 2014
and social media misuse. While social media have many advantages and benefits for organizations, the negative impacts can function as seeds of destruction and contribute to the possibility of an organizational implosion. Time Theft Employees steal from organizations on a daily basis. Sometimes, they embezzle money. Sometimes they steal items such as paper clips or writing pens. Such thefts are costly, and they often serve as major demolition charges for impending organizational implosions. However, the most costly may be time theft because it is not as easily detected, and more people seem to think that various types of time theft are acceptable. Henle, Reeve, and Pitts (2009) caution that “time theft (is) a common and costly form of ethical misconduct at work” (p. 53). Atkinson (2006) notes that employee time theft actions range from personal conversations to playing games, daydreaming, or anything that is not work.
Time theft creep is a dangerous reality. It may seem innocent enough at first. However, if each employee steals an hour a day, a 10,000 person organization experiences a loss of 10,000 hours a day, 50,000 hours in a five-day workweek, 200,000 hours in a four-week month, or 2,400,000 a year. Even if each employee only steals 15 minutes each day, the loss would be 600,000 hours a year. So time theft must be openly addressed. The problem is that employees at every level of the organization, horizontally and vertically, contribute to the time theft problem. Managers are reluctant to address the problem since they participate in time theft too.
Since time theft is a major demolition charge, and since time theft increases, it is simply a matter of when, not whether, time theft will help an organization implode. So what is the acceptable level of risk in a time theft situation? Organizational leaders cannot justify the existence of time theft. They can pretend it does not exist until the organization implodes, or they can engage employees in the minimization of time theft, always working toward its elimination. Each management and non-management employee must serve as a role model to help extinguish the deadly time theft phenomenon.
CONCLUSIONS The concept of organizational implosion should be an integral part of the literature on management, organizations, and leadership. The concept should be addressed from the perspectives of organizational systems and strategic alignment of system elements as well as problematic leaders and scenarios. Some concepts such as negativity, violence in the workplace, and deviancy have been widely addressed, but they have not been considered as potential seeds of destruction which trigger organizational implosions. Other issues have not been adequately addressed such as time theft which can be very costly as people use their time to concentrate on things other than workplace productivity and to act in ways that are counterproductive for their respective organizations.

Page 121
Academy of Strategic Management Journal, Volume 13, Number 2, 2014
RECOMMENDATIONS AND MANAGERIAL IMPLICATIONS It is time for organizational leaders and managers to join the conversation about organizational implosion and be part of the solution instead of part of the problem. They need to spend their time more productively so that they understand their jobs from the perspectives of systems management and the strategic alignment of system elements. In addition, they should address the negative issues and scenarios from the perspective of their potential impact on the whole organization as well as the individual elements and the people involved. It is time for researchers to begin to focus more on the things that will matter in terms of the long-term viability of organizations, such as the potential for organizations to implode because of multiple charges that are deliberately or inadvertently set in place over the years. It is time for authors to integrate such concepts into their articles and books and for teachers to integrate such concepts into their courses.
REFERENCES Allio, R.J. (2007). Bad leaders: How they get that way and what to do about them, Strategy and Leadership 35, 12-
17. Ambrose, M.L., Seabright, M.A., and Schminke, M. (2002). Sabotage in the workplace: The role of organizational
injustice. Organizational Behavior and Human Decision Processes 89, 947-965. Andersson, L. M., & Pearson, C. M. (1999). Tit for tat? The spiraling effect of incivility in the
workplace. Academy of Management Review, 24, 452-471. Atkinson, W. (2006). Stealing Time. Risk Management, 48-50, 52. Attkisson, S. (2011). Gunrunning Scandal Uncovered at the ATF (Alcohol, Tobacco and Firearms). Retrieved from
http://www.cbsnews.com/stories/2011/02/23/eveningnews/main20035609.shtml. Beer, M, and Eisenstat, R A (2000). The Silent Killers of Strategy Implementation and Learning, Sloan Management
Review 41 (4), 29-40. Bella, G., Bennett, R. & Aquino, K. (2011, February). Status differentiation and the protean self: A social-cognitive
model of unethical behavior in organizations, Journal of Business Ethics, 98(3): 407-424. Bozeman, B. (2011, March). Toward a theory of organizational implosion, The American Review of Public
Administration, 41(2), 119-140. Conger, J. (1990). The dark side of leadership. Organizational Dynamics, 19, 44−55. Denton, L.T. and Campbell, C. (2009, January). Dementors in our Midst: Managing the Highly Productive but
Morale-Killing Employee. Journal of Applied Management and Entrepreneurship, 14(1), 3-25. Gnosh, R., Jacobs, J.L., and Reio, T.G. (2011). The toxic continuum from incivility to violence: What can HRD do?
Advances in Developing Human Resources, 13(1), 3-9. Griffin, J. and Housley, A. (2012). Military timeline from night of Benghazi attack begs more questions. Retrieved
from http://www.foxnews.com/politics/2012/11/11/military-timeline-from-night-benghazi-attack-begs-more-questions/#ixzz2QHc9opds.
Henle, C.A., Reeve, C.L., and Pitts, V.E. (2010). Stealing time at work: Attitudes, social pressure, and perceived control as predictors of time theft. Journal of Business Ethics 94, 53-67.
Hogan, R. and Hogan, J. (2001). Assessing Leadership: A view from the dark side. International Journal of Selection and Assessment, 9(1/2), 40-51.
House, R. & Howell, J. (1992). Personality and charismatic leadership. Leadership Quarterly, 3, 81−108.

Page 122
Academy of Strategic Management Journal, Volume 13, Number2, 2014
Humphreys, J.H., Zhao, D., Ingram, K., Gladstone, J. & Basham, L. (2010, January). Situational Narcissism and Charismatic Leadership: A Conceptual Framework, Journal of Behavioral and Applied Management, 11(2): 118-136.
Hunter, D.Y. and Bandow, D. (2009, Summer). Abusive managers and variables impacting retaliation in organizations, The Business Review, 12(1), 32-38.
Jackson, E.M. and Finkelstein, S. (2005, September/October). Immunity from implosion: Building smart leadership. Ivey Business Journal, 1-7.
Johnson, P. R., & Indvik, J. (2001). Rudeness at work: Impulse over restraint. Public Personnel Management, 30, 57-65.
Lapin, D. (2011, November 27). Impotent Values and Imploding Cultures, Lead by Greatness http://leadbygreatness.com/impotent-values-and-imploding-cultures/.
Lim, S., & Cortina, L. M. (2005). Interpersonal mistreatment in the workplace: The interface and impact of general incivility and sexual harassment. Journal of Applied Psychology, 89, 483-496.
Maccoby, M. (2000). Narcissistic leaders: The incredible pros, the inevitable cons. Harvard Business Review, 78, 68−77.
O'Connor, J., Mumford, M., Clifton, T., Gessner, T., & Connelly, M. (1995). Charismatic leaders and destructiveness: An historiometric study. Leadership Quarterly, 6, 529−555.
Padilla, A., Hogan, R., & Kaiser, R.B. (2007). The toxic triangle: Destructive leaders, susceptible followers, and conducive environments, The Leadership Quarterly 18, 176-194.
Pasternack, B.A. and Viscio, A.J. (1998). The Centerless Corporation: A New Model for Transforming Your Organization for Growth and Prosperity. New York: Simon and Schuster.
Paulhus, D.L. & Williams, K.M. (2002). The dark triad of personality: Narcissism, Machiavellianism, and psychopathy, Journal of Research in Personality 36, 556-563.
Pech, R.J. & Slade, B.W. (2007). Organisational sociopaths: Rarely challenged, often promoted. Why? Society and Business Review 2(3): 254-269.
Porath, C. L., & Erez, A. (2007). Does rudeness really matter? The effects of rudeness on task performance and helpfulness. Academy of Management Journal, 50, 1181-1197.
Pryor, M.G., Anderson, D., Toombs, L.A., and Humphreys, J. (2007). Strategic Implementation as a Core Competency, Journal of Management Research, 7(1), 3-17.
Pryor, M.G., Oyler, J., and Odom, R.Y. (2013). Out-of-Control Executives -What Trumps Smart? 2013 Southwest Academy of Management Conference Proceedings.
Pryor, M.G. and White, J.C. (1996, 1996). Strategic Quality Management, Presentation to the 1996 Texas Quality EXPO, ASQC, Dallas, Texas.
Pryor, M.G., White, J.C. & Toombs, L.A. (1998, 2007). Strategic Quality Management: A Strategic, Systems Approach to Continuous Improvement. United States: Cengage (Thomson Learning/South-Western Publishing).
Pryor, M.G., Wulf, M., Alanazi, W., Alhamad, N., and Shomefun, S. (2013). The role of social media in transforming governments and nations. 2013 International Academy of Business and Public Administration Disciplines Conference Proceedings.
Reio, T. G., & Ghosh, R. (2009). Antecedents and outcomes of workplace incivility: Implications for human resource development research and practice. Human Resource Development Quarterly, 20, 237-264.
Rosenthal, S. A. & Pittinskya, T. L. (2006). Narcissistic leadership. Leadership Quarterly, 17, 617−633. Sankowsky, D. (1995). The charismatic leader as a narcissist: Understanding the abuse of power. Organizational
Dynamics, 23, 57−71. Vaughan, D. (1999). The dark side of organizations: Mistake, misconduct, and disaster. Annual Review of Sociology,
25, 271-305.