academia revista latinoamericana de administración...
TRANSCRIPT
Academia Revista Latinoamericana de AdministraciónThe efficiency of the future market for Brazilian live cattleOdilon José de Oliveira Neto Fabio Gallo Garcia
Article information:To cite this document:Odilon José de Oliveira Neto Fabio Gallo Garcia , (2013),"The efficiency of the future market for Brazilianlive cattle", Academia Revista Latinoamericana de Administración, Vol. 26 Iss 2 pp. 199 - 228Permanent link to this document:http://dx.doi.org/10.1108/ARLA-06-2013-0065
Downloaded on: 14 March 2016, At: 10:32 (PT)References: this document contains references to 44 other documents.To copy this document: [email protected] fulltext of this document has been downloaded 81 times since 2013*
Users who downloaded this article also downloaded:Ana María Lucia-Casademunt, J. Antonio Ariza-Montes, Alfonso Carlos Morales-Gutiérrez†,(2013),"Determinants of occupational well-being among executive women", Academia RevistaLatinoamericana de Administración, Vol. 26 Iss 2 pp. 229-257 http://dx.doi.org/10.1108/ARLA-06-2013-0064Olivia Vieira Marx Andrade, Renata Pautasso Barreto Amorim, Fabiana Cassilha Pires, Marcus WilcoxHemais, (2013),"Spoleto: internationalizing a Brazilian franchise of Italian cuisine", Academia RevistaLatinoamericana de Administración, Vol. 26 Iss 3 pp. 415-431 http://dx.doi.org/10.1108/ARLA-07-2013-0097Milagros Vivel-Búa, Luis Otero-González, Sara Fernández-López, Pablo Durán-Santomil, (2013),"Whyhedge currency exposure with foreign currency debt?", Academia Revista Latinoamericana deAdministración, Vol. 26 Iss 2 pp. 258-289 http://dx.doi.org/10.1108/ARLA-06-2013-0068
Access to this document was granted through an Emerald subscription provided by emerald-srm:478443 []
For AuthorsIf you would like to write for this, or any other Emerald publication, then please use our Emerald forAuthors service information about how to choose which publication to write for and submission guidelinesare available for all. Please visit www.emeraldinsight.com/authors for more information.
About Emerald www.emeraldinsight.comEmerald is a global publisher linking research and practice to the benefit of society. The companymanages a portfolio of more than 290 journals and over 2,350 books and book series volumes, as well asproviding an extensive range of online products and additional customer resources and services.
Emerald is both COUNTER 4 and TRANSFER compliant. The organization is a partner of the Committeeon Publication Ethics (COPE) and also works with Portico and the LOCKSS initiative for digital archivepreservation.
*Related content and download information correct at time of download.
Dow
nloa
ded
by F
GV
At 1
0:32
14
Mar
ch 2
016
(PT
)
The efficiency of the futuremarket for Brazilian live cattle
Eficiencia do mercado futuro doboi gordo Brasileiro
Odilon Jose de Oliveira Neto and Fabio Gallo GarciaS~ao Paulo School of Business Administration, Getulio Vargas Foundation,
S~ao Paulo, Brazil
Abstract
Purpose – This paper investigates the efficiency of the futures market for Brazilian live cattle to predictprices in the spot market of Argentinian steers. The lack of derivatives related to the beef market in thefutures exchange in Argentina was the main factor behind the decision to analyse the efficiency of theBrazilian live cattle futures as a predictor of spot prices of Argentinian steers.Design/methodology/approach – We opted to employ the efficient markets hypothesis to approachthe question. The hypothesis that futures prices are non-biased predictors of spot prices is consideredto be a true proposition only if the efficient markets hypothesis is not rejected. In methodologicalterms, the efficiency of the futures market for Brazilian live cattle relative to the spot market ofArgentinian steers was verified using the Johansen co-integration test. A vector error correctionmodel – which enables verification of the question of bias in the prediction of prices, was used toestimate the long-term equilibrium between spot and futures prices.Findings/originality/value – The results provided no evidence of bias in the prediction of prices andfound the predictive efficiency of the Brazilian live cattle futures market relative to the spot market ofArgentinians steers to be approximately 80 per cent. Thus, the future prices of Brazilian live cattle canexpressly assist participants in the Argentinian beef production chain to predict the spot prices of steers.Keywords Efficient market hypothesis, Futures market, Live cattle, Steer, Co-integration,Futures markets, Livestock, BrazilPaper type Research paper
Resumo
Purpose – Esse trabalho verifica a eficiencia do mercado futuro do boi gordo brasileiro em relac~ao aomercado a vista dos novilhos argentinos. A ausencia de derivativos relacionados ao mercado da carnebovina em bolsa de futuros na Argentina foi o principal aspecto motivador da analise da eficiencia domercado futuro do boi gordo brasileiro como preditordos precos a vista dos novilhos argentinos.Design/methodology/approach – Assim sendo, optou-se por uma abordagem a luz da teoria dahipotese dos mercados eficientes. A hipotese de que os precos futuros s~ao preditores n~ao viesados dosprecos a vista e tida como uma proposic~ao verdadeira somente se a hipotese de eficiencia de mercadon~ao for rejeitada. No contexto metodologico, a eficiencia do mercado futuro do boi gordo brasileiroem relac~ao ao mercado a vista dos novilhos argentinos foi verificada a partir do teste de cointegrac~aode Johansen, enquanto que o equilıbrio no longo prazo entre os precos a vista e futuros, que possibilitaa verificac~ao da quest~ao do vies na predic~ao dos precos, foi estimado por um modelo vetorial decorrec~ao de erro.Findings/Originality/value – Os resultados evidenciaram o n~ao vies na predic~ao dos precos e aeficiencia do mercado futuro do boi gordo brasileiro em relac~ao ao mercado a vista dos novilhosargentinos de aproximadamente 80%. Logo, os precos futuros do boi gordo brasileiro podem auxiliarde maneira expressiva os agentes da cadeia produtiva da carne bovina argentina na predic~ao dosprecos a vista dos novilhos.
Palavras-Chave Hipotese do Mercado Eficiente, Mercado Futuro, Boi Gordo, Novilho, Cointegrac~ao
The current issue and full text archive of this journal is available atwww.emeraldinsight.com/1012-8255.htm
Received 9 May 2012Revised 10 March 2013
14 March 2013Accepted 23 March 2013
Academia Revista Latinoamericanade AdministracionVol. 26 No. 2, 2013
pp. 199-228r Emerald Group Publishing Limited
1012-8255DOI 10.1108/ARLA-06-2013-0065
199
Future marketfor Brazilian
live cattle
Dow
nloa
ded
by F
GV
At 1
0:32
14
Mar
ch 2
016
(PT
)
1. IntroductionThe wealth generated from agricultural markets and agro industries are veryimportant to the gross domestic product (GDP) of the economy of several SouthAmerican countries. The set of operations and businesses made in this market,nominated as agribusiness, represents approximately 23 and 32 per cent of the Brazilianand Argentinean GDP, respectively, both major South American economies. In thiscontext, the operations and businesses related to the beef market represents around 13per cent of the agribusinesses GDP in these countries (Centre of Advanced Studies inApplied Economic (CEPEA), 2011; Ministry of Agriculture, Livestock and Fishing ofArgentina (MAGYP), 2011; United States Department of Agriculture (USDA), 2011).
In 2010, together, Brazil and Argentina were expected to account for around 25per cent of the contingent of bovine meat worldwide. Brazil, with 185.16 million ofbovines, and Argentina, with 49.05 millions of bovines, hold the first and fourth placeof commercial bovine cattle in the world. During this same period, the annualproduction of bovine meat in Brazil and Argentina was of 9.12 and 2.60 millions oftonnes, which puts them in second and fourth position in the world ranking of bovinemeat production (USDA, 2011).
The exports of Brazilian and Argentinean bovine meat was of 1.56 million and 0.298million of tonnes of bovine meat in 2010, representing 20.77 and 4 per cent of the worldcommodity exports, respectively (Associac~ao Brasileira das Industrias Exportadorasde Carnes (ABIEC), 2011; MAGYP, 2011; USDA, 2011).
The Argentinean and Brazilian bovine meat markets share some commoncharacteristics. Among these, it is particularly noticeable that in 2009, of the 87countries which commercialised bovine meat with refrigerated warehouses installed inArgentina, 72 also acquired the product from refrigerated warehouses operating inBrazil, which represents 83 per cent of the common destination for the commodityexport (Instituto de Promocion de la Carne Vacuna Argentina (IPVCA), 2012; Melo, 2010).
Despite the significant economic figures from bovine meat markets, it is importantto highlight the existence of derivative tools negotiated in stock exchange contributingto the management of price volatility. At present, Australia, Brazil, the USA, havederivative tools dealt in the stock with the objective of mitigating the price riskgenerated from beef cattle spot markets. However, Argentina lacks the derivativeinstruments which seek to cover the risk generated by the uncertainties of the bovinemeat spot markets.
In Argentina, different attempts to negotiate future contracts and price index ofbovine meat were thwarted throughout the years, having these derivatives failedshortly after being launched due to lack of funds.
Relevant studies point out at the factors which led to the short life cycle of futurecontracts of bovine meat in Argentina, such as future contracts which did not considerthe common interests of the agents dealing in the productive chain, and incompatibilityof the derivative standard in terms of size, expiration and guarantee margins (Comiso,2007; Dopchiz, 2008).
The problems faced by the agents of the productive chain of Argentinean bovinemeat, as a result of the lack of derivatives in future markets, is an element whichcontributes to increase the research on the efficiency of other markets in managingprice risk. Meanwhile, it is highlighted that the alternative to protection against risk isonly possible when the efficiency market hypothesis (EMH) is not rejected.
In a future efficient market, the future current prices of a contract to deliver aproduct in a future date are robust estimators of the spot prices for that same date,
200
ARLA26,2
Dow
nloa
ded
by F
GV
At 1
0:32
14
Mar
ch 2
016
(PT
)
and they incorporate the whole set of data to predict the future price. Therefore, theability of spot prices to incorporate the available data are what determines if a marketis efficient or not (Fama, 1970; Moraes et al., 2009).
Therefore, when considering the differences in production and commercialisation ofbeef cattle and the peculiarities of the Argentinean and Brazilian bovine meat market,and the problematic of management of price risk, in particularly the market ofArgentinean bovine meat, the following question is posed: the future prices of livecattle in the Brazilian Securities, Commodities and Futures Exchange (BM&FBOVESPA) are unbiased predictors of spot prices of the Argentinean steers on thecontracts expiry date?
In light of all the above, this study aims to verify the efficiency of the Brazilianfuture live finished cattle markets in relation of the Argentinean spot market of steersin the presence of a risk premium.
2. Theoretical foundationAn efficient market is a market where all available information is fully reflected onthe prices so that any changes are only possible after incorporating new information.As such, in an efficient market, the opportunities of generating earnings through theinformation found in the prices are limited. This is the hypothesis defined as the EMH(Fama, 1970).
Historically, an EMH is divided into three categories, which relate to different typesof information. The test “weak form EMH” verifies if all the incorporated informationto the former prices is reflected in the spot price. Testing the semi-strong form EMHchecks if a set of public available information is found reflected in the spot prices.The strong form EMH test ascertains if all the available information, public or not, isintegrally reflected on the spot prices and if any investor would obtain higher earnings(Bodie et al., 2010; Fama, 1970, 1991).
Based on the concept by Fama (1970), in which a EMH is where the prices of theactives completely reflect the available information, the efficiency of future pricesare tested through the equation: Stþ 1¼ aþ bFtþ utþ 1, where, Stþ 1 is the spot price ofthe period tþ 1; Ft and the future price in the period t ; and utþ 1 is the independenterror variable and identically distributed with a mean equal to 0 and a constantvariance. The coefficients a and b are constant in an efficient market with values a¼ 0and b¼ 1; and therefore Et(Stþ 1�Ft)¼ 0.
In this context, and in order to not reject the weak-form EMH test, the price in thespot market should not only reflect the set of available information, but also the futureprice of the actives on the contract’s expiry date tþ 1 must be an unbiased estimatorof the spot price of the same active in moment t.
According to Fama (1970, 1991), Camargos and Barbosa (2003) and Alves et al.(2008) some basic suppositions of the EMH test are highlighted: the environment ofperfect occurrence, concordance in terms of expectative of the investors regardinginformation and failure to consider the costs of transaction and of information. This isbecause, given the market imperfections and the admission of costly and asymmetricinformation, the EMH would be rejected because the results are ba1 (Fama, 1970;Zulauf and Irwin, 1997).
The speed with which agents analyse the available information is an element thatcan cause bias in the price, if the processing ability for a few some is higher thanthe rest, in this case Et(Stþ 1�Ft)a0. Considering that possibility account, the EMH
201
Future marketfor Brazilian
live cattle
Dow
nloa
ded
by F
GV
At 1
0:32
14
Mar
ch 2
016
(PT
)
as stated by Fama (1970) would allow the existence of a risk premium. The bias inthe price, in this instance, it is noted as aa0, being the value a defined as a riskcompensation (Moraes et al., 2009; Alves et al., 2008; Zulauf and Irwin, 1997;Fama, 1970).
As such, there are two versions of the EMH according to Fama (1970). A first onewith a¼ 0 and b¼ 1, and a second with aa0 and ba1, being the coefficients throughtime constant or not. Although the risk premium is controversial for the EMH, itsexistence is an empirical, as opposed to a conceptual, issue. Subsequently, in the secondversion of EMH, the risk reward does not invalidate the test since it does not dependon the absence of the latter (Moraes et al., 2009; Zulauf and Irwin, 1997).
The EMH version that results in aa0 and ba1 was also evidenced in the researchconducted by Danthine (1978), who concluded that the presence of risk premiums doesnot interfere with the test, since the EMH does not depend on its absence.
Different results for EMH tests are reported in several research works for whichfuture markets where the main objective, which raised criticism on this subject. Whilestudies such as the ones conducted by Beck (1994), Pizzi and Just (1998), Acker andRacine (1999), Chu et al. (1999), Jumah and Martin (1999), Melo et al. (2006), Silva Netoet al. (2010), Abitante (2008) and Moraes et al. (2009), did not reject the EMH in its weakform, other studies (Leuthold, 1979; Bressler and Covey, 1991; Lai and Lai, 1991; Alveset al., 2008) rejected the EMH for the future markets investigated.
Contradicting the studies that strongly rejected the EMH, some research creditedspecific elements for the lack of robustness to support it. This is the case of the studiesby Fama and French (1987), Kellard et al. (1999), McKenzie and Holt (2002) andKenourgios (2005).
The different results obtained for the EMH test on future agricultural commoditiesmarkets are attributed to factors such as: contract owners, product characteristic,seasonality, spacing of contracts’ observations, analysis period, institutional factors,governmental interventions, statistical procedures and econometric techniques ofanalysis, among others (Kellard et al., 1999; Newbold et al., 1999). Also, it ishighlighted that conclusions on EMH must be interpreted with caution to the point ofconsidering the specificities of the agricultural market and the two methods appliedto the research.
The analysis on the capability of future prices in predicting spot prices usesthe different research methods since EMH was first authored. Furthermore, with thedevelopment of co-integration techniques, several studies opted to use these for EHMtesting. The co-integration technique developed by Engle and Granger (1987) waswidely used to analyse the stationarity of the linear combination between financialseries, such as the equilibrium of these in the long term. However, the limitation in theanalysis of the co-integration of two or more series restricts their applicationthroughout the research on EMH.
The Engle and Granger (1987) technique has been used since first released by theseauthors for research involving only two variables, particularly because is easilyapplicable. Studies from/by Bressler and Covey (1991), Kellard et al. (1999), Newboldet al. (1999) and Melo et al. (2006), achieved consistent results for EMH testing byapplying the co-integration technique by Engle and Granger (1987).
The development of a co-integration technique that allows EMH testing withprecision, particularly in instances where the analysis deals with more than twovariables, was first developed by Johansen (1988). The co-integration techniqueproposed by Johansen is set out by deriving the maximum-likelihood test and follows
202
ARLA26,2
Dow
nloa
ded
by F
GV
At 1
0:32
14
Mar
ch 2
016
(PT
)
with the estimation of the parameters from the balance ratio between non-seasonaltime series.
The Johansen (1988) co-integration test for the autoregressive vector also allowsverifying the interaction between spot and future prices. The linear and seasonalcombination between non-seasonal variables, required for EMH confirmation, found inEnders (2004) one of its main supporters.
The Johansen (1988) co-integration test was used for several EMH testing in futureagricultural markets, mainly in view of the parsimony and robustness of the resultsobtained from its application. Among these studies, Kenourgios (2005), Abitante (2008),Alves et al. (2008) and Moraes et al. (2009) are the most relevant.
Since EMH was first developed, studies have been conducted using agriculturalcommodities such as: sugar, finished cattle, coffee, ethanol, corn, soy, among others.All of them included products and markets with similar characteristics, even withinthe same territorial range. However, in this study EMH is tested for markets fromdifferent countries, in this instance, future Brazilian markets and the Argentinean spotmarkets of beef cuts.
3. MethodologyThe present research is characterised as quantitative of the descriptive type. In thissense, it seeks to establish the relation between cause and effect of the variables aimingto determine the basis for estimation with the accuracy demanded by the testedhypothesis.
The time series analysis was applied with the purpose of verifying the dynamic andtemporal structure of the data. Consequently it was evaluated: the linear association,stationarity, serial autocorrelation and co-integration among the prices. The techniquesof co-integration were applied with the purpose of verifying the existence of a long-term relation between future and spot prices. All the analyses will follow the rigourdemanded by each particular statistical test.
The time series analyses were carried out with Eviews 7.0 software. To structure theequations the Mathtype 5 software was used. The data processing was aided by usingMicrosoft Excel software 2007 version.
3.1 Data and proceduresThe daily series of the spot market prices of the Argentinean steer cuts and futureprices of beef cattle in BM&FBOVESPA, used to test the EMH, included the periodbetween the 2 of January of 2002 and 13 of May of 2011.
The daily quotes referring to the indicators of future beef cattle prices of theBM&FBOVESPA were obtained from the CEPEA, responsible for the dailydissemination of daily-adjusted prices of future contracts. The defined indicator,originally in Brazilian Reales, is also published in American Dollars.
The future contract of live cattle refers to 330 liquid beef (15 kilograms). TheBrazilian live finished cattle is characterised as a male bovine, alive, castrated, witha convex carcase, with pasture or feedlot feeding, with a weight between 450 and 550kilograms and maximum age of 42 months (Bolsa de Valores, Mercadorias e Futuros(BM&FBOVESPA), 2012).
The daily quotations of current Argentinean steers prices were obtained from theMAGYP and refer to the spot prices used in the Liniers Markets S.A, which is the mostimportant Bovine spot transaction centre in Argentina. The prices of Argentinean
203
Future marketfor Brazilian
live cattle
Dow
nloa
ded
by F
GV
At 1
0:32
14
Mar
ch 2
016
(PT
)

steers are counted by kilogram/live weight, and the reference currency is theArgentinean peso.
The Argentinean young steer is a male bovine, young, alive, castrated, presentingbetween two and four definitive incisor teeth, with a rectilinear carcase, fed onpasture or feedlot, with a weight between 300 and 430 kilograms and an age ofaround 30 months. As such the adult Argentinean steer differs by having a minimumof six permanent incisor teeth, conformed to a carcase between sub-convex andconvex, weight between 431 and 520 kilograms and ages between 30 and 42 months(MAGYP, 2011).
The spot prices of Argentinean steers were transformed into dollars according tothe daily quotes of the Argentinean Republic Central Bank, and immediatelytransformed in liquid arrobas, considering the equivalent profiting of 50 per cent ofthe carcass.
The presence of days without price quotes and the illegitimated outliers weredeleted from the sample. Subsequently, a series of prices were logged in order toremove exponential tendencies and validate the linear association. There proceduresfollow the patterns of EMH testing with the application of co-integrationtechniques.
3.2 Hypothesis and statistical testsThe present study verified the hypothesis that future prices, on the due date of thefuture contract of the beef livestock of the BM&FBOVESPA, were unbiased predictorsof the spot prices for the Argentinean steers cuts. To verify the efficiency of futuremarkets, statistical stationary tests to assert the integrative order and theco-integration tests where sequentially applied.
The market efficiency testing demands that the variables, spot and future prices, tobe co-integrated in the same order. Therefore, the series of prices must have a unit root,that is, they must not be seasonal.
From a wider perspective, the co-integration relation is taken as long-term balancephenomena, therefore, although these variables deviate from their relation in the shortterm, these associations will be retaken in the long term.
From these two tests of unitary roots of Augmented Dickey and Fuller (1981) andPhillips and Perron (1988), know as ADF and Phillips-Perron, respectively, it waspossible to identify with higher accuracy if the series were integrated in the same order,as I(1). The Phillips-Perron and ADF stationary tests verify if the null and alternativehypothesis: H0: ytBI(1) and H1: ytBI(0).
Although needed, the same order of integration does not mean necessarily that theseries are co-integrated; therefore, it was opted to apply the Johansen (1988) andJohansen and Juselius (1990) trace test to verify the linear combinations type I(0). Thistest allows investigate the existence of long-term balance between the spot and futureprices, essential conditions for EMH acceptance.
Johansen’s (1988) methodology takes its starting point in the vector autoregression(VAR) of order p given by, yt¼A1yt�1þ y þApyt�pþ et, where yt, is an n� 1 vectorof variables that are integrated of order one, I(1). In this case, the previous equation canbe re written as:
Dyt ¼ mþY
yt�1 þ . . .þXp�1
i¼1
Gyt�1 þ et ð1Þ
204
ARLA26,2
Dow
nloa
ded
by F
GV
At 1
0:32
14
Mar
ch 2
016
(PT
)
where:
Y¼Xp
i¼ 1
Ai � 1 andG ¼ �Xp
j¼ iþ 1
Aj ð2Þ
If the coefficient matrixQ
has a reduced rank ron, then there exist r� n matricesa and b each with rank r such that
Q¼ ab and
Q¼ byt is stationary. r is the number
of co-integrating relationships, the elements of a are known as the adjustmentparameters in the vector error correction (VEC) model and each column of b is aco-integrating vector.
It can be shown that for a given r, the maximum likelihood estimator b matrixdefines the combination of yt�1 that yields the r largest canonical correlation[1] of Dyt
with yt�1, after correcting for lagged differences and deterministic variables whenpresent.
The significance of the likelihood ratio tests of the canonical correlations wereobtained from the trace test, according to the following equation:
ltraco ¼ �TXn
i¼rþ1
lnð1� ltÞ ð3Þ
where T is the sample size, and l#rþ 1 is i-estimator largest canonical correlation. Thetrace test tests the null hypothesis of the number of co-integrating vectors are less orequal to r, against the alternative hypothesis that the number of co-integrating vectorsare higher than r. The hypotheses, null or alternative, of the co-integrating trace testare the following:
H0. r¼ 0, there is no co-integrating.
H1. rX1, there is co-integrating.
A significance level of 5 per cent to reject or not the hypothesis was used. Theasymptotic critical values of the test can be found in Johansen and Juselius (1990) andare also given by most econometric software packages, such as Eviews 7.0, used inthe empirical tests of the present study. However, it is noted that Eviews 7.0 uses thecritical values of Mackinnon (1996) to test stationarity of the residuals considering theco-integrating. To test if the residual derived from the model estimations are autocorrelated, the d of Durbin and Watson (1951) statistical test was applied.
If the prices cannot be co-integrated and only show a short-term relation, they haveto be modelled on a bivariate VAR structure making the following equation:
DSt ¼ cs þXk
i¼1
bsiDSt�iþXk
i¼1
bsiDFt�i þ mst
DFt ¼ cf þXk
i¼1
bfiDSt�iþXk
i¼1
bfiDFt�i þ mft
ð4Þ
where c is the e intercept and, bsi and bfi are positive parameters. mst and mft are randomindependent vectors and identically distributed (i.d.d.). The use of the model means
205
Future marketfor Brazilian
live cattle
Dow
nloa
ded
by F
GV
At 1
0:32
14
Mar
ch 2
016
(PT
)

deciding which one is the lagged component, k, optimal, or which one starts with avalue of one and increases one lag to each integration until the residual correlation willbe eliminated from the equation system.
However, when knowing that the series are co-integrated according to what Lienand Luo (1993) showed, it is chosen to estimate a model with error correction, whichtakes into account the long-term equilibrium between the movement of spot and futureprices, and allows to verify the bias issue on the price predictions. Therefore, thesystem Equations (4) of the VAR structure was transformed into a rigourous bivariateautoregressive VEC according to the following equation:
DSt ¼ cs þXk
i¼1
bsiDSt�iþXk
i¼1
bsiDFt�i þ gsZt�1 þ mst
DFt ¼ cf þXk
i¼1
bfiDSt�iþXk
i¼1
bfiDFt�i � gf Zt�1 þ mft
ð5Þ
where gs and gf are positive parameters and Zt�1 is the error correction term whichmeasures how the dependent variable is adjusted to the deviations of the previousperiods promoted by the equilibrium in the long term, as specified in the followingequation:
Zt�1 ¼ �a� bFt þ St�1 ð6Þ
That can be transformed into the following equation:
St�1 ¼ �aþ bFt þ Zt�1 ð7Þ
where a is a constant and b is a co-integration vector. These two variables of the errorcorrection model, shown in the Equations (5), correspond to the VAR(k) model inthe first differences, increased in the error correction term gsZt�1 and �gfZt�1. Thecoefficient gs and gf are interpreted as adjustment speeds. The higher gs, the higher theresult of St to the previous deviances, due to the long-term equilibrium.
As such, regarding the EMH, the market price must reflect the availableinformation, meaning, Ft of the future contracts in time tþ 1 is an unbiased estimatorof the spot prices in the futures, Stþ 1, according to the following equation:
St�1 ¼ aþ bFt þ ut�1 ð8Þ
The null and alternative hypotheses, for the efficiency of future Brazilian live finishedcattle market in relation to the Argentinean spot market of steers, tested in the studyare the following:
H0. aa0 and ba1 with (bp0), the market is inefficient.
H1A. a¼ 0 and b¼ 1 the market is efficient and there is no existence of riskpremium.
H1B. aa0 and ba1 com (0obo1), the market is efficient, with the presence of riskpremium. In this case the degree of efficiency varies between 0 and 1.
206
ARLA26,2
Dow
nloa
ded
by F
GV
At 1
0:32
14
Mar
ch 2
016
(PT
)
The relaxing of the H1A for a H1B, referring to EMH, is due to the relation betweenspot prices and future products with similar characteristics, but not identical.
From the verification of the statistical parameters obtained by applying theJohansen’s (1988) co-integration test and Johansen and Juselius (1990) and the useof the VEC model it was possible to test, respectively, the EMH and the issue of bias inthe price prediction of this study.
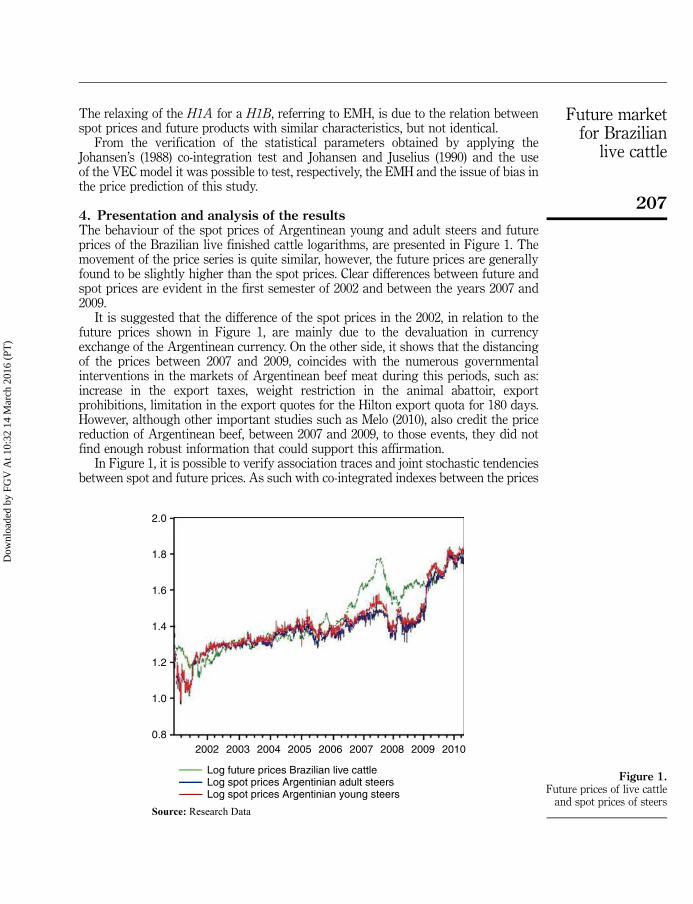
4. Presentation and analysis of the resultsThe behaviour of the spot prices of Argentinean young and adult steers and futureprices of the Brazilian live finished cattle logarithms, are presented in Figure 1. Themovement of the price series is quite similar, however, the future prices are generallyfound to be slightly higher than the spot prices. Clear differences between future andspot prices are evident in the first semester of 2002 and between the years 2007 and2009.
It is suggested that the difference of the spot prices in the 2002, in relation to thefuture prices shown in Figure 1, are mainly due to the devaluation in currencyexchange of the Argentinean currency. On the other side, it shows that the distancingof the prices between 2007 and 2009, coincides with the numerous governmentalinterventions in the markets of Argentinean beef meat during this periods, such as:increase in the export taxes, weight restriction in the animal abattoir, exportprohibitions, limitation in the export quotes for the Hilton export quota for 180 days.However, although other important studies such as Melo (2010), also credit the pricereduction of Argentinean beef, between 2007 and 2009, to those events, they did notfind enough robust information that could support this affirmation.
In Figure 1, it is possible to verify association traces and joint stochastic tendenciesbetween spot and future prices. As such with co-integrated indexes between the prices
2.0
1.8
1.6
1.4
1.2
1.0
0.82002 2003 2004 2005 2006 2007 2008 2009 2010
Log future prices Brazilian live cattle Log spot prices Argentinian adult steersLog spot prices Argentinian young steers
Source: Research Data
Figure 1.Future prices of live cattle
and spot prices of steers
207
Future marketfor Brazilian
live cattle
Dow
nloa
ded
by F
GV
At 1
0:32
14
Mar
ch 2
016
(PT
)
series, to carry an econometric test is essential in order to have a more accurateanalyses and conclusions in this regard.
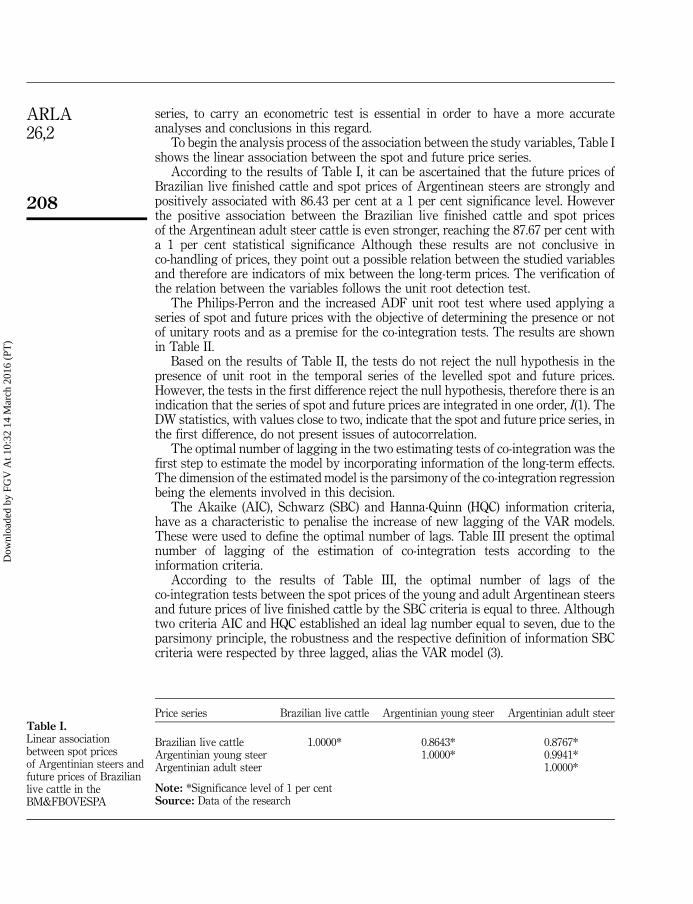
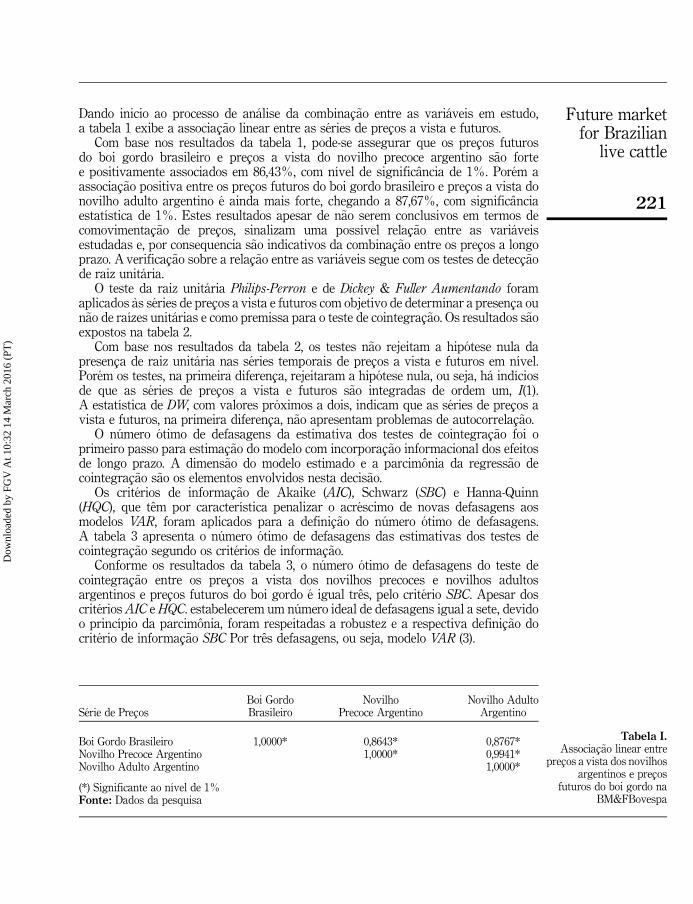
To begin the analysis process of the association between the study variables, Table Ishows the linear association between the spot and future price series.
According to the results of Table I, it can be ascertained that the future prices ofBrazilian live finished cattle and spot prices of Argentinean steers are strongly andpositively associated with 86.43 per cent at a 1 per cent significance level. Howeverthe positive association between the Brazilian live finished cattle and spot pricesof the Argentinean adult steer cattle is even stronger, reaching the 87.67 per cent witha 1 per cent statistical significance Although these results are not conclusive inco-handling of prices, they point out a possible relation between the studied variablesand therefore are indicators of mix between the long-term prices. The verification ofthe relation between the variables follows the unit root detection test.
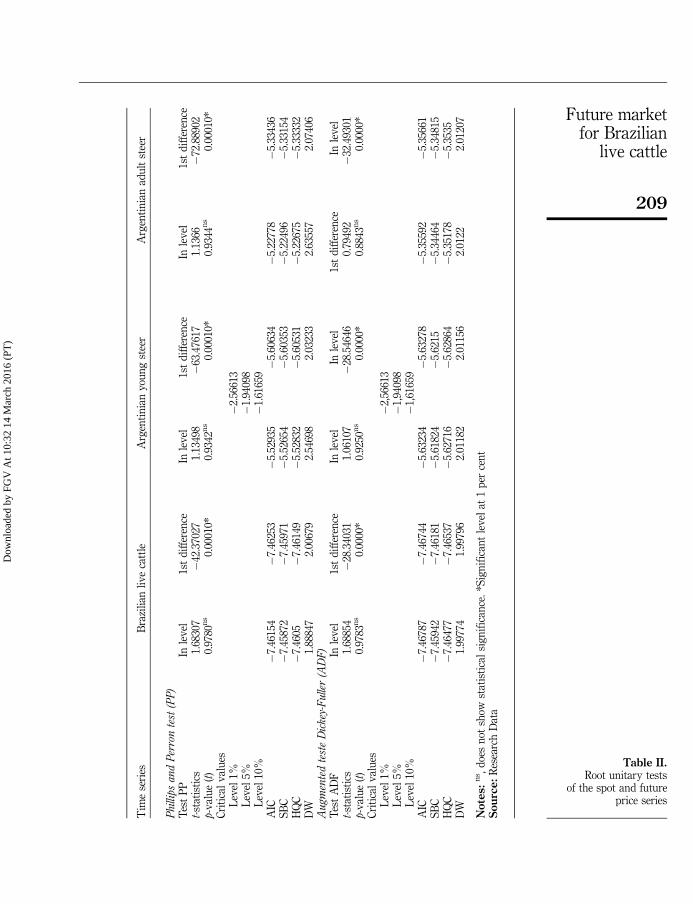
The Philips-Perron and the increased ADF unit root test where used applying aseries of spot and future prices with the objective of determining the presence or notof unitary roots and as a premise for the co-integration tests. The results are shownin Table II.
Based on the results of Table II, the tests do not reject the null hypothesis in thepresence of unit root in the temporal series of the levelled spot and future prices.However, the tests in the first difference reject the null hypothesis, therefore there is anindication that the series of spot and future prices are integrated in one order, I(1). TheDW statistics, with values close to two, indicate that the spot and future price series, inthe first difference, do not present issues of autocorrelation.
The optimal number of lagging in the two estimating tests of co-integration was thefirst step to estimate the model by incorporating information of the long-term effects.The dimension of the estimated model is the parsimony of the co-integration regressionbeing the elements involved in this decision.
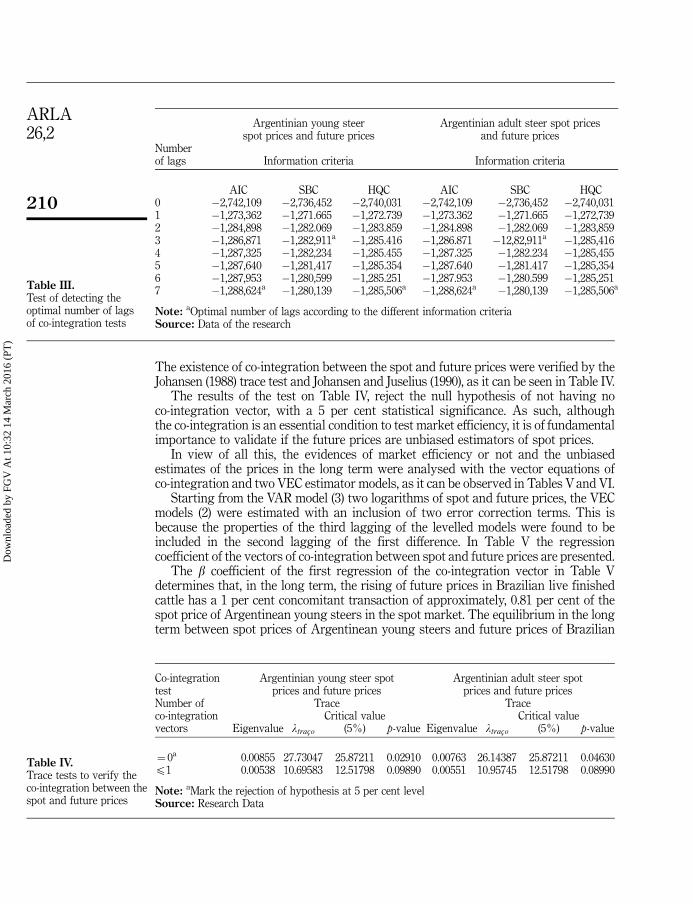
The Akaike (AIC), Schwarz (SBC) and Hanna-Quinn (HQC) information criteria,have as a characteristic to penalise the increase of new lagging of the VAR models.These were used to define the optimal number of lags. Table III present the optimalnumber of lagging of the estimation of co-integration tests according to theinformation criteria.
According to the results of Table III, the optimal number of lags of theco-integration tests between the spot prices of the young and adult Argentinean steersand future prices of live finished cattle by the SBC criteria is equal to three. Althoughtwo criteria AIC and HQC established an ideal lag number equal to seven, due to theparsimony principle, the robustness and the respective definition of information SBCcriteria were respected by three lagged, alias the VAR model (3).
Price series Brazilian live cattle Argentinian young steer Argentinian adult steer
Brazilian live cattle 1.0000* 0.8643* 0.8767*Argentinian young steer 1.0000* 0.9941*Argentinian adult steer 1.0000*
Note: *Significance level of 1 per centSource: Data of the research
Table I.Linear associationbetween spot pricesof Argentinian steers andfuture prices of Brazilianlive cattle in theBM&FBOVESPA
208
ARLA26,2
Dow
nloa
ded
by F
GV
At 1
0:32
14
Mar
ch 2
016
(PT
)
Tim
ese
ries
Bra
zili
anli
ve
catt
leA
rgen
tin
ian
you
ng
stee
rA
rgen
tin
ian
adu
ltst
eer
Phill
ips
and
Per
ron
test
(PP
)T
est
PP
Inle
vel
1st
dif
fere
nce
Inle
vel
1st
dif
fere
nce
Inle
vel
1st
dif
fere
nce
t-st
atis
tics
1.68
307
�42
.370
271.
1349
8�
63.4
7617
1.13
66�
72.8
8902
p-v
alu
e(t
)0.
9780
ns
0.00
010*
0.93
42n
s0.
0001
0*0.
9344
ns
0.00
010*
Cri
tica
lv
alu
esL
evel
1%�
2.56
613
Lev
el5%
�1.
9409
8L
evel
10%
�1.
6165
9A
IC�
7.46
154
�7.
4625
3�
5.52
935
�5.
6063
4�
5.22
778
�5.
3343
6S
BC
�7.
4587
2�
7.45
971
�5.
5265
4�
5.60
353
�5.
2249
6�
5.33
154
HQ
C�
7.46
05�
7.46
149
�5.
5283
2�
5.60
531
�5.
2267
5�
5.33
332
DW
1.88
847
2.00
679
2.54
698
2.03
233
2.63
557
2.07
406
Augm
ente
dte
ste
Dic
key-
Fulle
r(A
DF
)T
est
AD
FIn
lev
el1s
td
iffe
ren
ceIn
lev
elIn
lev
el1s
td
iffe
ren
ceIn
lev
elt-
stat
isti
cs1.
6885
4�
28.3
4031
1.06
107
�28
.546
460.
7949
2�
32.4
9301
p-v
alu
e(t
)0.
9783
ns
0.00
00*
0.92
50n
s0.
0000
*0.
8843
ns
0.00
00*
Cri
tica
lv
alu
esL
evel
1%�
2,56
613
Lev
el5%
�1,
9409
8L
evel
10%
�1,
6165
9A
IC�
7.46
787
�7.
4674
4�
5.63
234
�5.
6327
8�
5.35
592
�5.
3566
1S
BC
�7.
4594
2�
7.46
181
�5.
6182
4�
5.62
15�
5.34
464
�5.
3481
5H
QC
�7.
4647
7�
7.46
537
�5.
6271
6�
5.62
864
�5.
3517
8�
5.35
35D
W1.
9977
41.
9979
62.
0118
22.
0115
62.
0122
2.01
207
Note
s:
ns ,
doe
sn
otsh
owst
atis
tica
lsi
gn
ific
ance
.*S
ign
ific
ant
lev
elat
1p
erce
nt
Sourc
e:
Res
earc
hD
ata
Table II.Root unitary tests
of the spot and futureprice series
209
Future marketfor Brazilian
live cattle
Dow
nloa
ded
by F
GV
At 1
0:32
14
Mar
ch 2
016
(PT
)
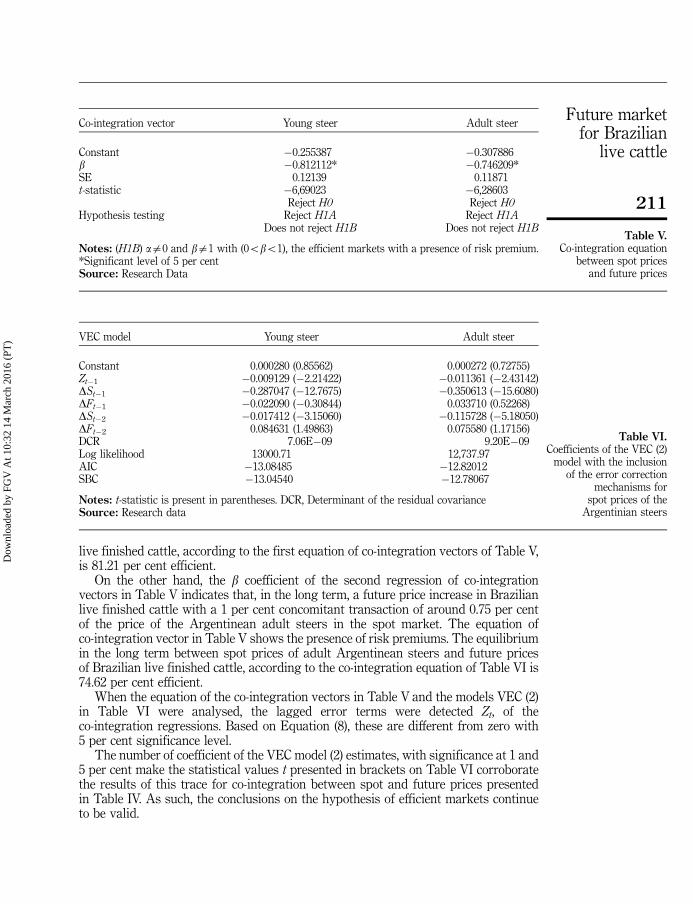
The existence of co-integration between the spot and future prices were verified by theJohansen (1988) trace test and Johansen and Juselius (1990), as it can be seen in Table IV.
The results of the test on Table IV, reject the null hypothesis of not having noco-integration vector, with a 5 per cent statistical significance. As such, althoughthe co-integration is an essential condition to test market efficiency, it is of fundamentalimportance to validate if the future prices are unbiased estimators of spot prices.
In view of all this, the evidences of market efficiency or not and the unbiasedestimates of the prices in the long term were analysed with the vector equations ofco-integration and two VEC estimator models, as it can be observed in Tables V and VI.
Starting from the VAR model (3) two logarithms of spot and future prices, the VECmodels (2) were estimated with an inclusion of two error correction terms. This isbecause the properties of the third lagging of the levelled models were found to beincluded in the second lagging of the first difference. In Table V the regressioncoefficient of the vectors of co-integration between spot and future prices are presented.
The b coefficient of the first regression of the co-integration vector in Table Vdetermines that, in the long term, the rising of future prices in Brazilian live finishedcattle has a 1 per cent concomitant transaction of approximately, 0.81 per cent of thespot price of Argentinean young steers in the spot market. The equilibrium in the longterm between spot prices of Argentinean young steers and future prices of Brazilian
Argentinian young steerspot prices and future prices
Argentinian adult steer spot pricesand future prices
Numberof lags Information criteria Information criteria
AIC SBC HQC AIC SBC HQC0 �2,742,109 �2,736,452 �2,740,031 �2,742,109 �2,736,452 �2,740,0311 �1,273,362 �1,271.665 �1,272.739 �1,273.362 �1,271.665 �1,272,7392 �1,284,898 �1,282.069 �1,283.859 �1,284.898 �1,282.069 �1,283,8593 �1,286,871 �1,282,911a �1,285.416 �1,286.871 �12,82,911a �1,285,4164 �1,287,325 �1,282,234 �1,285.455 �1,287.325 �1,282.234 �1,285,4555 �1,287,640 �1,281,417 �1,285.354 �1,287.640 �1,281.417 �1,285,3546 �1,287,953 �1,280,599 �1,285.251 �1,287.953 �1,280.599 �1,285,2517 �1,288,624a �1,280,139 �1,285,506a �1,288,624a �1,280,139 �1,285,506a
Note: aOptimal number of lags according to the different information criteriaSource: Data of the research
Table III.Test of detecting theoptimal number of lagsof co-integration tests
Co-integrationtest
Argentinian young steer spotprices and future prices
Argentinian adult steer spotprices and future prices
Trace TraceNumber ofco-integrationvectors Eigenvalue ltraco
Critical value(5%) p-value Eigenvalue ltraco
Critical value(5%) p-value
¼ 0a 0.00855 27.73047 25.87211 0.02910 0.00763 26.14387 25.87211 0.04630p1 0.00538 10.69583 12.51798 0.09890 0.00551 10.95745 12.51798 0.08990
Note: aMark the rejection of hypothesis at 5 per cent levelSource: Research Data
Table IV.Trace tests to verify theco-integration between thespot and future prices
210
ARLA26,2
Dow
nloa
ded
by F
GV
At 1
0:32
14
Mar
ch 2
016
(PT
)
live finished cattle, according to the first equation of co-integration vectors of Table V,is 81.21 per cent efficient.
On the other hand, the b coefficient of the second regression of co-integrationvectors in Table V indicates that, in the long term, a future price increase in Brazilianlive finished cattle with a 1 per cent concomitant transaction of around 0.75 per centof the price of the Argentinean adult steers in the spot market. The equation ofco-integration vector in Table V shows the presence of risk premiums. The equilibriumin the long term between spot prices of adult Argentinean steers and future pricesof Brazilian live finished cattle, according to the co-integration equation of Table VI is74.62 per cent efficient.
When the equation of the co-integration vectors in Table V and the models VEC (2)in Table VI were analysed, the lagged error terms were detected Zt, of theco-integration regressions. Based on Equation (8), these are different from zero with5 per cent significance level.
The number of coefficient of the VEC model (2) estimates, with significance at 1 and5 per cent make the statistical values t presented in brackets on Table VI corroboratethe results of this trace for co-integration between spot and future prices presentedin Table IV. As such, the conclusions on the hypothesis of efficient markets continueto be valid.
Co-integration vector Young steer Adult steer
Constant �0.255387 �0.307886b �0.812112* �0.746209*SE 0.12139 0.11871t-statistic �6,69023 �6,28603
Reject H0 Reject H0Hypothesis testing Reject H1A Reject H1A
Does not reject H1B Does not reject H1B
Notes: (H1B) aa0 and ba1 with (0obo1), the efficient markets with a presence of risk premium.*Significant level of 5 per centSource: Research Data
Table V.Co-integration equation
between spot pricesand future prices
VEC model Young steer Adult steer
Constant 0.000280 (0.85562) 0.000272 (0.72755)Zt�1 �0.009129 (�2.21422) �0.011361 (�2.43142)DSt�1 �0.287047 (�12.7675) �0.350613 (�15.6080)DFt�1 �0.022090 (�0.30844) 0.033710 (0.52268)DSt�2 �0.017412 (�3.15060) �0.115728 (�5.18050)DFt�2 0.084631 (1.49863) 0.075580 (1.17156)DCR 7.06E�09 9.20E�09Log likelihood 13000.71 12,737.97AIC �13.08485 �12.82012SBC �13.04540 �12.78067
Notes: t-statistic is present in parentheses. DCR, Determinant of the residual covarianceSource: Research data
Table VI.Coefficients of the VEC (2)
model with the inclusionof the error correction
mechanisms forspot prices of the
Argentinian steers
211
Future marketfor Brazilian
live cattle
Dow
nloa
ded
by F
GV
At 1
0:32
14
Mar
ch 2
016
(PT
)

5. ConclusionsThe objective of this paper was to verity the efficiency of future market of Brazilian livefinished cattle in BM&FBOVESPA, as a predictor of the prices of steer cuts in theArgentinean spot market in the presence of risk premiums.
Initially, a strong positive linear association higher than 85 per cent was foundbetween the spot and future markets. Subsequently for the unit root test, it was foundin the first difference, that the prices are seasonal, hence integrated in order one.
The result of the trace test indicates the presence of the co-integration vectorbetween the spot prices of Argentinean steers and future prices of the Brazilian livefinished cattle. The application of the error correction model, VEC, allows to test for theEMH with the presence of premium risk. The results showed that the risk premiumdoes not cause the rejection of the hypothesis of unbiased future prices.
The results show that for a market efficiency in the long term between the spotprices of Argentinean young steers and future prices of Brazilian live finished cattle ofapproximately of 81 per cent. In regards to the market efficiency in the long termbetween the spot prices of Argentinean adult steers and future prices of Brazilian livefinished cattle, is around 75 per cent. These results suggest that the future beef cattleprices can significantly help to predict spot prices of Argentinean steers.
Therefore, in can be stated based on the results of the co-integration tests andunbiased on the prices, that the future markets of Brazilian live finished cattle isefficient, and in the long term the future prices of beef are unbiased estimates of thespot prices of Argentinean steers.
The results obtained in this study contrast with the ones found by Bressler andCovey (1991), McKenzie and Holt (2002) and Alves et al. (2008). Although itcorroborates the research of Kellard et al. (1999), Melo et al. (2006), Abitante (2008) andMoraes et al. (2009).
The results found in the different EMH tests for future agricultural markets arecredited to diverse factors, specifically the analysis period, seasonality, governmentalintervention and institutional structures. In this context, the differences among theproducts, the spot market and the pattern of the derivatives of the future markets inregards to this study contribute to the research of different perspective of the EMH.
Therefore, the maturity of the future market of the live finished cattle, added to thegrowth of the participation of different agents of the productive chain of the bovinemeat, is an indicative, of the future contracts of the live finished cattle of theBM&FBOVESPA. These tend to be used more every time as a protection tool againstthe price changes in the spot market, not only by agents that act on the Brazilianbovine market, but also in other market. It already happens in a significant volumewith other commodities, in other stocks as for examples soy and its derivatives in theChicago Board of Trade.
The great number of methods that can be used to test the EMH allows that differentresearches on the relation between markets with similar characteristics as this study tobe made, especially, within the context of comparing the efficiency between thederivatives of different stocks to mitigate the risk of agricultural price commodities ofcountries that lack or do not have these tools available.
1. Introduc~aoAs riquezas geradas pelos mercados agrıcolas e agroindustriais s~ao muito importantespara a composic~ao do produto interno bruto (PIB) da economia de diversos paıses daAmerica do Sul. O conjunto de operacoes e negocios realizados neste mercado,
212
ARLA26,2
Dow
nloa
ded
by F
GV
At 1
0:32
14
Mar
ch 2
016
(PT
)
denominado agronegocio, representa, aproximadamente, 23% e 32% do PIB do Brasile da Argentina, respectivamente, maiores economias sul-americanas. Neste contexto,as operacoes e negocios relacionados ao mercado da carne bovina representam cerca de13% do PIB do agronegocio nesses paıses (CEPEA, 2011; MAGYP, 2011; USDA, 2011).
Em 2010, juntos, Brasil e Argentina responderam por algo perto de 25% docontingente de bovinos de corte no mundo. O Brasil, com 185,16 milhoes de bovinos e aArgentina, com 49,05 milhoes de bovinos, ocupam a primeira e a quarta colocac~ao emrebanho bovino comercial no mundo. Neste mesmo perıodo, a produc~ao anual de carnebovina no Brasil e na Argentina foi de 9,12 e 2,60 milhoes de toneladas, o que os colocana segunda e quarta posicoes no ranking mundial em produc~ao de carne bovina(USDA, 2011).
As exportacoes de carne bovina brasileira e argentina foram de 1,56 milhoes e 298mil toneladas de carne bovina em 2010, representando, respectivamente, 20,77% e 4%das exportacoes mundiais da commodity (ABIEC, 2011; MAGYP, 2011; USDA, 2011).
O mercado da carne bovina brasileira e argentina apresenta algumas caracterısticasem comum, dentre estas, salienta-se que em 2009, dos 87 paıses que comercializaramcarne bovina com frigorıficos instalados na Argentina, 72 tambem adquiriram oproduto de frigorıficos atuantes no Brasil, o que representa 83% de destino comumpara exportac~ao da commodity (IPVCA, 2012; Melo, 2010).
Apesar dos numeros significativos do mercado da carne bovina, ressalta-se aimportancia da existencia de instrumentos derivativos negociados em bolsaorganizada que propiciem o gerenciamento da volatilidade dos precos. Australia,Brasil, Estados Unidos da America (EUA), atualmente, contam com instrumentosderivativos negociados em bolsa com objetivo de mitigar os riscos de precos domercado a vista de bovinos de corte. Porem, a Argentina carece de instrumentosderivativos que objetivem a cobertura do risco gerada pelas incertezas do mercado avista da carne bovina.
Na Argentina, diversas tentativas de negociac~ao de contratos futuros e de ındice deprecos de carne bovina foram frustradas ao longo dos anos, sendo estes derivativoslancados e em um curto espaco de tempo fracassados por falta de liquidez.
Importantes estudos apontam para elementos que levaram ao curto ciclo de vidados contratos futuros de carne bovina na Argentina, como contratos futuros que n~aoatendiam a interesses comuns dos agentes da cadeia produtiva, e incompatibilidadedos padroes dos derivativos em termos de tamanho, vencimento e margens de garantia(Comiso, 2007; Dopchiz, 2008).
O problema enfrentado pelos agentes da cadeia produtiva da carne bovinaargentina, decorrente da carencia de derivativos em mercados futuros, e um elementoque colabora para que se realise a investigac~ao sobre a eficiencia de outro mercadona administrac~ao do risco de precos. No entanto, ressalta-se que a alternativa deprotec~ao contra o risco so e possıvel quando n~ao se rejeita a hipotese do mercadoeficiente (HME).
Em um mercado futuro eficiente, os precos futuros correntes de um contrato paraentrega de um produto em uma data futura s~ao estimadores robustos dos precos a vistapara essa mesma data, e incorporam todo o conjunto de informacoes para prever opreco futuro. Logo, a capacidade dos precos a vista em incorporar as informacoesdisponıveis e que determina se um mercado e ou n~ao eficiente (Fama, 1970; Moraeset al., 2009).
Portanto, ao considerar as diferencas da produc~ao e comercializac~ao de bovinosde corte e as particularidades do mercado da carne bovina brasileira e argentina, e a
213
Future marketfor Brazilian
live cattle
Dow
nloa
ded
by F
GV
At 1
0:32
14
Mar
ch 2
016
(PT
)
problematica no gerenciamento dos precos, em especial, a enfrentada na bovinoculturade corte e mercado da carne bovina argentina, e que emerge a quest~ao: os precosfuturos do boi gordo na Bolsa de Valores, Mercadorias e Futuros – S~ao Paulo/Brasil(BM&FBOVESPA) s~ao preditores n~ao viesados dos precos a vista dos novilhos de corteargentinos na data do vencimento dos contratos?
Assim sendo, este estudo tem por objetivo verificar a eficiencia do mercado futurodo boi gordo brasileiro em relac~ao ao mercado a vista argentino de novilhos de corte napresenca de premio ao risco.
2. Fundamentac~ao teoricaUm mercado eficiente e aquele em que as informacoes disponıveis encontram-setotalmente refletidas nos precos e quaisquer mudancas que venham a ocorrer so s~aopossıveis pela incorporac~ao de novas informacoes. Desta forma, em um mercadoeficiente, as oportunidades de gerac~ao de lucros por meio do conteudo informacionalinserido nos precos s~ao limitadas. Esta e a denominada hipotese do mercado eficiente(HME) (Fama, 1970).
Historicamente, a HME se divide em tres categorias, sendo estas relacionadasa tipos distintos de informacoes. O teste da forma fraca da HME verifica setodas as informacoes incorporadas aos precos anteriores encontram-se refletidasno preco a vista. O teste da forma semiforte da HME constata se o conjuntode informacoes publicamente disponıveis encontra-se refletida nos precos a vista.Ja o teste da forma forte da HME, apura se todas as informacoes, publicamenteou n~ao, disponıveis, encontram-se integralmente refletidas nos precos a vistae se qualquer investidor conseguiria obter lucros superiores (Bodie et al., 2010;Fama, 1991, 1970).
Baseando-se na concepc~ao de Fama (1970), de que a HME e aquela em que os precosdos ativos refletem completamente as informacoes disponıveis, a eficiencia dos precosfuturos vem sendo testada por meio da equac~ao: Stþ 1¼ aþ bFtþ utþ 1, onde, Stþ 1 e opreco a vista no perıodo tþ 1; Ft e o preco futuro no perıodo t; e utþ 1 e o termo de erroindependente e identicamente distribuıdo com media igual a zero e variancia constante;os coeficientes a e b s~ao constantes de um mercado eficiente com valores a¼ 0 e b¼ 1;e, portanto, Et(Stþ 1�Ft)¼ 0.
Nesse contexto, para n~ao rejeitar o teste da HME na forma fraca, o preco no mercadoa vista n~ao so deve refletir o conjunto de informacoes disponıveis, como tambem opreco futuro do ativo na data de vencimento do contrato tþ 1 deve ser um estimadorn~ao viesado do preco a vista deste mesmo ativo no momento t.
Fundamentado em Fama (1991, 1970), Camargos and Barbosa (2003) e Alves et al.(2008) chamam a atenc~ao para alguns pressupostos elementares do teste da HME, s~aoeles: o ambiente de concorrencia perfeita, concordancia em termos das expectativas dosinvestidores sobre as informacoes e a n~ao considerac~ao dos custos de transac~ao e deinformac~ao. Isto porque, dadas as imperfeicoes do mercado e a admiss~ao deinformacoes custosas e assimetricas, a HME seria rejeitada, uma vez que o resultadoseria ba1 (Fama, 1970; Zulauf and Irwin, 1997).
A velocidade dos agentes em analisar as informacoes disponıveis e um elemento quepode gerar vies no preco, caso a capacidade de processamento de uns seja superior a dosdemais, neste caso, Et(Stþ 1�Ft)a0. Considerando esta possibilidade, a HME de Fama(1970) permitiria a existencia de um premio pelo risco. O vies no preco, neste caso,e denotado como aa0, sendo o valor a definido como a compensac~ao pelo risco (Moraeset al., 2009; Alves et al., 2008; Zulauf and Irwin, 1997; Fama, 1970).
214
ARLA26,2
Dow
nloa
ded
by F
GV
At 1
0:32
14
Mar
ch 2
016
(PT
)

Dessa forma, existiriam duas versoes para a HME de Fama (1970), a primeira coma¼ 0e b¼ 1 e, a segunda com aa0e ba1, sendo os coeficientes constantes ou n~ao notempo. Apesar do premio ao risco ser controverso para a HME, a existencia deste e umaquest~ao empırica e n~ao conceitual. Logo, na segunda vers~ao da HME, o premio ao riscon~ao invalida o teste, visto que ele n~ao depende da ausencia deste (Moraes et al., 2009;Zulauf and Irwin, 1997).
A vers~ao da HME que resulta em aa0 e ba1 foi tambem evidenciada nainvestigac~ao de Danthine (1978), que concluıram que a presenca do premio ao risco n~aointerfere no teste, ja que a HME n~ao depende da ausencia deste.
Resultados distintos sobre os testes da HME est~ao presentes em variasinvestigacoes que tem como objeto os mercados futuros, o que fomenta crıticasa seu respeito. Enquanto estudos como os de Beck (1994), Pizzi and Just (1998), Ackerand Racine (1999), Chu et al. (1999), Jumah and Martin (1999), Melo et al. (2006), SilvaNeto et al. (2010), Abitante (2008) e Moraes et al. (2009), n~ao rejeitaram a HME na formafraca, outros, como os de Leuthold (1979) e Bressler and Covey (1991), Lai and Lai(1991), e, Alves et al. (2008), rejeitaram a HME para os mercados futuros investigados.
Contrariando os estudos que se definem pela forte rejeic~ao da HME, algumasinvestigacoes creditam a elementos especıficos a falta de robustez para suporta-la.Essa situac~ao e evidenciada nos estudos de Fama and French (1987), Kellard et al.(1999), McKenzie and Holt (2002), e Kenourgios (2005).
Os resultados diferentes para os testes da HME em mercados futuros decommodities agrıcolas s~ao atribuıdos a fatores como: padroes dos contratos,caracterısticas dos produtos, sazonalidade, espacamento das observacoes decontratos, perıodo de analise, fatores institucionais, intervencoes governamentais,procedimentos estatısticos e tecnicas econometricas de analise, entre outros(Kellard et al., 1999; Newbold et al., 1999). Logo, destaca-se que as conclusoes sobrea HME devem ser cautelosas a ponto de considerarem as especificidades do mercadoagrıcola e dos metodos aplicados a investigac~ao.
A analise sobre a capacidade dos precos futuros na de predic~ao dos precos a vistautiliza-se de diferentes metodos de investigac~ao desde a origem da HME. Todavia, como desenvolvimento das tecnicas de cointegrac~ao, varios estudos optaram pelo seu usopara testa-la. A tecnica de cointegrac~ao desenvolvida por Engle and Granger (1987)foi amplamente usada para analisar a estacionariedade da combinac~ao linear entreseries financeiras, assim como o equilıbrio destas no longo prazo. Porem a limitac~ao emanalisar a cointegrac~ao de mais de duas series restringiu sua aplicac~ao ao longo dapesquisa sobre a HME.
A tecnica de Engle and Granger (1987) vem sendo utilizada desde ent~ao parainvestigacoes que envolvam apenas duas variaveis, em especial, em raz~ao de suafacilidade de aplicac~ao. Estudos de Bressler and Covey (1991); Kellard et al. (1999);Newbold et al. (1999), e Melo et al. (2006), alcancaram resultados consistentes para ostestes da HME pela aplicac~ao da tecnica de cointegrac~ao de Engle and Granger (1987).
O desenvolvimento de uma tecnica de cointegrac~ao que permitisse testar a HMEcom precis~ao, mesmo em situacoes em que a analise envolve mais de duas variaveis,teve Johansen (1988) como um dos precursores. A tecnica de cointegrac~ao proposta porJohansen parte da derivac~ao do teste pelo metodo de maxima-verossimilhanca e seguecom a estimac~ao dos parametros da relac~ao de equilıbrio entre as series n~aoestacionarias.
O teste de cointegrac~ao de Johansen (1988) pelo vetor autorregressivo permite aindaa verificac~ao das interacoes entre precos a vista e futuros. A combinac~ao linear e
215
Future marketfor Brazilian
live cattle
Dow
nloa
ded
by F
GV
At 1
0:32
14
Mar
ch 2
016
(PT
)
estacionaria entre variaveis n~ao estacionarias, exigida para confirmac~ao da HME,tem Enders (2004) como um dos principais defensores.
O teste de cointegrac~ao de Johansen (1988) foi usado em diversos testes da HMEem mercados futuros agrıcolas, principalmente em vista da parcimonia e robustez dosresultados conseguidos pela sua aplicac~ao; dentre estes estudos, destacam-seKenourgios (2005), Abitante (2008), Alves et al. (2008), Moraes et al. (2009), e entre outros.
Desde o surgimento da HME, estudos tem sido realizados com commoditiesagrıcolas, como: acucar, boi gordo, cafe, etanol, milho, soja, entre outras, todosenvolvendo produtos e mercados com caracterısticas muito semelhantes, inclusive coma mesma abrangencia territorial. Porem, testa-se neste estudo a HME para mercados dediferentes paıses, neste caso, o mercado futuro brasileiro e o mercado a vista argentino,de bovinos de corte.
3. MetodologiaA presente pesquisa caracteriza-se como quantitativa do tipo descritiva. Neste sentido,buscou-se estabelecer a relac~ao entre causa e efeito das variaveis visando determinaruma base de estimac~ao com rigor exigido pelos testes de hipoteses.
A analise de series temporais foi aplicada com proposito de verificar as dinamicas eestruturas temporais dos dados. Em seguida foram avaliadas: a associac~ao linear,estacionariedade, autocorrelac~ao serial e cointegrac~ao entre os precos. As tecnicas decointegrac~ao s~ao aplicadas visando verificar a existencia do relacionamento de longoprazo entre os precos futuros e a vista. Todas as analises seguiram os rigores exigidospara cada teste estatıstico em particular.
As analises das series temporais foram apoiadas pelo uso do software Eviews 7.0.Para estruturac~ao das equacoes foi usado o software Mathtype 5. Ja o tratamento dosdados apoiou-se no uso do software Microsoft Excel vers~ao 2007.
3.1 Dados e procedimentosAs series diarias de precos do mercado a vista dos novilhos de corte argentinos eprecos futuros da arroba do boi gordo na BM&FBOVESPA, utilizados para testar aHME, compreendem o perıodo entre 02 de janeiro de 2002 e 13 de maio de 2011.
As cotacoes diarias referentes ao indicador de precos futuros da arroba do boi gordoda BM&FBOVESPA foram obtidas junto ao Centro de Estudos Avancados emEconomia Aplicada (CEPEA), responsavel pela divulgac~ao diaria de precos de ajustediario dos contratos futuros. O Indicador e definido, originalmente, em reais, e tambemdivulgado em dolares americanos.
O contrato futuro do boi gordo refere-se a 330 arrobas lıquidas (15 quilogramas).O boi gordo brasileiro e caracterizado como um bovino macho, vivo, castrado, comcarcaca convexa, alimentado a pasto ou confinamento, com peso entre 450 e 550quilogramas e idade maxima de 42 meses (BM&FBOVESPA, 2012).
As cotacoes diarias referentes aos precos a vista dos novilhos de corte argentinosforam obtidas junto ao Ministerio da Agricultura, Pecuaria e Pesca da Argentina(MAGYP) e referem-se aos precos a vista praticados no Mercado de Liniers S.A, que e omais importante centro de transacoes a vista de bovinos na Argentina. Os precos dosnovilhos argentinos s~ao cotados por quilograma/peso vivo, e a moeda referencial e opeso argentino.
O novilho precoce argentino e um bovino macho, jovem, vivo, castrado,apresentando entre dois e quatro dentes incisivos definitivos, com carcaca retilınea,alimentado a pasto ou confinamento, com peso entre 300 e 430 quilogramas e idade em
216
ARLA26,2
Dow
nloa
ded
by F
GV
At 1
0:32
14
Mar
ch 2
016
(PT
)
torno de 30 meses. Ja o novilho adulto argentino diferencia-se por ter, no mınimo seisdentes incisivos permanentes, conformac~ao de carcaca entre subconvexa e convexa,peso entre 431 e 520 quilogramas e idade entre 30 e 42 meses (MAGYP, 2011).
Os precos a vista dos novilhos argentinos foram transformados em dolar conformecotac~ao diaria do Banco Central da Republica da Argentina e, em seguida,transformados em arrobas lıquidas, considerando o aproveitamento equivalente acarcaca de 50%.
A presenca de dias sem cotac~ao de precos e os outliers n~ao legıtimos forameliminados da amostra. Em seguida, as series de precos foram logaritmizadas visandoremover as tendencias exponenciais e avaliadas quanto a associac~ao linear. Essesprocedimentos seguem os padroes dos testes da HME com a aplicac~ao de tecnicasde cointegrac~ao.
3.2 Hipotese e Testes EstatisticosNo presente estudo foi verificada a hipotese de que os precos futuros, na data dovencimento dos contratos futuros de boi gordo na BM&FBOVESPA, s~ao preditoresn~ao viesados dos precos a vista dos novilhos de corte argentinos. Para verificar aeficiencia do mercado futuro foram aplicados, sequencialmente, os testes estatısticosde estacionariedade para a constatac~ao da ordem de integrac~ao e os testes decointegrac~ao.
O teste de eficiencia de mercado exige, necessariamente, que as variaveis, precos avista e futuros, sejam cointegradas na mesma ordem. Portanto, as series de precosdevem possuir raiz unitaria, ou seja, ser n~ao estacionarias.
Posto de forma mais generalizada, uma relac~ao de cointegrac~ao e tida como umfenomeno de equilıbrio de longo prazo, ou seja, mesmo que essas variaveis se desviemdo seu relacionamento no curto prazo, esta associac~ao sera retomada no longo prazo.
A partir dos testes de raiz unitaria de Dickey and Fuller Aumentando (1981) ePhillips and Perron (1988), de conhecidos por Phillips-Perron e ADF, respectivamente,foi possıvel identificar com maior acuracia se as series s~ao integradas em mesmaordem, ou seja, I(1). Os testes de Phillips-Perron e ADF para estacionariedade verificamas hipoteses nula e alternativa: H0: ytBI(1) e H1: ytBI(0).
Apesar de necessaria, a integrac~ao de mesma ordem n~ao quer dizer que as seriessejam cointegradas; assim sendo, optou-se pela aplicac~ao do teste traco de Johansen(1988) e Johansen and Juselius (1990) para a verificac~ao de combinacoes lineares do tipoI(0). Este teste permitiu investigar a existencia de equilıbrio a longo prazo entre osprecos a vista e futuros, condicoes fundamentais para aceitac~ao da HME.
A metodologia de Johansen (1988) tem como ponto de partida o vetorautorregressivo de ordem p dado por, yt¼A1yt�1þyþApyt�pþ et, onde yt, e umvetor n� 1 de variaveis que s~ao integradas de ordem um, I(1). Neste caso, a equac~aoanterior pode ser reescrita como:
Dyt ¼ mþY
yt�1 þ . . .þXp�1
i¼1
Gyt�1 þ et ð1Þ
Onde:
Y¼Xp
i¼1
Ai � 1 andG ¼ �Xp
j¼iþ1
Aj ð2Þ
217
Future marketfor Brazilian
live cattle
Dow
nloa
ded
by F
GV
At 1
0:32
14
Mar
ch 2
016
(PT
)
Se o coeficiente da matrizQ
tem posto reduzido ron, ent~ao, existem r� n matrizes ae b, cada uma com posto r, tal que
Q¼ ab e
Q¼ byt e estacionaria, onde r e o numero
de relacoes de cointegrac~ao, os elementos de a s~ao conhecidos como parametros deajustamento no vetor de correc~ao do erro e cada coluna de b e um vetor de integrac~ao.
Pode-se mostrar que, para um dado r, o estimador de maxima verossimilhanca damatriz b define uma combinac~ao de yt-1 que produz r correlacoes canonicas[2] maioresentre Dyt e yt�1, apos as correcoes de diferencas de defasagem e variaveisdeterminısticas quando presentes.
A significancia da raz~ao de verossimilhanca das correlacoes canonicas foramconseguidas a partir do teste traco, conforme a equac~ao (3).
ltraco ¼ �TXn
i¼rþ1
lnð1� ltÞ ð3Þ
Onde T e o tamanho da amostra, e l#rþ 1 e a i-esima maior correlac~ao canonica. O testetraco avalia a hipotese nula de que o numero de vetores de cointegrac~ao e menor ouigual a r, contra a hipotese alternativa de que o numero de vetores de cointegrac~ao esuperior a r. As hipoteses, nula e alternativa, do teste traco de cointegrac~ao s~ao asseguintes:
H0. r¼ 0, n~ao ha cointegrac~ao.
H1. rX1, ha cointegrac~ao.
Considera-se o nıvel de significancia de 5% para rejeic~ao ou n~ao rejeic~ao das hipoteses.Os valores crıticos assintoticos do teste ltraco podem ser encontrados em Johansen andJuselius (1990) e muitos pacotes de software econometricos, como o Eviews 7.0,utilizado nos testes empıricos do presente estudo. Porem, destaca-se que o Eviews 7.0emprega os valores crıticos de Mackinnon (1996) para testar a estacionariedade dosresıduos considerando a cointegrac~ao. Para testar se os resıduos originados daestimac~ao do modelo s~ao autocorrelacionados, foi aplicada a estatıstica d de Durbinand Watson (1951).
No caso dos precos n~ao serem cointegrados e apresentarem somente uma relac~ao decurto prazo, esses devem ser modelados sob uma estrutura vetorial autorregressivabivariada (VAR) conforme o sistema de equacoes 4.
DSt ¼ cs þXk
i¼1
bsiDSt�iþXk
i¼1
bsiDFt�i þ mst
DFt ¼ cf þXk
i¼1
bfiDSt�iþXk
i¼1
bfiDFt�i þ mft
ð4Þ
Onde, c e o intercepto e, bsi e bfi s~ao parametros positivos. mstemft s~ao vetores aleatoriosindependente e identicamente distribuıdos (i.d.d). A aplicac~ao do modelo implicadecidir qual e o seu comprimento de defasagem, k, otimo, o qual se inicia com o valorum e acrescenta-se uma defasagem a cada interac~ao ate que a correlac~ao residual sejaeliminada do sistema de equacoes.
218
ARLA26,2
Dow
nloa
ded
by F
GV
At 1
0:32
14
Mar
ch 2
016
(PT
)
Porem, ao saber que as series s~ao cointegradas conforme o exposto por Lien andLuo (1993), deve-se optar por estimar um modelo com correc~ao de erro, que leve emconta o equilıbrio de longo prazo entre os movimentos dos precos a vista e futuros, epossibilita verificar a quest~ao do vies na predic~ao dos precos. Assim, o sistema deequacoes 4 da estrutura do VAR foi transformado em uma estrutura vetorialautorregressiva bivariada com correc~ao de erro (VEC) conforme a equac~ao 5.
DSt ¼ cs þXk
i¼1
bsiDSt�iþXk
i¼1
bsiDFt�i þ gsZt�1 þ mst
DFt ¼ cf þXk
i¼1
bfiDSt�iþXk
i¼1
bfiDFt�i � gf Zt�1 þ mft
ð5Þ
Onde gs e gf s~ao parametros positivos e Zt-1 e o termo de correc~ao do erro que medecomo a variavel dependente se ajusta aos desvios dos perıodos anteriores promovidospelo equilıbrio no longo prazo, como especificado na equac~ao 6.
Zt�1 ¼ �a� bFt þ St�1 ð6Þ
Que pode ser transformada na equac~ao 7.
St�1 ¼ �aþ bFt þ Zt�1 ð7Þ
Onde, a e uma constante, e b e o vetor de cointegrac~ao. Estas duas variaveis do modelode correc~ao do erro, expressas no sistema de equacoes 5, correspondem ao modeloVAR(k) na primeira diferenca, acrescido do termo correc~ao do erro gsZt-1 e �gfZt-1. Oscoeficientes gs e gf s~ao interpretados como a velocidade de ajustamento. Quanto maiorgs, maior a resposta de St aos desvios anteriores, devido ao equilıbrio no longo prazo.
Assim sendo, sob a HME, o preco do mercado deve refletir as informacoesdisponıveis, ou seja, Ft do contrato futuro no tempo tþ 1 e um estimador n~ao viesadodo preco a vista no futuro, Stþ 1, conforme a equac~ao 8.
St�1 ¼ aþ bFt þ ut�1 ð8Þ
As hipoteses, nula e alternativa, para eficiencia do mercado futuro brasileiro do boigordo brasileiro em relac~ao ao mercado a vista argentino dos novilhos de corte,testadas no estudo, s~ao as seguintes:
H0. aa0 e ba1 com (bp0), o mercado e ineficiente.
H1A. a¼ 0 e b¼ 1, o mercado e eficiente e n~ao existe premio ao risco.
H1B. aa0 e ba1 com (0obo1), o mercado e eficiente, com a presenca de premioao risco. Neste caso, o grau de eficiencia varia entre 0 e 1.
O relaxamento da H1A para a H1B, referente a HME, deve-se a relac~ao entre precos avista e futuros de produtos com caracterısticas similares, porem n~ao identicas.
219
Future marketfor Brazilian
live cattle
Dow
nloa
ded
by F
GV
At 1
0:32
14
Mar
ch 2
016
(PT
)
A partir da verificac~ao dos parametros estatısticos obtidos pela aplicac~ao dos testesde cointegrac~ao de Johansen (1988) e Johansen and Juselius (1990) e do uso do modeloVEC foi possıvel testar respectivamente, a HME e a quest~ao do vies da predic~ao deprecos proposta pelo estudo.
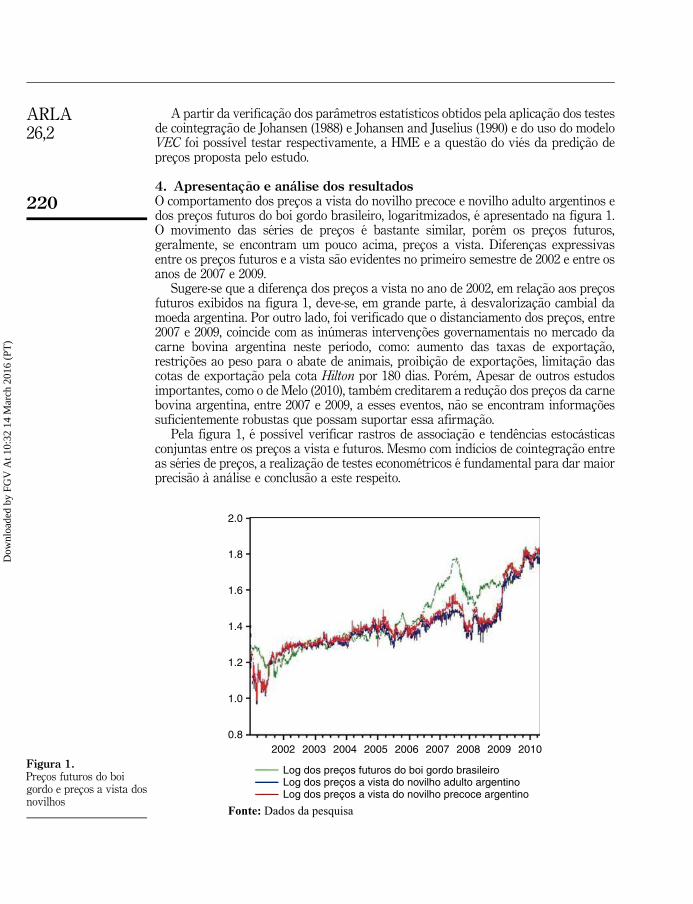
4. Apresentac~ao e analise dos resultadosO comportamento dos precos a vista do novilho precoce e novilho adulto argentinos edos precos futuros do boi gordo brasileiro, logaritmizados, e apresentado na figura 1.O movimento das series de precos e bastante similar, porem os precos futuros,geralmente, se encontram um pouco acima, precos a vista. Diferencas expressivasentre os precos futuros e a vista s~ao evidentes no primeiro semestre de 2002 e entre osanos de 2007 e 2009.
Sugere-se que a diferenca dos precos a vista no ano de 2002, em relac~ao aos precosfuturos exibidos na figura 1, deve-se, em grande parte, a desvalorizac~ao cambial damoeda argentina. Por outro lado, foi verificado que o distanciamento dos precos, entre2007 e 2009, coincide com as inumeras intervencoes governamentais no mercado dacarne bovina argentina neste perıodo, como: aumento das taxas de exportac~ao,restricoes ao peso para o abate de animais, proibic~ao de exportacoes, limitac~ao dascotas de exportac~ao pela cota Hilton por 180 dias. Porem, Apesar de outros estudosimportantes, como o de Melo (2010), tambem creditarem a reduc~ao dos precos da carnebovina argentina, entre 2007 e 2009, a esses eventos, n~ao se encontram informacoessuficientemente robustas que possam suportar essa afirmac~ao.
Pela figura 1, e possıvel verificar rastros de associac~ao e tendencias estocasticasconjuntas entre os precos a vista e futuros. Mesmo com indıcios de cointegrac~ao entreas series de precos, a realizac~ao de testes econometricos e fundamental para dar maiorprecis~ao a analise e conclus~ao a este respeito.
2.0
1.8
1.6
1.4
1.2
1.0
0.8
Fonte: Dados da pesquisa
2002 2003 2004 2005 2006 2007 2008 2009 2010
Log dos preços futuros do boi gordo brasileiro Log dos preços a vista do novilho adulto argentinoLog dos preços a vista do novilho precoce argentino
Figura 1.Precos futuros do boigordo e precos a vista dosnovilhos
220
ARLA26,2
Dow
nloa
ded
by F
GV
At 1
0:32
14
Mar
ch 2
016
(PT
)
Dando inicio ao processo de analise da combinac~ao entre as variaveis em estudo,a tabela 1 exibe a associac~ao linear entre as series de precos a vista e futuros.
Com base nos resultados da tabela 1, pode-se assegurar que os precos futurosdo boi gordo brasileiro e precos a vista do novilho precoce argentino s~ao fortee positivamente associados em 86,43%, com nıvel de significancia de 1%. Porem aassociac~ao positiva entre os precos futuros do boi gordo brasileiro e precos a vista donovilho adulto argentino e ainda mais forte, chegando a 87,67%, com significanciaestatıstica de 1%. Estes resultados apesar de n~ao serem conclusivos em termos decomovimentac~ao de precos, sinalizam uma possıvel relac~ao entre as variaveisestudadas e, por consequencia s~ao indicativos da combinac~ao entre os precos a longoprazo. A verificac~ao sobre a relac~ao entre as variaveis segue com os testes de detecc~aode raiz unitaria.
O teste da raiz unitaria Philips-Perron e de Dickey & Fuller Aumentando foramaplicados as series de precos a vista e futuros com objetivo de determinar a presenca oun~ao de raızes unitarias e como premissa para o teste de cointegrac~ao. Os resultados s~aoexpostos na tabela 2.
Com base nos resultados da tabela 2, os testes n~ao rejeitam a hipotese nula dapresenca de raiz unitaria nas series temporais de precos a vista e futuros em nıvel.Porem os testes, na primeira diferenca, rejeitaram a hipotese nula, ou seja, ha indıciosde que as series de precos a vista e futuros s~ao integradas de ordem um, I(1).A estatıstica de DW, com valores proximos a dois, indicam que as series de precos avista e futuros, na primeira diferenca, n~ao apresentam problemas de autocorrelac~ao.
O numero otimo de defasagens da estimativa dos testes de cointegrac~ao foi oprimeiro passo para estimac~ao do modelo com incorporac~ao informacional dos efeitosde longo prazo. A dimens~ao do modelo estimado e a parcimonia da regress~ao decointegrac~ao s~ao os elementos envolvidos nesta decis~ao.
Os criterios de informac~ao de Akaike (AIC), Schwarz (SBC) e Hanna-Quinn(HQC), que tem por caracterıstica penalizar o acrescimo de novas defasagens aosmodelos VAR, foram aplicados para a definic~ao do numero otimo de defasagens.A tabela 3 apresenta o numero otimo de defasagens das estimativas dos testes decointegrac~ao segundo os criterios de informac~ao.
Conforme os resultados da tabela 3, o numero otimo de defasagens do teste decointegrac~ao entre os precos a vista dos novilhos precoces e novilhos adultosargentinos e precos futuros do boi gordo e igual tres, pelo criterio SBC. Apesar doscriterios AIC e HQC. estabelecerem um numero ideal de defasagens igual a sete, devidoo princıpio da parcimonia, foram respeitadas a robustez e a respectiva definic~ao docriterio de informac~ao SBC Por tres defasagens, ou seja, modelo VAR (3).
Serie de PrecosBoi GordoBrasileiro
NovilhoPrecoce Argentino
Novilho AdultoArgentino
Boi Gordo Brasileiro 1,0000* 0,8643* 0,8767*Novilho Precoce Argentino 1,0000* 0,9941*Novilho Adulto Argentino 1,0000*
(*) Significante ao nıvel de 1%Fonte: Dados da pesquisa
Tabela I.Associac~ao linear entre
precos a vista dos novilhosargentinos e precos
futuros do boi gordo naBM&FBovespa
221
Future marketfor Brazilian
live cattle
Dow
nloa
ded
by F
GV
At 1
0:32
14
Mar
ch 2
016
(PT
)

Ser
iete
mp
oral
Fu
turo
sd
oB
oiG
ord
oB
rasi
leir
oA
Vis
tad
oN
ovil
ho
Pre
coce
Arg
enti
no
AV
ista
do
Nov
ilh
oA
du
lto
Arg
enti
no
Tes
tede
Phill
ips
&P
erro
n(P
P)
Tes
teP
PE
mn
ıvel
1ad
ifer
enca
Em
nıv
el1a
dif
eren
caE
mn
ıvel
1ad
ifer
enca
Est
atıs
tica
t1,
6830
7�
42,3
7027
1,13
498
�63
,476
171,
1366
�72
,889
02p
–v
alor
(t)
0,97
80n
s0,
0001
0*0,
9342
ns
0,00
010*
0,93
44n
s0,
0001
0*V
alor
escr
ıtic
osN
ıvel
1%�
2,56
613
Nıv
el5%
�1,
9409
8N
ıvel
10%
�1,
6165
9A
IC�
7,46
154
�7,
4625
3�
5,52
935
�5,
6063
4�
5,22
778
�5,
3343
6S
BC
�7,
4587
2�
7,45
971
�5,
5265
4�
5,60
353
�5,
2249
6�
5,33
154
HQ
C�
7,46
05�
7,46
149
�5,
5283
2�
5,60
531
�5,
2267
5�
5,33
332
DW
1,88
847
2,00
679
2,54
698
2,03
233
2,63
557
2,07
406
Tes
tede
Dic
key
&F
ulle
rA
um
enta
ndo
(AD
F)
Tes
teA
DF
Em
nıv
el1a
dif
eren
caE
mn
ıvel
1ad
ifer
enca
Em
nıv
el1a
dif
eren
caE
stat
ısti
cat
1,68
854
�28
,340
311,
0610
7�
28,5
4646
0,79
492
�32
,493
01p
–v
alor
(t)
0,97
83n
s0,
0000
*0,
9250
ns
0,00
00*
0,88
43n
s0,
0000
*V
alor
escr
ıtic
osN
ıvel
1%�
2,56
613
Nıv
el5%
�1,
9409
8N
ıvel
10%
�1,
6165
9A
IC�
7,46
787
�7,
4674
4�
5,63
234
�5,
6327
8�
5,35
592
�5,
3566
1S
BC
�7,
4594
2�
7,46
181
�5,
6182
4�
5,62
15�
5,34
464
�5,
3481
5H
QC
�7,
4647
7�
7,46
537
�5,
6271
6�
5,62
864
�5,
3517
8�
5,35
35D
W1,
9977
41,
9979
62,
0118
22,
0115
62,
0122
2,01
207
(*)
sig
nif
ican
teao
nıv
eld
e1%
,e
(ns )
n~ ao
apre
sen
tasi
gn
ific
anci
aes
tatı
stic
aF
onte
:D
ados
da
pes
qu
isa
Tabela II.Testes da raiz unitaria dasseries de precos a vista efuturos
222
ARLA26,2
Dow
nloa
ded
by F
GV
At 1
0:32
14
Mar
ch 2
016
(PT
)
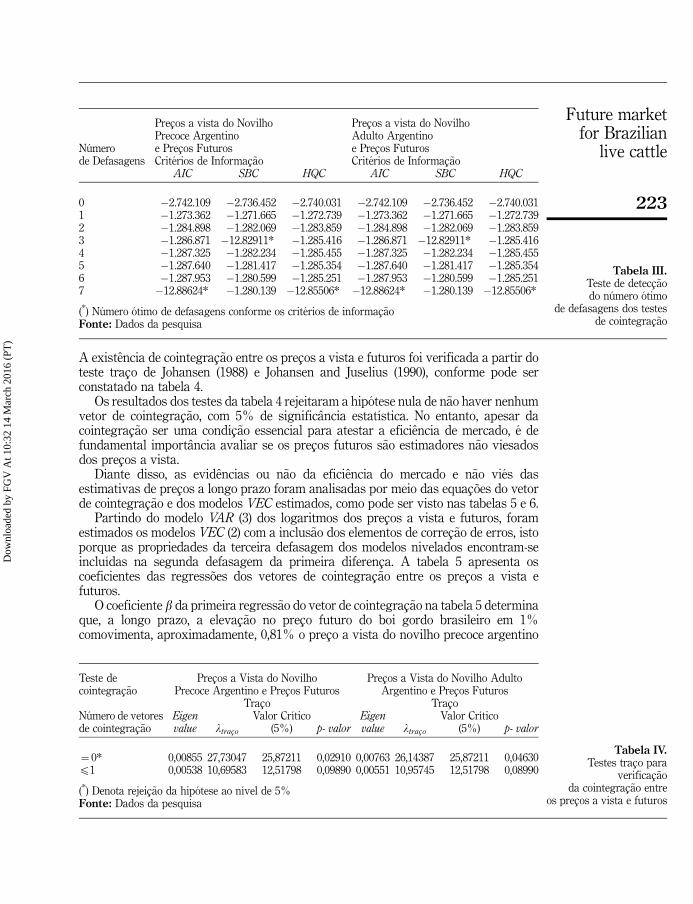
A existencia de cointegrac~ao entre os precos a vista e futuros foi verificada a partir doteste traco de Johansen (1988) e Johansen and Juselius (1990), conforme pode serconstatado na tabela 4.
Os resultados dos testes da tabela 4 rejeitaram a hipotese nula de n~ao haver nenhumvetor de cointegrac~ao, com 5% de significancia estatıstica. No entanto, apesar dacointegrac~ao ser uma condic~ao essencial para atestar a eficiencia de mercado, e defundamental importancia avaliar se os precos futuros s~ao estimadores n~ao viesadosdos precos a vista.
Diante disso, as evidencias ou n~ao da eficiencia do mercado e n~ao vies dasestimativas de precos a longo prazo foram analisadas por meio das equacoes do vetorde cointegrac~ao e dos modelos VEC estimados, como pode ser visto nas tabelas 5 e 6.
Partindo do modelo VAR (3) dos logaritmos dos precos a vista e futuros, foramestimados os modelos VEC (2) com a inclus~ao dos elementos de correc~ao de erros, istoporque as propriedades da terceira defasagem dos modelos nivelados encontram-seincluıdas na segunda defasagem da primeira diferenca. A tabela 5 apresenta oscoeficientes das regressoes dos vetores de cointegrac~ao entre os precos a vista efuturos.
O coeficiente b da primeira regress~ao do vetor de cointegrac~ao na tabela 5 determinaque, a longo prazo, a elevac~ao no preco futuro do boi gordo brasileiro em 1%comovimenta, aproximadamente, 0,81% o preco a vista do novilho precoce argentino
Precos a vista do NovilhoPrecoce Argentinoe Precos Futuros
Precos a vista do NovilhoAdulto Argentinoe Precos FuturosNumero
de Defasagens Criterios de Informac~ao Criterios de Informac~aoAIC SBC HQC AIC SBC HQC
0 �2.742.109 �2.736.452 �2.740.031 �2.742.109 �2.736.452 �2.740.0311 �1.273.362 �1.271.665 �1.272.739 �1.273.362 �1.271.665 �1.272.7392 �1.284.898 �1.282.069 �1.283.859 �1.284.898 �1.282.069 �1.283.8593 �1.286.871 �12.82911* �1.285.416 �1.286.871 �12.82911* �1.285.4164 �1.287.325 �1.282.234 �1.285.455 �1.287.325 �1.282.234 �1.285.4555 �1.287.640 �1.281.417 �1.285.354 �1.287.640 �1.281.417 �1.285.3546 �1.287.953 �1.280.599 �1.285.251 �1.287.953 �1.280.599 �1.285.2517 �12.88624* �1.280.139 �12.85506* �12.88624* �1.280.139 �12.85506*
(*) Numero otimo de defasagens conforme os criterios de informac~aoFonte: Dados da pesquisa
Tabela III.Teste de detecc~aodo numero otimo
de defasagens dos testesde cointegrac~ao
Teste decointegrac~ao
Precos a Vista do NovilhoPrecoce Argentino e Precos Futuros
Precos a Vista do Novilho AdultoArgentino e Precos Futuros
Traco TracoNumero de vetoresde cointegrac~ao
Eigenvalue ltraco
Valor Crıtico(5%) p- valor
Eigenvalue ltraco
Valor Crıtico(5%) p- valor
¼ 0* 0,00855 27,73047 25,87211 0,02910 0,00763 26,14387 25,87211 0,04630p1 0,00538 10,69583 12,51798 0,09890 0,00551 10,95745 12,51798 0,08990
(*) Denota rejeic~ao da hipotese ao nıvel de 5%Fonte: Dados da pesquisa
Tabela IV.Testes traco para
verificac~aoda cointegrac~ao entre
os precos a vista e futuros
223
Future marketfor Brazilian
live cattle
Dow
nloa
ded
by F
GV
At 1
0:32
14
Mar
ch 2
016
(PT
)
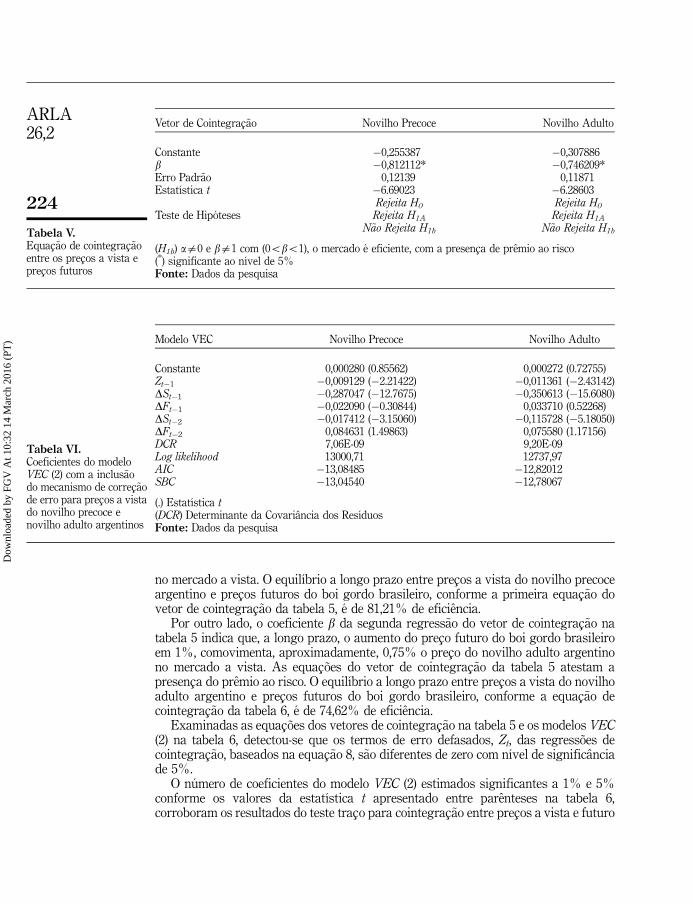
no mercado a vista. O equilıbrio a longo prazo entre precos a vista do novilho precoceargentino e precos futuros do boi gordo brasileiro, conforme a primeira equac~ao dovetor de cointegrac~ao da tabela 5, e de 81,21% de eficiencia.
Por outro lado, o coeficiente b da segunda regress~ao do vetor de cointegrac~ao natabela 5 indica que, a longo prazo, o aumento do preco futuro do boi gordo brasileiroem 1%, comovimenta, aproximadamente, 0,75% o preco do novilho adulto argentinono mercado a vista. As equacoes do vetor de cointegrac~ao da tabela 5 atestam apresenca do premio ao risco. O equilıbrio a longo prazo entre precos a vista do novilhoadulto argentino e precos futuros do boi gordo brasileiro, conforme a equac~ao decointegrac~ao da tabela 6, e de 74,62% de eficiencia.
Examinadas as equacoes dos vetores de cointegrac~ao na tabela 5 e os modelos VEC(2) na tabela 6, detectou-se que os termos de erro defasados, Zt, das regressoes decointegrac~ao, baseados na equac~ao 8, s~ao diferentes de zero com nıvel de significanciade 5%.
O numero de coeficientes do modelo VEC (2) estimados significantes a 1% e 5%conforme os valores da estatıstica t apresentado entre parenteses na tabela 6,corroboram os resultados do teste traco para cointegrac~ao entre precos a vista e futuro
Modelo VEC Novilho Precoce Novilho Adulto
Constante 0,000280 (0.85562) 0,000272 (0.72755)Zt�1 �0,009129 (�2.21422) �0,011361 (�2.43142)DSt�1 �0,287047 (�12.7675) �0,350613 (�15.6080)DFt�1 �0,022090 (�0.30844) 0,033710 (0.52268)DSt�2 �0,017412 (�3.15060) �0,115728 (�5.18050)DFt�2 0,084631 (1.49863) 0,075580 (1.17156)DCR 7,06E-09 9,20E-09Log likelihood 13000,71 12737,97AIC �13,08485 �12,82012SBC �13,04540 �12,78067
(.) Estatıstica t(DCR) Determinante da Covariancia dos ResıduosFonte: Dados da pesquisa
Tabela VI.Coeficientes do modeloVEC (2) com a inclus~aodo mecanismo de correc~aode erro para precos a vistado novilho precoce enovilho adulto argentinos
Vetor de Cointegrac~ao Novilho Precoce Novilho Adulto
Constante �0,255387 �0,307886b �0,812112* �0,746209*Erro Padr~ao 0,12139 0,11871Estatıstica t �6.69023 �6.28603
Rejeita H0 Rejeita H0
Teste de Hipoteses Rejeita H1A Rejeita H1A
N~ao Rejeita H1b N~ao Rejeita H1b
(H1b) aa0 e ba1 com (0obo1), o mercado e eficiente, com a presenca de premio ao risco(*) significante ao nıvel de 5%Fonte: Dados da pesquisa
Tabela V.Equac~ao de cointegrac~aoentre os precos a vista eprecos futuros
224
ARLA26,2
Dow
nloa
ded
by F
GV
At 1
0:32
14
Mar
ch 2
016
(PT
)
apresentados na tabela 4. Desse modo, as conclusoes sobre a hipotese do mercadoeficiente continuam validas.
5. ConclusoesO objetivo deste artigo foi verificar a eficiencia do mercado futuro do boi gordobrasileiro na BM&FBOVESPA, como preditor dos precos dos novilhos de corte nomercado a vista argentino na presenca de premio ao risco.
Inicialmente, constatou-se uma associac~ao linear forte e positiva acima de 85%entre os precos a vista e futuro. Em seguida, pelos testes de raiz unitaria, detectou-seque na primeira diferenca, as series de precos s~ao estacionarias, ou seja, integradas emordem um.
Os resultados do teste traco indicaram a presenca do vetor de cointegrac~ao entreos precos a vista dos novilhos argentinos e precos futuros do boi gordo brasileiro.A aplicac~ao do modelo de correc~ao de erros, VEC, permitiu testar a HME com apresenca do premio ao risco. Os resultados mostraram que o premio ao risco n~ao causarejeic~ao da hipotese de n~ao vies dos precos futuros.
Os resultados apontam para uma eficiencia de mercado a longo prazo entre osprecos a vista do novilho precoce argentino e precos futuros do boi gordo brasileiro deaproximadamente 81%. Enquanto a eficiencia de mercado a longo prazo entre osprecos a vista do novilho adulto argentino e precos futuros do boi gordo brasileiro, giraem torno de 75%. Esses resultados sugerem que os precos futuros do boi gordobrasileiro podem auxiliar de maneira expressiva a predic~ao dos precos a vista dosnovilhos argentinos.
Portanto, pode-se afirmar com base nos resultados dos testes de cointegrac~ao e den~ao vies dos precos, que o mercado futuro do boi gordo brasileiro e eficiente, e quea longo prazo os precos futuros do boi gordo s~ao estimadores n~ao viesados dos precos avista dos novilhos argentinos.
Os resultados obtidos neste estudo contrastam com os encontrados por Bressler andCovey (1991), McKenzie and Holt (2002) e Alves et al. (2008). Por outro lado, corroboramos resultados das investigacoes de Kellard et al. (1999), Melo et al. (2006), Abitante(2008) e Moraes et al. (2009).
Os resultados encontrados em diferentes testes da HME para mercados futurosagrıcolas s~ao creditados a diversos fatores, em especial: perıodo de analise,sazonalidade, intervencoes governamentais e estruturas institucionais. Nestecontexto, as diferencas entre os produtos, o mercado a vista e os padroes dosderivativos no mercado futuro referentes a este estudo contribuem para a investigac~aode diferentes perspectivas sobre a HME.
Porem, a maturidade do mercado futuro do boi gordo, somado ao crescimento daparticipac~ao de diferentes agentes da cadeia produtiva da carne bovina nele, e umindicativo de que os contratos futuros de boi gordo da BM&FBOVESPA tendem a sercada vez mais utilizados como instrumentos de protec~ao contra as oscilacoes de precosno mercado a vista, n~ao so por agentes que atuam no mercado da carne bovinabrasileira, como tambem de outros mercados, o que ja acontece em volume significativocom outras commodities, em outras bolsas, como, por exemplo, a soja e seus derivados,na Chicago Board of Trade (CBOT).
O grande numero de metodos que podem ser usados para testar a HME permite quediferentes investigacoes sobre a relac~ao entre mercados com caracterısticassemelhantes aos deste estudo sejam realizadas, em especial, no sentido de comparara eficiencia entre derivativos de diferentes bolsas para a mitigac~ao do risco de precos
225
Future marketfor Brazilian
live cattle
Dow
nloa
ded
by F
GV
At 1
0:32
14
Mar
ch 2
016
(PT
)
de commodities agrıcolas de paıses que tenham carencia ou indisponibilidade destesinstrumentos.
Notes
1. The scope of canonical correlations is to determine a linear combination for each group ofvariables (dependent or independent) which maximises the correlation between the twogroups (Rig~ao, 2009). Different canonical correlations, the multiple correlations, theassociation regression between the variables indicates the degree of association betweenthese variables. Therefore, it is not only associated with the dependent variables but alsowith the intercorrelations between the dependent variables (Henriques et al., 2005).
2. A finalidade da correlac~ao canonica e determinar uma combinac~ao linear para cada grupode variaveis (dependentes e independentes) que maximize a correlac~ao entre os dois grupos(Rig~ao, 2009). Diferente da correlac~ao canonica, a correlac~ao multipla, ou regress~ao deassociac~ao entre as variaveis, indica o grau de associac~ao entre as variaveis. Portanto, estarelacionada n~ao so as variaveis dependentes, mas tambem com as intercorrelacoes entrevariaveis dependentes (Henriques et al., 2005).
References
Abitante, K.G. (2008), “Cointegrac~ao entre os mercados spot e futuro: Evidencias dos mercadosde boi gordo e soja”, Revista de Economia e Sociologia Rural, Vol. 46 No. 1, pp. 75-96.
Acker, L.F. and Racine, M.D. (1999), “Stochastic trends and cointegration in the market forequities”, Journal of Economics and Business, Vol. 51 No. 2, pp. 133-143.
Alves, J.S., Duarte, G.S. and Lima, R.C. (2008), “Teste de eficiencia do mercado futuro do alcoolanidro no Brasil: Uma analise de cointegrac~ao”, Revista de Economia do Nordeste,Fortaleza, Vol. 39 No. 1, pp. 174-184.
Associac~ao Brasileira das Industrias Exportadoras de Carnes (ABIEC) (2011), “Estatısticas”,available at: www.abiec.com.br/41_exportacao_ano.asp (accessed 10 April 2011).
Beck, S.E. (1994), “Cointegration and market efficiency in commodity futures markets”, AppliedEconomics, Vol. 26 No. 3, pp. 249-257.
Bodie, Z., Kane, A. and Marcus, A.J. (2010), Investimentos, AMGH, Porto Alegre.
Bolsa de Valores, Mercadorias e Futuros (BM&FBOVESPA) (2012), “Contratos agropecuarios”,available at: www.bmfbovespa.com.br/pt-br/a-bmfbovespa/download/Contratos-Bolsa deValores, Mercadorias e Futuros – Agropecuarios.pdf (accessed 15 January 2012).
Bressler, D.A. and Covey, T. (1991), “Cointegration: some results on US cattle prices”, The Journalof Futures Markets, Vol. 11 No. 4, pp. 461-474.
Camargos, M.A. and Barbosa, F.V. (2003), “Teoria e evidencia informacional do mercado decapitais brasileiro”, Caderno de Pesquisas em Administrac~ao, Vol. 10 No. 1, pp. 1-15.
Centre of Advanced Studies in Applied Economic (CEPEA) (2011), “PIB do agronegocioBrasileiro”, available at: www.cepea.esalq.usp.br/pib/ (accessed 15 May 2011).
Chu, Q.C., Hsieh, W.G. and Tse, Y. (1999), “Price discovery on the S & P 500 index markets: ananalysis of spot index, index futures, and SPDRs”, International Review of FinancialAnalysis, Vol. 8 No. 1, pp. 21-34.
Comiso, M.G. (2007), Factibilidad de un mercado de futuros y opciones de ganado bovino parafaena en Argentina, Tese (Economia), Departamento de Economia, Universidad Nacionaldel Sur, Bahıa Blanca.
Danthine, J.P. (1978), “Information, futures prices and stabilizing speculation”, Journal ofEconomic Theory, Vol. 17 No. 1, pp. 79-98.
Dickey, D.A. and Fuller, W.A. (1981), “Likelihood ratio statistics for autoregressive time serieswith a unit root”, Econometrica, Vol. 49 No. 4, pp. 1057-1072.
226
ARLA26,2
Dow
nloa
ded
by F
GV
At 1
0:32
14
Mar
ch 2
016
(PT
)

Dopchiz, M.Y. (2008), La implementacion de un mercado de futuros em el sector ganaderoargentino, Tese (Economia), Facultad de Ciencias Economicas y Sociales, UniversidadNacional de Mar del Plata, Mar del Plata, Argantina.
Durbin, J. and Watson, G.S. (1951), “Testing for serial correlation in least-squares regression II”,Biometrika, Vol. 38 No. 1, pp. 159-178.
Enders, W. (2004), Applied Econometrics Time Series, Wiley, Hoboken, NJ.
Engle, R. and Granger, C. (1987), “Cointegration and error correction: representation, estimationand testing”, Econometrica, Vol. 55 No. 2, pp. 251-276.
Fama, E.F. (1970), “Efficient capital markets: a review of theory and empirical work”, The Journalof Finance, Vol. 25, pp. 383-417.
Fama, E.F. (1991), “Efficient capital markets II”, The Journal of Finance, Vol. 46 No. 5,pp. 1575-1617.
Fama, E.F. and French, K.R. (1987), “Commodity futures prices: some evidence on forecast power,premiums and the theory of storage”, Journal of Business, Vol. 60, pp. 55-73.
Henriques, A., Neves, C. and Pesquita, I. (2005), “Estudos correlacionais e estudos causal-comparativos: Metodologia da Investigac~ao I”, available at: www.educ.fc.ul.pt/docentes/ichagas/mi1/t1textoestcorrelacionais.pdf (accessed 10 April 2012).
Instituto de Promocion de la Carne Vacuna Argentina (IPVCA) (2012), “Estadısticas”, availableat: www.ipcva.com.ar/estadisticas/ (accessed 23 January 2012).
Johansen, S. (1988), “Statistical analysis of cointegration vector”, Journal of Econometric Dynamicand Control, Vol. 12 No. 2, pp. 231-254.
Johansen, S. and Juselius, K. (1990), “Maximum likelihood estimation and inference oncointegration: with applications to the demand for Money”, Oxford Bulletin of Economicsand Statistics, Vol. 52 No. 2, pp. 169-210.
Jumah, K. and Martin, W.C. (1999), “Temporal relationship among prices on commoditiesfutures markets”, American Journal of Agricultural Economics, Vol. 81 No. 4, pp. 987-989.
Kellard, N., Newobold, P., Rayner, T. and Ennew, C. (1999), “The relative efficiency of commodityfutures markets”, The Journal of Futures Markets, Vol. 19 No. 4, pp. 413-432.
Kenourgios, D.F. (2005), “Testing efficiency and the unbiasedness hypothesis of the emergingGreek futures market”, European Review of Economics and Finance, Vol. 4 No. 1,pp. 3-20.
Lai, K.S. and Lai, M. (1991), “A cointegration test for market efficiency”, The Journal of FuturesMarkets, Vol. 11 No. 5, pp. 567-575.
Leuthold., R.M. (1979), “An analysis of the futures – cash prices basis for live beef cattle”, NorthCentral Journal of Agricultural Economics, Vol. 1 No. 1, pp. 47-52.
Lien, D. and Luo, X. (1993), “Estimating multiperiod hedge ratios in cointegrated markets”, TheJournal of Futures Markets, Vol. 13 No. 8, pp. 909-920.
Mckenzie, A.M. and Holt, M.T. (2002), “Market efficiency in agricultural futures markets”,Applied Economics, Vol. 34 No. 12, pp. 1519-1532.
Mackinnon, J.G. (1996), “Numerical distribution functions for unit root and cointegration tests”,Journal of Applied Econometrics, Vol. 11 No. 6, pp. 601-618.
Melo, A.S., Lima, R.C. and Moraes, A.S. (2006), “Analise da eficiencia dos mercados futuros decommodities agrıcolas brasileiras utilizando cointegrac~ao”, Artigo apresentado no XLVICongresso da Sociedade Brasileira de Economia e Sociologia Rural, 23-27 Julho, Fortaleza.
Melo, G.B. (2010), Integrac~ao entre os mercados de boi para abate na Argentina e no Brasil,Dissertac~ao (Economia Aplicada), Escola Superior de Agricultura Luiz de Queiroz,Piracicaba, Brasil.
227
Future marketfor Brazilian
live cattle
Dow
nloa
ded
by F
GV
At 1
0:32
14
Mar
ch 2
016
(PT
)
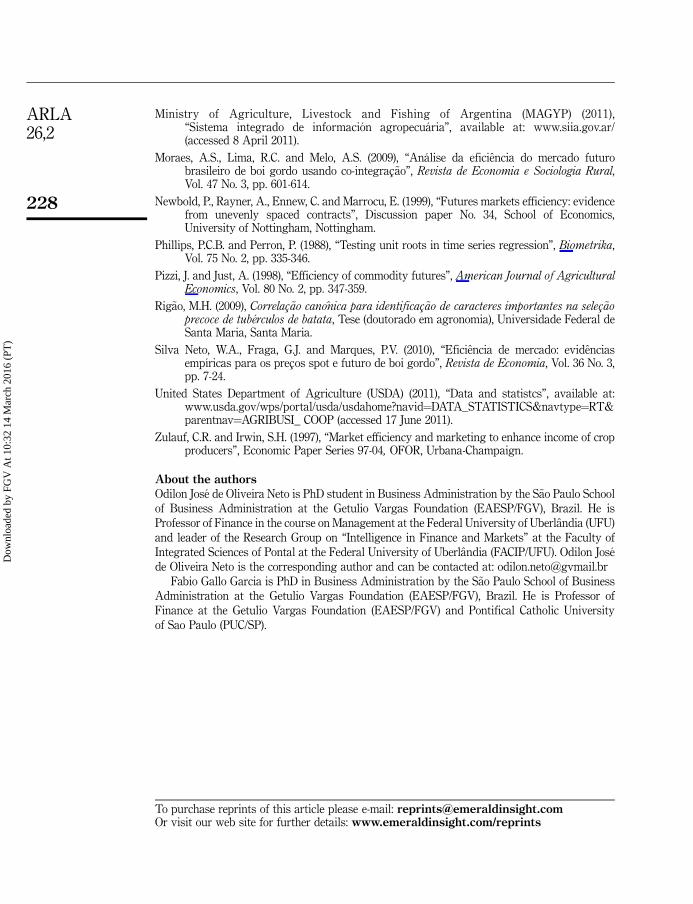
Ministry of Agriculture, Livestock and Fishing of Argentina (MAGYP) (2011),“Sistema integrado de informacion agropecuaria”, available at: www.siia.gov.ar/(accessed 8 April 2011).
Moraes, A.S., Lima, R.C. and Melo, A.S. (2009), “Analise da eficiencia do mercado futurobrasileiro de boi gordo usando co-integrac~ao”, Revista de Economia e Sociologia Rural,Vol. 47 No. 3, pp. 601-614.
Newbold, P., Rayner, A., Ennew, C. and Marrocu, E. (1999), “Futures markets efficiency: evidencefrom unevenly spaced contracts”, Discussion paper No. 34, School of Economics,University of Nottingham, Nottingham.
Phillips, P.C.B. and Perron, P. (1988), “Testing unit roots in time series regression”, Biometrika,Vol. 75 No. 2, pp. 335-346.
Pizzi, J. and Just, A. (1998), “Efficiency of commodity futures”, American Journal of AgriculturalEconomics, Vol. 80 No. 2, pp. 347-359.
Rig~ao, M.H. (2009), Correlac~ao canonica para identificac~ao de caracteres importantes na selec~aoprecoce de tuberculos de batata, Tese (doutorado em agronomia), Universidade Federal deSanta Maria, Santa Maria.
Silva Neto, W.A., Fraga, G.J. and Marques, P.V. (2010), “Eficiencia de mercado: evidenciasempıricas para os precos spot e futuro de boi gordo”, Revista de Economia, Vol. 36 No. 3,pp. 7-24.
United States Department of Agriculture (USDA) (2011), “Data and statistcs”, available at:www.usda.gov/wps/portal/usda/usdahome?navid¼DATA_STATISTICS&navtype¼RT&parentnav¼AGRIBUSI_ COOP (accessed 17 June 2011).
Zulauf, C.R. and Irwin, S.H. (1997), “Market efficiency and marketing to enhance income of cropproducers”, Economic Paper Series 97-04, OFOR, Urbana-Champaign.
About the authors
Odilon Jose de Oliveira Neto is PhD student in Business Administration by the S~ao Paulo Schoolof Business Administration at the Getulio Vargas Foundation (EAESP/FGV), Brazil. He isProfessor of Finance in the course on Management at the Federal University of Uberlandia (UFU)and leader of the Research Group on “Intelligence in Finance and Markets” at the Faculty ofIntegrated Sciences of Pontal at the Federal University of Uberlandia (FACIP/UFU). Odilon Josede Oliveira Neto is the corresponding author and can be contacted at: [email protected]
Fabio Gallo Garcia is PhD in Business Administration by the S~ao Paulo School of BusinessAdministration at the Getulio Vargas Foundation (EAESP/FGV), Brazil. He is Professor ofFinance at the Getulio Vargas Foundation (EAESP/FGV) and Pontifical Catholic Universityof Sao Paulo (PUC/SP).
To purchase reprints of this article please e-mail: [email protected] visit our web site for further details: www.emeraldinsight.com/reprints
228
ARLA26,2
Dow
nloa
ded
by F
GV
At 1
0:32
14
Mar
ch 2
016
(PT
)