aca 2013 technical report
DESCRIPTION
ÂTRANSCRIPT


ii
Table of Contents Page
List of Terms and Definitions .......................................................................................................... vi Units of Measurement .................................................................................................................... vi Acronyms ........................................................................................................................................ vi Executive Summary ........................................................................................................................ vii
1.0 INTRODUCTION ................................................................................................................. 1
1.1 ACA MISSION AND VISION .............................................................................................................. 1 1.2 ACA AIR MONITORING NETWORK .................................................................................................... 1
2.0 SUMMARY OF AIR MONITORING DATA ............................................................................. 6
2.1 SUMMARY OF EXCEEDANCES ABOVE THE AAAQO’S ............................................................................. 6 2.2 WIND DATA SUMMARY ................................................................................................................... 7 2.3 CONTINUOUS AIR QUALITY DATA ...................................................................................................... 9
2.3.1 Sulphur Dioxide (SO2) .................................................................................................... 9 2.3.2 Hydrogen Sulphide (H2S) ............................................................................................. 16 2.3.3 Nitrogen Dioxide (NO2) ............................................................................................... 22 2.3.4 Ozone (O3) ................................................................................................................... 28 2.3.5 Carbon Monoxide (CO) ................................................................................................ 33 2.3.6 Hydrocarbons (THC, CH4, and NMHC) ......................................................................... 38 2.3.7 Particulate Matter (PM2.5 and PM10) ........................................................................... 45
2.4 AIR QUALITY HEALTH INDEX ........................................................................................................... 51 2.5 AIR QUALITY FOR CANADIAN CITIES ................................................................................................. 53 2.6 PASSIVE SAMPLE SUMMARY ........................................................................................................... 57 2.7 INTERMITTENT PARTICULATE SAMPLE SUMMARY ............................................................................... 60
List of Tables Page
Table 1. ACA ambient air continuous monitoring stations and the measurement parameters .............................................................................. 3
Table 2. Number of exceedance events for 2013 ...................................................................... 6 Table 3. Summary statistics for 1‐hour average SO2 for 2013 ................................................. 10 Table 4. Number of exceedance events for SO2 for 2013 ........................................................ 10 Table 5. Summary statistics for 1‐hour average H2S for 2013 ................................................. 17 Table 6. Number of exceedance events for H2S for 2013 ........................................................ 17 Table 7. Summary statistics for 1‐hour average NO2 for 2013 ................................................ 23 Table 8. Number of exceedance events for NO2 for 2013 ....................................................... 23
iii
Table 9. Summary statistics for 1‐hour average O3 for 2013 ................................................... 29 Table 10. Number of exceedance events for O3 for 2013 .......................................................... 29 Table 11. Summary statistics for 1‐hour average CO for 2013 .................................................. 34 Table 12. Number of exceedance events for CO for 2013 ......................................................... 34 Table 13. Summary statistics for 1‐hour average hydrocarbons for 2013 ................................ 39 Table 14. Summary statistics for 1‐hour average
concentration for particulate matter for 2013 .......................................................... 46 Table 15. Number of exceedance events for PM2.5 for 2013 ..................................................... 46 Table 16. Annual average concentrations for passive SO2, NO2, and O3 for 2013 ..................... 58 Table 17. Summary statistics for 24‐hour average
intermittent particulate samples for 2013 ................................................................. 60 Table 18. Number of exceedance events for intermittent PM2.5 and TSP samples for 2013 ..... 61
List of Figures Page
Figure 1. Alberta Capital Airshed management zone ................................................................. 2 Figure 2. Locations of the ACA continuous monitoring stations ................................................. 4 Figure 3. Locations of the ACA passive monitoring stations ....................................................... 5 Figure 4. Wind roses for 1‐hour average wind data for 2013 ..................................................... 8 Figure 5. Pollutant rose for 1‐hour average SO2 data at the Sherwood Park station ............... 11 Figure 6. Pollutant rose for 1‐hour average SO2 data at the Gold Bar station .......................... 11 Figure 7. Pollutant rose for 1‐hour average SO2 data at the Beverly station ............................ 12 Figure 8. Pollutant rose for 1‐hour average SO2 data at the Elmjay station ............................. 12 Figure 9. Pollutant rose for 1‐hour average SO2 data at the Woodcroft station ...................... 13 Figure 10. Pollutant rose for 1‐hour average SO2 data at the Edmonton East station ............... 13 Figure 11. Pollutant rose for 1‐hour average SO2 data at the Edmonton South station ............. 14 Figure 12. Annual average concentrations for SO2 for the Province of Alberta ......................... 15 Figure 13. Pollutant rose for 1‐hour average H2S data at the Sherwood Park station ............... 18 Figure 14. Pollutant rose for 1‐hour average H2S data at the Gold Bar station .......................... 18 Figure 15. Pollutant rose for 1‐hour average H2S data at the Beverly station ............................ 19 Figure 16. Pollutant rose for 1‐hour average H2S data at the Elmjay station ............................. 19 Figure 17. Pollutant rose for 1‐hour average H2S data at the Edmonton East station ............... 20 Figure 18. Annual average concentrations for H2S for the Province of Alberta ......................... 21 Figure 19. Pollutant rose for 1‐hour average NO2 data at the Sherwood Park station .............. 24 Figure 20. Pollutant rose for 1‐hour average NO2 data at the Gold Bar station ......................... 24 Figure 21. Pollutant rose for 1‐hour average NO2 data at the Woodcroft station ..................... 25 Figure 22. Pollutant rose for 1‐hour average NO2 data at the Edmonton Centre station
(analyzed using wind data from the Edmonton East station) .................................... 25

iv
Figure 23. Pollutant rose for 1‐hour average NO2 data at the Edmonton East station .............. 26 Figure 24. Pollutant rose for 1‐hour average NO2 data at the Edmonton South station ............ 26 Figure 25. Annual average concentrations for NO2 for the Province of Alberta ......................... 27 Figure 26. Pollutant rose for 1‐hour average O3 data at the Woodcroft station ........................ 30 Figure 27. Pollutant rose for 1‐hour average O3 data at the Edmonton Centre station
(analyzed using wind data from the Edmonton East station) .................................... 30 Figure 28. Pollutant rose for 1‐hour average O3 data at the Edmonton East station ................. 31 Figure 29. Pollutant rose for 1‐hour average O3 data at the Edmonton South station .............. 31 Figure 30. Annual average concentrations for O3 for the Province of Alberta ........................... 32 Figure 31. Pollutant rose for 1‐hour average CO data at the Edmonton Centre station
(analyzed using wind data from the Edmonton East station) .................................... 35 Figure 32. Pollutant rose for 1‐hour average CO data at the Edmonton East station ................ 35 Figure 33. Pollutant rose for 1‐hour average CO data at the Edmonton South station ............. 36 Figure 34. Annual average concentrations for CO for the Province of Alberta .......................... 37 Figure 35. Pollutant rose for 1‐hour average THC data at the Sherwood Park station .............. 39 Figure 36. Pollutant rose for 1‐hour average THC data at the Beverly station ........................... 40 Figure 37. Pollutant rose for 1‐hour average THC data at the Edmonton Centre station
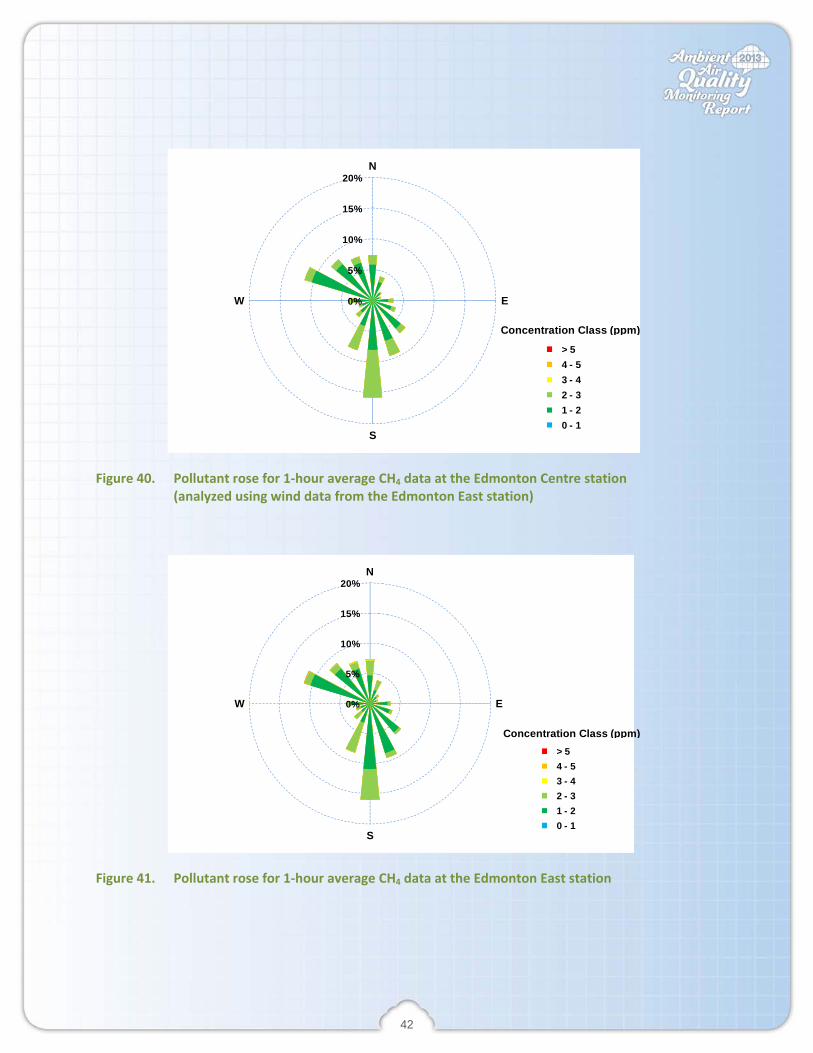
(analyzed using wind data from the Edmonton East station) .................................... 40 Figure 38. Pollutant rose for 1‐hour average THC data at the Edmonton East station .............. 41 Figure 39. Pollutant rose for 1‐hour average THC data at the Edmonton South station ............ 41 Figure 40. Pollutant rose for 1‐hour average CH4 data at the Edmonton Centre station
(analyzed using wind data from the Edmonton East station) .................................... 42 Figure 41. Pollutant rose for 1‐hour average CH4 data at the Edmonton East station ............... 42 Figure 42. Pollutant rose for 1‐hour average NMHC data at the Edmonton Centre station
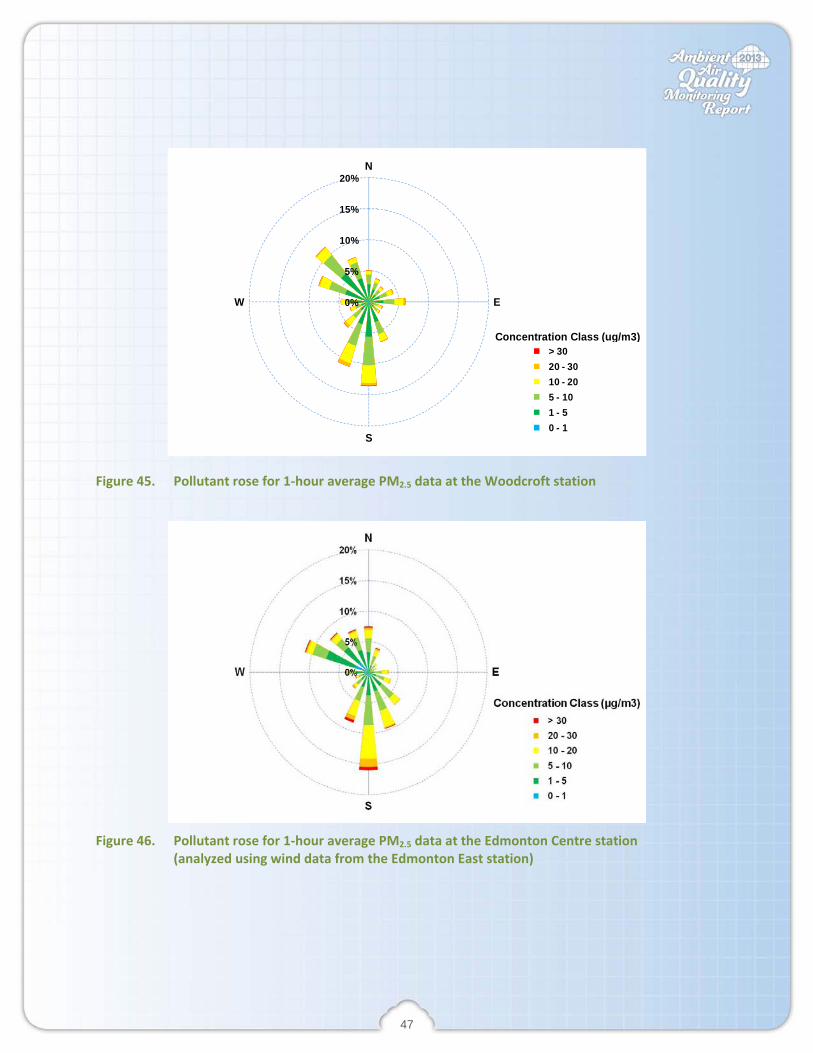
(analyzed using wind data from the Edmonton East station) .................................... 43 Figure 43. Pollutant rose for 1‐hour average NMHC data at the Edmonton East station .......... 43 Figure 44. Annual average concentrations for THC for the Province of Alberta ......................... 44 Figure 45. Pollutant rose for 1‐hour average PM2.5 data at the Woodcroft station ................... 47 Figure 46. Pollutant rose for 1‐hour average PM2.5 data at the Edmonton Centre station
(analyzed using wind data from the Edmonton East station) .................................... 47 Figure 47. Pollutant rose for 1‐hour average PM2.5 data at the Edmonton East station ............ 48 Figure 48. Pollutant rose for 1‐hour average PM2.5 data at the Edmonton South station ......... 48 Figure 49. Pollutant rose for 1‐hour average PM10 data at the Edmonton South station .......... 49 Figure 50. Annual average concentrations for PM2.5 for the Province of Alberta ...................... 50 Figure 51. Risk classification and health messages for Air Quality Health Index
(Environment Canada) ................................................................................................ 51 Figure 52. Summary of AQHI ratings for Alberta municipalities for 2013 .................................. 52 Figure 53. Annual average SO2 concentration for the 20 most populated Canadian cities ........ 54 Figure 54. Annual average NO2 concentration for the 20 most populated Canadian cities ....... 54
v
Figure 55. Annual average O3 concentration for the 20 most populated Canadian cities .......... 55 Figure 56. Annual average CO concentration for the 20 most populated Canadian cities ......... 55 Figure 57. Annual average PM2.5 concentration for the 20 most populated Canadian cities ..... 56 Figure 58. Annual average PM10 concentration for the 20 most populated Canadian cities ..... 56 Figure 59. 30‐Day passive SO2 sampling results for 2013 ........................................................... 58 Figure 60. 30‐Day passive NO2 sampling results for 2013 ........................................................... 59 Figure 61. 30‐Day passive O3 sampling results for 2013 ............................................................. 59 Figure 62. 24‐Hour average PM2.5 concentrations for 2013 ....................................................... 62 Figure 63. 24‐Hour average TSP and PM10 concentrations at the Woodcroft Station ................ 62
List of Appendices Appendix I Summary for Continuous Monitoring Data (AMD Summary Tables) Appendix II Summary for Passive Monitoring Data Appendix III Summary for Intermittent Particulate Monitoring Data
vi
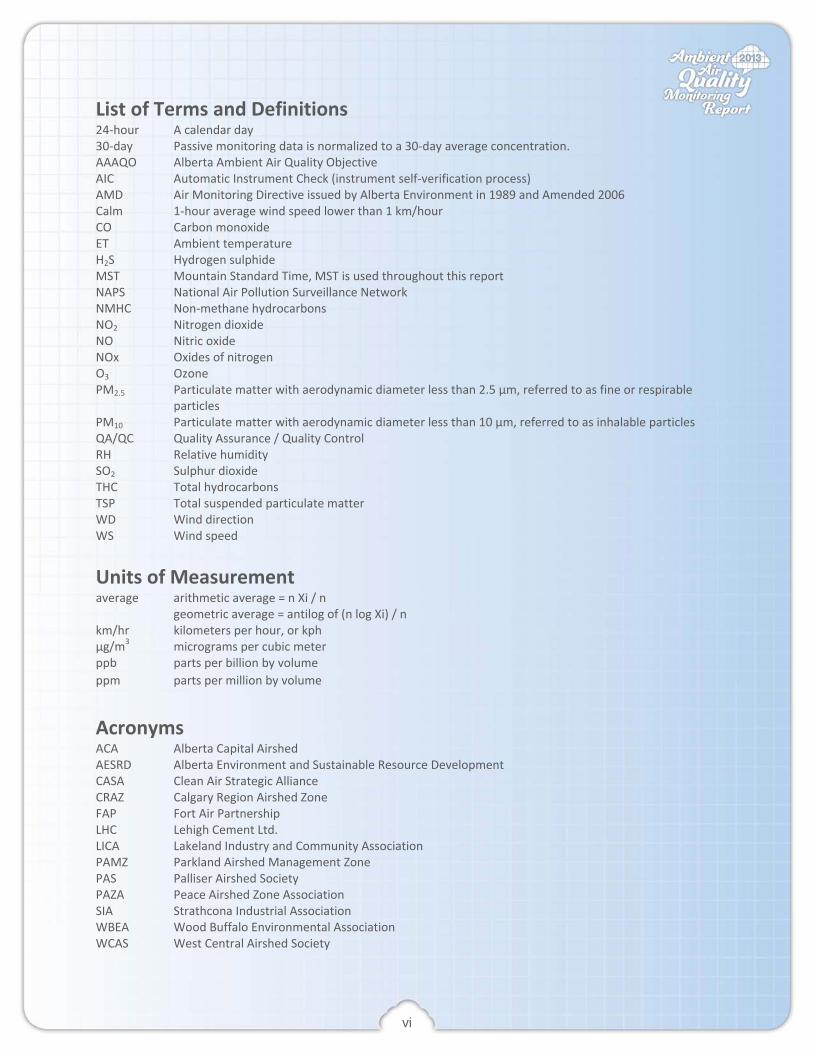
List of Terms and Definitions 24‐hour A calendar day 30‐day Passive monitoring data is normalized to a 30‐day average concentration. AAAQO Alberta Ambient Air Quality Objective AIC Automatic Instrument Check (instrument self‐verification process) AMD Air Monitoring Directive issued by Alberta Environment in 1989 and Amended 2006 Calm 1‐hour average wind speed lower than 1 km/hour CO Carbon monoxide ET Ambient temperature H2S Hydrogen sulphide MST Mountain Standard Time, MST is used throughout this report NAPS National Air Pollution Surveillance Network NMHC Non‐methane hydrocarbons NO2 Nitrogen dioxide NO Nitric oxide NOx Oxides of nitrogen O3 Ozone PM2.5 Particulate matter with aerodynamic diameter less than 2.5 μm, referred to as fine or respirable
particles PM10 Particulate matter with aerodynamic diameter less than 10 μm, referred to as inhalable particles QA/QC Quality Assurance / Quality Control RH Relative humidity SO2 Sulphur dioxide THC Total hydrocarbons TSP Total suspended particulate matter WD Wind direction WS Wind speed Units of Measurement average arithmetic average = n Xi / n geometric average = antilog of (n log Xi) / n km/hr kilometers per hour, or kph μg/m3 micrograms per cubic meter ppb parts per billion by volume ppm parts per million by volume
Acronyms ACA Alberta Capital Airshed AESRD Alberta Environment and Sustainable Resource Development CASA Clean Air Strategic Alliance CRAZ Calgary Region Airshed Zone FAP Fort Air Partnership LHC Lehigh Cement Ltd. LICA Lakeland Industry and Community Association PAMZ Parkland Airshed Management Zone PAS Palliser Airshed Society PAZA Peace Airshed Zone Association SIA Strathcona Industrial Association WBEA Wood Buffalo Environmental Association WCAS West Central Airshed Society

vii
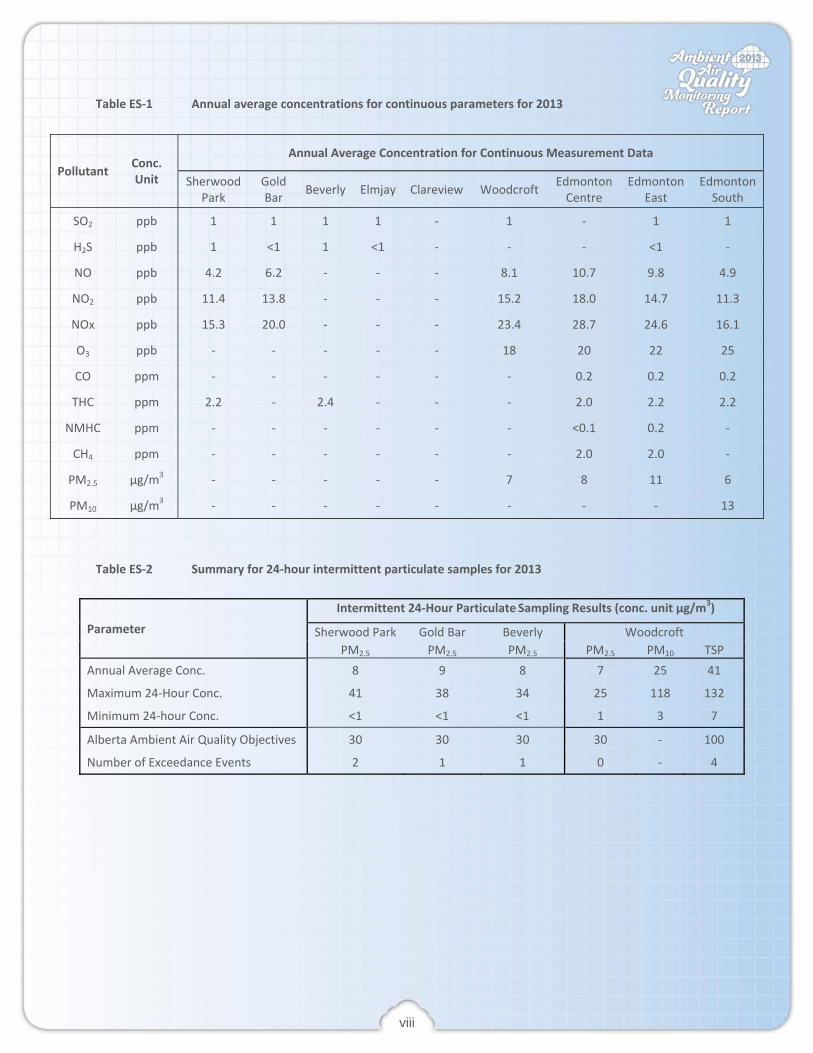
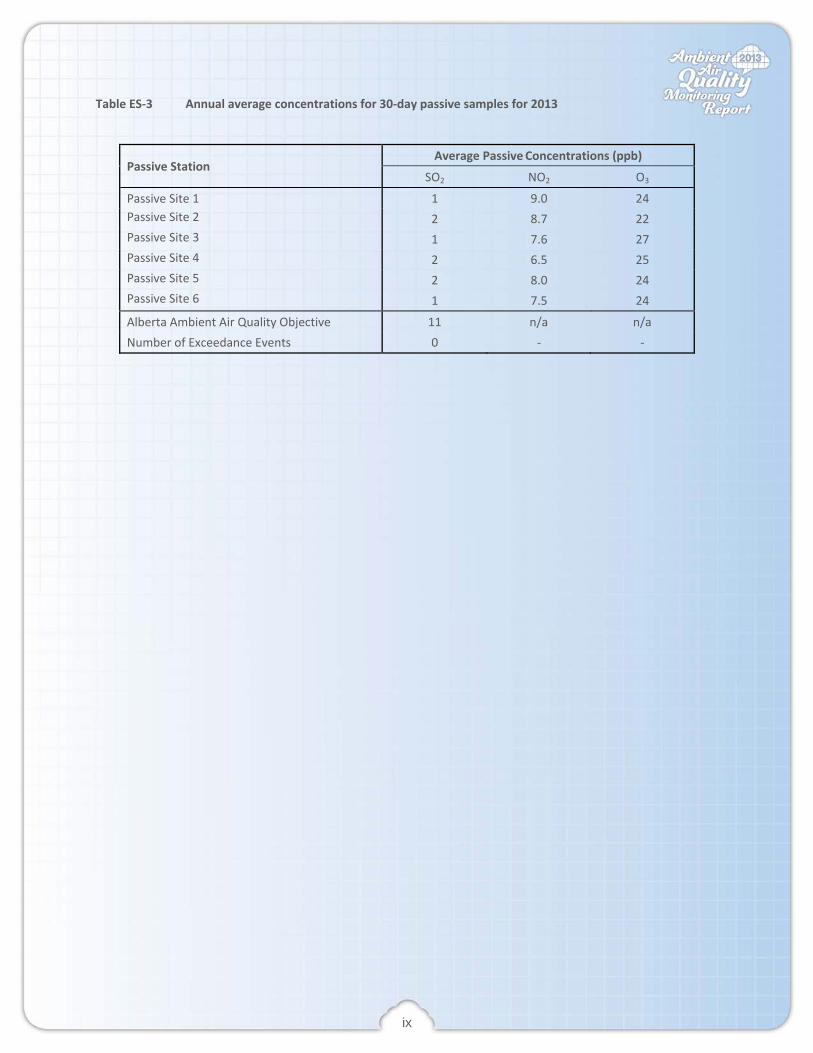
EXECUTIVE SUMMARY The ACA management zone contains a region parallel to the Edmonton Census Metropolitan Area as shown in Figure 1 of the main report. The air monitoring network consists of a continuous monitoring network, an intermittent particulate monitoring network, and a passive monitoring network. Figure 2 of the main report presents the locations of the continuous air monitoring stations. The ACA management zone contains nine continuous monitoring stations. The continuous network measures sulphur dioxide (SO2), hydrogen sulphide (H2S), nitrogen oxides (NO, NO2, NOx), carbon monoxide (CO), ozone (O3), total hydrocarbons (THC), methane (CH4), non‐methane hydrocarbon (NMHC), particulate matter (PM2.5 and PM10), ambient temperature (ET), relative humidity (RH), wind speed (WS) and wind direction (WD). In 2013, the annual instrument uptime for the continuous monitoring parameters exceeded 90% requirement of the Alberta Air Monitoring Directive (AMD), with the exception of 89.5% for PM2.5 at the Edmonton South Station. Table ES‐1 summarizes the annual average concentrations for the year of 2013. There were seven (7) exceedance events for H2S, as well as twenty‐five (25) exceedance events for PM2.5. The Sherwood Park, Gold Bar, Beverly, and Woodcroft stations also measure 24‐hour intermittent samples for particulate matter every six days following the sampling schedule of the National Ambient Pollution Surveillance Network (NAPS, Environment Canada). The intermittent monitoring program measures 24‐hour average concentrations for PM2.5, PM10, and TSP using dedicated air samplers. Table ES‐2 summarizes the monitoring results for 2013. There were four (4) exceedance events for 24‐hour average PM2.5 in 2013. The Woodcroft station also recorded four (4) exceedance events for 24‐hour average TSP, attributed to construction activities near the station. The ACA passive network includes six monitoring sites as shown in Figure 3 of the main report. Each site monitors 30‐day average concentration for SO2, NO2, and O3. Table ES‐3 summarizes the annual average concentrations results for 2013. There were no exceedance events in 2013.
viii
Table ES‐1 Annual average concentrations for continuous parameters for 2013
Table ES‐2 Summary for 24‐hour intermittent particulate samples for 2013
Pollutant Conc. Unit
Annual Average Concentration for Continuous Measurement Data
Sherwood Park
Gold Bar Beverly Elmjay Clareview Woodcroft Edmonton
Centre Edmonton
East Edmonton South
SO2 ppb 1 1 1 1 ‐ 1 ‐ 1 1
H2S ppb 1 <1 1 <1 ‐ ‐ ‐ <1 ‐
NO ppb 4.2 6.2 ‐ ‐ ‐ 8.1 10.7 9.8 4.9
NO2 ppb 11.4 13.8 ‐ ‐ ‐ 15.2 18.0 14.7 11.3
NOx ppb 15.3 20.0 ‐ ‐ ‐ 23.4 28.7 24.6 16.1
O3 ppb ‐ ‐ ‐ ‐ ‐ 18 20 22 25
CO ppm ‐ ‐ ‐ ‐ ‐ ‐ 0.2 0.2 0.2
THC ppm 2.2 ‐ 2.4 ‐ ‐ ‐ 2.0 2.2 2.2
NMHC ppm ‐ ‐ ‐ ‐ ‐ ‐ <0.1 0.2 ‐
CH4 ppm ‐ ‐ ‐ ‐ ‐ ‐ 2.0 2.0 ‐
PM2.5 µg/m3 ‐ ‐ ‐ ‐ ‐ 7 8 11 6
PM10 µg/m3 ‐ ‐ ‐ ‐ ‐ ‐ ‐ ‐ 13
Parameter
Intermittent 24‐Hour Particulate Sampling Results (conc. unit µg/m3)
Sherwood Park Gold Bar Beverly Woodcroft PM2.5 PM2.5 PM2.5 PM2.5 PM10 TSP
Annual Average Conc. 8 9 8 7 25 41
Maximum 24‐Hour Conc. 41 38 34 25 118 132
Minimum 24‐hour Conc. <1 <1 <1 1 3 7
Alberta Ambient Air Quality Objectives 30 30 30 30 ‐ 100
Number of Exceedance Events 2 1 1 0 ‐ 4
ix
Table ES‐3 Annual average concentrations for 30‐day passive samples for 2013
Passive Station Average Passive Concentrations (ppb)
SO2 NO2 O3
Passive Site 1 1 9.0 24 Passive Site 2 2 8.7 22 Passive Site 3 1 7.6 27 Passive Site 4 2 6.5 25 Passive Site 5 2 8.0 24 Passive Site 6 1 7.5 24
Alberta Ambient Air Quality Objective 11 n/a n/a Number of Exceedance Events 0 ‐ ‐
1
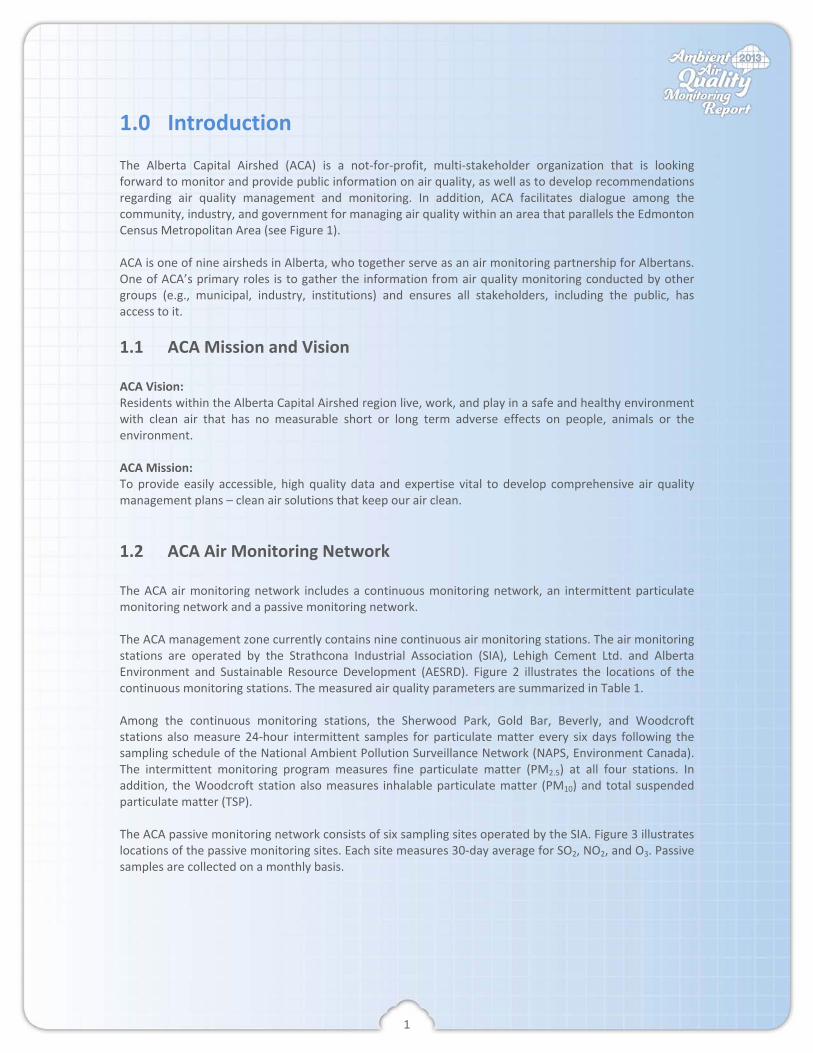
1.0 Introduction The Alberta Capital Airshed (ACA) is a not‐for‐profit, multi‐stakeholder organization that is looking forward to monitor and provide public information on air quality, as well as to develop recommendations regarding air quality management and monitoring. In addition, ACA facilitates dialogue among the community, industry, and government for managing air quality within an area that parallels the Edmonton Census Metropolitan Area (see Figure 1). ACA is one of nine airsheds in Alberta, who together serve as an air monitoring partnership for Albertans. One of ACA’s primary roles is to gather the information from air quality monitoring conducted by other groups (e.g., municipal, industry, institutions) and ensures all stakeholders, including the public, has access to it.
1.1 ACA Mission and Vision ACA Vision: Residents within the Alberta Capital Airshed region live, work, and play in a safe and healthy environment with clean air that has no measurable short or long term adverse effects on people, animals or the environment. ACA Mission: To provide easily accessible, high quality data and expertise vital to develop comprehensive air quality management plans – clean air solutions that keep our air clean.
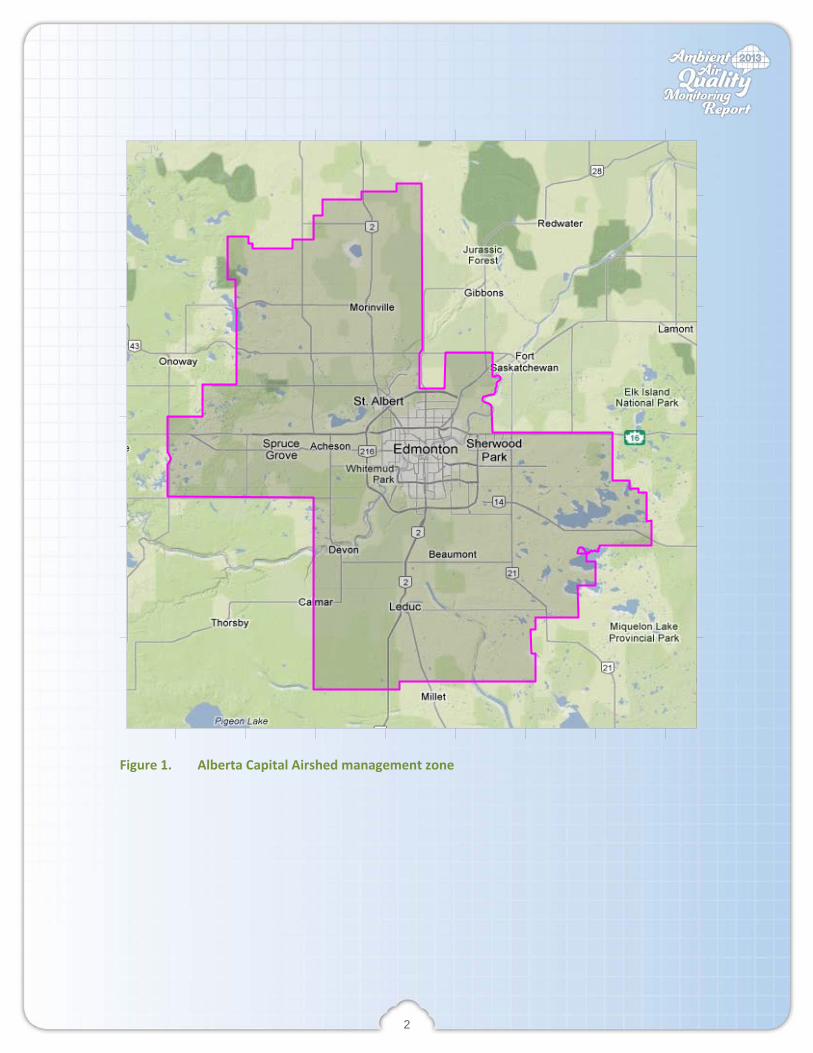
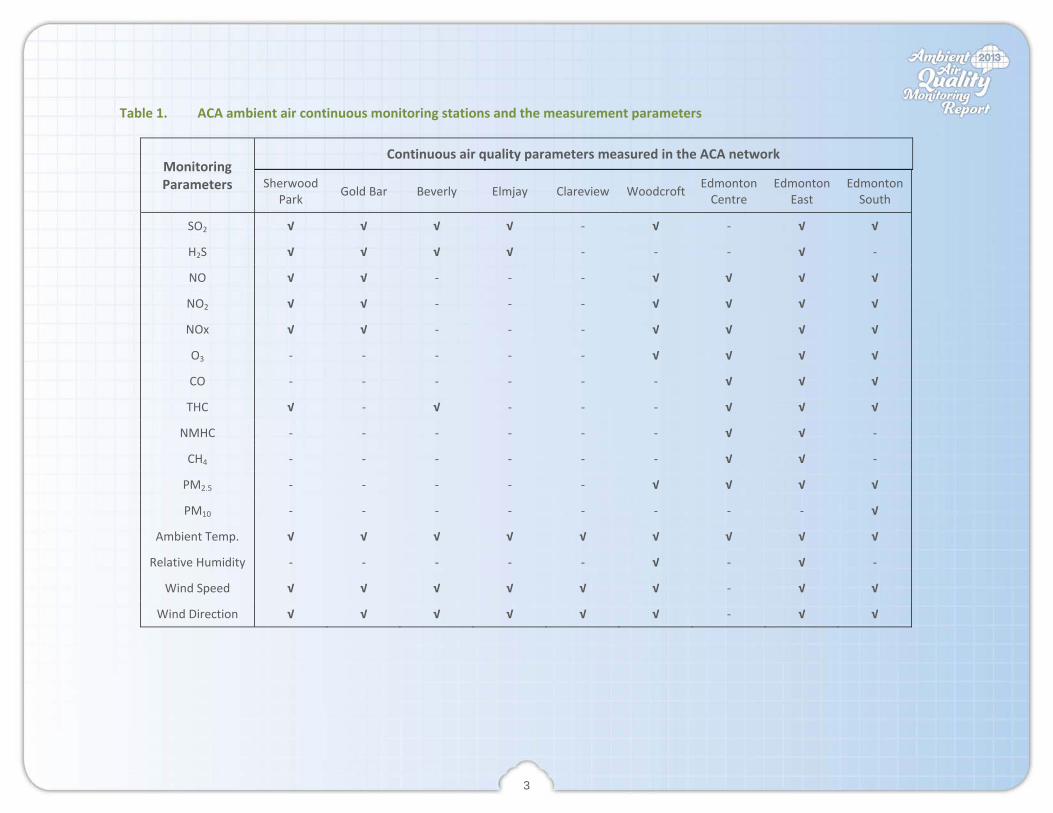
1.2 ACA Air Monitoring Network The ACA air monitoring network includes a continuous monitoring network, an intermittent particulate monitoring network and a passive monitoring network. The ACA management zone currently contains nine continuous air monitoring stations. The air monitoring stations are operated by the Strathcona Industrial Association (SIA), Lehigh Cement Ltd. and Alberta Environment and Sustainable Resource Development (AESRD). Figure 2 illustrates the locations of the continuous monitoring stations. The measured air quality parameters are summarized in Table 1. Among the continuous monitoring stations, the Sherwood Park, Gold Bar, Beverly, and Woodcroft stations also measure 24‐hour intermittent samples for particulate matter every six days following the sampling schedule of the National Ambient Pollution Surveillance Network (NAPS, Environment Canada). The intermittent monitoring program measures fine particulate matter (PM2.5) at all four stations. In addition, the Woodcroft station also measures inhalable particulate matter (PM10) and total suspended particulate matter (TSP). The ACA passive monitoring network consists of six sampling sites operated by the SIA. Figure 3 illustrates locations of the passive monitoring sites. Each site measures 30‐day average for SO2, NO2, and O3. Passive samples are collected on a monthly basis.
2
Figure 1. Alberta Capital Airshed management zone
3
Table 1. ACA ambient air continuous monitoring stations and the measurement parameters
Monitoring Parameters
Continuous air quality parameters measured in the ACA network
Sherwood Park Gold Bar Beverly Elmjay Clareview Woodcroft Edmonton
Centre Edmonton
East Edmonton South
SO2 √ √ √ √ ‐ √ ‐ √ √
H2S √ √ √ √ ‐ ‐ ‐ √ ‐
NO √ √ ‐ ‐ ‐ √ √ √ √
NO2 √ √ ‐ ‐ ‐ √ √ √ √
NOx √ √ ‐ ‐ ‐ √ √ √ √
O3 ‐ ‐ ‐ ‐ ‐ √ √ √ √
CO ‐ ‐ ‐ ‐ ‐ ‐ √ √ √
THC √ ‐ √ ‐ ‐ ‐ √ √ √
NMHC ‐ ‐ ‐ ‐ ‐ ‐ √ √ ‐
CH4 ‐ ‐ ‐ ‐ ‐ ‐ √ √ ‐
PM2.5 ‐ ‐ ‐ ‐ ‐ √ √ √ √
PM10 ‐ ‐ ‐ ‐ ‐ ‐ ‐ ‐ √
Ambient Temp. √ √ √ √ √ √ √ √ √
Relative Humidity ‐ ‐ ‐ ‐ ‐ √ ‐ √ ‐
Wind Speed √ √ √ √ √ √ ‐ √ √
Wind Direction √ √ √ √ √ √ ‐ √ √

4
Figure 2. Locations of the ACA continuous monitoring stations

5
ACA Boundary
Passive Stations
Site 4
Site 5
Site 1
Site 2Site 6
Site 3
Figure 3. Locations of the ACA passive monitoring stations
6
2.0 Summary of Air Monitoring Data
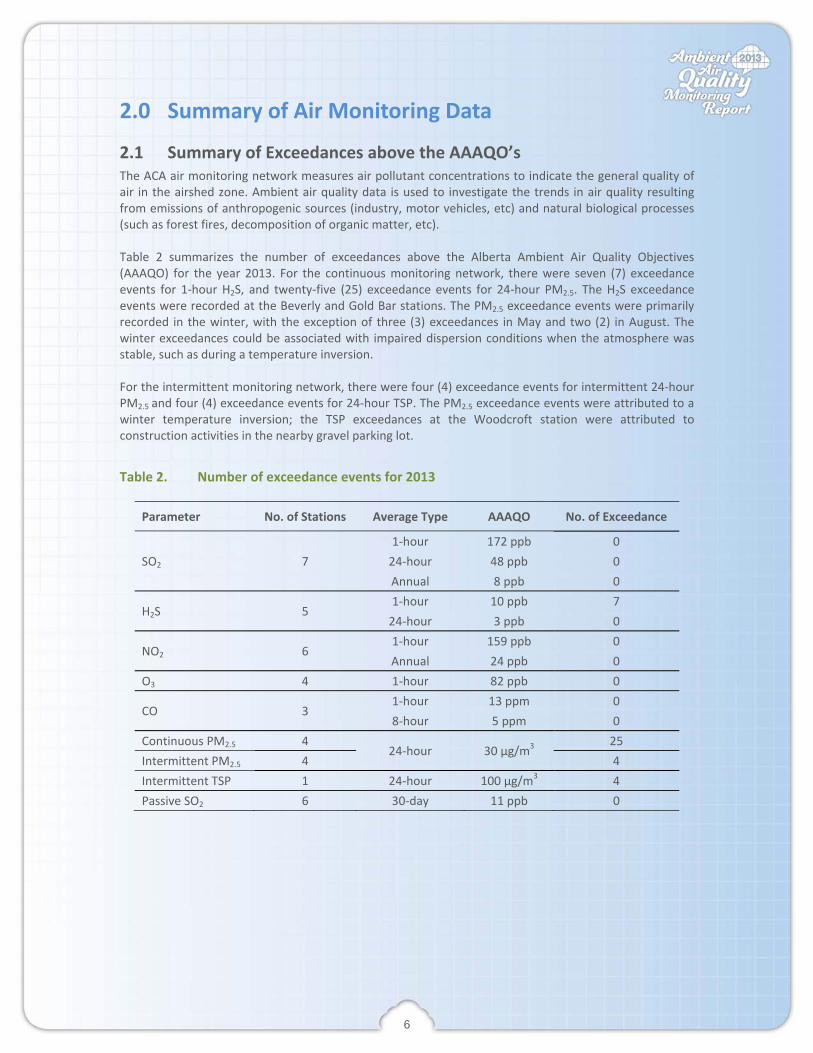
2.1 Summary of Exceedances above the AAAQO’s The ACA air monitoring network measures air pollutant concentrations to indicate the general quality of air in the airshed zone. Ambient air quality data is used to investigate the trends in air quality resulting from emissions of anthropogenic sources (industry, motor vehicles, etc) and natural biological processes (such as forest fires, decomposition of organic matter, etc). Table 2 summarizes the number of exceedances above the Alberta Ambient Air Quality Objectives (AAAQO) for the year 2013. For the continuous monitoring network, there were seven (7) exceedance events for 1‐hour H2S, and twenty‐five (25) exceedance events for 24‐hour PM2.5. The H2S exceedance events were recorded at the Beverly and Gold Bar stations. The PM2.5 exceedance events were primarily recorded in the winter, with the exception of three (3) exceedances in May and two (2) in August. The winter exceedances could be associated with impaired dispersion conditions when the atmosphere was stable, such as during a temperature inversion. For the intermittent monitoring network, there were four (4) exceedance events for intermittent 24‐hour PM2.5 and four (4) exceedance events for 24‐hour TSP. The PM2.5 exceedance events were attributed to a winter temperature inversion; the TSP exceedances at the Woodcroft station were attributed to construction activities in the nearby gravel parking lot.
Table 2. Number of exceedance events for 2013
Parameter No. of Stations Average Type AAAQO No. of Exceedance
SO2 7 1‐hour 172 ppb 0 24‐hour 48 ppb 0 Annual 8 ppb 0
H2S 5 1‐hour 10 ppb 7 24‐hour 3 ppb 0
NO2 6 1‐hour 159 ppb 0 Annual 24 ppb 0
O3 4 1‐hour 82 ppb 0
CO 3 1‐hour 13 ppm 0 8‐hour 5 ppm 0
Continuous PM2.5 4 24‐hour 30 µg/m3
25 Intermittent PM2.5 4 4 Intermittent TSP 1 24‐hour 100 µg/m3 4 Passive SO2 6 30‐day 11 ppb 0
7
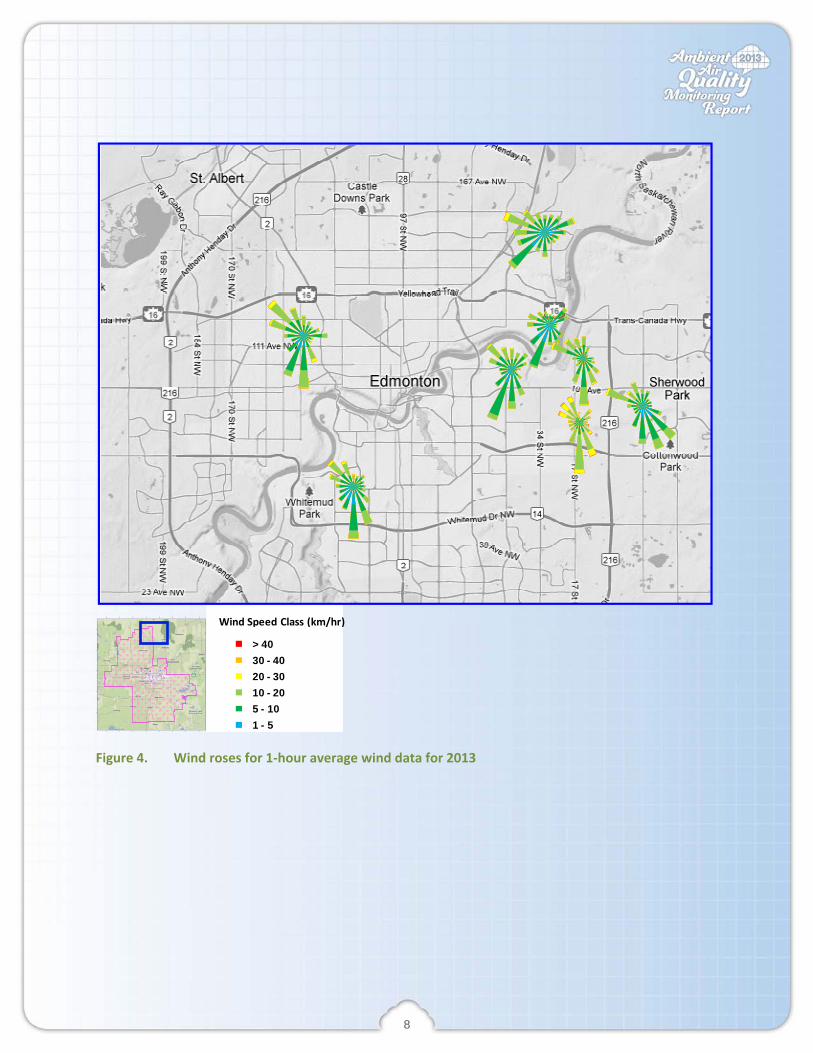
2.2 Wind Data Summary Wind speed and wind direction are important factors that influence regional air quality. The diffusion and dispersion of air pollutant emissions are greatly impacted by variations in wind speed and corresponding air turbulence. Different degrees of turbulence are created by variable mixing conditions due to the vertical gradient of ambient temperatures and terrain roughness unique to each station. Figure 4 presents the wind roses at the ACA continuous monitoring stations. The prevalent winds in this area were primarily from the southern sectors, and to a lesser frequency from the northwest directions. The Elmjay station typically recorded a higher wind speed than the other stations, potentially due to the open, flat terrain near this station. The detailed frequency distribution table and wind roses are presented in Appendix I: AMD Summary Tables.
8
> 4030 - 4020 - 3010 - 205 - 101 - 5
Wind Speed Class (km/hr)
Figure 4. Wind roses for 1‐hour average wind data for 2013
9
2.3 Continuous Air Quality Data
2.3.1 Sulphur Dioxide (SO2) Sulphur dioxide is a colourless, non‐flammable gas with a pungent odour. Natural sources include volcanoes, biodegradation of organic matter, and solar action on seawater. The primary anthropogenic sources of SO2 include fossil fuel combustion, petroleum refining, and smelting sulphide ores. Exposure to SO2 results in numerous effects to the pulmonary system. Healthy subjects exhibit increased airway resistance and bronchoconstriction, decreased maximum expiratory flow and decreased pulmonary function. Asthmatic subjects exhibit similar symptoms but also report increases in asthma symptoms, wheezing, chest tightness, and difficulty breathing. Sulphur dioxide affects vegetation as a result of acute and chronic exposures. Acute exposure to high concentrations of sulfur dioxide can produce injury in the form of foliar necrosis. Long term exposures to low concentration of SO2 have been shown to affect metabolic activity. The current Alberta Ambient Air Quality Objectives (AAAQO) for sulphur dioxide are:
• 1‐hour average AAAQO = 172 ppb • 24‐hour average AAAQO = 48 ppb • annual average AAAQO = 8 ppb
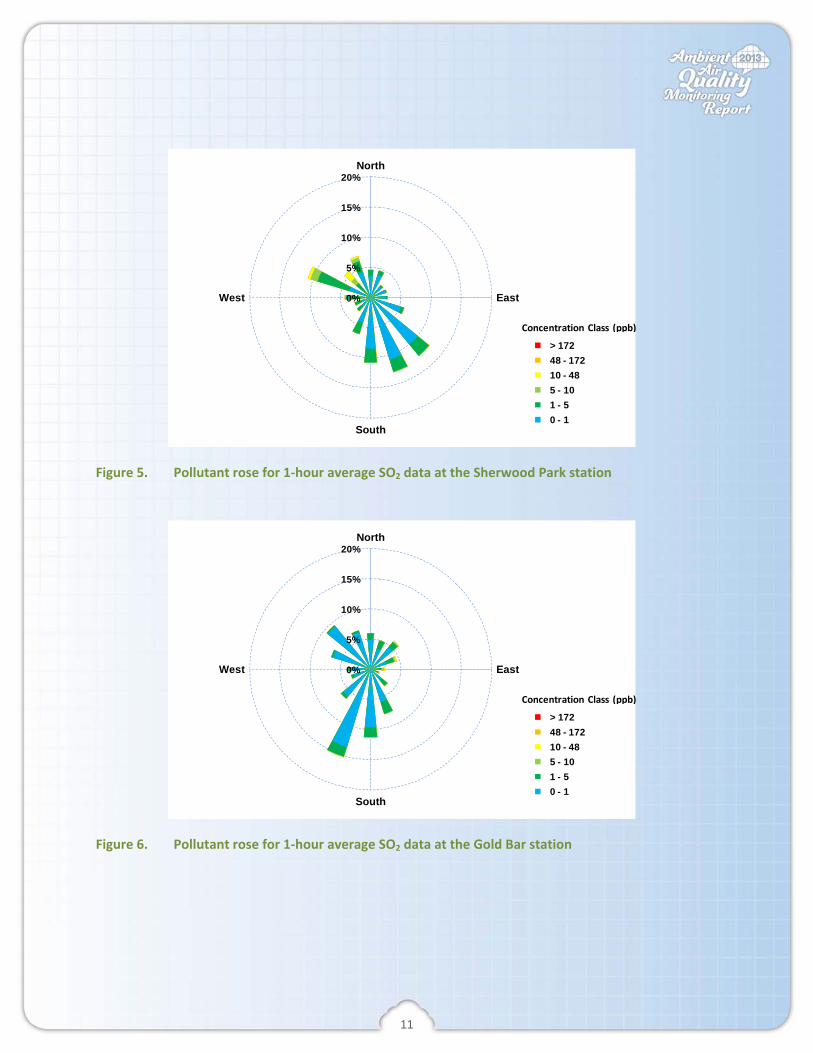
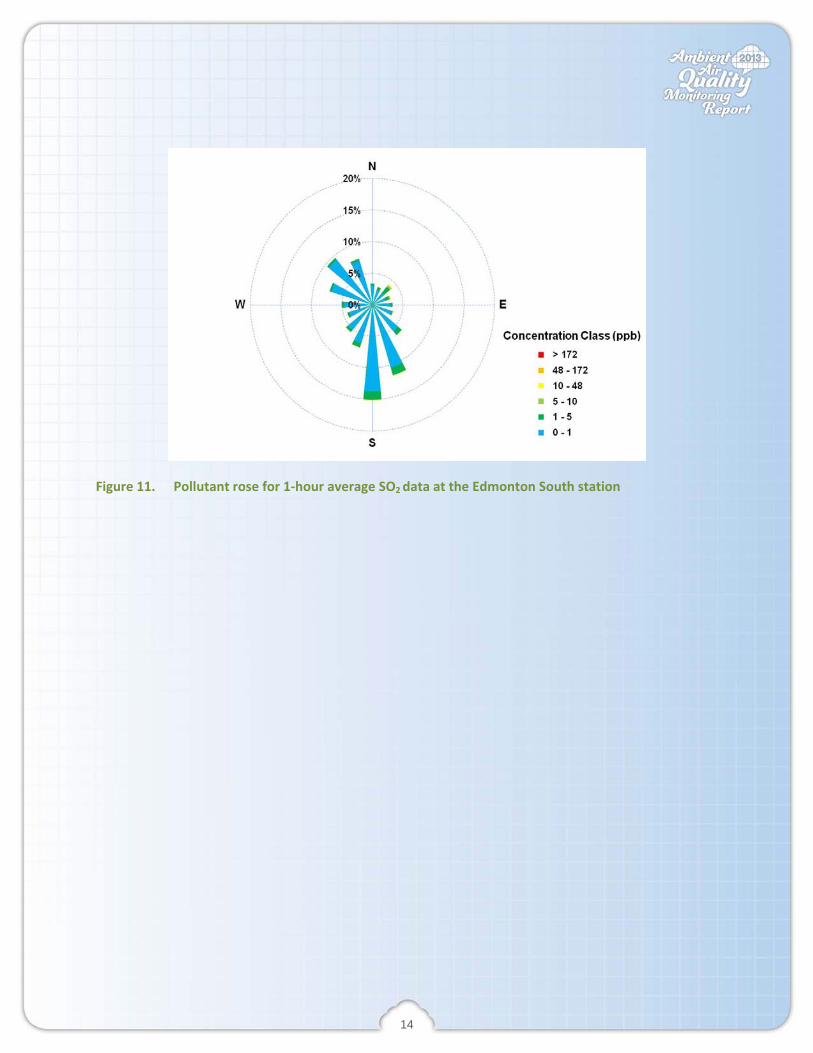
Table 3 presents the summary statistics for 1‐hour average concentrations for SO2 for the ACA monitoring stations. The annual average concentration was 1 ppb. The maximum 1‐hour average concentration of 76 ppb and the maximum 24‐hour average concentrations of 19 ppb were both recorded at the Beverly station. Table 4 summarizes the number of exceedances of the Alberta Ambient Air Quality Objectives. There were no exceedance events for the 1‐hour, 24‐hour, and annual average concentrations in 2013. Figures 5 to 11 present pollutant roses for 1‐hour average SO2 for the ACA monitoring stations. The pollutant roses indicate that SO2 concentration was predominantly less than 5 ppb. The detailed pollutant data is presented in Appendix I: AMD Summary Tables. The concentration distribution tables indicate that more than 90% of the time the 1‐hour average SO2 concentration was less than 5 ppb. Figure 12 compares the annual average SO2 concentrations for fifty‐two (52) monitoring stations in Alberta. The annual average concentrations of the ACA monitoring stations were ranked the 5th, 6th, 8th, 11th, 20th, 22nd and 32nd places. A higher concentration tends to be recorded in the areas with heavy industry and energy operation facilities.

10
Table 3. Summary statistics for 1‐hour average SO2 for 2013
Monitoring Station
Annual Average
Instrument Uptime Time
Maximum SO2 Conc. and Occurrence Time
1‐hour Max. 24‐hour Max. ppb % ppb Time ppb Date
Sherwood Park 1 99.9 68 Dec 04 03:00 10 Dec 04
Gold Bar 1 99.9 48 Jul 13 10:00 8 May 24
Beverly 1 100.0 76 May 23 01:00 19 May 23
Elmjay 1 100.0 73 Jan 19 19:00 8 Jan 19
Woodcroft 1 99.4 17 Aug 23 10:00 4 Aug 23
Edmonton East 1 98.4 36 May 20 14:00 7 Jun 19
Edmonton South 1 96.0 22 Aug 11 12:00 4 Apr 07
Table 4. Number of exceedance events for SO2 for 2013
Monitoring Station
No. of Exceedance to Alberta Ambient Air Quality Objectives (AAAQO)
1‐hr AAAQO 24‐hr AAAQO Annual AAAQO 172 ppb 48 ppb 8 ppb
Sherwood Park 0 0 0
Gold Bar 0 0 0
Beverly 0 0 0
Elmjay 0 0 0
Woodcroft 0 0 0
Edmonton East 0 0 0
Edmonton South 0 0 0
11
0%
5%
10%
15%
20%North
East
South
West
> 17248 - 17210 - 485 - 101 - 50 - 1
Concentration Class (ppb)
Figure 5. Pollutant rose for 1‐hour average SO2 data at the Sherwood Park station
0%
5%
10%
15%
20%North
East
South
West
> 17248 - 17210 - 485 - 101 - 50 - 1
Concentration Class (ppb)
Figure 6. Pollutant rose for 1‐hour average SO2 data at the Gold Bar station

12
0%
5%
10%
15%
20%North
East
South
West
> 17248 - 17210 - 485 - 101 - 50 - 1
Concentration Class (ppb)
Figure 7. Pollutant rose for 1‐hour average SO2 data at the Beverly station
0%
5%
10%
15%
20%North
East
South
West
> 17248 - 17210 - 485 - 101 - 50 - 1
Concentration Class (ppb)
Figure 8. Pollutant rose for 1‐hour average SO2 data at the Elmjay station

13
0%
5%
10%
15%
20%N
E
S
W
> 17248 - 17210 - 485 - 101 - 50 - 1
Concentration Class (ppb)
Figure 9. Pollutant rose for 1‐hour average SO2 data at the Woodcroft station
Figure 10. Pollutant rose for 1‐hour average SO2 data at the Edmonton East station
14
Figure 11. Pollutant rose for 1‐hour average SO2 data at the Edmonton South station

15
0 2 4 6 8 10 12 14 16 18 20Redwater Industrial (FAP)
Mannix (WBEA)Mildred Lake (WBEA)Lamont County (FAP)
Beverly (SIA)Sherwood Park (SIA)Fort McKay (WBEA)
Edmonton East (AESRD)Fort McKay South (WBEA)
Lower Camp (WBEA)Elmjay (SIA)
Shell Muskeg River (WBEA)Scotford 2 (FAP)
Hinton (WCAS)St. Lina (LICA)
Fort McMurray-Patricia Mcinnes …Bruderheim (FAP)
CNRL Horizon (WBEA)Ross Creek (FAP)
Edmonton South (AESRD)Millennium Mine (WBEA)
Gold Bar (SIA)Wagner2 (WCAS)
Buffalo Viewpoint (WBEA)Genesee (WCAS)
Anzac (WBEA)Maskwa (LICA)
Fort McMurray-Athabasca Valley …Caroline (PAMZ)
Fort Saskatchewan-92 St and 96 …Range Road 220 (FAP)
Woodcrof t (LHC)Valleyview (PAZA)
Elk Island (FAP)Meadows (WCAS)
Tomahawk (WCAS)Edson (WCAS)
Violet Grove (WCAS)Smoky Heights (PAZA)
Lethbridge (AESRD)Breton (WCAS)Power (WCAS)
Cold Lake South (LICA)Fort Chipewyan (WBEA)
Carrot Creek (WCAS)Beaverlodge (PAZA)
Grande Prairie (Henry Pirker) (PAZA)Crescent Heights (PAS)Evergreen Park (PAZA)
Falher (PAZA)Red Deer - Riverside (PAMZ)
Steeper (WCAS)
SO2 parts per billion (ppb)
8 ppb -SO2 A
lberta Annual A
irQuality O
bjective
Figure 12. Annual average concentrations for SO2 for the Province of Alberta

16
2.3.2 Hydrogen Sulphide (H2S) Hydrogen sulphide is a colourless, flammable gas that can be identified by humans at relatively low concentrations. It is characterized by a rotten egg odour. Hydrogen sulphide is extremely hazardous and toxic. The gas occurs naturally in coal pits, sulphur springs, gas wells, and biodegradation of sulphur‐containing organic matter. It is commonly existent in places such as sewers, sewage treatment plants, and manure stockpiles. Industrial sources of hydrogen sulphide include petroleum and natural gas extraction and refining, pulp and paper manufacturing, rayon textile production, leather tanning, chemical manufacturing, and waste disposal. Hydrogen sulfide is a highly toxic and flammable gas. It is heavier than air and tends to accumulate at the bottom of poorly ventilated spaces. Although very pungent at first, it quickly deadens the sense of smell. Potential victims may be unaware of its presence until it is too late. The current AAAQO for hydrogen sulphide are:
• 1‐hour average AAAQO = 10 ppb • 24‐hour average AAAQO = 3 ppb
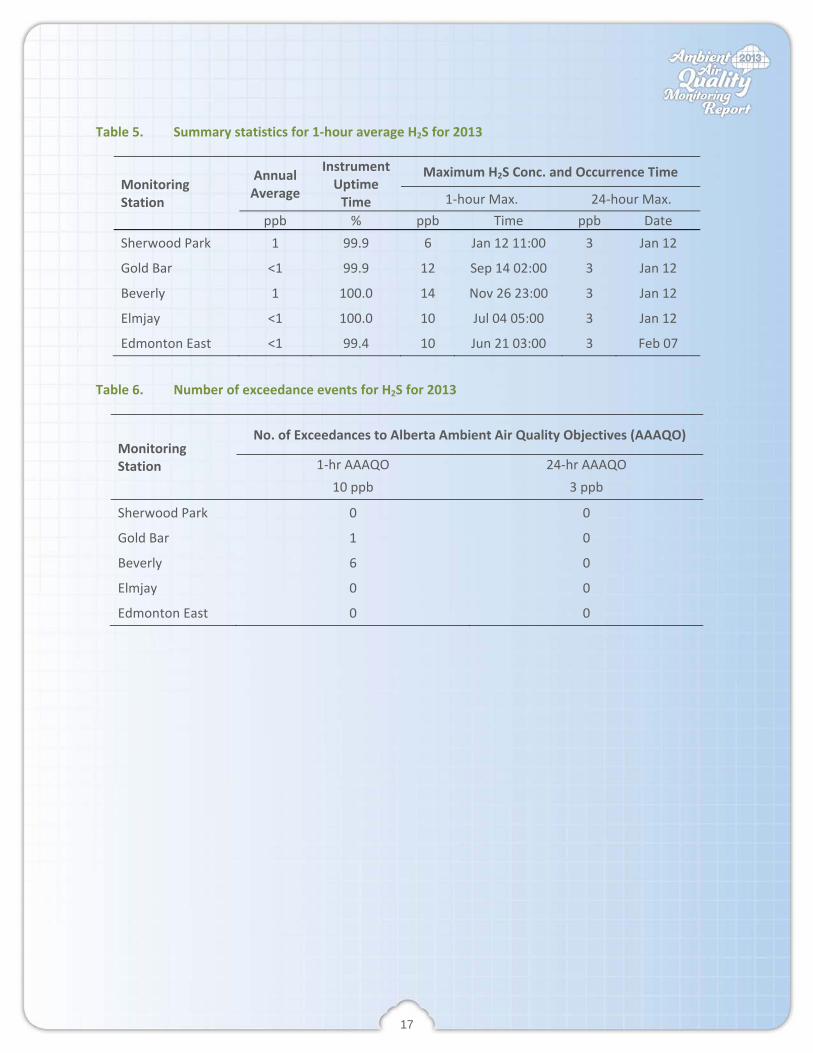
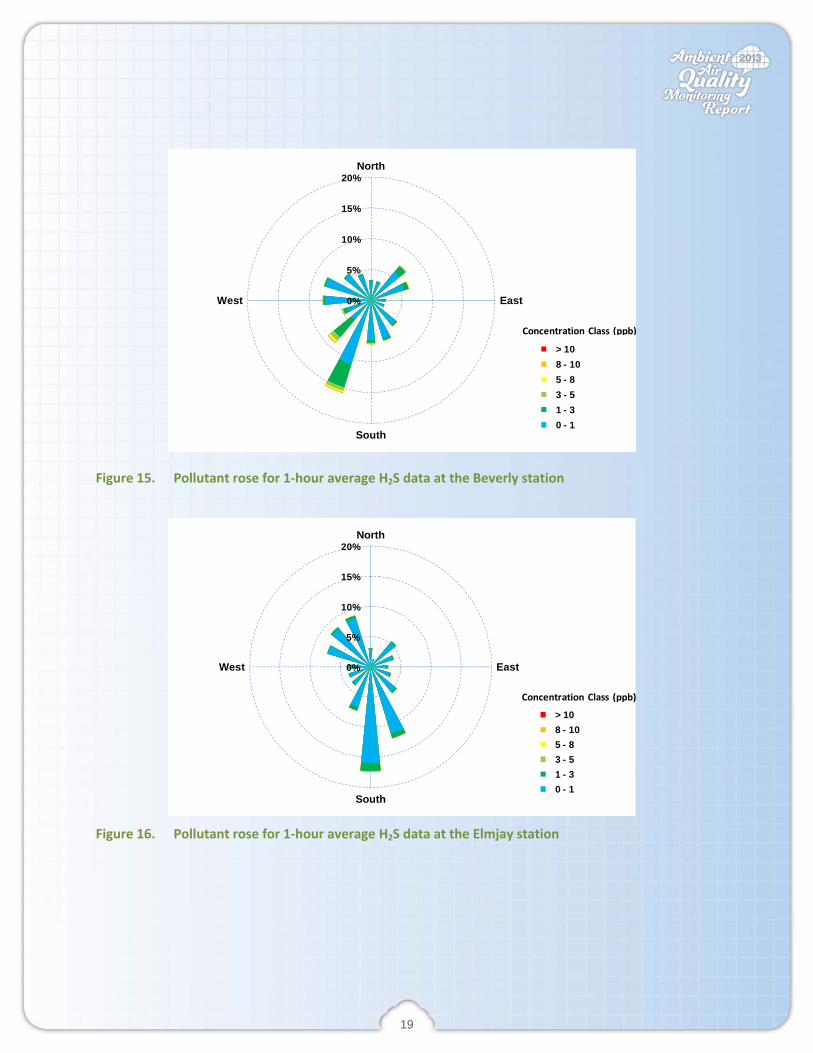
Table 5 presents summary statistics for 1‐hour average concentrations for H2S for 2013. The annual average concentrations for H2S ranged between <1 ppb and 1 ppb. The highest 1‐hour average concentration of 14 ppb was recorded at the Beverly station. The highest 24‐hour average concentration of 3 ppb was recorded at all stations. Table 6 summarizes the number of exceedance events for the year 2013. There were seven (7) exceedance events for 1‐hour AAAQO. The exceedance events were detected at the Beverly station and Gold Bar station: • The Beverly station detected six (6) exceedance events for 1‐hour average H2S. During the exceedance events,
wind speed was low (<4km/hr), generally from southwest and south‐southwest directions. • The Gold Bar station detected one (1) exceedance event for 1‐hour average H2S. During the exceedance event,
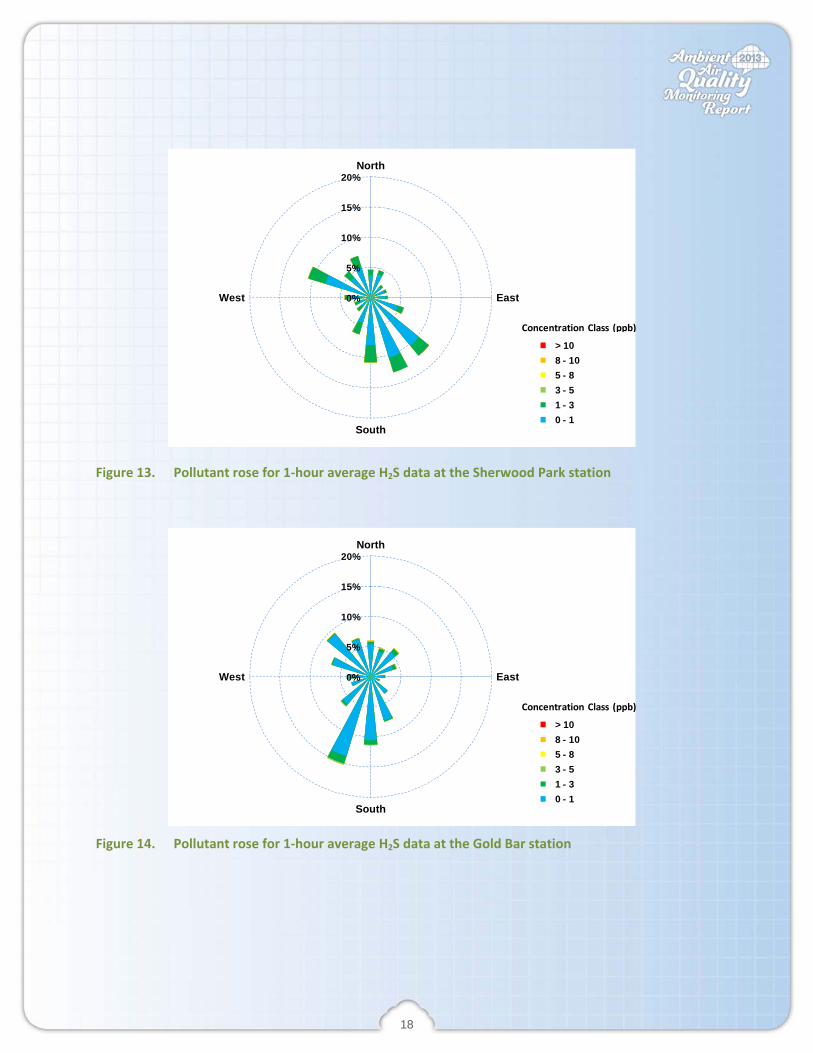
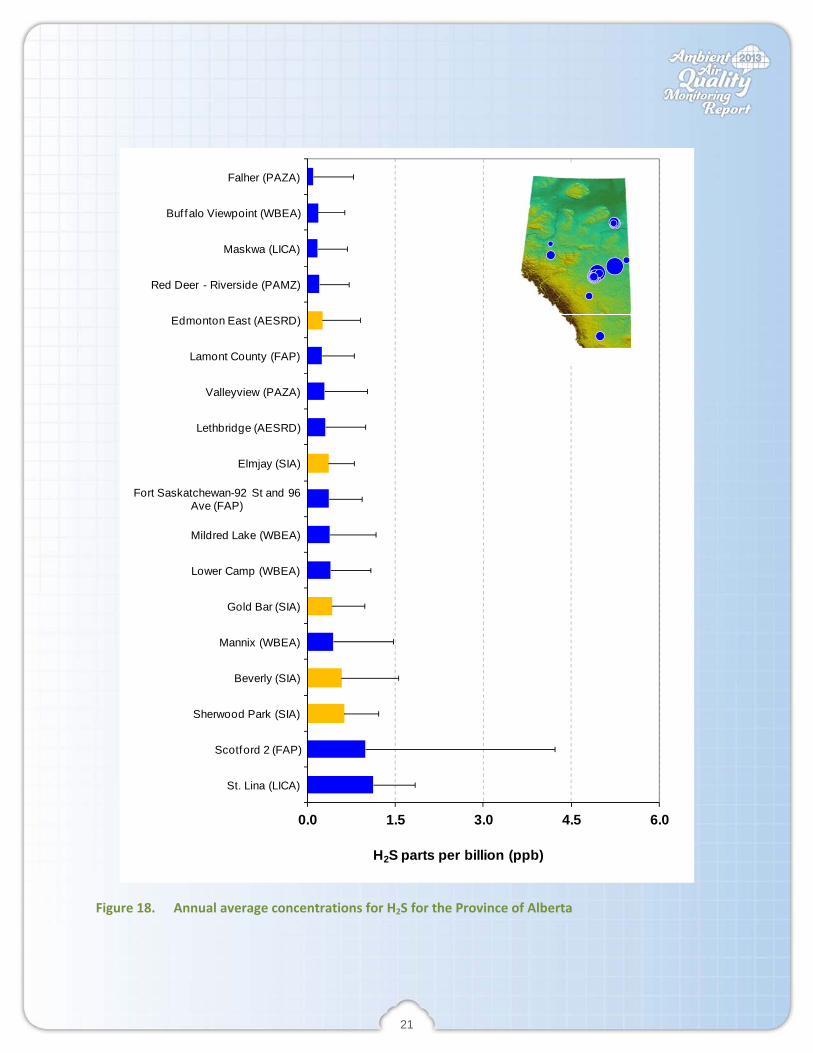
wind speed was calm (<1km/hr), from the north‐northeast direction. Figures 13 to 17 present pollutant roses for 1‐hour average H2S. The pollutant roses indicate H2S concentration in the ambient air was predominantly less than 1 ppb at all stations. The detailed pollutant data is presented in Appendix I: AMD Summary Tables. The concentration distribution tables indicate that greater than 90% of the time the 1‐hour average H2S concentration was less than 1 ppb, with the exception of the Beverly station (84.3%), and the Sherwood Park station (76.8%). Figure 18 compares the annual average H2S concentrations for eighteen (18) monitoring stations in Alberta. The annual average concentrations of the ACA monitoring stations were ranked the 3rd, 4th, 6th, 10th, and 14th places.
17
Table 5. Summary statistics for 1‐hour average H2S for 2013
Monitoring Station
Annual Average
Instrument Uptime Time
Maximum H2S Conc. and Occurrence Time
1‐hour Max. 24‐hour Max. ppb % ppb Time ppb Date
Sherwood Park 1 99.9 6 Jan 12 11:00 3 Jan 12
Gold Bar <1 99.9 12 Sep 14 02:00 3 Jan 12
Beverly 1 100.0 14 Nov 26 23:00 3 Jan 12
Elmjay <1 100.0 10 Jul 04 05:00 3 Jan 12
Edmonton East <1 99.4 10 Jun 21 03:00 3 Feb 07
Table 6. Number of exceedance events for H2S for 2013
Monitoring Station
No. of Exceedances to Alberta Ambient Air Quality Objectives (AAAQO)
1‐hr AAAQO 24‐hr AAAQO 10 ppb 3 ppb
Sherwood Park 0 0
Gold Bar 1 0
Beverly 6 0
Elmjay 0 0
Edmonton East 0 0
18
0%
5%
10%
15%
20%North
East
South
West
> 108 - 105 - 83 - 51 - 30 - 1
Concentration Class (ppb)
Figure 13. Pollutant rose for 1‐hour average H2S data at the Sherwood Park station
0%
5%
10%
15%
20%North
East
South
West
> 108 - 105 - 83 - 51 - 30 - 1
Concentration Class (ppb)
Figure 14. Pollutant rose for 1‐hour average H2S data at the Gold Bar station
19
0%
5%
10%
15%
20%North
East
South
West
> 108 - 105 - 83 - 51 - 30 - 1
Concentration Class (ppb)
Figure 15. Pollutant rose for 1‐hour average H2S data at the Beverly station
0%
5%
10%
15%
20%North
East
South
West
> 108 - 105 - 83 - 51 - 30 - 1
Concentration Class (ppb)
Figure 16. Pollutant rose for 1‐hour average H2S data at the Elmjay station

20
Figure 17. Pollutant rose for 1‐hour average H2S data at the Edmonton East station
21
0.0 1.5 3.0 4.5 6.0
St. Lina (LICA)
Scotford 2 (FAP)
Sherwood Park (SIA)
Beverly (SIA)
Mannix (WBEA)
Gold Bar (SIA)
Lower Camp (WBEA)
Mildred Lake (WBEA)
Fort Saskatchewan-92 St and 96 Ave (FAP)
Elmjay (SIA)
Lethbridge (AESRD)
Valleyview (PAZA)
Lamont County (FAP)
Edmonton East (AESRD)
Red Deer - Riverside (PAMZ)
Maskwa (LICA)
Buffalo Viewpoint (WBEA)
Falher (PAZA)
H2S parts per billion (ppb)
Figure 18. Annual average concentrations for H2S for the Province of Alberta

22
2.3.3 Nitrogen Dioxide (NO2) Nitrogen dioxide is a reddish‐orange‐brown gas with an irritating, pungent odour. Nitrogen dioxide is corrosive, highly oxidizing and non‐combustible. Nitrogen dioxide occurs naturally in the environment as a result of forest fires, atmospheric lightning discharges, and biodegradation of nitrogen containing compounds. Anthropogenic sources of NO2 are mainly from combustion processes, such as vehicles emissions, coal combustion, and industrial processes. Acute exposure to NO2 of 2 ppm or lower can cause airway inflammation and alterations in lymphocytes appearance in healthy individuals; individuals with asthma have a greater sensitivity to acute exposures. Pre‐exposure to NO2 can increase the responsiveness of mildly asthmatic individuals to inhaled allergens. The effects on vegetation are dependent on a number of factors, for example sensitivity of the species, duration and concentration of the exposure, and stage of growth when exposed. Some of the effects that have been observed include: increase in shoot to root ratio, which results in drought susceptibility; decreased growth; increased shoot nitrogen, which leads to increased susceptibility to pathogen and insect attack; and advanced bud‐break, which could lead to frost damage. The current AAAQO for nitrogen dioxide are:
• 1‐hour average AAAQO = 159 ppb • annual average AAAQO = 24 ppb
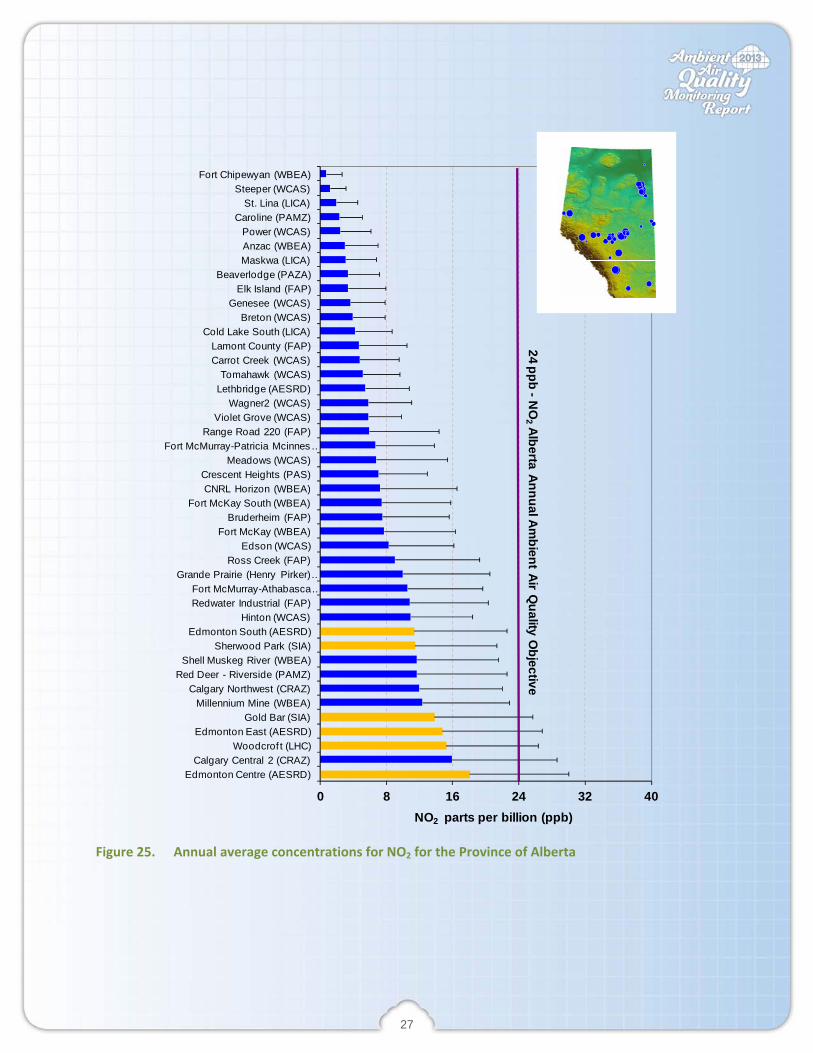
Table 7 presents the summary statistics for 1‐hour average concentrations for NO2 for 2013. The annual average concentrations ranged between 11.4 ppb to 18.0 ppb. The maximum 1‐hour average concentration of 118.1 ppb was detected at the Edmonton East station. The maximum 24‐hour average concentration of 58.9 ppb was detected at the Edmonton Centre station. Table 8 summarizes number of exceedances for the year of 2013. There were no exceedance events recorded in the ACA monitoring network. Figures 19 to 24 present pollutant roses for 1‐hour average NO2. The pollutant roses indicate NO2 concentration was predominantly less than 30 ppb at all stations. The detailed pollutant data is presented in Appendix I: AMD Summary Tables. The concentration distribution tables indicate that greater than 85% of the time the 1‐hour average NO2 concentration was less than 30 ppb, with the exception of the Edmonton Centre station (83.8%). Figure 25 compares the annual average NO2 concentrations for forty‐three (43) monitoring stations in Alberta. The concentrations for the ACA air monitoring stations were ranked high among the stations. Four of the ACA monitoring stations were ranking among the top five stations in the province (1st, 3rd, 4th, and 5th), with the exception of the Sherwood Park station in 10th place, and the Edmonton South station in 11th place. A higher concentration of NO2 tends to be recorded in large cities due to traffic emissions, as well as industrial areas where more combustion sources are present.

23
Table 7. Summary statistics for 1‐hour average NO2 for 2013
Monitoring Station Annual Average
Instrument Uptime Time
Maximum NO2 Conc. and Occurrence Time
1‐hour Max. 24‐hour Max.
ppb % ppb Time ppb Date
Sherwood Park 11.4 99.7 79.3 Jan 04 10:00 43.6 Jan 04
Gold Bar 13.8 99.2 72.3 Nov 25 09:00 47.9 Jan 04
Woodcroft 15.2 99.0 88.5 Jan 04 10:00 53.8 Jan 04
Edmonton Centre 18.0 99.6 84.4 Jan 04 09:00 58.9 Jan 04
Edmonton East 14.7 99.0 118.1 Oct 24 16:00 52.4 Jan 04
Edmonton South 11.3 99.6 81.8 Jan 04 12:00 52.2 Jan 04
Table 8. Number of exceedance events for NO2 for 2013
Monitoring Station No. of Exceedances to Alberta Ambient Air Quality Objectives (AAAQO)
1‐hr AAAQO Annual AAAQO 159 ppb 24 ppb
Sherwood Park 0 0
Gold Bar 0 0
Woodcroft 0 0
Edmonton Centre 0 0
Edmonton East 0 0
Edmonton South 0 0

24
0%
5%
10%
15%
20%North
East
South
West
> 159100 - 15930 - 10015 - 305 - 150 - 5
Concentration Class (ppb)
Figure 19. Pollutant rose for 1‐hour average NO2 data at the Sherwood Park station
0%
5%
10%
15%
20%North
East
South
West
> 159100 - 15930 - 10015 - 305 - 150 - 5
Concentration Class (ppb)
Figure 20. Pollutant rose for 1‐hour average NO2 data at the Gold Bar station

25
0%
5%
10%
15%
20%N
E
S
W
> 159100 - 15930 - 10015 - 305 - 150 - 5
Concentration Class (ppb)
Figure 21. Pollutant rose for 1‐hour average NO2 data at the Woodcroft station
Figure 22. Pollutant rose for 1‐hour average NO2 data at the Edmonton Centre station
(analyzed using wind data from the Edmonton East station)

26
Figure 23. Pollutant rose for 1‐hour average NO2 data at the Edmonton East station
Figure 24. Pollutant rose for 1‐hour average NO2 data at the Edmonton South station
27
0 8 16 24 32 40
Edmonton Centre (AESRD)Calgary Central 2 (CRAZ)
Woodcrof t (LHC)Edmonton East (AESRD)
Gold Bar (SIA)Millennium Mine (WBEA)
Calgary Northwest (CRAZ)Red Deer - Riverside (PAMZ)
Shell Muskeg River (WBEA)Sherwood Park (SIA)
Edmonton South (AESRD)Hinton (WCAS)
Redwater Industrial (FAP)Fort McMurray-Athabasca …
Grande Prairie (Henry Pirker) …Ross Creek (FAP)
Edson (WCAS)Fort McKay (WBEA)
Bruderheim (FAP)Fort McKay South (WBEA)
CNRL Horizon (WBEA)Crescent Heights (PAS)
Meadows (WCAS)Fort McMurray-Patricia Mcinnes …
Range Road 220 (FAP)Violet Grove (WCAS)
Wagner2 (WCAS)Lethbridge (AESRD)Tomahawk (WCAS)
Carrot Creek (WCAS)Lamont County (FAP)
Cold Lake South (LICA)Breton (WCAS)
Genesee (WCAS)Elk Island (FAP)
Beaverlodge (PAZA)Maskwa (LICA)Anzac (WBEA)Power (WCAS)
Caroline (PAMZ)St. Lina (LICA)
Steeper (WCAS)Fort Chipewyan (WBEA)
NO2 parts per billion (ppb)
24 ppb -NO
2 Alberta Annual Ambient Air Q
uality Objective
Figure 25. Annual average concentrations for NO2 for the Province of Alberta
28
2.3.4 Ozone (O3) Ozone is a highly reactive, colourless gas that is normally present in the troposphere as a result of naturally occurring photochemical and meteorological processes. It has a sharp odour that can often be detected around running electric motors, after lightning storms, and newly mown hay. The effects of ozone are dependent on where it exists. Stratospheric ozone protects the earth from UV light, but ozone can be toxic in the troposphere. Ground level ozone is formed through complex chemical reactions between precursor pollutants, e.g. volatile organic compounds and nitrogen oxides, in the presence of heat and sunlight. Changing weather patterns also contribute to yearly variations in ozone concentrations. Ozone also can be transported into an area from pollution sources hundreds of miles upwind. Potential short‐term effects for ozone exposure include pulmonary function reductions, increased airway sensitivities, and airway inflammation. The primary short‐term injury is to the lungs, which is characterized by lung congestion, fluid build‐up, and bleeding. Inhalation may initiate, accelerate, or exacerbate respiratory tract disease of bacterial or viral origin. Discomfort to individuals may involve coughing, dryness of throat, mucous membranes, and of the nose and eyes following exposures of high concentrations for short duration. The current AAAQO for ozone is:
• 1‐hour average AAAQO = 82 ppb Table 9 presents the summary statistics for 1‐hour average concentrations for O3 for 2013. The annual average concentrations ranged between 18 ppb to 25 ppb. The maximum 1‐hour average concentration of 72 ppb and the maximum 24‐hour average concentration of 51 ppb were both detected at the Edmonton South station. Table 10 summarizes the number of exceedances for the year of 2013. There were no exceedance events recorded in the ACA monitoring network. Figures 26 to 29 present pollutant roses for 1‐hour average O3. The pollutant roses indicate O3 concentration in the ambient air was predominantly less than 40 ppb at all stations. The detailed pollutant data is presented in Appendix I: AMD Summary Tables. The concentration distribution tables indicate that greater than 85% of the time the 1‐hour average O3 concentration was less than 40 ppb, with the exception of the Edmonton South station (84.1%). Figure 30 compares the annual average O3 concentrations for thirty‐two (32) monitoring stations in Alberta. The concentrations for the ACA air monitoring stations were low in the province. The annual average concentrations of the ACA monitoring stations were ranked the 20th, 24th, 26th and 31st places. A lower concentration of O3 tends to be recorded in the areas that have more anthropogenic emission sources, indicating the effects of ozone titration.

29
Table 9. Summary statistics for 1‐hour average O3 for 2013
Monitoring Station Annual Average
Instrument Uptime Time
Maximum O3 Conc. and Occurrence Time
1‐hour Max. 24‐hour Max.
ppb % ppb Time ppb Date
Woodcrofta. 18 99.9 63 Sep 21 11:00 45 Nov 29
Edmonton Centre 20 99.6 66 Jul 08 08:00 47 Mar 30
Edmonton East 22 99.6 65 Mar 29 15:00 47 Mar 30
Edmonton South 25 98.6 72 Jul 02 15:00 51 Mar 30 a. Woodcroft O3 analyzer was operational June to December 2013.
Table 10. Number of exceedance events for O3 for 2013
Monitoring Station No. of Exceedances to Alberta Ambient Air Quality Objectives (AAAQO)
1‐hr AAAQO 82 ppb
Woodcroft 0
Edmonton Centre 0
Edmonton East 0
Edmonton South 0

30
0%
5%
10%
15%
20%N
E
S
W
> 8240 - 8230 - 4020 - 3010 - 200 - 10
Concentration Class (ppb)
Figure 26. Pollutant rose for 1‐hour average O3 data at the Woodcroft station
Figure 27. Pollutant rose for 1‐hour average O3 data at the Edmonton Centre station
(analyzed using wind data from the Edmonton East station)

31
Figure 28. Pollutant rose for 1‐hour average O3 data at the Edmonton East station
Figure 29. Pollutant rose for 1‐hour average O3 data at the Edmonton South station

32
0 15 30 45 60
Steeper (WCAS)Caroline (PAMZ)
St. Lina (LICA)Lethbridge (AESRD)Beaverlodge (PAZA)
Violet Grove (WCAS)Lamont County (FAP)
Tomahawk (WCAS)Elk Island (FAP)
Crescent Heights (PAS)Bruderheim (FAP)
Breton (WCAS)Calgary Northwest (CRAZ)
Fort Chipewyan (WBEA)Carrot Creek (WCAS)
Cold Lake South (LICA)Anzac (WBEA)Edson (WCAS)
Genesee (WCAS)Edmonton South (AESRD)
Grande Prairie (Henry …Fort Saskatchewan-92 St …
Fort McMurray-Patricia …Edmonton East (AESRD)
Red Deer - Riverside (PAMZ)Edmonton Centre (AESRD)
Calgary Central 2 (CRAZ)Fort McKay (WBEA)
Fort McMurray-Athabasca …Fort McKay South (WBEA)
Woodcroft (LHC)Hinton (WCAS)
O3 parts per billion (ppb)
Figure 30. Annual average concentrations for O3 for the Province of Alberta

33
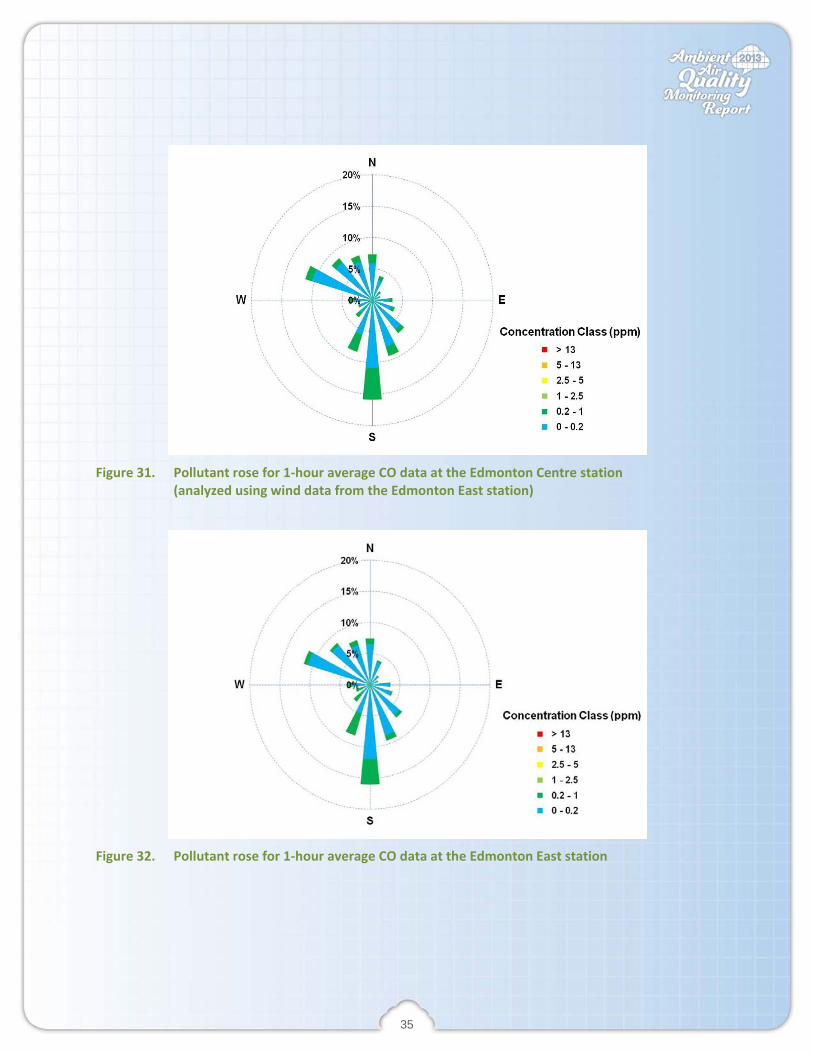
2.3.5 Carbon Monoxide (CO) Carbon monoxide is a colourless, odourless, and tasteless gas that is slightly lighter than air. In the presence of oxygen, carbon monoxide burns with a blue flame, producing carbon dioxide. Carbon monoxide is produced from the partial oxidation of carbon‐containing compounds. It forms when there is not enough oxygen to produce carbon dioxide, such as when operating a stove or an internal combustion engine in an enclosed space. Carbon monoxide is toxic to humans and animals when exposed at high concentrations. Carbon monoxide mainly causes adverse effects in humans by combining with hemoglobin to form carboxyhemoglobin in the blood. This prevents hemoglobin from releasing oxygen leading to hypoxia. Exposures to a high concentration can lead to significant toxicity of the central nervous system and even death. Symptoms of mild acute poisoning include light headedness, confusion, headaches, vertigo, and flu‐like effects. Chronic exposure to low levels of carbon monoxide can lead to depression, confusion, and memory loss. The current AAAQO for Carbon monoxide are:
• 1‐hour average AAAQO = 13 ppm • 8‐hour average AAAQO = 5 ppm
Table 11 presents the summary statistics for 1‐hour average concentrations for CO. The annual average concentration was 0.2 ppm. The maximum 1‐hour average concentration of 1.6 ppm was detected at the Edmonton South station, and the maximum 8‐hour average concentration of 1.1 ppm was detected at the Edmonton Centre station. Table 12 summarizes the number of exceedances for the year of 2013. There were no exceedance events recorded in the ACA monitoring network. Figures 31 to 33 present pollutant roses for 1‐hour average CO. The pollutant roses indicate CO concentration in the ambient air was predominantly less than 1 ppm. The detailed pollutant data is presented in Appendix I: AMD Summary Tables. The concentration distribution tables indicate that greater than 99% of the time the 1‐hour average CO concentration was less than 1 ppm. Figure 34 compares the annual average CO concentrations for eleven (11) monitoring stations in Alberta. The annual average concentrations of the ACA monitoring stations were ranked the 2nd, 5th, and 9th places. A higher concentration of CO tends to be recorded in large cities, indicating a potential link with traffic emission sources.

34
Table 11. Summary statistics for 1‐hour average CO for 2013
Monitoring Station Annual Average
Instrument Uptime Time
Maximum CO Conc. and Occurrence Time
1‐hour Max. 8‐hour Max.
ppm % ppb Time ppm Time
Edmonton Centre 0.2 99.6 1.5 Jan 04 09:00 1.1 Feb‐07 15:00
Edmonton East 0.2 99.5 1.1 Jan 04 11:00 0.8 Feb 07 10:00
Edmonton South 0.2 99.6 1.6 Dec 17 17:00 1.0 Feb‐07 17:00
Table 12. Number of exceedance events for CO for 2013
Monitoring Station No. of Exceedances to Alberta Ambient Air Quality Objectives (AAAQO)
1‐hr AAAQO 8‐hr AAAQO 13 ppm 5 ppm
Edmonton Centre 0 0
Edmonton East 0 0
Edmonton South 0 0
35
Figure 31. Pollutant rose for 1‐hour average CO data at the Edmonton Centre station
(analyzed using wind data from the Edmonton East station)
Figure 32. Pollutant rose for 1‐hour average CO data at the Edmonton East station

36
Figure 33. Pollutant rose for 1‐hour average CO data at the Edmonton South station

37
0 100 200 300 400
Calgary Central 2 (CRAZ)
Edmonton South (AESRD)
Grande Prairie (Henry Pirker) (PAZA)
Calgary Northwest (CRAZ)
Edmonton Centre (AESRD)
Fort McMurray-Athabasca Valley (WBEA)
Lethbridge (AESRD)
Fort Saskatchewan-92 St and 96 Ave (FAP)
Edmonton East (AESRD)
Crescent Heights (PAS)
Steeper (WCAS)
CO parts per billion (ppb)
Figure 34. Annual average concentrations for CO for the Province of Alberta
38
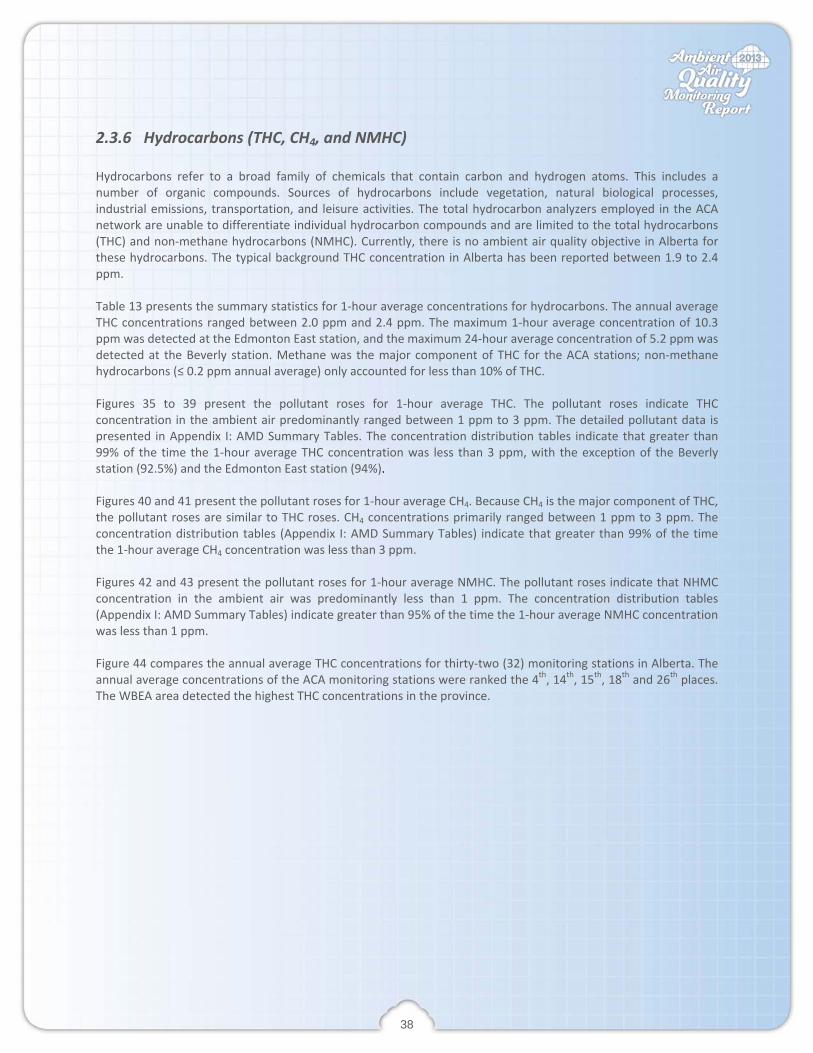
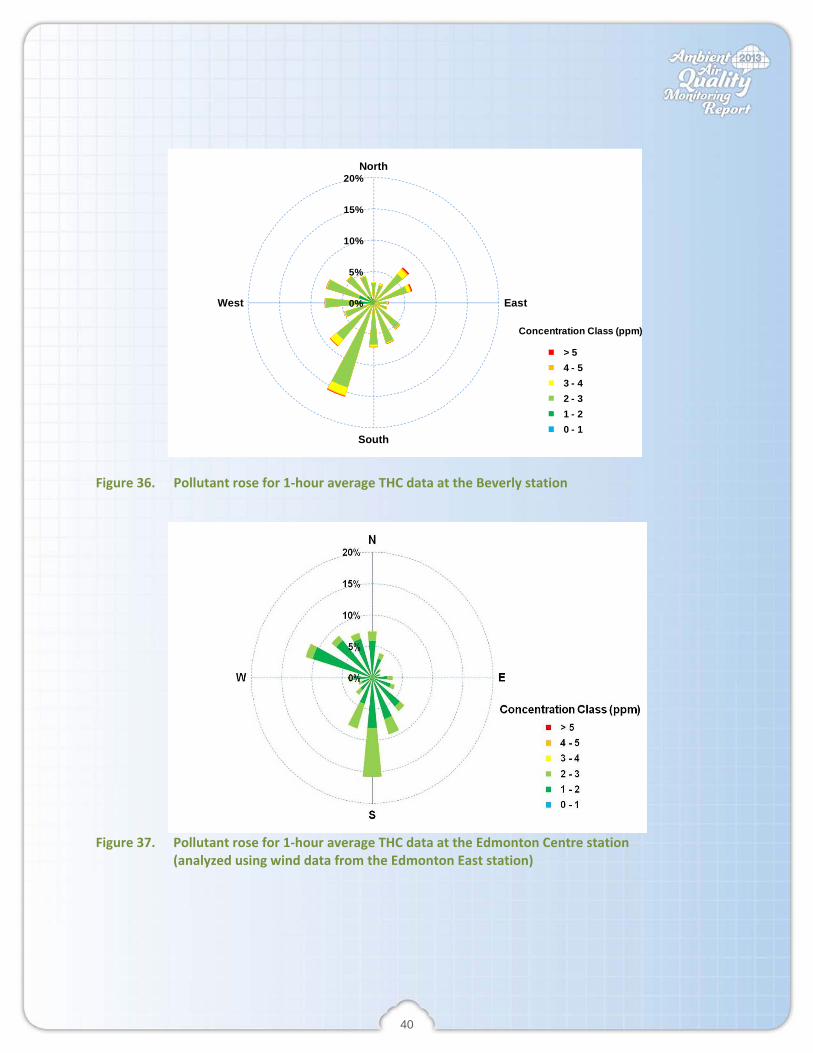
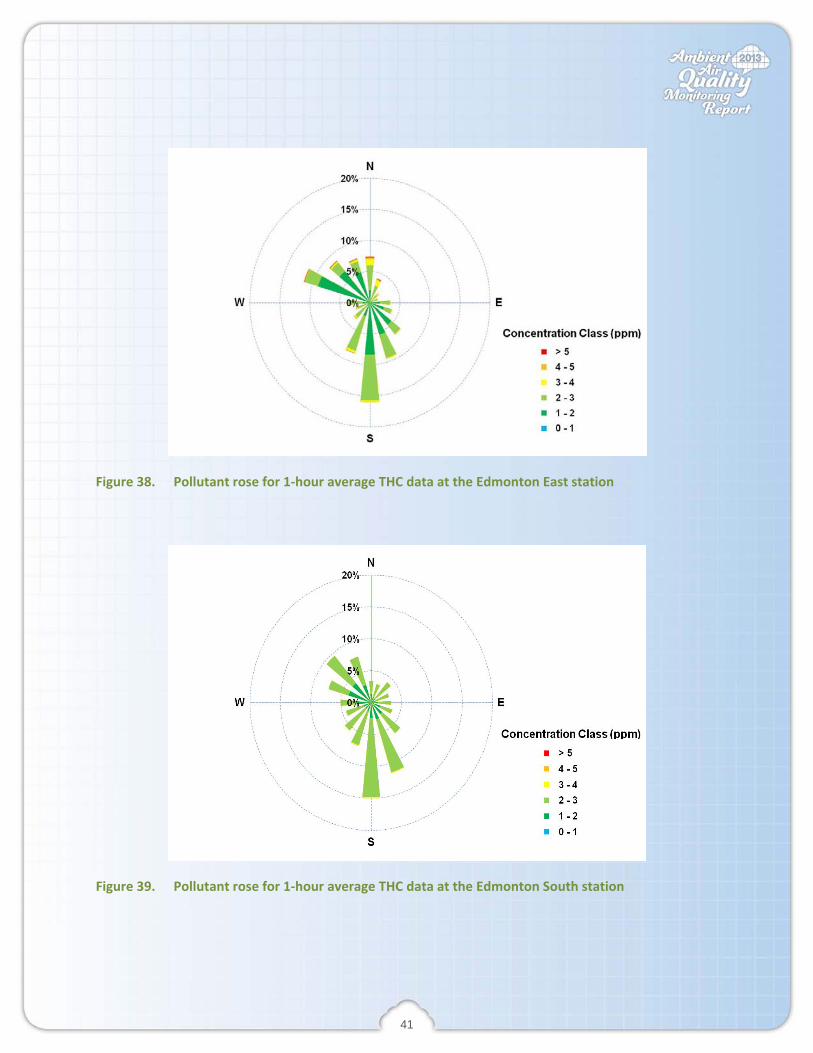
2.3.6 Hydrocarbons (THC, CH4, and NMHC) Hydrocarbons refer to a broad family of chemicals that contain carbon and hydrogen atoms. This includes a number of organic compounds. Sources of hydrocarbons include vegetation, natural biological processes, industrial emissions, transportation, and leisure activities. The total hydrocarbon analyzers employed in the ACA network are unable to differentiate individual hydrocarbon compounds and are limited to the total hydrocarbons (THC) and non‐methane hydrocarbons (NMHC). Currently, there is no ambient air quality objective in Alberta for these hydrocarbons. The typical background THC concentration in Alberta has been reported between 1.9 to 2.4 ppm. Table 13 presents the summary statistics for 1‐hour average concentrations for hydrocarbons. The annual average THC concentrations ranged between 2.0 ppm and 2.4 ppm. The maximum 1‐hour average concentration of 10.3 ppm was detected at the Edmonton East station, and the maximum 24‐hour average concentration of 5.2 ppm was detected at the Beverly station. Methane was the major component of THC for the ACA stations; non‐methane hydrocarbons (≤ 0.2 ppm annual average) only accounted for less than 10% of THC. Figures 35 to 39 present the pollutant roses for 1‐hour average THC. The pollutant roses indicate THC concentration in the ambient air predominantly ranged between 1 ppm to 3 ppm. The detailed pollutant data is presented in Appendix I: AMD Summary Tables. The concentration distribution tables indicate that greater than 99% of the time the 1‐hour average THC concentration was less than 3 ppm, with the exception of the Beverly station (92.5%) and the Edmonton East station (94%). Figures 40 and 41 present the pollutant roses for 1‐hour average CH4. Because CH4 is the major component of THC, the pollutant roses are similar to THC roses. CH4 concentrations primarily ranged between 1 ppm to 3 ppm. The concentration distribution tables (Appendix I: AMD Summary Tables) indicate that greater than 99% of the time the 1‐hour average CH4 concentration was less than 3 ppm. Figures 42 and 43 present the pollutant roses for 1‐hour average NMHC. The pollutant roses indicate that NHMC concentration in the ambient air was predominantly less than 1 ppm. The concentration distribution tables (Appendix I: AMD Summary Tables) indicate greater than 95% of the time the 1‐hour average NMHC concentration was less than 1 ppm. Figure 44 compares the annual average THC concentrations for thirty‐two (32) monitoring stations in Alberta. The annual average concentrations of the ACA monitoring stations were ranked the 4th, 14th, 15th, 18th and 26th places. The WBEA area detected the highest THC concentrations in the province.

39
Table 13. Summary statistics for 1‐hour average hydrocarbons for 2013
Species Monitoring Station
Annual Average
Instrument Uptime Time
Maximum Conc. and Occurrence Time
1‐hour Max. 24‐hour Max. ppm % ppm Time ppm Date
THC
Sherwood Park 2.2 99.9 4.8 Jan 04 10:00 3.1 Feb 07
Beverly 2.4 99.9 8.5 Feb 07 09:00 5.2 Feb 07
Edmonton Centre 2.0 97.7 3.9 Feb 07 19:00 2.9 Feb 07
Edmonton East 2.2 95.7 10.3 Jan 04 12:00 4.9 Jan 04
Edmonton South 2.2 99.6 4.3 Dec 01 08:00 3.2 Feb 07
CH4 Edmonton Centre 2.0 97.7% 3.8 Dec 01 07:00 2.6 Feb 07
Edmonton East 2.0 95.7% 7.3 Feb 07 10:00 3.6 Jan 04
NMHC Edmonton Centre <0.1 97.7 0.6 Feb 07 15:00 0.2 Feb 07
Edmonton East 0.2 95.7 4.9 Jun 19 03:00 1.2 Feb 07
0%
5%
10%
15%
20%North
East
South
West
> 54 - 53 - 42 - 31 - 20 - 1
Concentration Class (ppm)
Figure 35. Pollutant rose for 1‐hour average THC data at the Sherwood Park station
40
0%
5%
10%
15%
20%North
East
South
West
> 54 - 53 - 42 - 31 - 20 - 1
Concentration Class (ppm)
Figure 36. Pollutant rose for 1‐hour average THC data at the Beverly station
Figure 37. Pollutant rose for 1‐hour average THC data at the Edmonton Centre station (analyzed using wind data from the Edmonton East station)
41
Figure 38. Pollutant rose for 1‐hour average THC data at the Edmonton East station
Figure 39. Pollutant rose for 1‐hour average THC data at the Edmonton South station
42
0%
5%
10%
15%
20%N
E
S
W
> 54 - 53 - 42 - 31 - 20 - 1
Concentration Class (ppm)
Calm (<1 km/hr) =0.0%
Figure 40. Pollutant rose for 1‐hour average CH4 data at the Edmonton Centre station (analyzed using wind data from the Edmonton East station)
0%
5%
10%
15%
20%N
E
S
W
> 54 - 53 - 42 - 31 - 20 - 1
Concentration Class (ppm)
Figure 41. Pollutant rose for 1‐hour average CH4 data at the Edmonton East station

43
Figure 42. Pollutant rose for 1‐hour average NMHC data at the Edmonton Centre station (analyzed using wind data from the Edmonton East station)
Figure 43. Pollutant rose for 1‐hour average NMHC data at the Edmonton East station

44
0 1 2 3 4
Shell Muskeg River (WBEA)
Millennium Mine (WBEA)
Barge Landing (WBEA)
Beverly (SIA)
Lower Camp (WBEA)
Mildred Lake (WBEA)
Violet Grove (WCAS)
CNRL Horizon (WBEA)
Mannix (WBEA)
Fort McKay South (WBEA)
Cold Lake South (LICA)
Maskwa (LICA)
Buf falo Viewpoint (WBEA)
Edmonton East (AESRD)
Edmonton South (AESRD)
Crescent Heights (PAS)
Red Deer - Riverside (PAMZ)
Sherwood Park (SIA)
Bruderheim (FAP)
St. Lina (LICA)
Range Road 220 (FAP)
Grande Prairie (Henry Pirker) …
Calgary Central 2 (CRAZ)
Caroline (PAMZ)
Fort McKay (WBEA)
Edmonton Centre (AESRD)
Anzac (WBEA)
Fort McMurray-Athabasca …
Fort McMurray-Patricia …
Calgary Northwest (CRAZ)
Lethbridge (AESRD)
Fort Saskatchewan-92 St and …
THC parts per million (ppm)
Figure 44. Annual average concentrations for THC for the Province of Alberta

45
2.3.7 Particulate Matter (PM2.5 and PM10) Airborne particulates are tiny pieces of solid or liquid matter suspended in the atmosphere. Respirable particulates are fine particles that have the potential to affect human health. Particles with aerodynamic diameters between 2.5 and 10 micrometers are generally removed from inspired air in the nose and throat. Particles that are smaller than 2.5 micrometers (PM2.5) can penetrate into the lungs and are generally referred to as respirable or fine particulate matter. Particles that are between 2.5 microns and 10 microns are generally referred to as inhalable or coarse particulate matters. The total mass concentration of the fine and coarse portions is referred to PM10, or particulate matter smaller than 10 microns aerodynamic diameter. These particles may originate from soil, road dust, agricultural dust, smoke, forest fires, traffic emissions, and industrial sources. Alberta does not have an ambient air quality objective for PM10. The current AAAQO for PM2.5 is:
• 24‐hr average AAAQO = 30 μg/m3 Table 14 presents the summary statistics for 1‐hour average concentrations for particulate matter. The annual average PM2.5 concentrations ranged between 6 µg/m
3 and 11 µg/m3. The maximum 1‐hour average concentration of 449 µg/m3 and the maximum 24‐hour average concentration of 76 µg/m3 were both detected at the Edmonton East station. The ACA network monitors PM10 at the Edmonton South station. The annual average PM10 concentration was 13 µg/m3. Both the maximum 1‐hour average (136 µg/m3) and the maximum 24‐hour average (54 µg/m3) were detected on May 6, 2013. Table 15 summarizes the number of exceedances for the year of 2013. There were twenty‐five (25) exceedance events for 24‐hour PM2.5 for the ACA monitoring program. The PM2.5 exceedance events were primarily recorded in the winter, with the exception of three (3) exceedances in May and two (2) in August. The winter exceedances could be associated with impaired dispersion conditions when the atmosphere was stable, such as during a temperature inversion. Figures 45 to 48 present pollutant roses for 1‐hour average PM2.5. The pollutant roses indicate PM2.5 concentration in the ambient air was predominantly less than 20 µg/m3 at all stations. The detailed pollutant data is presented in Appendix I: AMD Summary Tables. The concentration distribution tables indicate that greater than 90% of the time PM2.5 concentration was less than 20 µg/m
3. Figure 49 presents a pollutant rose for 1‐hour average PM10. The pollutant rose indicates PM10 concentration in the ambient air was predominantly less than 30 µg/m3. The concentration distribution table for PM10 indicates that 91.6% of the time, the 1‐hour average PM10 concentration was less than 30 µg/m
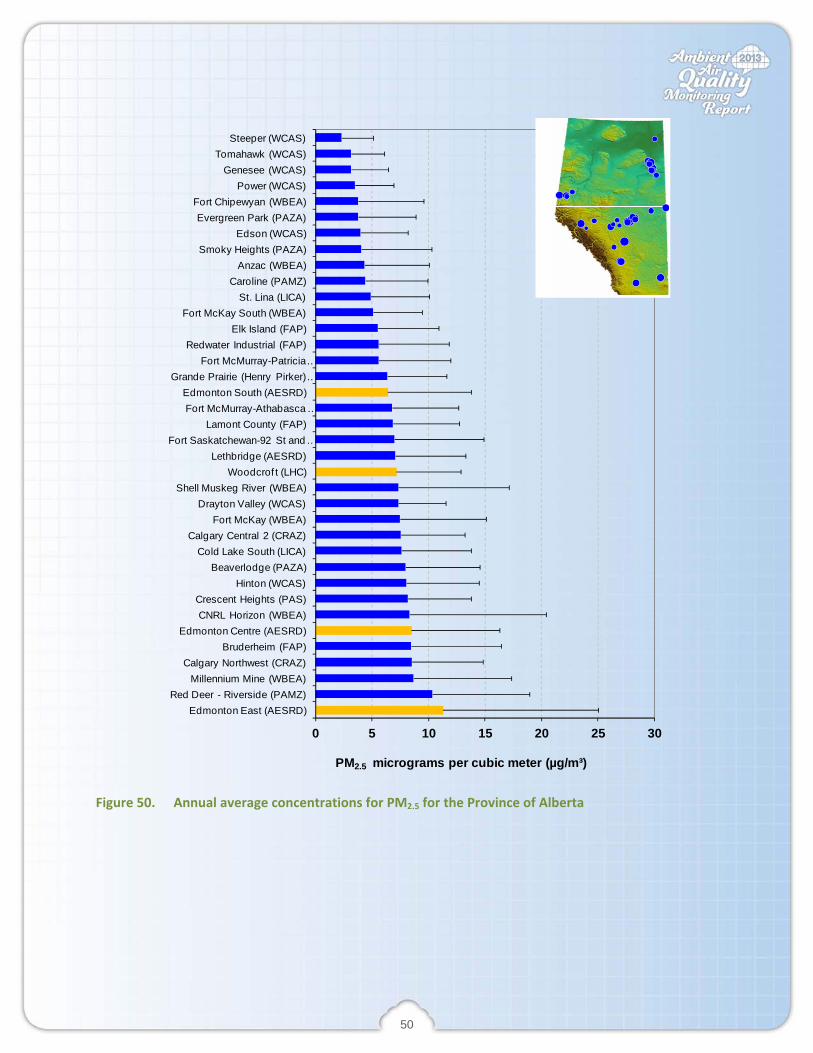
3. Figure 50 compares the annual average PM2.5 concentrations for thirty‐seven (37) monitoring stations in Alberta. The annual average concentrations of the ACA monitoring stations were ranked the 1st, 6th, 16th, and 21st places.

46
Table 14. Summary statistics for 1‐hour average concentration for particulate matter for 2013
PM Size Monitoring Station
Annual Average
Instrument Uptime Time
Maximum PM Conc. and Occurrence Time
1‐hour Max. 24‐hour Max.
μg/m3 % μg/m3 Time μg/m3 Date
PM2.5
Woodcroft 7 97.9 73 Sep 21 11:00 22 Nov 29
Edmonton Centre 8 93.7 97 Feb 07 18:00 54 Feb 07
Edmonton East 11 98.9 449 May 20 12:00 76 May 21
Edmonton South 6 89.5 63 Mar 28 08:00 41 Mar 28
PM10 Edmonton South 13 99.3 136 May 06 23:00 54 May 06
Table 15. Number of exceedance events for PM2.5 for 2013
Monitoring Station No. of Exceedances to Alberta Ambient Air Quality Objectives (AAAQO)
24‐hr AAAQO 30 μg/m3
Woodcroft 0
Edmonton Centre 6
Edmonton East 14
Edmonton South 5
47
0%
5%
10%
15%
20%N
E
S
W
> 3020 - 3010 - 205 - 101 - 50 - 1
Concentration Class (ug/m3)
Figure 45. Pollutant rose for 1‐hour average PM2.5 data at the Woodcroft station
Figure 46. Pollutant rose for 1‐hour average PM2.5 data at the Edmonton Centre station
(analyzed using wind data from the Edmonton East station)

48
Figure 47. Pollutant rose for 1‐hour average PM2.5 data at the Edmonton East station
Figure 48. Pollutant rose for 1‐hour average PM2.5 data at the Edmonton South station

49
Figure 49. Pollutant rose for 1‐hour average PM10 data at the Edmonton South station
50
0 5 10 15 20 25 30
Edmonton East (AESRD)Red Deer - Riverside (PAMZ)
Millennium Mine (WBEA)Calgary Northwest (CRAZ)
Bruderheim (FAP)Edmonton Centre (AESRD)
CNRL Horizon (WBEA)Crescent Heights (PAS)
Hinton (WCAS)Beaverlodge (PAZA)
Cold Lake South (LICA)Calgary Central 2 (CRAZ)
Fort McKay (WBEA)Drayton Valley (WCAS)
Shell Muskeg River (WBEA)Woodcrof t (LHC)
Lethbridge (AESRD)Fort Saskatchewan-92 St and …
Lamont County (FAP)Fort McMurray-Athabasca …Edmonton South (AESRD)
Grande Prairie (Henry Pirker) …Fort McMurray-Patricia …
Redwater Industrial (FAP)Elk Island (FAP)
Fort McKay South (WBEA)St. Lina (LICA)
Caroline (PAMZ)Anzac (WBEA)
Smoky Heights (PAZA)Edson (WCAS)
Evergreen Park (PAZA)Fort Chipewyan (WBEA)
Power (WCAS)Genesee (WCAS)
Tomahawk (WCAS)Steeper (WCAS)
PM2.5 micrograms per cubic meter (µg/m³)
Figure 50. Annual average concentrations for PM2.5 for the Province of Alberta
51
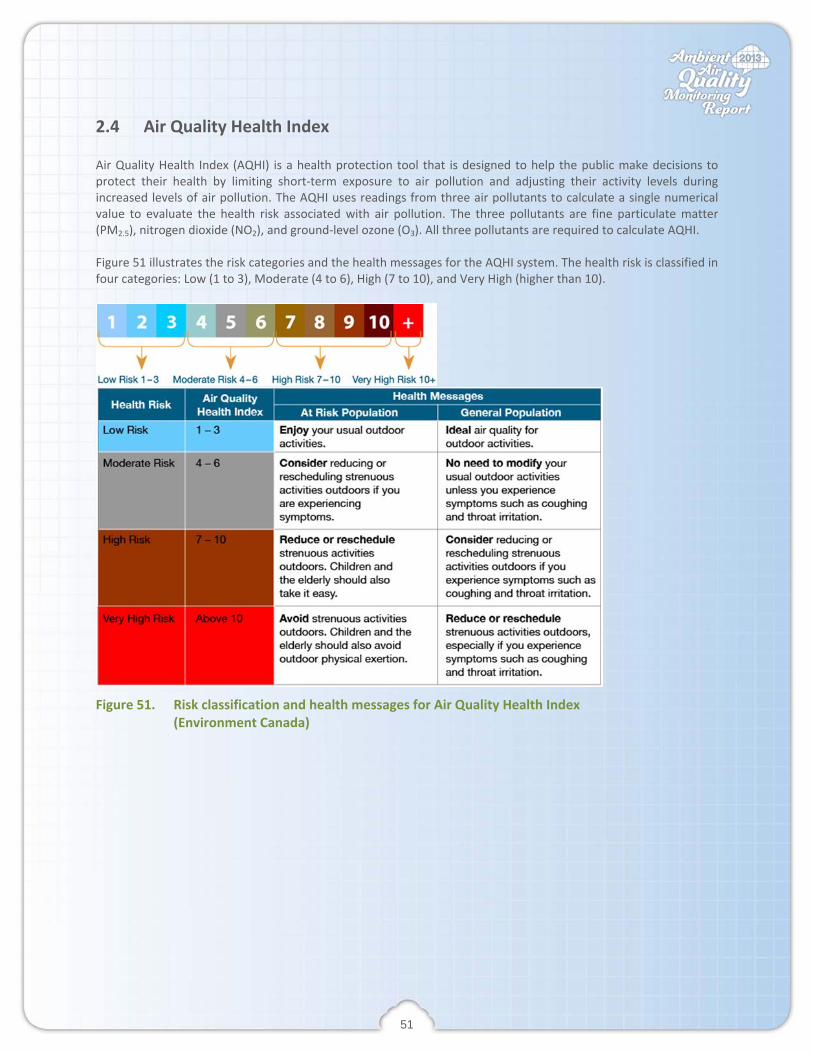
2.4 Air Quality Health Index Air Quality Health Index (AQHI) is a health protection tool that is designed to help the public make decisions to protect their health by limiting short‐term exposure to air pollution and adjusting their activity levels during increased levels of air pollution. The AQHI uses readings from three air pollutants to calculate a single numerical value to evaluate the health risk associated with air pollution. The three pollutants are fine particulate matter (PM2.5), nitrogen dioxide (NO2), and ground‐level ozone (O3). All three pollutants are required to calculate AQHI. Figure 51 illustrates the risk categories and the health messages for the AQHI system. The health risk is classified in four categories: Low (1 to 3), Moderate (4 to 6), High (7 to 10), and Very High (higher than 10).
Figure 51. Risk classification and health messages for Air Quality Health Index
(Environment Canada)

52
Figure 52 compares the AQHI rating among the communities in Alberta. For the City of Edmonton, the ambient air quality was rated Low Risk for 81% of the time; 18% was rated Moderate Risk, 0.7% was rated High Risk, and 0.1% was rated Very High Risk. The Very High Risk rating occurred on May 20, May 21, May 22, and October 25. These Very High Risk events were characterized by a high concentration of fine particulate matter (>250 μg/m3). In Alberta, the High Risk and Very High Risk ratings were primarily recorded in the population centres and Wood Buffalo area. Edmonton recorded the highest percentage of time in the Very High, High and Moderate Risk categories.
Figure 52. Summary of AQHI ratings for Alberta municipalities for 2013

53
2.5 Air Quality for Canadian Cities The air quality for the twenty most populated metropolitans in Canada are compared for SO2, NO2, CO, O3, PM2.5
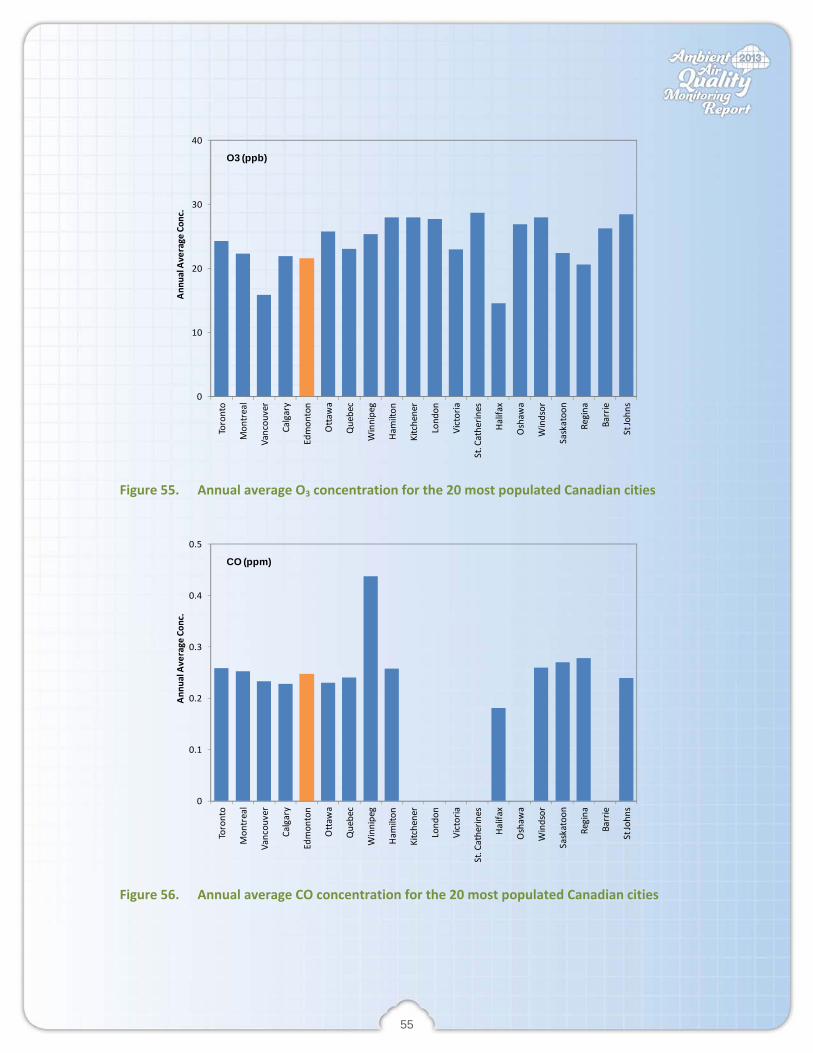
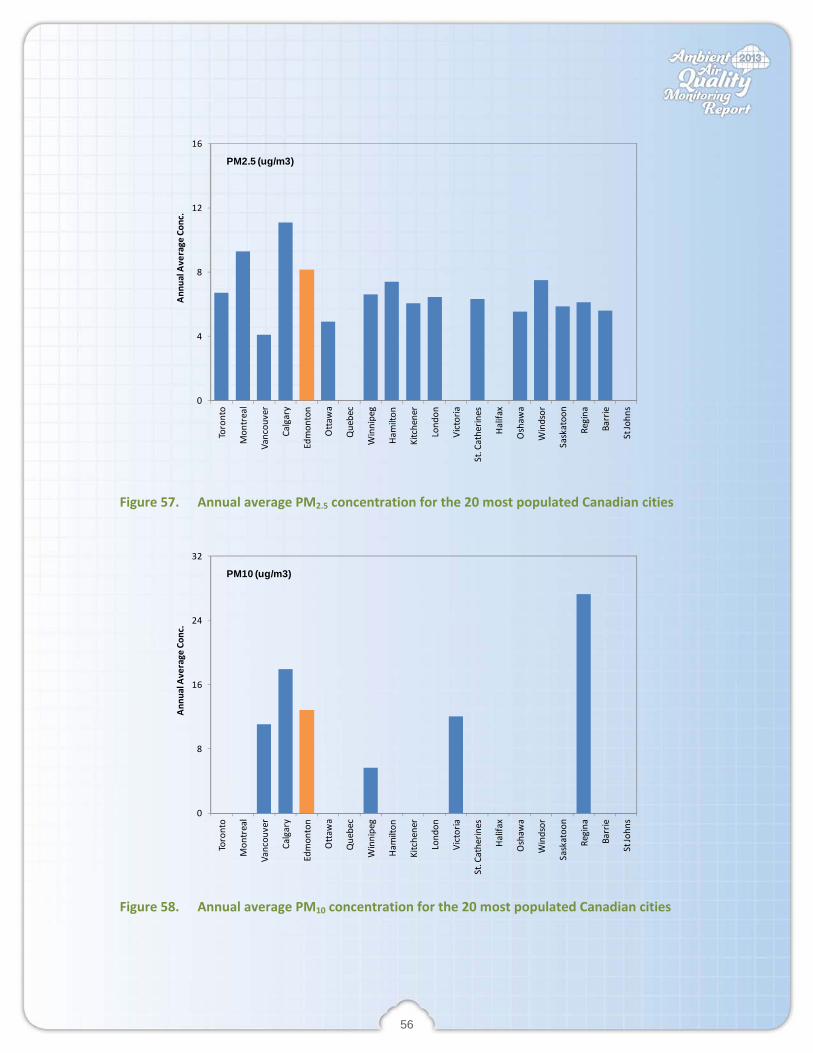
and PM10 using the NAPS database (NAPS, 2012). It should be noted that the land use types and the number of the stations in the database vary among the cities. The comparison is based on the available data, and is not intended to justify the quality of air among the cities. Figures 53 to 58 compare the annual average concentration for the cities. The bar charts are arranged in a descending order by city population from left to right. An empty bar indicates the city does not have data in the NAPS database. Figure 53 compares the annual average concentration for SO2. The annual averages ranged from 0.2 to 4.3 ppb. The annual average SO2 concentration in Edmonton (0.8 ppb) was ranked 8th. The three highest concentrations were recorded at Hamilton (4.3 ppb), Windsor (2.8 ppb), and Halifax (2.2 ppb). Figure 54 compares the annual average concentration for NO2. The annual averages ranged from 5.6 to 15.2 ppb. The annual average NO2 concentration in Edmonton (13.9 ppb) was ranked 3rd. The two highest concentrations were recorded at Vancouver (15.2 ppb) and Toronto (14.7 ppb). Figure 55 compares the annual average concentration for O3. The annual averages ranged from 14.6 to 28.7 ppb. The annual average O3 concentration in Edmonton (21.6 ppb) was ranked 17th. The three highest concentrations were recorded at St. Catherines (28.7 ppb), St. Johns (28.5 ppb), and Windsor (28.0 ppb). Figure 56 compares the annual average concentration for CO. The annual averages ranged from 0.18 to 0.44 ppm. The annual average CO concentration in Edmonton (0.25 ppm) was ranked 8th. The three highest concentrations were recorded at Winnipeg (0.44 ppm), Regina (0.28 ppm), and Saskatoon (0.27 ppm). Figure 57 compares the annual average concentration for PM2.5. The annual averages ranged from 4.1 to 11.1 µg/m3. The annual average PM2.5 concentration in Edmonton (8.2 µg/m3) was ranked 3rd. The two highest concentrations were recorded at Calgary (11.1 µg/m3) and Montreal (9.3 µg/m3). Figure 58 compares the annual average concentration for PM10. Only six cities reported PM10 data to NAPS. The annual averages ranged from 5.6 to 27.3 µg/m3. The annual average PM10 concentration in Edmonton (12.8 µg/m3) was ranked 3rd. The two highest concentrations were recorded at Regina (27.3 µg/m3) and Calgary (17.9 µg/m3).

54
0
1
2
3
4
5
Toronto
Mon
treal
Vancou
ver
Calgary
Edmon
ton
Ottaw
a
Quebec
Winnipeg
Ham
ilton
Kitchener
Lond
on
Victoria
St. Catherin
es
Halifax
Oshaw
a
Windsor
Saskatoo
n
Regina
Barrie
St John
s
Ann
ual A
verage
Con
c.
SO2 (ppb)
Figure 53. Annual average SO2 concentration for the 20 most populated Canadian cities
0
5
10
15
20
Toronto
Mon
treal
Vancou
ver
Calgary
Edmon
ton
Ottaw
a
Quebec
Winnipeg
Ham
ilton
Kitchener
Lond
on
Victoria
St. Catherin
es
Halifax
Oshaw
a
Windsor
Saskatoo
n
Regina
Barrie
St John
s
Ann
ual A
verage
Con
c.
NO2 (ppb)
Figure 54. Annual average NO2 concentration for the 20 most populated Canadian cities
55
0
10
20
30
40
Toronto
Mon
treal
Vancou
ver
Calgary
Edmon
ton
Ottaw
a
Quebec
Winnipeg
Ham
ilton
Kitchener
Lond
on
Victoria
St. Catherin
es
Halifax
Oshaw
a
Windsor
Saskatoo
n
Regina
Barrie
St John
s
Ann
ual A
verage
Con
c.
O3 (ppb)
Figure 55. Annual average O3 concentration for the 20 most populated Canadian cities
0
0.1
0.2
0.3
0.4
0.5
Toronto
Mon
treal
Vancou
ver
Calgary
Edmon
ton
Ottaw
a
Quebec
Winnipeg
Ham
ilton
Kitchener
Lond
on
Victoria
St. Catherin
es
Halifax
Oshaw
a
Windsor
Saskatoo
n
Regina
Barrie
St John
s
Ann
ual A
verage
Con
c.
CO (ppm)
Figure 56. Annual average CO concentration for the 20 most populated Canadian cities
56
0
4
8
12
16
Toronto
Mon
treal
Vancou
ver
Calgary
Edmon
ton
Ottaw
a
Quebec
Winnipeg
Ham
ilton
Kitchener
Lond
on
Victoria
St. Catherin
es
Halifax
Oshaw
a
Windsor
Saskatoo
n
Regina
Barrie
St John
s
Ann
ual A
verage
Con
c.
PM2.5 (ug/m3)
Figure 57. Annual average PM2.5 concentration for the 20 most populated Canadian cities
0
8
16
24
32
Toronto
Mon
treal
Vancou
ver
Calgary
Edmon
ton
Ottaw
a
Quebec
Winnipeg
Ham
ilton
Kitchener
Lond
on
Victoria
St. Catherin
es
Halifax
Oshaw
a
Windsor
Saskatoo
n
Regina
Barrie
St John
s
Ann
ual A
verage
Con
c.
PM10 (ug/m3)
Figure 58. Annual average PM10 concentration for the 20 most populated Canadian cities
57
2.6 Passive Sample Summary Passives samples are a measure of loadings accumulated over a pre‐determined exposure period. The adsorbed analytes are extracted and analyzed in a laboratory, and calculated to the concentrations in the air. For passive samples, Alberta regulates SO2 only. The current AAAQO for passive SO2 is:
• 30‐day average AAAQO = 11 ppb
The ACA Passive Network consists of six stations monitoring 30‐day averages for SO2, NO2, and O3. In 2013, a total of seventy two (72) samples were collected for SO2, NO2, and O3. There were no sample failures. Table 16 summarizes the annual average and maximum 30‐day concentrations for 2013. Figure 59 presents a time‐course chart for 30‐day average concentration for passive SO2 samples. The 30‐day average concentrations ranged between <1 ppb and 4 ppb. There was no exceedance of the 30‐day average AAAQO in 2013. There was no clear temporal trend or spatial trend detected in the passive monitoring network. Figure 60 presents a time‐course chart for 30‐day average concentration for passive NO2 samples. The measured concentrations ranged between 1.5 ppb and 21.9 ppb. A seasonal trend for NO2 seems to be existent. A higher concentration tended to occur in the winter months. The trend could be associated with the atmospheric conditions. In winter when the air temperature is colder, air pollutants tend to stay longer and accumulate to a higher concentration. In addition, there is a higher chance of forming a thermal inversion layer on cold winter days. Thermal inversion limits atmospheric mixing and caps air pollutants near the ground, forming a higher concentration at the ground level. Figure 61 presents a time‐course chart for 30‐day average concentration for passive O3 samples. The measurements ranged between 10 ppb to 39 ppb. The chart indicates O3 concentration tended to be higher during the spring months. The concentration of ground‐level ozone is the net result of atmospheric formation, transport, and destruction processes. Some research for the Edmonton Capital Region suggests intrusion of ozone from the stratosphere could be an important source of ground‐level ozone. During spring and summer, vertical mixing is stronger and may promote downward propagation of upper air ozone to the ground. However, the Ground‐Level Ozone in Alberta (AESRD, 1999) report suggests that there were split opinions for relative importance of contributions from upper air intrusion, local photochemistry, and the medium and long‐range transport.

58
Table 16. Annual average concentrations for passive SO2, NO2, and O3 for 2013
Pollutant Species Data Type
Average Concentration for 30‐Day Passive Samples (ppb)
Site 1 Site 2 Site 3 Site 4 Site 5 Site 6
SO2 Annual Avg. 1 2 1 2 2 1
Highest 30‐Day Conc. 2 2 2 4 3 2
NO2 Annual Avg. 9.0 8.7 7.6 6.5 8.0 7.5
Highest 30‐Day Conc. 21.9 17.4 20.6 16.3 14.9 16.6
O3 Annual Avg. 24 22 27 25 24 24
Highest 30‐Day Conc. 36 34 35 38 33 39
0
1
2
3
4
Site 1 Site 2 Site 3 Site 4 Site 5 Site 6
SO2Co
ncen
tration (p
pb)
January February March AprilMay June July AugustSeptember October November December
Alberta Ambient Air Quality Objective - 30‐Day Objective for Passive SO2 is 11 ppb
Figure 59. 30‐Day passive SO2 sampling results for 2013

59
0
10
20
30
40
Site 1 Site 2 Site 3 Site 4 Site 5 Site 6
NO
2Co
ncen
tration (p
pb)
January February March AprilMay June July AugustSeptember October November December
Alberta Ambient Air Quality Objective - No 30‐Day Objective for NO2
Figure 60. 30‐Day passive NO2 sampling results for 2013
0
10
20
30
40
50
60
70
Site 1 Site 2 Site 3 Site 4 Site 5 Site 6
O3Co
ncen
tration (p
pb)
January February March AprilMay June July AugustSeptember October November December
Alberta Ambient Air Quality Objective - No 30-Day Objective for O3
Figure 61. 30‐Day passive O3 sampling results for 2013

60
2.7 Intermittent Particulate Sample Summary The ACA air monitoring network measures intermittent PM2.5 samples at four stations: Sherwood Park, Gold Bar, Beverly, and Woodcroft. In addition, the Woodcroft station also measures PM10 and total suspended particulate (TSP). The sampling program follows the NAPS sampling schedule. A 24‐hour intermittent sample was collected every six days throughout the year. In 2013, there were sixty one (61) sampling days, resulting in a total of one hundred eighty three (183) samples. There were three (3) failure samples at the Sherwood Park station. A total of one hundred eighty (180) valid samples were collected. Table 17 presents summary statistics for 24‐hour average concentrations for the ACA intermittent particulate monitoring program. There was no significant difference for the annual average PM2.5
concentrations among the four stations. The maximum 24‐hour average concentration was detected on November 6, 2013 at the Sherwood Park station. Figures 62 and 63 present the time‐course chart for 24‐hour average concentrations for 2013. Table 18 summarizes the number of exceedances for the year of 2013. There were three (3) PM2.5 exceedance events detected on March 29, 2013 at the Sherwood Park, Gold Bar, and Beverly stations, attributed to a winter temperature inversion in the region. There was one (1) PM2.5 exceedance event at the Sherwood Park station on November 6, 2012. There were four (4) exceedance events for 24‐hr average TSP at the Woodcroft station. These exceedances were primarily due to construction activities in the nearby gravel parking lot.
Table 17. Summary statistics for 24‐hour average intermittent particulate samples for 2013
Monitoring Station
Size Fraction
Annual Geometric Average
Annual Arithmetic Average
Maximum 24‐hr Average PM Concentration
μg/m3 μg/m3 μg/m3 Occurrence Date
Sherwood Park PM2.5 7 8 41 Nov 06
Gold Bar PM2.5 7 9 38 Mar 29
Beverly PM2.5 7 8 34 Mar 29
Woodcroft PM2.5 6 7 25 Jan 04
PM10 19 25 118 May 22
TSP 31 41 132 May 22

61
Table 18. Number of exceedance events for intermittent PM2.5 and TSP samples for 2013
Monitoring Station No. of Exceedances to Alberta Ambient Air Quality Objectives (AAAQO)
PM2.5 24‐hr AAAQO TSP 24‐hr AAAQO 30 μg/m3 100 μg/m3
Sherwood Park 2 ‐
Gold Bar 1 ‐
Beverly 1 ‐
Woodcroft 0 4

62
0
15
30
45
PM2.5Co
ncen
tration (ug/m
3 )
Sample Date
Sherwood Park
Gold Bar
Beverly
Woodcroft
Figure 62. 24‐Hour average PM2.5 concentrations for 2013
0
50
100
150
200
Particulate Co
ncentration (ug/m
3 )
Sampling Date
TSPAAAQO for TSPPM10
Figure 63. 24‐Hour average TSP and PM10 concentrations at the Woodcroft Station
AAAQO for PM2.5
63
Appendix I
Summary for Continuous Monitoring Data (AMD Summary Tables)

A1.1
PART 1. Sherwood Park Station

AI-1-1
Table I‐1 Sherwood Park Station: Summary statistics for continuous air monitoring results for 2013
Parameter Unit Calibration & AIC Valid Data Uptime Summary Statistics for Hourly Average Data
(hours) (hours) (%) Average Minimum Maximum
SO2 ppb 482 8273 99.9% 1 < 1 68
H2S ppb 473 8282 99.9% 1 < 1 6
NO ppb 504 8232 99.7% 4.2 < 0.1 263.4
NO2 ppb 504 8232 99.7% 11.4 0 79.3
NOx ppb 504 8232 99.7% 15.3 < 0.1 342.1
THC ppm 474 8277 99.9% 2.2 1.6 4.8
Ambient Temp. °C 0 8759 100.0% 5.2 ‐28 34.4
Wind Speed km/hr 0 8755 99.9% 7.7 Calm 35.5
AI-1-2
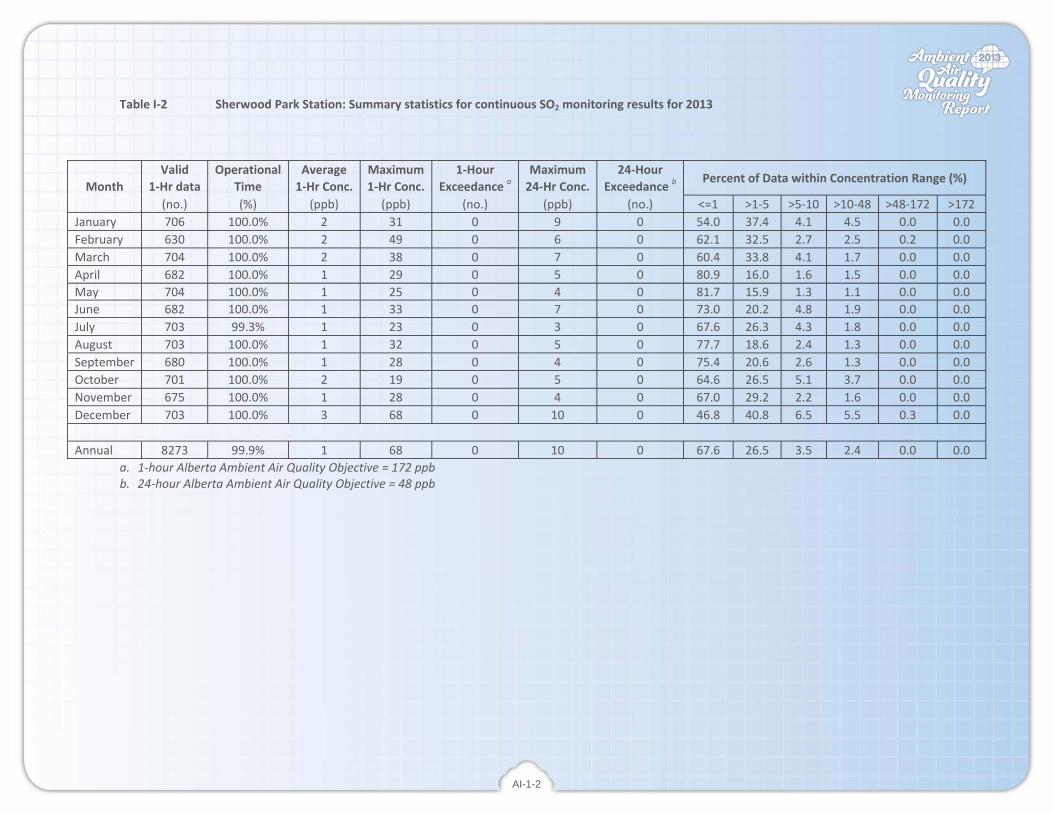
Table I‐2 Sherwood Park Station: Summary statistics for continuous SO2 monitoring results for 2013
Valid Operational Average Maximum 1‐Hour Maximum 24‐Hour Percent of Data within Concentration Range (%)
Month 1‐Hr data Time 1‐Hr Conc. 1‐Hr Conc. Exceedance a 24‐Hr Conc. Exceedance b (no.) (%) (ppb) (ppb) (no.) (ppb) (no.) <=1 >1‐5 >5‐10 >10‐48 >48‐172 >172
January 706 100.0% 2 31 0 9 0 54.0 37.4 4.1 4.5 0.0 0.0 February 630 100.0% 2 49 0 6 0 62.1 32.5 2.7 2.5 0.2 0.0 March 704 100.0% 2 38 0 7 0 60.4 33.8 4.1 1.7 0.0 0.0 April 682 100.0% 1 29 0 5 0 80.9 16.0 1.6 1.5 0.0 0.0 May 704 100.0% 1 25 0 4 0 81.7 15.9 1.3 1.1 0.0 0.0June 682 100.0% 1 33 0 7 0 73.0 20.2 4.8 1.9 0.0 0.0 July 703 99.3% 1 23 0 3 0 67.6 26.3 4.3 1.8 0.0 0.0 August 703 100.0% 1 32 0 5 0 77.7 18.6 2.4 1.3 0.0 0.0 September 680 100.0% 1 28 0 4 0 75.4 20.6 2.6 1.3 0.0 0.0 October 701 100.0% 2 19 0 5 0 64.6 26.5 5.1 3.7 0.0 0.0 November 675 100.0% 1 28 0 4 0 67.0 29.2 2.2 1.6 0.0 0.0 December 703 100.0% 3 68 0 10 0 46.8 40.8 6.5 5.5 0.3 0.0 Annual 8273 99.9% 1 68 0 10 0 67.6 26.5 3.5 2.4 0.0 0.0
a. 1‐hour Alberta Ambient Air Quality Objective = 172 ppb b. 24‐hour Alberta Ambient Air Quality Objective = 48 ppb

AI-1-3
Table I‐3 Sherwood Park Station: Summary of continuous H2S monitoring results for 2013
Valid Operational Average Maximum 1‐Hour Maximum 24‐Hour Percent of Data within Concentration Range (%)
Month 1‐Hr data Time 1‐Hr Conc. 1‐Hr Conc. Exceedance a 24‐Hr Conc. Exceedanceb (no.) (%) (ppb) (ppb) (no.) (ppb) (no.) <=1 >1‐3 >3‐5 >5‐8 >8‐10 >10
January 706 100.0% 1 6 0 3 0 75.5 21.1 2.3 1.1 0.0 0.0 February 635 100.0% < 1 4 0 1 0 94.8 4.9 0.3 0.0 0.0 0.0 March 704 100.0% < 1 2 0 1 0 97.4 2.6 0.0 0.0 0.0 0.0 April 682 100.0% < 1 2 0 < 1 0 99.7 0.3 0.0 0.0 0.0 0.0 May 704 100.0% < 1 2 0 1 0 98.2 1.8 0.0 0.0 0.0 0.0June 682 100.0% < 1 5 0 1 0 84.0 15.5 0.4 0.0 0.0 0.0 July 702 99.3% 1 6 0 1 0 88.2 10.8 0.6 0.4 0.0 0.0 August 703 100.0% 1 5 0 1 0 84.1 15.2 0.7 0.0 0.0 0.0 September 680 100.0% 1 3 0 1 0 68.2 31.5 0.3 0.0 0.0 0.0 October 701 100.0% 1 3 0 2 0 33.5 66.5 0.0 0.0 0.0 0.0 November 680 100.0% 1 4 0 2 0 44.4 55.3 0.3 0.0 0.0 0.0 December 703 100.0% 1 3 0 1 0 54.3 45.7 0.0 0.0 0.0 0.0 Annual 8282 99.9% 1 6 0 3 0 76.8 22.7 0.4 0.1 0.0 0.0
a. 1‐hour Alberta Ambient Air Quality Objective = 10 ppb b. 24‐hour Alberta Ambient Air Quality Objective = 3 ppb
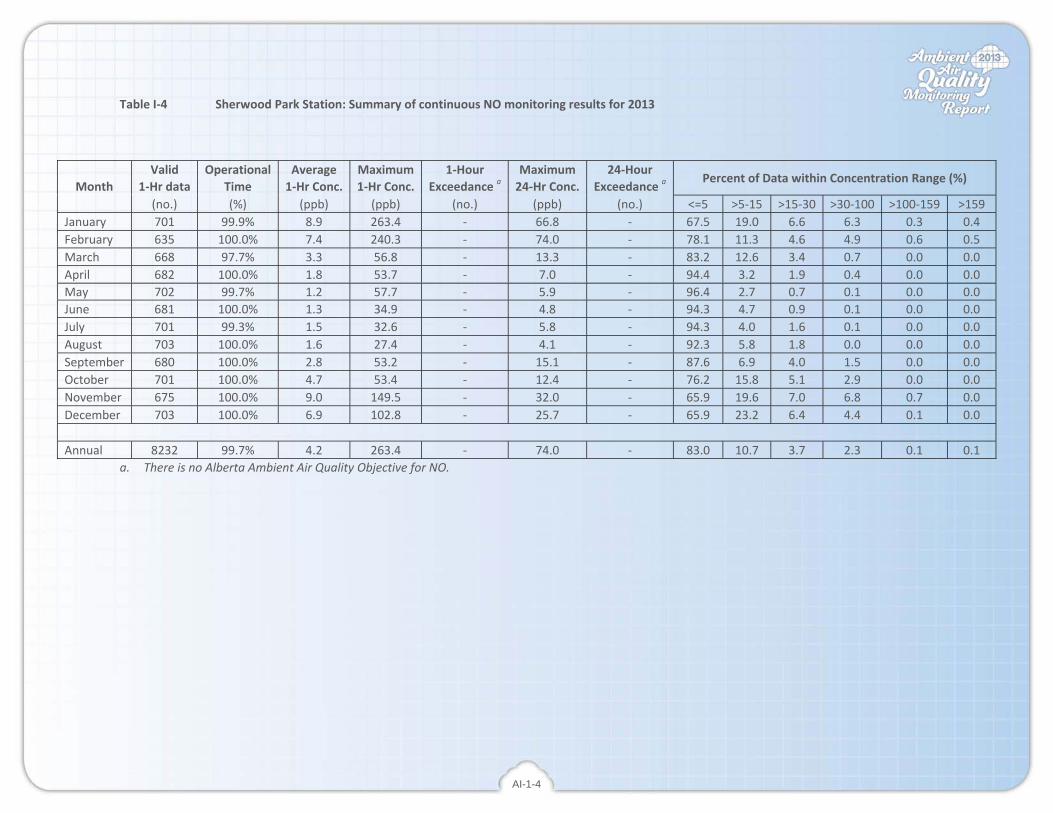
AI-1-4
Table I‐4 Sherwood Park Station: Summary of continuous NO monitoring results for 2013
Valid Operational Average Maximum 1‐Hour Maximum 24‐Hour Percent of Data within Concentration Range (%)
Month 1‐Hr data Time 1‐Hr Conc. 1‐Hr Conc. Exceedance a 24‐Hr Conc. Exceedance a (no.) (%) (ppb) (ppb) (no.) (ppb) (no.) <=5 >5‐15 >15‐30 >30‐100 >100‐159 >159
January 701 99.9% 8.9 263.4 ‐ 66.8 ‐ 67.5 19.0 6.6 6.3 0.3 0.4 February 635 100.0% 7.4 240.3 ‐ 74.0 ‐ 78.1 11.3 4.6 4.9 0.6 0.5 March 668 97.7% 3.3 56.8 ‐ 13.3 ‐ 83.2 12.6 3.4 0.7 0.0 0.0 April 682 100.0% 1.8 53.7 ‐ 7.0 ‐ 94.4 3.2 1.9 0.4 0.0 0.0 May 702 99.7% 1.2 57.7 ‐ 5.9 ‐ 96.4 2.7 0.7 0.1 0.0 0.0June 681 100.0% 1.3 34.9 ‐ 4.8 ‐ 94.3 4.7 0.9 0.1 0.0 0.0 July 701 99.3% 1.5 32.6 ‐ 5.8 ‐ 94.3 4.0 1.6 0.1 0.0 0.0 August 703 100.0% 1.6 27.4 ‐ 4.1 ‐ 92.3 5.8 1.8 0.0 0.0 0.0 September 680 100.0% 2.8 53.2 ‐ 15.1 ‐ 87.6 6.9 4.0 1.5 0.0 0.0 October 701 100.0% 4.7 53.4 ‐ 12.4 ‐ 76.2 15.8 5.1 2.9 0.0 0.0 November 675 100.0% 9.0 149.5 ‐ 32.0 ‐ 65.9 19.6 7.0 6.8 0.7 0.0 December 703 100.0% 6.9 102.8 ‐ 25.7 ‐ 65.9 23.2 6.4 4.4 0.1 0.0 Annual 8232 99.7% 4.2 263.4 ‐ 74.0 ‐ 83.0 10.7 3.7 2.3 0.1 0.1
a. There is no Alberta Ambient Air Quality Objective for NO.

AI-1-5
Table I‐5 Sherwood Park Station: Summary of continuous NO2 monitoring results for 2013
Valid Operational Average Maximum 1‐Hour Maximum 24‐Hour Percent of Data within Concentration Range (%)
Month 1‐Hr data Time 1‐Hr Conc. 1‐Hr Conc. Exceedance a 24‐Hr Conc. Exceedance b (no.) (%) (ppb) (ppb) (no.) (ppb) (no.) <=5 >5‐15 >15‐30 >30‐100 >100‐159 >159
January 701 99.9% 18.0 79.3 0 43.6 ‐ 7.0 45.1 30.0 18.0 0.0 0.0 February 635 100.0% 16.4 66.9 0 38.1 ‐ 12.0 43.8 28.2 16.1 0.0 0.0 March 668 97.7% 13.0 56.1 0 26.2 ‐ 17.7 52.1 21.9 8.4 0.0 0.0 April 682 100.0% 8.5 52.7 0 18.4 ‐ 48.2 36.1 11.4 4.3 0.0 0.0 May 702 99.7% 6.5 38.7 0 11.7 ‐ 57.1 33.5 8.1 1.3 0.0 0.0June 681 100.0% 5.8 32.3 0 12.7 ‐ 54.2 42.9 2.8 0.1 0.0 0.0 July 701 99.3% 5.5 23.8 0 10.5 ‐ 57.8 38.9 3.3 0.0 0.0 0.0 August 703 100.0% 6.3 28.3 0 11.7 ‐ 53.2 39.4 7.4 0.0 0.0 0.0 September 680 100.0% 8.4 30.6 0 15.3 ‐ 42.6 41.0 16.2 0.1 0.0 0.0 October 701 100.0% 12.8 35.9 0 22.7 ‐ 15.5 50.8 29.2 4.4 0.0 0.0 November 675 100.0% 17.7 54.8 0 33.6 ‐ 7.7 43.6 33.3 15.4 0.0 0.0 December 703 100.0% 17.9 58.2 0 33.9 ‐ 2.1 47.9 37.3 12.7 0.0 0.0 Annual 8232 99.7% 11.4 79.3 0 43.6 ‐ 31.4 42.9 19.0 6.7 0.0 0.0
a. 1‐hour Alberta Ambient Air Quality Objective = 159 ppb b. There is no 24‐hour Alberta Ambient Air Quality Objective for NO2.

AI-1-6
Table I‐6 Sherwood Park Station: Summary of continuous NOx monitoring results for 2013
Valid Operational Average Maximum 1‐Hour Maximum 24‐Hour Percent of Data within Concentration Range (%)
Month 1‐Hr data Time 1‐Hr Conc. 1‐Hr Conc. Exceedance a 24‐Hr Conc. Exceedance a (no.) (%) (ppb) (ppb) (no.) (ppb) (no.) <=5 >5‐15 >15‐30 >30‐100 >100‐159 >159
January 701 99.9% 25.4 342.1 ‐ 109.5 ‐ 11.3 35.5 27.4 22.7 2.4 0.7 February 635 100.0% 22.6 306.1 ‐ 111.1 ‐ 14.2 38.7 26.8 18.0 1.6 0.8 March 668 97.7% 16.0 101.0 ‐ 38.1 ‐ 15.1 47.3 23.8 13.6 0.1 0.0 April 682 100.0% 10.4 105.4 ‐ 25.2 ‐ 34.8 47.7 12.0 5.4 0.1 0.0 May 702 99.7% 7.7 96.7 ‐ 17.6 ‐ 50.4 36.9 10.4 2.3 0.0 0.0June 681 100.0% 7.1 58.7 ‐ 16.2 ‐ 44.6 48.8 4.8 1.8 0.0 0.0 July 701 99.3% 7.0 54.7 ‐ 16.3 ‐ 47.5 45.1 5.3 2.1 0.0 0.0 August 703 100.0% 7.9 51.6 ‐ 15.0 ‐ 45.4 43.7 8.4 2.6 0.0 0.0 September 680 100.0% 11.3 80.5 ‐ 29.1 ‐ 34.3 43.7 14.6 7.5 0.0 0.0 October 701 100.0% 17.5 83.0 ‐ 32.7 ‐ 9.8 48.8 25.4 16.0 0.0 0.0 November 675 100.0% 26.8 205.0 ‐ 60.8 ‐ 3.7 36.3 34.7 21.0 3.7 0.6 December 703 100.0% 24.9 156.3 ‐ 54.2 ‐ 1.0 34.7 41.3 21.8 1.3 0.0 Annual 8232 99.7% 15.3 342.1 ‐ 111.1 ‐ 26.1 42.2 19.5 11.2 0.8 0.2
a. There is no Alberta Ambient Air Quality Objective for NOx.

AI-1-7
Table I‐7 Sherwood Park Station: Summary of continuous THC monitoring results for 2013
Valid Operational Average Maximum 1‐Hour Maximum 24‐Hour Percent of Data within Concentration Range (%) Month 1‐Hr data Time 1‐Hr Conc. 1‐Hr Conc. Exceedance a 24‐Hr Conc. Exceedance a
(no.) (%) (ppm) (ppm) (no.) (ppm) (no.) <=1 >1‐2 >2‐3 >3‐4 >4‐5 >5 January 706 100.0% 2.4 4.8 ‐ 3.1 ‐ 0.0 0.0 97.6 1.7 0.7 0.0 February 635 100.0% 2.3 4.0 ‐ 3.1 ‐ 0.0 0.0 97.2 2.5 0.3 0.0 March 704 100.0% 2.3 3.2 ‐ 2.6 ‐ 0.0 0.0 99.7 0.3 0.0 0.0 April 685 100.0% 2.1 2.7 ‐ 2.3 ‐ 0.0 4.7 95.3 0.0 0.0 0.0 May 699 99.7% 2.1 2.6 ‐ 2.2 ‐ 0.0 14.2 85.8 0.0 0.0 0.0June 682 100.0% 2.2 2.6 ‐ 2.3 ‐ 0.0 6.9 93.1 0.0 0.0 0.0 July 701 99.3% 2.1 2.8 ‐ 2.3 ‐ 0.0 18.7 81.3 0.0 0.0 0.0 August 701 99.7% 2.1 3.6 ‐ 2.2 ‐ 0.0 37.1 62.6 0.3 0.0 0.0 September 680 100.0% 2.0 3.0 ‐ 2.2 ‐ 0.0 63.5 36.5 0.0 0.0 0.0 October 701 100.0% 2.1 2.8 ‐ 2.3 ‐ 0.0 17.4 82.6 0.0 0.0 0.0 November 680 100.0% 2.2 3.4 ‐ 2.7 ‐ 0.0 7.8 91.6 0.6 0.0 0.0 December 703 100.0% 2.1 3.0 ‐ 2.5 ‐ 0.0 39.3 60.6 0.1 0.0 0.0 Annual 8277 99.9% 2.2 4.8 ‐ 3.1 ‐ 0.0 17.5 81.9 0.4 0.1 0.0
a. There is no Alberta Ambient Air Quality Objective for THC.

AI-1-8
Table I‐8 Sherwood Park Station: Summary of continuous ambient temperature monitoring results for 2013
Valid Operational Average Minimum Maximum Percent of Data within Temperature Range
Month 1‐Hr data Time 1‐hr Temp. 1‐Hr Temp. 1‐Hr Temp. (no.) (%) (°C) (°C) (°C) <=‐30 >‐30~‐15 >‐15~‐0 >0~‐15 >15~30 >30
January 744 100.0% ‐7.5 ‐27.5 9.3 0.0 18.5 63.2 18.3 0.0 0.0 February 672 100.0% ‐2.4 ‐14.1 9.8 0.0 0.0 65.3 34.7 0.0 0.0 March 744 100.0% ‐4.4 ‐16.7 10.8 0.0 2.8 69.6 27.6 0.0 0.0 April 720 100.0% 2.0 ‐11.7 20.4 0.0 0.0 39.2 57.6 3.2 0.0 May 744 100.0% 14.9 ‐5.5 30.4 0.0 0.0 1.2 51.5 46.9 0.4June 720 100.0% 16.0 6.1 28.7 0.0 0.0 0.0 46.7 53.3 0.0 July 744 100.0% 17.9 7.6 34.4 0.0 0.0 0.0 29.7 69.2 1.1 August 744 100.0% 18.9 9.9 29.0 0.0 0.0 0.0 18.1 81.9 0.0 September 720 100.0% 15.6 1.3 31.5 0.0 0.0 0.0 45.4 53.6 1.0 October 743 99.9% 6.6 ‐7.7 18.5 0.0 0.0 8.9 88.0 3.1 0.0 November 720 100.0% ‐4.6 ‐23.1 10.6 0.0 4.9 67.5 27.6 0.0 0.0 December 744 100.0% ‐11.6 ‐27.4 7.0 0.0 46.1 37.2 16.7 0.0 0.0 Annual 8759 100.0% 5.2 ‐27.5 34.4 0.0 6.1 29.1 38.5 26.1 0.2

AI-1-9
Table I‐9 Sherwood Park Station: Wind frequency table for 2013
Wind Direction Sector
Percent of Data within Wind Speed Range, wind speed unit km/hr >1‐5 >5‐10 >10‐20 >20‐30 >30‐40 >40 Total
North NorthEast 1.7% 2.3% 0.6% 0.0% 0.0% 0.0% 4.5% NorthEast 1.4% 0.9% 0.3% 0.0% 0.0% 0.0% 2.6% East NorthEast 1.5% 0.9% 0.3% 0.0% 0.0% 0.0% 2.7% East 1.7% 0.9% 0.1% 0.0% 0.0% 0.0% 2.7% East SouthEast 2.8% 2.2% 0.8% 0.0% 0.0% 0.0% 5.7% SouthEast 3.7% 5.6% 3.1% 0.1% 0.0% 0.0% 12.4% South SouthEast 2.9% 7.3% 2.8% 0.0% 0.0% 0.0% 13.0% South 3.1% 6.2% 1.4% 0.0% 0.0% 0.0% 10.8% South SouthWest 2.5% 3.7% 0.1% 0.0% 0.0% 0.0% 6.3% SouthWest 1.7% 1.1% 0.0% 0.0% 0.0% 0.0% 2.8% West SouthWest 1.3% 1.3% 0.1% 0.0% 0.0% 0.0% 2.7% West 1.0% 2.0% 1.1% 0.0% 0.0% 0.0% 4.2% West NorthWest 0.8% 3.5% 6.2% 0.4% 0.0% 0.0% 10.9% NorthWest 0.7% 1.7% 2.7% 0.5% 0.0% 0.0% 5.6% North NorthWest 0.9% 2.9% 3.1% 0.2% 0.0% 0.0% 7.1% North 1.0% 2.3% 1.3% 0.0% 0.0% 0.0% 4.5% Total 28.8% 44.9% 23.9% 1.2% 0.0% 0.0% 98.8%
Percent Calm 0.8% Number of Valid Hourly‐Average Data 8755 Total Workable Hours in Time Period 8760
0%
5%
10%
15%
20%N
E
S
W
> 4030 - 4020 - 3010 - 205 - 101 - 5
Wind Speed Class (km/hr)
Calm (<1 km/hr) = 1.2%

A1.2
PART 2. Gold Bar Station

AI-2-1
Table I‐10 Gold Bar Station: Summary statistics for continuous air monitoring results for 2013
Parameter Unit Calibration & AIC Valid Data Uptime Summary Statistics of Hourly Average Data
(hours) (hours) (%) Average Minimum Maximum
SO2 ppb 453 8302 99.9% 1 < 1 48
H2S ppb 453 8302 99.9% < 1 < 1 12
NO ppb 455 8240 99.2% 6.2 < 0.1 277.7
NO2 ppb 455 8240 99.2% 13.8 0.6 72.3
NOx ppb 455 8240 99.2% 20.0 0.7 337.6
Ambient Temp. °C 0 8760 100.0% 4.6 ‐29 34.0
Wind Speed km/hr 0 8760 100.0% 7.8 Calm 36.5
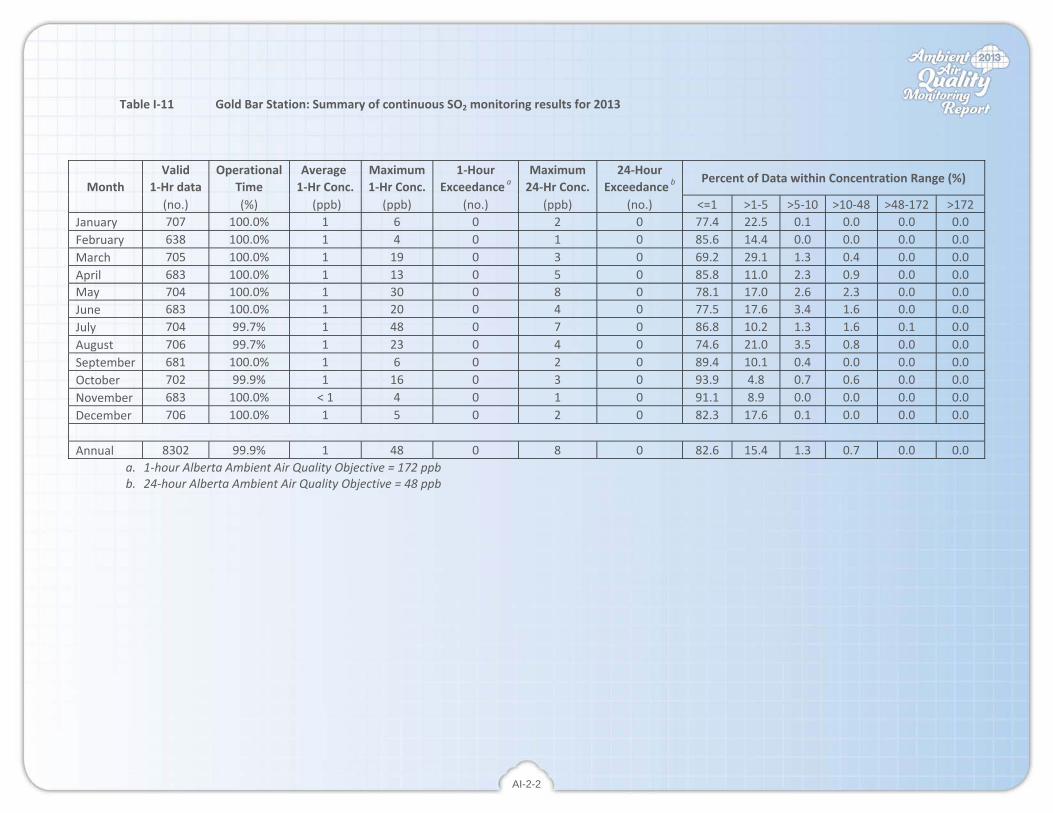
AI-2-2
Table I‐11 Gold Bar Station: Summary of continuous SO2 monitoring results for 2013
Valid Operational Average Maximum 1‐Hour Maximum 24‐Hour Percent of Data within Concentration Range (%) Month 1‐Hr data Time 1‐Hr Conc. 1‐Hr Conc. Exceedance a 24‐Hr Conc. Exceedance b
(no.) (%) (ppb) (ppb) (no.) (ppb) (no.) <=1 >1‐5 >5‐10 >10‐48 >48‐172 >172 January 707 100.0% 1 6 0 2 0 77.4 22.5 0.1 0.0 0.0 0.0 February 638 100.0% 1 4 0 1 0 85.6 14.4 0.0 0.0 0.0 0.0 March 705 100.0% 1 19 0 3 0 69.2 29.1 1.3 0.4 0.0 0.0 April 683 100.0% 1 13 0 5 0 85.8 11.0 2.3 0.9 0.0 0.0 May 704 100.0% 1 30 0 8 0 78.1 17.0 2.6 2.3 0.0 0.0June 683 100.0% 1 20 0 4 0 77.5 17.6 3.4 1.6 0.0 0.0 July 704 99.7% 1 48 0 7 0 86.8 10.2 1.3 1.6 0.1 0.0 August 706 99.7% 1 23 0 4 0 74.6 21.0 3.5 0.8 0.0 0.0 September 681 100.0% 1 6 0 2 0 89.4 10.1 0.4 0.0 0.0 0.0 October 702 99.9% 1 16 0 3 0 93.9 4.8 0.7 0.6 0.0 0.0 November 683 100.0% < 1 4 0 1 0 91.1 8.9 0.0 0.0 0.0 0.0 December 706 100.0% 1 5 0 2 0 82.3 17.6 0.1 0.0 0.0 0.0 Annual 8302 99.9% 1 48 0 8 0 82.6 15.4 1.3 0.7 0.0 0.0
a. 1‐hour Alberta Ambient Air Quality Objective = 172 ppb b. 24‐hour Alberta Ambient Air Quality Objective = 48 ppb

AI-2-3
Table I‐12 Gold Bar Station: Summary of continuous H2S monitoring results for 2013
Valid Operational Average Maximum 1‐Hour Maximum 24‐Hour Percent of Data within Concentration Range (%)
Month 1‐Hr data Time 1‐Hr Conc. 1‐Hr Conc. Exceedance a 24‐Hr Conc. Exceedance b (no.) (%) (ppb) (ppb) (no.) (ppb) (no.) <=1 >1‐3 >3‐5 >5‐8 >8‐10 >10
January 707 100.0% 1 6 0 3 0 87.8 9.1 2.4 0.7 0.0 0.0 February 638 100.0% < 1 3 0 2 0 91.5 7.7 0.8 0.0 0.0 0.0 March 705 100.0% < 1 1 0 < 1 0 99.4 0.6 0.0 0.0 0.0 0.0 April 683 100.0% < 1 2 0 < 1 0 99.1 0.9 0.0 0.0 0.0 0.0 May 704 100.0% < 1 6 0 1 0 96.4 3.3 0.1 0.1 0.0 0.0June 683 100.0% < 1 5 0 1 0 93.7 6.0 0.1 0.1 0.0 0.0 July 704 99.7% < 1 5 0 1 0 91.8 7.2 1.0 0.0 0.0 0.0 August 706 99.7% 1 7 0 1 0 86.5 11.2 1.6 0.7 0.0 0.0 September 681 100.0% 1 12 1 2 0 86.5 10.6 2.2 0.4 0.1 0.1 October 702 99.9% < 1 3 0 1 0 96.3 3.4 0.3 0.0 0.0 0.0 November 683 100.0% 1 5 0 1 0 89.9 9.2 0.7 0.1 0.0 0.0 December 706 100.0% < 1 3 0 1 0 94.1 5.9 0.0 0.0 0.0 0.0 Annual 8302 99.9% < 1 12 1 3 0 92.8 6.2 0.8 0.2 0.0 0.0
a. 1‐hour Alberta Ambient Air Quality Objective = 10 ppb b. 24‐hour Alberta Ambient Air Quality Objective = 3 ppb
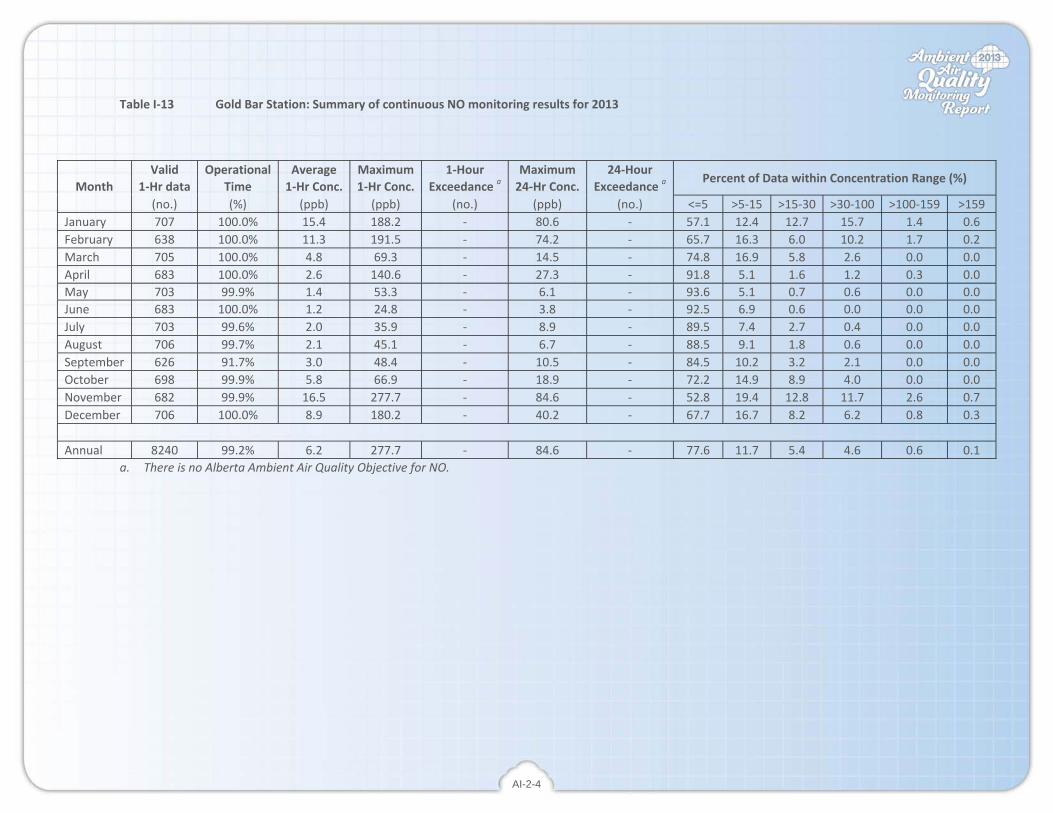
AI-2-4
Table I‐13 Gold Bar Station: Summary of continuous NO monitoring results for 2013
Valid Operational Average Maximum 1‐Hour Maximum 24‐Hour Percent of Data within Concentration Range (%)
Month 1‐Hr data Time 1‐Hr Conc. 1‐Hr Conc. Exceedance a 24‐Hr Conc. Exceedance a (no.) (%) (ppb) (ppb) (no.) (ppb) (no.) <=5 >5‐15 >15‐30 >30‐100 >100‐159 >159
January 707 100.0% 15.4 188.2 ‐ 80.6 ‐ 57.1 12.4 12.7 15.7 1.4 0.6 February 638 100.0% 11.3 191.5 ‐ 74.2 ‐ 65.7 16.3 6.0 10.2 1.7 0.2 March 705 100.0% 4.8 69.3 ‐ 14.5 ‐ 74.8 16.9 5.8 2.6 0.0 0.0 April 683 100.0% 2.6 140.6 ‐ 27.3 ‐ 91.8 5.1 1.6 1.2 0.3 0.0 May 703 99.9% 1.4 53.3 ‐ 6.1 ‐ 93.6 5.1 0.7 0.6 0.0 0.0June 683 100.0% 1.2 24.8 ‐ 3.8 ‐ 92.5 6.9 0.6 0.0 0.0 0.0 July 703 99.6% 2.0 35.9 ‐ 8.9 ‐ 89.5 7.4 2.7 0.4 0.0 0.0 August 706 99.7% 2.1 45.1 ‐ 6.7 ‐ 88.5 9.1 1.8 0.6 0.0 0.0 September 626 91.7% 3.0 48.4 ‐ 10.5 ‐ 84.5 10.2 3.2 2.1 0.0 0.0 October 698 99.9% 5.8 66.9 ‐ 18.9 ‐ 72.2 14.9 8.9 4.0 0.0 0.0 November 682 99.9% 16.5 277.7 ‐ 84.6 ‐ 52.8 19.4 12.8 11.7 2.6 0.7 December 706 100.0% 8.9 180.2 ‐ 40.2 ‐ 67.7 16.7 8.2 6.2 0.8 0.3 Annual 8240 99.2% 6.2 277.7 ‐ 84.6 ‐ 77.6 11.7 5.4 4.6 0.6 0.1
a. There is no Alberta Ambient Air Quality Objective for NO.

AI-2-5
Table I‐14 Gold Bar Station: Summary of continuous NO2 monitoring results for 2013
Valid Operational Average Maximum 1‐Hour Maximum 24‐Hour Percent of Data within Concentration Range (%)
Month 1‐Hr data Time 1‐Hr Conc. 1‐Hr Conc. Exceedance a 24‐Hr Conc. Exceedance b (no.) (%) (ppb) (ppb) (no.) (ppb) (no.) <=5 >5‐15 >15‐30 >30‐100 >100‐159 >159
January 707 100.0% 22.5 65.2 0 47.9 ‐ 7.6 35.4 22.8 34.2 0.0 0.0 February 638 100.0% 21.2 54.7 0 41.0 ‐ 8.5 33.4 29.0 29.2 0.0 0.0 March 705 100.0% 18.7 58.5 0 36.6 ‐ 9.6 43.7 25.5 21.1 0.0 0.0 April 683 100.0% 10.8 61.1 0 28.7 ‐ 31.2 47.0 16.0 5.9 0.0 0.0 May 703 99.9% 8.2 47.3 0 16.3 ‐ 43.0 44.4 10.8 1.8 0.0 0.0June 683 100.0% 6.3 28.8 0 12.9 ‐ 50.1 44.8 5.1 0.0 0.0 0.0 July 703 99.6% 6.5 35.9 0 13.2 ‐ 50.2 42.8 6.8 0.1 0.0 0.0 August 706 99.7% 8.2 40.2 0 15.3 ‐ 37.4 49.2 13.0 0.4 0.0 0.0 September 626 91.7% 8.8 32.9 0 14.7 ‐ 35.0 48.4 16.3 0.3 0.0 0.0 October 698 99.9% 13.9 38.0 0 23.5 ‐ 21.3 38.5 35.0 5.2 0.0 0.0 November 682 99.9% 21.3 72.3 0 44.3 ‐ 9.1 32.0 29.9 29.0 0.0 0.0 December 706 100.0% 18.7 68.5 0 38.4 ‐ 6.2 42.5 31.4 19.8 0.0 0.0 Annual 8240 99.2% 13.8 72.3 0 47.9 ‐ 25.8 41.8 20.1 12.3 0.0 0.0
a. 1‐hour Alberta Ambient Air Quality Objective = 159 ppb b. There is no 24‐hour Alberta Ambient Air Quality Objective for NO2.

AI-2-6
Table I‐15 Gold Bar Station: Summary of continuous NOx monitoring results for 2013
Valid Operational Average Maximum 1‐Hour Maximum 24‐Hour Percent of Data within Concentration Range (%)
Month 1‐Hr data Time 1‐Hr Conc. 1‐Hr Conc. Exceedance a 24‐Hr Conc. Exceedance a (no.) (%) (ppb) (ppb) (no.) (ppb) (no.) <=5 >5‐15 >15‐30 >30‐100 >100‐159 >159
January 707 100.0% 38.0 252.9 ‐ 128.5 ‐ 5.9 32.1 20.4 34.8 5.4 1.4 February 638 100.0% 32.7 243.0 ‐ 115.4 ‐ 4.2 32.0 26.3 32.3 3.9 1.3 March 705 100.0% 23.6 115.6 ‐ 51.3 ‐ 5.2 42.3 24.7 27.4 0.4 0.0 April 683 100.0% 13.5 201.8 ‐ 56.3 ‐ 24.5 50.7 16.3 7.9 0.4 0.3 May 703 99.9% 9.7 93.6 ‐ 22.4 ‐ 38.1 44.8 13.5 3.6 0.0 0.0June 683 100.0% 7.5 48.0 ‐ 16.6 ‐ 44.4 46.3 7.6 1.8 0.0 0.0 July 703 99.6% 8.6 71.7 ‐ 20.5 ‐ 44.1 41.0 11.5 3.4 0.0 0.0 August 706 99.7% 10.3 69.3 ‐ 20.2 ‐ 31.3 48.4 16.4 3.8 0.0 0.0 September 626 91.7% 12.0 74.5 ‐ 24.9 ‐ 29.2 47.1 16.0 7.7 0.0 0.0 October 698 99.9% 19.7 96.3 ‐ 40.6 ‐ 15.0 38.4 24.9 21.6 0.0 0.0 November 682 99.9% 37.6 337.6 ‐ 128.5 ‐ 6.3 29.0 21.3 35.6 4.8 2.9 December 706 100.0% 27.3 248.5 ‐ 78.3 ‐ 5.2 35.1 32.4 24.4 1.8 1.0 Annual 8240 99.2% 20.0 337.6 ‐ 128.5 ‐ 21.2 40.6 19.3 17.0 1.4 0.6
a. There is no Alberta Ambient Air Quality Objective for NOx.

AI-2-7
Table I‐16 Gold Bar Station: Summary of continuous ambient temperature monitoring results for 2013
Valid Operational Average Minimum Maximum Percent of Data within Temperature Range
Month 1‐Hr data Time 1‐Hr Temp. 1‐Hr Temp. 1‐Hr Temp. (no.) (%) (°C) (°C) (°C) <=‐30 >‐30~‐15 >‐15~‐0 >0~‐15 >15~30 >30
January 744 100.0% ‐8.4 ‐28.3 9.6 0.0 19.5 65.1 15.5 0.0 0.0 February 672 100.0% ‐3.3 ‐14.0 10.0 0.0 0.0 71.1 28.9 0.0 0.0 March 744 100.0% ‐5.2 ‐18.1 10.1 0.0 4.4 72.0 23.5 0.0 0.0 April 720 100.0% 1.5 ‐12.5 20.0 0.0 0.0 42.2 55.0 2.8 0.0 May 744 100.0% 14.7 ‐4.8 30.9 0.0 0.0 1.2 51.5 46.9 0.4June 720 100.0% 15.7 5.5 28.6 0.0 0.0 0.0 48.9 51.1 0.0 July 744 100.0% 17.6 7.7 34.0 0.0 0.0 0.0 30.5 68.4 1.1 August 744 100.0% 18.6 9.4 28.4 0.0 0.0 0.0 20.8 79.2 0.0 September 720 100.0% 15.3 1.0 31.4 0.0 0.0 0.0 48.2 51.3 0.6 October 744 100.0% 6.3 ‐7.8 17.7 0.0 0.0 9.3 88.2 2.6 0.0 November 720 100.0% ‐5.5 ‐23.0 10.8 0.0 7.9 69.3 22.8 0.0 0.0 December 744 100.0% ‐12.5 ‐28.6 5.8 0.0 50.5 36.2 13.3 0.0 0.0 Annual 8760 100.0% 4.6 ‐28.6 34.0 0.0 7.0 30.2 37.2 25.4 0.2

AI-2-8
Table I‐17 Gold Bar Station: Wind frequency table for 2013
Wind Direction Sector
Percent of Data within Wind Speed Range, wind speed unit km/hr >1‐5 >5‐10 >10‐20 >20‐30 >30‐40 >40 Total
North NorthEast 1.4% 1.7% 1.6% 0.0% 0.0% 0.0% 4.8% NorthEast 1.6% 3.2% 1.1% 0.0% 0.0% 0.0% 6.0% East NorthEast 1.5% 1.9% 0.9% 0.1% 0.0% 0.0% 4.4% East 0.9% 0.6% 0.8% 0.1% 0.0% 0.0% 2.4% East SouthEast 0.6% 0.4% 0.5% 0.0% 0.0% 0.0% 1.5% SouthEast 0.9% 1.5% 1.2% 0.0% 0.0% 0.0% 3.5% South SouthEast 1.8% 3.9% 2.0% 0.0% 0.0% 0.0% 7.8% South 2.4% 6.6% 2.2% 0.0% 0.0% 0.0% 11.2% South SouthWest 3.9% 9.9% 1.3% 0.0% 0.0% 0.0% 15.1% SouthWest 2.6% 3.4% 0.2% 0.0% 0.0% 0.0% 6.2% West SouthWest 1.5% 1.6% 0.2% 0.0% 0.0% 0.0% 3.3% West 1.4% 1.9% 0.2% 0.0% 0.0% 0.0% 3.6% West NorthWest 1.4% 3.3% 2.0% 0.0% 0.0% 0.0% 6.8% NorthWest 1.5% 3.3% 4.2% 0.4% 0.0% 0.0% 9.4% North NorthWest 0.9% 2.0% 3.3% 0.4% 0.0% 0.0% 6.7% North 1.0% 1.9% 2.8% 0.3% 0.0% 0.0% 5.9% Total 25.5% 47.1% 24.6% 1.4% 0.0% 0.0% 98.6%
Percent Calm 1.4% Number of Valid Hourly‐Average Data 8760 Total Workable Hours in Time Period 8760
0%
5%
10%
15%
20%N
E
S
W
> 4030 - 4020 - 3010 - 205 - 101 - 5
Wind Speed Class (km/hr)
Calm (<1 km/hr) = 1.4%

A1.3
PART 3. Beverly Station

AI-3-1
Table I‐18 Beverly Station: Summary statistics for continuous air monitoring results for 2013
Parameter Unit Calibration & AIC Valid Data Uptime Summary Statistics of Hourly Average Data
(hours) (hours) (%) Average Minimum Maximum
SO2 ppb 465 8294 100.0% 1 < 1 76
H2S ppb 465 8294 100.0% 1 < 1 14
THC ppm 458 8295 99.9% 2.4 1.6 8.5
Ambient Temp. °C 0 8759 100.0% 4.4 ‐29 34.4
Wind Speed km/hr 0 8759 100.0% 6.7 Calm 26.8

AI-3-2
Table I‐19 Beverly Station: Summary of continuous SO2 monitoring results for 2013
Valid Operational Average Maximum 1‐Hour Maximum 24‐Hour Percent of Data within Concentration Range (%)
Month 1‐Hr data Time 1‐Hr Conc. 1‐Hr Conc. Exceedance a 24‐Hr Conc. Exceedance b (no.) (%) (ppb) (ppb) (no.) (ppb) (no.) <=1 >1‐5 >5‐10 >10‐48 >48‐172 >172
January 705 100.0% 2 25 0 3 0 46.1 51.9 1.8 0.1 0.0 0.0 February 636 100.0% 2 17 0 5 0 47.5 47.8 3.3 1.4 0.0 0.0 March 704 100.0% 2 22 0 5 0 53.8 39.3 4.1 2.7 0.0 0.0 April 682 100.0% 2 41 0 9 0 69.8 22.4 3.5 4.3 0.0 0.0 May 704 100.0% 3 76 0 19 0 60.7 27.6 6.3 5.3 0.3 0.0June 682 100.0% 1 20 0 3 0 76.7 19.6 3.4 0.3 0.0 0.0 July 704 100.0% 1 17 0 4 0 78.4 17.0 3.1 1.4 0.0 0.0 August 706 100.0% 1 17 0 5 0 67.7 27.3 3.3 1.7 0.0 0.0 September 681 100.0% 1 22 0 5 0 64.5 30.0 4.0 1.6 0.0 0.0 October 704 99.9% 1 21 0 4 0 73.2 21.9 3.4 1.6 0.0 0.0 November 681 100.0% 1 14 0 3 0 60.4 36.0 3.2 0.4 0.0 0.0 December 705 100.0% 1 38 0 4 0 60.4 35.3 3.7 0.6 0.0 0.0 Annual 8294 100.0% 1 76 0 19 0 63.3 31.3 3.6 1.8 0.0 0.0
a. 1‐hour Alberta Ambient Air Quality Objective = 172 ppb b. 24‐hour Alberta Ambient Air Quality Objective = 48 ppb

AI-3-3
Table I‐20 Beverly Station: Summary of continuous H2S monitoring results for 2013
Valid Operational Average Maximum 1‐Hour Maximum 24‐Hour Percent of Data within Concentration Range (%)
Month 1‐Hr data Time 1‐Hr Conc. 1‐Hr Conc. Exceedance a 24‐Hr Conc. Exceedance b (no.) (%) (ppb) (ppb) (no.) (ppb) (no.) <=1 >1‐3 >3‐5 >5‐8 >8‐10 >10
January 705 100.0% 1 6 0 3 0 72.3 24.1 2.7 0.9 0.0 0.0 February 636 100.0% 1 6 0 2 0 80.8 17.6 1.4 0.2 0.0 0.0 March 704 100.0% < 1 3 0 1 0 94.7 5.3 0.0 0.0 0.0 0.0 April 682 100.0% < 1 2 0 1 0 97.8 2.2 0.0 0.0 0.0 0.0 May 704 100.0% < 1 5 0 1 0 88.9 9.2 1.6 0.3 0.0 0.0June 682 100.0% < 1 4 0 1 0 92.2 7.6 0.1 0.0 0.0 0.0 July 704 100.0% < 1 6 0 1 0 86.8 11.6 1.4 0.1 0.0 0.0 August 706 100.0% 1 10 0 2 0 80.3 16.3 2.3 0.8 0.3 0.0 September 681 100.0% 1 13 3 3 0 77.7 15.0 3.8 2.3 0.7 0.4 October 704 99.9% 1 13 2 2 0 77.6 13.9 5.0 2.7 0.4 0.4 November 681 100.0% 1 14 1 3 0 73.3 20.9 3.5 2.1 0.1 0.1 December 705 100.0% < 1 8 0 1 0 89.1 9.9 0.7 0.3 0.0 0.0 Annual 8294 100.0% 1 14 6 3 0 84.3 12.8 1.9 0.8 0.1 0.1
a. 1‐hour Alberta Ambient Air Quality Objective = 10 ppb b. 24‐hour Alberta Ambient Air Quality Objective = 3 ppb
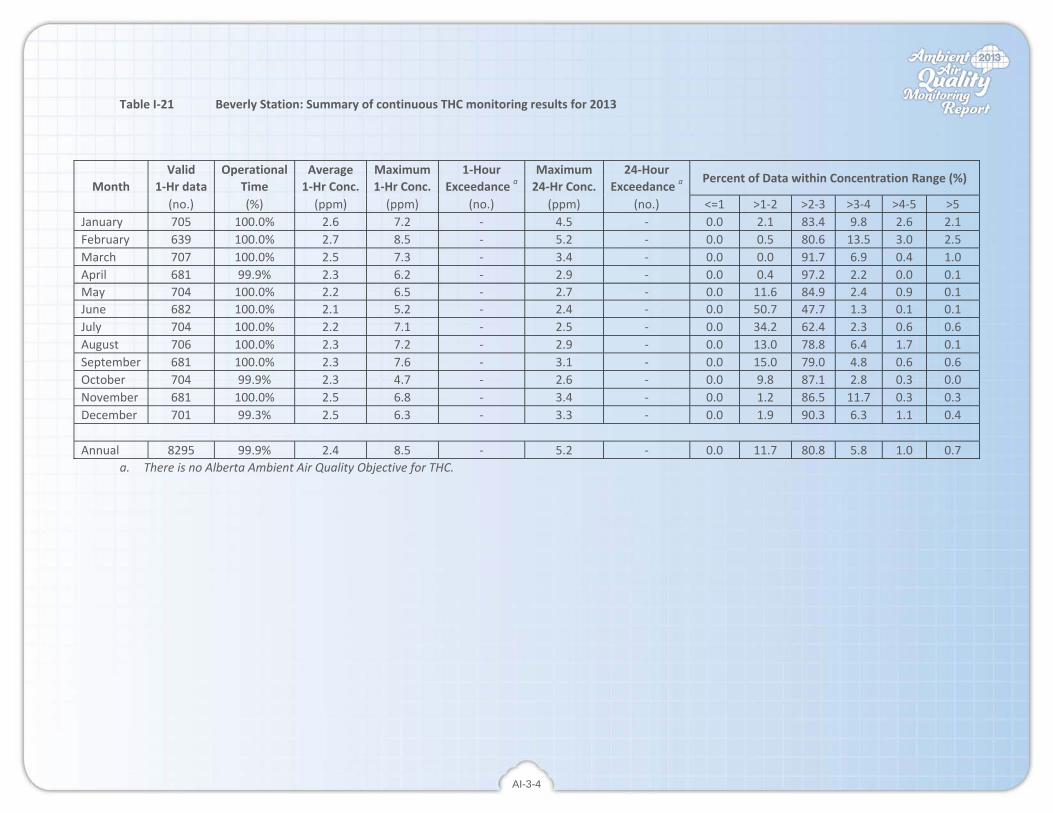
AI-3-4
Table I‐21 Beverly Station: Summary of continuous THC monitoring results for 2013
Valid Operational Average Maximum 1‐Hour Maximum 24‐Hour Percent of Data within Concentration Range (%)
Month 1‐Hr data Time 1‐Hr Conc. 1‐Hr Conc. Exceedance a 24‐Hr Conc. Exceedance a (no.) (%) (ppm) (ppm) (no.) (ppm) (no.) <=1 >1‐2 >2‐3 >3‐4 >4‐5 >5
January 705 100.0% 2.6 7.2 ‐ 4.5 ‐ 0.0 2.1 83.4 9.8 2.6 2.1 February 639 100.0% 2.7 8.5 ‐ 5.2 ‐ 0.0 0.5 80.6 13.5 3.0 2.5 March 707 100.0% 2.5 7.3 ‐ 3.4 ‐ 0.0 0.0 91.7 6.9 0.4 1.0 April 681 99.9% 2.3 6.2 ‐ 2.9 ‐ 0.0 0.4 97.2 2.2 0.0 0.1 May 704 100.0% 2.2 6.5 ‐ 2.7 ‐ 0.0 11.6 84.9 2.4 0.9 0.1June 682 100.0% 2.1 5.2 ‐ 2.4 ‐ 0.0 50.7 47.7 1.3 0.1 0.1 July 704 100.0% 2.2 7.1 ‐ 2.5 ‐ 0.0 34.2 62.4 2.3 0.6 0.6 August 706 100.0% 2.3 7.2 ‐ 2.9 ‐ 0.0 13.0 78.8 6.4 1.7 0.1 September 681 100.0% 2.3 7.6 ‐ 3.1 ‐ 0.0 15.0 79.0 4.8 0.6 0.6 October 704 99.9% 2.3 4.7 ‐ 2.6 ‐ 0.0 9.8 87.1 2.8 0.3 0.0 November 681 100.0% 2.5 6.8 ‐ 3.4 ‐ 0.0 1.2 86.5 11.7 0.3 0.3 December 701 99.3% 2.5 6.3 ‐ 3.3 ‐ 0.0 1.9 90.3 6.3 1.1 0.4 Annual 8295 99.9% 2.4 8.5 ‐ 5.2 ‐ 0.0 11.7 80.8 5.8 1.0 0.7
a. There is no Alberta Ambient Air Quality Objective for THC.
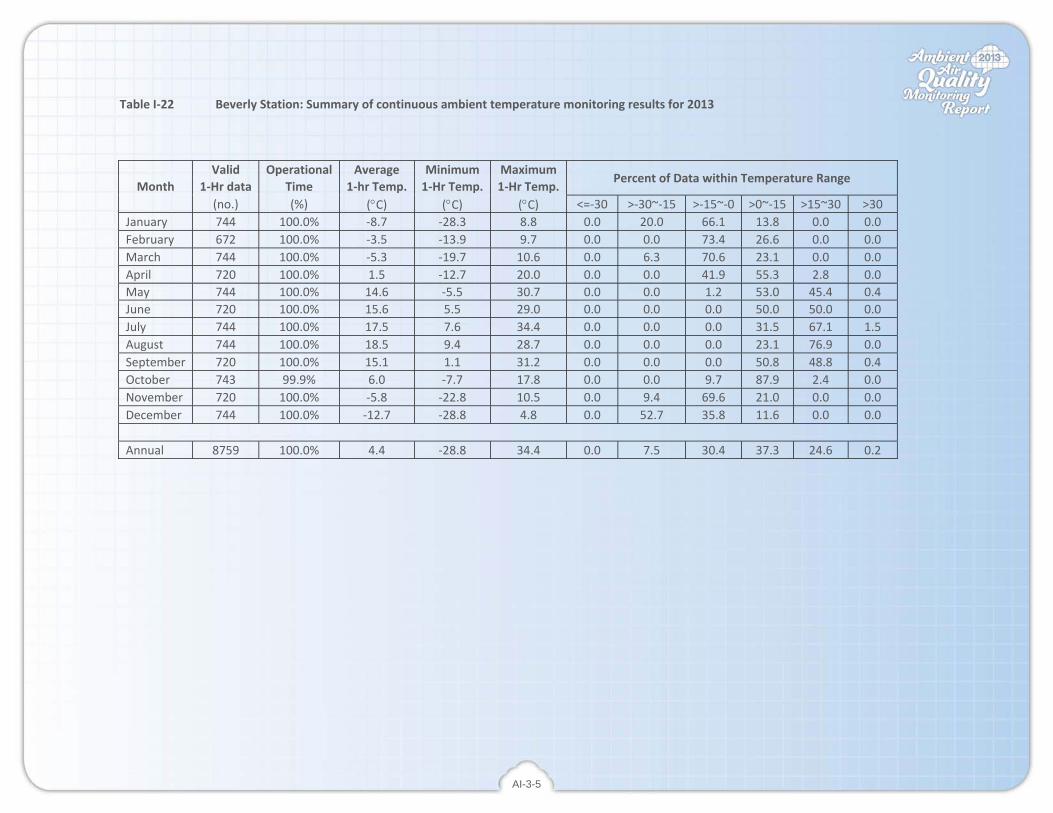
AI-3-5
Table I‐22 Beverly Station: Summary of continuous ambient temperature monitoring results for 2013
Valid Operational Average Minimum Maximum Percent of Data within Temperature Range
Month 1‐Hr data Time 1‐hr Temp. 1‐Hr Temp. 1‐Hr Temp. (no.) (%) (°C) (°C) (°C) <=‐30 >‐30~‐15 >‐15~‐0 >0~‐15 >15~30 >30
January 744 100.0% ‐8.7 ‐28.3 8.8 0.0 20.0 66.1 13.8 0.0 0.0 February 672 100.0% ‐3.5 ‐13.9 9.7 0.0 0.0 73.4 26.6 0.0 0.0 March 744 100.0% ‐5.3 ‐19.7 10.6 0.0 6.3 70.6 23.1 0.0 0.0 April 720 100.0% 1.5 ‐12.7 20.0 0.0 0.0 41.9 55.3 2.8 0.0 May 744 100.0% 14.6 ‐5.5 30.7 0.0 0.0 1.2 53.0 45.4 0.4June 720 100.0% 15.6 5.5 29.0 0.0 0.0 0.0 50.0 50.0 0.0 July 744 100.0% 17.5 7.6 34.4 0.0 0.0 0.0 31.5 67.1 1.5 August 744 100.0% 18.5 9.4 28.7 0.0 0.0 0.0 23.1 76.9 0.0 September 720 100.0% 15.1 1.1 31.2 0.0 0.0 0.0 50.8 48.8 0.4 October 743 99.9% 6.0 ‐7.7 17.8 0.0 0.0 9.7 87.9 2.4 0.0 November 720 100.0% ‐5.8 ‐22.8 10.5 0.0 9.4 69.6 21.0 0.0 0.0 December 744 100.0% ‐12.7 ‐28.8 4.8 0.0 52.7 35.8 11.6 0.0 0.0 Annual 8759 100.0% 4.4 ‐28.8 34.4 0.0 7.5 30.4 37.3 24.6 0.2

AI-3-6
Table I‐23 Beverly Station: Wind frequency table for 2013
Wind Direction Sector
Percent of Data within Wind Speed Range, wind speed unit km/hr >1‐5 >5‐10 >10‐20 >20‐30 >30‐40 >40 Total
North NorthEast 1.3% 1.4% 0.4% 0.0% 0.0% 0.0% 3.2% NorthEast 2.3% 3.8% 1.1% 0.1% 0.0% 0.0% 7.3% East NorthEast 2.0% 3.0% 1.2% 0.1% 0.0% 0.0% 6.2% East 1.2% 0.8% 0.4% 0.0% 0.0% 0.0% 2.3% East SouthEast 1.2% 0.7% 0.3% 0.0% 0.0% 0.0% 2.2% SouthEast 1.9% 2.8% 0.7% 0.0% 0.0% 0.0% 5.4% South SouthEast 1.7% 3.6% 1.2% 0.0% 0.0% 0.0% 6.6% South 2.1% 3.6% 1.1% 0.0% 0.0% 0.0% 6.9% South SouthWest 6.0% 8.8% 0.8% 0.0% 0.0% 0.0% 15.5% SouthWest 5.5% 3.3% 0.0% 0.0% 0.0% 0.0% 8.8% West SouthWest 2.7% 1.9% 0.1% 0.0% 0.0% 0.0% 4.7% West 1.8% 3.8% 2.1% 0.0% 0.0% 0.0% 7.8% West NorthWest 1.3% 3.4% 3.0% 0.2% 0.0% 0.0% 7.8% NorthWest 1.0% 2.6% 1.9% 0.1% 0.0% 0.0% 5.5% North NorthWest 1.0% 1.9% 1.4% 0.0% 0.0% 0.0% 4.4% North 1.1% 1.7% 0.4% 0.0% 0.0% 0.0% 3.3% Total 34.1% 47.2% 16.1% 0.5% 0.0% 0.0% 97.9%
Percent Calm 2.1% Number of Valid Hourly‐Average Data 8759 Total Workable Hours in Time Period 8760
0%
5%
10%
15%
20%N
E
S
W
> 4030 - 4020 - 3010 - 205 - 101 - 5
Wind Speed Class (km/hr)
Calm (<1 km/hr) = 2.1%

A1.4
PART 4. Elmjay Station
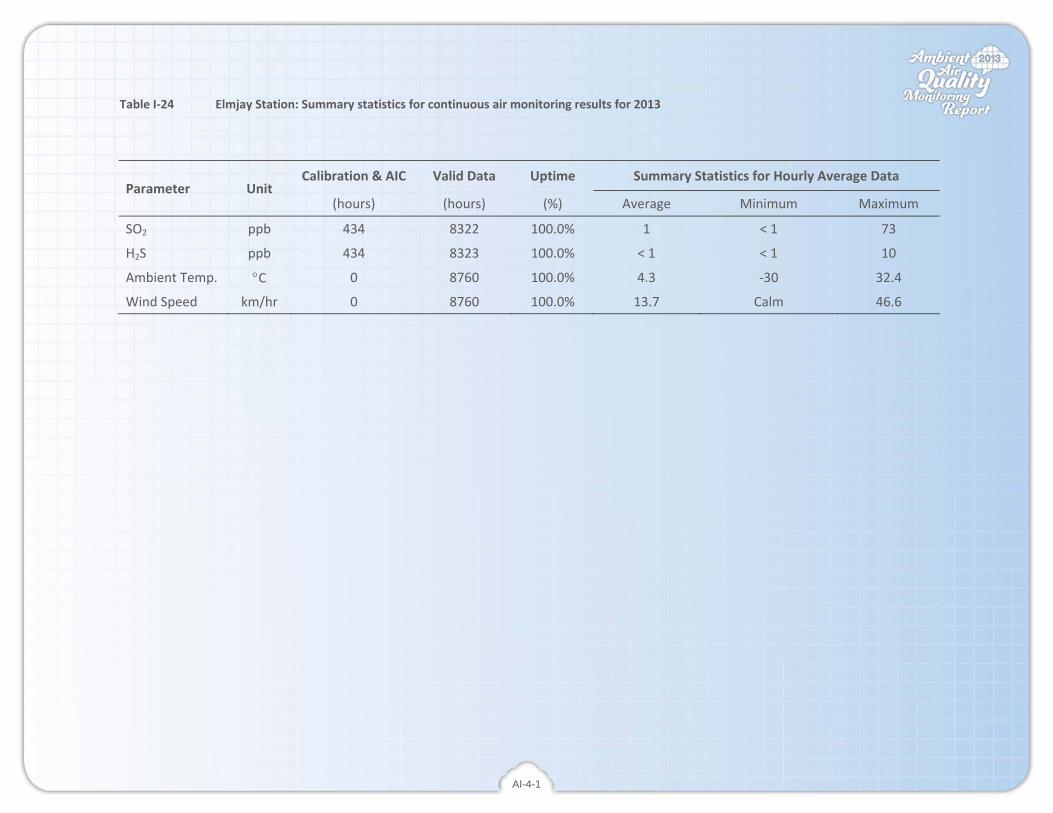
AI-4-1
Table I‐24 Elmjay Station: Summary statistics for continuous air monitoring results for 2013
Parameter Unit Calibration & AIC Valid Data Uptime Summary Statistics for Hourly Average Data
(hours) (hours) (%) Average Minimum Maximum
SO2 ppb 434 8322 100.0% 1 < 1 73
H2S ppb 434 8323 100.0% < 1 < 1 10
Ambient Temp. °C 0 8760 100.0% 4.3 ‐30 32.4
Wind Speed km/hr 0 8760 100.0% 13.7 Calm 46.6

AI-4-2
Table I‐25 Elmjay Station: Summary of continuous SO2 monitoring results for 2013
Valid Operational Average Maximum 1‐Hour Maximum 24‐Hour Percent of Data within Concentration Range (%)
Month 1‐Hr data Time 1‐Hr Conc. 1‐Hr Conc. Exceedance a 24‐Hr Conc. Exceedance b (no.) (%) (ppb) (ppb) (no.) (ppb) (no.) <=1 >1‐5 >5‐10 >10‐48 >48‐172 >172
January 708 100.0% 1 73 0 8 0 62.7 34.3 1.7 1.0 0.3 0.0 February 639 100.0% 1 16 0 4 0 68.2 28.5 1.9 1.4 0.0 0.0 March 706 100.0% 2 19 0 5 0 56.2 38.1 4.0 1.7 0.0 0.0 April 684 99.9% 1 18 0 3 0 75.3 18.3 4.5 1.9 0.0 0.0 May 707 100.0% 1 16 0 3 0 78.6 19.9 0.6 0.8 0.0 0.0June 682 100.0% 1 15 0 2 0 79.0 17.9 2.5 0.6 0.0 0.0 July 708 100.0% 1 15 0 3 0 70.5 24.3 4.4 0.8 0.0 0.0 August 708 100.0% 1 17 0 3 0 77.1 20.2 2.3 0.4 0.0 0.0 September 681 99.6% 1 17 0 2 0 75.8 22.2 1.9 0.1 0.0 0.0 October 708 100.0% 1 14 0 4 0 67.8 26.3 5.1 0.8 0.0 0.0 November 683 100.0% 1 30 0 6 0 70.9 26.4 1.2 1.6 0.0 0.0 December 708 100.0% 2 25 0 6 0 55.9 38.1 2.5 3.4 0.0 0.0 Annual 8322 100.0% 1 73 0 8 0 69.8 26.2 2.7 1.2 0.0 0.0
a. 1‐hour Alberta Ambient Air Quality Objective = 172 ppb b. 24‐hour Alberta Ambient Air Quality Objective = 48 pp

AI-4-3
Table I‐26 Elmjay Station: Summary of continuous H2S monitoring results for 2013
Valid Operational Average Maximum 1‐Hour Maximum 24‐Hour Percent of Data within Concentration Range (%)
Month 1‐Hr data Time 1‐Hr Conc. 1‐Hr Conc. Exceedance a 24‐Hr Conc. Exceedance b (no.) (%) (ppb) (ppb) (no.) (ppb) (no.) <=1 >1‐3 >3‐5 >5‐8 >8‐10 >10
January 708 100.0% < 1 6 0 3 0 91.4 5.8 2.7 0.1 0.0 0.0 February 639 100.0% < 1 3 0 1 0 97.0 3.0 0.0 0.0 0.0 0.0 March 706 100.0% < 1 2 0 < 1 0 99.9 0.1 0.0 0.0 0.0 0.0 April 684 99.9% < 1 5 0 1 0 98.7 1.0 0.3 0.0 0.0 0.0 May 707 100.0% < 1 1 0 < 1 0 99.3 0.7 0.0 0.0 0.0 0.0June 682 100.0% < 1 3 0 1 0 95.3 4.5 0.1 0.0 0.0 0.0 July 708 100.0% < 1 10 0 2 0 89.8 8.5 1.4 0.1 0.0 0.1 August 708 100.0% < 1 3 0 1 0 86.9 13.0 0.1 0.0 0.0 0.0 September 682 99.7% 1 4 0 1 0 81.2 18.5 0.3 0.0 0.0 0.0 October 708 100.0% < 1 1 0 < 1 0 99.6 0.4 0.0 0.0 0.0 0.0 November 683 100.0% < 1 3 0 1 0 96.5 3.5 0.0 0.0 0.0 0.0 December 708 100.0% < 1 2 0 1 0 99.4 0.6 0.0 0.0 0.0 0.0 Annual 8323 100.0% < 1 10 0 3 0 94.6 5.0 0.4 0.0 0.0 0.0
a. 1‐hour Alberta Ambient Air Quality Objective = 10 ppb b. 24‐hour Alberta Ambient Air Quality Objective = 3 ppb

AI-4-4
Table I‐27 Elmjay Station: Summary of continuous ambient temperature monitoring results for 2013
Valid Operational Average Minimum Maximum Percent of Data within temperature Range (%)
Month 1‐Hr data Time 1‐Hr Temp. 1‐Hr Temp. 1‐Hr Temp. (no.) (%) (°C) (°C) (°C) <=‐30 >‐30~‐15 >‐15~‐0 >0~‐15 >15~30 >30
January 744 100.0% ‐8.6 ‐28.6 8.0 0.0 21.6 65.2 13.2 0.0 0.0 February 672 100.0% ‐3.4 ‐14.6 8.8 0.0 0.0 73.2 26.8 0.0 0.0 March 744 100.0% ‐5.6 ‐18.1 8.2 0.0 6.2 72.3 21.5 0.0 0.0 April 720 100.0% 1.2 ‐10.7 19.6 0.0 0.0 45.1 52.2 2.6 0.0 May 744 100.0% 14.3 ‐4.8 29.9 0.0 0.0 1.3 53.8 44.9 0.0June 720 100.0% 15.2 5.4 27.1 0.0 0.0 0.0 52.8 47.2 0.0 July 744 100.0% 17.1 8.2 32.4 0.0 0.0 0.0 33.9 65.3 0.8 August 744 100.0% 18.4 9.7 27.4 0.0 0.0 0.0 20.7 79.3 0.0 September 720 100.0% 15.2 1.0 30.2 0.0 0.0 0.0 49.0 50.8 0.1 October 744 100.0% 6.1 ‐8.3 17.2 0.0 0.0 8.9 89.4 1.7 0.0 November 720 100.0% ‐5.7 ‐24.6 9.8 0.0 9.0 68.5 22.5 0.0 0.0 December 744 100.0% ‐12.8 ‐30.1 6.3 0.4 52.2 34.3 13.2 0.0 0.0 Annual 8760 100.0% 4.3 ‐30.1 32.4 0.0 7.5 30.4 37.4 24.5 0.1

AI-4-5
Table I‐28 Elmjay Station: Wind frequency table for 2013
Wind Direction Sector
Percent of Data within Wind Speed Range, wind speed unit km/hr >1‐5 >5‐10 >10‐20 >20‐30 >30‐40 >40 Total
North NorthEast 0.3% 0.3% 0.6% 0.2% 0.0% 0.0% 1.3% NorthEast 0.5% 1.3% 3.1% 0.4% 0.1% 0.0% 5.4% East NorthEast 0.6% 1.5% 1.5% 0.2% 0.1% 0.0% 3.9% East 0.4% 1.0% 1.2% 0.4% 0.0% 0.0% 2.9% East SouthEast 0.4% 1.0% 1.6% 0.4% 0.1% 0.0% 3.5% SouthEast 0.4% 1.7% 2.7% 0.8% 0.2% 0.0% 5.8% South SouthEast 0.6% 3.0% 6.4% 2.1% 0.2% 0.0% 12.4% South 0.6% 3.6% 12.0% 1.1% 0.1% 0.0% 17.4% South SouthWest 0.4% 2.1% 4.9% 0.1% 0.0% 0.0% 7.5% SouthWest 0.4% 1.6% 1.9% 0.0% 0.0% 0.0% 3.9% West SouthWest 0.4% 1.5% 1.8% 0.0% 0.0% 0.0% 3.8% West 0.3% 1.2% 2.0% 0.3% 0.0% 0.0% 3.7% West NorthWest 0.3% 1.0% 3.4% 2.4% 0.5% 0.0% 7.6% NorthWest 0.4% 1.3% 3.7% 2.4% 0.5% 0.1% 8.4% North NorthWest 0.3% 1.4% 5.4% 1.6% 0.2% 0.0% 8.9% North 0.2% 0.3% 1.6% 0.9% 0.1% 0.0% 3.0% Total 6.3% 23.7% 53.8% 13.3% 2.3% 0.1% 99.6%
Percent Calm 0.4% Number of Valid Hourly‐Average Data 8760 Total Workable Hours in Time Period 8760
0%
5%
10%
15%
20%N
E
S
W
> 4030 - 4020 - 3010 - 205 - 101 - 5
Wind Speed Class (km/hr)
Calm (<1 km/hr) = 0.4%

A1.5
PART 5. Clareview Station

AI-5-1
Table I‐29 Clareview Station: Summary statistics for continuous air monitoring results for 2013
Parameter Unit Calibration & AIC Valid Data Uptime Summary Statistics of Hourly Average Data
(hours) (hours) (%) Average Minimum Maximum
Ambient Temp. °C 0 8758 100.0% 4.3 ‐29.3 33.8
Wind Speed km/hr 0 8758 100.0% 7.7 Calm 33.3
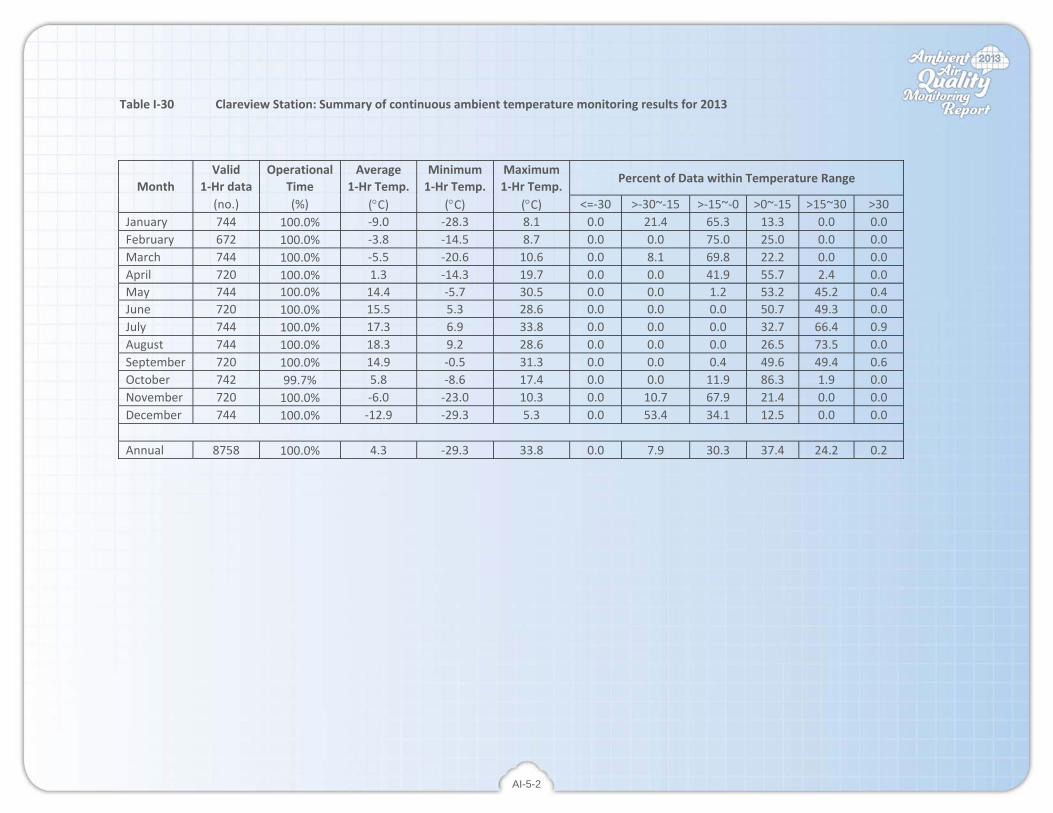
AI-5-2
Table I‐30 Clareview Station: Summary of continuous ambient temperature monitoring results for 2013
Valid Operational Average Minimum Maximum Percent of Data within Temperature Range
Month 1‐Hr data Time 1‐Hr Temp. 1‐Hr Temp. 1‐Hr Temp. (no.) (%) (°C) (°C) (°C) <=‐30 >‐30~‐15 >‐15~‐0 >0~‐15 >15~30 >30
January 744 100.0% ‐9.0 ‐28.3 8.1 0.0 21.4 65.3 13.3 0.0 0.0 February 672 100.0% ‐3.8 ‐14.5 8.7 0.0 0.0 75.0 25.0 0.0 0.0 March 744 100.0% ‐5.5 ‐20.6 10.6 0.0 8.1 69.8 22.2 0.0 0.0 April 720 100.0% 1.3 ‐14.3 19.7 0.0 0.0 41.9 55.7 2.4 0.0 May 744 100.0% 14.4 ‐5.7 30.5 0.0 0.0 1.2 53.2 45.2 0.4June 720 100.0% 15.5 5.3 28.6 0.0 0.0 0.0 50.7 49.3 0.0 July 744 100.0% 17.3 6.9 33.8 0.0 0.0 0.0 32.7 66.4 0.9 August 744 100.0% 18.3 9.2 28.6 0.0 0.0 0.0 26.5 73.5 0.0 September 720 100.0% 14.9 ‐0.5 31.3 0.0 0.0 0.4 49.6 49.4 0.6 October 742 99.7% 5.8 ‐8.6 17.4 0.0 0.0 11.9 86.3 1.9 0.0 November 720 100.0% ‐6.0 ‐23.0 10.3 0.0 10.7 67.9 21.4 0.0 0.0 December 744 100.0% ‐12.9 ‐29.3 5.3 0.0 53.4 34.1 12.5 0.0 0.0 Annual 8758 100.0% 4.3 ‐29.3 33.8 0.0 7.9 30.3 37.4 24.2 0.2
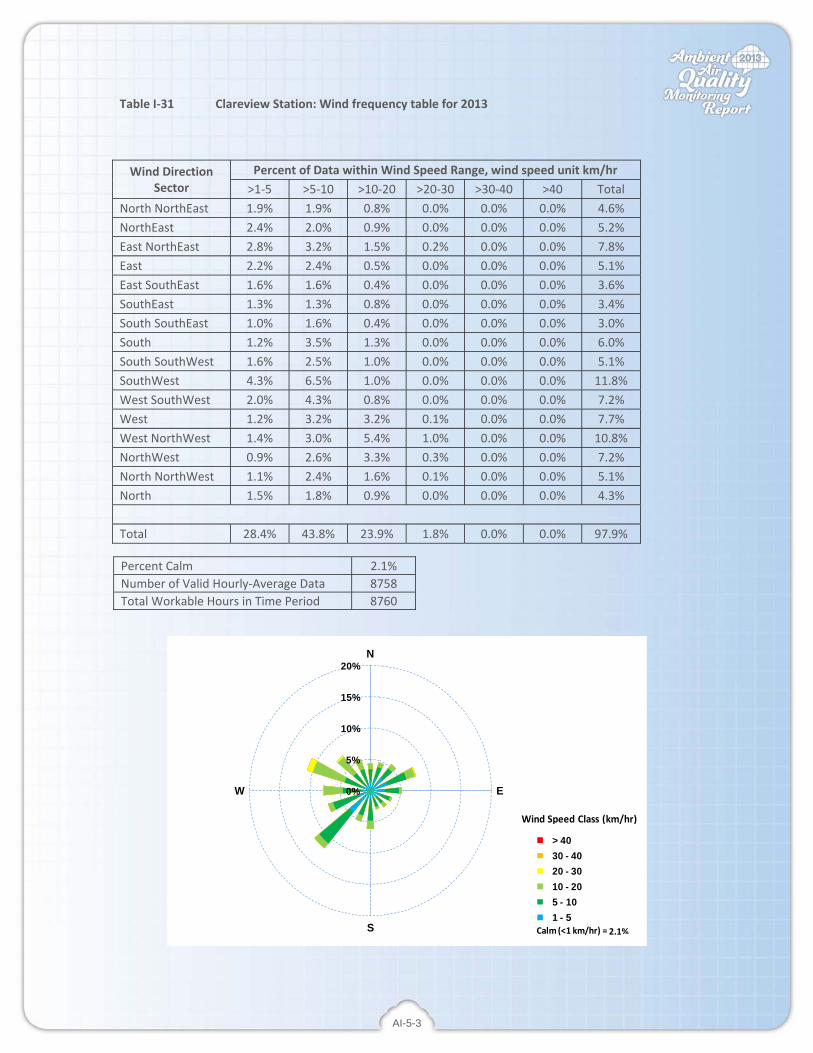
AI-5-3
Table I‐31 Clareview Station: Wind frequency table for 2013
Wind Direction Sector
Percent of Data within Wind Speed Range, wind speed unit km/hr >1‐5 >5‐10 >10‐20 >20‐30 >30‐40 >40 Total
North NorthEast 1.9% 1.9% 0.8% 0.0% 0.0% 0.0% 4.6% NorthEast 2.4% 2.0% 0.9% 0.0% 0.0% 0.0% 5.2% East NorthEast 2.8% 3.2% 1.5% 0.2% 0.0% 0.0% 7.8% East 2.2% 2.4% 0.5% 0.0% 0.0% 0.0% 5.1% East SouthEast 1.6% 1.6% 0.4% 0.0% 0.0% 0.0% 3.6% SouthEast 1.3% 1.3% 0.8% 0.0% 0.0% 0.0% 3.4% South SouthEast 1.0% 1.6% 0.4% 0.0% 0.0% 0.0% 3.0% South 1.2% 3.5% 1.3% 0.0% 0.0% 0.0% 6.0% South SouthWest 1.6% 2.5% 1.0% 0.0% 0.0% 0.0% 5.1% SouthWest 4.3% 6.5% 1.0% 0.0% 0.0% 0.0% 11.8% West SouthWest 2.0% 4.3% 0.8% 0.0% 0.0% 0.0% 7.2% West 1.2% 3.2% 3.2% 0.1% 0.0% 0.0% 7.7% West NorthWest 1.4% 3.0% 5.4% 1.0% 0.0% 0.0% 10.8% NorthWest 0.9% 2.6% 3.3% 0.3% 0.0% 0.0% 7.2% North NorthWest 1.1% 2.4% 1.6% 0.1% 0.0% 0.0% 5.1% North 1.5% 1.8% 0.9% 0.0% 0.0% 0.0% 4.3% Total 28.4% 43.8% 23.9% 1.8% 0.0% 0.0% 97.9%
Percent Calm 2.1% Number of Valid Hourly‐Average Data 8758 Total Workable Hours in Time Period 8760
0%
5%
10%
15%
20%N
E
S
W
> 4030 - 4020 - 3010 - 205 - 101 - 5
Wind Speed Class (km/hr)
Calm (<1 km/hr) = 2.1%

A1.6
PART 6. Woodcroft Station

AI-6-1
Table I‐32 Woodcroft Station: Summary statistics for continuous air monitoring results for 2013
Parameter Unit Calibration & AIC Valid Data Uptime Summary Statistics for Hourly Average Data
(hours) (hours) (%) Average Minimum Maximum
SO2 ppb 452 8251 99.4% 1 < 1 17
NO ppb 451 8221 99.0% 8.1 < 0.1 379.0
NO2 ppb 451 8221 99.0% 15.2 1.4 88.5
NOx ppb 451 8221 99.0% 23.4 1.3 468.7
O3 ppb 268 4864 99.9% 18 < 1 63.0
PM2.5 µg/m3 2 8573 97.9% 7 < 1 73
Temperature C 0 8725 99.6% 4.2 ‐30.8 33.2
Relative Humidity % 0 8725 99.6% 65 10 95
Wind Speed km/hr 0 8727 99.6% 8.6 Calm 33.4

AI-6-2
Table I‐33 Woodcroft Station: Summary of continuous SO2 monitoring results for 2013
Valid Operational Average Maximum 1‐Hour Maximum 24‐Hour Percent of Data within Concentration Range (%)
Month 1‐Hr data Time 1‐Hr Conc. 1‐Hr Conc. Exceedance a 24‐Hr Conc. Exceedance b (no.) (%) (ppb) (ppb) (no.) (ppb) (no.) <=1 >1‐5 >5‐10 >10‐48 >48‐172 >172
January 707 100.0% 1 6 0 2 0 81.5 18.4 0.1 0.0 0.0 0.0 February 613 96.1% 1 8 0 1 0 85.0 14.5 0.5 0.0 0.0 0.0 March 704 100.0% 1 14 0 2 0 76.8 21.9 1.1 0.1 0.0 0.0 April 684 100.0% < 1 11 0 1 0 93.9 5.4 0.6 0.1 0.0 0.0 May 679 96.4% 1 10 0 2 0 90.6 7.8 1.3 0.3 0.0 0.0June 679 99.7% < 1 5 0 1 0 94.0 5.9 0.1 0.0 0.0 0.0 July 706 100.0% < 1 11 0 2 0 93.2 6.4 0.3 0.1 0.0 0.0 August 706 100.0% 1 17 0 4 0 88.7 9.1 1.8 0.4 0.0 0.0 September 681 99.9% < 1 6 0 1 0 92.5 7.3 0.1 0.0 0.0 0.0 October 705 100.0% < 1 16 0 3 0 96.3 2.7 0.6 0.4 0.0 0.0 November 683 100.0% < 1 4 0 1 0 95.3 4.7 0.0 0.0 0.0 0.0 December 704 100.0% 1 7 0 1 0 85.8 13.9 0.3 0.0 0.0 0.0 Annual 8251 99.4% 1 17 0 4 0 89.5 9.8 0.6 0.1 0.0 0.0
a. 1‐hour Alberta Ambient Air Quality Objective = 172 ppb b. 24‐hour Alberta Ambient Air Quality Objective = 48 pp

AI-6-3
Table I‐34 Woodcroft Station: Summary of continuous NO monitoring results for 2013
Valid Operational Average Maximum 1‐Hour Maximum 24‐Hour Percent of Data within Concentration Range (%)
Month 1‐Hr data Time 1‐Hr Conc. 1‐Hr Conc. Exceedance a 24‐Hr Conc. Exceedance a (no.) (%) (ppb) (ppb) (no.) (ppb) (no.) <=5 >5‐15 >15‐30 >30‐100 >100‐159 >159
January 707 100.0% 18.5 379.0 ‐ 144.3 ‐ 42.1 27.0 15.4 12.4 1.3 1.7 February 634 99.3% 13.8 218.5 ‐ 81.8 ‐ 39.7 36.0 13.6 9.0 1.1 0.6 March 704 100.0% 5.8 62.4 ‐ 10.9 ‐ 61.2 31.0 6.3 1.6 0.0 0.0 April 684 100.0% 3.6 69.1 ‐ 14.5 ‐ 83.2 12.9 1.8 2.2 0.0 0.0 May 679 96.4% 2.4 58.6 ‐ 9.9 ‐ 88.2 8.5 2.2 1.0 0.0 0.0June 628 92.5% 2.3 38.2 ‐ 5.0 ‐ 86.9 12.3 0.6 0.2 0.0 0.0 July 706 100.0% 2.8 47.3 ‐ 9.6 ‐ 85.7 11.8 2.0 0.6 0.0 0.0 August 706 100.0% 3.7 109.9 ‐ 14.6 ‐ 81.7 12.3 4.2 1.6 0.1 0.0 September 681 99.9% 5.2 69.8 ‐ 17.0 ‐ 73.0 17.9 5.9 3.2 0.0 0.0 October 705 100.0% 9.8 76.0 ‐ 20.8 ‐ 52.8 28.2 10.4 8.7 0.0 0.0 November 683 100.0% 17.6 246.3 ‐ 79.1 ‐ 34.0 30.3 21.7 11.9 1.2 1.0 December 704 100.0% 11.9 126.0 ‐ 35.1 ‐ 41.9 35.1 14.2 8.5 0.3 0.0 Annual 8221 99.0% 8.1 379.0 ‐ 144.3 ‐ 64.1 22.0 8.2 5.1 0.3 0.3
a. There is no Alberta Ambient Air Quality Objective for NO.
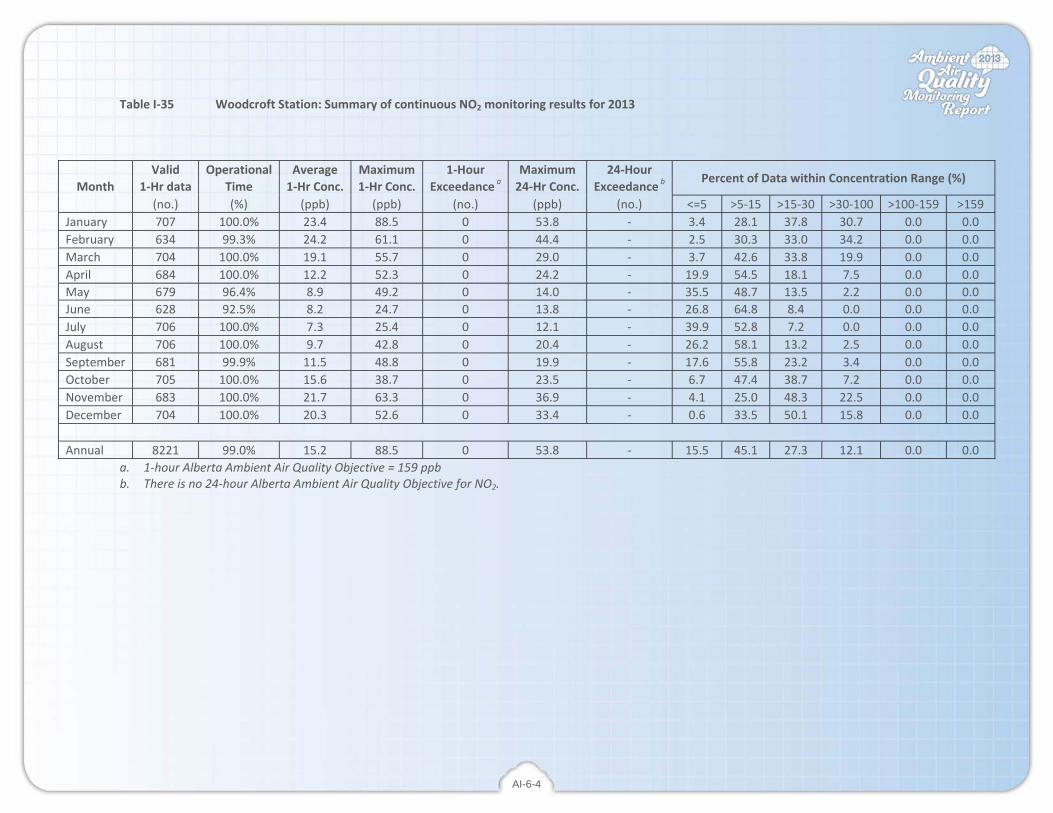
AI-6-4
Table I‐35 Woodcroft Station: Summary of continuous NO2 monitoring results for 2013
Valid Operational Average Maximum 1‐Hour Maximum 24‐Hour Percent of Data within Concentration Range (%)
Month 1‐Hr data Time 1‐Hr Conc. 1‐Hr Conc. Exceedance a 24‐Hr Conc. Exceedance b (no.) (%) (ppb) (ppb) (no.) (ppb) (no.) <=5 >5‐15 >15‐30 >30‐100 >100‐159 >159
January 707 100.0% 23.4 88.5 0 53.8 ‐ 3.4 28.1 37.8 30.7 0.0 0.0 February 634 99.3% 24.2 61.1 0 44.4 ‐ 2.5 30.3 33.0 34.2 0.0 0.0 March 704 100.0% 19.1 55.7 0 29.0 ‐ 3.7 42.6 33.8 19.9 0.0 0.0 April 684 100.0% 12.2 52.3 0 24.2 ‐ 19.9 54.5 18.1 7.5 0.0 0.0 May 679 96.4% 8.9 49.2 0 14.0 ‐ 35.5 48.7 13.5 2.2 0.0 0.0June 628 92.5% 8.2 24.7 0 13.8 ‐ 26.8 64.8 8.4 0.0 0.0 0.0 July 706 100.0% 7.3 25.4 0 12.1 ‐ 39.9 52.8 7.2 0.0 0.0 0.0 August 706 100.0% 9.7 42.8 0 20.4 ‐ 26.2 58.1 13.2 2.5 0.0 0.0 September 681 99.9% 11.5 48.8 0 19.9 ‐ 17.6 55.8 23.2 3.4 0.0 0.0 October 705 100.0% 15.6 38.7 0 23.5 ‐ 6.7 47.4 38.7 7.2 0.0 0.0 November 683 100.0% 21.7 63.3 0 36.9 ‐ 4.1 25.0 48.3 22.5 0.0 0.0 December 704 100.0% 20.3 52.6 0 33.4 ‐ 0.6 33.5 50.1 15.8 0.0 0.0 Annual 8221 99.0% 15.2 88.5 0 53.8 ‐ 15.5 45.1 27.3 12.1 0.0 0.0
a. 1‐hour Alberta Ambient Air Quality Objective = 159 ppb b. There is no 24‐hour Alberta Ambient Air Quality Objective for NO2.

AI-6-5
Table I‐36 Woodcroft Station: Summary of continuous NOx monitoring results for 2013
Valid Operational Average Maximum 1‐Hour Maximum 24‐Hour Percent of Data within Concentration Range (%)
Month 1‐Hr data Time 1‐Hr Conc. 1‐Hr Conc. Exceedance a 24‐Hr Conc. Exceedance a (no.) (%) (ppb) (ppb) (no.) (ppb) (no.) <=5 >5‐15 >15‐30 >30‐100 >100‐159 >159
January 707 100.0% 42.2 468.7 ‐ 199.2 ‐ 2.3 19.2 32.1 39.7 4.2 2.4 February 634 99.3% 38.2 279.4 ‐ 126.2 ‐ 1.3 16.6 35.2 42.3 3.6 1.1 March 704 100.0% 24.9 107.4 ‐ 36.9 ‐ 2.1 32.7 35.9 29.0 0.3 0.0 April 684 100.0% 15.8 118.8 ‐ 38.7 ‐ 12.9 54.5 21.2 11.0 0.4 0.0 May 679 96.4% 11.2 93.9 ‐ 22.0 ‐ 31.5 47.9 14.0 6.6 0.0 0.0June 628 92.5% 10.6 57.4 ‐ 17.0 ‐ 15.6 65.4 17.0 1.9 0.0 0.0 July 706 100.0% 10.1 72.6 ‐ 21.8 ‐ 24.2 58.9 13.7 3.1 0.0 0.0 August 706 100.0% 13.4 147.5 ‐ 31.3 ‐ 15.9 59.6 14.2 10.2 0.1 0.0 September 681 99.9% 16.7 101.4 ‐ 35.2 ‐ 10.0 53.0 23.1 13.8 0.1 0.0 October 705 100.0% 25.4 112.6 ‐ 42.1 ‐ 3.5 34.5 33.0 28.2 0.7 0.0 November 683 100.0% 39.3 310.0 ‐ 116.3 ‐ 1.8 18.2 27.7 47.6 3.2 1.6 December 704 100.0% 32.2 178.5 ‐ 68.5 ‐ 0.1 19.3 40.8 36.8 2.8 0.1 Annual 8221 99.0% 23.4 468.7 ‐ 199.2 ‐ 10.1 39.9 25.7 22.6 1.3 0.4
a. There is no Alberta Ambient Air Quality Objective for NOx.
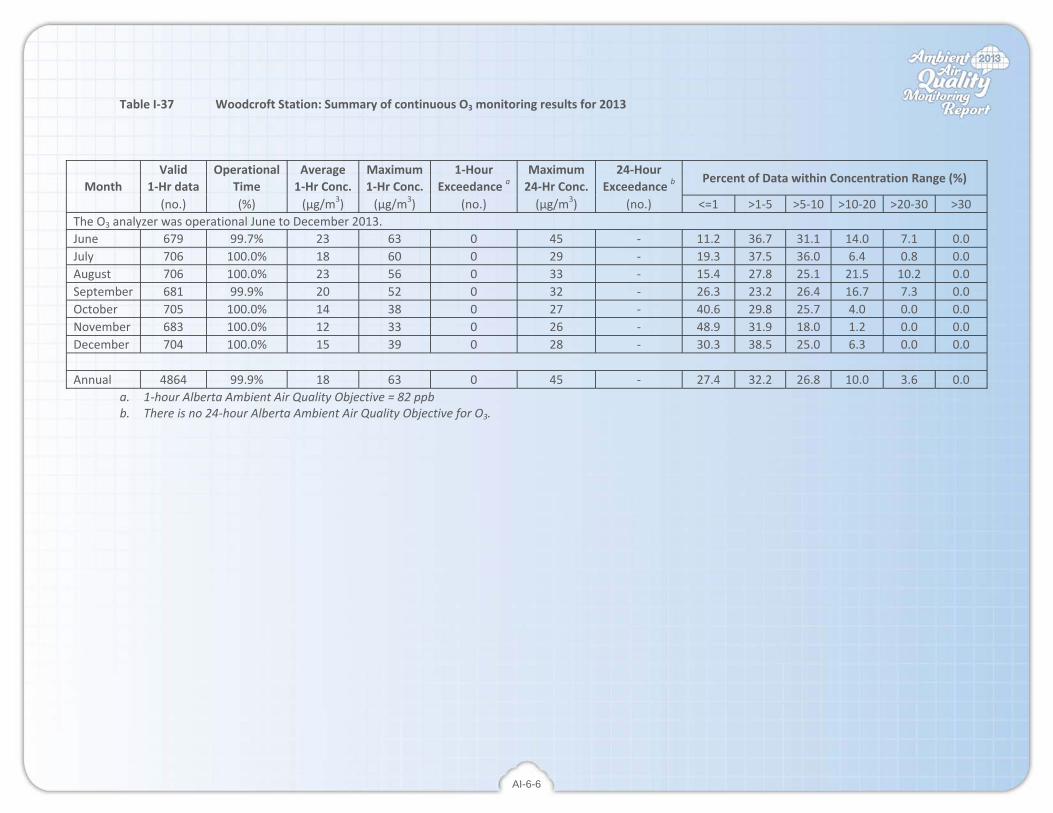
AI-6-6
Table I‐37 Woodcroft Station: Summary of continuous O3 monitoring results for 2013
Valid Operational Average Maximum 1‐Hour Maximum 24‐Hour Percent of Data within Concentration Range (%)
Month 1‐Hr data Time 1‐Hr Conc. 1‐Hr Conc. Exceedance a 24‐Hr Conc. Exceedance b (no.) (%) (µg/m3) (µg/m3) (no.) (µg/m3) (no.) <=1 >1‐5 >5‐10 >10‐20 >20‐30 >30
The O3 analyzer was operational June to December 2013.June 679 99.7% 23 63 0 45 ‐ 11.2 36.7 31.1 14.0 7.1 0.0 July 706 100.0% 18 60 0 29 ‐ 19.3 37.5 36.0 6.4 0.8 0.0 August 706 100.0% 23 56 0 33 ‐ 15.4 27.8 25.1 21.5 10.2 0.0 September 681 99.9% 20 52 0 32 ‐ 26.3 23.2 26.4 16.7 7.3 0.0 October 705 100.0% 14 38 0 27 ‐ 40.6 29.8 25.7 4.0 0.0 0.0 November 683 100.0% 12 33 0 26 ‐ 48.9 31.9 18.0 1.2 0.0 0.0 December 704 100.0% 15 39 0 28 ‐ 30.3 38.5 25.0 6.3 0.0 0.0 Annual 4864 99.9% 18 63 0 45 ‐ 27.4 32.2 26.8 10.0 3.6 0.0
a. 1‐hour Alberta Ambient Air Quality Objective = 82 ppb b. There is no 24‐hour Alberta Ambient Air Quality Objective for O3.
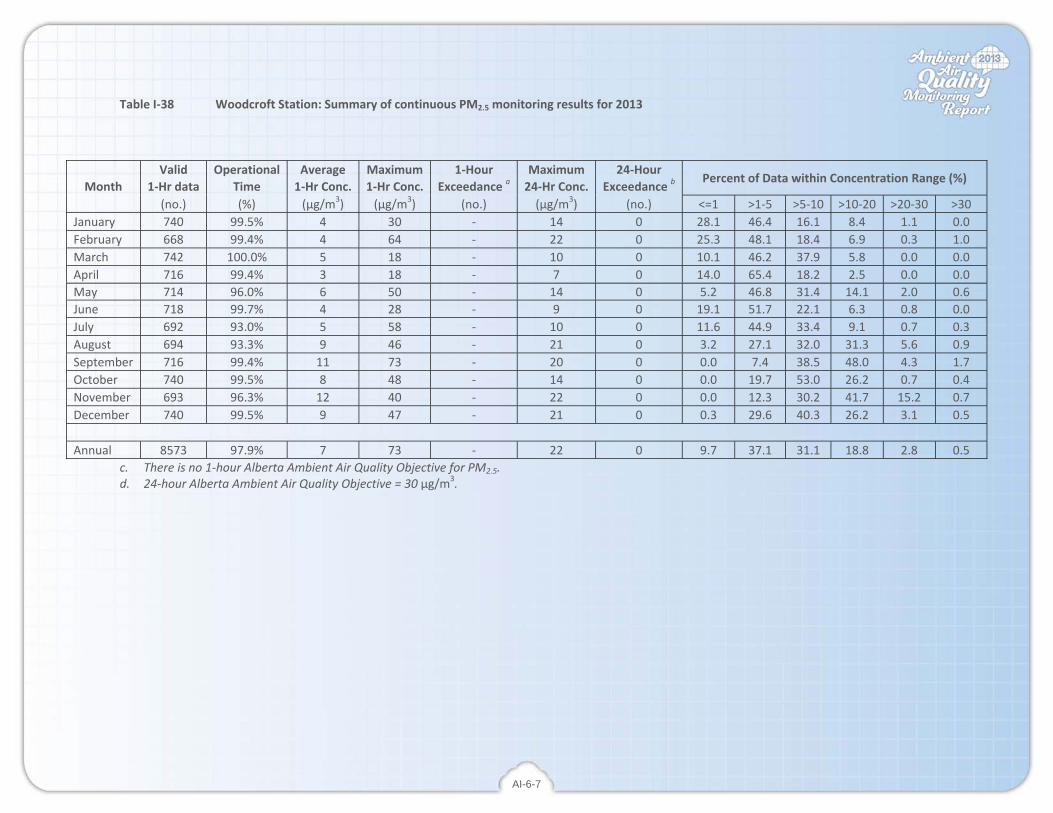
AI-6-7
Table I‐38 Woodcroft Station: Summary of continuous PM2.5 monitoring results for 2013
Valid Operational Average Maximum 1‐Hour Maximum 24‐Hour Percent of Data within Concentration Range (%)
Month 1‐Hr data Time 1‐Hr Conc. 1‐Hr Conc. Exceedance a 24‐Hr Conc. Exceedance b (no.) (%) (µg/m3) (µg/m3) (no.) (µg/m3) (no.) <=1 >1‐5 >5‐10 >10‐20 >20‐30 >30
January 740 99.5% 4 30 ‐ 14 0 28.1 46.4 16.1 8.4 1.1 0.0 February 668 99.4% 4 64 ‐ 22 0 25.3 48.1 18.4 6.9 0.3 1.0 March 742 100.0% 5 18 ‐ 10 0 10.1 46.2 37.9 5.8 0.0 0.0 April 716 99.4% 3 18 ‐ 7 0 14.0 65.4 18.2 2.5 0.0 0.0 May 714 96.0% 6 50 ‐ 14 0 5.2 46.8 31.4 14.1 2.0 0.6June 718 99.7% 4 28 ‐ 9 0 19.1 51.7 22.1 6.3 0.8 0.0 July 692 93.0% 5 58 ‐ 10 0 11.6 44.9 33.4 9.1 0.7 0.3 August 694 93.3% 9 46 ‐ 21 0 3.2 27.1 32.0 31.3 5.6 0.9 September 716 99.4% 11 73 ‐ 20 0 0.0 7.4 38.5 48.0 4.3 1.7 October 740 99.5% 8 48 ‐ 14 0 0.0 19.7 53.0 26.2 0.7 0.4 November 693 96.3% 12 40 ‐ 22 0 0.0 12.3 30.2 41.7 15.2 0.7 December 740 99.5% 9 47 ‐ 21 0 0.3 29.6 40.3 26.2 3.1 0.5 Annual 8573 97.9% 7 73 ‐ 22 0 9.7 37.1 31.1 18.8 2.8 0.5
c. There is no 1‐hour Alberta Ambient Air Quality Objective for PM2.5. d. 24‐hour Alberta Ambient Air Quality Objective = 30 µg/m3.

AI-6-8
Table I‐39 Woodcroft Station: Summary of continuous ambient temperature monitoring results for 2013
Valid Operational Average Minimum Maximum Percent of Data within temperature Range (%)
Month 1‐Hr data Time 1‐Hr Temp. 1‐Hr Temp. 1‐Hr Temp. (no.) (%) (°C) (°C) (°C) <=‐30 >‐30~‐15 >‐15~‐0 >0~‐15 >15~30 >30
January 744 100.0% ‐8.8 ‐28.2 8.2 0.0 19.9 67.2 12.9 0.0 0.0 February 672 100.0% ‐3.5 ‐13.7 8.8 0.0 0.0 74.0 26.0 0.0 0.0 March 744 100.0% ‐5.5 ‐17.5 10.8 0.0 7.1 70.0 22.8 0.0 0.0 April 720 100.0% 1.2 ‐11.4 19.4 0.0 0.0 44.6 52.8 2.6 0.0 May 716 96.2% 14.2 ‐4.6 30.0 0.0 0.0 1.4 53.5 45.0 0.1June 718 99.7% 15.3 5.5 27.3 0.0 0.0 0.0 52.4 47.6 0.0 July 744 100.0% 17.1 7.7 33.2 0.0 0.0 0.0 34.5 64.7 0.8 August 743 99.9% 18.3 8.5 27.4 0.0 0.0 0.0 23.6 76.4 0.0 September 718 99.7% 14.9 ‐0.3 30.4 0.0 0.0 0.1 50.1 49.4 0.3 October 742 99.7% 6.0 ‐8.6 17.3 0.0 0.0 11.3 86.7 2.0 0.0 November 720 100.0% ‐6.0 ‐23.6 10.3 0.0 8.2 70.4 21.4 0.0 0.0 December 744 100.0% ‐13.0 ‐30.8 5.9 1.1 52.2 34.1 12.6 0.0 0.0 Annual 8725 99.6% 4.2 ‐30.8 33.2 0.1 7.4 30.9 37.4 24.1 0.1
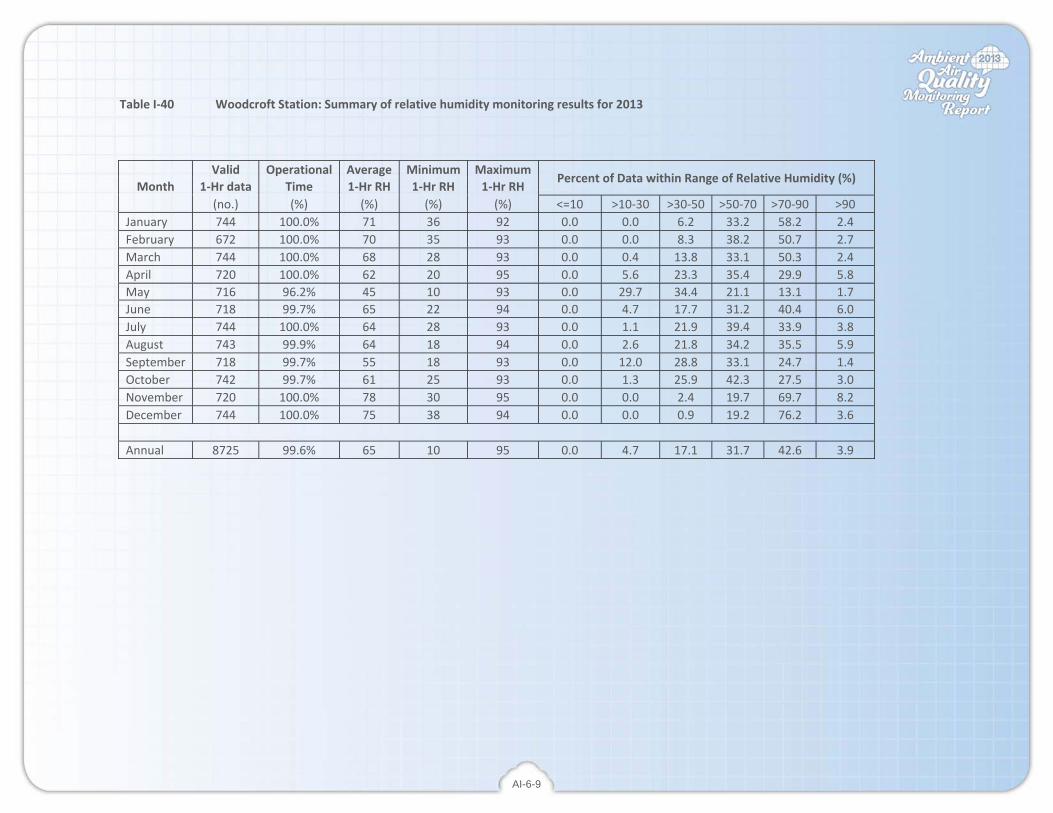
AI-6-9
Table I‐40 Woodcroft Station: Summary of relative humidity monitoring results for 2013
Valid Operational Average Minimum Maximum Percent of Data within Range of Relative Humidity (%)
Month 1‐Hr data Time 1‐Hr RH 1‐Hr RH 1‐Hr RH (no.) (%) (%) (%) (%) <=10 >10‐30 >30‐50 >50‐70 >70‐90 >90
January 744 100.0% 71 36 92 0.0 0.0 6.2 33.2 58.2 2.4 February 672 100.0% 70 35 93 0.0 0.0 8.3 38.2 50.7 2.7 March 744 100.0% 68 28 93 0.0 0.4 13.8 33.1 50.3 2.4 April 720 100.0% 62 20 95 0.0 5.6 23.3 35.4 29.9 5.8 May 716 96.2% 45 10 93 0.0 29.7 34.4 21.1 13.1 1.7June 718 99.7% 65 22 94 0.0 4.7 17.7 31.2 40.4 6.0 July 744 100.0% 64 28 93 0.0 1.1 21.9 39.4 33.9 3.8 August 743 99.9% 64 18 94 0.0 2.6 21.8 34.2 35.5 5.9 September 718 99.7% 55 18 93 0.0 12.0 28.8 33.1 24.7 1.4 October 742 99.7% 61 25 93 0.0 1.3 25.9 42.3 27.5 3.0 November 720 100.0% 78 30 95 0.0 0.0 2.4 19.7 69.7 8.2 December 744 100.0% 75 38 94 0.0 0.0 0.9 19.2 76.2 3.6 Annual 8725 99.6% 65 10 95 0.0 4.7 17.1 31.7 42.6 3.9

AI-6-10
Table I‐41 Woodcroft Station: Wind frequency table for 2013
Wind Direction Sector
Percent of Data within Wind Speed Range, wind speed unit km/hr >1‐5 >5‐10 >10‐20 >20‐30 >30‐40 >40 Total
North NorthEast 1.2% 1.6% 1.0% 0.0% 0.0% 0.0% 3.8% NorthEast 1.1% 1.4% 0.5% 0.0% 0.0% 0.0% 3.0% East NorthEast 1.2% 1.9% 0.8% 0.1% 0.0% 0.0% 4.1% East 1.5% 3.0% 1.3% 0.0% 0.0% 0.0% 5.7% East SouthEast 0.9% 1.0% 0.4% 0.0% 0.0% 0.0% 2.3% SouthEast 0.7% 0.7% 0.8% 0.2% 0.0% 0.0% 2.4% South SouthEast 1.0% 2.0% 3.3% 0.7% 0.0% 0.0% 7.1% South 2.7% 6.0% 4.4% 0.2% 0.0% 0.0% 13.4% South SouthWest 3.7% 5.9% 1.3% 0.0% 0.0% 0.0% 10.9% SouthWest 2.6% 2.4% 0.2% 0.0% 0.0% 0.0% 5.3% West SouthWest 1.7% 1.4% 0.1% 0.0% 0.0% 0.0% 3.3% West 1.3% 2.7% 0.7% 0.0% 0.0% 0.0% 4.7% West NorthWest 1.5% 3.4% 3.8% 0.4% 0.0% 0.0% 9.1% NorthWest 1.4% 3.3% 6.1% 0.9% 0.0% 0.0% 11.7% North NorthWest 1.2% 3.0% 3.0% 0.2% 0.0% 0.0% 7.5% North 1.0% 1.6% 2.3% 0.2% 0.0% 0.0% 5.1% Total 24.6% 41.4% 30.0% 3.0% 0.1% 0.0% 99.1%
Percent Calm 0.9% Number of Valid Hourly‐Average Data 8727 Total Workable Hours in Time Period 8760
0%
5%
10%
15%
20%N
E
S
W
> 4030 - 4020 - 3010 - 205 - 101 - 5
Wind Speed Class (km/hr)
Calm (<1 km/hr) = 0.9%

A1.7
PART 7. Edmonton Centre Station
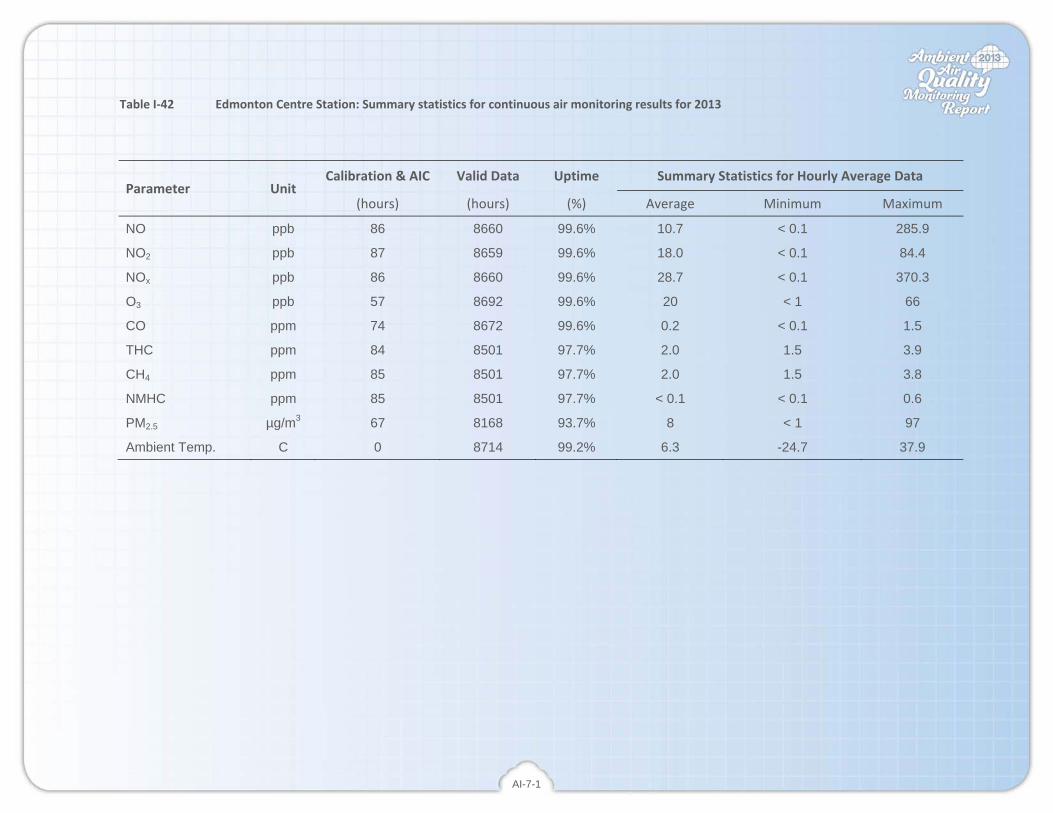
AI-7-1
Table I‐42 Edmonton Centre Station: Summary statistics for continuous air monitoring results for 2013
Parameter Unit Calibration & AIC Valid Data Uptime Summary Statistics for Hourly Average Data
(hours) (hours) (%) Average Minimum Maximum
NO ppb 86 8660 99.6% 10.7 < 0.1 285.9
NO2 ppb 87 8659 99.6% 18.0 < 0.1 84.4
NOx ppb 86 8660 99.6% 28.7 < 0.1 370.3
O3 ppb 57 8692 99.6% 20 < 1 66
CO ppm 74 8672 99.6% 0.2 < 0.1 1.5
THC ppm 84 8501 97.7% 2.0 1.5 3.9
CH4 ppm 85 8501 97.7% 2.0 1.5 3.8
NMHC ppm 85 8501 97.7% < 0.1 < 0.1 0.6
PM2.5 µg/m3 67 8168 93.7% 8 < 1 97
Ambient Temp. C 0 8714 99.2% 6.3 -24.7 37.9

AI-7-2
Table I‐43 Edmonton Centre Station: Summary of continuous NO monitoring results for 2013
Valid Operational Average Maximum 1‐Hour Maximum 24‐Hour Percent of Data within Concentration Range (%)
Month 1‐Hr data Time 1‐Hr Conc. 1‐Hr Conc. Exceedance a 24‐Hr Conc. Exceedance a (no.) (%) (ppb) (ppb) (no.) (ppb) (no.) <=5 >5‐15 >15‐30 >30‐100 >100‐159 >159
January 736 96.8% 23.2 285.9 ‐ 124.4 ‐ 20.4 35.5 20.9 20.1 2.0 1.1 February 663 100.0% 18.3 193.5 ‐ 92.8 ‐ 31.2 35.1 18.4 12.2 2.3 0.8 March 736 99.7% 11.9 55.8 ‐ 22.0 ‐ 29.2 41.7 22.7 6.4 0.0 0.0 April 713 100.0% 7.4 84.3 ‐ 18.2 ‐ 49.5 40.8 7.0 2.7 0.0 0.0 May 737 100.0% 4.0 117.8 ‐ 10.4 ‐ 78.6 17.1 3.3 0.9 0.1 0.0June 709 99.7% 3.6 34.0 ‐ 7.4 ‐ 79.5 16.6 3.2 0.6 0.0 0.0 July 736 99.9% 2.7 38.1 ‐ 8.5 ‐ 89.3 8.3 2.0 0.4 0.0 0.0 August 735 99.7% 4.9 57.1 ‐ 12.7 ‐ 71.2 22.9 4.5 1.5 0.0 0.0 September 711 99.7% 7.0 145.0 ‐ 18.4 ‐ 61.7 26.2 9.0 3.0 0.1 0.0 October 733 99.5% 9.0 68.9 ‐ 20.0 ‐ 41.2 42.8 12.0 4.0 0.0 0.0 November 714 100.0% 20.2 226.7 ‐ 55.6 ‐ 13.3 41.2 26.9 16.9 1.1 0.6 December 737 99.9% 16.4 82.5 ‐ 51.2 ‐ 18.6 38.7 28.0 14.8 0.0 0.0 Annual 8660 99.6% 10.7 285.9 ‐ 124.4 ‐ 48.7 30.5 13.1 6.9 0.5 0.2
a. There is no Alberta Ambient Air Quality Objective for NO.

AI-7-3
Table I‐44 Edmonton Centre Station: Summary of continuous NO2 monitoring results for 2013
Valid Operational Average Maximum 1‐Hour Maximum 24‐Hour Percent of Data within Concentration Range (%)
Month 1‐Hr data Time 1‐Hr Conc. 1‐Hr Conc. Exceedance a 24‐Hr Conc. Exceedance b (no.) (%) (ppb) (ppb) (no.) (ppb) (no.) <=5 >5‐15 >15‐30 >30‐100 >100‐159 >159
January 736 96.8% 30.6 84.4 0 58.9 ‐ 0.4 12.2 39.0 48.4 0.0 0.0 February 663 100.0% 30.0 68.8 0 51.5 ‐ 0.0 11.8 42.1 46.2 0.0 0.0 March 736 99.7% 27.1 61.4 0 39.7 ‐ 0.0 10.9 52.7 36.4 0.0 0.0 April 713 100.0% 17.3 59.5 0 30.0 ‐ 1.8 46.8 42.8 8.6 0.0 0.0 May 737 100.0% 12.4 52.9 0 22.2 ‐ 9.1 65.0 22.1 3.8 0.0 0.0June 709 99.7% 11.8 32.7 0 16.5 ‐ 7.1 67.8 25.0 0.1 0.0 0.0 July 736 99.9% 10.9 59.6 0 18.1 ‐ 1.9 82.3 14.9 0.8 0.0 0.0 August 735 99.7% 7.7 35.7 0 21.8 ‐ 42.2 43.0 13.7 1.1 0.0 0.0 September 711 99.7% 9.5 41.0 0 15.7 ‐ 32.6 45.7 21.0 0.7 0.0 0.0 October 733 99.5% 13.6 38.9 0 18.9 ‐ 12.8 48.6 34.9 3.7 0.0 0.0 November 713 100.0% 22.8 57.0 0 36.3 ‐ 0.8 24.0 51.5 23.7 0.0 0.0 December 737 99.9% 23.1 54.5 0 37.9 ‐ 0.1 19.3 57.7 22.9 0.0 0.0 Annual 8659 99.6% 18.0 84.4 0 58.9 ‐ 9.1 39.9 34.7 16.2 0.0 0.0
a. 1‐hour Alberta Ambient Air Quality Objective = 159 ppb b. There is no 24‐hour Alberta Ambient Air Quality Objective for NO2.
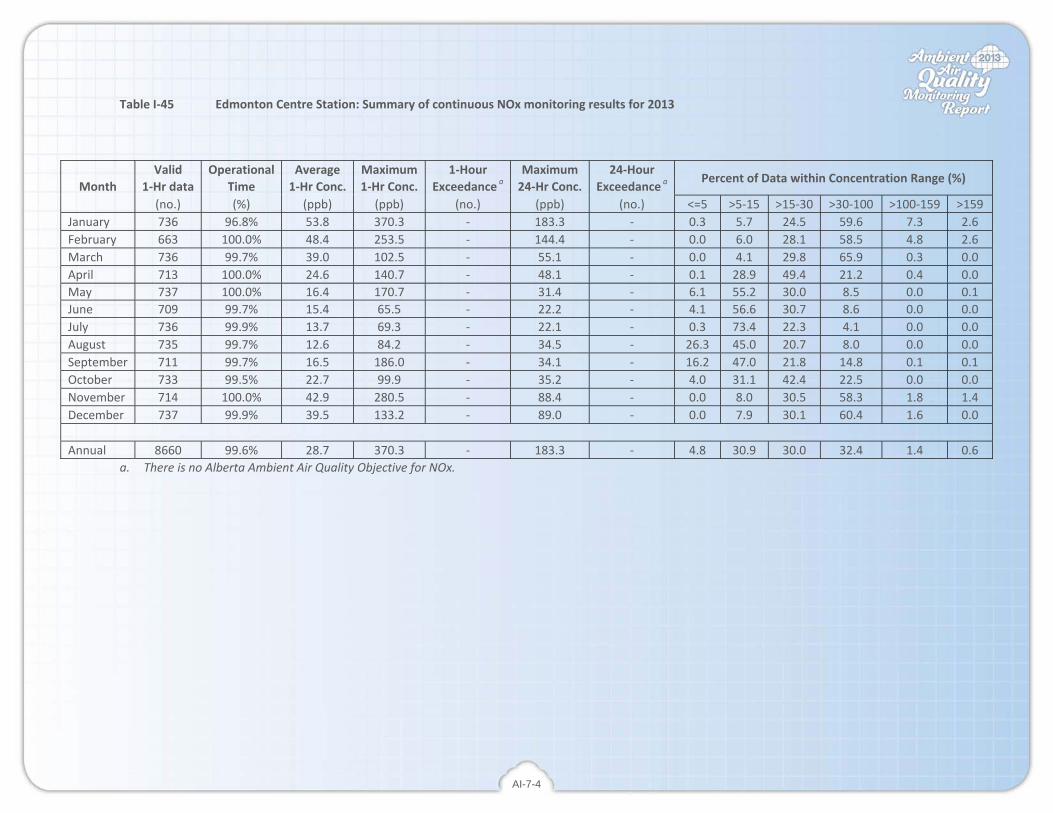
AI-7-4
Table I‐45 Edmonton Centre Station: Summary of continuous NOx monitoring results for 2013
Valid Operational Average Maximum 1‐Hour Maximum 24‐Hour Percent of Data within Concentration Range (%)
Month 1‐Hr data Time 1‐Hr Conc. 1‐Hr Conc. Exceedance a 24‐Hr Conc. Exceedance a (no.) (%) (ppb) (ppb) (no.) (ppb) (no.) <=5 >5‐15 >15‐30 >30‐100 >100‐159 >159
January 736 96.8% 53.8 370.3 ‐ 183.3 ‐ 0.3 5.7 24.5 59.6 7.3 2.6 February 663 100.0% 48.4 253.5 ‐ 144.4 ‐ 0.0 6.0 28.1 58.5 4.8 2.6 March 736 99.7% 39.0 102.5 ‐ 55.1 ‐ 0.0 4.1 29.8 65.9 0.3 0.0 April 713 100.0% 24.6 140.7 ‐ 48.1 ‐ 0.1 28.9 49.4 21.2 0.4 0.0 May 737 100.0% 16.4 170.7 ‐ 31.4 ‐ 6.1 55.2 30.0 8.5 0.0 0.1June 709 99.7% 15.4 65.5 ‐ 22.2 ‐ 4.1 56.6 30.7 8.6 0.0 0.0 July 736 99.9% 13.7 69.3 ‐ 22.1 ‐ 0.3 73.4 22.3 4.1 0.0 0.0 August 735 99.7% 12.6 84.2 ‐ 34.5 ‐ 26.3 45.0 20.7 8.0 0.0 0.0 September 711 99.7% 16.5 186.0 ‐ 34.1 ‐ 16.2 47.0 21.8 14.8 0.1 0.1 October 733 99.5% 22.7 99.9 ‐ 35.2 ‐ 4.0 31.1 42.4 22.5 0.0 0.0 November 714 100.0% 42.9 280.5 ‐ 88.4 ‐ 0.0 8.0 30.5 58.3 1.8 1.4 December 737 99.9% 39.5 133.2 ‐ 89.0 ‐ 0.0 7.9 30.1 60.4 1.6 0.0 Annual 8660 99.6% 28.7 370.3 ‐ 183.3 ‐ 4.8 30.9 30.0 32.4 1.4 0.6
a. There is no Alberta Ambient Air Quality Objective for NOx.

AI-7-5
Table I‐46 Edmonton Centre Station: Summary of continuous O3 monitoring results for 2013
Valid Operational Average Maximum 1‐Hour Maximum 24‐Hour Percent of Data within Concentration Range (%)
Month 1‐Hr data Time 1‐Hr Conc. 1‐Hr Conc. Exceedance a 24‐Hr Conc. Exceedance b (no.) (%) (ppb) (ppb) (no.) (ppb) (no.) <=10 >10‐20 >20‐30 >30‐40 >40‐82 >82
January 735 96.8% 15 41 0 38 ‐ 38.2 32.0 22.2 7.5 0.1 0.0 February 667 100.0% 18 41 0 34 ‐ 28.2 27.7 27.3 16.2 0.6 0.0 March 739 99.7% 26 61 0 47 ‐ 10.0 17.2 39.9 25.0 7.8 0.0 April 715 100.0% 33 52 0 41 ‐ 2.7 10.9 24.6 33.0 28.8 0.0 May 740 100.0% 32 61 0 43 ‐ 5.3 11.6 24.2 35.1 23.8 0.0June 714 99.7% 23 53 0 39 ‐ 9.7 34.9 36.7 14.8 3.9 0.0 July 737 99.9% 19 66 0 25 ‐ 12.8 50.7 30.7 5.3 0.5 0.0 August 738 99.7% 23 50 0 32 ‐ 12.6 30.5 32.7 19.9 4.3 0.0 September 717 100.0% 19 52 0 30 ‐ 28.5 24.7 27.6 14.6 4.6 0.0 October 736 99.5% 14 37 0 26 ‐ 36.5 40.1 21.7 1.6 0.0 0.0 November 715 100.0% 10 30 0 20 ‐ 54.5 36.6 8.8 0.0 0.0 0.0 December 739 100.0% 13 36 0 27 ‐ 39.6 40.5 18.0 1.9 0.0 0.0 Annual 8692 99.6% 20 66 0 47 ‐ 23.2 29.8 26.2 14.6 6.2 0.0
a. 1‐hour Alberta Ambient Air Quality Objective = 82 ppb b. There is no 24‐hour Alberta Ambient Air Quality Objective for O3.
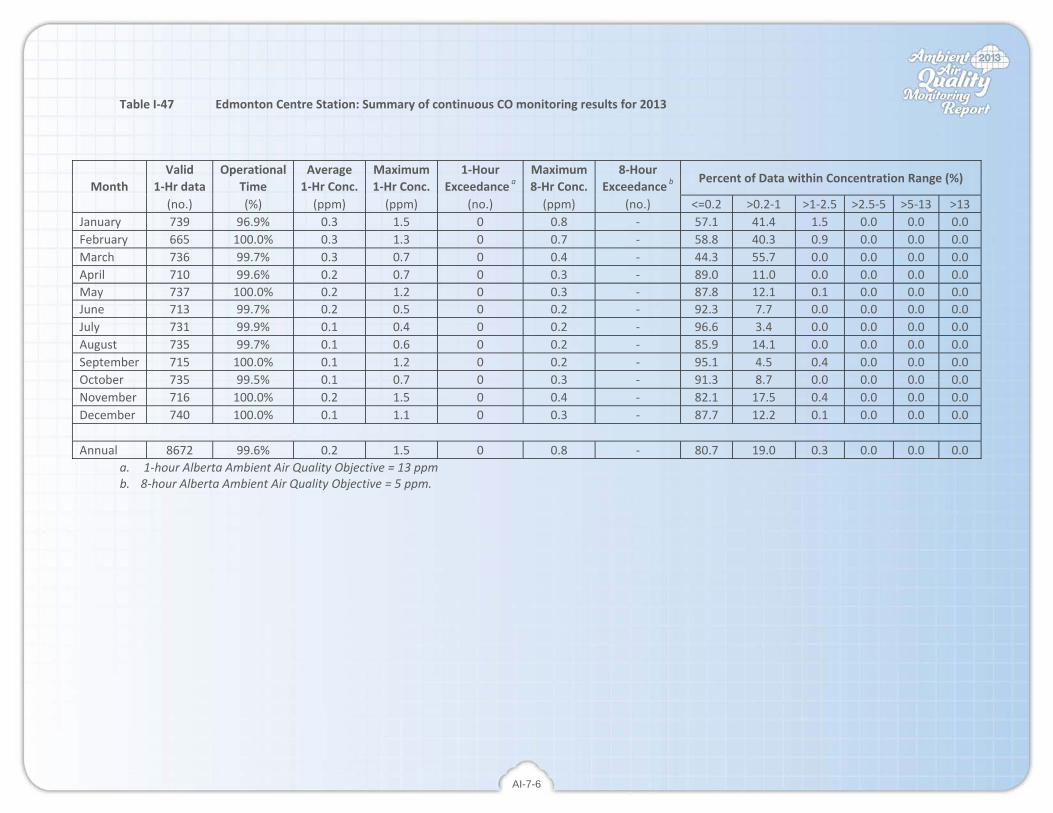
AI-7-6
Table I‐47 Edmonton Centre Station: Summary of continuous CO monitoring results for 2013
Valid Operational Average Maximum 1‐Hour Maximum 8‐Hour Percent of Data within Concentration Range (%)
Month 1‐Hr data Time 1‐Hr Conc. 1‐Hr Conc. Exceedance a 8‐Hr Conc. Exceedance b (no.) (%) (ppm) (ppm) (no.) (ppm) (no.) <=0.2 >0.2‐1 >1‐2.5 >2.5‐5 >5‐13 >13
January 739 96.9% 0.3 1.5 0 0.8 ‐ 57.1 41.4 1.5 0.0 0.0 0.0 February 665 100.0% 0.3 1.3 0 0.7 ‐ 58.8 40.3 0.9 0.0 0.0 0.0 March 736 99.7% 0.3 0.7 0 0.4 ‐ 44.3 55.7 0.0 0.0 0.0 0.0 April 710 99.6% 0.2 0.7 0 0.3 ‐ 89.0 11.0 0.0 0.0 0.0 0.0 May 737 100.0% 0.2 1.2 0 0.3 ‐ 87.8 12.1 0.1 0.0 0.0 0.0June 713 99.7% 0.2 0.5 0 0.2 ‐ 92.3 7.7 0.0 0.0 0.0 0.0 July 731 99.9% 0.1 0.4 0 0.2 ‐ 96.6 3.4 0.0 0.0 0.0 0.0 August 735 99.7% 0.1 0.6 0 0.2 ‐ 85.9 14.1 0.0 0.0 0.0 0.0 September 715 100.0% 0.1 1.2 0 0.2 ‐ 95.1 4.5 0.4 0.0 0.0 0.0 October 735 99.5% 0.1 0.7 0 0.3 ‐ 91.3 8.7 0.0 0.0 0.0 0.0 November 716 100.0% 0.2 1.5 0 0.4 ‐ 82.1 17.5 0.4 0.0 0.0 0.0 December 740 100.0% 0.1 1.1 0 0.3 ‐ 87.7 12.2 0.1 0.0 0.0 0.0 Annual 8672 99.6% 0.2 1.5 0 0.8 ‐ 80.7 19.0 0.3 0.0 0.0 0.0
a. 1‐hour Alberta Ambient Air Quality Objective = 13 ppm b. 8‐hour Alberta Ambient Air Quality Objective = 5 ppm.

AI-7-7
Table I‐48 Edmonton Centre Station: Summary of continuous THC monitoring results for 2013
Valid Operational Average Maximum 1‐Hour Maximum 24‐Hour Percent of Data within Concentration Range (%)
Month 1‐Hr data Time 1‐Hr Conc. 1‐Hr Conc. Exceedance a 24‐Hr Conc. Exceedance a (no.) (%) (ppm) (ppm) (no.) (ppm) (no.) <=1 >1‐2 >2‐3 >3‐4 >4‐5 >5
January 659 86.6% 2.1 2.9 ‐ 2.5 ‐ 0.0 46.6 53.4 0.0 0.0 0.0 February 656 98.6% 2.1 3.9 ‐ 2.9 ‐ 0.0 45.9 52.3 1.8 0.0 0.0 March 714 96.9% 2.0 2.9 ‐ 2.3 ‐ 0.0 62.5 37.5 0.0 0.0 0.0 April 711 99.7% 2.0 2.7 ‐ 2.1 ‐ 0.0 86.8 13.2 0.0 0.0 0.0 May 737 100.0% 2.0 3.0 ‐ 2.1 ‐ 0.0 89.8 10.2 0.0 0.0 0.0June 713 99.7% 1.9 2.4 ‐ 2.0 ‐ 0.0 93.4 6.6 0.0 0.0 0.0 July 684 93.2% 1.9 2.5 ‐ 2.1 ‐ 0.0 92.8 7.2 0.0 0.0 0.0 August 733 99.7% 1.9 2.9 ‐ 2.1 ‐ 0.0 88.8 11.2 0.0 0.0 0.0 September 715 99.9% 2.0 3.0 ‐ 2.1 ‐ 0.0 81.0 19.0 0.0 0.0 0.0 October 728 99.3% 1.9 3.1 ‐ 2.1 ‐ 0.0 78.8 21.0 0.1 0.0 0.0 November 712 99.6% 2.0 3.2 ‐ 2.5 ‐ 0.0 64.2 35.5 0.3 0.0 0.0 December 739 100.0% 2.1 3.9 ‐ 2.5 ‐ 0.0 52.8 46.8 0.4 0.0 0.0 Annual 8501 97.7% 2.0 3.9 ‐ 2.9 ‐ 0.0 73.9 25.9 0.2 0.0 0.0
a. There is no Alberta Ambient Air Quality Objective for THC.

AI-7-8
Table I‐49 Edmonton Centre Station: Summary of continuous CH4 monitoring results for 2013
Valid Operational Average Maximum 1‐Hour Maximum 24‐Hour Percent of Data within Concentration Range (%)
Month 1‐Hr data Time 1‐Hr Conc. 1‐Hr Conc. Exceedance a 24‐Hr Conc. Exceedance a (no.) (%) (ppm) (ppm) (no.) (ppm) (no.) <=1 >1‐2 >2‐3 >3‐4 >4‐5 >5
January 659 86.6% 2.1 2.7 ‐ 2.5 ‐ 0.0 47.0 53.0 0.0 0.0 0.0 February 656 98.6% 2.1 3.3 ‐ 2.6 ‐ 0.0 45.9 53.4 0.8 0.0 0.0 March 714 96.9% 2.0 2.9 ‐ 2.3 ‐ 0.0 62.6 37.4 0.0 0.0 0.0 April 711 99.7% 2.0 2.5 ‐ 2.1 ‐ 0.0 86.8 13.2 0.0 0.0 0.0 May 737 100.0% 2.0 2.7 ‐ 2.1 ‐ 0.0 90.4 9.6 0.0 0.0 0.0June 713 99.7% 1.9 2.4 ‐ 2.0 ‐ 0.0 93.5 6.5 0.0 0.0 0.0 July 684 93.2% 1.9 2.4 ‐ 2.1 ‐ 0.0 92.8 7.2 0.0 0.0 0.0 August 733 99.7% 1.9 2.4 ‐ 2.1 ‐ 0.0 88.8 11.2 0.0 0.0 0.0 September 715 99.9% 2.0 2.7 ‐ 2.1 ‐ 0.0 82.0 18.0 0.0 0.0 0.0 October 728 99.5% 1.9 3.0 ‐ 2.1 ‐ 0.0 79.1 20.9 0.0 0.0 0.0 November 712 99.6% 2.0 2.8 ‐ 2.4 ‐ 0.0 64.3 35.7 0.0 0.0 0.0 December 739 100.0% 2.1 3.8 ‐ 2.5 ‐ 0.0 52.9 46.7 0.4 0.0 0.0 Annual 8501 97.7% 2.0 3.8 ‐ 2.6 ‐ 0.0 74.2 25.7 0.1 0.0 0.0
a. There is no Alberta Ambient Air Quality Objective for CH4.
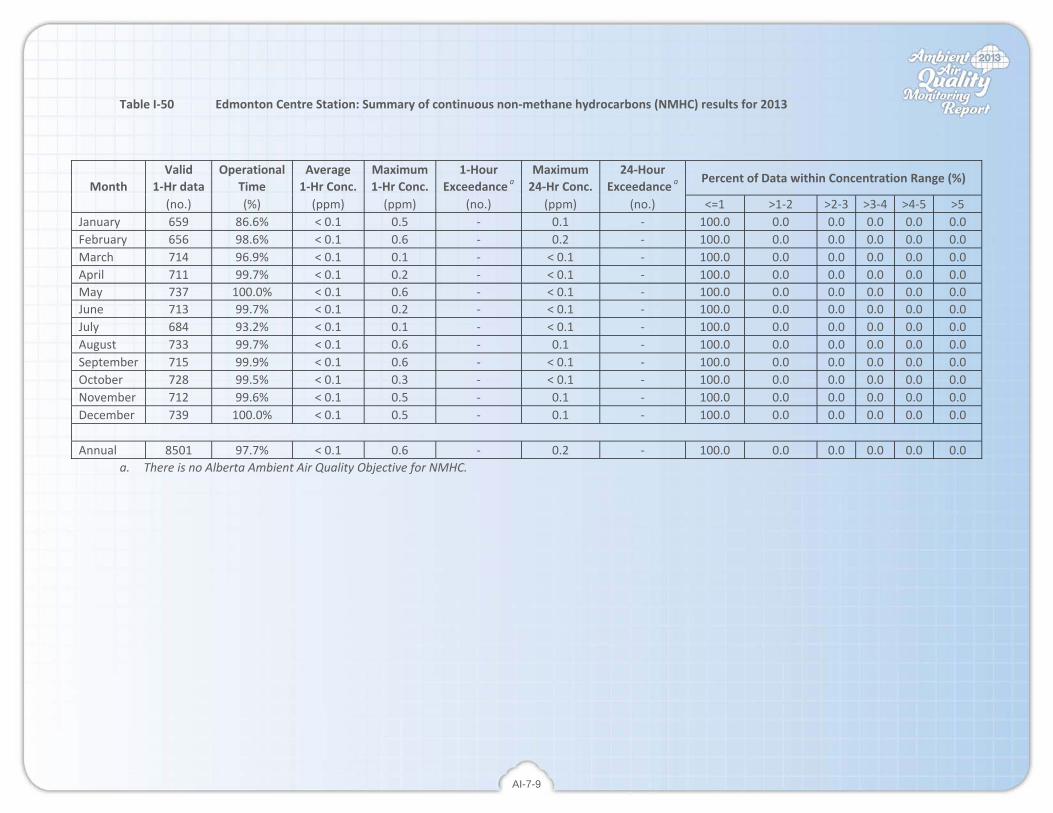
AI-7-9
Table I‐50 Edmonton Centre Station: Summary of continuous non‐methane hydrocarbons (NMHC) results for 2013
Valid Operational Average Maximum 1‐Hour Maximum 24‐Hour Percent of Data within Concentration Range (%)
Month 1‐Hr data Time 1‐Hr Conc. 1‐Hr Conc. Exceedance a 24‐Hr Conc. Exceedance a (no.) (%) (ppm) (ppm) (no.) (ppm) (no.) <=1 >1‐2 >2‐3 >3‐4 >4‐5 >5
January 659 86.6% < 0.1 0.5 ‐ 0.1 ‐ 100.0 0.0 0.0 0.0 0.0 0.0 February 656 98.6% < 0.1 0.6 ‐ 0.2 ‐ 100.0 0.0 0.0 0.0 0.0 0.0 March 714 96.9% < 0.1 0.1 ‐ < 0.1 ‐ 100.0 0.0 0.0 0.0 0.0 0.0 April 711 99.7% < 0.1 0.2 ‐ < 0.1 ‐ 100.0 0.0 0.0 0.0 0.0 0.0 May 737 100.0% < 0.1 0.6 ‐ < 0.1 ‐ 100.0 0.0 0.0 0.0 0.0 0.0June 713 99.7% < 0.1 0.2 ‐ < 0.1 ‐ 100.0 0.0 0.0 0.0 0.0 0.0 July 684 93.2% < 0.1 0.1 ‐ < 0.1 ‐ 100.0 0.0 0.0 0.0 0.0 0.0 August 733 99.7% < 0.1 0.6 ‐ 0.1 ‐ 100.0 0.0 0.0 0.0 0.0 0.0 September 715 99.9% < 0.1 0.6 ‐ < 0.1 ‐ 100.0 0.0 0.0 0.0 0.0 0.0 October 728 99.5% < 0.1 0.3 ‐ < 0.1 ‐ 100.0 0.0 0.0 0.0 0.0 0.0 November 712 99.6% < 0.1 0.5 ‐ 0.1 ‐ 100.0 0.0 0.0 0.0 0.0 0.0 December 739 100.0% < 0.1 0.5 ‐ 0.1 ‐ 100.0 0.0 0.0 0.0 0.0 0.0 Annual 8501 97.7% < 0.1 0.6 ‐ 0.2 ‐ 100.0 0.0 0.0 0.0 0.0 0.0
a. There is no Alberta Ambient Air Quality Objective for NMHC.

AI-7-10
Table I‐51 Edmonton Centre Station: Summary of continuous PM2.5 monitoring results for 2013
Valid Operational Average Maximum 1‐Hour Maximum 24‐Hour Percent of Data within Concentration Range (%)
Month 1‐Hr data Time 1‐Hr Conc. 1‐Hr Conc. Exceedance a 24‐Hr Conc. Exceedance b (no.) (%) (µg/m3) (µg/m3) (no.) (µg/m3) (no.) <=1 >1‐5 >5‐10 >10‐20 >20‐30 >30
January 727 95.2% 8 44 ‐ 24 0 19.5 30.0 22.6 21.0 5.4 1.5 February 610 91.9% 11 97 ‐ 54 2 14.8 25.1 19.8 24.1 9.2 7.0 March 740 100.0% 14 86 ‐ 45 4 1.9 20.4 29.9 27.7 10.4 9.7 April 718 99.7% 9 34 ‐ 17 0 7.1 23.4 37.2 29.7 2.2 0.4 May 729 99.0% 8 56 ‐ 22 0 4.8 35.8 34.0 19.8 4.0 1.6June 614 86.0% 6 36 ‐ 12 0 9.6 40.4 36.6 11.1 2.1 0.2 July 682 92.0% 5 23 ‐ 10 0 17.0 38.9 32.1 11.9 0.1 0.0 August 583 78.7% 9 28 ‐ 17 0 9.4 20.1 35.0 31.9 3.6 0.0 September 690 96.2% 6 37 ‐ 11 0 9.0 39.6 38.8 11.6 0.6 0.4 October 611 85.3% 5 46 ‐ 17 0 37.5 24.7 21.1 13.3 2.6 0.8 November 720 100.0% 10 33 ‐ 20 0 5.0 26.8 23.2 35.8 8.8 0.4 December 744 100.0% 8 43 ‐ 20 0 9.1 34.0 29.4 22.6 3.6 1.2 Annual 8168 93.7% 8 97 ‐ 54 6 11.7 30.0 30.0 21.8 4.4 2.0
a. There is no 1‐hour Alberta Ambient Air Quality Objective for PM2.5. b. 24‐hour Alberta Ambient Air Quality Objective 30 µg/m3.

AI-7-11
Table I‐52 Edmonton Centre Station: Summary of continuous ambient temperature monitoring results for 2013
Valid Operational Average Minimum Maximum Percent of Data within temperature Range (%)
Month 1‐Hr data Time 1‐Hr Temp. 1‐Hr Temp. 1‐Hr Temp. (no.) (%) (°C) (°C) (°C) <=‐30 >‐30~‐15 >‐15~‐0 >0~‐15 >15~30 >30
January 733 95.4% ‐7.0 ‐23.9 9.3 0.0 15.6 67.0 17.5 0.0 0.0 February 672 100.0% ‐1.9 ‐12.6 10.9 0.0 0.0 64.6 35.4 0.0 0.0 March 744 100.0% ‐3.2 ‐16.1 15.6 0.0 1.7 63.6 34.3 0.4 0.0 April 720 100.0% 3.3 ‐9.6 24.1 0.0 0.0 30.1 65.3 4.6 0.0 May 744 100.0% 16.6 ‐3.5 33.5 0.0 0.0 1.1 43.5 53.5 1.9June 719 99.9% 17.2 5.9 31.5 0.0 0.0 0.0 40.3 58.6 1.1 July 744 100.0% 19.4 8.9 37.9 0.0 0.0 0.0 23.0 72.7 4.3 August 742 99.7% 20.5 10.5 32.8 0.0 0.0 0.0 13.7 84.5 1.8 September 720 100.0% 17.3 2.4 34.6 0.0 0.0 0.0 38.8 56.7 4.6 October 739 99.3% 7.5 ‐7.3 21.3 0.0 0.0 6.6 87.8 5.5 0.0 November 720 100.0% ‐4.5 ‐21.7 12.2 0.0 4.7 68.5 26.8 0.0 0.0 December 717 96.4% ‐11.1 ‐24.7 6.5 0.0 44.4 39.3 16.3 0.0 0.0 Annual 8714 99.2% 6.3 ‐24.7 37.9 0.0 5.5 28.1 36.9 28.4 1.1

A1.8
PART 8. Edmonton East Station

AI-9-1
Table I‐53 Edmonton East Station: Summary statistics for continuous air monitoring results for 2013
Parameter Unit Calibration & AIC Valid Data Uptime Summary Statistics for Hourly Average Data
(hours) (hours) (%) Average Minimum Maximum
SO2 ppb 67 8580 98.4% 1 < 1 36
H2S ppb 59 8674 99.4% <1 <1 10
NO ppb 98 8595 99.0% 9.8 < 0.1 295.7
NO2 ppb 98 8595 99.0% 14.7 < 0.1 118.1
NOx ppb 98 8595 99.0% 24.6 < 0.1 358.1
O3 ppb 55 8691 99.6% 22 < 1 65
CO ppm 65 8672 99.5% 0.2 < 0.1 1.1
THC ppm 147 8262 95.7% 2.2 < 0.1 10.3
CH4 ppm 145 8264 95.7% 2.0 1.2 7.3
NMHC ppm 145 8264 95.7% 0.2 < 0.1 4.9
PM2.5 µg/m3 60 8627 98.9% 11 < 1 449
Ambient Temp. C 0 8310 94.6% 4.8 -29.7 34.8
Relative Humidity % 0 8334 94.9% 63 < 1 99
Wind Speed km/hr 0 8718 100.0% 9.7 1.1 58.1

AI-9-2
Table I‐54 Edmonton East Station: Summary of continuous SO2 monitoring results for 2013
Valid Operational Average Maximum 1‐Hour Maximum 24‐Hour Percent of Data within Concentration Range (%)
Month 1‐Hr data Time 1‐Hr Conc. 1‐Hr Conc. Exceedance a 24‐Hr Conc. Exceedance b (no.) (%) (ppb) (ppb) (no.) (ppb) (no.) <=1 >1‐5 >5‐10 >10‐48 >48‐172 >172
January 739 96.7% 1 9 0 2 0 77.4 21.7 0.9 0.0 0.0 0.0 February 667 100.0% 1 13 0 3 0 75.4 23.4 0.9 0.3 0.0 0.0 March 738 99.9% 1 14 0 2 0 82.2 16.0 1.4 0.4 0.0 0.0 April 716 100.0% 1 17 0 3 0 85.8 10.3 2.9 1.0 0.0 0.0 May 738 99.9% 1 36 0 5 0 83.9 10.8 3.5 1.8 0.0 0.0June 637 89.1% 2 26 0 7 0 71.6 19.8 5.5 3.1 0.0 0.0 July 710 96.3% 2 14 0 2 0 75.1 22.0 2.7 0.3 0.0 0.0 August 736 99.6% 2 20 0 5 0 78.0 17.4 3.3 1.4 0.0 0.0 September 706 99.7% 1 30 0 4 0 85.6 12.6 1.4 0.4 0.0 0.0 October 738 100.0% 1 18 0 3 0 80.6 17.3 1.5 0.5 0.0 0.0 November 715 100.0% 2 10 0 3 0 64.9 34.0 1.1 0.0 0.0 0.0 December 740 100.0% 1 9 0 2 0 73.1 26.4 0.5 0.0 0.0 0.0 Annual 8580 98.4% 1 36 0 7 0 77.9 19.3 2.1 0.7 0.0 0.0
a. 1‐hour Alberta Ambient Air Quality Objective = 172 ppb b. 24‐hour Alberta Ambient Air Quality Objective = 48 pp

AI-9-3
Table I‐55 Edmonton East Station: Summary of continuous H2S monitoring results for 2013
Valid Operational Average Maximum 1‐Hour Maximum 24‐Hour Percent of Data within Concentration Range (%)
Month 1‐Hr data Time 1‐Hr Conc. 1‐Hr Conc. Exceedance a 24‐Hr Conc. Exceedance b (no.) (%) (ppb) (ppb) (no.) (ppb) (no.) <=1 >1‐3 >3‐5 >5‐8 >8‐10 >10
January 739 96.7% <1 6 0 3 0 90.3 7.0 2.6 0.1 0.0 0.0 February 667 100.0% <1 6 0 3 0 94.3 4.2 1.2 0.3 0.0 0.0 March 738 99.9% <1 4 0 1 0 97.2 2.7 0.1 0.0 0.0 0.0 April 716 100.0% <1 5 0 1 0 96.8 2.7 0.6 0.0 0.0 0.0 May 736 99.6% <1 4 0 1 0 97.3 2.4 0.3 0.0 0.0 0.0June 714 99.9% <1 10 0 1 0 95.7 3.1 1.0 0.1 0.1 0.0 July 721 98.1% <1 5 0 1 0 97.6 2.1 0.3 0.0 0.0 0.0 August 738 99.9% <1 7 0 2 0 96.6 3.1 0.0 0.3 0.0 0.0 September 710 99.4% 1 5 0 1 0 90.3 9.2 0.6 0.0 0.0 0.0 October 740 100.0% <1 4 0 1 0 98.6 1.2 0.1 0.0 0.0 0.0 November 714 99.7% <1 4 0 1 0 95.8 4.1 0.1 0.0 0.0 0.0 December 741 100.0% <1 3 0 1 0 98.1 1.9 0.0 0.0 0.0 0.0 Annual 8674 99.4% <1 10 0 3 0 95.7 3.6 0.6 0.1 0.0 0.0
a. 1‐hour Alberta Ambient Air Quality Objective = 10 ppb b. 24‐hour Alberta Ambient Air Quality Objective = 3 ppb

AI-9-4
Table I‐56 Edmonton East Station: Summary of continuous NO monitoring results for 2013
Valid Operational Average Maximum 1‐Hour Maximum 24‐Hour Percent of Data within Concentration Range (%)
Month 1‐Hr data Time 1‐Hr Conc. 1‐Hr Conc. Exceedance a 24‐Hr Conc. Exceedance a (no.) (%) (ppb) (ppb) (no.) (ppb) (no.) <=5 >5‐15 >15‐30 >30‐100 >100‐159 >159
January 737 96.7% 16.6 273.5 ‐ 107.5 ‐ 40.2 30.0 14.5 12.9 1.9 0.5 February 662 100.0% 15.1 239.9 ‐ 118.4 ‐ 52.4 24.3 12.4 6.8 3.2 0.9 March 737 99.9% 9.3 136.6 ‐ 31.0 ‐ 51.4 33.0 10.0 5.2 0.4 0.0 April 710 100.0% 4.9 130.7 ‐ 28.8 ‐ 76.5 17.5 3.2 2.5 0.3 0.0 May 674 92.5% 3.2 49.1 ‐ 10.6 ‐ 83.2 14.1 1.8 0.9 0.0 0.0June 714 100.0% 2.7 39.5 ‐ 6.7 ‐ 83.6 14.7 1.3 0.4 0.0 0.0 July 730 99.6% 3.7 44.6 ‐ 10.1 ‐ 77.9 18.2 2.6 1.2 0.0 0.0 August 735 99.7% 5.1 85.6 ‐ 17.5 ‐ 71.4 20.4 6.4 1.8 0.0 0.0 September 710 99.4% 7.4 84.9 ‐ 18.6 ‐ 62.4 23.4 9.3 4.9 0.0 0.0 October 735 99.9% 11.0 152.7 ‐ 21.5 ‐ 51.2 29.8 9.7 8.8 0.5 0.0 November 713 100.0% 23.3 295.7 ‐ 88.5 ‐ 34.5 26.2 17.0 17.5 2.9 1.8 December 738 100.0% 15.6 146.6 ‐ 60.8 ‐ 40.7 29.7 14.5 14.1 1.1 0.0 Annual 8595 99.0% 9.8 295.7 ‐ 118.4 ‐ 60.3 23.5 8.6 6.5 0.8 0.3
a. There is no Alberta Ambient Air Quality Objective for NO.

AI-9-5
Table I‐57 Edmonton East Station: Summary of continuous NO2 monitoring results for 2013
Valid Operational Average Maximum 1‐Hour Maximum 24‐Hour Percent of Data within Concentration Range (%)
Month 1‐Hr data Time 1‐Hr Conc. 1‐Hr Conc. Exceedance a 24‐Hr Conc. Exceedance b (no.) (%) (ppb) (ppb) (no.) (ppb) (no.) <=5 >5‐15 >15‐30 >30‐100 >100‐159 >159
January 737 96.7% 23.6 82.3 0 52.4 ‐ 6.1 31.3 28.1 34.5 0.0 0.0 February 662 100.0% 23.8 73.6 0 52.3 ‐ 5.4 29.9 31.1 33.5 0.0 0.0 March 737 99.9% 20.2 69.8 0 34.3 ‐ 4.3 38.5 37.7 19.4 0.0 0.0 April 710 100.0% 12.3 61.2 0 29.0 ‐ 22.0 50.8 20.6 6.6 0.0 0.0 May 674 92.5% 10.6 39.7 0 19.2 ‐ 24.9 51.6 20.0 3.4 0.0 0.0June 714 100.0% 9.3 34.7 0 16.2 ‐ 23.9 60.9 14.6 0.6 0.0 0.0 July 730 99.6% 9.0 29.0 0 14.9 ‐ 24.9 61.4 13.7 0.0 0.0 0.0 August 735 99.7% 7.0 105.0 0 14.2 ‐ 48.7 39.2 11.4 0.5 0.1 0.0 September 710 99.4% 7.9 32.2 0 15.0 ‐ 46.5 34.6 18.7 0.1 0.0 0.0 October 735 99.9% 12.5 118.1 0 22.8 ‐ 28.0 35.4 32.5 3.9 0.1 0.0 November 713 100.0% 21.0 68.6 0 43.8 ‐ 6.5 34.5 34.6 24.4 0.0 0.0 December 738 100.0% 19.4 59.9 0 40.6 ‐ 4.5 39.6 35.9 20.1 0.0 0.0 Annual 8595 99.0% 14.7 118.1 0 52.4 ‐ 20.5 42.3 24.9 12.2 0.0 0.0
a. 1‐hour Alberta Ambient Air Quality Objective = 159 ppb b. There is no 24‐hour Alberta Ambient Air Quality Objective for NO2.
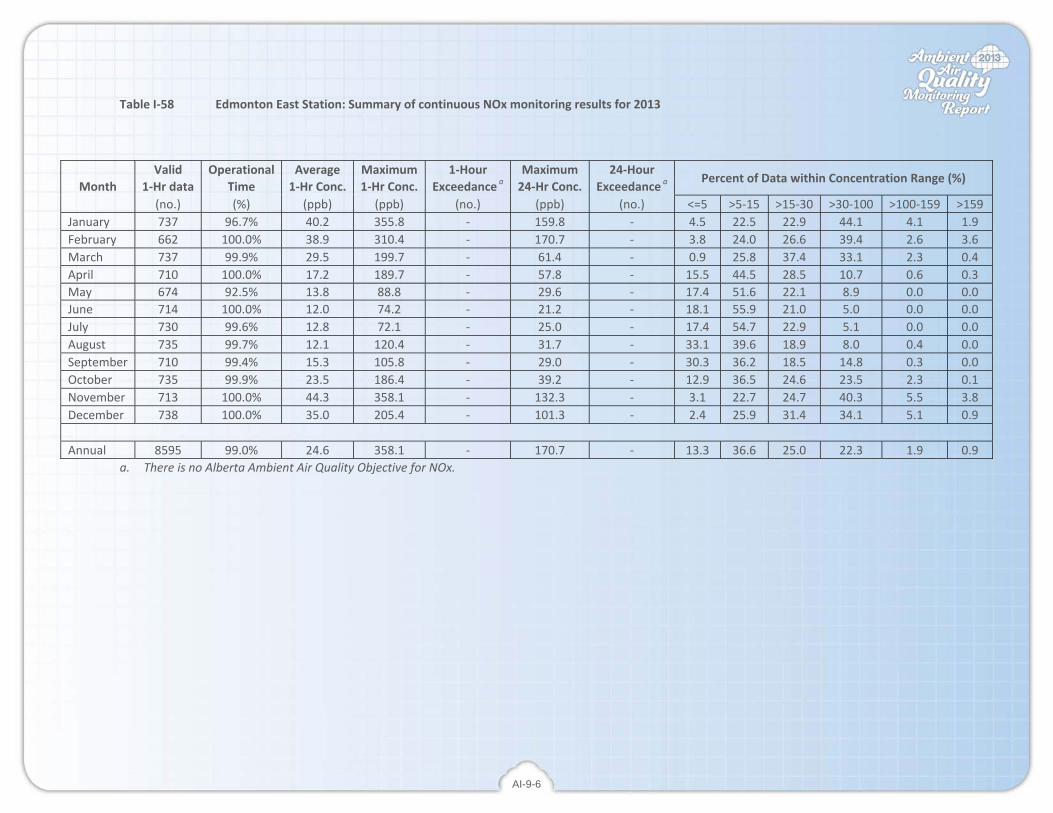
AI-9-6
Table I‐58 Edmonton East Station: Summary of continuous NOx monitoring results for 2013
Valid Operational Average Maximum 1‐Hour Maximum 24‐Hour Percent of Data within Concentration Range (%)
Month 1‐Hr data Time 1‐Hr Conc. 1‐Hr Conc. Exceedance a 24‐Hr Conc. Exceedance a (no.) (%) (ppb) (ppb) (no.) (ppb) (no.) <=5 >5‐15 >15‐30 >30‐100 >100‐159 >159
January 737 96.7% 40.2 355.8 ‐ 159.8 ‐ 4.5 22.5 22.9 44.1 4.1 1.9 February 662 100.0% 38.9 310.4 ‐ 170.7 ‐ 3.8 24.0 26.6 39.4 2.6 3.6 March 737 99.9% 29.5 199.7 ‐ 61.4 ‐ 0.9 25.8 37.4 33.1 2.3 0.4 April 710 100.0% 17.2 189.7 ‐ 57.8 ‐ 15.5 44.5 28.5 10.7 0.6 0.3 May 674 92.5% 13.8 88.8 ‐ 29.6 ‐ 17.4 51.6 22.1 8.9 0.0 0.0June 714 100.0% 12.0 74.2 ‐ 21.2 ‐ 18.1 55.9 21.0 5.0 0.0 0.0 July 730 99.6% 12.8 72.1 ‐ 25.0 ‐ 17.4 54.7 22.9 5.1 0.0 0.0 August 735 99.7% 12.1 120.4 ‐ 31.7 ‐ 33.1 39.6 18.9 8.0 0.4 0.0 September 710 99.4% 15.3 105.8 ‐ 29.0 ‐ 30.3 36.2 18.5 14.8 0.3 0.0 October 735 99.9% 23.5 186.4 ‐ 39.2 ‐ 12.9 36.5 24.6 23.5 2.3 0.1 November 713 100.0% 44.3 358.1 ‐ 132.3 ‐ 3.1 22.7 24.7 40.3 5.5 3.8 December 738 100.0% 35.0 205.4 ‐ 101.3 ‐ 2.4 25.9 31.4 34.1 5.1 0.9 Annual 8595 99.0% 24.6 358.1 ‐ 170.7 ‐ 13.3 36.6 25.0 22.3 1.9 0.9
a. There is no Alberta Ambient Air Quality Objective for NOx.
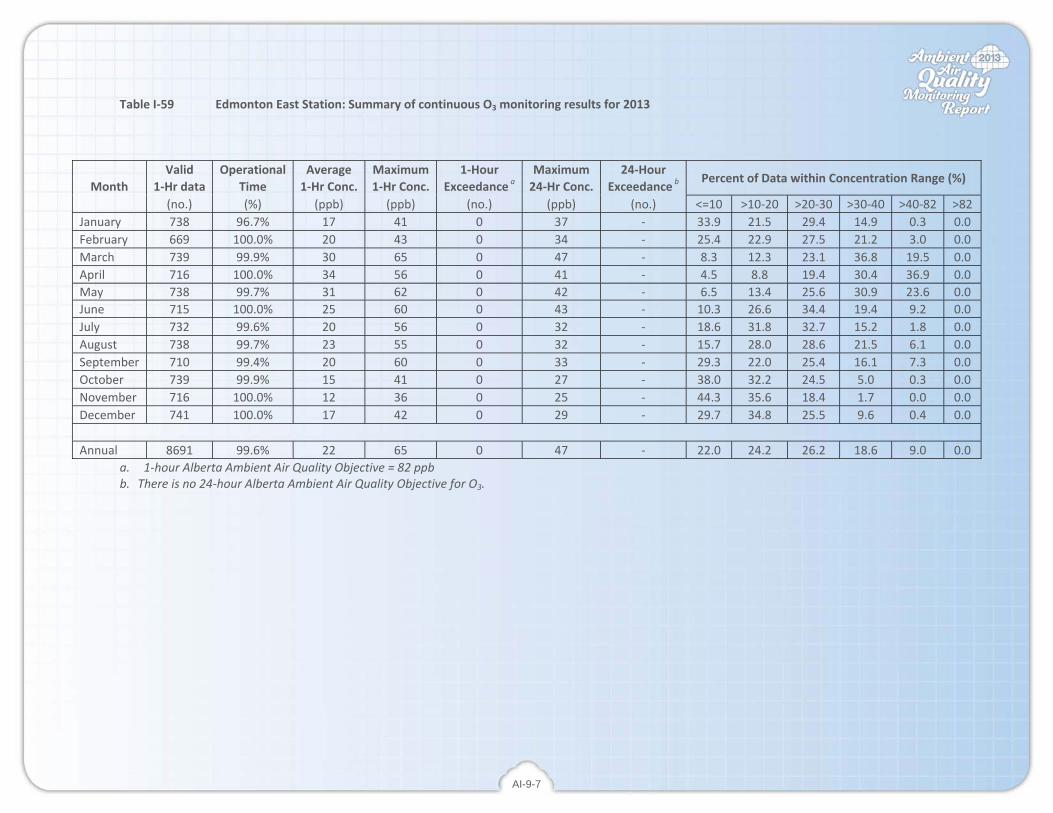
AI-9-7
Table I‐59 Edmonton East Station: Summary of continuous O3 monitoring results for 2013
Valid Operational Average Maximum 1‐Hour Maximum 24‐Hour Percent of Data within Concentration Range (%)
Month 1‐Hr data Time 1‐Hr Conc. 1‐Hr Conc. Exceedance a 24‐Hr Conc. Exceedance b (no.) (%) (ppb) (ppb) (no.) (ppb) (no.) <=10 >10‐20 >20‐30 >30‐40 >40‐82 >82
January 738 96.7% 17 41 0 37 ‐ 33.9 21.5 29.4 14.9 0.3 0.0 February 669 100.0% 20 43 0 34 ‐ 25.4 22.9 27.5 21.2 3.0 0.0 March 739 99.9% 30 65 0 47 ‐ 8.3 12.3 23.1 36.8 19.5 0.0 April 716 100.0% 34 56 0 41 ‐ 4.5 8.8 19.4 30.4 36.9 0.0 May 738 99.7% 31 62 0 42 ‐ 6.5 13.4 25.6 30.9 23.6 0.0June 715 100.0% 25 60 0 43 ‐ 10.3 26.6 34.4 19.4 9.2 0.0 July 732 99.6% 20 56 0 32 ‐ 18.6 31.8 32.7 15.2 1.8 0.0 August 738 99.7% 23 55 0 32 ‐ 15.7 28.0 28.6 21.5 6.1 0.0 September 710 99.4% 20 60 0 33 ‐ 29.3 22.0 25.4 16.1 7.3 0.0 October 739 99.9% 15 41 0 27 ‐ 38.0 32.2 24.5 5.0 0.3 0.0 November 716 100.0% 12 36 0 25 ‐ 44.3 35.6 18.4 1.7 0.0 0.0 December 741 100.0% 17 42 0 29 ‐ 29.7 34.8 25.5 9.6 0.4 0.0 Annual 8691 99.6% 22 65 0 47 ‐ 22.0 24.2 26.2 18.6 9.0 0.0
a. 1‐hour Alberta Ambient Air Quality Objective = 82 ppb b. There is no 24‐hour Alberta Ambient Air Quality Objective for O3.

AI-9-8
Table I‐60 Edmonton East Station: Summary of continuous CO monitoring results for 2013
Valid Operational Average Maximum 1‐Hour Maximum 8‐Hour Percent of Data within Concentration Range (%)
Month 1‐Hr data Time 1‐Hr Conc. 1‐Hr Conc. Exceedance a 8‐Hr Conc. Exceedance b (no.) (%) (ppm) (ppm) (no.) (ppm) (no.) <=0.2 >0.2‐1 >1‐2.5 >2.5‐5 >5‐13 >13
January 738 96.7% 0.3 1.1 0 0.8 0 61.1 38.8 0.1 0.0 0.0 0.0 February 659 98.8% 0.2 0.7 0 0.6 0 68.0 32.0 0.0 0.0 0.0 0.0 March 737 99.9% 0.2 0.6 0 0.5 0 78.8 21.2 0.0 0.0 0.0 0.0 April 712 100.0% 0.1 0.7 0 0.5 0 93.4 6.6 0.0 0.0 0.0 0.0 May 736 99.7% 0.2 0.5 0 0.4 0 79.8 20.2 0.0 0.0 0.0 0.0June 714 99.9% 0.1 0.4 0 0.3 0 92.6 7.4 0.0 0.0 0.0 0.0 July 735 99.6% 0.1 0.4 0 0.3 0 93.5 6.5 0.0 0.0 0.0 0.0 August 737 99.7% 0.2 1.1 0 0.4 0 90.9 9.0 0.1 0.0 0.0 0.0 September 711 99.4% 0.1 0.5 0 0.3 0 90.0 10.0 0.0 0.0 0.0 0.0 October 738 99.9% 0.1 0.5 0 0.3 0 92.4 7.6 0.0 0.0 0.0 0.0 November 715 100.0% 0.2 0.9 0 0.6 0 80.3 19.7 0.0 0.0 0.0 0.0 December 740 100.0% 0.2 0.9 0 0.4 0 85.1 14.9 0.0 0.0 0.0 0.0 Annual 8672 99.5% 0.2 1.1 0 0.8 0 83.9 16.1 0.0 0.0 0.0 0.0
a. 1‐hour Alberta Ambient Air Quality Objective = 13 ppm b. 8‐hour Alberta Ambient Air Quality Objective = 5 ppm.

AI-9-9
Table I‐61 Edmonton East Station: Summary of continuous THC monitoring results for 2013
Valid Operational Average Maximum 1‐Hour Maximum 24‐Hour Percent of Data within Concentration Range (%) Month 1‐Hr data Time 1‐Hr Conc. 1‐Hr Conc. Exceedance a 24‐Hr Conc. Exceedance a
(no.) (%) (ppm) (ppm) (no.) (ppm) (no.) <=1 >1‐2 >2‐3 >3‐4 >4‐5 >5 January 733 96.3% 2.2 10.3 ‐ 4.9 ‐ 0.0 53.6 42.0 1.9 1.1 1.4 February 580 89.1% 2.3 9.0 ‐ 4.6 ‐ 0.2 52.4 37.4 6.7 1.9 1.4 March 676 94.3% 2.2 6.3 ‐ 3.0 ‐ 0.0 55.3 39.1 3.4 1.2 1.0 April 709 99.9% 2.1 6.2 ‐ 2.7 ‐ 0.0 61.5 34.7 3.0 0.7 0.1 May 732 99.2% 2.1 6.0 ‐ 2.6 ‐ 0.0 70.4 25.4 2.9 1.0 0.4June 704 98.7% 2.1 7.1 ‐ 2.5 ‐ 0.0 72.0 22.4 3.8 1.0 0.7 July 596 81.9% 2.2 6.2 ‐ 2.8 ‐ 0.0 50.5 45.1 3.4 0.7 0.3 August 727 99.9% 2.3 6.6 ‐ 3.5 ‐ 0.0 35.2 56.8 5.5 1.2 1.2 September 625 88.3% 2.3 6.7 ‐ 3.1 ‐ 0.0 37.8 52.5 7.5 1.4 0.8 October 728 99.7% 2.2 5.9 ‐ 2.6 ‐ 0.0 51.0 46.3 2.2 0.4 0.1 November 715 100.0% 2.4 8.6 ‐ 3.2 ‐ 0.0 20.7 71.2 6.4 1.0 0.7 December 737 99.9% 2.3 6.0 ‐ 3.2 ‐ 0.0 41.9 52.2 4.6 0.7 0.5 Annual 8262 95.7% 2.2 10.3 ‐ 4.9 ‐ 0.0 50.2 43.8 4.2 1.0 0.7
a. There is no Alberta Ambient Air Quality Objective for THC.

AI-9-10
Table I‐62 Edmonton East Station: Summary of continuous CH4 monitoring results for 2013
Valid Operational Average Maximum 1‐Hour Maximum 24‐Hour Percent of Data within Concentration Range (%) Month 1‐Hr data Time 1‐Hr Conc. 1‐Hr Conc. Exceedance a 24‐Hr Conc. Exceedance a
(no.) (%) (ppm) (ppm) (no.) (ppm) (no.) <=1 >1‐2 >2‐3 >3‐4 >4‐5 >5 January 733 96.3% 2.1 6.5 ‐ 3.6 ‐ 0.0 67.0 30.7 1.2 0.5 0.5 February 580 89.1% 2.1 7.3 ‐ 3.4 ‐ 0.0 66.2 30.2 3.1 0.2 0.3 March 676 94.3% 2.0 4.8 ‐ 2.6 ‐ 0.0 74.1 23.8 1.5 0.6 0.0 April 709 99.9% 2.0 3.5 ‐ 2.2 ‐ 0.0 81.5 18.1 0.4 0.0 0.0 May 732 99.2% 1.9 5.3 ‐ 2.2 ‐ 0.0 94.5 5.2 0.0 0.1 0.1June 704 98.7% 1.8 3.6 ‐ 2.0 ‐ 0.0 94.9 4.7 0.4 0.0 0.0 July 596 81.9% 1.9 5.7 ‐ 2.2 ‐ 0.0 84.7 14.8 0.3 0.0 0.2 August 728 99.9% 2.0 5.1 ‐ 2.6 ‐ 0.0 78.0 20.1 1.4 0.4 0.1 September 625 88.3% 2.0 3.5 ‐ 2.3 ‐ 0.0 73.8 25.9 0.3 0.0 0.0 October 729 99.7% 2.0 3.4 ‐ 2.2 ‐ 0.0 78.3 21.5 0.1 0.0 0.0 November 715 100.0% 2.1 4.4 ‐ 2.4 ‐ 0.0 46.9 52.7 0.3 0.1 0.0 December 737 99.9% 2.1 4.2 ‐ 2.5 ‐ 0.0 62.8 36.6 0.4 0.1 0.0 Annual 8264 95.7% 2.0 7.3 ‐ 3.6 ‐ 0.0 75.2 23.7 0.8 0.2 0.1 a. There is no Alberta Ambient Air Quality Objective for CH4.

AI-9-11
Table I‐63 Edmonton East Station: Summary of continuous non‐methane hydrocarbons (NMHC) results for 2013
Valid Operational Average Maximum 1‐Hour Maximum 24‐Hour Percent of Data within Concentration Range (%) Month 1‐Hr data Time 1‐Hr Conc. 1‐Hr Conc. Exceedance a 24‐Hr Conc. Exceedance a
(no.) (%) (ppm) (ppm) (no.) (ppm) (no.) <=1 >1‐2 >2‐3 >3‐4 >4‐5 >5 January 733 96.3% 0.1 3.8 ‐ 1.2 ‐ 98.2 1.2 0.1 0.4 0.0 0.0 February 580 89.1% 0.2 3.3 ‐ 1.2 ‐ 95.5 4.0 0.3 0.2 0.0 0.0 March 676 94.3% 0.2 2.8 ‐ 0.5 ‐ 96.7 2.7 0.6 0.0 0.0 0.0 April 709 99.9% 0.1 3.2 ‐ 0.6 ‐ 98.3 1.3 0.3 0.1 0.0 0.0 May 732 99.2% 0.2 4.0 ‐ 0.6 ‐ 96.7 2.7 0.3 0.3 0.0 0.0June 704 98.7% 0.2 4.9 ‐ 0.6 ‐ 94.6 3.8 0.9 0.4 0.3 0.0 July 596 81.9% 0.2 2.4 ‐ 0.6 ‐ 97.1 2.7 0.2 0.0 0.0 0.0 August 728 99.9% 0.3 3.0 ‐ 1.1 ‐ 94.8 4.5 0.7 0.0 0.0 0.0 September 625 88.3% 0.3 4.6 ‐ 0.8 ‐ 94.2 4.6 0.6 0.3 0.2 0.0 October 729 99.7% 0.2 2.5 ‐ 0.5 ‐ 98.1 1.6 0.3 0.0 0.0 0.0 November 715 100.0% 0.3 4.2 ‐ 0.9 ‐ 95.9 2.9 0.7 0.3 0.1 0.0 December 737 99.9% 0.2 2.9 ‐ 0.8 ‐ 97.4 2.2 0.4 0.0 0.0 0.0 Annual 8264 95.7% 0.2 4.9 ‐ 1.2 ‐ 96.5 2.8 0.4 0.2 0.0 0.0
a. There is no Alberta Ambient Air Quality Objective for NMHC.
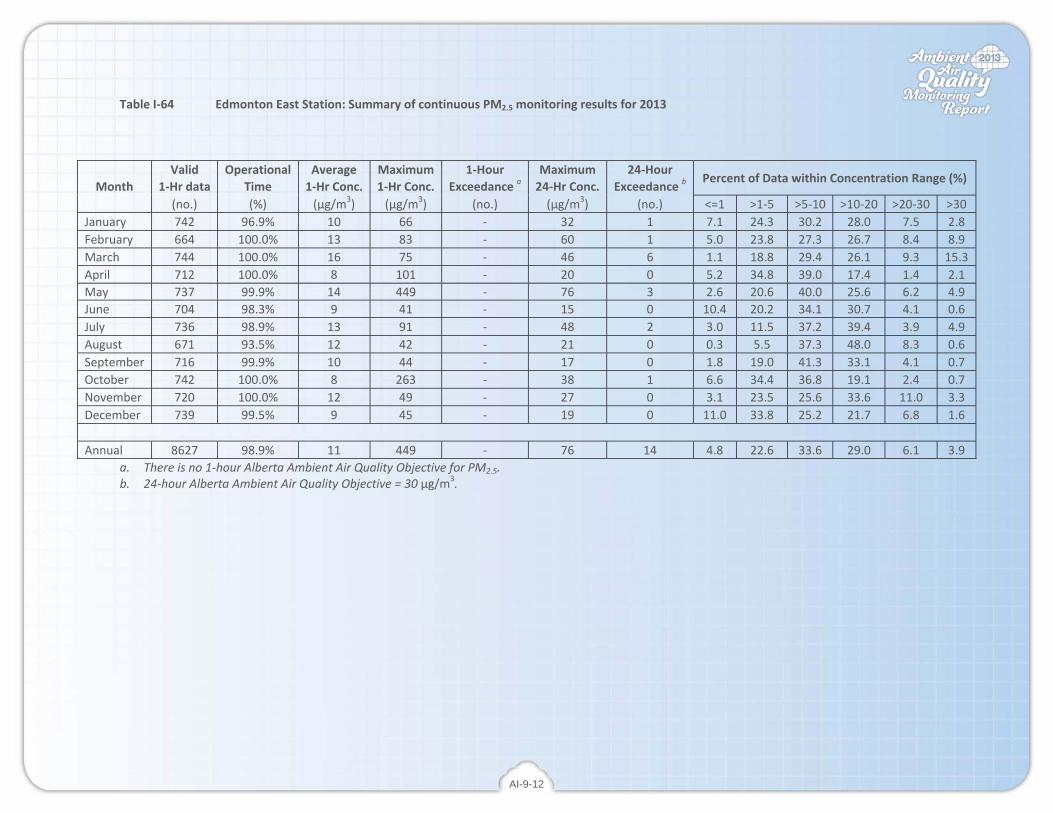
AI-9-12
Table I‐64 Edmonton East Station: Summary of continuous PM2.5 monitoring results for 2013
Valid Operational Average Maximum 1‐Hour Maximum 24‐Hour Percent of Data within Concentration Range (%)
Month 1‐Hr data Time 1‐Hr Conc. 1‐Hr Conc. Exceedance a 24‐Hr Conc. Exceedance b (no.) (%) (µg/m3) (µg/m3) (no.) (µg/m3) (no.) <=1 >1‐5 >5‐10 >10‐20 >20‐30 >30
January 742 96.9% 10 66 ‐ 32 1 7.1 24.3 30.2 28.0 7.5 2.8 February 664 100.0% 13 83 ‐ 60 1 5.0 23.8 27.3 26.7 8.4 8.9 March 744 100.0% 16 75 ‐ 46 6 1.1 18.8 29.4 26.1 9.3 15.3 April 712 100.0% 8 101 ‐ 20 0 5.2 34.8 39.0 17.4 1.4 2.1 May 737 99.9% 14 449 ‐ 76 3 2.6 20.6 40.0 25.6 6.2 4.9June 704 98.3% 9 41 ‐ 15 0 10.4 20.2 34.1 30.7 4.1 0.6 July 736 98.9% 13 91 ‐ 48 2 3.0 11.5 37.2 39.4 3.9 4.9 August 671 93.5% 12 42 ‐ 21 0 0.3 5.5 37.3 48.0 8.3 0.6 September 716 99.9% 10 44 ‐ 17 0 1.8 19.0 41.3 33.1 4.1 0.7 October 742 100.0% 8 263 ‐ 38 1 6.6 34.4 36.8 19.1 2.4 0.7 November 720 100.0% 12 49 ‐ 27 0 3.1 23.5 25.6 33.6 11.0 3.3 December 739 99.5% 9 45 ‐ 19 0 11.0 33.8 25.2 21.7 6.8 1.6 Annual 8627 98.9% 11 449 ‐ 76 14 4.8 22.6 33.6 29.0 6.1 3.9
a. There is no 1‐hour Alberta Ambient Air Quality Objective for PM2.5. b. 24‐hour Alberta Ambient Air Quality Objective = 30 µg/m3.

AI-9-13
Table I‐65 Edmonton East Station: Summary of continuous ambient temperature monitoring results for 2013
Valid Operational Average Minimum Maximum Percent of Data within temperature Range (%)
Month 1‐Hr data Time 1‐Hr Temp. 1‐Hr Temp. 1‐Hr Temp. (no.) (%) (°C) (°C) (°C) <=‐30 >‐30~‐15 >‐15~‐0 >0~‐15 >15~30 >30
January 725 94.4% ‐8.3 ‐28.3 10.8 0.0 20.1 65.0 14.9 0.0 0.0 February 590 87.8% ‐3.0 ‐13.9 12.2 0.0 0.0 71.7 28.3 0.0 0.0 March 701 94.2% ‐4.7 ‐18.2 11.0 0.0 5.0 69.9 25.1 0.0 0.0 April 719 99.9% 1.9 ‐12.1 21.2 0.0 0.0 40.3 56.6 3.1 0.0 May 723 97.2% 15.0 ‐5.0 30.4 0.0 0.0 1.2 51.2 47.4 0.1June 636 88.3% 16.2 5.0 30.2 0.0 0.0 0.0 47.0 52.8 0.2 July 744 100.0% 17.9 7.5 34.8 0.0 0.0 0.0 32.8 65.1 2.2 August 691 92.9% 19.3 9.8 31.6 0.0 0.0 0.0 21.4 78.1 0.4 September 657 91.3% 16.3 0.0 33.8 0.0 0.0 2.1 40.0 54.8 3.0 October 660 88.7% 6.8 ‐8.0 20.4 0.0 0.0 10.0 85.8 4.2 0.0 November 720 100.0% ‐5.3 ‐23.4 11.5 0.0 6.9 70.0 23.1 0.0 0.0 December 744 100.0% ‐12.4 ‐29.7 6.7 0.0 48.9 37.6 13.4 0.0 0.0 Annual 8310 94.6% 4.8 ‐29.7 34.8 0.0 7.2 30.6 36.3 25.4 0.5

AI-9-14
Table I‐66 Edmonton East Station: Summary of relative humidity monitoring results for 2013
Valid Operational Average Minimum Maximum Percent of Data within Range of Relative Humidity (%)
Month 1‐Hr data Time 1‐Hr RH 1‐Hr RH 1‐Hr RH (no.) (%) (%) (%) (%) <=10 >10‐30 >30‐50 >50‐70 >70‐90 >90
January 749 97.5% 69 29 92 0.0 0.0 1.7 22.7 56.3 19.2 February 590 87.8% 69 34 91 0.0 0.0 3.2 23.9 49.3 23.6 March 701 94.2% 65 24 91 0.0 0.0 7.6 28.1 46.5 17.8 April 719 99.9% 60 18 95 0.0 1.5 16.7 32.0 32.1 17.7 May 723 97.2% 45 10 92 0.0 10.4 39.8 25.6 16.5 7.7June 636 88.3% 64 20 99 0.0 0.5 16.8 24.2 31.1 27.4 July 744 100.0% 62 20 98 0.0 0.1 15.1 32.5 32.4 19.9 August 691 92.9% 62 18 99 0.0 0.4 12.6 34.4 34.6 17.9 September 657 91.3% 51 0 92 2.1 1.2 30.4 28.8 28.3 9.1 October 660 88.7% 57 21 93 0.0 0.0 16.2 39.2 39.4 5.2 November 720 100.0% 75 28 95 0.0 0.0 1.4 11.5 48.2 38.9 December 744 100.0% 73 39 94 0.0 0.0 0.3 8.9 74.3 16.5 Annual 8334 94.9% 63 0 99 0.2 1.2 13.4 25.8 41.0 18.4

AI-9-15
Table I‐67 Edmonton East Station: Wind frequency table for 2013
Wind Direction Sector
Percent of Data within Wind Speed Range, wind speed unit km/hr >1‐5 >5‐10 >10‐20 >20‐30 >30‐40 >40 Total
North NorthEast 0.7% 1.7% 1.6% 0.0% 0.0% 0.0% 4.1% NorthEast 0.7% 0.7% 0.4% 0.1% 0.0% 0.0% 1.9% East NorthEast 0.4% 0.7% 0.3% 0.0% 0.0% 0.0% 1.4% East 0.6% 2.1% 0.6% 0.0% 0.0% 0.0% 3.3% East SouthEast 0.5% 2.1% 1.1% 0.2% 0.0% 0.0% 3.9% SouthEast 0.7% 3.4% 2.4% 0.2% 0.0% 0.0% 6.8% South SouthEast 1.0% 3.6% 4.3% 0.4% 0.0% 0.0% 9.3% South 1.2% 8.5% 6.0% 0.3% 0.0% 0.0% 15.9% South SouthWest 0.9% 4.8% 2.8% 0.1% 0.0% 0.0% 8.6% SouthWest 0.6% 1.7% 1.2% 0.0% 0.0% 0.0% 3.5% West SouthWest 0.8% 1.1% 0.6% 0.0% 0.0% 0.0% 2.4% West 1.1% 1.4% 1.4% 0.0% 0.0% 0.0% 3.9% West NorthWest 1.8% 4.4% 4.7% 0.6% 0.0% 0.0% 11.6% NorthWest 1.4% 2.8% 3.7% 0.6% 0.0% 0.0% 8.6% North NorthWest 1.3% 2.5% 3.3% 0.3% 0.0% 0.0% 7.4% North 1.4% 3.2% 2.6% 0.2% 0.0% 0.0% 7.4% Total 15.2% 44.7% 36.9% 3.0% 0.2% 0.0% 100.0%
Percent Calm 0.0% 0.0% 0.0% Number of Valid Hourly‐Average Data 8718 Total Workable Hours in Time Period 8721
AI-9-1
PART 9. Edmonton South Station
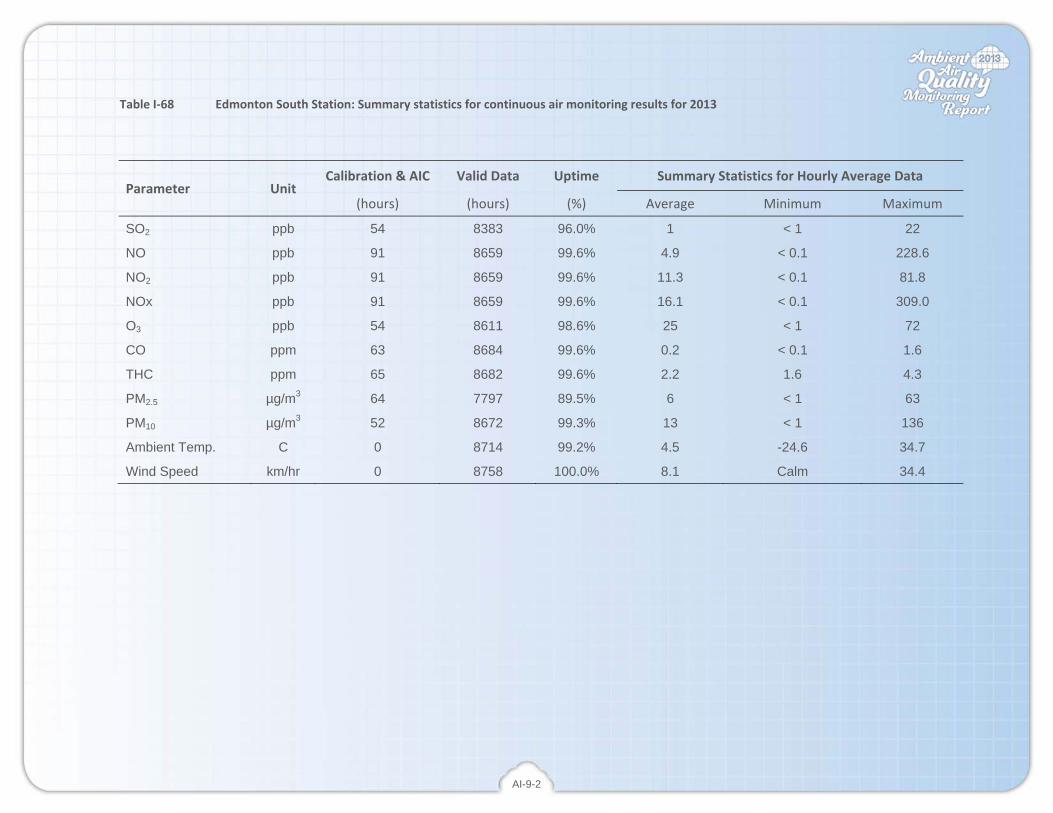
AI-9-2
Table I‐68 Edmonton South Station: Summary statistics for continuous air monitoring results for 2013
Parameter Unit Calibration & AIC Valid Data Uptime Summary Statistics for Hourly Average Data
(hours) (hours) (%) Average Minimum Maximum
SO2 ppb 54 8383 96.0% 1 < 1 22
NO ppb 91 8659 99.6% 4.9 < 0.1 228.6
NO2 ppb 91 8659 99.6% 11.3 < 0.1 81.8
NOx ppb 91 8659 99.6% 16.1 < 0.1 309.0
O3 ppb 54 8611 98.6% 25 < 1 72
CO ppm 63 8684 99.6% 0.2 < 0.1 1.6
THC ppm 65 8682 99.6% 2.2 1.6 4.3
PM2.5 µg/m3 64 7797 89.5% 6 < 1 63
PM10 µg/m3 52 8672 99.3% 13 < 1 136
Ambient Temp. C 0 8714 99.2% 4.5 -24.6 34.7
Wind Speed km/hr 0 8758 100.0% 8.1 Calm 34.4

AI-9-3
Table I‐69 Edmonton South Station: Summary of continuous SO2 monitoring results for 2013
Valid Operational Average Maximum 1‐Hour Maximum 24‐Hour Percent of Data within Concentration Range (%)
Month 1‐Hr data Time 1‐Hr Conc. 1‐Hr Conc. Exceedance a 24‐Hr Conc. Exceedance b (no.) (%) (ppb) (ppb) (no.) (ppb) (no.) <=1 >1‐5 >5‐10 >10‐48 >48‐172 >172
January 739 96.9% 1 7 0 2 0 85.5 14.1 0.4 0.0 0.0 0.0 February 667 99.9% 1 11 0 3 0 87.1 12.3 0.4 0.1 0.0 0.0 March 735 99.6% 1 16 0 4 0 81.2 16.3 1.5 1.0 0.0 0.0 April 712 99.9% 1 19 0 4 0 90.3 7.4 1.4 0.8 0.0 0.0 May 738 99.9% < 1 13 0 2 0 93.0 6.2 0.7 0.1 0.0 0.0June 717 100.0% < 1 9 0 2 0 91.2 7.8 1.0 0.0 0.0 0.0 July 741 99.9% < 1 18 0 3 0 96.5 2.6 0.5 0.4 0.0 0.0 August 651 88.0% 1 22 0 2 0 89.7 9.1 0.8 0.5 0.0 0.0 September 488 68.3% 1 4 0 1 0 94.1 5.9 0.0 0.0 0.0 0.0 October 740 100.0% 1 16 0 3 0 93.2 6.1 0.4 0.3 0.0 0.0 November 715 100.0% 1 5 0 2 0 89.5 10.5 0.0 0.0 0.0 0.0 December 740 100.0% 1 13 0 3 0 83.6 15.1 1.1 0.1 0.0 0.0 Annual 8383 96.0% 1 22 0 4 0 89.5 9.5 0.7 0.3 0.0 0.0
a. 1‐hour Alberta Ambient Air Quality Objective = 172 ppb b. 24‐hour Alberta Ambient Air Quality Objective = 48 pp

AI-9-4
Table I‐70 Edmonton South Station: Summary of continuous NO monitoring results for 2013
Valid Operational Average Maximum 1‐Hour Maximum 24‐Hour Percent of Data within Concentration Range (%)
Month 1‐Hr data Time 1‐Hr Conc. 1‐Hr Conc. Exceedance a 24‐Hr Conc. Exceedance a (no.) (%) (ppb) (ppb) (no.) (ppb) (no.) <=5 >5‐15 >15‐30 >30‐100 >100‐159 >159
January 738 96.9% 11.0 228.6 ‐ 74.1 ‐ 62.9 16.1 9.8 9.6 0.8 0.8 February 657 100.0% 9.2 173.2 ‐ 67.1 ‐ 72.6 12.5 6.4 6.7 1.5 0.3 March 734 99.7% 4.1 49.0 ‐ 11.4 ‐ 74.9 19.8 3.7 1.6 0.0 0.0 April 709 99.9% 2.2 53.6 ‐ 11.9 ‐ 93.1 4.2 1.1 1.6 0.0 0.0 May 736 99.9% 1.3 22.4 ‐ 3.7 ‐ 94.7 4.6 0.7 0.0 0.0 0.0June 714 100.0% 0.8 12.0 ‐ 2.6 ‐ 96.5 3.5 0.0 0.0 0.0 0.0 July 734 99.9% 0.9 16.4 ‐ 3.7 ‐ 94.4 5.4 0.1 0.0 0.0 0.0 August 737 99.7% 2.1 46.0 ‐ 10.8 ‐ 90.4 7.5 1.6 0.5 0.0 0.0 September 711 99.7% 3.0 66.0 ‐ 15.2 ‐ 83.1 11.1 4.4 1.4 0.0 0.0 October 738 100.0% 4.5 79.0 ‐ 15.6 ‐ 81.7 10.0 4.2 4.1 0.0 0.0 November 713 99.9% 10.7 154.0 ‐ 63.8 ‐ 61.0 19.8 10.1 8.0 1.1 0.0 December 738 100.0% 8.9 207.0 ‐ 34.5 ‐ 67.5 17.9 6.8 7.3 0.3 0.3 Annual 8659 99.6% 4.9 228.6 ‐ 74.1 ‐ 81.1 11.0 4.1 3.4 0.3 0.1
a. There is no Alberta Ambient Air Quality Objective for NO.
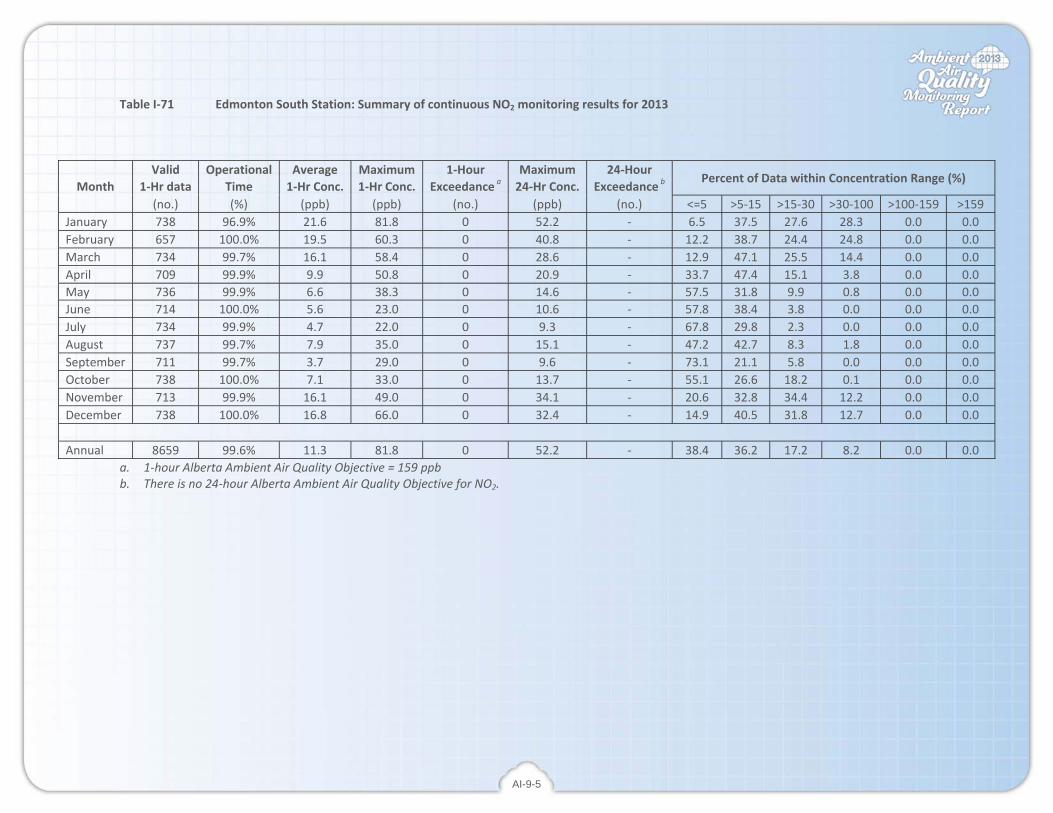
AI-9-5
Table I‐71 Edmonton South Station: Summary of continuous NO2 monitoring results for 2013
Valid Operational Average Maximum 1‐Hour Maximum 24‐Hour Percent of Data within Concentration Range (%)
Month 1‐Hr data Time 1‐Hr Conc. 1‐Hr Conc. Exceedance a 24‐Hr Conc. Exceedance b (no.) (%) (ppb) (ppb) (no.) (ppb) (no.) <=5 >5‐15 >15‐30 >30‐100 >100‐159 >159
January 738 96.9% 21.6 81.8 0 52.2 ‐ 6.5 37.5 27.6 28.3 0.0 0.0 February 657 100.0% 19.5 60.3 0 40.8 ‐ 12.2 38.7 24.4 24.8 0.0 0.0 March 734 99.7% 16.1 58.4 0 28.6 ‐ 12.9 47.1 25.5 14.4 0.0 0.0 April 709 99.9% 9.9 50.8 0 20.9 ‐ 33.7 47.4 15.1 3.8 0.0 0.0 May 736 99.9% 6.6 38.3 0 14.6 ‐ 57.5 31.8 9.9 0.8 0.0 0.0June 714 100.0% 5.6 23.0 0 10.6 ‐ 57.8 38.4 3.8 0.0 0.0 0.0 July 734 99.9% 4.7 22.0 0 9.3 ‐ 67.8 29.8 2.3 0.0 0.0 0.0 August 737 99.7% 7.9 35.0 0 15.1 ‐ 47.2 42.7 8.3 1.8 0.0 0.0 September 711 99.7% 3.7 29.0 0 9.6 ‐ 73.1 21.1 5.8 0.0 0.0 0.0 October 738 100.0% 7.1 33.0 0 13.7 ‐ 55.1 26.6 18.2 0.1 0.0 0.0 November 713 99.9% 16.1 49.0 0 34.1 ‐ 20.6 32.8 34.4 12.2 0.0 0.0 December 738 100.0% 16.8 66.0 0 32.4 ‐ 14.9 40.5 31.8 12.7 0.0 0.0 Annual 8659 99.6% 11.3 81.8 0 52.2 ‐ 38.4 36.2 17.2 8.2 0.0 0.0
a. 1‐hour Alberta Ambient Air Quality Objective = 159 ppb b. There is no 24‐hour Alberta Ambient Air Quality Objective for NO2.
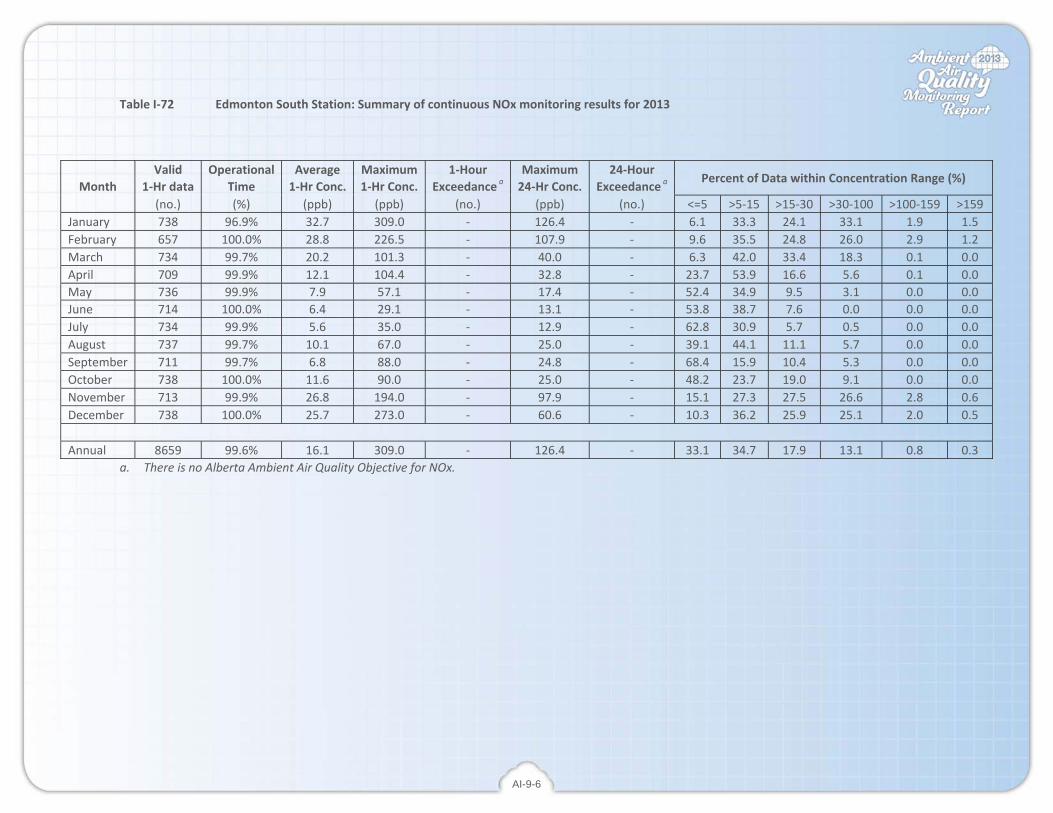
AI-9-6
Table I‐72 Edmonton South Station: Summary of continuous NOx monitoring results for 2013
Valid Operational Average Maximum 1‐Hour Maximum 24‐Hour Percent of Data within Concentration Range (%)
Month 1‐Hr data Time 1‐Hr Conc. 1‐Hr Conc. Exceedance a 24‐Hr Conc. Exceedance a (no.) (%) (ppb) (ppb) (no.) (ppb) (no.) <=5 >5‐15 >15‐30 >30‐100 >100‐159 >159
January 738 96.9% 32.7 309.0 ‐ 126.4 ‐ 6.1 33.3 24.1 33.1 1.9 1.5 February 657 100.0% 28.8 226.5 ‐ 107.9 ‐ 9.6 35.5 24.8 26.0 2.9 1.2 March 734 99.7% 20.2 101.3 ‐ 40.0 ‐ 6.3 42.0 33.4 18.3 0.1 0.0 April 709 99.9% 12.1 104.4 ‐ 32.8 ‐ 23.7 53.9 16.6 5.6 0.1 0.0 May 736 99.9% 7.9 57.1 ‐ 17.4 ‐ 52.4 34.9 9.5 3.1 0.0 0.0June 714 100.0% 6.4 29.1 ‐ 13.1 ‐ 53.8 38.7 7.6 0.0 0.0 0.0 July 734 99.9% 5.6 35.0 ‐ 12.9 ‐ 62.8 30.9 5.7 0.5 0.0 0.0 August 737 99.7% 10.1 67.0 ‐ 25.0 ‐ 39.1 44.1 11.1 5.7 0.0 0.0 September 711 99.7% 6.8 88.0 ‐ 24.8 ‐ 68.4 15.9 10.4 5.3 0.0 0.0 October 738 100.0% 11.6 90.0 ‐ 25.0 ‐ 48.2 23.7 19.0 9.1 0.0 0.0 November 713 99.9% 26.8 194.0 ‐ 97.9 ‐ 15.1 27.3 27.5 26.6 2.8 0.6 December 738 100.0% 25.7 273.0 ‐ 60.6 ‐ 10.3 36.2 25.9 25.1 2.0 0.5 Annual 8659 99.6% 16.1 309.0 ‐ 126.4 ‐ 33.1 34.7 17.9 13.1 0.8 0.3
a. There is no Alberta Ambient Air Quality Objective for NOx.
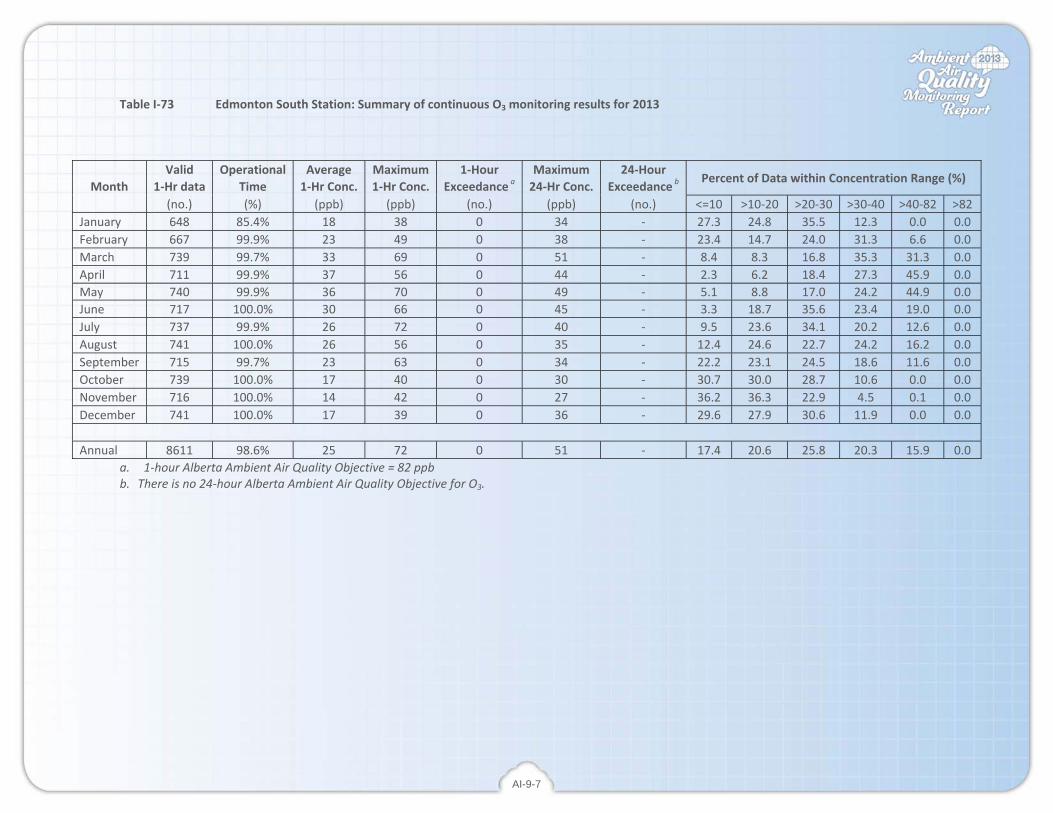
AI-9-7
Table I‐73 Edmonton South Station: Summary of continuous O3 monitoring results for 2013
Valid Operational Average Maximum 1‐Hour Maximum 24‐Hour Percent of Data within Concentration Range (%)
Month 1‐Hr data Time 1‐Hr Conc. 1‐Hr Conc. Exceedance a 24‐Hr Conc. Exceedance b (no.) (%) (ppb) (ppb) (no.) (ppb) (no.) <=10 >10‐20 >20‐30 >30‐40 >40‐82 >82
January 648 85.4% 18 38 0 34 ‐ 27.3 24.8 35.5 12.3 0.0 0.0 February 667 99.9% 23 49 0 38 ‐ 23.4 14.7 24.0 31.3 6.6 0.0 March 739 99.7% 33 69 0 51 ‐ 8.4 8.3 16.8 35.3 31.3 0.0 April 711 99.9% 37 56 0 44 ‐ 2.3 6.2 18.4 27.3 45.9 0.0 May 740 99.9% 36 70 0 49 ‐ 5.1 8.8 17.0 24.2 44.9 0.0June 717 100.0% 30 66 0 45 ‐ 3.3 18.7 35.6 23.4 19.0 0.0 July 737 99.9% 26 72 0 40 ‐ 9.5 23.6 34.1 20.2 12.6 0.0 August 741 100.0% 26 56 0 35 ‐ 12.4 24.6 22.7 24.2 16.2 0.0 September 715 99.7% 23 63 0 34 ‐ 22.2 23.1 24.5 18.6 11.6 0.0 October 739 100.0% 17 40 0 30 ‐ 30.7 30.0 28.7 10.6 0.0 0.0 November 716 100.0% 14 42 0 27 ‐ 36.2 36.3 22.9 4.5 0.1 0.0 December 741 100.0% 17 39 0 36 ‐ 29.6 27.9 30.6 11.9 0.0 0.0 Annual 8611 98.6% 25 72 0 51 ‐ 17.4 20.6 25.8 20.3 15.9 0.0
a. 1‐hour Alberta Ambient Air Quality Objective = 82 ppb b. There is no 24‐hour Alberta Ambient Air Quality Objective for O3.
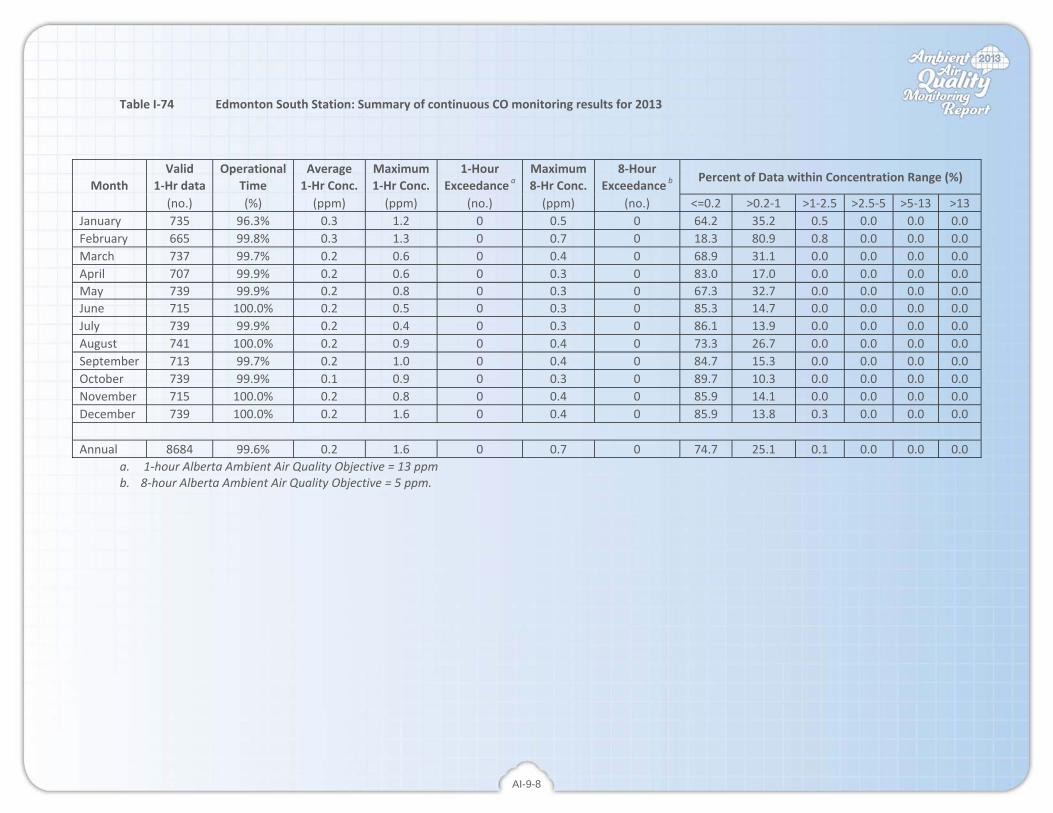
AI-9-8
Table I‐74 Edmonton South Station: Summary of continuous CO monitoring results for 2013
Valid Operational Average Maximum 1‐Hour Maximum 8‐Hour Percent of Data within Concentration Range (%)
Month 1‐Hr data Time 1‐Hr Conc. 1‐Hr Conc. Exceedance a 8‐Hr Conc. Exceedance b (no.) (%) (ppm) (ppm) (no.) (ppm) (no.) <=0.2 >0.2‐1 >1‐2.5 >2.5‐5 >5‐13 >13
January 735 96.3% 0.3 1.2 0 0.5 0 64.2 35.2 0.5 0.0 0.0 0.0 February 665 99.8% 0.3 1.3 0 0.7 0 18.3 80.9 0.8 0.0 0.0 0.0 March 737 99.7% 0.2 0.6 0 0.4 0 68.9 31.1 0.0 0.0 0.0 0.0 April 707 99.9% 0.2 0.6 0 0.3 0 83.0 17.0 0.0 0.0 0.0 0.0 May 739 99.9% 0.2 0.8 0 0.3 0 67.3 32.7 0.0 0.0 0.0 0.0June 715 100.0% 0.2 0.5 0 0.3 0 85.3 14.7 0.0 0.0 0.0 0.0 July 739 99.9% 0.2 0.4 0 0.3 0 86.1 13.9 0.0 0.0 0.0 0.0 August 741 100.0% 0.2 0.9 0 0.4 0 73.3 26.7 0.0 0.0 0.0 0.0 September 713 99.7% 0.2 1.0 0 0.4 0 84.7 15.3 0.0 0.0 0.0 0.0 October 739 99.9% 0.1 0.9 0 0.3 0 89.7 10.3 0.0 0.0 0.0 0.0 November 715 100.0% 0.2 0.8 0 0.4 0 85.9 14.1 0.0 0.0 0.0 0.0 December 739 100.0% 0.2 1.6 0 0.4 0 85.9 13.8 0.3 0.0 0.0 0.0 Annual 8684 99.6% 0.2 1.6 0 0.7 0 74.7 25.1 0.1 0.0 0.0 0.0
a. 1‐hour Alberta Ambient Air Quality Objective = 13 ppm b. 8‐hour Alberta Ambient Air Quality Objective = 5 ppm.

AI-9-9
Table I‐75 Edmonton South Station: Summary of continuous THC monitoring results for 2013
Valid Operational Average Maximum 1‐Hour Maximum 24‐Hour Percent of Data within Concentration Range (%) Month 1‐Hr data Time 1‐Hr Conc. 1‐Hr Conc. Exceedance a 24‐Hr Conc. Exceedance a
(no.) (%) (ppm) (ppm) (no.) (ppm) (no.) <=1 >1‐2 >2‐3 >3‐4 >4‐5 >5 January 736 96.8% 2.5 3.8 ‐ 3.0 ‐ 0.0 1.4 96.5 2.2 0.0 0.0 February 665 99.8% 2.4 4.2 ‐ 3.2 ‐ 0.0 3.6 92.3 3.9 0.2 0.0 March 737 99.7% 2.3 3.1 ‐ 2.5 ‐ 0.0 9.9 89.8 0.3 0.0 0.0 April 712 99.9% 2.1 2.8 ‐ 2.3 ‐ 0.0 30.2 69.8 0.0 0.0 0.0 May 739 99.9% 2.0 3.0 ‐ 2.3 ‐ 0.0 61.6 38.4 0.0 0.0 0.0June 712 99.7% 2.1 2.8 ‐ 2.2 ‐ 0.0 48.6 51.4 0.0 0.0 0.0 July 737 99.7% 2.0 3.0 ‐ 2.2 ‐ 0.0 72.3 27.7 0.0 0.0 0.0 August 740 100.0% 2.1 3.4 ‐ 2.4 ‐ 0.0 62.4 37.2 0.4 0.0 0.0 September 713 99.7% 2.2 3.2 ‐ 2.4 ‐ 0.0 31.4 68.2 0.4 0.0 0.0 October 740 100.0% 2.3 3.0 ‐ 2.5 ‐ 0.0 17.7 82.3 0.0 0.0 0.0 November 711 99.7% 2.3 3.4 ‐ 2.8 ‐ 0.0 15.9 83.1 1.0 0.0 0.0 December 740 100.0% 2.3 4.3 ‐ 2.8 ‐ 0.0 12.3 85.7 1.9 0.1 0.0 Annual 8682 99.6% 2.2 4.3 ‐ 3.2 ‐ 0.0 30.8 68.3 0.8 0.0 0.0
a. There is no Alberta Ambient Air Quality Objective for THC.

AI-9-10
Table I‐76 Edmonton South Station: Summary of continuous PM2.5 monitoring results for 2013
Valid Operational Average Maximum 1‐Hour Maximum 24‐Hour Percent of Data within Concentration Range (%)
Month 1‐Hr data Time 1‐Hr Conc. 1‐Hr Conc. Exceedance a 24‐Hr Conc. Exceedance b (no.) (%) (µg/m3) (µg/m3) (no.) (µg/m3) (no.) <=1 >1‐5 >5‐10 >10‐20 >20‐30 >30
January 683 89.5% 9 42 ‐ 22 0 25.8 19.3 22.7 20.8 7.6 3.8 February 619 92.5% 10 55 ‐ 38 2 18.7 23.7 22.3 21.8 7.6 5.8 March 721 97.7% 12 63 ‐ 41 3 14.4 18.7 25.4 21.6 10.1 9.7 April 657 92.4% 5 30 ‐ 12 0 29.7 34.2 24.7 10.4 1.1 0.0 May 654 89.2% 6 36 ‐ 13 0 27.8 32.7 22.5 14.2 2.4 0.3June 497 70.6% 2 17 ‐ 5 0 65.8 25.2 7.2 1.8 0.0 0.0 July 578 77.7% 6 22 ‐ 11 0 20.9 30.4 36.0 12.3 0.3 0.0 August 712 96.1% 9 51 ‐ 15 0 14.6 20.1 29.1 31.5 4.1 0.7 September 641 90.2% 4 27 ‐ 6 0 39.0 35.4 18.9 6.6 0.2 0.0 October 700 94.7% 3 25 ‐ 6 0 40.4 42.4 15.6 1.4 0.1 0.0 November 659 91.5% 6 29 ‐ 10 0 27.0 28.8 28.8 14.1 1.2 0.0 December 676 91.2% 5 26 ‐ 11 0 28.1 36.7 25.3 9.0 0.9 0.0 Annual 7797 89.5% 6 63 ‐ 41 5 28.5 29.0 23.4 14.2 3.1 1.8
a. There is no 1‐hour Alberta Ambient Air Quality Objective for PM2.5. b. 24‐hour Alberta Ambient Air Quality Objective = 30 µg/m3.

AI-9-11
Table I‐77 Edmonton South Station: Summary of continuous PM10 monitoring results for 2013
Valid Operational Average Maximum 1‐Hour Maximum 24‐Hour Percent of Data within Concentration Range (%)
Month 1‐Hr data Time 1‐Hr Conc. 1‐Hr Conc. Exceedance a 24‐Hr Conc. Exceedance a (no.) (%) (µg/m3) (µg/m3) (no.) (µg/m3) (no.) <=1 >1‐5 >5‐10 >10‐20 >20‐30 >30
January 733 96.4% 8 59 ‐ 23 ‐ 13.1 35.2 26.5 18.6 3.7 3.0 February 654 100.0% 9 62 ‐ 23 ‐ 10.6 30.0 23.5 27.2 5.8 2.9 March 740 100.0% 14 68 ‐ 25 ‐ 1.6 22.2 24.2 32.4 13.5 6.1 April 713 99.4% 17 100 ‐ 37 ‐ 3.8 19.2 21.2 28.9 12.9 14.0 May 738 99.7% 22 136 ‐ 54 ‐ 2.0 6.1 13.8 35.2 20.5 22.4June 717 99.7% 9 43 ‐ 22 ‐ 6.8 27.2 30.7 28.6 4.7 2.0 July 729 98.4% 10 70 ‐ 26 ‐ 10.3 25.9 24.8 28.4 5.8 4.8 August 733 98.9% 17 81 ‐ 37 ‐ 2.5 8.3 21.8 40.0 14.9 12.6 September 717 99.9% 22 123 ‐ 48 ‐ 3.3 4.6 9.6 32.9 25.7 23.8 October 737 99.6% 13 87 ‐ 24 ‐ 6.6 22.8 23.6 28.4 11.7 6.9 November 719 99.9% 8 48 ‐ 19 ‐ 8.2 33.4 33.8 22.0 1.8 0.8 December 742 100.0% 6 42 ‐ 13 ‐ 13.6 44.1 29.8 9.6 2.2 0.8 Annual 8672 99.3% 13 136 ‐ 54 ‐ 6.8 23.2 23.6 27.7 10.3 8.4
a. There is no 1‐hour Alberta Ambient Air Quality Objective for PM10.

AI-9-12
Table I‐78 Edmonton South Station: Summary of continuous ambient temperature monitoring results for 2013
Valid Operational Average Minimum Maximum Percent of Data within temperature Range (%)
Month 1‐Hr data Time 1‐Hr Temp. 1‐Hr Temp. 1‐Hr Temp. (no.) (%) (°C) (°C) (°C) <=‐30 >‐30~‐15 >‐15~‐0 >0~‐15 >15~30 >30
January 736 95.8% ‐7.9 ‐24.3 10.1 0.0 17.7 65.6 16.7 0.0 0.0 February 672 100.0% ‐3.1 ‐13.0 8.9 0.0 0.0 71.0 29.0 0.0 0.0 March 744 100.0% ‐5.8 ‐20.3 10.3 0.0 10.8 69.5 19.8 0.0 0.0 April 719 99.9% 1.0 ‐12.5 20.2 0.0 0.0 48.1 49.0 2.9 0.0 May 744 100.0% 14.4 ‐4.4 30.0 0.0 0.0 1.2 53.4 45.4 0.0June 720 100.0% 15.7 5.9 28.5 0.0 0.0 0.0 49.2 50.8 0.0 July 743 99.9% 17.3 0.0 34.7 0.0 0.0 0.1 33.8 65.1 0.9 August 744 100.0% 18.3 8.1 28.0 0.0 0.0 0.0 26.2 73.8 0.0 September 720 100.0% 14.8 ‐1.1 30.5 0.0 0.0 0.6 51.5 47.5 0.4 October 744 100.0% 5.8 ‐8.5 18.0 0.0 0.0 13.4 84.0 2.6 0.0 November 720 100.0% ‐5.9 ‐24.6 10.6 0.0 6.1 74.3 19.6 0.0 0.0 December 708 95.2% ‐11.8 ‐24.5 5.1 0.0 48.2 40.7 11.2 0.0 0.0 Annual 8714 99.2% 4.5 ‐24.6 34.7 0.0 6.8 31.7 37.1 24.3 0.1
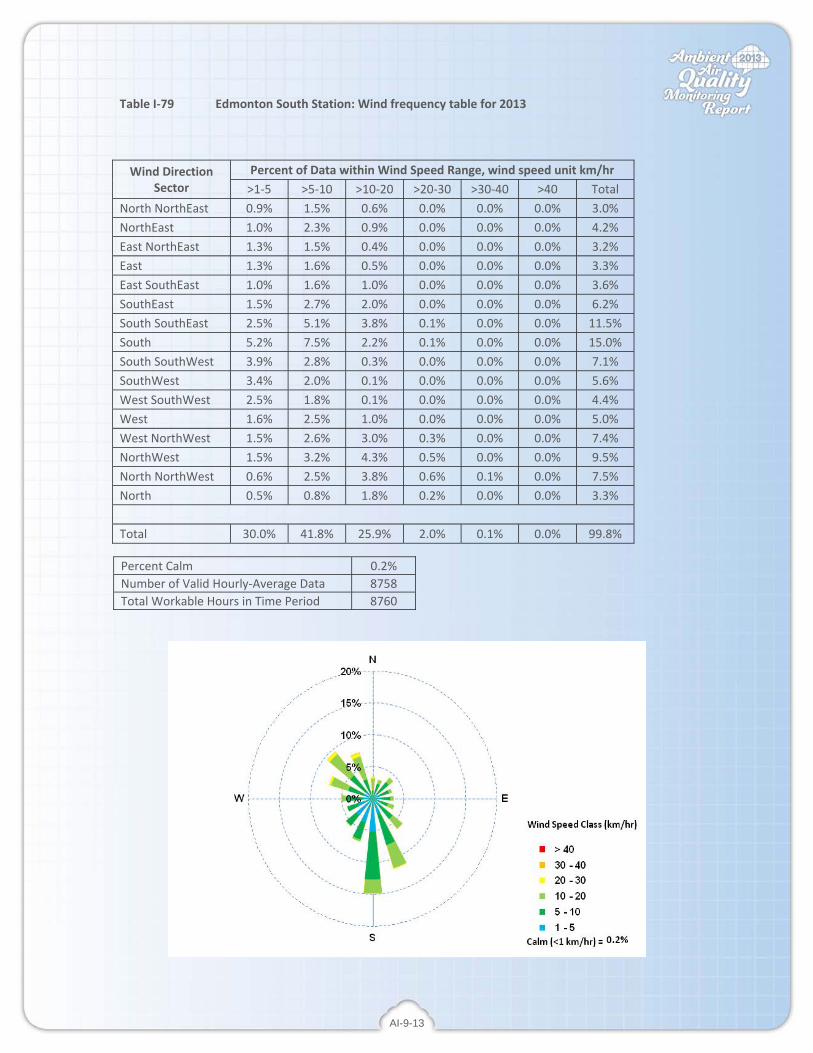
AI-9-13
Table I‐79 Edmonton South Station: Wind frequency table for 2013
Wind Direction Sector
Percent of Data within Wind Speed Range, wind speed unit km/hr >1‐5 >5‐10 >10‐20 >20‐30 >30‐40 >40 Total
North NorthEast 0.9% 1.5% 0.6% 0.0% 0.0% 0.0% 3.0% NorthEast 1.0% 2.3% 0.9% 0.0% 0.0% 0.0% 4.2% East NorthEast 1.3% 1.5% 0.4% 0.0% 0.0% 0.0% 3.2% East 1.3% 1.6% 0.5% 0.0% 0.0% 0.0% 3.3% East SouthEast 1.0% 1.6% 1.0% 0.0% 0.0% 0.0% 3.6% SouthEast 1.5% 2.7% 2.0% 0.0% 0.0% 0.0% 6.2% South SouthEast 2.5% 5.1% 3.8% 0.1% 0.0% 0.0% 11.5% South 5.2% 7.5% 2.2% 0.1% 0.0% 0.0% 15.0% South SouthWest 3.9% 2.8% 0.3% 0.0% 0.0% 0.0% 7.1% SouthWest 3.4% 2.0% 0.1% 0.0% 0.0% 0.0% 5.6% West SouthWest 2.5% 1.8% 0.1% 0.0% 0.0% 0.0% 4.4% West 1.6% 2.5% 1.0% 0.0% 0.0% 0.0% 5.0% West NorthWest 1.5% 2.6% 3.0% 0.3% 0.0% 0.0% 7.4% NorthWest 1.5% 3.2% 4.3% 0.5% 0.0% 0.0% 9.5% North NorthWest 0.6% 2.5% 3.8% 0.6% 0.1% 0.0% 7.5% North 0.5% 0.8% 1.8% 0.2% 0.0% 0.0% 3.3% Total 30.0% 41.8% 25.9% 2.0% 0.1% 0.0% 99.8%
Percent Calm 0.2% Number of Valid Hourly‐Average Data 8758 Total Workable Hours in Time Period 8760

AII
Appendix II
Summary for Passive Monitoring Data

AII-1
Table II‐1 Summary for 30‐day passive SO2 for 2013
Month 30‐Day Passive SO2 Concentrations for 2013 (ppb)
Site 1 Site 2 Site 3 Site 4 Site 5 Site 6 Network Average
Network Maximum
January 2 2 1 2 2 2 2 2 February 1 2 1 1 1 1 1 2 March 2 2 2 2 2 2 2 2 April 2 2 1 1 1 1 1 2 May 1 2 1 1 3 1 2 3 June 1 1 1 1 2 1 1 2 July 1 1 1 2 1 1 1 2
August 2 2 2 1 3 1 2 3 September 1 2 <1 1 1 1 1 2 October 1 2 1 2 1 1 1 2 November 1 2 1 2 1 1 2 2 December 2 2 1 4 2 2 2 4
Annual Average 1 2 1 2 2 1 1 2 Maximum Month 2 2 2 4 3 2 2 4
Table II‐2 Summary for 30‐day passive NO2 for 2013
Month 30‐Day Passive NO2 Concentrations for 2013 (ppb)
Site 1 Site 2 Site 3 Site 4 Site 5 Site 6 Network Average
Network Maximum
January 21.9 16.8 20.6 11.5 14.3 14.3 16.6 21.9 February 14.8 17.4 11.9 8.7 9.5 9.8 12.0 17.4 March 6.1 8.2 6.6 3.9 6.0 6.2 6.2 8.2 April 4.8 4.3 2.8 3.9 5.6 4.0 4.2 5.6 May 3.3 2.7 1.5 1.5 3.6 2.9 2.6 3.6 June 3.1 2.9 2.4 3.3 4.0 4.1 3.3 4.1 July 3.3 3.2 2.4 3.3 3.6 3.2 3.2 3.6
August 4.6 3.8 2.3 2.6 7.4 3.7 4.1 7.4 September 4.7 4.9 3.1 3.2 5.3 4.4 4.3 5.3 October 9.3 9.6 7.8 6.6 8.8 8.7 8.5 9.6 November 17.6 15.2 15.8 12.6 14.9 16.6 15.5 17.6 December 14.2 15.7 13.8 16.3 12.9 12.0 14.2 16.3
Annual Average 9.0 8.7 7.6 6.5 8.0 7.5 7.9 10.1 Maximum Month 21.9 17.4 20.6 16.3 14.9 16.6 16.6 21.9
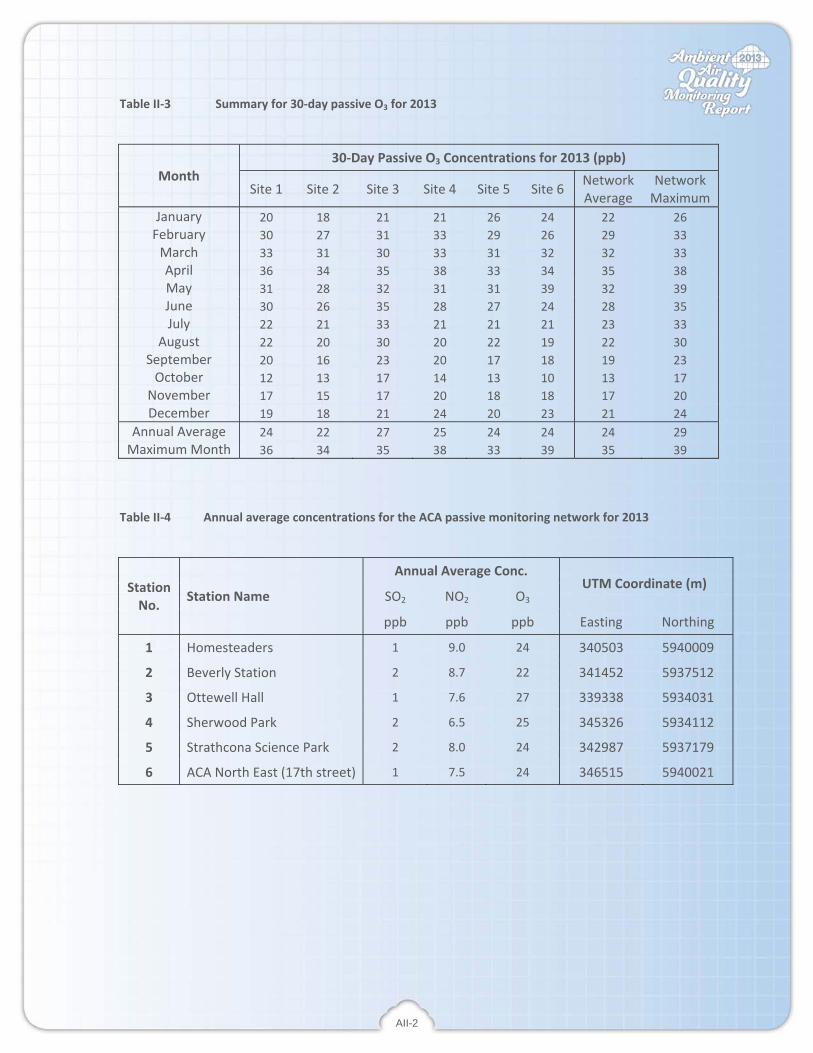
AII-2
Table II‐3 Summary for 30‐day passive O3 for 2013
Month 30‐Day Passive O3 Concentrations for 2013 (ppb)
Site 1 Site 2 Site 3 Site 4 Site 5 Site 6 Network Average
Network Maximum
January 20 18 21 21 26 24 22 26 February 30 27 31 33 29 26 29 33 March 33 31 30 33 31 32 32 33 April 36 34 35 38 33 34 35 38 May 31 28 32 31 31 39 32 39 June 30 26 35 28 27 24 28 35 July 22 21 33 21 21 21 23 33
August 22 20 30 20 22 19 22 30 September 20 16 23 20 17 18 19 23 October 12 13 17 14 13 10 13 17 November 17 15 17 20 18 18 17 20 December 19 18 21 24 20 23 21 24
Annual Average 24 22 27 25 24 24 24 29 Maximum Month 36 34 35 38 33 39 35 39
Table II‐4 Annual average concentrations for the ACA passive monitoring network for 2013
Station No. Station Name
Annual Average Conc. UTM Coordinate (m)
SO2 NO2 O3
ppb ppb ppb Easting Northing
1 Homesteaders 1 9.0 24 340503 5940009
2 Beverly Station 2 8.7 22 341452 5937512
3 Ottewell Hall 1 7.6 27 339338 5934031
4 Sherwood Park 2 6.5 25 345326 5934112
5 Strathcona Science Park 2 8.0 24 342987 5937179
6 ACA North East (17th street) 1 7.5 24 346515 5940021
AIII
Appendix III
Summary for Intermittent Particulate Monitoring Data
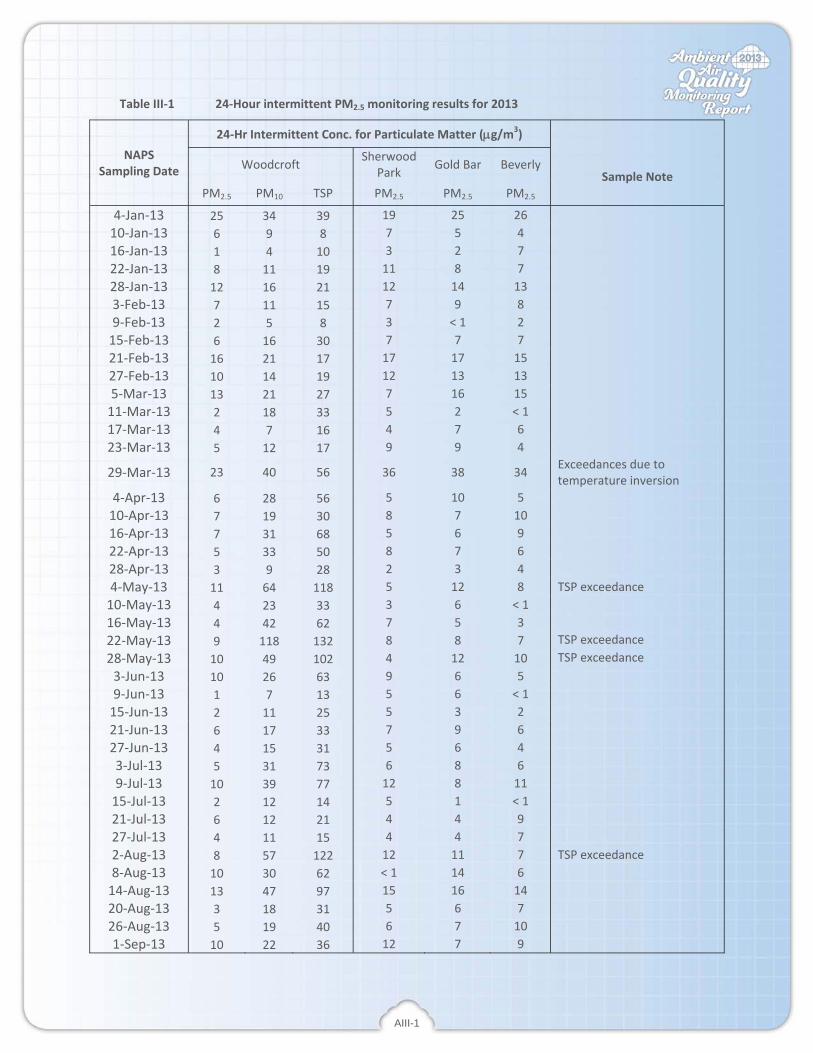
AIII-1
Table III‐1 24‐Hour intermittent PM2.5 monitoring results for 2013
NAPS Sampling Date
24‐Hr Intermittent Conc. for Particulate Matter (μg/m3)
Woodcroft Sherwood Park Gold Bar Beverly
Sample Note PM2.5 PM10 TSP PM2.5 PM2.5 PM2.5
4‐Jan‐13 25 34 39 19 25 26 10‐Jan‐13 6 9 8 7 5 4 16‐Jan‐13 1 4 10 3 2 7 22‐Jan‐13 8 11 19 11 8 7 28‐Jan‐13 12 16 21 12 14 13 3‐Feb‐13 7 11 15 7 9 8 9‐Feb‐13 2 5 8 3 < 1 2 15‐Feb‐13 6 16 30 7 7 7 21‐Feb‐13 16 21 17 17 17 15 27‐Feb‐13 10 14 19 12 13 13 5‐Mar‐13 13 21 27 7 16 15 11‐Mar‐13 2 18 33 5 2 < 1 17‐Mar‐13 4 7 16 4 7 6 23‐Mar‐13 5 12 17 9 9 4
29‐Mar‐13 23 40 56 36 38 34 Exceedances due to temperature inversion
4‐Apr‐13 6 28 56 5 10 5 10‐Apr‐13 7 19 30 8 7 10 16‐Apr‐13 7 31 68 5 6 9 22‐Apr‐13 5 33 50 8 7 6 28‐Apr‐13 3 9 28 2 3 4 4‐May‐13 11 64 118 5 12 8 TSP exceedance 10‐May‐13 4 23 33 3 6 < 1 16‐May‐13 4 42 62 7 5 3 22‐May‐13 9 118 132 8 8 7 TSP exceedance 28‐May‐13 10 49 102 4 12 10 TSP exceedance 3‐Jun‐13 10 26 63 9 6 5 9‐Jun‐13 1 7 13 5 6 < 1 15‐Jun‐13 2 11 25 5 3 2 21‐Jun‐13 6 17 33 7 9 6 27‐Jun‐13 4 15 31 5 6 4 3‐Jul‐13 5 31 73 6 8 6 9‐Jul‐13 10 39 77 12 8 11 15‐Jul‐13 2 12 14 5 1 < 1 21‐Jul‐13 6 12 21 4 4 9 27‐Jul‐13 4 11 15 4 4 7 2‐Aug‐13 8 57 122 12 11 7 TSP exceedance 8‐Aug‐13 10 30 62 < 1 14 6 14‐Aug‐13 13 47 97 15 16 14 20‐Aug‐13 3 18 31 5 6 7 26‐Aug‐13 5 19 40 6 7 10 1‐Sep‐13 10 22 36 12 7 9

AIII-2
Table III‐1 24‐Hour intermittent PM2.5 monitoring results for 2013 (continued)
NAPS Sampling Date
24‐Hr Intermittent Conc. for Particulate Matter (μg/m3)
Woodcroft Sherwood Park Gold Bar Beverly
Sample Note PM2.5 PM10 TSP PM2.5 PM2.5 PM2.5
7‐Sep‐13 5 26 46 7 5 213‐Sep‐13 12 59 99 14 11 519‐Sep‐13 6 61 91 4 9 625‐Sep‐13 5 36 46 4 3 61‐Oct‐13 0 6 12 2 2 < 17‐Oct‐13 4 27 42 7 6 113‐Oct‐13 9 26 51 12 12 1019‐Oct‐13 4 39 60 4 < 1 325‐Oct‐13 7 37 55 5 9 731‐Oct‐13 4 20 24 3 2 46‐Nov‐13 9 17 17 41 21 14 Sherwood Park exceedance12‐Nov‐13 17 26 30 14 15 1318‐Nov‐13 12 13 45 10 8 924‐Nov‐13 3 3 7 3 5 230‐Nov‐13 18 19 24 14 21 16
6‐Dec‐13 13 17 27 ‐‐‐ 3 20 Sherwood Park sample failed to run
12‐Dec‐13 6 10 24 5 7 < 1
18‐Dec‐13 4 8 7 ‐‐‐ < 1 2 Sherwood Park sample failed to run
24‐Dec‐13 2 5 7 5 8 2
30‐Dec‐13 9 13 20 ‐‐‐ 14 18 Sherwood Park sample failed to run

End of the Report