ac2017 6. output based contracting
TRANSCRIPT

Camiel Both – [email protected]
AtulKaul – [email protected] Richard Sweer – [email protected]
9 November 2017 - version 1.00
Output base contract management in an Agile world
version 1.00 2/27
Agenda
• 5 Why’s
• Core metrics for every (agile) project
• Vision about Agile/Scrum and FSM
• Model - approach
• Results
• Monitor and control
• Experiences Glencore Agriculture (client)
• Experiences Cognizant (vendor)

version 1.00 3/27
Why 1 – most significant determinants
• Most significant determinants of effort
1. Project size (10 or 10.000 Function Points)
2. Kind of software (factor 30-40)- Nuclear power plant, air traffic system, bank system, etc.
3. Effectiveness of individuals of team (factor 10-20)
4. Programming languages (factor 2-6)- .NET, Java, Mendix, OutSystems, Thinkwise, Codeless, Angular, Polymer, Oracle, SQL Server, etc.
version 1.00 4/27
Why 2 – productivity/quality team members
SUITABLE
UNSUITABLE
BIT IN BETWEEN
version 1.00 5/27
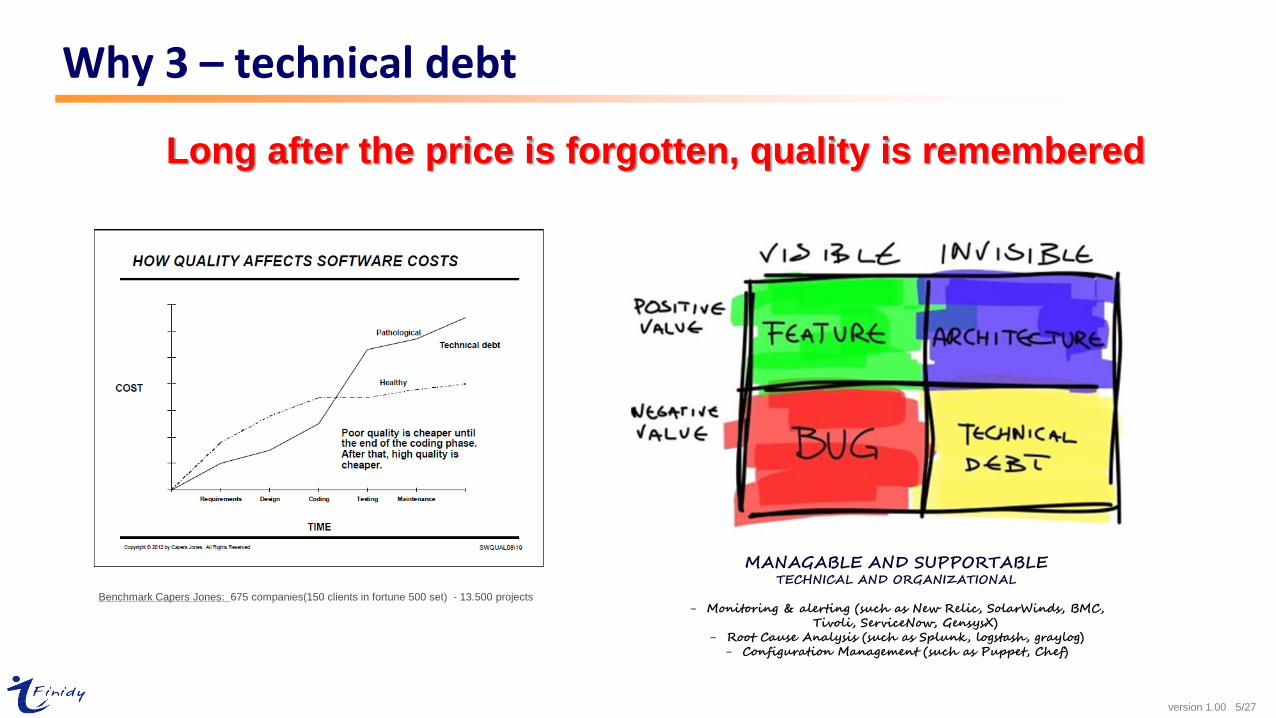
Benchmark Capers Jones: 675 companies(150 clients in fortune 500 set) - 13.500 projects
Long after the price is forgotten, quality is remembered
Why 3 – technical debt
MANAGABLE AND SUPPORTABLETECHNICAL AND ORGANIZATIONAL
- Monitoring & alerting (such as New Relic, SolarWinds, BMC, Tivoli, ServiceNow, GensysX)
- Root Cause Analysis (such as Splunk, logstash, graylog)- Configuration Management (such as Puppet, Chef)
version 1.00 6/27
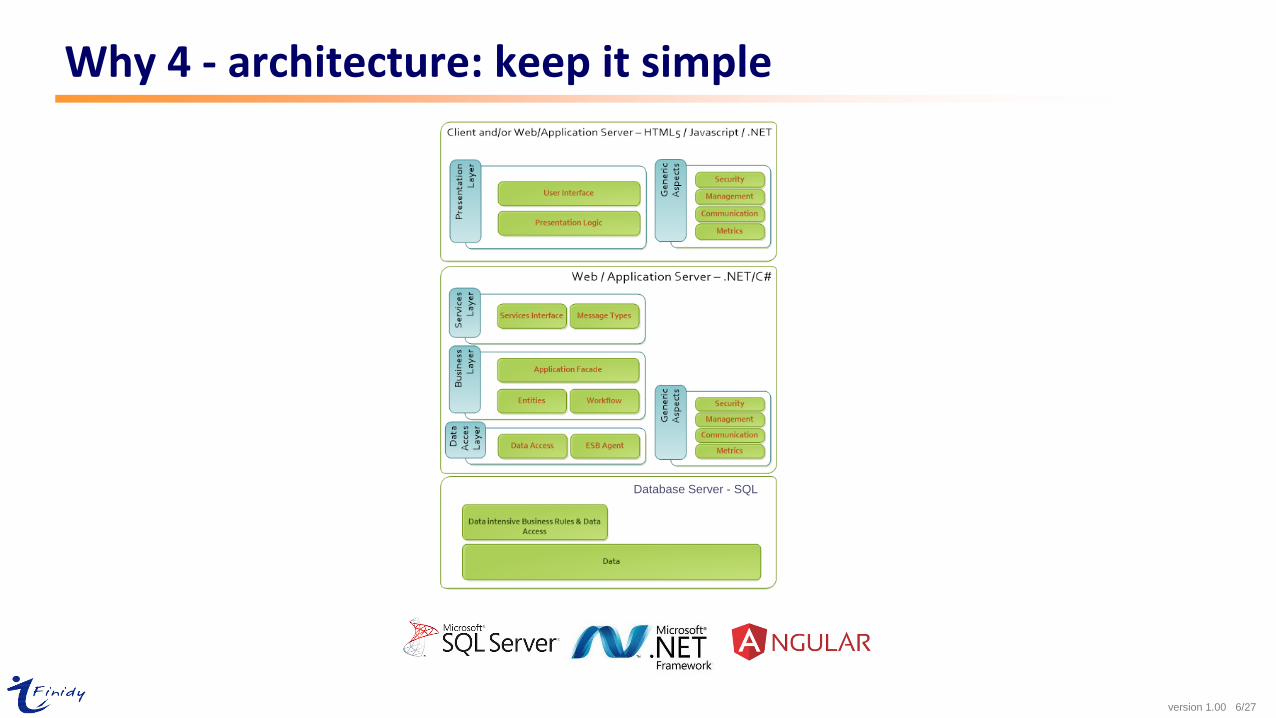
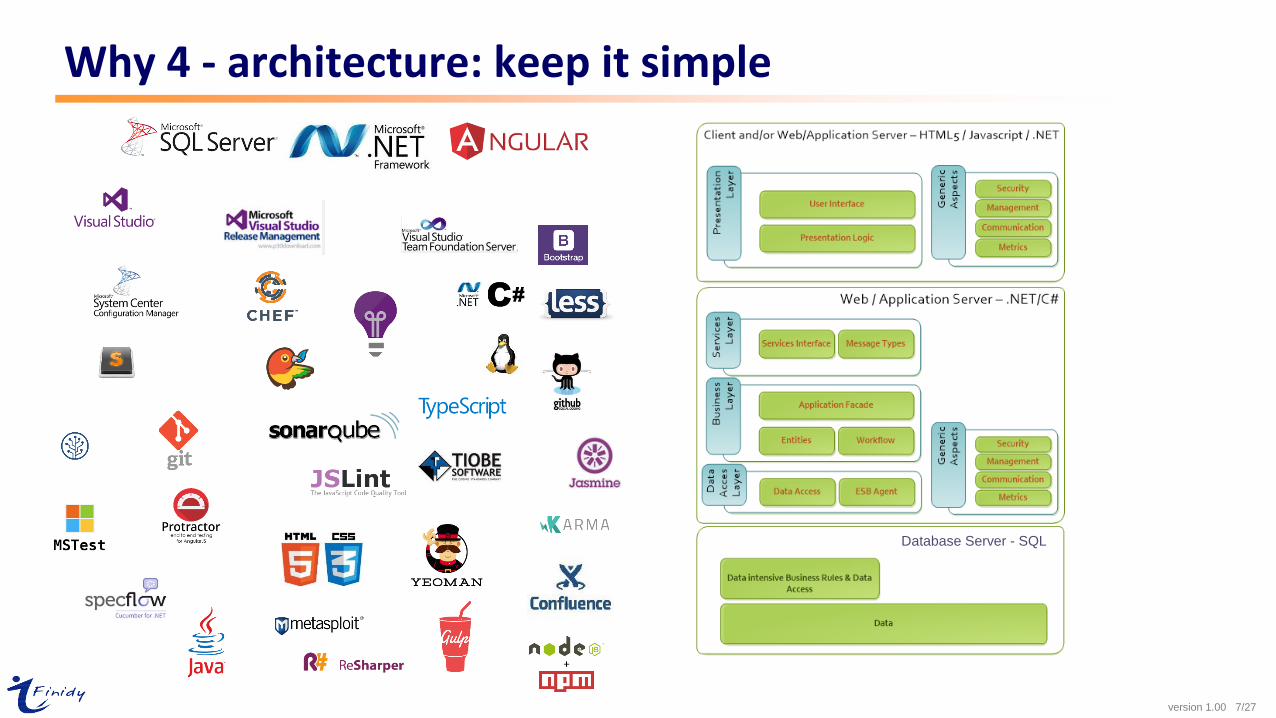
Why 4 - architecture: keep it simple
Database Server - SQL
version 1.00 7/27
Why 4 - architecture: keep it simple
Database Server - SQL

version 1.00 8/27
Why 5 - deadlines and limited costs
AWBZ, Wanbetalers en Onverzekerden
projects between 3 and >15 million Euro (only ICT)
with a duration between 1 and 4 yearsReviews & audits on effort, duration and costs

version 1.00 9/27
Core metrics for every (agile) project
• Productivity rates
Hours of effort
(User requested) size of Software Product Delivered
• Cost effectivenessProject dollar cost
(User requested) size of Software Product Delivered
• Product quality1) Defects delivered
(User requested) size of Software Product Delivered
2) Quality attributes based on (ISO 25010 past 9126)
3) Software architectural audits

version 1.00 10/27
Time-boxed “Sprint” Cycles
Sprint Planning Meeting
- Review Product Backlog
- Estimate Sprint Backlog
- Commit
Daily Scrum Meetings
- Done since last meeting
- Plan for today
- Roadlocks/Accelerators?
Sprint Review Meeting
- Demo features to all
- Retrospective on the Sprint
Product Backlog Backlog tasks
Product Backlog
- Client prioritized
product features
Sprint Backlog
- Features assigned to Sprint
- Estimated by team
- Team commitment
Working Code Ready for
Shipping (product)
Time-boxed
Test/Develop
FSM FSM FSMincrease
decrease
increase
decrease
Story Points for team commitment
&
Functional Size Measurement (FSM) for competitive
productivity, cost effectiveness and product quality
Vision on FSM and Agile/scrum
version 1.00 11/27
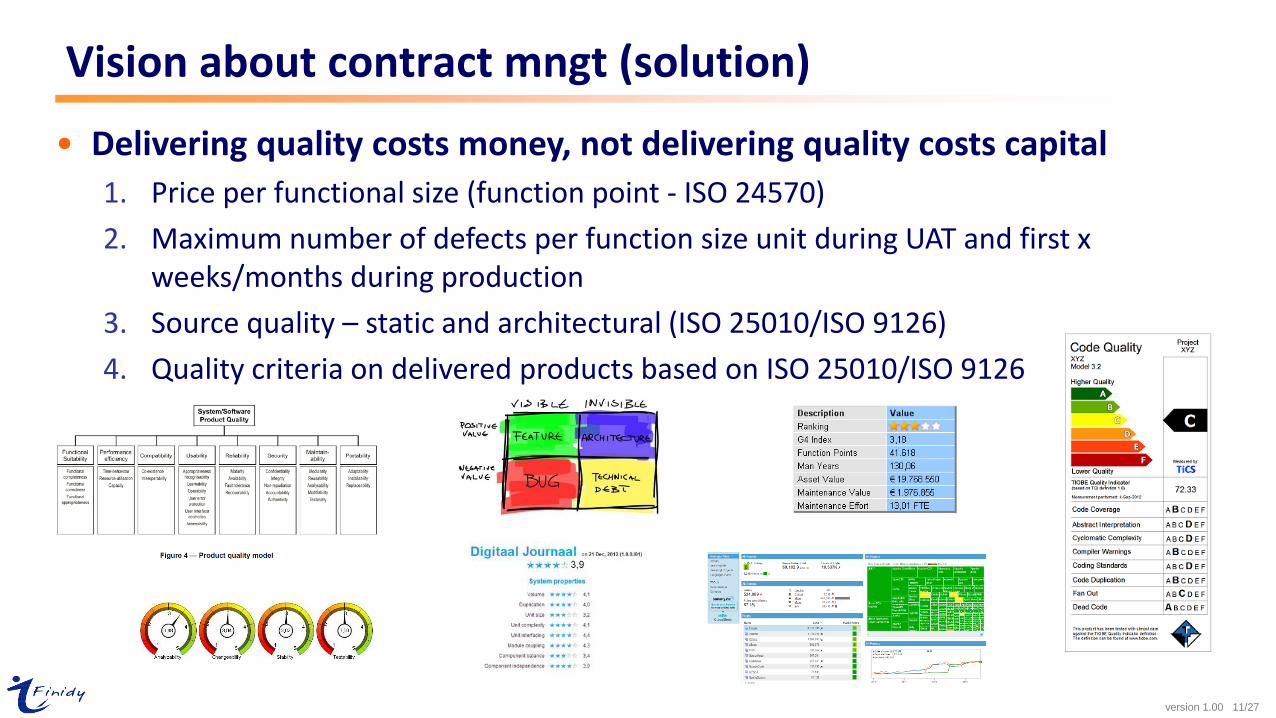
• Delivering quality costs money, not delivering quality costs capital
1. Price per functional size (function point - ISO 24570)
2. Maximum number of defects per function size unit during UAT and first x weeks/months during production
3. Source quality – static and architectural (ISO 25010/ISO 9126)
4. Quality criteria on delivered products based on ISO 25010/ISO 9126
Vision about contract mngt (solution)
version 1.00 12/27
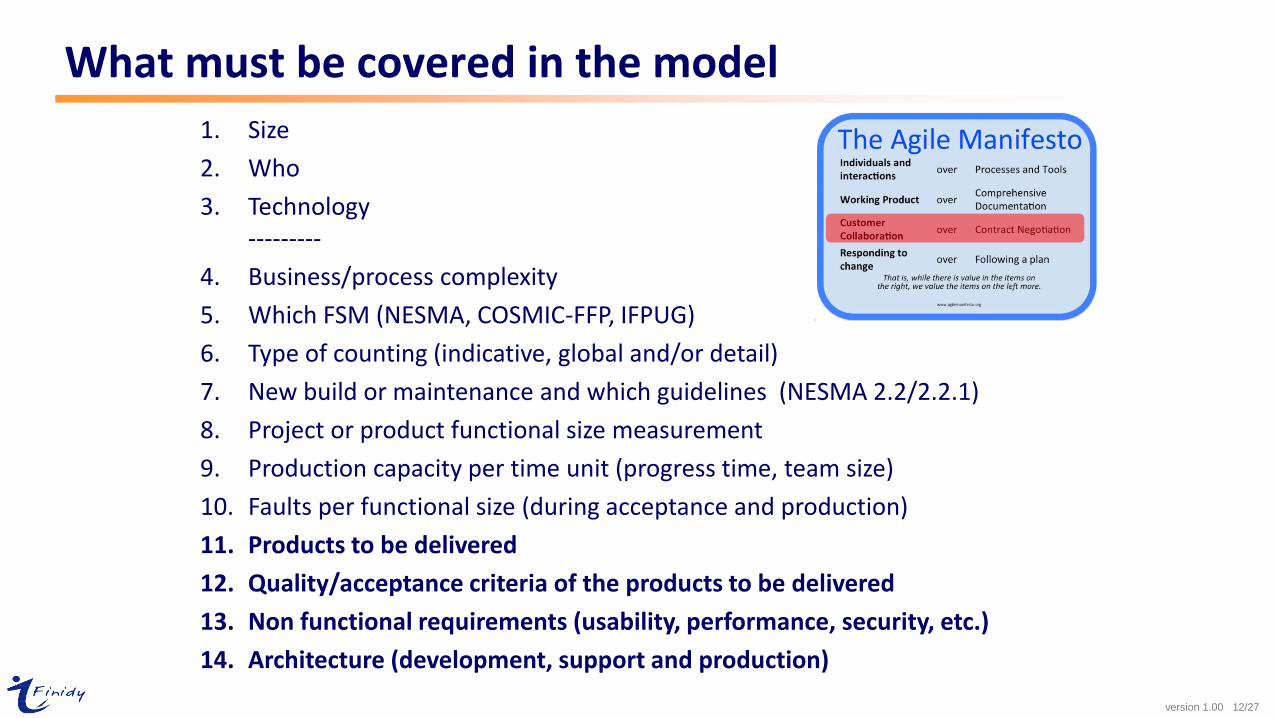
1. Size
2. Who
3. Technology---------
4. Business/process complexity
5. Which FSM (NESMA, COSMIC-FFP, IFPUG)
6. Type of counting (indicative, global and/or detail)
7. New build or maintenance and which guidelines (NESMA 2.2/2.2.1)
8. Project or product functional size measurement
9. Production capacity per time unit (progress time, team size)
10. Faults per functional size (during acceptance and production)
11. Products to be delivered
12. Quality/acceptance criteria of the products to be delivered
13. Non functional requirements (usability, performance, security, etc.)
14. Architecture (development, support and production)
What must be covered in the model

version 1.00 13/27
Model - approachRFI/RFP
Statement of Work Monitor and controlKey Performance Indicators
Project Plan Project Start
ArchitectureApplication
example14 factors
Term sheet- based on more than 80 topics -

version 1.00 14/27
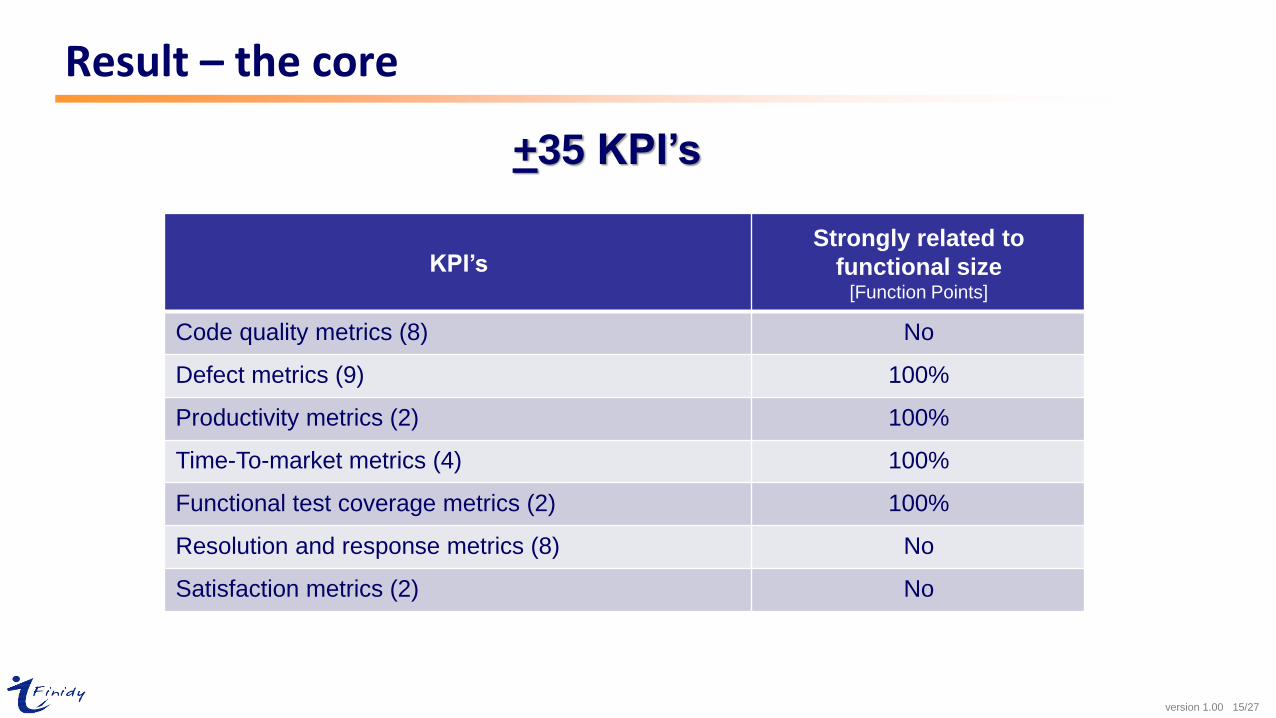
Result – the core
KPI’s
for project control
&
Contract mngt.
version 1.00 15/27
KPI’sStrongly related to
functional size [Function Points]
Code quality metrics (8) No
Defect metrics (9) 100%
Productivity metrics (2) 100%
Time-To-market metrics (4) 100%
Functional test coverage metrics (2) 100%
Resolution and response metrics (8) No
Satisfaction metrics (2) No
+35 KPI’s
Result – the core
version 1.00 16/27
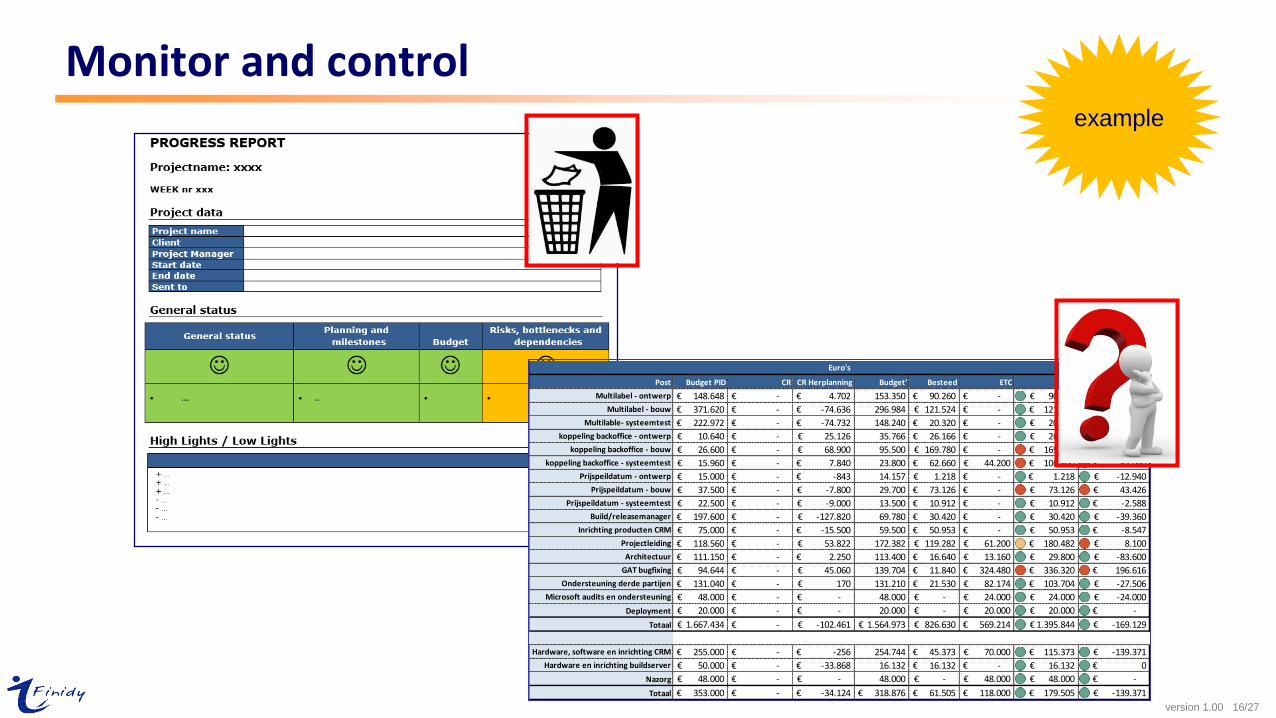
Monitor and controlexample
Post Budget PID CR CR Herplanning Budget' Besteed ETC EAC Δ Budget'-EAC
Multilabel - ontwerp 148.648€ -€ 4.702€ 153.350 90.260€ -€ 90.260€ -63.090€
Multilabel - bouw 371.620€ -€ -74.636€ 296.984 121.524€ -€ 121.524€ -175.461€
Multilable- systeemtest 222.972€ -€ -74.732€ 148.240 20.320€ -€ 20.320€ -127.920€
koppeling backoffice - ontwerp 10.640€ -€ 25.126€ 35.766 26.166€ -€ 26.166€ -9.600€
koppeling backoffice - bouw 26.600€ -€ 68.900€ 95.500 169.780€ -€ 169.780€ 74.280€
koppeling backoffice - systeemtest 15.960€ -€ 7.840€ 23.800 62.660€ 44.200€ 106.860€ 83.060€
Prijspeildatum - ontwerp 15.000€ -€ -843€ 14.157 1.218€ -€ 1.218€ -12.940€
Prijspeildatum - bouw 37.500€ -€ -7.800€ 29.700 73.126€ -€ 73.126€ 43.426€
Prijspeildatum - systeemtest 22.500€ -€ -9.000€ 13.500 10.912€ -€ 10.912€ -2.588€
Build/releasemanager 197.600€ -€ -127.820€ 69.780 30.420€ -€ 30.420€ -39.360€
Inrichting producten CRM 75.000€ -€ -15.500€ 59.500 50.953€ -€ 50.953€ -8.547€
Projectleiding 118.560€ -€ 53.822€ 172.382 119.282€ 61.200€ 180.482€ 8.100€
Architectuur 111.150€ -€ 2.250€ 113.400 16.640€ 13.160€ 29.800€ -83.600€
GAT bugfixing 94.644€ -€ 45.060€ 139.704 11.840€ 324.480€ 336.320€ 196.616€
Ondersteuning derde partijen 131.040€ -€ 170€ 131.210 21.530€ 82.174€ 103.704€ -27.506€
Microsoft audits en ondersteuning 48.000€ -€ -€ 48.000 -€ 24.000€ 24.000€ -24.000€
Deployment 20.000€ -€ -€ 20.000 -€ 20.000€ 20.000€ -€
Totaal 1.667.434€ -€ -102.461€ 1.564.973€ 826.630€ 569.214€ 1.395.844€ -169.129€
Hardware, software en inrichting CRM 255.000€ -€ -256€ 254.744 45.373€ 70.000€ 115.373€ -139.371€
Hardware en inrichting buildserver 50.000€ -€ -33.868€ 16.132 16.132€ -€ 16.132€ 0€
Nazorg 48.000€ -€ -€ 48.000 -€ 48.000€ 48.000€ -€
Totaal 353.000€ -€ -34.124€ 318.876€ 61.505€ 118.000€ 179.505€ -139.371€
Euro's

version 1.00 17/27
Monitor and Controlexample
Code Quality Target Sprint 1 Sprint 2 Sprint 3 Sprint 4
Abstract interpretations B A C A B
Cyclomatic complexity A A B C B
Compiler warnings B A B A A
Code standards C no 1 A B C no 1 C
Code duplication D A D C B
Fan out E A C E C
Dead Code B A B A A
Code Coverage C B C D C
Defect metrics Target Sprint 1 Sprint 2 Sprint 3 Sprint 4
Maximum defect with severity 1 in first iteration of UAT (defects/FP) 0,015 0,2 0,011 0,001 0,001
Maximum defects with severity 1 and 2 in UAT (defects/FP) 0,02 0,03 0,03 0,03 0,03
Defect with severity 1 and 2 in code 0 0 0,1 0,2 0
Maximum defect within documentation per sprint 3 2 3 2,2 2
Total defects with severity 1 and 2 in production for 4 consecutive weeks 0 0 0,1 0,001 0
Maximum defects with severity 3 and 4 in production for 4 consecutive weeks (defects/FP) 0,06 0,04 0,03 0,031 0,02
Productivity metrics Target Sprint 1 Sprint 2 Sprint 3 Sprint 4
Agile Delivery (per sprint in hours/FP) 20 10,7 11 13,4 14
Project Dashboard
version 1.00 18/27
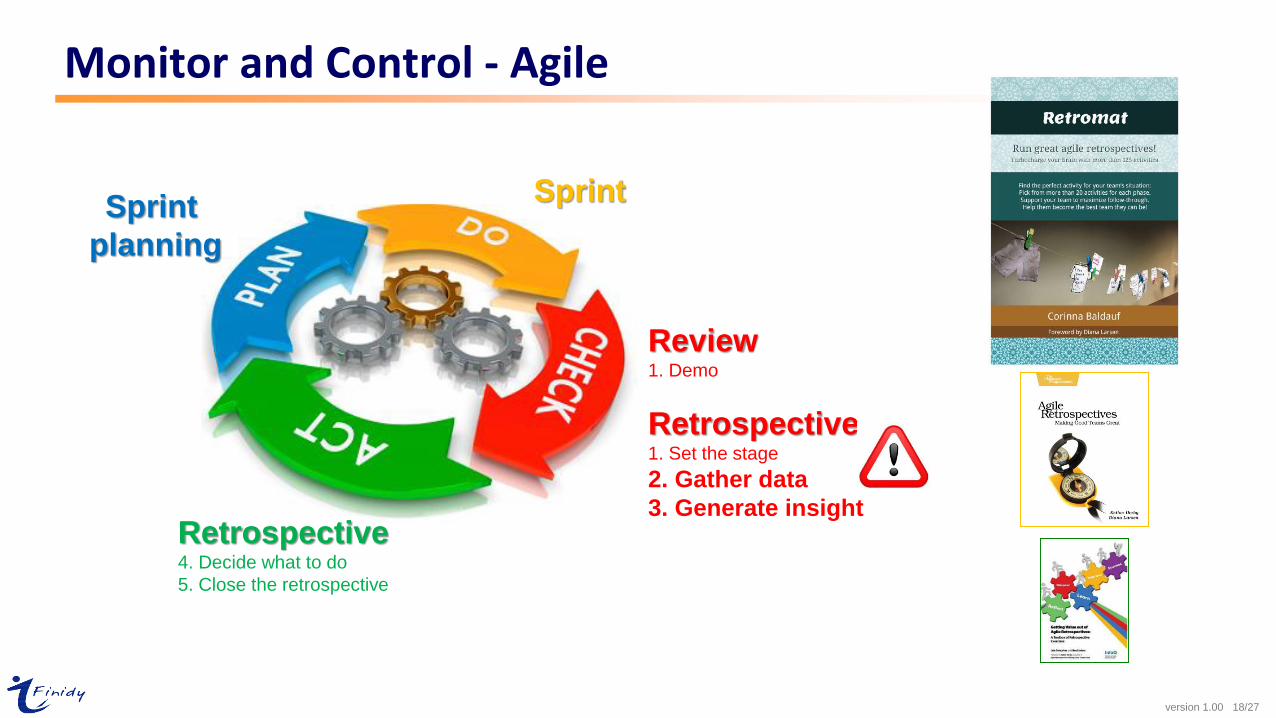
Monitor and Control - Agile
Review1. Demo
Retrospective1. Set the stage
2. Gather data
3. Generate insight
Sprint
Retrospective4. Decide what to do
5. Close the retrospective
Sprint
planning

Experiences with output based contractingNov 2017
Camiel Both, Head of IT
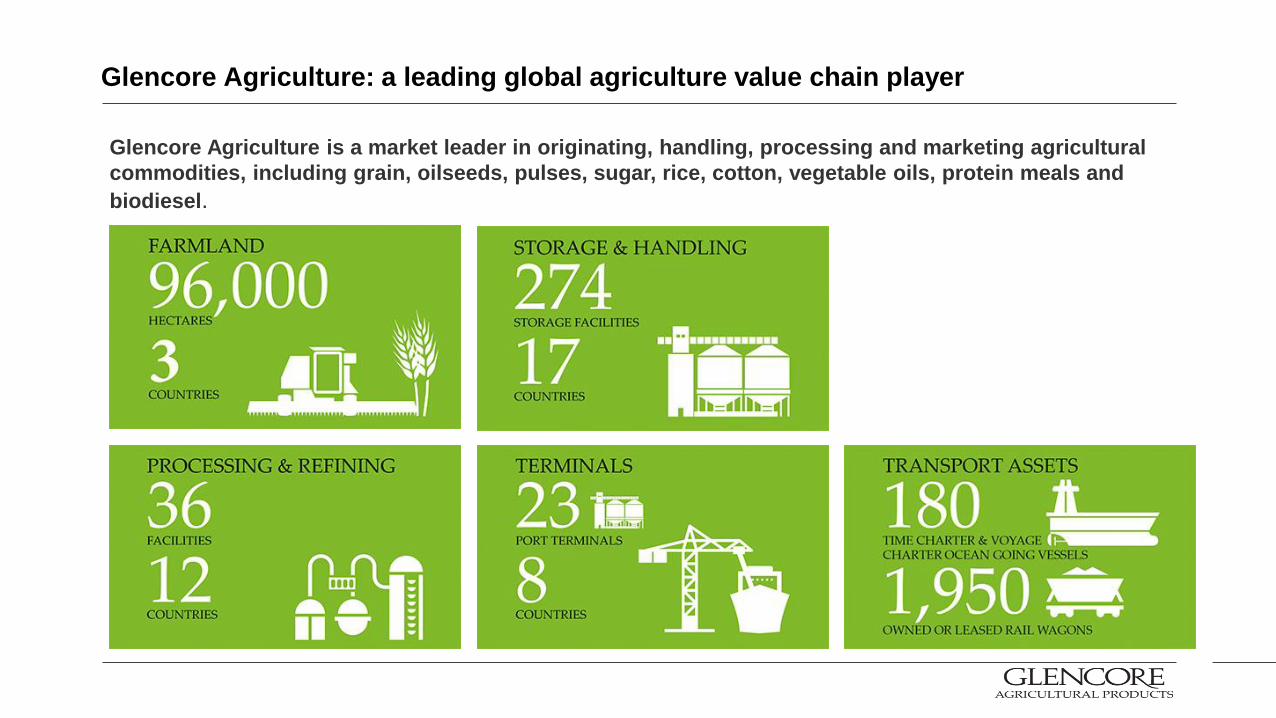
Glencore Agriculture: a leading global agriculture value chain player
Glencore Agriculture is a market leader in originating, handling, processing and marketing agricultural
commodities, including grain, oilseeds, pulses, sugar, rice, cotton, vegetable oils, protein meals and
biodiesel.

Glencore Agriculture - Project context
• Glencore Agriculture has written its existing Trading and Traffic System in Powerbuilder (Client)
and PL-SQL/Oracle (Backend).
• The existing system is complex and comprehensive.
• Used by more than 900 users in more than 16 countries.
• Scope of the system determined by conducting a NESMA 2.2 Function Point Analysis. Online
scope (exclusive batches and interfaces) is approximately 13,000 Function Points.
• Powerbuilder is set to be replaced by a different programming environment
• After a brief preliminary study, the choice has fallen on a
Oracle (DBMS), Microsoft .NET and TypeScript/Angular environment.
• Rebuild while the shop is still open:
• Modular rebuild
• Keep using single Oracle database
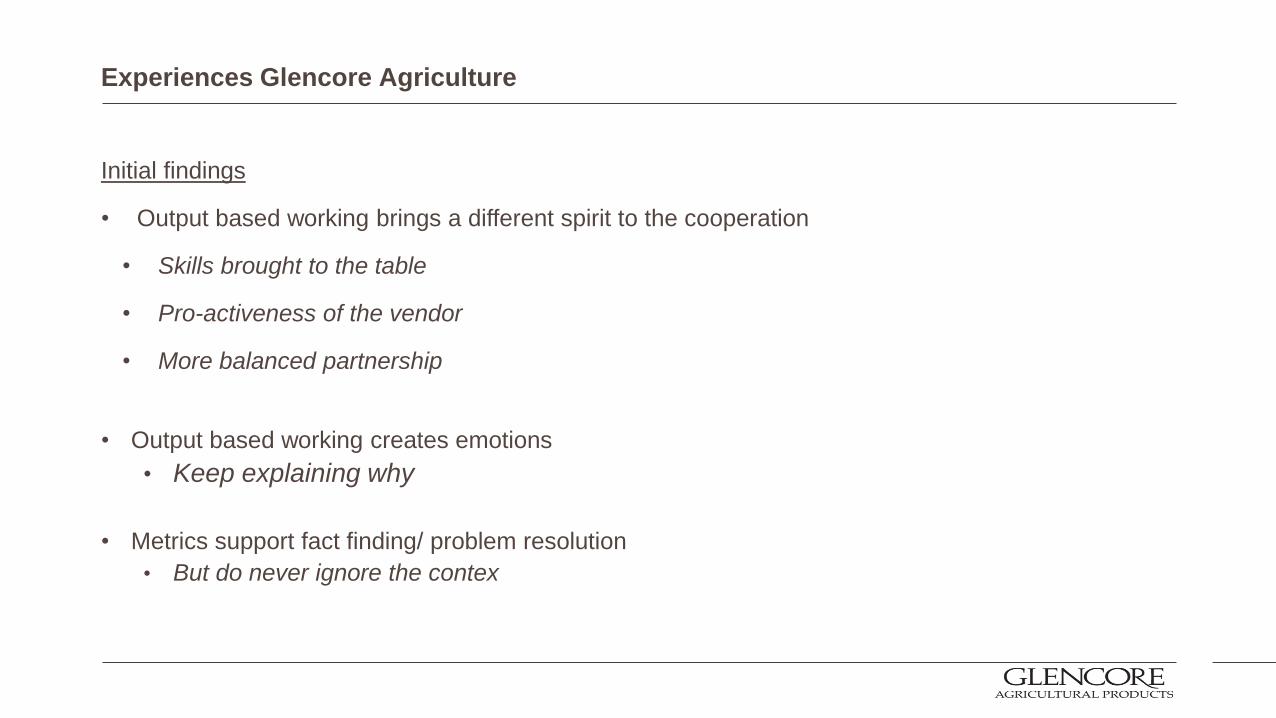
Experiences Glencore Agriculture
Initial findings
• Output based working brings a different spirit to the cooperation
• Skills brought to the table
• Pro-activeness of the vendor
• More balanced partnership
• Output based working creates emotions
• Keep explaining why
• Metrics support fact finding/ problem resolution
• But do never ignore the contex
© 2017 Cognizant
© 2017 Cognizant
9th Nov 2017
Output based contract management in Agile
world
© 2017 Cognizant 24
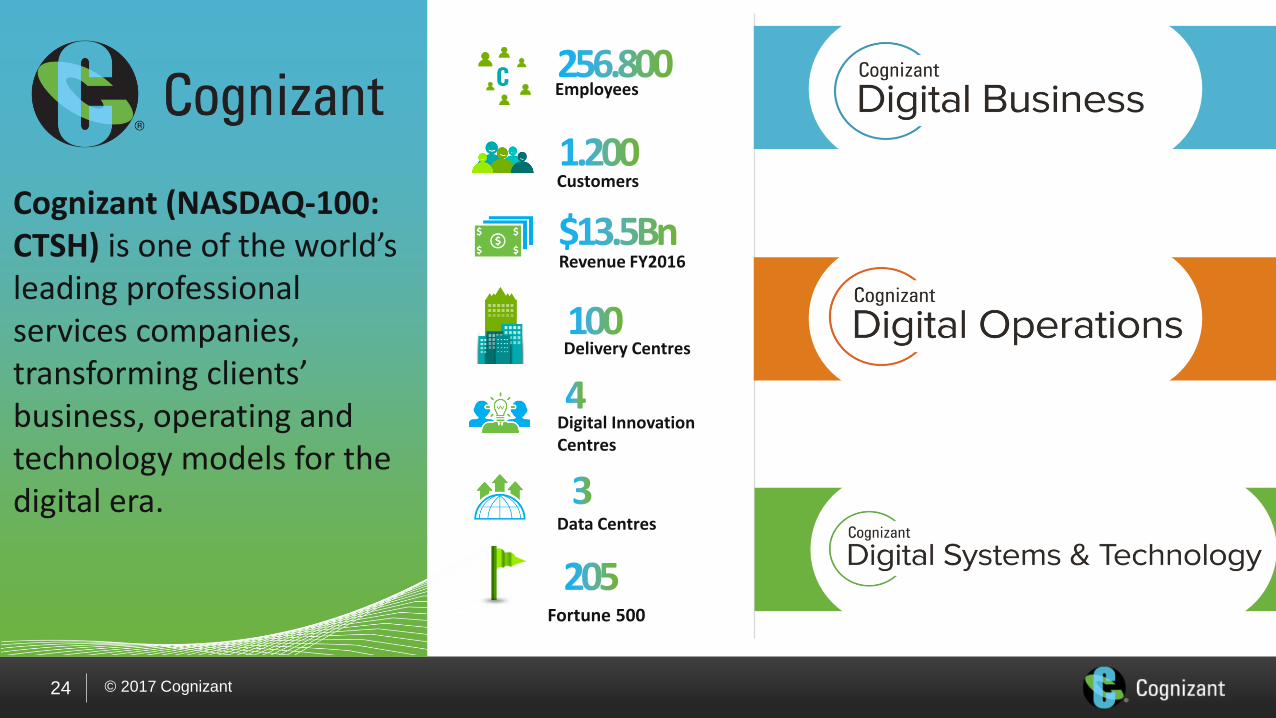
Cognizant (NASDAQ-100: CTSH) is one of the world’s leading professional services companies, transforming clients’ business, operating and technology models for the digital era.
Fortune 500
Employees
Delivery Centres
Revenue FY2016
Customers
Digital Innovation Centres
Data Centres

© 2017 Cognizant 25
• Fixed specification• Fixed price and date• Changes with a fee• Risk with Supplier
• Supplier owns delivery • And is paid per Output delivered (e.g.
Function Points )• Value to business, Risk with Supplier
• Payment is tied to % of business benefits (Reward sharing)
• Traditional tariff based • No complete specification• Ends as specified by Customer• Risk with customer
Outcome Based
Output Based
Fixed Price
Time & Materials
04
03
02
01
Business Value
© 2017 Cognizant 26
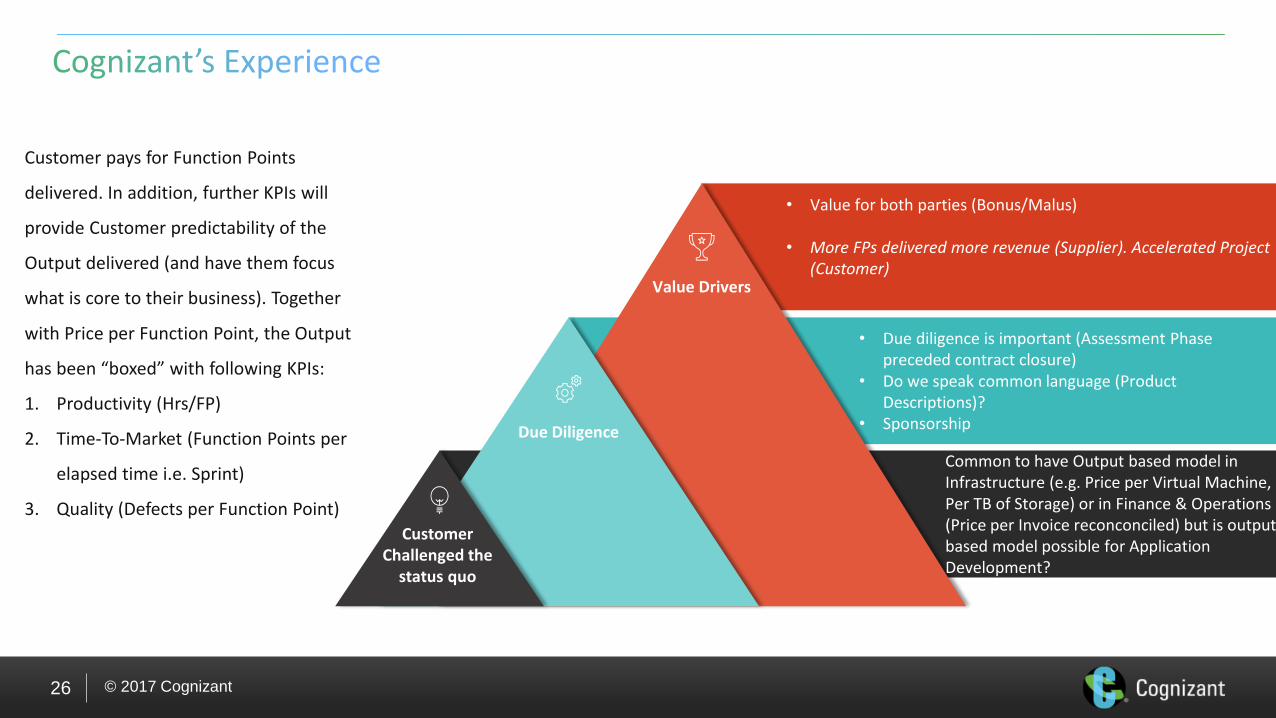
• Value for both parties (Bonus/Malus)
• More FPs delivered more revenue (Supplier). Accelerated Project (Customer)
Customer Challenged the
status quo
Due Diligence
Value Drivers
• Due diligence is important (Assessment Phase preceded contract closure)
• Do we speak common language (Product Descriptions)?
• Sponsorship
Common to have Output based model in Infrastructure (e.g. Price per Virtual Machine, Per TB of Storage) or in Finance & Operations (Price per Invoice reconconciled) but is output based model possible for Application Development?
Customer pays for Function Points
delivered. In addition, further KPIs will
provide Customer predictability of the
Output delivered (and have them focus
what is core to their business). Together
with Price per Function Point, the Output
has been “boxed” with following KPIs:
1. Productivity (Hrs/FP)
2. Time-To-Market (Function Points per
elapsed time i.e. Sprint)
3. Quality (Defects per Function Point)
© 2017 Cognizant
Keep Challenging

version 1.00 28/27
Questions