abundance and size structures of cawaki in 6 i qoliqoli...
TRANSCRIPT

1 Pacific Horticultural and Agricultural Market Access (PHAMA) Program Sea Urchin Report (Parts 1 and 2) - Fiji
Pacific Horticultural and Agricultural Market Access (PHAMA) Program
Department of Foreign Affairs and Trade
15 February 2018
TECHNICAL REPORT
Sea Urchin (cawaki) Report Part 1: Assessment of population abundance and size structures of cawaki in 6 i qoliqoli in Viti Levu, Fiji
Part 2: Sea Urchin Stock and Harvester Survey
#120

2 Pacific Horticultural and Agricultural Market Access (PHAMA) Program Sea Urchin Report (Parts 1 and 2) - Fiji
Sea Urchin Report (Parts 1 and 2) - Fiji TR#120 Client: Department of Foreign Affairs and Trade ABN: 47 065 634 525 Prepared by AECOM Services Pty Ltd Brisbane Level 8, 540 Wickham Street Fortitude Valley, QLD 4006 Australia T +61 7 3553 2000 F +61 7 3553 2050 www.aecom.com ABN 46 000 691 690 2018 Job No.: 42444251 AECOM in Australia and New Zealand is certified to ISO9001, ISO14001 AS/NZS4801 and OHSAS18001. © AECOM Services Pty Limited. All rights reserved. No use of the contents, concepts, designs, drawings, specifications, plans etc. included in this report is permitted unless and until they are the subject of a written contract between AECOM Services Pty Limited (AECOM) and the addressee of this report. AECOM accepts no liability of any kind for any unauthorised use of the contents of this report and AECOM reserves the right to seek compensation for any such unauthorised use. Document Delivery AECOM Services Pty Limited (AECOM) provides this document in either printed format, electronic format or both. AECOM considers the printed version to be binding. The electronic format is provided for the client’s convenience and AECOM requests that the client ensures the integrity of this electronic information is maintained. Storage of this electronic information should at a minimum comply with the requirements of the Electronic Transactions Act 2002.

3 Pacific Horticultural and Agricultural Market Access (PHAMA) Program Sea Urchin Report (Parts 1 and 2) - Fiji
Quality Information Date 15 February 2018
Prepared by Ministry of Fisheries, Fiji
Reviewed by Bronwyn Wiseman (Deputy Team Leader)
Revision History
Rev Revision Date Details Authorised
Name/ Position Signature
1.0
15 February 2018
Final Di Barr Team Leader
4 Pacific Horticultural and Agricultural Market Access (PHAMA) Program Sea Urchin Report (Parts 1 and 2) - Fiji
Table of Contents Quality Information ................................................................................................................................ 3
Table of Contents ................................................................................................................................... 4
Acronym List ........................................................................................................................................... 6
Acknowledgement ................................................................................................................................. 7
Part 1: Assessment of Population Abundance and Size Structure of Tripneustes gratilla (Cawaki) in Six (6) i qoliqoli, Viti Levu, Fiji ................................................................................................................ 8
Executive Summary ................................................................................................................................ 9
1.0 Introduction .................................................................................................................................... 10
2.0 Background ..................................................................................................................................... 11
2.1 Biology and Ecology .................................................................................................................... 11
2.2 Growth and Recruitment ............................................................................................................ 11
2.3 Market and Economic Value ....................................................................................................... 11
2.4 Sea Urchin (Cawaki) Fishery in Fiji .............................................................................................. 12
3.0 Methodology .................................................................................................................................. 13
3.1 Survey Sites ................................................................................................................................. 13
3.2 Belt Transect ............................................................................................................................... 16
3.3 Data Analysis ............................................................................................................................... 16
4.0 Results ............................................................................................................................................ 17
4.1 Density ........................................................................................................................................ 17
4.2 Sizes Frequency ........................................................................................................................... 17
4.3 Discussions .................................................................................................................................. 20
5.0 Conclusion ...................................................................................................................................... 21
6.0 Recommendations ......................................................................................................................... 21
7.0 Reference ........................................................................................................................................ 22
8.0 Appendix ......................................................................................................................................... 23
Population Abundance per Transect (500m2) ................................................................................... 23
Analysis of Variances (ANOVA) ......................................................................................................... 24
Part 2: Sea Urchin Stock & Harvester Survey Report ......................................................................... 26
Acknowledgement ............................................................................................................................... 27
Executive Summary .............................................................................................................................. 29
Main Findings ....................................................................................................................................... 30
1.0 Background ..................................................................................................................................... 31
1.1 The Sea Urchin Stock & Harvester Survey, 2017 ........................................................................ 31
2.0 Methodology .................................................................................................................................. 32
5 Pacific Horticultural and Agricultural Market Access (PHAMA) Program Sea Urchin Report (Parts 1 and 2) - Fiji
2.1 Survey Areas................................................................................................................................ 32
3.0 Limitations ...................................................................................................................................... 34
4.0 Results ............................................................................................................................................ 34
4.1 Gender Profiling .......................................................................................................................... 34
4.2 Age and length of participation .................................................................................................. 35
4.3 Marital status and decision-making ............................................................................................ 35
4.4 Education and Literacy level ....................................................................................................... 36
4.5 Economic Activity ........................................................................................................................ 36
4.6 Social Activity .............................................................................................................................. 36
4.7 Household Information ............................................................................................................... 37
4.8 Harvesting Effort and Catch ........................................................................................................ 37
Case Study 1 - Historical knowledge (Community leader-83 years old) ........................................... 37
4.9 Collection and Storage Methods................................................................................................. 38
4.10 Weekly Harvest and Income ..................................................................................................... 38
4.11 Sea urchin selection method .................................................................................................... 38
4.12 Income Satisfaction and Banking .............................................................................................. 40
4.13 Markets ..................................................................................................................................... 40
4.14 Fisheries Dependence ............................................................................................................... 40
4.15 Export of Sea Urchins ................................................................................................................ 41
4.16 Knowledge level ........................................................................................................................ 41
5.0 Conclusion ...................................................................................................................................... 41
6.0 Recommendations ......................................................................................................................... 42
References ............................................................................................................................................ 43
Annex 1: Survey Respondents ............................................................................................................. 44
Annex 2: Sea Urchin Stock & Harvester Questionnaire ...................................................................... 45
6 Pacific Horticultural and Agricultural Market Access (PHAMA) Program Sea Urchin Report (Parts 1 and 2) - Fiji
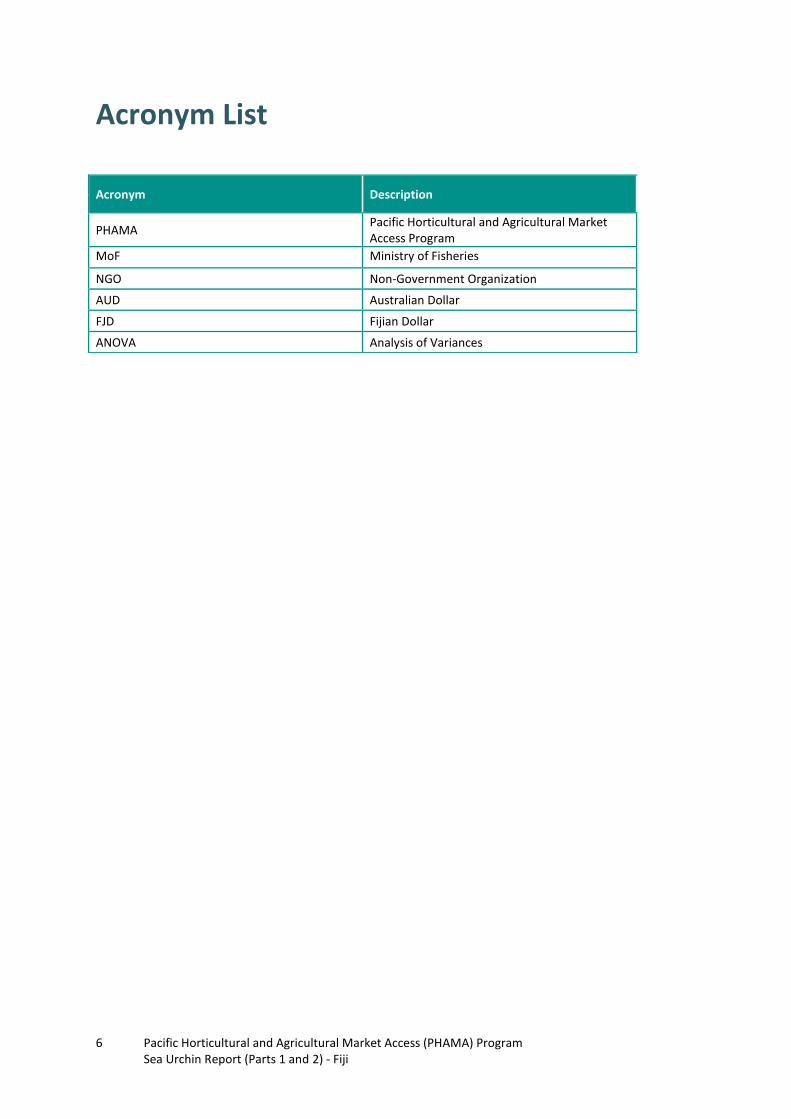
Acronym List
Acronym Description
PHAMA Pacific Horticultural and Agricultural Market Access Program
MoF Ministry of Fisheries
NGO Non-Government Organization
AUD Australian Dollar
FJD Fijian Dollar
ANOVA Analysis of Variances

7 Pacific Horticultural and Agricultural Market Access (PHAMA) Program Sea Urchin Report (Parts 1 and 2) - Fiji
Acknowledgement The Research section of the Ministry of Fisheries acknowledges the work that was put into carrying out the survey on Population Abundance and Size Structure of Sea Urchins (Cawaki) in six (6) i qoliqoli (traditionally-owned fishing grounds), Viti Levu. This report would not be completed without the help of the following people who assisted in the biological data gathering. Field Team:
1. Kalisiana Marama
2. Aporosa Nalasi
3. Inasa Vunisa
4. Apolosi Cokanasiga
5. Saras Goundar Special thanks to the people of Malomalo, Cuvu, Navutulevu, Mau, Waiqanake (Navakavu) and Kalokolevu for allowing the team to undertake the field survey in their i qoliqoli. A very special gratitude goes to the Pacific Horticultural and Agricultural Market Access Program (PHAMA) for assisting and providing funding for the survey. Big appreciation to the Senior Management of the Ministry for approving the field survey and collaboration work. Vinaka vakalevu.

8 Pacific Horticultural and Agricultural Market Access (PHAMA) Program Sea Urchin Report (Parts 1 and 2) - Fiji
Part 1:
Assessment of Population Abundance and Size Structure of Tripneustes gratilla (Cawaki) in Six (6) i qoliqoli, Viti Levu, Fiji.

9 Pacific Horticultural and Agricultural Market Access (PHAMA) Program Sea Urchin Report (Parts 1 and 2) - Fiji
Executive Summary Sea urchin, Tripneustes gratilla locally known as Cawaki is the only species from the family Toxopneustidae
belonging to class Echinoidea that is edible in Fiji with the gonad a popular delicacy in coastal villages.
Sea urchins are herbivorous with an important role of controlling the dynamic balance between benthic organisms, as algae are efficient competitors for space.
Collection of T.gratilla from the inshore area during low tide is mainly operated by women from harvesting to marketing of the product.
The biological data collection of T.gratilla was carried out in six (6) i qoliqoli (Malomalo, Cuvu, Navutulevu, Mau, Navakavu and Kalokolevu) along the western and central coastal areas of Viti Levu.
The aim of the study is to determine whether the status of Cawaki fishery is viable to cater the export market.
The objectives of the survey are to examine the population abundance and size structure of T.gratilla in six (6) i qoliqoli in Viti Levu.
Cawaki potential fisheries commodity for the export market, given that sea urchins are targeted fisheries, for their highly valued gonads in the Japanese market.
3,757 T.gratilla were counted within the surveyed sites.
The density per transect in each of the fishing ground ranges from 0.016 - 0.452 individual per 500m2.
The highest density per transect was recorded at Kalokolevu with 0.452 individual per 500 m2 followed by Malomalo (0.378 ind./500m
2) and Navutulevu ().33 ind./500m
2).
There was no sea urchin recorded in Cuvu fishing ground presumably due to the strong currents witnessed in Cuvu inshore area during the time of the survey whereby T.gratilla burrowed and hide under big gravels and boulders to avoid being washed away by the currents.
Based on T- Test on analysis of differences between the fishing grounds that are located on the same area with a confidence interval of 95% it shows that along the Coral Coast, there is no significance difference in the density of T.gratilla between Navutulevu and Malomalo fishing grounds. However, there is a clear significant difference between Kalokolevu, Mau and Navakavu fishing grounds.
The sizes ranges from 0 – 15±1.973cm and the mean sizes is about 7.1 ±1.973cm.
In the sizes distribution per fishing ground, Malomalo recorded the biggest size of T.gratilla which is 15 ± 1.846 cm and the mean sizes of 7.383± 1.846cm.
The lowest mean sizes, 6.23 ± 1.849 cm and 6.321± 2.225 cm were recorded at Navakavu and Mau fishing grounds respectively.
The size of maturity for T.gratilla is between 6 – 7.5 cm McManus et al (Undated) and more than 60 per cent of the individual recorded were more than the size at maturity.
The main factors that affecting the abundance and distribution in the areas surveyed are food availability and substratum type. It is evident in the survey that T.gratilla occurs in high number on macro algae covered substratum. Kalokolevu has recorded the highest mean density mainly due to food availability such as the high coverage Sargassum sp and Padina sp on the coral reef area. The dominant Sargassum sp and Padina sp is also the result of live rock and live coral removal as the area was engage in aquarium trade for the last twelve (12) years. Removal of live rock from its natural habitat for aquarium trade causes an overgrown of Sargassum sp and Padina sp in Kalokolevu hence provide a favorable habitat for T.gratilla to thrive. The fishing grounds along the Coral Coast from Komave village to Malomalo were also engaged in the aquarium trade in the 1990s to early200s.
Other factors that affect the distribution of T.gratilla population distribution are recruitment availability and physical exposure. High number of T.gratilla were present in areas adjacent to the tabu area as protected areas increases the chances of adult sea urchins to spawn and replenishing other areas.
The current sea urchin population stock and the status of the fishing grounds given that the fishing grounds are overfished with herbivorous fish and recovering from live rock trade with dominant Sargassum sp coverage on the substratum is viable for sea urchin commercial activity.
The population stock is sustainable and able to cater the local market demand However, for the fishery to enter the export market effective management strategies must be introduced immediately.
The dominant of Sargassum sp in most of the surveyed fishing grounds provide a good opportunity for sea ranching program.

10 Pacific Horticultural and Agricultural Market Access (PHAMA) Program Sea Urchin Report (Parts 1 and 2) - Fiji
1.0 Introduction Fiji’s marine resources are an important source of both protein and income for the coastal and maritime communities. Over the years communities have evolve from subsistence and artisanal defined areas of fishing activities to more commercial activities and operating fishing business. The shift has caused by the increase in population, urbanization and globalisation. Hence new fisheries are identified and exploited. Sea urchin (Tripneustes gratilla) locally known as cawaki is the only species that is edible in Fiji with the gonad a popular delicacy in coastal villages. T.gratilla (cawaki) is distributed across Fiji’s shallow coral reef ecosystem. Collection of T.gratilla from the inshore area during low tide is mainly operated by women from harvesting to marketing of the product. Generally, sea urchins are grazers and mainly feed on algae and also ingest sediment by scraping the substratum surface on which they live with their teeth (Prabhu et al., 2015). They have an important role in controlling the dynamic balance between benthic organisms, as algae are efficient competitors for space. Sea urchins are dominant herbivorous in unprotected coral reefs while the herbivorous fishes particularly Parrotfish and Surgeonfish are dominant in protected coral reefs (Prabhu et al 2015). There is limited information available particularly focus on the wild population stock and catch data of T.gratilla in Fiji. However, there is information available on the effectiveness of marine protected areas (MPA) in Fiji and listing T.gratilla as one of the key indicator species. Cakacaka (2007) confirmed the high abundance of T.gratilla in both the Tabu and non – Tabu area of Navakavu fishing grounds and it also dominate the invertebrate catch with total landings accounted to 58.6%. Simpson (2010) on assessing the MPA effectiveness on Korolevu-i-wai i qoliqoli, Coral Coast from 2004 – 2007 stated the conspicuous decreasing trend of a 95% confidence interval in the observed abundance of T.gratilla across Korolevu-i-wai fishing ground due to continuous harvesting and poaching because of the high nutritional and economic value of sea urchins in the local markets or maybe due to the shift in habitat types from a lower surface area with a few available niches comprising much of macro algae pastures to that of a greater surface area with the significant increase in coral cover. This study aims to examine the status and the population abundance and size structure of T.gratilla in six (6) traditional demarcated fishing grounds (i qoliqoli) in Viti Levu. Cawaki was identified by the Pacific Horticultural and Agricultural Market Access Program (PHAMA) in collaboration with the Ministry of Fisheries and relevant stakeholders as a potential fisheries commodity for the export market, given that sea urchins are targeted fisheries, for their highly valued gonads in the Japanese market. Hence, the intention of the study is to determine whether the current population is viable for the export market and recommendation in place to boost cawaki fishery.

11 Pacific Horticultural and Agricultural Market Access (PHAMA) Program Sea Urchin Report (Parts 1 and 2) - Fiji
2.0 Background
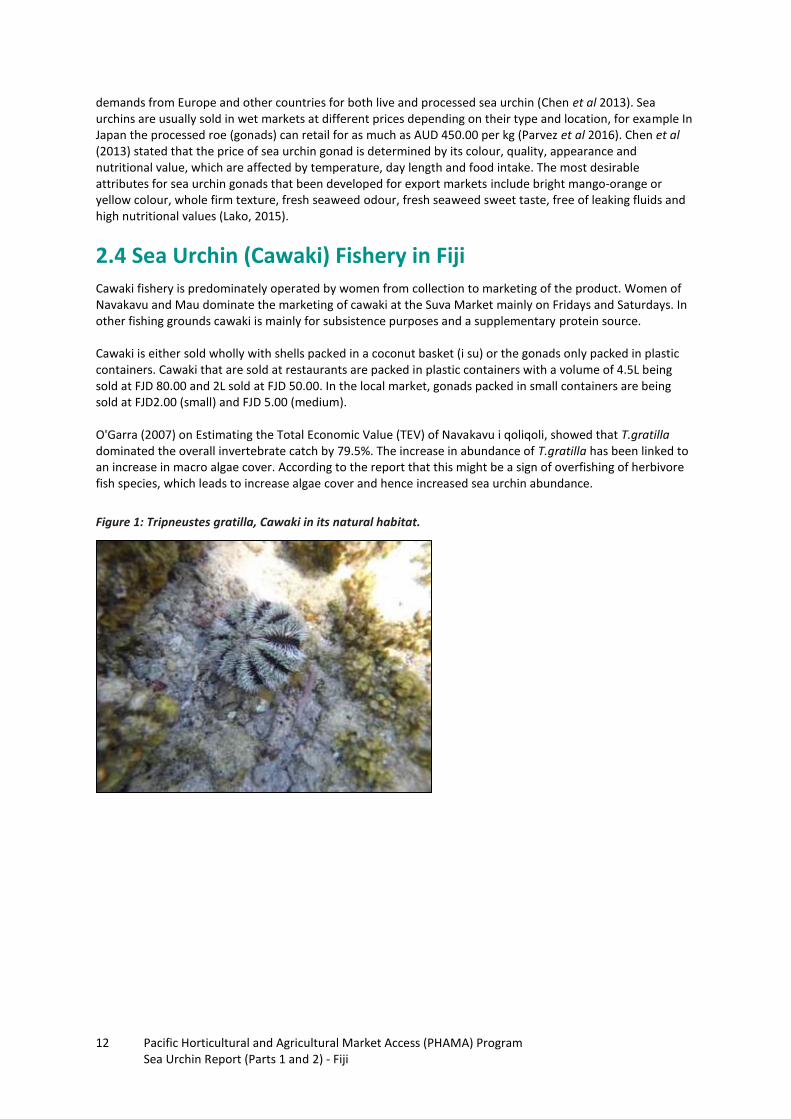
2.1 Biology and Ecology T.gratilla commonly known as the collector sea urchin, are known to occur in a wide range of tropical habitats including coral reefs, sea grass, meadows, macro-algae meadows and in bare sediment (Lyimo et al 2011). In these habitats, they feed on a wide variety of algal species and sea grasses that are found in their surrounding environment (Lyimo et al 2007). T.gratilla body surface is often purple black where the spines are short with sharp tips (Figure 1) and variable in color from white to copper brown or orange (Capinpin Jr, 2015).They can reach a test diameter of 10-15cm and are prey to puffer fish, octopus and humans. T.gratilla has an annual reproductive cycle that is mediated by seawater temperature, day length and feeding activity (Rahman et al 2014). There are variable spawning periods based on geographical distribution, as according to Vaitilingon et al (2005), in some tropical echinoid species, breeding season is spread throughout the year when the population is located near the equator, but farther away, spawning occurs over a restricted period. According to (McManus et al (Undated) studies conducted in the Philippines, T.gratilla peak spawning periods occur from December-January although release of gametes occurs year-round. Sea urchins have separate male and female sexes which are externally identical. Each sea urchin clutch consists of approximately 2 million eggs and during spawning the egg meets the sperm in the water column where the fertilized egg then develops into pluteus larvae (MarineBio, 2014). After a month it then settles on the sea floor, undergoes metamorphosis and becomes juveniles. It then takes about 2-5 years to become a reproducing adult where the sea urchins test diameters are around 6- 7.5cm (McManus et al Undated).
2.2 Growth and Recruitment Sea urchins are considered to be one of the fastest growing invertebrates and according to Rahman et al (2014), individuals can reach a test diameter of about 7.5cm in the first year. Seasonality and type of food available could be significant factors causing differences in growth rates and maximum size attained by sea urchins. T.gratilla showed variations in growth rate in relation to the type of food they ingest (Regaldo et al 2010). The highest growth rate of T.gratilla was observed using Sargassum species and that growth rate of sea urchins in the aquaria was much slower when compared to the growth rates out in the field (sea), due to greater water movement and flushing of wastes at sea (Capinpin Jr et al 2015). There are other factors such as physical exposure, recruitment variability and substratum type to determine population abundance (Regaldo et al 2010). With regards to recruitment it was noted by McManus et al (Undated) that T.gratilla recruitment are the highest during the month of May and June, where about half of the yearly recruitment occurs. The study conducted by Regaldo et al (2010) in the Philippines, states that T.gratilla reproductive activity has an extended breeding season, a resting period and another period with less intense spawning activity. It shows that younger and higher individuals occur in June and February indicating high number recruitment for this month.
2.3 Market and Economic Value There are many species of edible sea urchins, however some common ones that are readily available and consumed in some parts of the world include red sea urchins; Strongylocentrotus franciscanus, green sea urchins; Strongylocentrotus droebachien, purple sea urchins; Strongylocentrotus purpuratus, Evechinus chloroticus (endemic in New Zealand), Psammechinus miliaris, Paracentrotus lividus (purple sea urchin) and Echinus esculentus (West- coast of Scotland) (Lako, 2015). It is known as an alternative food for most people living in coastal areas in many countries where the gonads are considered to be an important economic commodity and the demand is rapidly expanding in many countries (Kasim et al 2009). The gonad (fresh or processed) is considered as one of the most expensive and luxury seafood in the world (Parvez et al 2016). Japan is the largest market of sea urchin and there are also
12 Pacific Horticultural and Agricultural Market Access (PHAMA) Program Sea Urchin Report (Parts 1 and 2) - Fiji
demands from Europe and other countries for both live and processed sea urchin (Chen et al 2013). Sea urchins are usually sold in wet markets at different prices depending on their type and location, for example In Japan the processed roe (gonads) can retail for as much as AUD 450.00 per kg (Parvez et al 2016). Chen et al (2013) stated that the price of sea urchin gonad is determined by its colour, quality, appearance and nutritional value, which are affected by temperature, day length and food intake. The most desirable attributes for sea urchin gonads that been developed for export markets include bright mango-orange or yellow colour, whole firm texture, fresh seaweed odour, fresh seaweed sweet taste, free of leaking fluids and high nutritional values (Lako, 2015).
2.4 Sea Urchin (Cawaki) Fishery in Fiji Cawaki fishery is predominately operated by women from collection to marketing of the product. Women of Navakavu and Mau dominate the marketing of cawaki at the Suva Market mainly on Fridays and Saturdays. In other fishing grounds cawaki is mainly for subsistence purposes and a supplementary protein source. Cawaki is either sold wholly with shells packed in a coconut basket (i su) or the gonads only packed in plastic containers. Cawaki that are sold at restaurants are packed in plastic containers with a volume of 4.5L being sold at FJD 80.00 and 2L sold at FJD 50.00. In the local market, gonads packed in small containers are being sold at FJD2.00 (small) and FJD 5.00 (medium). O'Garra (2007) on Estimating the Total Economic Value (TEV) of Navakavu i qoliqoli, showed that T.gratilla dominated the overall invertebrate catch by 79.5%. The increase in abundance of T.gratilla has been linked to an increase in macro algae cover. According to the report that this might be a sign of overfishing of herbivore fish species, which leads to increase algae cover and hence increased sea urchin abundance.
Figure 1: Tripneustes gratilla, Cawaki in its natural habitat.

13 Pacific Horticultural and Agricultural Market Access (PHAMA) Program Sea Urchin Report (Parts 1 and 2) - Fiji
3.0 Methodology
3.1 Survey Sites There were a total of 6 iQoliqoli (Malomalo, Cuvu, Navutulevu, Kalokolevu, Mau and Navakavu) assessed for its sea urchin stock status. The iQoliqoli Malomalo survey site covered an area of 3.1Ha, Cuvu (2.2Ha), Navutulevu (2.8Ha), Navakavu (3.2Ha), Mau (1.5Ha) and Kalokolevu (1.1Ha). The surveyed sites were all within the near shore reef areas, within the back reef habitat where T.gratilla typically inhabit. The sites at Malomalo and Cuvu are easily accessed by wading during low tide while Navutulevu, Mau, Kalokolevu and Navakavu are only accessible by boat.
Figure 2.Navakavu i qoliqoli
There were 3 sites in Navakavu, within site 1 (NAV_S01) there was a total of 8 transects conducted, site 2 (NAV_S02) had a total of 12 transects and site 3 (NAV_S03) had a total of 12 transects.
Figure 3.Kalokolevu i qoliqoli - In Kalokolevu (KAL_S01), there was a total of 11 transects.
14 Pacific Horticultural and Agricultural Market Access (PHAMA) Program Sea Urchin Report (Parts 1 and 2) - Fiji
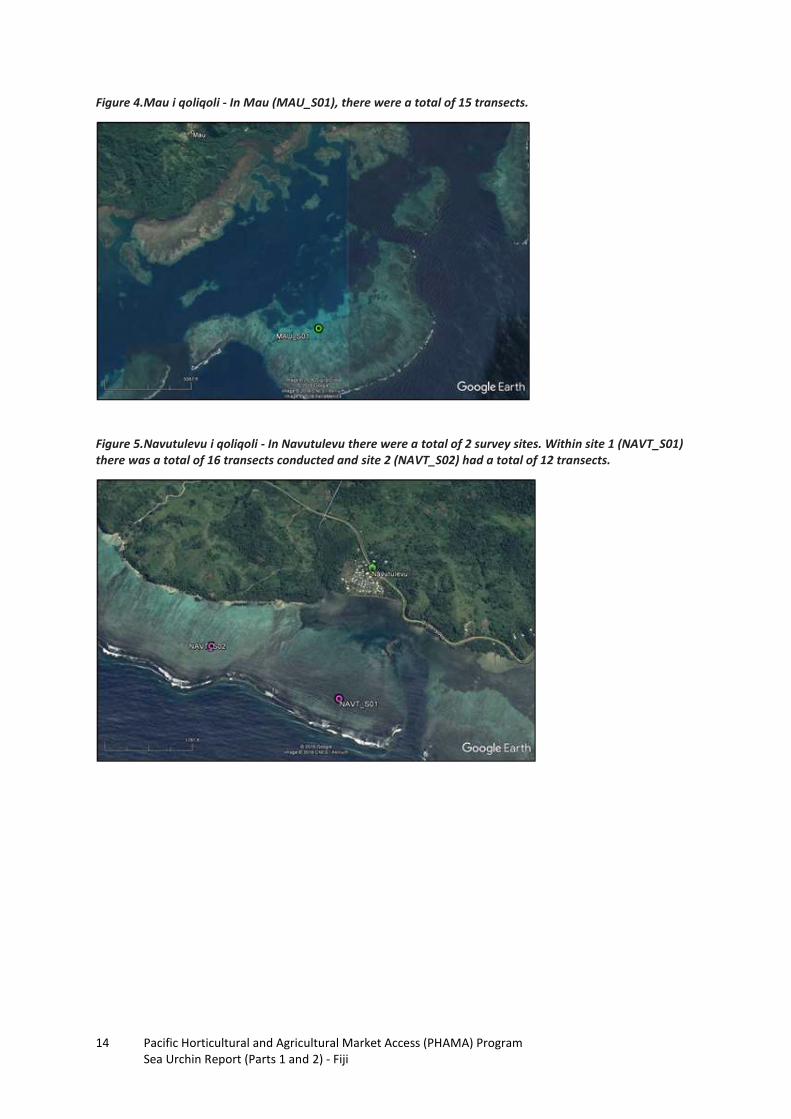
Figure 4.Mau i qoliqoli - In Mau (MAU_S01), there were a total of 15 transects.
Figure 5.Navutulevu i qoliqoli - In Navutulevu there were a total of 2 survey sites. Within site 1 (NAVT_S01) there was a total of 16 transects conducted and site 2 (NAVT_S02) had a total of 12 transects.
15 Pacific Horticultural and Agricultural Market Access (PHAMA) Program Sea Urchin Report (Parts 1 and 2) - Fiji
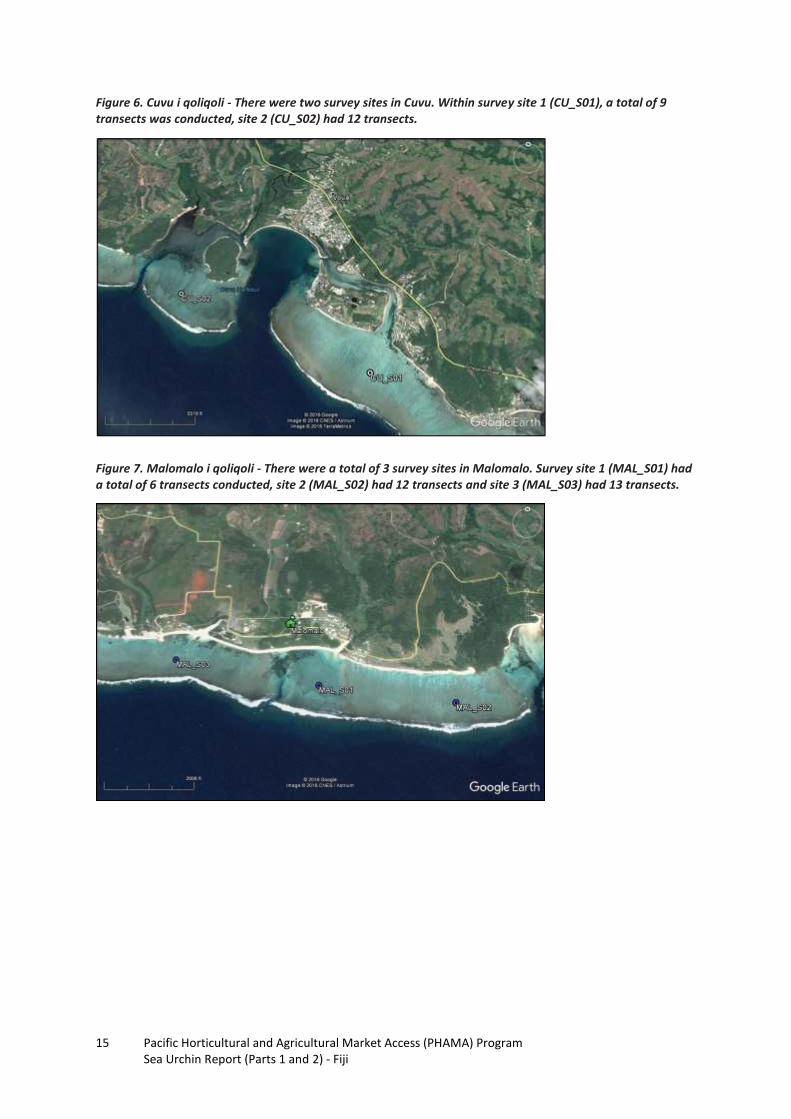
Figure 6. Cuvu i qoliqoli - There were two survey sites in Cuvu. Within survey site 1 (CU_S01), a total of 9 transects was conducted, site 2 (CU_S02) had 12 transects.
Figure 7. Malomalo i qoliqoli - There were a total of 3 survey sites in Malomalo. Survey site 1 (MAL_S01) had a total of 6 transects conducted, site 2 (MAL_S02) had 12 transects and site 3 (MAL_S03) had 13 transects.
16 Pacific Horticultural and Agricultural Market Access (PHAMA) Program Sea Urchin Report (Parts 1 and 2) - Fiji
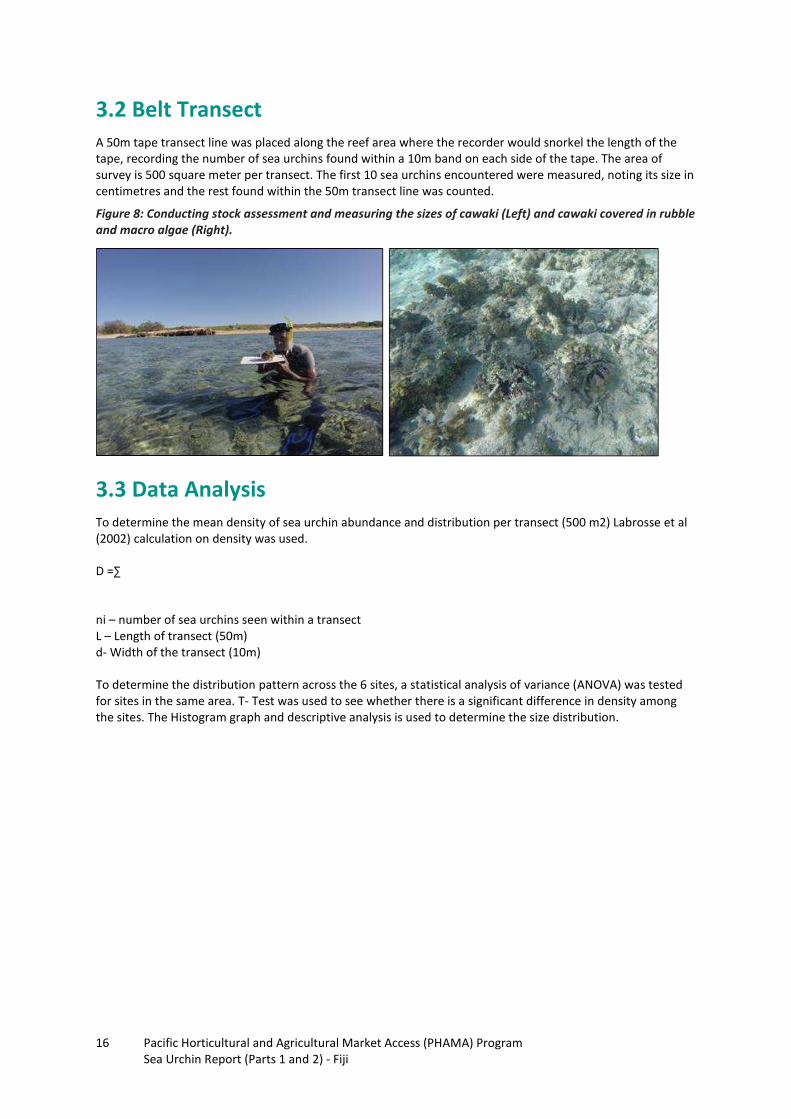
3.2 Belt Transect A 50m tape transect line was placed along the reef area where the recorder would snorkel the length of the tape, recording the number of sea urchins found within a 10m band on each side of the tape. The area of survey is 500 square meter per transect. The first 10 sea urchins encountered were measured, noting its size in centimetres and the rest found within the 50m transect line was counted.
Figure 8: Conducting stock assessment and measuring the sizes of cawaki (Left) and cawaki covered in rubble and macro algae (Right).
3.3 Data Analysis To determine the mean density of sea urchin abundance and distribution per transect (500 m2) Labrosse et al (2002) calculation on density was used. D =∑ ni – number of sea urchins seen within a transect L – Length of transect (50m) d- Width of the transect (10m) To determine the distribution pattern across the 6 sites, a statistical analysis of variance (ANOVA) was tested for sites in the same area. T- Test was used to see whether there is a significant difference in density among the sites. The Histogram graph and descriptive analysis is used to determine the size distribution.
17 Pacific Horticultural and Agricultural Market Access (PHAMA) Program Sea Urchin Report (Parts 1 and 2) - Fiji
4.0 Results
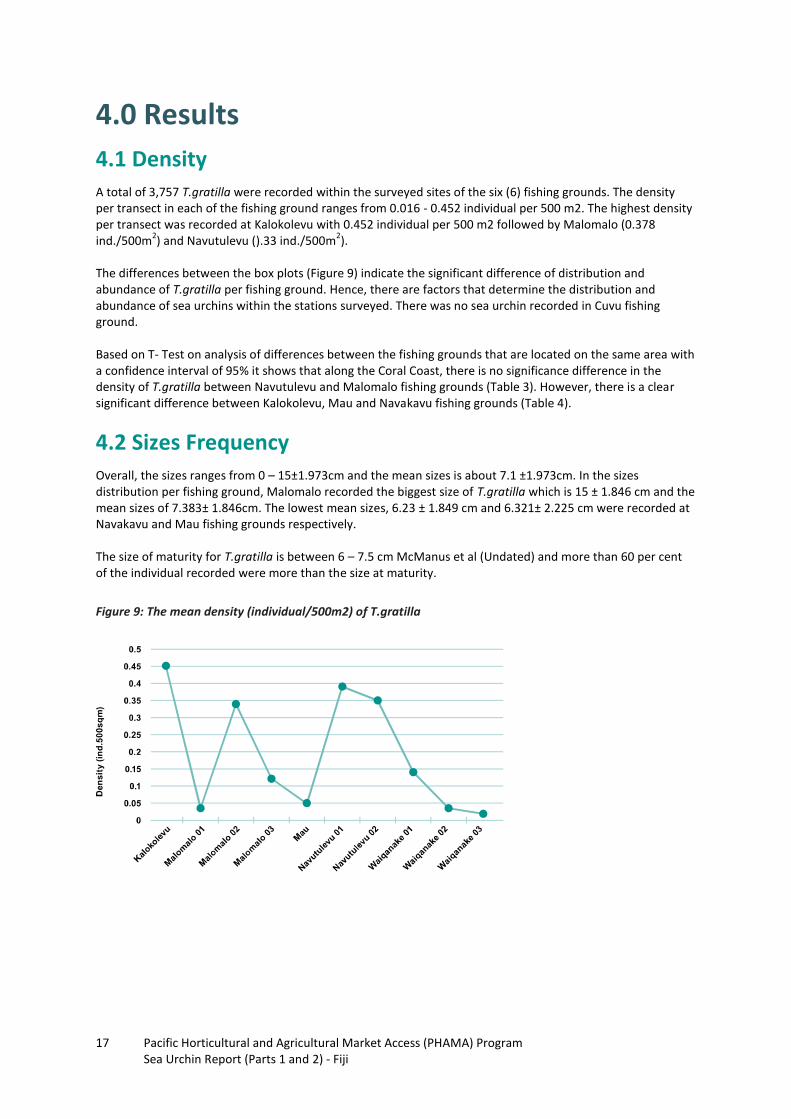
4.1 Density A total of 3,757 T.gratilla were recorded within the surveyed sites of the six (6) fishing grounds. The density per transect in each of the fishing ground ranges from 0.016 - 0.452 individual per 500 m2. The highest density per transect was recorded at Kalokolevu with 0.452 individual per 500 m2 followed by Malomalo (0.378 ind./500m
2) and Navutulevu ().33 ind./500m
2).
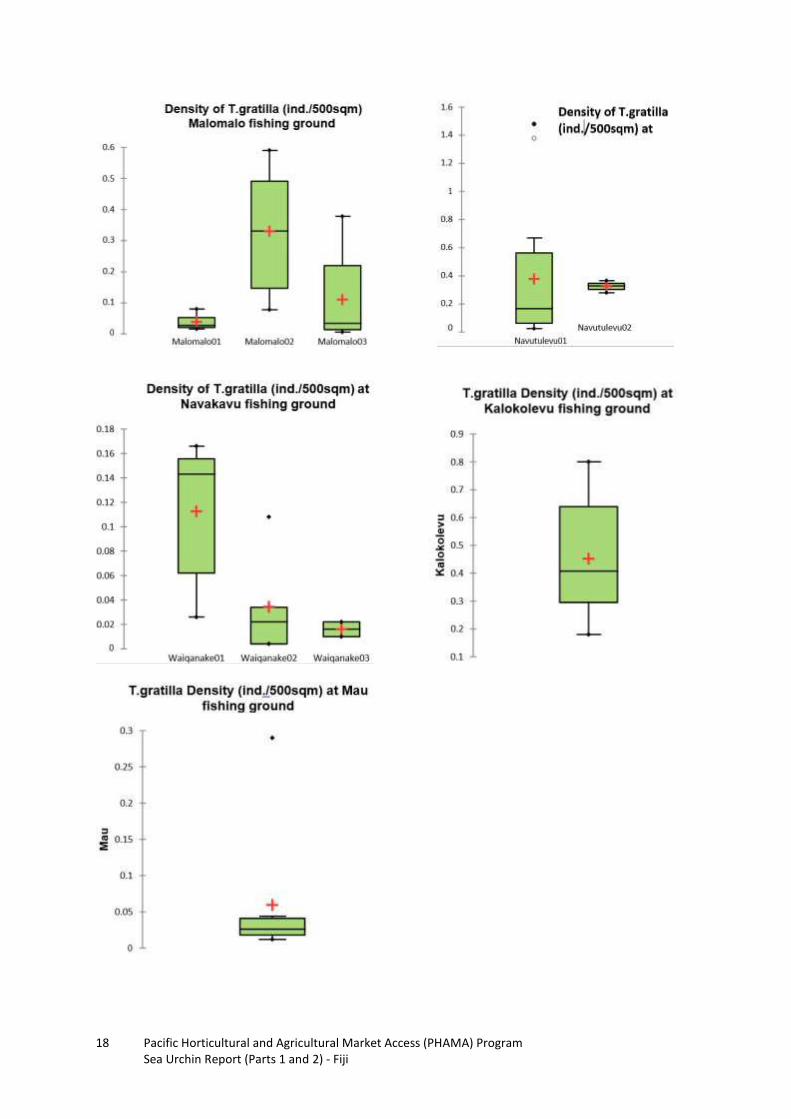
The differences between the box plots (Figure 9) indicate the significant difference of distribution and abundance of T.gratilla per fishing ground. Hence, there are factors that determine the distribution and abundance of sea urchins within the stations surveyed. There was no sea urchin recorded in Cuvu fishing ground. Based on T- Test on analysis of differences between the fishing grounds that are located on the same area with a confidence interval of 95% it shows that along the Coral Coast, there is no significance difference in the density of T.gratilla between Navutulevu and Malomalo fishing grounds (Table 3). However, there is a clear significant difference between Kalokolevu, Mau and Navakavu fishing grounds (Table 4).
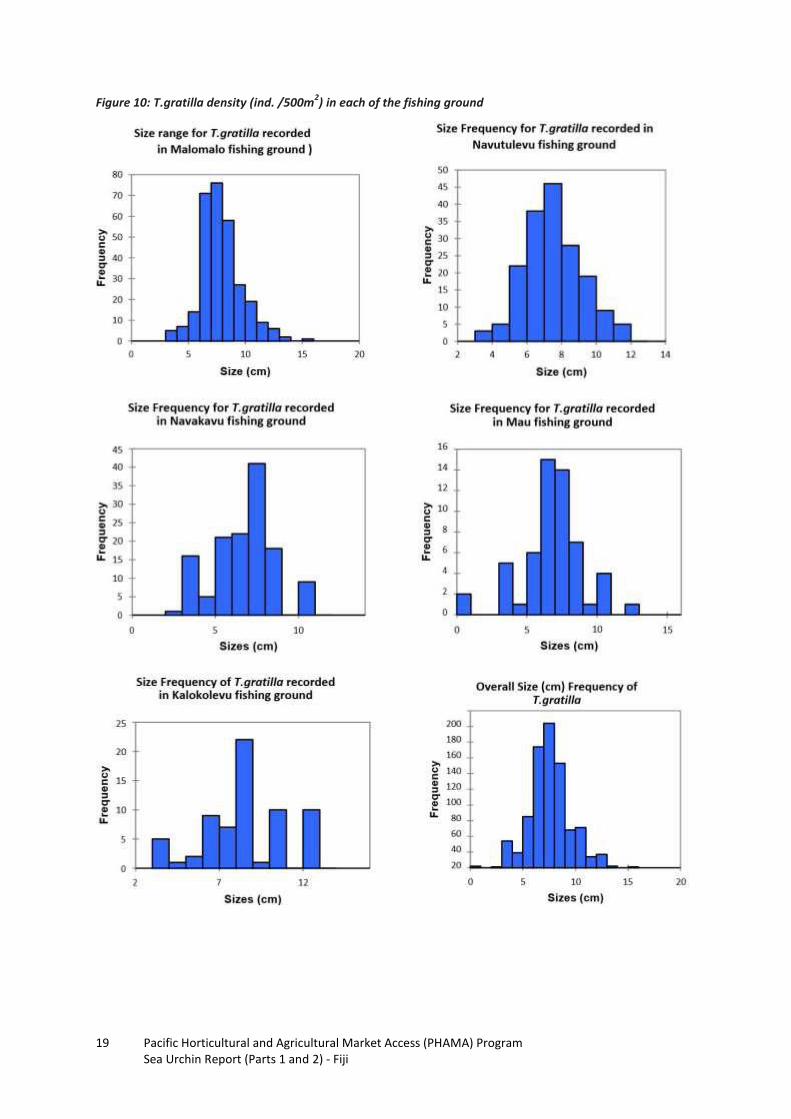
4.2 Sizes Frequency Overall, the sizes ranges from 0 – 15±1.973cm and the mean sizes is about 7.1 ±1.973cm. In the sizes distribution per fishing ground, Malomalo recorded the biggest size of T.gratilla which is 15 ± 1.846 cm and the mean sizes of 7.383± 1.846cm. The lowest mean sizes, 6.23 ± 1.849 cm and 6.321± 2.225 cm were recorded at Navakavu and Mau fishing grounds respectively. The size of maturity for T.gratilla is between 6 – 7.5 cm McManus et al (Undated) and more than 60 per cent of the individual recorded were more than the size at maturity.
Figure 9: The mean density (individual/500m2) of T.gratilla
18 Pacific Horticultural and Agricultural Market Access (PHAMA) Program Sea Urchin Report (Parts 1 and 2) - Fiji
19 Pacific Horticultural and Agricultural Market Access (PHAMA) Program Sea Urchin Report (Parts 1 and 2) - Fiji
Figure 10: T.gratilla density (ind. /500m2) in each of the fishing ground

20 Pacific Horticultural and Agricultural Market Access (PHAMA) Program Sea Urchin Report (Parts 1 and 2) - Fiji
4.3 Discussions The results obtained allowed us to identify the most suitable areas for the establishment of a community based managed commercial fishery for T.gratilla. Despite the insufficient information available on stock assessment of sea urchins in Fiji, this report has given us enough information on understanding the population structure of T.gratilla in Fiji. This study has demonstrated factors that drive the abundance and distribution of T.gratilla across six (6) i qoliqoli. Seasonality and type of available food might be significant factors causing differences in growth rates and maximum size attained by sea urchins (Regaldo et al 2010). The main factors that affecting the abundance and distribution in the areas surveyed are food availability and substratum type. It is evident in the survey that T.gratilla occurs in high number on macro algae covered substratum. Pan (2012) states that sea urchins have the ability to graze on macro algae at a substantial quantity. Padina sp and Sargassum sp are considered to be suitable feed for sea urchins (Capinpin 2015) and these seagrasses occur in these fishing grounds. The T- Test clearly showed the different factors affecting T.gratilla abundance and distribution between fishing grounds. Mau, Navakavu and Kalokolevu showed a clear significant difference in density between the fishing grounds because of different effort exerted by collectors due to different demand and source of income available in the area. Sea urchins harvested from these fishing grounds are mainly sold at the market. Factors that presumably have a major influence on these fishing grounds are more harvesting of sea urchins to cater the Suva market and other outlets. There is no significance difference of density of sea urchins in Malomalo and Navutulevu because they only harvest for subsistence purposes. Comparing the mean density in each of the three (3) fishing grounds, Kalokolevu came out with the highest mainly due to food availability such as the high coverage of Sargassum sp and Padina sp on the coral reef area. The dominant of Sargassum sp and Padina sp is also the result of live rock and live coral removal as the area was engaged in aquarium trade for the past twelve (12) years. Removal of live rock from its natural habitat for aquarium trade causes an overgrowth of Sargassum sp and Padina sp in Kalokolevu hence provide a favourable habitat for T.gratilla to thrive. The fishing grounds along the Coral Coast from Komave village to Malomalo were also engaged in the aquarium trade in the 1990s to early200s. Also these areas are subjected to overfishing of herbivorous fishes such as Parrotfishes and Surgeonfishes that usually grazes on coral reef area controlling the dynamic balance between benthic organisms but when they are overharvested, dramatic changes occur. Other factors that affect the distribution of T.gratilla population distribution are recruitment availability and physical exposure (Regaldo et al 2010). It is evident from the survey that high number of T.gratilla were present in areas adjacent to the tabu area as protected areas increases the chances of adult sea urchins to spawn and replenishing other areas. Studies by Smith & Wilen, (2004) regarding the California sea urchin fishery noted that closed area promise protection of spawning biomass urchins to reach sexual maturity whereby larvae are redistributed at a considerable distance from the spawning areas by currents, winds and sea surface changes and hence protected urchins have the capability to replenish remaining open areas. Over 60 per cent of the sizes recorded were well above the maturity sizes. In Navakavu about 50 per cent of the sizes recorded were less than 7 cm an indication of recruitment period. In the Philippines T.gratilla has an extended breeding season with younger individuals are seen to occur in June and February whereby spawning occurred in December - January (Regalso et al 2010). As compared to the survey time (February – March) at Navakavu, high number of young individuals were seen within Navakavu01 site. As compared to Lako (2015) the highest yield were obtained from the acceptable sizes of 8 – 10mm x 40 – 50mm with high quality gonad is between January – February and confirms the spawning season of sea urchins could be around this time.

21 Pacific Horticultural and Agricultural Market Access (PHAMA) Program Sea Urchin Report (Parts 1 and 2) - Fiji
5.0 Conclusion It is evident from this report that the status of the fishing grounds with the current sea urchin population stock given that the fishing grounds are overfished with herbivorous fish and recovering from live rock trade with dominant Sargassum sp coverage on the substratum is viable for sea urchin commercial activity. The current population stock is sustainable and able to cater the local market demand. For the fishery to enter the export market an effective management strategies must be introduced immediately. The artisanal sea urchin fishery is operating without a management plan, because it is a subsistence fishery in most of the fishing grounds. However, in areas that are near Suva, sea urchins have become a source of income for women. There are no restrictions on the catch and the season. The only requirement for fishers to be able to collect sea urchins to sell in the market is the fishing license. The benefit of marine protected areas is evident in this survey whereby stations that are closely associated with a protected area recorded a high population density. The importance of having a protected area or reserve is that it helps protect spawning sea urchins. This allows larvae to be redistributed and have the capability to replenish and sustain remaining open areas.
6.0 Recommendations The followings are recommendations if were to consider expanding the sea urchin fishery for the export market: 1. Formulation of a Sea urchin (Cawaki) Fishery Management Plan to include relevant management
measures such size limits, quota, season etc. for the management and sustainability of the sea urchin in Fiji.
2. Research on the recruitment and growth studies and the spawning time to establish the harvesting time to ensure high yield of gonads as this was highlighted in Lako (2015).
3. Collection of catch data or catch per unit effort data (CPUE) for assessment and management of the stock
4. Comprehensive stock assessment and mapping as this also appears to be an integral part of successful fisheries management as indicated by some sea urchin fishery management plan from other parts of the world.
5. The dominant of Sargassum sp in most of the surveyed fishing grounds provide an opportunity for sea ranching program.
22 Pacific Horticultural and Agricultural Market Access (PHAMA) Program Sea Urchin Report (Parts 1 and 2) - Fiji
7.0 Reference Capinpin Jr, E. C. (2015). Growth and Survival of Sea Urchin (Tripneustes gratilla) Fed Different Brown Algae in Aquaria. International Journal of Fauna and Biological Studies, 56-60. Chen, Y.-C., Chen, T.-Y., Chiou, T.-K., & Hwang, D.-F. (2013). Seasonal Variation on General Composition, Free Amino Acids and Fatty Acids in the Gonad of Taiwans Sea Urchin Tripneustes gratilla. Journal of Marine Science and Technology, 723-732. Kasim, M. (2009). Grazing Activity of the Sea Urchin Tripneustes gratilla in Tropical Seagrass Beds of Buton Island, Southeast Sulawesi, Indonesia. Journal of Coastal Development, 19-27. Lako, J. (2015). Product Development of Chiled Sea Urchin for Human Consumption. Labrosse, P., Kulbicki, M., Ferraris, J. (2002). Underwater Visual Census Surveys – Proper use and Implementation. Noumea: Secretariat of the South Pacific. Lyimo, J. T., Mamboya, F., Hamisi, M., & Lugomela, C. (2011). Food Preference of the Sea Urchin Tripneustes gratilla (Linnaeus, 1975) in Tropical Seagrass Habitats at Dar es Salaam, Tanzania. Journal of Ecology and the Natural Environment, 415-423. Lyon, S. (2014). Tripneustes gratilla Fact Sheet. Retrieved February 23, 2017, from The University of Queensland-Great Barrier Reef Invertebrates. MarineBio. (2014, March 14). Collector Urchins, Tripneustes gratilla. Retrieved March 22, 2017, from MarineBio Conservation Society: http://marinebio.org/species.asp?id=2128 McManus, L. T., Gomez, E. D., McManus, J. W., & Juinio, A. (Undated). Sea Urchin Management in Bolinao, Pangasinan, Philippines: Attempts on Sustainable Use of A Communal Resource. Quezon: Marine Science Institute, University of the Philippines. O'Garra, T. (2007). Estimating the Total Economic Value (TEV) of the Navakavu LMMA (Locally Managed Marine Area) in Viti Levu Island (Fiji). Noumea: CRISP. Pan, R. T. (2012). The Growth and Survival of the Sea Urchin Tripneustes gratilla, A Possible Biocontrol Agent for Invasive Macroalgae. University of Hawai'i. Parvez, M. S., Rahman, M. A., & Yusoff, F. M. (2016). Status, Prospects and Potentials of Echinoid Sea Urchins in Malaysia. International Journal of Chemical, Environmental and Biological Sciences, 4(1). Rahman, M. A., Arshad, A., & Yusoff, F. M. (2014). Sea Urchins (Echinodermata:Echinoidea): Their Biology, Culture and Bioactive Compounds. International Conference on Agricultural, Ecological and Medical Sciences. London: International Conference on Agricultural, Ecological and Medical Sciences. Regaldo, J. M., Campos, W. L., & Santillan, A. S. (2010). Population Biology of Tripneustes gratilla (Linnaeus)(Echinodermata) in Seagrass Beds of Southern Guimaras, Philippines. Miagao: Science Diliman. Smith, M. D., & Wilen, J. E. (2004). Marine Reserves with Endogenous Ports: Empirical Bioeconomics of the California Sea Urchin Fishery. Marine Resource Economics, 18, 85- 112. Stimson, J., Cunha, T., & Philippoff, J. (2007). Food Preferences and Related Behavior of the Browsing Sea Urchin Tripneustes gratilla (Linnaeus) and its Potential for Use as a Biological Control Agent. Marine Biology, 1761-1772. Toha, A. H., Binur, R., Lutfi, Suhaemi, Hakim, L., Widodo, N., et al. (2014). Genetic Aspects of the Commercially Used Sea Urchin Tripneustes gratilla. Journal of Biological Researches, 12-17. Ungson, J. (2006). An Economic Assessment of Sea Urchin (Tripneustes gratilla) Culture. IIFET 2006 Portsmouth Proceeding. Vaitilingon, D., Rasolofonirina, R., & Jangoux, M. (2005). Reproductive Cycle of Edible Echinoderms from the Southwestern Indian Ocean. Western Indian Ocean J. Mar.Sci., 47-60.
23 Pacific Horticultural and Agricultural Market Access (PHAMA) Program Sea Urchin Report (Parts 1 and 2) - Fiji
8.0 Appendix
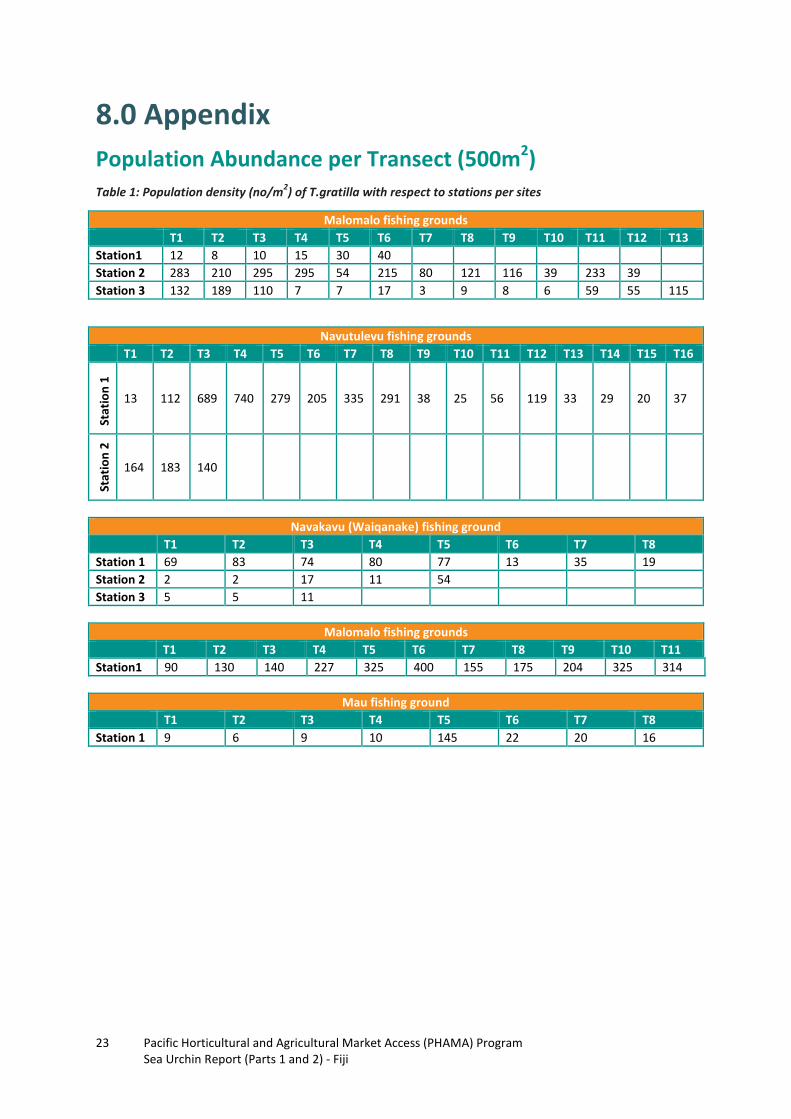
Population Abundance per Transect (500m2) Table 1: Population density (no/m
2) of T.gratilla with respect to stations per sites
Malomalo fishing grounds
T1 T2 T3 T4 T5 T6 T7 T8 T9 T10 T11 T12 T13
Station1 12 8 10 15 30 40
Station 2 283 210 295 295 54 215 80 121 116 39 233 39
Station 3 132 189 110 7 7 17 3 9 8 6 59 55 115
Navutulevu fishing grounds
T1 T2 T3 T4 T5 T6 T7 T8 T9 T10 T11 T12 T13 T14 T15 T16
Stat
ion
1
13 112 689 740 279 205 335 291 38 25 56 119 33 29 20 37
Stat
ion
2
164 183 140
Navakavu (Waiqanake) fishing ground
T1 T2 T3 T4 T5 T6 T7 T8
Station 1 69 83 74 80 77 13 35 19
Station 2 2 2 17 11 54
Station 3 5 5 11
Malomalo fishing grounds
T1 T2 T3 T4 T5 T6 T7 T8 T9 T10 T11
Station1 90 130 140 227 325 400 155 175 204 325 314
Mau fishing ground
T1 T2 T3 T4 T5 T6 T7 T8
Station 1 9 6 9 10 145 22 20 16
24 Pacific Horticultural and Agricultural Market Access (PHAMA) Program Sea Urchin Report (Parts 1 and 2) - Fiji
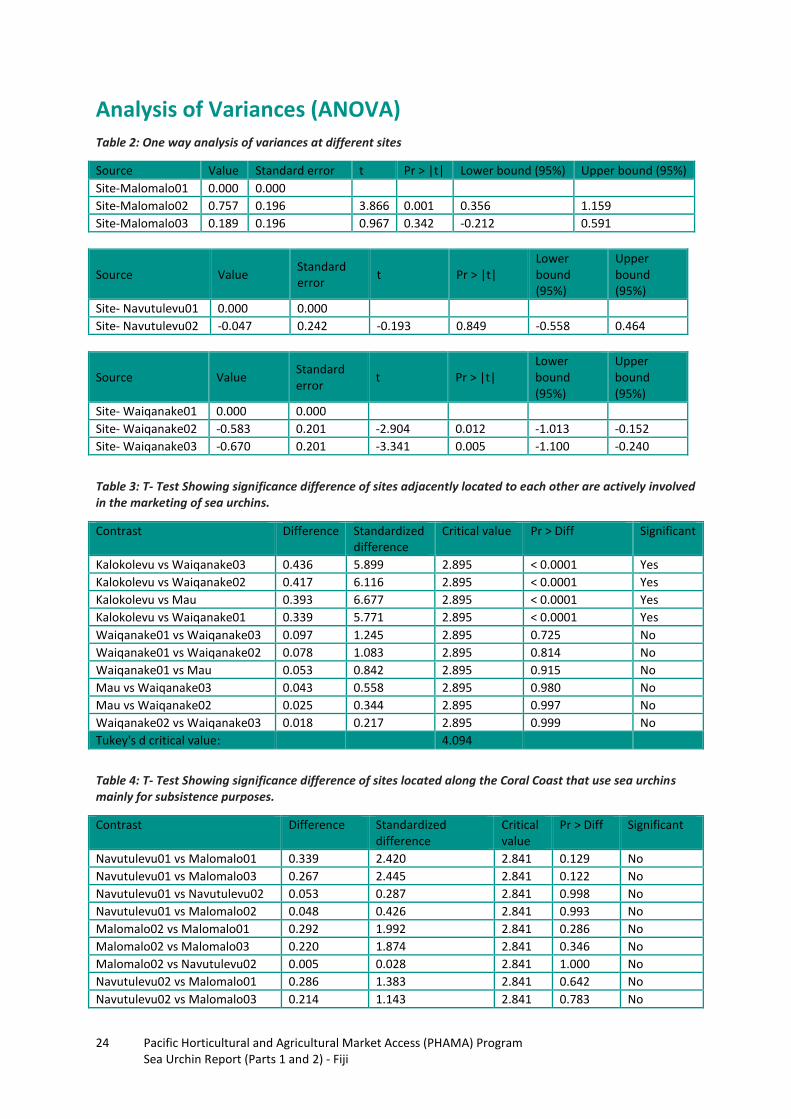
Analysis of Variances (ANOVA) Table 2: One way analysis of variances at different sites
Source Value Standard error t Pr > |t| Lower bound (95%) Upper bound (95%)
Site-Malomalo01 0.000 0.000
Site-Malomalo02 0.757 0.196 3.866 0.001 0.356 1.159
Site-Malomalo03 0.189 0.196 0.967 0.342 -0.212 0.591
Source Value Standard error
t Pr > |t| Lower bound (95%)
Upper bound (95%)
Site- Navutulevu01 0.000 0.000
Site- Navutulevu02 -0.047 0.242 -0.193 0.849 -0.558 0.464
Source Value Standard error
t Pr > |t| Lower bound (95%)
Upper bound (95%)
Site- Waiqanake01 0.000 0.000
Site- Waiqanake02 -0.583 0.201 -2.904 0.012 -1.013 -0.152
Site- Waiqanake03 -0.670 0.201 -3.341 0.005 -1.100 -0.240
Table 3: T- Test Showing significance difference of sites adjacently located to each other are actively involved in the marketing of sea urchins.
Contrast Difference Standardized difference
Critical value Pr > Diff Significant
Kalokolevu vs Waiqanake03 0.436 5.899 2.895 < 0.0001 Yes
Kalokolevu vs Waiqanake02 0.417 6.116 2.895 < 0.0001 Yes
Kalokolevu vs Mau 0.393 6.677 2.895 < 0.0001 Yes
Kalokolevu vs Waiqanake01 0.339 5.771 2.895 < 0.0001 Yes
Waiqanake01 vs Waiqanake03 0.097 1.245 2.895 0.725 No
Waiqanake01 vs Waiqanake02 0.078 1.083 2.895 0.814 No
Waiqanake01 vs Mau 0.053 0.842 2.895 0.915 No
Mau vs Waiqanake03 0.043 0.558 2.895 0.980 No
Mau vs Waiqanake02 0.025 0.344 2.895 0.997 No
Waiqanake02 vs Waiqanake03 0.018 0.217 2.895 0.999 No
Tukey's d critical value: 4.094
Table 4: T- Test Showing significance difference of sites located along the Coral Coast that use sea urchins mainly for subsistence purposes.
Contrast Difference Standardized difference
Critical value
Pr > Diff Significant
Navutulevu01 vs Malomalo01 0.339 2.420 2.841 0.129 No
Navutulevu01 vs Malomalo03 0.267 2.445 2.841 0.122 No
Navutulevu01 vs Navutulevu02 0.053 0.287 2.841 0.998 No
Navutulevu01 vs Malomalo02 0.048 0.426 2.841 0.993 No
Malomalo02 vs Malomalo01 0.292 1.992 2.841 0.286 No
Malomalo02 vs Malomalo03 0.220 1.874 2.841 0.346 No
Malomalo02 vs Navutulevu02 0.005 0.028 2.841 1.000 No
Navutulevu02 vs Malomalo01 0.286 1.383 2.841 0.642 No
Navutulevu02 vs Malomalo03 0.214 1.143 2.841 0.783 No

25 Pacific Horticultural and Agricultural Market Access (PHAMA) Program Sea Urchin Report (Parts 1 and 2) - Fiji
Malomalo03 vs Malomalo01 0.072 0.498 2.841 0.987 No
Tukey's d critical value: 4.018
26 Pacific Horticultural and Agricultural Market Access (PHAMA) Program Sea Urchin Report (Parts 1 and 2) - Fiji
Part 2:
Sea Urchin Stock &
Harvester Survey Report
Prepared by Ms Lanieta Vakadewabuka Researcher- Statistics/Gender & Rural Dev Nov 2016- Feb 2017 Fisheries Technical Report No 01/2017 Research Section Ministry of Fisheries, Draunibota, Lami Compiled by: Nanise Kuridrani – Tuqiri, Kalisiana Marama and Aporosa Nalasi

27 Pacific Horticultural and Agricultural Market Access (PHAMA) Program Sea Urchin Report (Parts 1 and 2) - Fiji
Prepared by Ms Lanieta Vakadewabuka Researcher- Statistics/Gender & Rural Dev Nov 2016- Feb 2017 Fisheries Technical Report No 01/2017 Research Section Ministry of Fisheries, Draunibota, Lami Compiled by: Nanise Kuridrani – Tuqiri, Kalisiana Marama and Aporosa Nalasi
Acknowledgement Foremost, I am grateful to Pacific Horticultural and Agricultural Market Access Program (PHAMA Program) for the opportunity and support to take a lead role in the initial study to collect sex-segregated data for those involved in harvesting sea urchins, and to provide an indicator on the availability of sea urchins for export from a socio economic perspective. The experience and knowledge gained is invaluable. I am indebted to the Ministry of Fisheries (MoF) for all the resources used for the survey. My sincere appreciation goes to the Socio Research team for their expertise and assistance during field data collection phase. I acknowledge with appreciation the support of the Village Chiefs and Village headman (Turaga ni Koro) of the selected communities for allowing access to their communities, accommodating the team and their tremendous support throughout the survey. I am deeply grateful to the women and men harvesters who have openly shared information, experiences and knowledge. All information shared and recorded during the interviews have greatly contributed to making this survey count. Vinaka Vakalevu.

28 Pacific Horticultural and Agricultural Market Access (PHAMA) Program Sea Urchin Report (Parts 1 and 2) - Fiji
List of Tables Table 1 Respondents/ tot households/type of harvester Table 2 Estimate of harvest and Income
Case Study Case Study 1 Historical knowledge Case Study 2 Personal experience in sea urchin fishery and marketing

29 Pacific Horticultural and Agricultural Market Access (PHAMA) Program Sea Urchin Report (Parts 1 and 2) - Fiji
Executive Summary The Sea Urchin Stock and Harvester Survey is conducted by the Pacific Horticultural and Agricultural Market Access Program (PHAMA Program) and the Ministry of Fisheries (MoF).Consultations and Planning between the two stakeholders were held towards the end of 2016(Nov- Dec) .Field work for data collection, data entry, data processing and report writing commenced in January to March 2017. The survey was primarily designed to collect sex segregated data and detailed information on individuals involved in harvesting and selling sea urchins (cawaki) and to determine the level of participation of women in the fishery. Other objectives of the study were to identify the availability of sea urchins for export opportunity, and identify opportunities and threats of supply of sea urchins to markets and buyers. Apart from the main objectives, the MoF questionnaire was redesigned (Appendix 2) to gather more relative data and capture better information on six important features of the fishery: 1. Gender 2. Household information of harvester 3. Harvesting effort and catch 4. Markets/preparation of catch and Income 5. Fisheries dependence 6. Sea urchin stock and management. The survey covered two distinctive areas in the Central and Western Division of Fiji. The smaller Suva peninsula area (in the Central Division) recorded a higher percentage (44.5%) of total households actively involved in sea urchin fishery. The coastal areas of Cuvu and Malomalo (in the Western Division) had a larger coverage by area and recorded a much smaller portion of total households (20.3%) actively involved in sea urchin fishery. A total of sixteen communities (16) were visited and 133 interviews conducted in the two (2) divisions.
30 Pacific Horticultural and Agricultural Market Access (PHAMA) Program Sea Urchin Report (Parts 1 and 2) - Fiji
Main Findings • Women constitute 85% in sea urchin fishery • Sea urchins are a major source of regular income for a significant number of households in the areas
surveyed, averaging $200 per week for sea urchin sales only. • Women earn a regular income from selling sea urchins, and the income has financially supported their
access to basic necessities like proper housing, water, electricity and food their households • Other family members including men assist women in harvesting to ensure maximum catch .The
participation of men assisting their wives in harvesting often leads to control of income even when their (men) level of contribution is minimal
• There is a high level of dependency on coastal fishery as a major source of income and food. • There is an existing thriving local market for sea urchins. Local demand continues to increase with
consumers buying from the municipal markets and also purchasing directly from site. There is an increasing number of middlemen who buy directly from source in large quantities and re-sell to consumers and business houses. This may provide market competition and affect supply for export market.
• Women harvesters earn good and regular income but do not have personal bank accounts. • Most women harvesters are satisfied with the income they earn and depend less on their husbands
for economic support • Abundance and the increasing population of sea urchins have been recorded from all interviews
conducted. • Harvesters and communities surveyed lack knowledge and training in the following areas:
• Modern methods of preservation of sea urchins • Hygienic preparation and packing methods • Health and safety issues relating to regular sea urchin harvesting • Life cycle and protecting sea urchin habitats • Managing fishing environment for sustainable sea urchin stock • Empowerment for market and price determination • Business training (to include budgeting, banking and business setting)

31 Pacific Horticultural and Agricultural Market Access (PHAMA) Program Sea Urchin Report (Parts 1 and 2) - Fiji
1.0 Background Sea urchins (Tripnuestes gratila) are considered one of the major coastal fishery resources of Fiji. Data collected for smaller coastal fishery like sea urchins and other species is very limited. Sea urchins and other smaller fishery has always been assumed as a non-significant sector despite its importance to a large proportion of Fiji’s rural and urban population as a source of income and food. On the other hand, some basic information has been collected by government and non-government agencies (NGO), but there has been very little effort over the years to collate and share sea urchin information from different sources. Participation of women in coastal fisheries or in any other sector has often been assumed and under estimated. The current global push for gender equality and development using gender statistics as evidence for decision making has warranted the need to conduct such surveys to collect sex-segregated data in both the formal and informal sectors. This baseline survey is an effort to capture, record and provide sex-segregated data in sea urchin fishery. It is anticipated that data collected from this survey will identify the needs of women involved in sea urchin fishery and also provide evidence to support development and empowerment for women in smaller fishery sectors. Additionally, this survey will create and support future opportunities to conduct similar surveys in a wider cross section of communities and also across the various coastal fishery in Fiji.
1.1 The Sea Urchin Stock & Harvester Survey, 2017 Based on information and initial data provided by the Ministry of Fisheries (MoF), this survey was designed to support and expand on initial efforts by MoF to collect harvester data, assess sea urchin stock for export opportunity and identify threats to the supply of sea urchins to markets and buyers. A questionnaire used by MoF was amended to improve the capture and recording of distinctive socio and economic features of sea urchin fishery in Fiji and those involved in it. A total of 55 questions (Appendix 1) were asked in addition to other informal interviews and discussions with key informants like village elders, village headman and other community members. MoF assisted and contributed to most stages of the survey including planning and selection of survey sites, logistics, staffing, transport, accommodation, data collection and data entry.
32 Pacific Horticultural and Agricultural Market Access (PHAMA) Program Sea Urchin Report (Parts 1 and 2) - Fiji
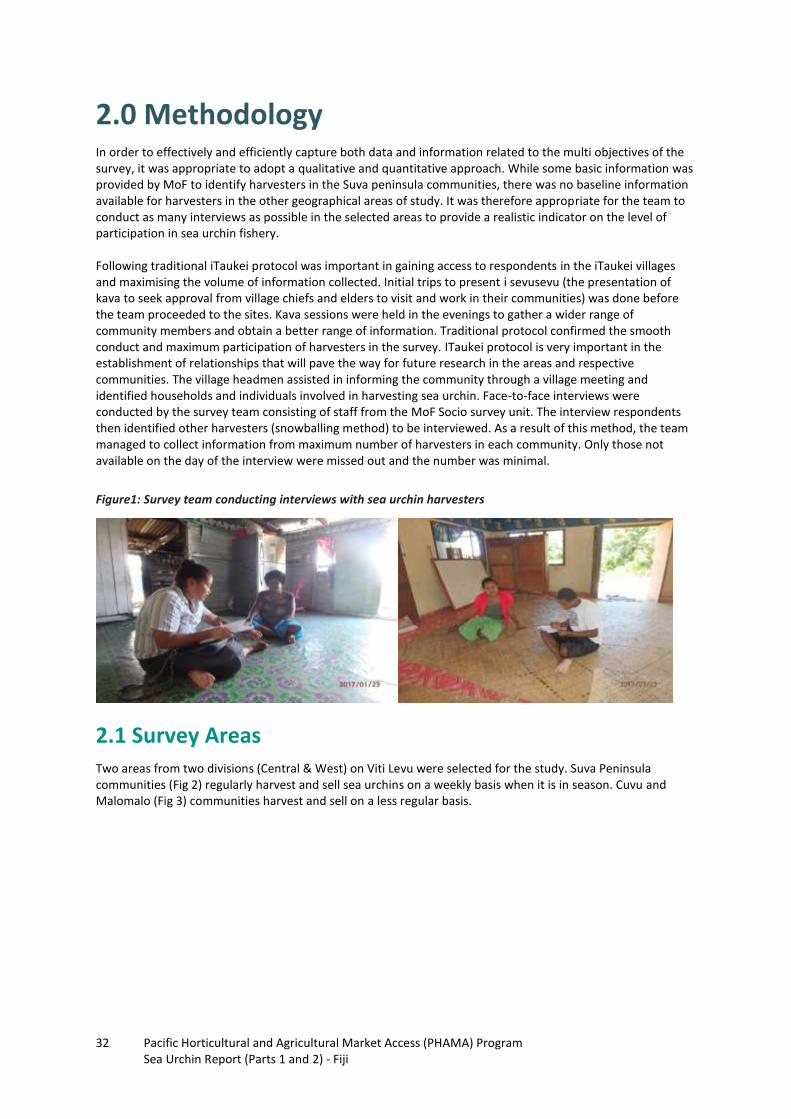
2.0 Methodology In order to effectively and efficiently capture both data and information related to the multi objectives of the survey, it was appropriate to adopt a qualitative and quantitative approach. While some basic information was provided by MoF to identify harvesters in the Suva peninsula communities, there was no baseline information available for harvesters in the other geographical areas of study. It was therefore appropriate for the team to conduct as many interviews as possible in the selected areas to provide a realistic indicator on the level of participation in sea urchin fishery. Following traditional iTaukei protocol was important in gaining access to respondents in the iTaukei villages and maximising the volume of information collected. Initial trips to present i sevusevu (the presentation of kava to seek approval from village chiefs and elders to visit and work in their communities) was done before the team proceeded to the sites. Kava sessions were held in the evenings to gather a wider range of community members and obtain a better range of information. Traditional protocol confirmed the smooth conduct and maximum participation of harvesters in the survey. ITaukei protocol is very important in the establishment of relationships that will pave the way for future research in the areas and respective communities. The village headmen assisted in informing the community through a village meeting and identified households and individuals involved in harvesting sea urchin. Face-to-face interviews were conducted by the survey team consisting of staff from the MoF Socio survey unit. The interview respondents then identified other harvesters (snowballing method) to be interviewed. As a result of this method, the team managed to collect information from maximum number of harvesters in each community. Only those not available on the day of the interview were missed out and the number was minimal.
Figure1: Survey team conducting interviews with sea urchin harvesters
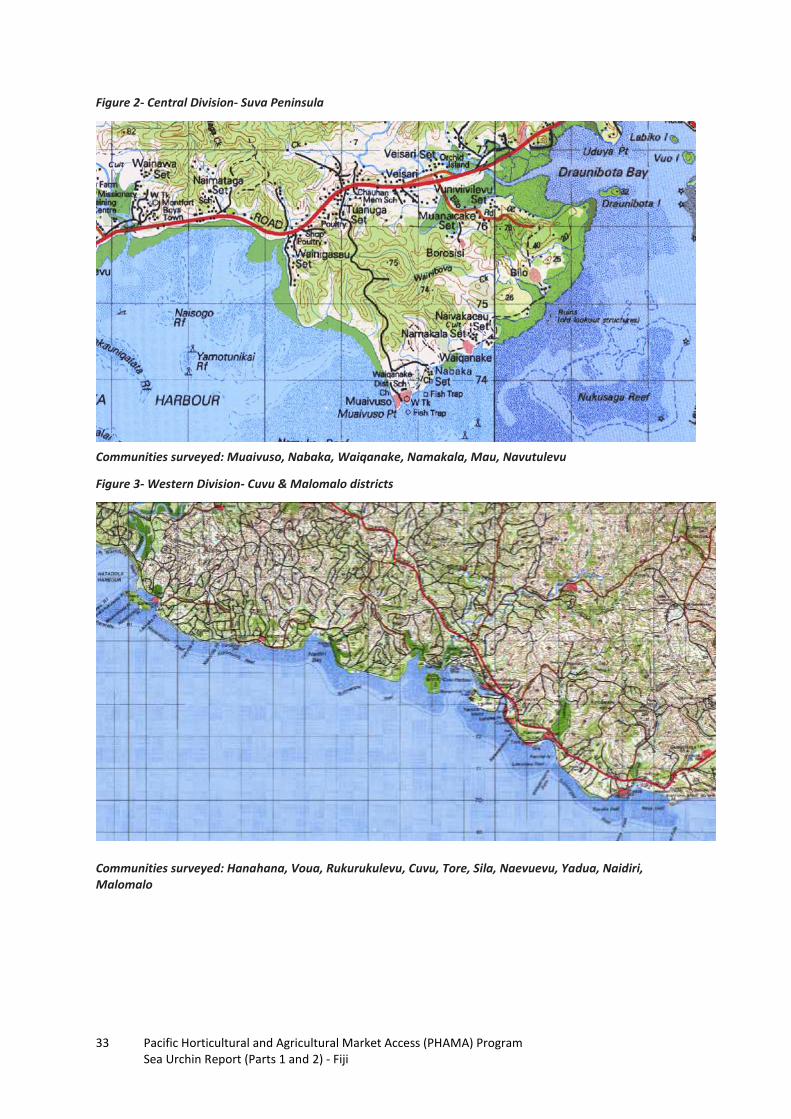
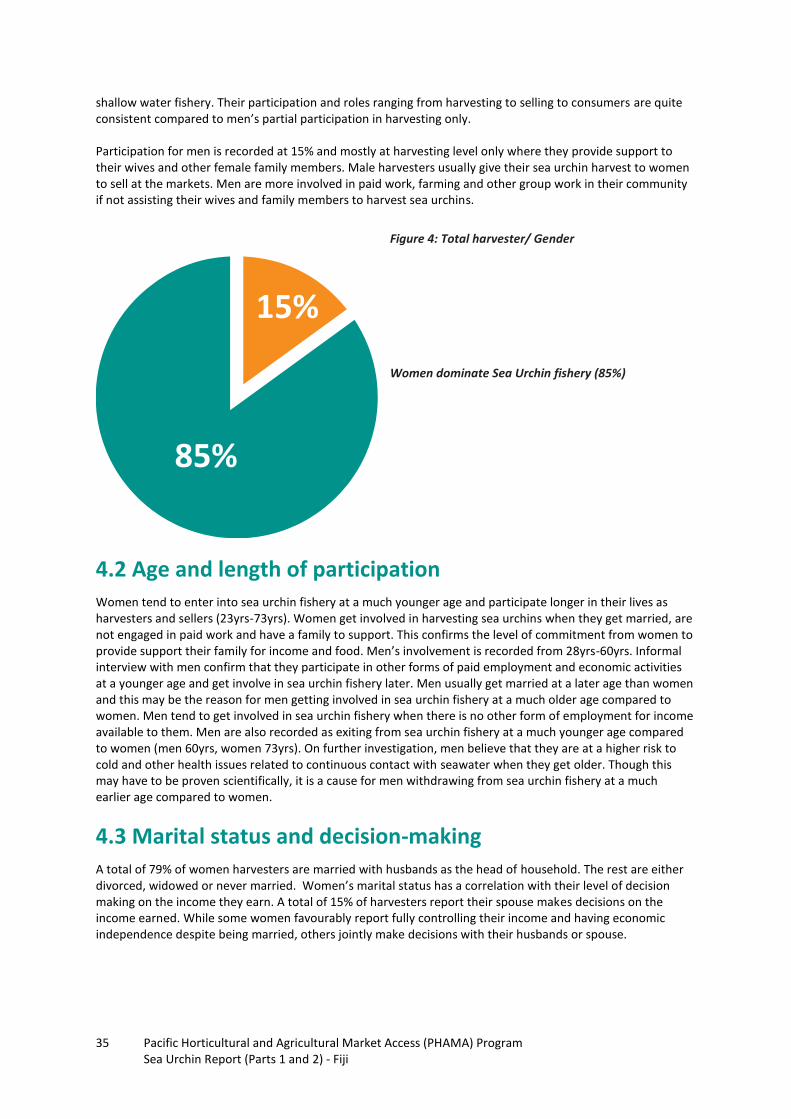
2.1 Survey Areas Two areas from two divisions (Central & West) on Viti Levu were selected for the study. Suva Peninsula communities (Fig 2) regularly harvest and sell sea urchins on a weekly basis when it is in season. Cuvu and Malomalo (Fig 3) communities harvest and sell on a less regular basis.
33 Pacific Horticultural and Agricultural Market Access (PHAMA) Program Sea Urchin Report (Parts 1 and 2) - Fiji
Figure 2- Central Division- Suva Peninsula
Communities surveyed: Muaivuso, Nabaka, Waiqanake, Namakala, Mau, Navutulevu
Figure 3- Western Division- Cuvu & Malomalo districts
Communities surveyed: Hanahana, Voua, Rukurukulevu, Cuvu, Tore, Sila, Naevuevu, Yadua, Naidiri, Malomalo

34 Pacific Horticultural and Agricultural Market Access (PHAMA) Program Sea Urchin Report (Parts 1 and 2) - Fiji
3.0 Limitations • Like any other survey, there were some administrative delays and problems experienced. This
included money transaction difficulties between the two main stakeholders delaying the timing and progress of the survey
• The limited number of days (15) allocated to plan, design, conduct, data entry, analysis and reporting was very insufficient. Insufficient time usually compromises the quality of data collected and the level of data analysis and reporting done
• Limited funding resulted in only two areas surveyed. This disqualifies the survey as a proper representation of the level of sea urchin harvesting in Fiji, the level of participation of women and may under-report the availability of sea urchin stock for export
• The preparation period (late Dec 2016 -early Jan 2017) is not a suitable time to prepare for a project as staff are out on break during the festive season, thus delaying the progress of the preparation phase
• Lack of allocated transport for the team affected the mobility of the team and progress of the survey and coverage.
• Due to lack of transport, harvesters who were not at home during the time of visit could not be revisited and were left out of the survey.
4.0 Results A much larger proportion (44.5%) of total households in the six (6) communities surveyed in the Suva peninsula area are involved in harvesting and selling sea urchins compared to only 20.3 % of total households in ten (10) communities in the Cuvu and Malomalo areas. Overall, 27% of total households in both areas surveyed are involved in sea urchin fishery as a source of income and source of food. As tabled below, it must be known that each respondent represents a household in this survey.
Table 1: Respondents/ Tot. households/Type of harvester
Area Total
households Total
respondents % of total
households Female Male
Suva Peninsula 137 61 44.5 52 9
Cuvu & Malomalo
coastal 355 72 20.3 61 11
492 133 27.0 113 20
Note: figures have been rounded off
The larger proportion of households (73%) in both areas are engaged in other forms of activities to provide a regular source of income for their households. These other activities include fishing to sell fish and other species, paid employment like working in the hotel sector in the Coral Coast area, other forms of paid employment and managing small business.
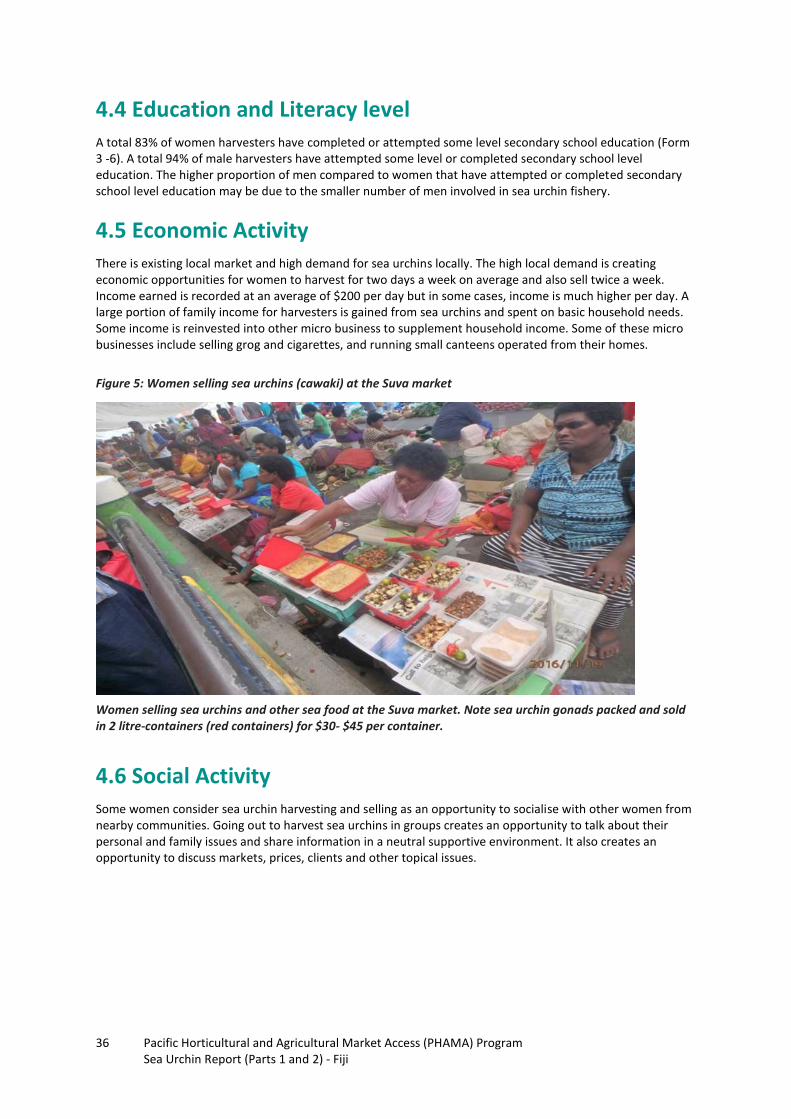
4.1 Gender Profiling Women make a tremendous contribution to economic and domestic life but their role is often to support men’s economic activity (Gender Issues in Employment, Dr Warden Narsey, 2007). Sectoral studies as such are important to expose the domination of women and their leading roles in economic activities supported by men in unexplored sectors. Overall, women dominate sea urchin fishery and their participation is recorded at a high of 85% (refer Table 1) compared to men. It can be concluded from the results that women’s domination in shallow water fishery can no longer be assumed and they may be responsible for harvesting a significant percentage of all species in
35 Pacific Horticultural and Agricultural Market Access (PHAMA) Program Sea Urchin Report (Parts 1 and 2) - Fiji
shallow water fishery. Their participation and roles ranging from harvesting to selling to consumers are quite consistent compared to men’s partial participation in harvesting only. Participation for men is recorded at 15% and mostly at harvesting level only where they provide support to their wives and other female family members. Male harvesters usually give their sea urchin harvest to women to sell at the markets. Men are more involved in paid work, farming and other group work in their community if not assisting their wives and family members to harvest sea urchins.
Figure 4: Total harvester/ Gender
Women dominate Sea Urchin fishery (85%)
4.2 Age and length of participation Women tend to enter into sea urchin fishery at a much younger age and participate longer in their lives as harvesters and sellers (23yrs-73yrs). Women get involved in harvesting sea urchins when they get married, are not engaged in paid work and have a family to support. This confirms the level of commitment from women to provide support their family for income and food. Men’s involvement is recorded from 28yrs-60yrs. Informal interview with men confirm that they participate in other forms of paid employment and economic activities at a younger age and get involve in sea urchin fishery later. Men usually get married at a later age than women and this may be the reason for men getting involved in sea urchin fishery at a much older age compared to women. Men tend to get involved in sea urchin fishery when there is no other form of employment for income available to them. Men are also recorded as exiting from sea urchin fishery at a much younger age compared to women (men 60yrs, women 73yrs). On further investigation, men believe that they are at a higher risk to cold and other health issues related to continuous contact with seawater when they get older. Though this may have to be proven scientifically, it is a cause for men withdrawing from sea urchin fishery at a much earlier age compared to women.
4.3 Marital status and decision-making A total of 79% of women harvesters are married with husbands as the head of household. The rest are either divorced, widowed or never married. Women’s marital status has a correlation with their level of decision making on the income they earn. A total of 15% of harvesters report their spouse makes decisions on the income earned. While some women favourably report fully controlling their income and having economic independence despite being married, others jointly make decisions with their husbands or spouse.
36 Pacific Horticultural and Agricultural Market Access (PHAMA) Program Sea Urchin Report (Parts 1 and 2) - Fiji
4.4 Education and Literacy level A total 83% of women harvesters have completed or attempted some level secondary school education (Form 3 -6). A total 94% of male harvesters have attempted some level or completed secondary school level education. The higher proportion of men compared to women that have attempted or completed secondary school level education may be due to the smaller number of men involved in sea urchin fishery.
4.5 Economic Activity There is existing local market and high demand for sea urchins locally. The high local demand is creating economic opportunities for women to harvest for two days a week on average and also sell twice a week. Income earned is recorded at an average of $200 per day but in some cases, income is much higher per day. A large portion of family income for harvesters is gained from sea urchins and spent on basic household needs. Some income is reinvested into other micro business to supplement household income. Some of these micro businesses include selling grog and cigarettes, and running small canteens operated from their homes.
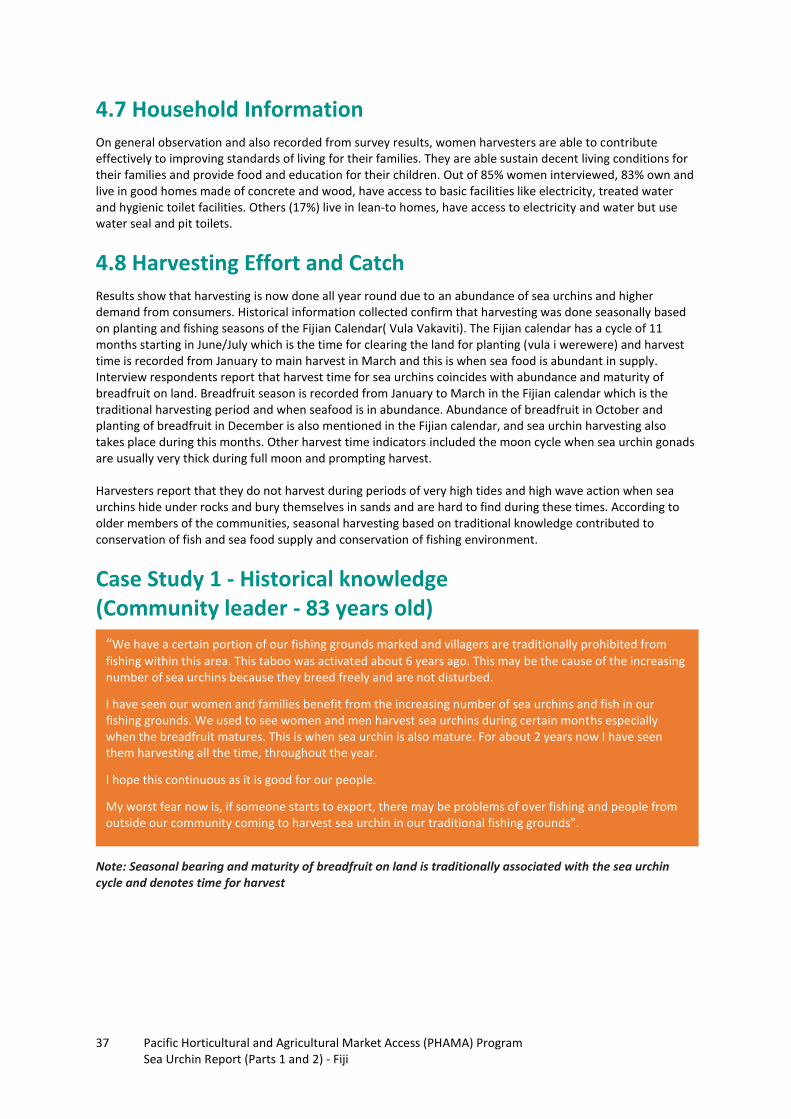
Figure 5: Women selling sea urchins (cawaki) at the Suva market
Women selling sea urchins and other sea food at the Suva market. Note sea urchin gonads packed and sold in 2 litre-containers (red containers) for $30- $45 per container.
4.6 Social Activity Some women consider sea urchin harvesting and selling as an opportunity to socialise with other women from nearby communities. Going out to harvest sea urchins in groups creates an opportunity to talk about their personal and family issues and share information in a neutral supportive environment. It also creates an opportunity to discuss markets, prices, clients and other topical issues.
37 Pacific Horticultural and Agricultural Market Access (PHAMA) Program Sea Urchin Report (Parts 1 and 2) - Fiji
4.7 Household Information On general observation and also recorded from survey results, women harvesters are able to contribute effectively to improving standards of living for their families. They are able sustain decent living conditions for their families and provide food and education for their children. Out of 85% women interviewed, 83% own and live in good homes made of concrete and wood, have access to basic facilities like electricity, treated water and hygienic toilet facilities. Others (17%) live in lean-to homes, have access to electricity and water but use water seal and pit toilets.
4.8 Harvesting Effort and Catch Results show that harvesting is now done all year round due to an abundance of sea urchins and higher demand from consumers. Historical information collected confirm that harvesting was done seasonally based on planting and fishing seasons of the Fijian Calendar( Vula Vakaviti). The Fijian calendar has a cycle of 11 months starting in June/July which is the time for clearing the land for planting (vula i werewere) and harvest time is recorded from January to main harvest in March and this is when sea food is abundant in supply. Interview respondents report that harvest time for sea urchins coincides with abundance and maturity of breadfruit on land. Breadfruit season is recorded from January to March in the Fijian calendar which is the traditional harvesting period and when seafood is in abundance. Abundance of breadfruit in October and planting of breadfruit in December is also mentioned in the Fijian calendar, and sea urchin harvesting also takes place during this months. Other harvest time indicators included the moon cycle when sea urchin gonads are usually very thick during full moon and prompting harvest. Harvesters report that they do not harvest during periods of very high tides and high wave action when sea urchins hide under rocks and bury themselves in sands and are hard to find during these times. According to older members of the communities, seasonal harvesting based on traditional knowledge contributed to conservation of fish and sea food supply and conservation of fishing environment.
Case Study 1 - Historical knowledge (Community leader - 83 years old)
Note: Seasonal bearing and maturity of breadfruit on land is traditionally associated with the sea urchin cycle and denotes time for harvest
“We have a certain portion of our fishing grounds marked and villagers are traditionally prohibited from
fishing within this area. This taboo was activated about 6 years ago. This may be the cause of the increasing number of sea urchins because they breed freely and are not disturbed.
I have seen our women and families benefit from the increasing number of sea urchins and fish in our fishing grounds. We used to see women and men harvest sea urchins during certain months especially when the breadfruit matures. This is when sea urchin is also mature. For about 2 years now I have seen them harvesting all the time, throughout the year.
I hope this continuous as it is good for our people.
My worst fear now is, if someone starts to export, there may be problems of over fishing and people from outside our community coming to harvest sea urchin in our traditional fishing grounds”.

38 Pacific Horticultural and Agricultural Market Access (PHAMA) Program Sea Urchin Report (Parts 1 and 2) - Fiji
4.9 Collection and Storage Methods Sea urchins are collected by hand during low tide from reef tops and shallow inter-tidal areas. For women, harvesting is usually a coordinated task with other family members including husbands. Men play an important role in harvesting as they are faster in collecting, capable of carrying heavier loads like 25-50kg sacks full of sea urchin, loading and unloading to and from boats and rafts, and carrying from the beach to the village for storage and processing. Harvested sea urchins are kept in sacks under seawater or in a cool, dry place away from the sun before they are processed (shelled) for sale. When shelled, sea urchin gonads are kept in plastic containers and deep frozen for at least two (2) nights before they are taken to the selling points.
4.10 Weekly Harvest and Income For the purpose of providing an indicator for harvest and income, results for forty two (42) interviews of regular harvesters from the Suva peninsula area have been used. Harvesters from the other study area (Cuvu & Malomalo) are not considered in the estimates tabled below as they do not harvest and sell on regular basis compared to the Suva peninsula area harvesters. Women harvesters from communities in the Suva peninsula communities have been supplying the Suva market and major buyers on regular basis throughout the year. Shelled sea urchins packed in plastic containers is a popular Saturday market product for regular large buyers and individual consumers.
Table 2: Estimate of harvest and Income
Tot harvesters
Tot catch per day/ per head
Av no of harvest days per week per head.
Tot catch per head*2days per week* 42
Av income per day per head
Av income*2days*42
Av income per day per head
42 160 2 days 13,440 $200 $16,800 53,760
An estimated number of 13,440 sea urchins are harvested in every 2 days of harvest per week by 42 harvesters. The total number of sea urchins harvested per week (13,440) is similar to each harvester collecting 160 sea urchins a day. From 160 (1x 50 kg bag full + 1x 25 kg bag full) each harvester is able to completely fill two to three, 2litre containers of sea urchin roe/gonad. The number of 2litre containers filled depends on maturity and thickness of sea urchin gonad. The other commonly used plastic 500ml containers are sold for $5 per serve. Each 2litre container full is sold for $30- $45 per container. Average income is estimated at $200 per harvester per day if three (3) containers are sold at $45 each, plus income earned from smaller serves selling at $5 per serve. It is to be noted that there are extreme situations were a vendor may sell up to 30 containers or more at prices ranging from $30-$45 per 2litre container. These are usually orders placed by Asian customers, hotels and restaurants and other Pacific islanders.
4.11 Sea urchin selection method During mature season (Oct- March), harvesters are not very selective of the size harvested as sea urchin gonads are usually thick during this time, and, any size of sea urchin will provide sufficient amount of gonads for consumption. When not mature (off season), harvesters usually pick the larger size (6-8 cm diameter) to harvest. This selection method is usually done during harvesting phase where smaller size sea urchins are not harvested and left to grow in their natural habitat.
39 Pacific Horticultural and Agricultural Market Access (PHAMA) Program Sea Urchin Report (Parts 1 and 2) - Fiji
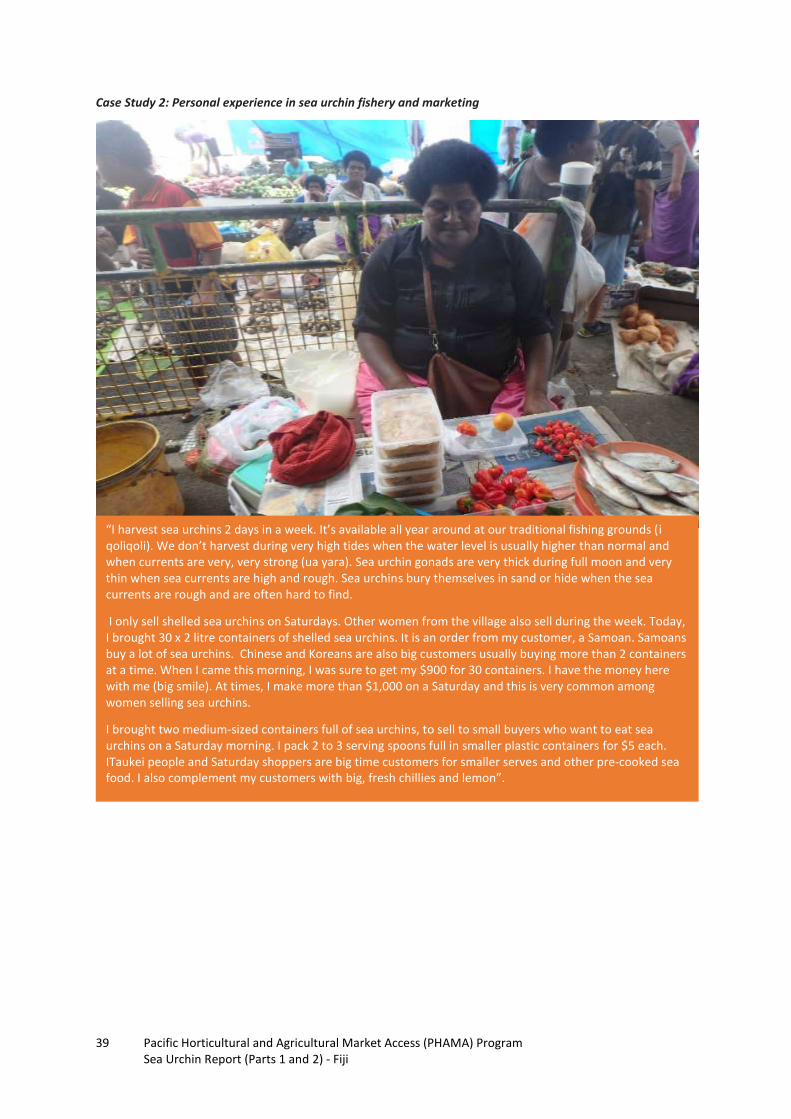
Case Study 2: Personal experience in sea urchin fishery and marketing
“I harvest sea urchins 2 days in a week. It’s available all year around at our traditional fishing grounds (i qoliqoli). We don’t harvest during very high tides when the water level is usually higher than normal and when currents are very, very strong (ua yara). Sea urchin gonads are very thick during full moon and very thin when sea currents are high and rough. Sea urchins bury themselves in sand or hide when the sea currents are rough and are often hard to find.
I only sell shelled sea urchins on Saturdays. Other women from the village also sell during the week. Today, I brought 30 x 2 litre containers of shelled sea urchins. It is an order from my customer, a Samoan. Samoans buy a lot of sea urchins. Chinese and Koreans are also big customers usually buying more than 2 containers at a time. When I came this morning, I was sure to get my $900 for 30 containers. I have the money here with me (big smile). At times, I make more than $1,000 on a Saturday and this is very common among women selling sea urchins.
I brought two medium-sized containers full of sea urchins, to sell to small buyers who want to eat sea urchins on a Saturday morning. I pack 2 to 3 serving spoons full in smaller plastic containers for $5 each. ITaukei people and Saturday shoppers are big time customers for smaller serves and other pre-cooked sea food. I also complement my customers with big, fresh chillies and lemon”.

40 Pacific Horticultural and Agricultural Market Access (PHAMA) Program Sea Urchin Report (Parts 1 and 2) - Fiji
4.12 Income Satisfaction and Banking Majority of women harvesters are satisfied with the income they earn from selling sea urchin. It is an easy way to earn income as they are able to combine their household chores in a day with harvesting sea urchin for income and food. Harvesting takes up 2-3 hours per day, for every 2-3 days per week depending on the tides. Women are able to participate in other family and community commitments before and after harvesting trips. This contributes to satisfaction from income as they are able to efficiently do daily households chores and spend 2-3 hours for income. A follow up on 23% of women harvesters and regular sellers confirm that they do not own a personal bank account to keep their income. This practice may be common with women in sea urchin fishery. Money earned from sea urchin is deposited into their husbands account or in a joint account with their husbands. This leads to women not having full control and timely access to their money. Other women do not see the need to have a bank account because they spend their income daily for their household and personal needs. Banks are a distance from the locations studied and access to banking facilities on a daily basis may be a hindrance to women having their own bank accounts.
4.13 Markets The Suva municipal market, every Saturday morning, is the major selling point for sea urchin gonad (cawaki) harvested by Suva peninsula communities covered in this survey. Vendors have regular individual customers, and also sell to restaurants and hotels. This is in addition to the high demand from ordinary Saturday market shoppers. Harvesters in the other areas of study sell on a very small scale from the Sigatoka market, while others deliver to hotels, sell to fellow villagers and give to families and friends. Customer preference has seen the change from buying whole sea urchin in baskets to buying gonads packed in plastic containers. These are usually prepared and deep frozen for at least one or two nights before being sold.
Fig 6a. Freshly harvested sea urchins Fig 6b. Sea urchin gonads sold at the Suva market
4.14 Fisheries Dependence About 20.3% of total respondents fully depend on their fishery for income and food for their family. While sea urchin stands to be the major source of income and food, they also collect other sea food including fish, sea shells, clams, sea grapes (nama) and sea weed (lumi). Other respondents have other sources of income including paid employment and small businesses but also rely on the sea for food at certain times. Some confirm having a paid job but harvest sea urchins and other shallow water fishery to supplement their income.

41 Pacific Horticultural and Agricultural Market Access (PHAMA) Program Sea Urchin Report (Parts 1 and 2) - Fiji
4.15 Export of Sea Urchin Exporting sea urchin was discussed at length by respondents and other community members. The idea created a lot of interest and more awareness and scientific research is needed to confirm the possibility of exporting and most importantly maintaining the export market with sea urchin stock and supply. This survey could only provide an estimate on the number of sea urchin harvested (13,440) every two days of harvest per week for 42 regular harvesters from the Suva peninsula only. This figure may also provide an indicator on the quantity and abundance of sea urchin available in some of Fiji’s inter-tidal water fishing grounds. Further biological and scientific studies may be required to confirm the above estimates and provide further stock data as evidence to facilitate export initiatives. Respondents have also expressed fears of depleting stock due to over harvest and abuse by poachers if sea urchin is to be exported. While export of sea urchin may provide quicker and easier financial returns for harvesters, commercial farming of sea urchin needs to be explored to support current stock available in Fiji’s natural sea urchin habitat and also confirm the sustainability of stock for export.
4.16 Knowledge level Generally, respondents lack information and knowledge in the changes happening in their fishing environment. They can identify threats to their fishing environment but are not able to recommend ways to conserve their fishing environment. Some harvesters and community members have attended trainings in relation to preserving fishing environment but may need refresher sessions to improve their knowledge.
5.0 Conclusion In terms of coverage of scope, the survey was successfully conducted in the two (2) divisions, given the very short period allowed. Despite the shortfalls in planning, timing, transport and other issues encountered, the main objectives were covered and indicators and estimates provided. Results from this survey are NOT sufficient for national representation and must not be used for that purpose. On the other hand, results can be used as useful indicators for the sea urchin fishery and also as a baseline to encourage and support further research on a wider scope in other parts of Fiji. Sea urchin trade has been in existence for some time. Survey respondents recorded having learnt harvesting and marketing skills from their grandparents and parents. Despite its existence and evolvement from subsistence to a market-driven product, it remains an unrecognised sector that does not have any policies to govern harvest and selling. Sea urchins maybe open to abuse and depletion if an export opportunity arises. In view of the increasing demand recorded, this fishery sector needs to be properly regulated through policies to ensure sustainability of stock and specie. Women dominate sea urchin fishery and earn a regular income to provide for the basic needs in their households. Women are empowered through the income they gain and have been able to gain economic independence to some extent. Empowerment of women through banking, budgeting and financial planning should be encouraged in the sector. Hygienic and safe preparation of sea urchin for sale to consumers has never been taught to women involved in the trade. Buyers may be at risk from food poisoning though no such incidence has been recorded. The practice of harvesting and selling has been done over many years and have evolved from subsistence to being a market-driven product. The high demand of consumers has driven harvesters to harvest and sell more frequently. Continued exposure to water, cold, sun and other weather conditions is a health risk to harvesters. The increasing number of sea urchins is a concern for the study communities. There may be threats associated with the increasing numbers and this information needs to be shared to harvesters and communities concerned. Increasing stock may support an opportunity for export but may also create threats like abuse and excessive harvesting resulting in depleting stock. Export may also be an opportunity to control excess sea urchin population in Fiji’s fishing grounds.

42 Pacific Horticultural and Agricultural Market Access (PHAMA) Program Sea Urchin Report (Parts 1 and 2) - Fiji
6.0 Recommendations 1. Stakeholders are encouraged to use the results as a starting point for further research and
development in sea urchin fishery. 2. Stakeholders and responsible agencies need to devise specific policies to regulate, control and
monitor sea urchin fishery to ensure sustainability of sea urchin specie and stock. 3. Women need to be empowered through training and information sharing on banking, budgeting,
financial planning and marketing skills for better financial management and use of income. 4. Health and hygiene training to improve preparation and avoid risks like food poisoning and health
issues related to constant contact with seawater. 5. Information like proper waterproof wear, water safety and current fishing and preservation
technology needs to be shared to harvesting communities 6. Environment management knowledge and training to sustain stock and specie must be extended to
harvesters. 7. Communities studied should have more access to scientific knowledge about their main source of
income (sea urchin) to improve their understanding and hopefully will influence their decision making about sea urchins, the income and the environment.
8. Communities need to be informed and get a feedback on the results of the survey.

43 Pacific Horticultural and Agricultural Market Access (PHAMA) Program Sea Urchin Report (Parts 1 and 2) - Fiji
References 1. Dharam Chandra & Vasemaca Lewai,2005.Gender Statistics and Trends 2. David & Lucille Packard Foundation, 2014, Coastal Fisheries in Fiji 3. Dr Warden Narsey.2007. Gender Issues in Employment and Underemployment and Incomes in Fiji
4. Dr. Jimaima Lako. Product development of chilled and alcohol preserved sea urchin gonads for human
consumption 5. Professor Warden Narsey, 2008. The Quantitative Analysis of Poverty in Fiji 6. Robert Gillet, Anthony Lewis, Ian Cartwright. Coastal Fisheries in Fiji. Resources, Issues,& Enhancing
Role of the Fisheries Department 7. Veitayaki, J, 1995. Fisheries development in Fiji. The quest of Sustainability 8. Wildlife Conservation Society. Impact of Tropical Winston on Fisheries Dependent Communities in Fiji 9. wwwfijiancustomculture.blogshot.com Fijian Custom & Culture: Na Vula Vakaviti (Fijian Calendar)

44 Pacific Horticultural and Agricultural Market Access (PHAMA) Program Sea Urchin Report (Parts 1 and 2) - Fiji
Annex 1: Survey Respondents Survey Respondents
Central West
Saimone Makutu Vasemaca Verebasaga Sureti Bale Keleauni Waicula
Verona Tuikatoga Reapi Seruvatu Maria Veremaca Sera Mocelutu
Virisila Devekuta Unaisi Leqeleqe Elina Koroivuki
Ruci Delamakavu Mereani Cavalevu Mereoni Vasailagi Silovate Rabo
Arieta Roko Tokasa Lewesagane Solomoni Kai Titilia Vokili
Sereama Tuira Rupeni Paua Rejieli Lalabalavu Viliame Vuleka
Uraia Luisa Tinai Mere Nabukaka Vani Natoro
Mereseini Buloulevu Anibinivalu Raijeli Natuvuniwai Miriama Buka
Sereana Makelesi Marama Rufina Bua Sulueti Tabua
Virisila Melia Vulailai Venesa Buka Salanieta Tanumi
Losana Marama Melia Liku Taraivini Masarau Meremalesi Maca
Lusiana Litia Dobui Maraia Vatai Loata Tabualevu
Asinate Ratumainaceva
Mereseini Wati Imeri Nagale Salote Tuvou
Alumita Rabakele Karalaini Lini Asemate Kalesi Nasalo
Tarisi Kerekerelevu Akosita Lewamaqe Laisa Nasimokulavere Milinia Vaqewa
Camari Naiqara Nacanieli Sumataiwalu Merewai Biu Iliana Nagaunavou
Lavenia Tagavira Ameli Tiki Mekereta Ranadi Amenia Nagale
Luisa Raudiva Sereana Titilia Kula Merewai Nainoka
Kaliova Naratutabua Naomi Ralagi Ruci Kurunawaqa Paulina Rabo
Paulini Sivunakami Salote Bulouvela Arieta Vuki Joana Loloma
Vani Rogorogoivau Lolokiua Todra Mere Nakaka Ema Lewaninahohowaqa
Ema Dromunacua Seremaia Tinanivalu Maria Qasevakatini Verenaisi Baharo
Raluve Tavaita Vauerau Mereisi Vadua Esili Adicavulaca
Litiana Vakaiyaro Mereia Rabo Kulae Raviyawa Ana Talia
Kesaia Raidole Silina Melaia Drekevutu Viriseta Rogorogoyawa
Nemani Rabakele Salesa Veniana Mocelutu Ana Vose
Makerina Marika Waqa Mereani Vasei Matila Naivua
Kasanita Wati Wainikiti Bulovela Luisa Nabewa Timoci Tikoilodoni
Sakiusa Naimila Merelevu Rakolewa Adi Mere Tawakelevu Senimeli Waqa
Tokasa Lewesagane Makereta Tuneve Asenaca Kuraiwasa Virisila Naikula
Virisila Miriama Malotolu Ifereini Kuruvou
Joseva Millaer Vilimoni Drau
Nemaia Tui Iliasa Toroca
Mosese Volavola Rusiate Lalavanua
Ilaitia Vononale Akuila Virivisai
Ilami Wainiqolo Josaia Cokoibusa
Total Central= 61 Total West = 72
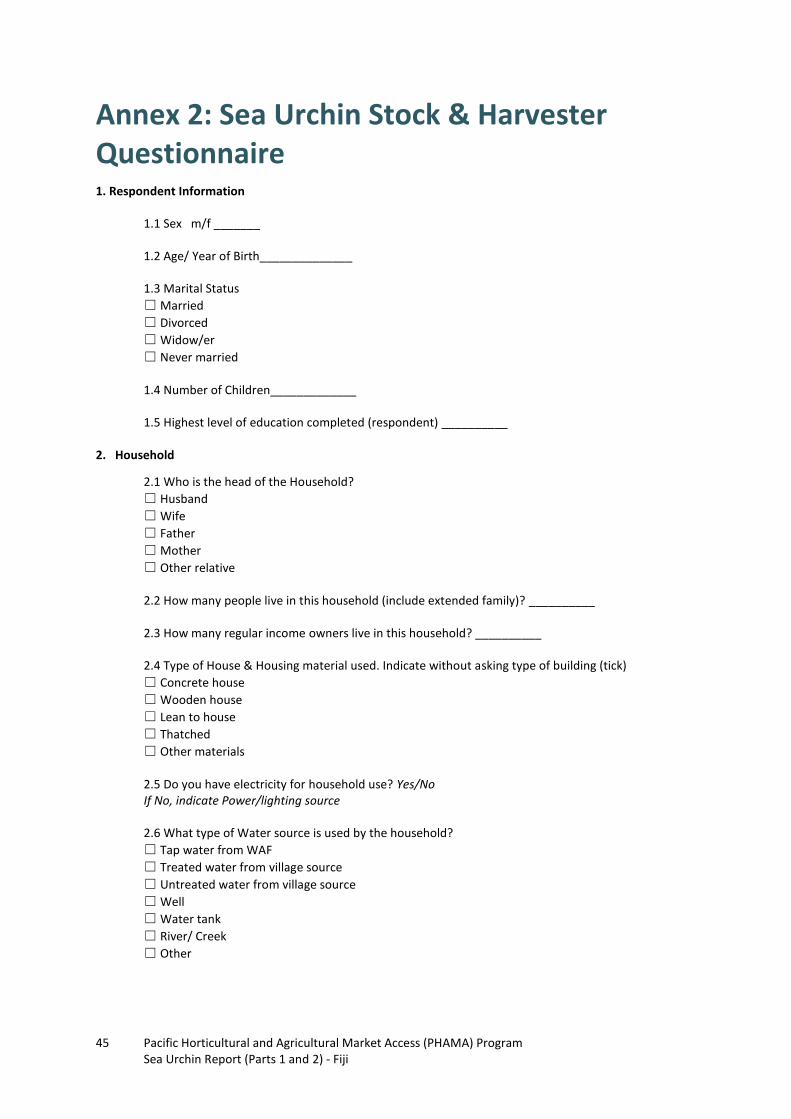
45 Pacific Horticultural and Agricultural Market Access (PHAMA) Program Sea Urchin Report (Parts 1 and 2) - Fiji
Annex 2: Sea Urchin Stock & Harvester Questionnaire 1. Respondent Information
1.1 Sex m/f _______
1.2 Age/ Year of Birth______________
1.3 Marital Status
☐ Married
☐ Divorced
☐ Widow/er
☐ Never married
1.4 Number of Children_____________
1.5 Highest level of education completed (respondent) __________ 2. Household
2.1 Who is the head of the Household?
☐ Husband
☐ Wife
☐ Father
☐ Mother
☐ Other relative
2.2 How many people live in this household (include extended family)? __________
2.3 How many regular income owners live in this household? __________
2.4 Type of House & Housing material used. Indicate without asking type of building (tick)
☐ Concrete house
☐ Wooden house
☐ Lean to house
☐ Thatched
☐ Other materials
2.5 Do you have electricity for household use? Yes/No If No, indicate Power/lighting source
2.6 What type of Water source is used by the household?
☐ Tap water from WAF
☐ Treated water from village source
☐ Untreated water from village source
☐ Well
☐ Water tank
☐ River/ Creek
☐ Other

46 Pacific Horticultural and Agricultural Market Access (PHAMA) Program Sea Urchin Report (Parts 1 and 2) - Fiji
2.7 What type of Toilet facility is used by the household? Tick
☐ Flush and with dwelling house
☐ Flush and outside dwelling house
☐ Water seal
☐ Pit toilet
☐ Other
2.8 What type of kitchen facility is used by the household?
☐ Indicate the type of kitchen facility available and used
☐ Separate room in the main dwelling house
☐ Separate structure outside the main dwelling house
☐ Attached to the main dwelling house
☐ Both indoor & outdoor kitchen available and used
2.9 What do you use for household cooking? Tick
☐ Gas
☐ electric stove
☐ kerosene stove
☐ firewood
☐ Combination of all
3. Harvesting Effort and Catch
3.1 How old were you when you first started collecting Sea Urchin? _____ yrs 3.2 Have you been collecting sea urchin every year since then?
☐ Yes ☐ No How many years have you been collecting for? _____ yrs Why? _____________________________________________________________
3.3 Where do you collect your Sea Urchin from?
☐ Reef top
☐ Lagoon
☐ Reef Flats
☐ other
3.4 How do you collect Sea Urchin?
☐ Hand collection
☐ Scoop net
☐ Spear
☐ Hand
☐ Net
☐ Other
3.5 Do you collect Sea Urchin with anyone? ☐ Yes ☐ No If so, with whom (tick all that apply)
☐ Husband
☐ Father
☐ Brother
☐ Other family member
☐ Wife
☐ Mother
☐ Sister
☐ Friend
☐ Buyer
☐ Other ______________________

47 Pacific Horticultural and Agricultural Market Access (PHAMA) Program Sea Urchin Report (Parts 1 and 2) - Fiji
3.6 Do you select a certain size/ weight of Sea Urchin to harvest? 3.7 How many/much Sea Urchin do you usually harvest on a trip? 3.8 How many hours per day (on average) do you spend collecting Sea Urchin?
☐ <1 ☐ 1 ☐ 2 ☐ 3 ☐ 4 ☐ 5 ☐ >5 3.9 How many days per week (on average) do you spend collecting Sea Urchin?
☐ 1 ☐ 2 ☐ 3 ☐ 4 ☐ 5 ☐ 6 ☐ 7 3.10 Which months of year do you usually collect/ harvest Sea urchin? (state month) 3.11 How many hours do you spend traveling to and from the harvesting sites (i.e. not including the harvesting time)?
☐ <1 ☐ 1 ☐ 2 ☐ 3 ☐ 4 ☐ 5 ☐ >5 3.12 How do you get to your Sea urchin harvesting area? (tick all that apply)
☐ Foot
☐ Bilibili / Raft Boat (no engine)
☐ Boat (with engine)
☐ Other 3.13 State costs involved in collecting or selling Sea urchins?
One off Costs: Equipment/Supplies Costs
Ongoing costs: Supplies/Transport Costs
3.14 What do you do with the Sea Urchin you harvest? (rank 1-7, 1 for most use)
☐ Eaten by household
☐ sell at market
☐ sell to middlemen /agents
☐ sell to export
☐ sell to restaurant
☐ sell to hotels / resorts
☐ Other
4. Markets/ Preparation & Income
4.1 Which market/s do you sell your Sea Urchin at?
☐ Suva
☐ Lami
☐ Navua
☐ Sigatoka
☐ Nadi
☐ Lautoka 4.2 How do you store harvested Sea Urchin before selling? Record method
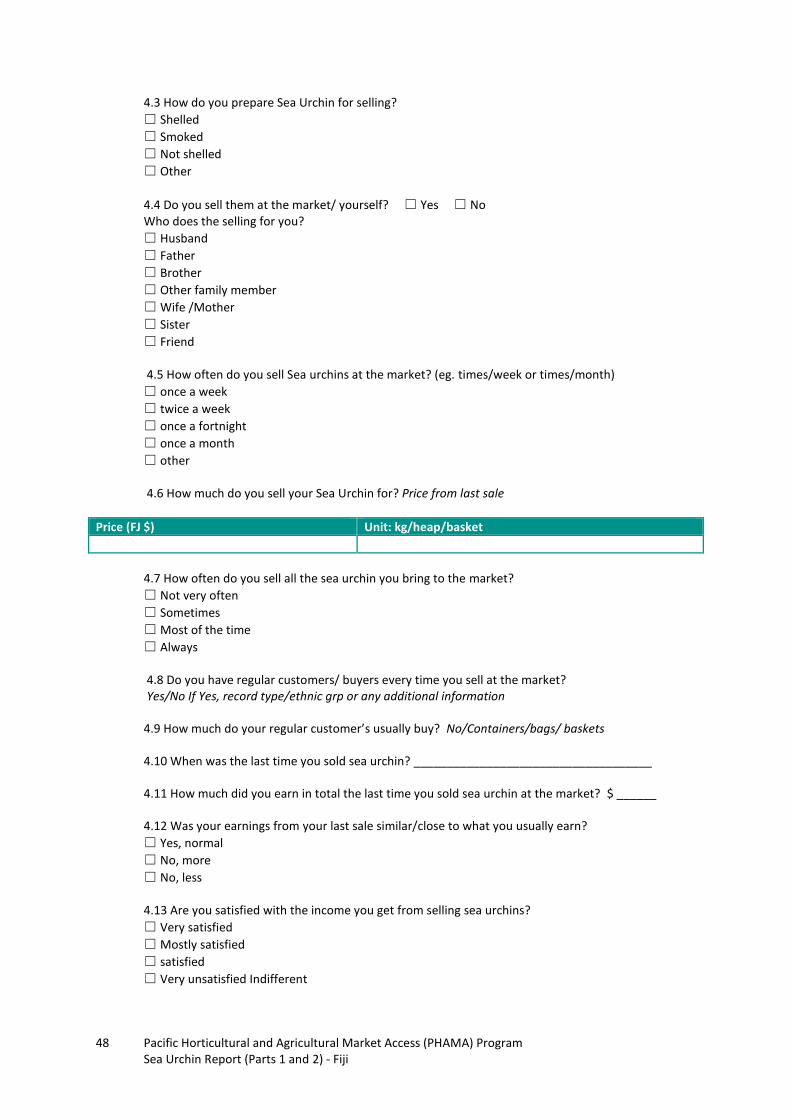
48 Pacific Horticultural and Agricultural Market Access (PHAMA) Program Sea Urchin Report (Parts 1 and 2) - Fiji
4.3 How do you prepare Sea Urchin for selling?
☐ Shelled
☐ Smoked
☐ Not shelled
☐ Other
4.4 Do you sell them at the market/ yourself? ☐ Yes ☐ No Who does the selling for you?
☐ Husband
☐ Father
☐ Brother
☐ Other family member
☐ Wife /Mother
☐ Sister
☐ Friend 4.5 How often do you sell Sea urchins at the market? (eg. times/week or times/month)
☐ once a week
☐ twice a week
☐ once a fortnight
☐ once a month
☐ other 4.6 How much do you sell your Sea Urchin for? Price from last sale
Price (FJ $) Unit: kg/heap/basket
4.7 How often do you sell all the sea urchin you bring to the market?
☐ Not very often
☐ Sometimes
☐ Most of the time
☐ Always 4.8 Do you have regular customers/ buyers every time you sell at the market? Yes/No If Yes, record type/ethnic grp or any additional information
4.9 How much do your regular customer’s usually buy? No/Containers/bags/ baskets 4.10 When was the last time you sold sea urchin? ____________________________________ 4.11 How much did you earn in total the last time you sold sea urchin at the market? $ ______ 4.12 Was your earnings from your last sale similar/close to what you usually earn?
☐ Yes, normal
☐ No, more
☐ No, less
4.13 Are you satisfied with the income you get from selling sea urchins?
☐ Very satisfied
☐ Mostly satisfied
☐ satisfied
☐ Very unsatisfied Indifferent

49 Pacific Horticultural and Agricultural Market Access (PHAMA) Program Sea Urchin Report (Parts 1 and 2) - Fiji
4.14 Who makes decisions on how income you earned from harvesting and selling sea urchin is used?
☐ Self
☐ Husband /Wife
5. Fisheries Dependence
5.1 Do you have any other source of income? Yes/ No if Yes, tick
☐ Paid employment
☐ Sewing & selling clothes
☐ Selling Handicraft
☐ Selling Cooked food
☐ Canteen
☐ Selling grog
☐ Other (state)
5.2 Do you also catch other seafood to sell? ☐ No ☐ Yes List if Yes ________________________________________________________________________________
5.3 In the past week, what other types of seafood did you sell? List ________________________________________________________________________________
5.4 How much did you earn in the last two weeks from selling other seafood? (Make sure respondent does not include money from sale of sea urchin) $_______________
6. Sea Urchin Stock & Management
6.1 At what time of the year is Sea Urchin most abundant in your fishing area? month/ moon/ tide/ season
6.2 Has the number of Sea urchin (abundance) changed over time? ☐ No ☐ Yes Note: “declining badly” means can still find sea urchin but takes time. “Depleted” means there are almost no sea urchin left to harvest.
☐ Increasing greatly
☐ Increasing Stable
☐ Declining badly
☐ Depleted 6.3 Has the average size of sea urchin changed over time?
☐ Increasing greatly
☐ Increasing Stable
☐ Declining badly
☐ Depleted 6.4 Are there times/ seasons when Sea Urchin is not available in your fishing area? Yes/ No, if Yes, Why? ________________________________________________________________________________ 6.5 Are there times/ months/seasons when you refrain / don’t harvest Sea urchin? Yes/No, If Yes/ Why? ________________________________________________________________________________

50 Pacific Horticultural and Agricultural Market Access (PHAMA) Program Sea Urchin Report (Parts 1 and 2) - Fiji
6.6 What do you think are the biggest threats to your sea urchin fishery? Do not give the respondents the answers.
☐ Fishing pressure by villagers
☐ Lack of regulations
☐ Fishing pressure by outsiders
☐ Lack of enforcement
☐ Mangrove degradation
☐ Pollution Others _______________________________________________________ 6.7 Have you received any information on sea urchin biology, life cycles or fishery management training?
☐ No If Yes ☐ state source of information/ training____________________________ If No, What type of information/training would you like to get and be useful to you and your community? 6.8 Has your community made any rules about managing sea urchin fishery?
☐ No ☐ Yes
What are the rules? Who made the rules?
6.9 Are you involved in any decision making in regards to sea urchin fishery?
☐ No ☐ Yes Describe you role in the decision-making? __________________________________________________________________________________