abstracts of oral presentations - welcome to cie...
TRANSCRIPT

Abstracts of Oral Presentations
at
CIE Topical Conference 2018
2018-01-23
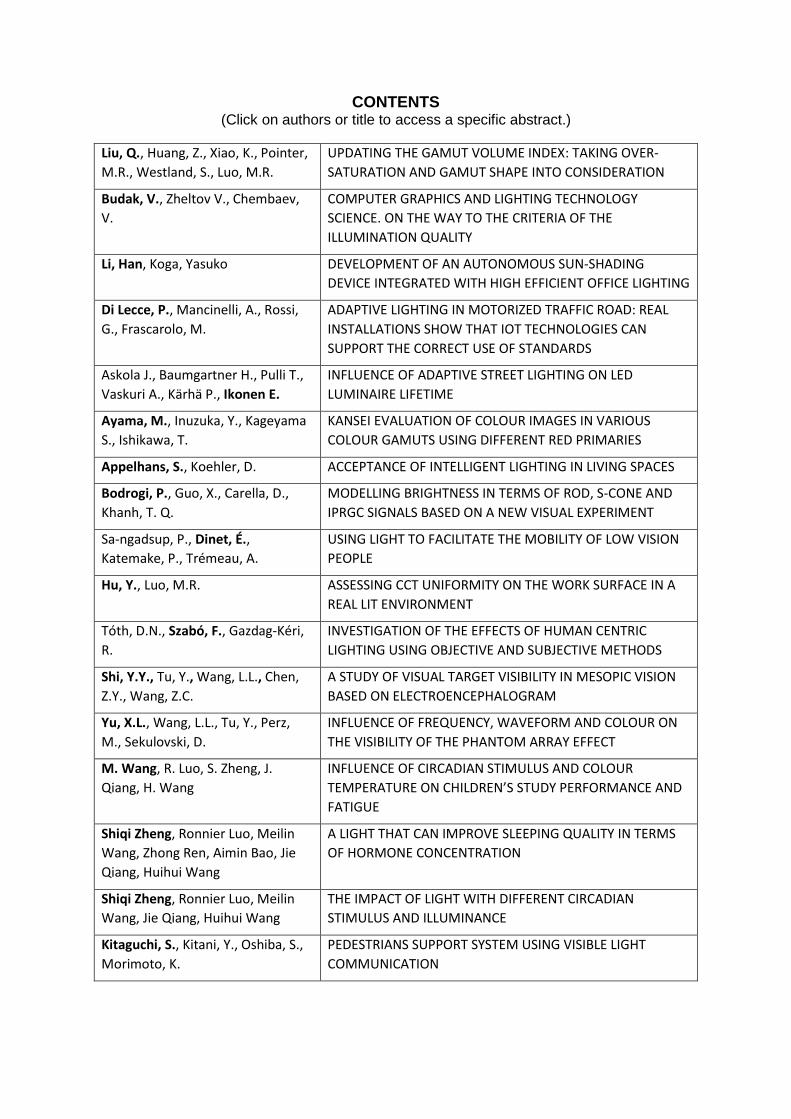
CONTENTS (Click on authors or title to access a specific abstract.)
Liu, Q., Huang, Z., Xiao, K., Pointer,
M.R., Westland, S., Luo, M.R.
UPDATING THE GAMUT VOLUME INDEX: TAKING OVER-
SATURATION AND GAMUT SHAPE INTO CONSIDERATION
Budak, V., Zheltov V., Chembaev,
V.
COMPUTER GRAPHICS AND LIGHTING TECHNOLOGY
SCIENCE. ON THE WAY TO THE CRITERIA OF THE
ILLUMINATION QUALITY
Li, Han, Koga, Yasuko DEVELOPMENT OF AN AUTONOMOUS SUN-SHADING
DEVICE INTEGRATED WITH HIGH EFFICIENT OFFICE LIGHTING
Di Lecce, P., Mancinelli, A., Rossi,
G., Frascarolo, M.
ADAPTIVE LIGHTING IN MOTORIZED TRAFFIC ROAD: REAL
INSTALLATIONS SHOW THAT IOT TECHNOLOGIES CAN
SUPPORT THE CORRECT USE OF STANDARDS
Askola J., Baumgartner H., Pulli T.,
Vaskuri A., Kärhä P., Ikonen E.
INFLUENCE OF ADAPTIVE STREET LIGHTING ON LED
LUMINAIRE LIFETIME
Ayama, M., Inuzuka, Y., Kageyama
S., Ishikawa, T.
KANSEI EVALUATION OF COLOUR IMAGES IN VARIOUS
COLOUR GAMUTS USING DIFFERENT RED PRIMARIES
Appelhans, S., Koehler, D. ACCEPTANCE OF INTELLIGENT LIGHTING IN LIVING SPACES
Bodrogi, P., Guo, X., Carella, D.,
Khanh, T. Q.
MODELLING BRIGHTNESS IN TERMS OF ROD, S-CONE AND
IPRGC SIGNALS BASED ON A NEW VISUAL EXPERIMENT
Sa-ngadsup, P., Dinet, É.,
Katemake, P., Trémeau, A.
USING LIGHT TO FACILITATE THE MOBILITY OF LOW VISION
PEOPLE
Hu, Y., Luo, M.R. ASSESSING CCT UNIFORMITY ON THE WORK SURFACE IN A
REAL LIT ENVIRONMENT
Tóth, D.N., Szabó, F., Gazdag-Kéri,
R.
INVESTIGATION OF THE EFFECTS OF HUMAN CENTRIC
LIGHTING USING OBJECTIVE AND SUBJECTIVE METHODS
Shi, Y.Y., Tu, Y., Wang, L.L., Chen,
Z.Y., Wang, Z.C.
A STUDY OF VISUAL TARGET VISIBILITY IN MESOPIC VISION
BASED ON ELECTROENCEPHALOGRAM
Yu, X.L., Wang, L.L., Tu, Y., Perz,
M., Sekulovski, D.
INFLUENCE OF FREQUENCY, WAVEFORM AND COLOUR ON
THE VISIBILITY OF THE PHANTOM ARRAY EFFECT
M. Wang, R. Luo, S. Zheng, J.
Qiang, H. Wang
INFLUENCE OF CIRCADIAN STIMULUS AND COLOUR
TEMPERATURE ON CHILDREN’S STUDY PERFORMANCE AND
FATIGUE
Shiqi Zheng, Ronnier Luo, Meilin
Wang, Zhong Ren, Aimin Bao, Jie
Qiang, Huihui Wang
A LIGHT THAT CAN IMPROVE SLEEPING QUALITY IN TERMS
OF HORMONE CONCENTRATION
Shiqi Zheng, Ronnier Luo, Meilin
Wang, Jie Qiang, Huihui Wang
THE IMPACT OF LIGHT WITH DIFFERENT CIRCADIAN
STIMULUS AND ILLUMINANCE
Kitaguchi, S., Kitani, Y., Oshiba, S.,
Morimoto, K.
PEDESTRIANS SUPPORT SYSTEM USING VISIBLE LIGHT
COMMUNICATION
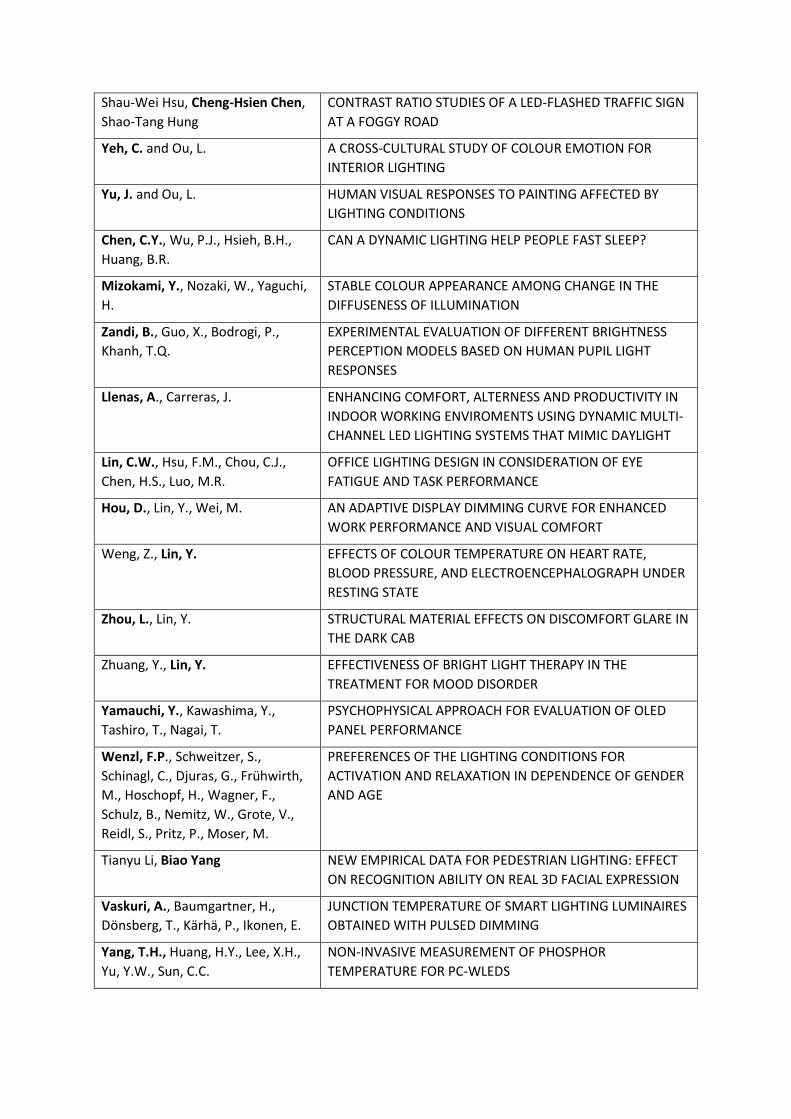
Shau-Wei Hsu, Cheng-Hsien Chen,
Shao-Tang Hung
CONTRAST RATIO STUDIES OF A LED-FLASHED TRAFFIC SIGN
AT A FOGGY ROAD
Yeh, C. and Ou, L. A CROSS-CULTURAL STUDY OF COLOUR EMOTION FOR
INTERIOR LIGHTING
Yu, J. and Ou, L. HUMAN VISUAL RESPONSES TO PAINTING AFFECTED BY
LIGHTING CONDITIONS
Chen, C.Y., Wu, P.J., Hsieh, B.H.,
Huang, B.R.
CAN A DYNAMIC LIGHTING HELP PEOPLE FAST SLEEP?
Mizokami, Y., Nozaki, W., Yaguchi,
H.
STABLE COLOUR APPEARANCE AMONG CHANGE IN THE
DIFFUSENESS OF ILLUMINATION
Zandi, B., Guo, X., Bodrogi, P.,
Khanh, T.Q.
EXPERIMENTAL EVALUATION OF DIFFERENT BRIGHTNESS
PERCEPTION MODELS BASED ON HUMAN PUPIL LIGHT
RESPONSES
Llenas, A., Carreras, J. ENHANCING COMFORT, ALTERNESS AND PRODUCTIVITY IN
INDOOR WORKING ENVIROMENTS USING DYNAMIC MULTI-
CHANNEL LED LIGHTING SYSTEMS THAT MIMIC DAYLIGHT
Lin, C.W., Hsu, F.M., Chou, C.J.,
Chen, H.S., Luo, M.R.
OFFICE LIGHTING DESIGN IN CONSIDERATION OF EYE
FATIGUE AND TASK PERFORMANCE
Hou, D., Lin, Y., Wei, M. AN ADAPTIVE DISPLAY DIMMING CURVE FOR ENHANCED
WORK PERFORMANCE AND VISUAL COMFORT
Weng, Z., Lin, Y. EFFECTS OF COLOUR TEMPERATURE ON HEART RATE,
BLOOD PRESSURE, AND ELECTROENCEPHALOGRAPH UNDER
RESTING STATE
Zhou, L., Lin, Y. STRUCTURAL MATERIAL EFFECTS ON DISCOMFORT GLARE IN
THE DARK CAB
Zhuang, Y., Lin, Y. EFFECTIVENESS OF BRIGHT LIGHT THERAPY IN THE
TREATMENT FOR MOOD DISORDER
Yamauchi, Y., Kawashima, Y.,
Tashiro, T., Nagai, T.
PSYCHOPHYSICAL APPROACH FOR EVALUATION OF OLED
PANEL PERFORMANCE
Wenzl, F.P., Schweitzer, S.,
Schinagl, C., Djuras, G., Frühwirth,
M., Hoschopf, H., Wagner, F.,
Schulz, B., Nemitz, W., Grote, V.,
Reidl, S., Pritz, P., Moser, M.
PREFERENCES OF THE LIGHTING CONDITIONS FOR
ACTIVATION AND RELAXATION IN DEPENDENCE OF GENDER
AND AGE
Tianyu Li, Biao Yang NEW EMPIRICAL DATA FOR PEDESTRIAN LIGHTING: EFFECT
ON RECOGNITION ABILITY ON REAL 3D FACIAL EXPRESSION
Vaskuri, A., Baumgartner, H.,
Dönsberg, T., Kärhä, P., Ikonen, E.
JUNCTION TEMPERATURE OF SMART LIGHTING LUMINAIRES
OBTAINED WITH PULSED DIMMING
Yang, T.H., Huang, H.Y., Lee, X.H.,
Yu, Y.W., Sun, C.C.
NON-INVASIVE MEASUREMENT OF PHOSPHOR
TEMPERATURE FOR PC-WLEDS
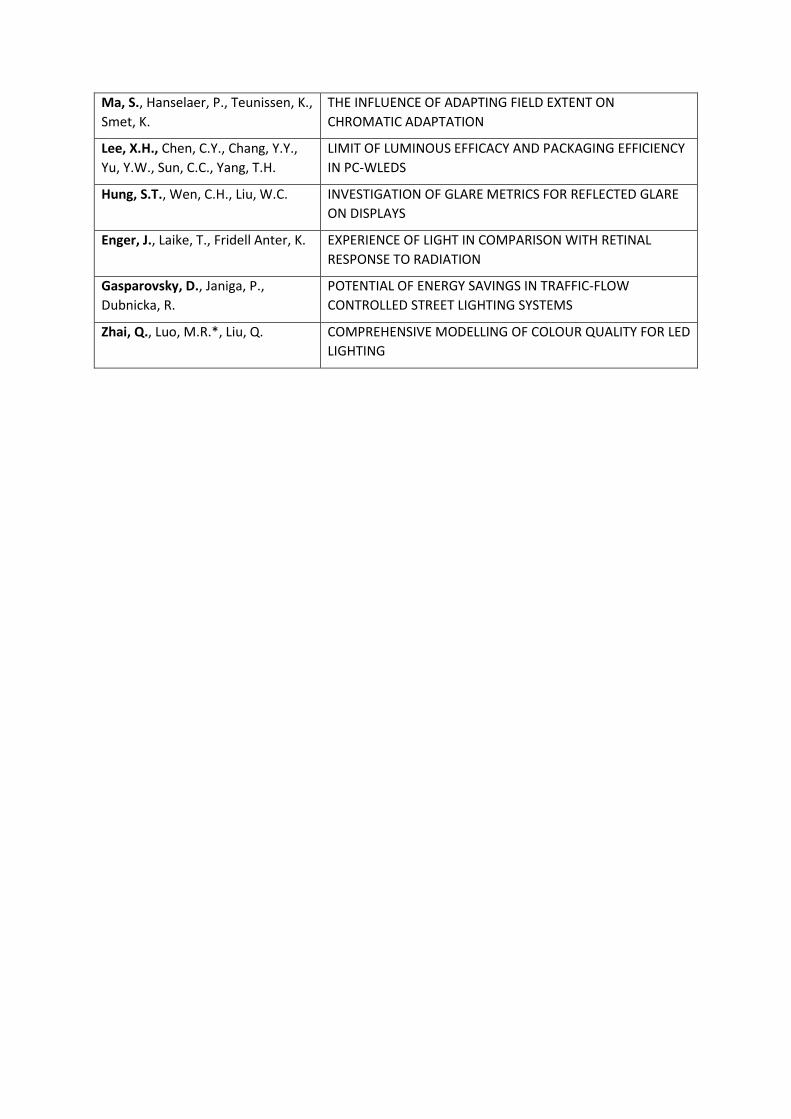
Ma, S., Hanselaer, P., Teunissen, K.,
Smet, K.
THE INFLUENCE OF ADAPTING FIELD EXTENT ON
CHROMATIC ADAPTATION
Lee, X.H., Chen, C.Y., Chang, Y.Y.,
Yu, Y.W., Sun, C.C., Yang, T.H.
LIMIT OF LUMINOUS EFFICACY AND PACKAGING EFFICIENCY
IN PC-WLEDS
Hung, S.T., Wen, C.H., Liu, W.C. INVESTIGATION OF GLARE METRICS FOR REFLECTED GLARE
ON DISPLAYS
Enger, J., Laike, T., Fridell Anter, K. EXPERIENCE OF LIGHT IN COMPARISON WITH RETINAL
RESPONSE TO RADIATION
Gasparovsky, D., Janiga, P.,
Dubnicka, R.
POTENTIAL OF ENERGY SAVINGS IN TRAFFIC-FLOW
CONTROLLED STREET LIGHTING SYSTEMS
Zhai, Q., Luo, M.R.*, Liu, Q. COMPREHENSIVE MODELLING OF COLOUR QUALITY FOR LED
LIGHTING
004
UPDATING THE GAMUT VOLUME INDEX: TAKING OVER-SATURATION AND GAMUT SHAPE INTO CONSIDERATION
Liu, Q.1, 2, 3, Huang, Z.1, Xiao, K.3, Pointer, M.R.3, Westland, S.3, Luo, M.R.4 1 School of Printing and Packaging, Wuhan University, Wuhan, CHINA 2 Shenzhen Research Institute, Wuhan University, Shenzhen, CHINA 3 School of Design, University of Leeds, Leeds, UNITED KINGDOM
4State Key Laboratory of Modern Optical Instrumentation, Zhejiang University, Hangzhou, CHINA
Abstract
1. Motivation, specific objective
Colour preference of lighting is highly related to colour saturation. In a recent study, a colour preference metric, the Gamut Volume Index (GVI), was proposed. Such a measure was derived from a meta-analysis of 8 psychophysical studies with 32 lighting scenarios and it was based on the absolute gamut volume of 14 optimized high-saturated colour samples. The aim of developing this measure was to accurately predict colour preference, not only for metameric lighting scenarios but also for multi-CCT scenarios and its superiority was validated by comparison with 20 existing metrics (CRI, CAM02UCS,
Qa, Qp, Qf, Qg, CRI2012, Rf, Rg, CPI, △C*, GAI, CDI, CSA, FCI, FSCI, MRCI, etc) based on a large
dataset.
However, since the previous study did not pay attention to the impairment of the over-saturation effect and abnormal gamut shape on colour preference, the original version still exhibits poor performance in certain extreme conditions. To solve this problem, in this study, the original GVI has been optimized based on additional psychophysical data, where the lighting scenarios with over-saturated effects or abnormal gamut shapes are included.
2. Methods
The key point of the current work lies in penalizing the over-saturation effect as well as abnormal gamut shapes when calculating the GVI. Two penalizing factors are proposed, one for quantifying the over-saturation effect in terms of gamut volume and the other to represent the abnormality of the gamut shape in terms of the gamut volume intersection with regard to a reference light source.
The data of 7 lighting scenarios with over-saturation effects or abnormal gamut shapes were adopted as the training samples to optimize the GVI while a much larger dataset with more than 60 lighting scenarios (including both metameric lighting conditions and multi-CCT conditions) was collected for further training and testing. The weights of the two penalizing factors were determined by optimizing the weighted average correlation between the metric predictions and the subjective preference ratings for all the psychophysical data.
3. Results
The experimental results showed that the updated GVI outperformed the original version, especially for the conditions where light sources with over-saturation effects or abnormal gamut shapes were used.
In addition, it should be highlighted again that, unlike for colour fidelity, colour preference should not be restricted by a certain CCT, since in many cases observers actually want to choose a favourite light in irrespective of any external criterion. Such a concept correlates well with the recent findings in the field of ‘white’ lighting.
4. Conclusions
Theoretically speaking, it is very difficult to reach a strong conclusion from a single study because of the lack of statistical robustness. That is the reason why a meta-analysis was used in developing the GVI. In this study, a similar protocol was adopted to optimize the original version of GVI with regard to the over-saturation effect and abnormal gamut shapes. The effectiveness of this optimization was verified comprehensively based on a large psychophysical dataset.
006
COMPUTER GRAPHICS AND LIGHTING TECHNOLOGY SCIENCE. ON THE WAY TO THE CRITERIA OF THE ILLUMINATION QUALITY
Budak, V., Zheltov V., Chembaev, V. Moscow Power Engineering Institute, Moscow, RUSSIA
Abstract
1. Motivation, specific objective
At the beginning of the century, it was a great revolution in the design of lighting facilities (LF) - the transition from engineering methods of calculation of lighting facilities to modelling it an on a computer. The foundation of the revolution was laid even earlier, with the formulation of the global illumination equation (J. Kajiya, 1986) which called in the computer graphics - rendering equation. Should be noted that even earlier in 1940 P. Moon formulated this equation for diffuse reflection (the radiation equation), and by Z. Yamauti in 1926 in the discrete form. However, only half a century later, in 1999, the release of the Lightscape program opens a new era in the design of an LF. Lightscape itself did not make a big bang in the lighting design, but it makes a boon for the development of programs that became de facto standard in the modelling of the LF - DIALux, Relux, and others. A feature of many modern programs is that they are not based on the solution of the global illumination equation, but on the modeling of the radiative equation. It leads to the fact that they simulate the illumination. Nevertheless, the human eye reacts to radiance but not to illumination. The next step in the development of LF simulation programs became DIALux Evo, which implements the photon map algorithm, which applies to modelling the global illumination equation and allowing to simulate the radiance directly.
Nonetheless, there is a vicious circle. In most legal documents, the illumination for indoor lighting is normalized, where multiple reflections of light must be taken into account. Radiance, however, normalizes only in external illumination, where there are no multiple reflections, so that radiance should not be considered!
Nevertheless, in addition to the quantitative characteristics of lighting, there are also qualitative ones. The most commonly used in engineering practice is the Unified Glare Rating (UGR). UGR is calculated based on the radiance of the glare sources. Note that it considers only small-sized direct bright sources, while the extended reflections formed during reflection are not included in the UGR model.
As it showed in the classical works on the study of the discomfort of Ferree, 1915, Luckiesh M. and Guth S.K., 1949, it is the space-angular distribution of radiance in the field of view that makes the most significant contribution to the perception of the quality of illumination.
Thus, having the possibility of modelling the spatial-angular distribution of radiance, we can reconsider the approach to determining the discomfort and quality of illumination. As a result, it is possible to set a more ambitious task - the transition from LF design to specified quantitative characteristics to design for a given quality.
2. Methods
In our paper, we considered one of the methods for modeling the global illumination equation - local estimations of the Monte Carlo method. The method is well known in atomic physics and goes back to the work of Kalos, 1963. Further development of the method can be found in the optics of the atmosphere and the ocean in the solution of the radiation transfer equation. Note that the equation of global illumination is a consequence of radiation transfer equation. A similar algorithm for modeling the global lighting equation would be formulated in a phenomenological approach to the work of Keller, 1997. The implementation of the local estimation algorithm showed that it is not biased and converges. Research shows that the algorithms of local estimates are more efficient than direct modeling of the order of 1-2 for many practical problems.
Based on the research, we propose criteria of the illumination quality, based on the generalization of contrast as a ratio of the average contrast gradient to the threshold contrast. The result of calculating the criteria is the number, same as in the case of UGR. However, the absence of an eye model that

takes into account psychophysical perception requires the construction of a scale to determine the perception of this number: good or poorly lit, comfortable or uncomfortable, etc.
For this purpose, we created an experimental facility, which has similar features with the facility in Luckiesh, 1949. With this facility, it is possible to conduct perceptual studies and link the calculated quality criterion with psychophysical perception.
3. Results
To validate the experimental facility, we did the similar experiment as Luckiesh, 1949. Nonetheless, due to the differences between our setup from Lukiesh: the type of source (LED), its chromaticity, the different geometry of the installation, the learning process, etc. - the results of our experiments differed from Lukiesh. Consecutive elimination of these factors showed a shift in the results of research toward the values obtained in the work of Luckiesh, 1949.
In parallel, an additional series of studies of the quality criterion was carried out. At the time of registration of the sensation according to comfort-discomfort scale, the camera was photographed in RAW format, and the radiance of the glare source was measured. Based on these data, considering the calibration curves, a quality criterion was calculated. The results of the studies show that the quality criterion well describes the sharp transition of sensations for radiance at the comfort-discomfort boundary. At the same time, the criterion behaves smoothly in the region of comfortable sensations of radiance. It is a convincing proof of the correct choice of the spatial-angular distribution of radiance as the basis for the criterion of the quality of illumination.
4. Conclusions
Even today it can be argued that the proposed criterion can describe the quality of lighting based on the spatial-angular distribution of radiance, considering the psychophysical perception of the human eye.
The further work is connected both with a collecting of statistics of experiments on the created installation and with the transition to real lighting facilities. On the next steps, we assume modeling of a large extended bright surface, rather than of point glare sources, and an investigation of the behavior of the quality criterion on them.
The result of such studies should be an unambiguous scale describing the distribution of the quality criterion - "good - bad." As a result, even at the design stage of the lighting facilities, it will be possible to assess its quality on the basis of an analysis of the total space-angular distribution of radiance, taking into account multiple reflections of light, rather than on the basis of an analysis of direct glare sources, as it’s implemented in the UGR case.
011
DEVELOPMENT OF AN AUTONOMOUS SUN-SHADING DEVICE INTEGRATED WITH HIGH EFFICIENT OFFICE LIGHTING
Li, Han1, Koga, Yasuko2 1 Graduate School of Human-Environment Studies, Kyushu University
2 Faculty of Human-Environment Studies, Kyushu University Fukuoka, JAPAN
Abstract
1. Motivation, specific objective
Considering the appeal for more energy efficient buildings, it is necessary to reduce the amount of electric lighting in buildings. Utilizing daylight is a means to light the interior of offices building as well as reduce the amount of energy for electric lighting. Besides, solar energy is a means of producing electricity on site, directly from the sun, without environmental harm. But using conventional windows to let daylight come into the building will cause thermal and visual problems.
Facade systems including louvers or blinds can block out daylight in order to reduce the need of cooling the inside of a room and to reduce disruption by glare. However, most of daylight only reaches the part of a room nearest to the window, barely reaching the back of the room. And the intensity of daylight fluctuates greatly over the whole day. It is necessary to take both daylighting and electric lighting into account for office lighting design.
The research is to develop a façade system with a sun-shading device that is autonomously controlled as an integrated solution for daylight and electric lighting. The façade system has photovoltaic sensors on the outer surface of the sun-shading device and can monitor daylight illuminance by using output of the photovoltaic sensors. The photovoltaic cell modules can supply the electric power for the operation of the autonomously controlled façade system.
2. Methods
Firstly, this research examined thresholds of vertical global illuminance for the sun-shading control. The monthly thresholds were obtained from data of daylight illuminance and solar irradiance collected at the International Daylight Measurement Program (IDMP) station in Lyon, France. The monthly thresholds of vertical global illuminance, which considering the effect of seasons and window directions, were drawn as a function of the solar altitude or profile angle for judging whether the windows receive direct sunlight or not.
Secondly, this research proposed a new optimal sun-shading strategy named ‘PV-slat angle’. The ‘PV-slat angle’ is calculated from the solar profile angle and kept the surface of blind slats perpendicular to the direct sunlight.
Thirdly, this research processed illuminance simulations of electric lighting and daylighting. The electric lighting simulation was sat to solve the problem of insufficient daylight in the depths of the room under automatic the sun-shading control. The simulation of the interior illuminance distribution was carried out to examine differences of the electric lighting between control methods using the new PV-slat angle and the common cut-off angle control.
3. Results
Considering effects of the seasons and window directions, the sun profile angle is more suitable as a valuable than the solar altitude for the window facing between the southwest and west (or the east and southeast). But, for the window facing between the southeast and southwest, it is considered that solar altitude is appropriate.
The simulations of the interior illuminance distribution showed the proposed sun-shading control method using the PV-slat angle could provide advantages of building energy performance and visual comfort against the common control method.

4. Conclusions
This research proposes a new concept of a façade system with a sun-shading device that is autonomously controlled as an integrated solution for daylight and electric lighting. The photovoltaic cell module on the outer surface of the sun-shading device is capable of daylight sensing and power supply.
In this research work the orientation of the window was taken into account in the control. Thresholds of vertical global illuminance for judging direct sunlight presence were obtained from daylight measurements at the IDMP station in France. This research also proposes the automatic sun-shading control method named “PV-slat angle”.
Further study is needed to generalize the thresholds of vertical global illuminance. Moreover, the next goal of this research includes development of an intellectual electric lighting system concerning the control methods of the proposed autonomous sun-shading device.
012
ADAPTIVE LIGHTING IN MOTORIZED TRAFFIC ROAD: REAL INSTALLATIONS SHOW THAT IOT TECHNOLOGIES CAN SUPPORT THE CORRECT USE OF STANDARDS
Di Lecce, P., Mancinelli, A., Rossi, G., Frascarolo, M. Reverberi Enetec, Castelnovo nè Monti, ITALY, Reverberi Enetec, Castelnovo nè Monti, ITALY,
INRIM, Torino, ITALY, Roma 3University, Rome, ITALY
Abstract
1. Motivation, specific objective
In the world of Smart Cities and IoT, traditional pre-programmed street lighting dimming systems are perceived as obsolete. Capable of measuring three essential parameters for outdoor areas lighting control (traffic, weather conditions, and road surface luminance), a new generation of sensors is providing, at reasonable costs, opportunities for new approaches in both design and maintenance of road lighting installations.
The standard EN 13201-1:2015 and CIE TR 115:2010, introduced specific chapters about new approaches of Adaptive Lighting: both lighting designers and Municipalities will be now able to operate real time PLMS (Public Lighting Management Systems) through sensors installed within their territories, with benefits in terms of energy saving and increased road safety. The new Italian standard UNI 11248 sets a number of parameters (dimming speed, maximum dimming levels, number and periodicity of samples, calculation parameters, control strategies, etc.) to ensure, in different real time measured conditions, maximum driving safety. The Italian standard introduces two adaptive lighting strategies: the TAI (Traffic Adaptive Installation), where only the traffic volume is measured and the FAI (Full Adaptive Installation), where even weather conditions and road surface luminance are measured. When FAI is being deployed and safety conditions are guaranteed, UNI 11248 allows a downgrade up to 3 lighting classes, corresponding often to 75% dimming of the luminous flux required by the initial lighting class.
Even if these standards are requiring specific real-time measurements, more and more municipalities seem to be attracted by simpler Adaptive Lighting systems, able to detect only occupancy or movements. Clearly, according to standard for motorized traffic roads, this approach should not be considered. Such simple Adaptive Lighting systems well fit, with good results, in parks, gardens, or pedestrian area. On motorized traffic roads, the main driver visual task is obstacle identification, which is proportional to traffic flow and not to lane occupancy or movement.
One reason that didn’t help Adaptive Lighting Systems diffusion was related to lack of technological advanced sensors, which did not give the possibility to install, on road, reliable traffic flow monitor and weather sensors coupled with luminance sensors.
Today, with the help of computer vision technology, this is possible. Unfortunately, sensor cost and limited analysis area are negatively influencing a broader diffusion.
2. Methods
Thanks to EU program LIFE, an innovative approach has been designed and applied in the city of ROME, within EUR district, with the project LIFE-Diademe.
Today, the IoT technology (Internet of Things) is allowing to install, on each lighting pole, low cost sensors, able to detect luminance, traffic flow and weather conditions. All these parameters can be measured in a more accurate way and, above all, in a wide urban area. Within the LIFE-Diademe project, 1000 devices have been installed on 1000 lighting poles, to measure, in a selected area, relevant parameters for Adaptive Lighting. For obtaining a wide records of typical road lighting situation, the tests considers urban contests representing different type of traffic: residential, offices, shops, Public Administration, University, etc.
On-site expert systems analyse streets data and, thanks to the 3 basic evaluated parameters, they adapt street lighting levels in real time mode (measurement and dimming time is executed every minute).
3. Results
To set the base line, a complete lighting measurement campaign has been executed for the 1000 lighting points through EUR Rome. For different pre-set light levels, visual luminance, lighting point luminance, street light uniformity (transversal and longitudinal), pedestrian zone lighting levels and power absorbed by each control panel has been collected.
Then the new LIFE-Diademe system has been installed.
First data about behaviour of the system are showing an approximate energy saving of about 30% compared to pre-programmed dimming cycles, and 50% compared to no dimming. These data are comparable with other Adaptive Lighting installations – designed according to standards – where the most significant result is that in most of the urban roads, for 90% of the time, traffic flow is less than 10% of road nominal capacity.
Thanks to new IoT concepts, data about air quality, noise and pole inclination will also be collected from each lighting point.
4. Conclusions
The LIFE-Diademe project experience will run for one year. This permits to collect a reasonable sets of data. After this period, a new lighting measurement campaign will be performed and, consequently, a Life Cycle Assessment (LCA) and a Life Cicle Cost Analisis (LCCA) analysis will be carried out, in order to asses results, in terms of energy saving, safety, waste reduction, and, finally, sustainability.
023
INFLUENCE OF ADAPTIVE STREET LIGHTING ON LED LUMINAIRE LIFETIME
Askola J.1, Baumgartner H.1, Pulli T.1, Vaskuri A.1, Kärhä P.1, Ikonen E.1,2 1 Metrology Research Institute, Aalto University, Espoo, FINLAND,
2 MIKES Metrology, VTT Technical Research Centre of Finland Ltd, Espoo, FINLAND
Abstract
1. Motivation, specific objective
In adaptive control of street lighting luminaires, their light output is based on the demand of illumination. When there is no traffic, the luminaires are dimmed, but brightened when vehicles or pedestrians appear. This type of lighting control saves energy and reduces light pollution.
LED luminaires should withstand the effects of periodic dimming. However, ongoing dimming and brightening of the luminaires causes thermal stress to the LEDs. Thermal cycling is used in hammer testing to accelerate degradation of the electronics so thermal stress may also shorten the lifetime of luminaires. On the other hand, dimming the LEDs reduces the current through LEDs, decreases the junction temperature, and thus extends the lifetime. The net influence of the contradictory effects is worth studying.
The CIE Research Strategy topic on Adaptive, Intelligent and Dynamic Lighting includes the following research questions: Which types and levels of dynamics are acceptable in a lighting installation? What are the energy and operational costs and benefits of adaptive lighting? The experimental observations in our work contribute to answering these questions.
2. Methods
In our study, we have aged inside at the ambient temperature of (25 ± 3) ℃ a batch of 20 LED street light luminaires from two manufacturers A and B in conditions addressing the effect of adaptive control. The types of the luminaires were chosen to be suitable for highway use. In the ageing test, five luminaires from manufacturer A and five luminaires from manufacturer B are switched on continuously for 9 hours and off for 3 hours. The other sub-batch of 10 lamps is operated in such a way that they are switched on for 30 seconds at full intensity and then dimmed to 20% of the full intensity for 30 seconds. The 30+30 seconds dimming and brightening sequence is continued for 9 hours, after which the luminaires are switched off for 3 hours. The 3-h switched off period is used to cool down the luminaire to simulate the natural cooling during daytime when the street lights are not on.
To study the ageing difference between the periodically dimmed and continuously driven luminaires, their electrical and photometric properties are measured regularly every three to six months. During the starting period, more frequent measurements were made. The measurements are carried out in an integrating sphere for the relative spectral radiant flux, luminous flux, electrical power, and luminous efficacy. When comparing the results for luminous flux and luminous efficacy between different measurement rounds, the relative measurement uncertainty is less than 1 % at 95 % confidence level.
3. Results
Our experiment on ageing the street light luminaires takes place since April 2014. During the first 2 years of ageing, the luminous flux and efficacy of the luminaires gradually increased 2 % to 5 % depending on the sample and manufacturer. During the same time interval no differences could be observed in the optical or electrical parameters between the groups of the periodically dimmed and continuously driven luminaires. Thereafter the situation changed systematically for luminous flux and luminous efficacy.
After 3.5 years of ageing, the periodically dimmed luminaires of manufacturer A show, on the average, 3 % smaller luminous flux than the continuously driven luminaires. The luminous flux values of both groups of five samples are clearly separated, as the spread within a group is well below 1 %. For the luminaires of manufacturer B, a similar clear effect is seen with an average difference of 2 % between the periodically dimmed and the continuously driven luminaires. The group of continuously driven luminaires contained five samples, whereas two periodically dimmed luminaires of manufacturer B were
removed from the analysis, because their flux had suddenly dropped to 70 % of the initial value. All other luminaires are still above 96 % of their initial luminous flux.
For luminous efficacy, similar separate groups of periodically dimmed and continuously driven luminaires were observed as for luminous flux. The changes in luminous flux explain the changes in luminous efficacy. Some trend of grouping in correlated colour temperature values can also be observed. However, the results are not yet conclusive enough to say that there would be a difference in the colour temperature change of periodically dimmed and continuously driven luminaires.
For the predicted 70 % lifetime, an extrapolation can be made on the basis of the presently available data with the result that the lifetime of the continuously driven luminaires would be at least one year longer than the lifetime of the periodically dimmed luminaires. It remains to be seen whether smooth decay of luminous flux or discontinuous changes, as observed for the two periodically dimmed luminaires of manufacturer B, will be the dominating mechanism limiting the lifetime of the luminaires.
4. Conclusions
We have selected the periodical dimming and brightening of the luminaires in such a way that it maximizes the thermal stress in the luminaires in order to be able to study the ageing effects experimentally. In actual street lighting applications the probable number of dimming cycles per given time interval would be much smaller. Nevertheless, our data will give the first published results on the effect of the number of dimming cycles on the predicted luminaire lifetime and can potentially be used to optimize the control of adaptive lighting in order to minimize energy and operational costs.
025
KANSEI EVALUATION OF COLOUR IMAGES IN VARIOUS COLOUR GAMUTS USING DIFFERENT RED PRIMARIES
Ayama, M.1, Inuzuka, Y.2, Kageyama S.3, Ishikawa, T.4 1 Utsunomiya University, Utsunomiya, JAPAN, 2 Utsunomiya University, Utsunomiya, JAPAN, 3 Utsunomiya University, Utsunomiya, JAPAN, 4 Utsunomiya University, Utsunomiya, JAPAN
Abstract
1. Motivation, specific objective
Along with the development of advanced display technology, high resolution and super-wide colour gamut are spreading to our everyday life. ITU-R BT.2020 (Rec. 2020) was established in 2012 for SHDTV broadcast [1]. Its RGB primaries are equivalent to the monochromatic wavelengths of 630nm, 532nm, and 467nm, considering the expansion of laser display although it needs for a while. On the other hand, DCI-P3 has been already implemented in upper models of wide display and mobile phones. Its blue primary is the same as sRGB, green primary is close to 545nm but slightly inside the spectral locus, and red primary is equivalent to the monochromatic wavelengths of 615nm. The wide gamut area, 25% larger than sRGB, is mentioned as the advantage of DCI-P3 [2].
However, in ordinal conditions, and for ordinal observers, KANSEI property of colour images on a display is more important than how wide the colour gamut is. KANSEI is a Japanese word meaning a mental sense of subjectivity, being a higher order function of the human brain. It is interpreted in English as sensitivity, feeling of emotion, or psychological feeling. Preference, naturalness, and impressiveness, etc. are often used as the KANSEI evaluation words. In the previous studies, we investigated the best blue and green primaries from KANSEI evaluation point of view. For blue primary, 470nm is the best as a total, probably because appearance of bluish region (the sky and the sea in the test stimuli) looked nearly unique-blue [3]. For green primary, it was difficult to conclude specific wavelength as the best green primary. It seemed that the most favored colour appearance of green is highly object dependent [4].
In this study, we investigated the best red primary that gives the highest performance in KANSEI evaluation. In the field of visual assessment of lighting, appearance of red object is a key factor of scene evaluation [5,6]. The longer the wavelength, the deeper the red appearance, i.e. less yellowish. It would be interesting to examine whether the longer wavelength primary results the better KANSEI evaluation performace, or there exists some optimum primary that gives the best score.
2. Methods
In the experimental method, test colour images were displayed on the screen using two projectors, one is for the variable red primary, and the other is for the green and blue primaries. Interference filter (IF) of λp = 610nm, 620nm, 630nm, or 640nm was inserted in front of the lower projector to achieve different red primaries. White point of different red primary conditions was set nearly the same by inserting appropriate ND filters in front of the projectors 1 and 2.
Five adjective pairs, deep-pale, beautiful-dirty, like-dislike, impressive-mundane, and natural-unnatural, were used in the KANSEI evaluation. Observers were instructed to evaluate each test image by indicating a score on a seven-point scale (-3 to 3) between two bipolar adjectives. Group1 and Group2 of the test images, each group contains 15 images, same as those in our previous studies, were used [3,4]. So far, 13 observers in their twenties with normal colour vision participated the evaluation experiment.
3. Results
Results of Group1 and Group2 were basically similar to each other. Among the 15 test images, results of “red”, “red-blue”, “red-green”, and “multi-colours” images which include red or reddish objects, indicate significant effect of different red primaries. The red primary of 610nm shows the worst in the results of “Impressive vs Mundane,” and “Deep vs Pale,” evaluations, while 630nm and 640nm show high scores. As a total, 630 nm shows the best. Contrary to that, 610nm shows the best score in “Natural vs Unnatural”

evaluation, while 630 nm and 640nm show low scores most of the cases. Neither systematic, nor significant effect is observed in the results of “Beautiful vs Dirty” and “Like vs Dislike”.
4. Conclusions
It is interesting that nearly opposite tendency is found in different evaluation words pairs. The red primary of 630nm, which is the BT.2020 primary, provides deep colour and impressive feeling, but less natural, and observers do not like them. 640nm shows very similar results. On the other hand, The red primary of 610nm, which is the closest to the DCI-P3 primary, does not give a deep red and impressive, but it appears more natural for most observers. This raises the question that the result of which evaluation word should be taken as the first priority to design colour gamut of display. In addition to that, analysis of pixel distribution of chromaticity is needed as we have done in the previous studies on blue and green primary.
030
ACCEPTANCE OF INTELLIGENT LIGHTING IN LIVING SPACES
Appelhans, S., Koehler, D. Lichtforum NRW Arnsberg, GERMANY
Abstract
1. Motivation, specific objective
While intelligent lighting is possible without HCL, an integral part of HCL is intelligent lighting. Only once the entire illumination – taking a room as the smallest possible unit – , is based on the needs of an individual, all aspects of HCL are taken into consideration. Those are not only the biological-circadian illumination and optimal illumination for the respective visual task, but also the psycho-emotional aspects of light. Therefore, the acceptance of lighting system-based illumination is particularly important in living spaces, as a living space is a private refuge which is designed in consideration of individual tastes. If the illumination is to be “intelligent“, these single lights (i.e. different manufacturers) of have to be incorporated in a system. Yet, an automated scene recognition which ought to offer the optimal respective illumination can cause the user discomfort if the psycho-emotional aspects of light are discarded.
2. Methods
The Lichtforum NRW utilized an online survey as well as a laboratory study within the framework of the network research project “OLIVE” (translated: optimal lighting systems to improve efficiency and health. Funded by Federal Ministry of Education and Research, Germany). The participants of the online survey were asked to rate how useful different illumination types are in five pre-set situations. Their options were chosen from colour temperature (warm, neutral, cold-white), direction (diffused, directional), intensity (bright, dimmed) and atmosphere (atmospheric). Based on the results of this survey, in a laboratory study, test subjects were asked to adjust the illumination in an examplatory living space – a kitchen table – with regard to their individual preferences for three pre-set tasks. The options were CCT, brightness and direction (direct/indirect illumination). The purpose of the examination was to establish whether, in spite of the individual assignment of the separate tasks, universal conclusions with respect to illumination settings could be drawn and whether there are significant differences between these tasks.
3. Results
Tendencies of lighting criteria in application are presented. The analysis of results shows significant differences of illumination level and colour temperature between individual tasks and situations respectively. This confirms the conclusions of the previous online survey, which displayed tendencies and significant differences between lighting settings for pre-set situations. In addition to those differences for respective tasks, there is also major variance within these tasks.
4. Conclusions
The results lead us to the conclusion that general lighting situations can be ascribed to individual situations. Still, the major variance within the situations is indicative of individual requirements and preferences. In order to incorporate HCL into lighting and living space illumination in particular, further examinations of this subject matter are essential.
038
MODELLING BRIGHTNESS IN TERMS OF ROD, S-CONE AND IPRGC SIGNALS BASED ON A NEW VISUAL EXPERIMENT
Bodrogi, P.1, Guo, X. 1, Carella, D. 1, Khanh, T. Q.1 1 Technische Universität Darmstadt, Laboratory of Lighting Technology, Darmstadt, GERMANY
Abstract
1. Motivation, specific objective
In lighting practice, a wide range of luminance levels (from low mesopic up to high photopic luminances) and different light chromaticities can be found. This results in very different spatial brightness impressions of the viewed scene which cannot be described by the quantity luminance (in cd/m2) alone as often pointed out in literature. A new, alternative descriptor quantity for brightness was proposed recently. This quantity combined numeric descriptors of rod (R), S-cone (S) and ipRGC signals depending on luminance level. Optimum model coefficients were estimated based on a previous study.
In the meantime (as it was indicated previously), a series of new visual brightness experiments with different multi-LED spectra were conducted at four different luminance levels (measured on the bottom of the viewing box: 266±1 cd/m2; 25±0.1 cd/m2; 1.6±0.005 cd/m2 and 0.34±0.004 cd/m2). The aim of the present paper is to show and model these new visual brightness results in the above mentioned physiologically relevant R-S-ipRGC-framework introduced previously. In the new experiments, observers assessed the brightness of stimuli of different spectral content but the same luminance at each one of the four luminance levels.
The quantity luminance (in cd/m2 units, in the conventional sense; for the sake of practical applications, alternative models of the luminance signal like V* were not considered) was used to keep the signal of the luminance channel (roughly: a linear combination of the L and M cone signals) of the stimuli (to be assessed visually) constant at each luminance level. The signals of the other channels, R, S, ipRGC, L-M (hence the chromaticity of the equi-luminant stimuli) were varied systematically. The hypothesis that brightness impression changes significantly with the R, S, and ipRGC content of the stimuli was corroborated. The objective of the present contribution is to show the optimum exponent and the weighting of the R, S and ipRGC signals as a function of luminance level to show the way towards a new R-S-ipRGC-based brightness model (which also includes luminance dependence) intended for practical applications. Another hypothesis is that latter brightness model can better predict pupil response than luminance alone. This is intended to be investigated in a parallel paper at the present conference.
2. Method, results and discussion
Two different methods were applied: 1. category rating at the 0.34 cd/m2 level and 2. brightness discrimination procedure at the other three levels (266 cd/m2; 25 cd/m2; and 1.6 cd/m2). The CIE best practice guidance was studied carefully before designing the procedures to avoid bias effects: 1. for category rating, the response range was anchored, 6 categories (even number) were used, the number of stimuli (6) equalled the number of categories (6) and these six stimuli were presented six times in differently randomised orders; and 2. for discrimination: the 20 stimuli to be compared with the reference stimulus were shown twice in two different randomised orders and the order of the test and reference (left/right) was changed in between in order to avoid position bias.
In the category rating procedure (0.34 cd/m2 measured on the bottom of the viewing box), 29 observers of normal colour vision rated each one of the six stimuli by the aid of six categories (6 points: the brightest; 1 point: the darkest). After 20 minutes of dark adaptation, the stimuli were presented for 1 minute after each other in a random order. Six such random orders were used and the sum of the points of all 29 observers x 6 repetitions determined the rank order of the light source. This rank order could be best predicted by the standalone rod (V’) signal. The weighting of the other components, S and ipRGC, did not contribute to the model. Observers were completely immersed in the viewing booth (their position was fixed by a chinrest) and were asked to rate the brightness of the homogeneous bottom. The six stimuli were produced by optimising the LED driving values of a stable, six-channel LED light
engine to provide six very different R, S, ipRGC and L-M signal distributions among the six stimuli at the fixed luminance level of 0.34 cd/m2.
In the brightness discrimination procedure, 37 observers of normal colour vision compared the brightness of 20 different stimuli (provided by a stable 11-channel LED light engine) with a reference stimulus (a stable, high-quality one-channel white multi-phosphor LED at 3800 K) in two adjacent viewing chambers. As mentioned above, two series were carried out at each luminance level (266 cd/m2; 25 cd/m2; and 1.6 cd/m2) with two different randomised orders and different positions of the two light sources (left/right, right/left). The two lower levels were achieved by spectrally neutral shadow masks. The position of the observer’s head was fixed by a chinrest so that each chamber covered a viewing field of 33° x 36°. After 15 minutes of initial adaptation, observers viewed every pair of stimuli for 1 minute. Observers were taught to view both stimuli binocularly by slowly looking back and forth between them (mixed adaptation) and give their answer by assessing the homogeneous viewing booth bottoms.
The 11 LED channels were optimised to obtain 20 stimuli at the same luminance (measured on the bottom of the viewing box) but with very different R, S, ipRGC and L-M signal distributions (hence also different chromaticities). The peak wavelengths of some of the 11 LED channels coincided roughly with the peak sensitivity wavelength of the above mechanisms. First, observers had to tell which side of the double-chamber viewing booth was brighter (forced choice) and then also tell how much brighter, 0 being almost equally bright (difference almost invisible), 1 being a little bit brighter (very small difference), 2 being a bit brighter, 3 being explicitly brighter and 4 being explicitly brighter (a big difference is visible). If the reference was brighter then this number was multiplied by -1 during the evaluation. The sum of these numbers from every observer in the two repetitions determined the rank order of the twenty light sources. This rank order could be best predicted by the model equation in the following way: 1. L-M signals were excluded from the prediction; 2. the exponent of the signals equalled 0.5; 3. rod contribution equalled zero; 4. at 266 cd/m2, the ratio of the ipRGC and S-cone weighting factors equalled ipRGC:S= 1.2:1.0; 5. at 25 cd/m2, this ratio equalled ipRGC:S= 15.0:1.00; while at 1.6 cd/m2, this ratio equalled ipRGC:S= 17.4:1.00. The role of the ipRGC signal and its relationship with pupil behaviour will be discussed in the final paper together with the performance of existing brightness models from literature.
041
USING LIGHT TO FACILITATE THE MOBILITY OF LOW VISION PEOPLE
Sa-ngadsup, P.1, Dinet, É.2, Katemake, P.1, Trémeau, A.2 1 Chulalongkorn University, Bangkok, THAILAND,
2 Univ Lyon, UJM Saint-Étienne, CNRS, Institut Optique Graduate School, Laboratoire Hubert Curien UMR 5516, Saint-Étienne, FRANCE
Abstract
1. Motivation
According to the most recent review conducted by the World Health Organization (WHO) from 2000 to 2010, the number of people of all ages referred to as “low vision” are estimated to 246 million. Two thirds of this population are over the age of 50 and were not concerned by any visual deficiency when they were younger. Concurrent with the increase in the average age of people, growth in the number of persons with visual impairment is unfortunately expected.
A visual impairment can affect the ability to perform simple activities of everyday life as walking safely at home, pouring water in a glass or easily finding familiar and household objects. The quality of life can be dramatically altered and it can be impossible to maintain independence in a safe manner. Yet loss of independence is a predominant concern of the older adult.
Nowadays, existing visual aids are mainly based on all-optical devices even if a few electronic apparatus are available for prescription. Visual aids are specifically designed for magnification for near, magnification for distance and visual field defects. Primary aids for orientation and mobility are canes. They are used by visually impaired travellers to detect obstacles as well as changes in ground surfaces such as drop-offs and sidewalks.
Quite obviously, due to the constraints in their use and due to their lack of portability for some of them, the existing visual aids for low vision do not match the patient’s concerns. Consequently, the challenge is to improve both the usability and the efficiency of equipment in order to facilitate the mobility and the socioeconomic independence of the low vision population.
Such a double improvement is the scope of a pilot project we are currently developing. Our objective is to propose an assistive lighting system to help low vision persons for independent navigation. Our approach attempts to make use of residual vision of patients by exploiting light characteristics to enhance edges of objects forming a real scene. The paper we propose will present and focus on our first studies and results in relation with the psychophysical experiments carried out to determine what light features could be relevant to facilitate the autonomous mobility of low vision people.
2. Method
In our concern in developing a mobility aid for visually impaired people, we considered from different published results that an edge enhancement approach could be an efficient basis for a first pilot study. Then we carried out a psychophysical experiment to study the effectiveness of such an approach.
The experiment consisted in asking participants wearing simulated impairment glasses to walk in a room through a series of obstacles of two types: floor and hanging obstacles to reach a “kitchen” counter in order to make two cups of tea.
The ambient light was produced by fluorescent tubes with a colour temperature of 4000K and the average illuminance at eye level was roughly 300 lux. Ribbon LED tapes were stuck on the edges of each obstacle. All ribbons were set up to obtain white light at about 4000K with an illuminance higher than 300 lux at 1 meter from the source. Objects on the “kitchen” counter were illuminated by the side with vertical fluorescent tubes.
Three groups of 15 observers each with normal vision wearing simulated visual impairment glasses participated in the experiment. Three types of simulated impairments were selected: tunnel vision, central scotoma and blur vision. All participants were naïve and they were familiarized and adapted to the simulated visual impairment glasses during a preliminary training. Then, they received the following instructions: “Walk naturally from the entrance door to the illuminated table at the back of the room.
Avoid any obstacles on the way, try not to contact them. Make two cups of tea. Take one tea bag out from the box, put in the teapot, pour water from kettle into the teapot (mark is provided), bring the teapot to a “dining” table (located 1 meter from the kitchen counter), bring two cups to the table and rinse water from the teapot into the first tea cup and the second tea cup (mark is provided). After that, go back to the entrance door by avoiding obstacles.”. As the observers received a long instruction, they visualized the steps of activities on a monitor before starting the experiment.
The ribbon LED tapes were switched on during the mobility walk course and switched off during the kitchen activity. Then, the return mobility walk course was performed by the participants with raw obstacles (no edge enhancement). Only the “kitchen” counter was illuminated by the side, the “diner” table was lit only by the ambient light.
3. Results
Time to complete the walking course, walking speed (m/s) and numbers of body contact with any object were measured. Parameters such as confusion or repeated instructions were also considered.
Statistical analysis shows that there is no significant differences between the walking speeds when the LED tapes were switched on and switched off for tunnel vision and central scotoma. For the blur vision, the walking speed is decreased when the LED tapes are switched on. For the three groups, the number of body contacts with obstacles increases when their contours are not enhanced by light.
Except for blur vision group who complained about uncomfortable glare produced by the lighting system of “kitchen” counter, participants performed more easily the first part of tea cup making than the second part located on a table only lit by the ambient light. Moreover smaller deviations between the actual level of liquid compared to the expected one were measured for the “kitchen” counter.
4. Conclusions
The first experiment carried out to study the effectiveness of object contour enhancement based on illumination techniques provided interesting and promising results which confirmed that light could be efficiently used to facilitate the autonomous mobility of low vision people. This motivated new experiments with low vision people to extend the study with the scope to develop smart lighting systems designed as a mobility aid for visually impaired people.
042
ASSESSING CCT UNIFORMITY ON THE WORK SURFACE IN A REAL LIT ENVIRONMENT
Hu, Y.1, Luo, M.R.1 1 State Key Laboratory of Modern Optical Instrumentation, Zhejiang University, Hangzhou, CHINA
Abstract
1. Motivation, specific objective
Uniform light distribution is an important parameter of lighting quality. The extent of uniformity frequently depends on the function of the space and the type of activities. Normally only illuminance or luminance uniformity is considered. With the recent development of multichannel LED lighting technology, spectral power distribution (SPD) become tunable. Therefore, many parameters of light can be precisely controlled, such as light density, correlated colour temperature (CCT) and colour rendering index (CRI) etc. It is now possible to produce different levels of nonuniform CCT distribution with completely uniform illuminance.
The present study is a continuation of the earlier study on illuminance uniformity under indoor lighting. There are three goals in this study: to investigate how human eye assesses CCT uniformity on a work surface, to find an appropriate method to evaluate CCT uniformity, and to propose tolerance of an acceptable CCT uniformity for lighting design.
2. Methods
The experiment was carried out to study the uniformity of CCT in an office-like room. The work surface had a size of 1.6m x 0.8m x 0.75m. The room was lit by twelve 11-channels LED illuminators. Each illuminator can be individually controlled and can produce white light varying CCT from 2000K to 20000K. Due to the mired (micro-reciprocal) scale is a better measure of perceptual colour difference of white lights than the CCT scale, the LED system is used to produce a smooth variation CCT in mired scale along the work surface of a desk. All lighting conditions were accumulated at two CCT levels, with 4000K and 4800K at the middle of work surface respectively. At each CCT level, lighting conditions were divided into 9 levels of uniformity, which were 0.99, 0.95, 0.88, 0.83, 0.76, 0.70, 0.66, 0.60, and 0.53 in terms of min-max ratio. The average illuminance of all light distributions was 600 ± 25 lux.
Twenty normal colour vision observers were asked to assess each lighting condition in terms of acceptability, uniformity, and comfort. All observers were the students at Zhejiang university. They had an average age of 25 ranged from 21 to 34.
Each observer viewed the test lighting conditions following a random order. They were first asked to undertake a short task, which was to finish a 6 by 6 Schulte table. It was only used for observers quickly adapt to the lighting, and the results were not subsequently analysed. Observers were then asked to answer three questions: 1. Do you think this lighting environment is acceptable for office lighting? (Yes or No) 2. How uniform is the work surface? (1~5) 3. Do you feel the light comfortable or uncomfortable to work on? (-3~3). Question 2 was answered using a five-point categorical scale: 1. very uniform, 2. just notice non-uniform, 3. small non-uniform, 4. non-uniform, 5. very non-uniform. After answer the questions, next light was presented. All light distributions were repeated in another session. It took 1.5 hrs to finish two sessions for each observer. There was a break of 5 minutes in between.
3. Results
Wrong decision was used as a measure to quantify observer variation for the comfort and acceptability ratings. The results showed that for intra-observer variation, the mean results were 0.19 and 0.11 for comfort and acceptability respectively. While the mean results of inter-observer variation were 0.24 and 0.21 respectively. It is expected that the intra-observer variability is more consistent than inter-observer variability for both attributes. The observer variation of uniformity rating was quantified by STRESS value. Inter-observer variation ranged from 10 to 29, with a mean STRESS value of 17. While intra-observer variation ranged from 14 to 38, with a mean STRESS value of 22. This indicates that the uniformity rating results are reliable and repeatable.
Mean observer estimates were calculated for all light distributions. The results showed that comfort rating correlated well with non-uniformity rating (R2 = 0.970). It indicates that a more uniform light distribution on CCT will be more comfortable. Various uniformity metrics have been compared with the mean score of non-uniformity rating. The mired range performed the best to evaluate the non-uniformity of CCT regardless of the CCT level (R2 = 0.970). Other metrics were also found to agree well with the perceived non-uniformity rating. However, their non-uniformity ratings at two CCT levels did not coincide, unlike the mired range. Therefore, the latter is proposed to evaluate uniformity of CCT.
Two methods were used to obtain the acceptable uniformity of CCT. According to the relationship of unacceptable rate and mired range, lighting condition with smaller mired range is more acceptable to observer. And 50% unacceptable level corresponded to range value of 56.5 MK-1. Another method to obtain acceptable uniformity was via comfort rating. Neutral point of comfort rating corresponded to non-uniformity score of 3.362, which led to a range value of 55.8 MK-1. Two threshold values of acceptable uniformity agree very well. So, it can be concluded that the uniformity of CCT is acceptable when mired range is smaller than 56 MK-1. Normally the CCT is more familiar than the mired value. Therefore, the kelvin ranges for different target CCT were also provided to produce comfortable lighting. For instance, the acceptable range of 6500K has a range between 5500K and 7950K, and between 2767K and 3275K for 3000K.
4. Conclusions
Experiment was conducted to assess three perception attributes including uniformity, comfort and acceptability under a series of CCT-nonuniform lighting. From the above results, the following conclusions can be drawn:
Observers feel more comfortable when light distribution to have a more uniform CCT.
The mired range performed the best to evaluate the nonuniformity of CCT, much better than those based on CCT.
The uniformity of CCT is acceptable when mired range is smaller than 56 MK-1. A look-up table has been established between the CCT and the acceptance limit in terms of CCTs corresponding to 56 MK-1.
043
INVESTIGATION OF THE EFFECTS OF HUMAN CENTRIC LIGHTING USING OBJECTIVE AND SUBJECTIVE METHODS
Tóth, D.N.1, Szabó, F.1, Gazdag-Kéri, R.1 1 Light and Colour Science Research Laboratory, University of Pannonia, Veszprém, HUNGARY
Abstract
1. Motivation, specific objective
The absence of natural light is a possible source of serious health problems. In today’s society working in night shifts or in closed workspaces illuminated only by artificial light sources is common. To avoid the negative impacts on health, human centric lighting aims to support the proper circadian function of the users. In this case study a custom implementation of human centric lighting for industrial use had been investigated in terms of effects on the users. The custom developed luminaires can provide continuous fading between light settings with different spectra, circadian effect and intensity. The investigation included objective measurements and questionnaires to assess the subjective experiences of the participants.
2. Methods
During the experiments objective and subjective methods had been used. The experiments had two stages; one stage using a static, LED tube lighting system at 4100K CCT and one using the human centric luminaires. Results of these measurements and questionnaires were later analysed individually and were compared between the two stages.
Effects of the lighting had been evaluated based on the heartrate changes of the users which was recorded during working hours using heartrate-monitoring smartwatches. The circadian effect of the different spectra had been calculated from the spectral power distributions. Paired-samples t-tests had been used to prove the statistical differences between the heartrate measurements under the LED tube lighting and human centric lighting, and Pearson’s correlation had been used to confirm the differences and to prove the effect of lighting on heartrate.
The subjective feeling of alertness of the participants had been assessed using questionnaires which had to be filled on Tuesday and Friday. The morning shift’s questionnaire had been divided into two time intervals in the morning and the afternoon shift’s into three because the different light settings in these intervals. The answers of the questionnaires had been coded for evaluation in statistical software and had been analysed using Spearman’s correlation and variance analysis.
3. Results
The statistical difference of the heartrate measurement results in case of the human centric luminaires and the LED tube lighting had been proven using paired-samples t-tests. The morning and afternoon shifts were tested separately. The result was in both cases a significant statistical difference of the data pairs (P < 0.01). Since the objective measurements and calculated descriptive data are high measurement level variables in statistics, the evaluation of the heartrate data and circadian effects had been done via Pearson’s correlation. The correlation between the circadian effect of the human centric lighting and the heartrate measurement could not be evaluated because the 2-hour delay in the light’s effect caused the effect of the morning shift’s lighting transition to fall outside the time interval of the heartrate monitoring. The heartrate data recorded during the afternoon shift under the human centric lighting had a moderate positive correlation with the circadian effect (correlation coefficient: 0.4, P < 0.01). The moderate strength of the correlation could be acknowledged to the fact that heartrate is affected by other factors – for example movement during measurement – besides lighting. The changes in the effect in comparison to the LED tube lighting were further confirmed by the correlation between the heartrates measured under the two lighting systems. The morning shift’s heartrate data under the LED tube lighting had a strong positive correlation with the data measured under the human centric lighting (coefficient: 0.75, P < 0.01). This result could be acknowledged to the aforementioned delay in circadian effect. Due to the delay the measured heartrate in case of the human centric lighting belonged to a constant circadian effect as well. The same comparison in case of the afternoon shift’s
measurement data resulted in a moderate positive correlation (coefficient: 0.41, P < 0.01). The decrease of the correlation confirmed the relation between the effect of light and the heartrate measurement.
The questionnaires assessing subjective experiences about human centric lighting had questions which assessed the lighting’s support of productivity, the users’ feeling of alertness and ability to concentrate, glare, disturbing effect of glare, amount of disturbing shadows, subjective relaxing effect of the light, hours of sleep and coffee intake. With the variance analysis the following significant (P < 0.05) connections had been found: feeling of alertness and time during afternoon (P = 0.005), feeling of alertness and relaxing effect of light during both shifts (P = 0.028 and P = 0.001), support of productivity and feeling of alertness during both shifts (P = 0.001 and P = 0.000). The correlation analysis on the afternoon shift’s questionnaire answers further confirmed the connection between the subjective alertness, and the light’s calculated circadian effect (correlation: -0.21, P < 0.01) and between the alertness and relaxing effect (correlation: -0.252, P < 0.01). A positive significant correlation had been shown between the ability to concentrate and the support of productivity (correlation: 0.272, P < 0.001). These results mean that the participants perceived their productivity to be lesser and the light to be more relaxing when the effect on the circadian system decreased.
4. Conclusions
The results of questionnaire analyses clearly show a connection between circadian effect the human centric lighting’s continuously changing light settings and the participants’ subjective feeling of alertness and their productivity. The participants perceived their own ability to concentrate and their productivity to be significantly better when the light had more stimulating effect on the circadian system. The participants’ exhaustion over time had been shown from the answers as well.
The effect of lighting had been proven using objective measurements besides the questionnaires. A significant moderate correlation between the circadian effect and the heartrate changes had been shown. The moderate strength can be acknowledged to other factors which influence the heartrate.
As a final result it can be concluded that the continuously changing light of the human centric luminaires indeed have an effect on the users’ circadian system. This hypothesis was confirmed by both the objective and subjective evaluation methods.
050
A STUDY OF VISUAL TARGET VISIBILITY IN MESOPIC VISION BASED ON ELECTROENCEPHALOGRAM
Shi, Y.Y.1, Tu, Y.1, Wang, L.L.1, Chen, Z.Y.1, Wang, Z.C.1 1 Joint International Research Laboratory of Information Display and Visualization, School of Electronic
Science and Engineering, Southeast University, Nanjing, China,
Abstract
When driving in dark environment, the loss of visual attention may cause traffic accidents, thus the visibility of detailed targets on road is important for driving safety. Research on environmental factors affecting visual target visibility can contribute to road safety.
This study aims to explore changes of brain activity when subjects recognize visual target in mesopic vision. Furthermore, the impact of contrast and eccentricity of visual stimulus on electroencephalogram (EEG) signal, reaction time and detection rate is discussed.
A visual Go/Nogo experiment is conducted in the study. Scenes with visual stimulus (a 20cm*20cm grey square) and dark road background were used as Go trails, while single dark road background scenes without visual stimulus were used as Nogo trails. Go trails consisted of 9 types of stimulus, including 3 contrast levels (achieved by adopting square targets with different grey levels) and 3 eccentricities. The 9 types of stimulus were represented 60 times for each in randomized order. Subjects were asked to step the pedal as quickly as possible once they detected the stimulus, and to refrain from responding if no stimulus was detected.
Before the experiment, subjects went through a 5-minute adaptation to get used to the dark environment. In the experiment, 600 trails, consisted of 540 Go trails (3 contrast*3 eccentricity*60 repetitions=540 trails) and 60 Nogo trails were displayed. These 600 trails were split evenly into 4 blocks. In each block, 135 Go trails (3 contrast*3 eccentricity*15 repetitions =135 trails) and 15 Nogo trails randomly appeared for 1000ms for each preceded by a variable inter-stimulus interval (ISI). The duration of each ISI was randomly selected from 1500ms to 2500ms. There was a 60-second rest period among blocks to prevent fatigue.
Two digital projectors were used in this experiment, with one displaying the dark road background, and the other displaying visual stimuli target. Dark road background was a uniform road with 3 lanes in constant low light environment with average luminance of 0.95cd/m2. A 20cm*20cm grey square used as the visual stimulus was presented on the road with 3 levels of contrast (expressed in Weber contrast between square target and road background: 0.1, 0.2, and 1.6) and 3 eccentricity (expressed as visual angle: -3.8°, 0°, and 3.8°corresponding to left, middle, and right lane). In the experiment, 10 volunteers (6 female, 4 male) were recruited from Southeast University in Nanjing, with their age ranging from 22 to 27(mean=23.6, SD=1.56). Subjects were seated in front of a 295cm*220cm screen in a dark laboratory. The viewing distance was 1.65m.All the subjects had (corrected to) normal visual acuity over 1.2.E-prime software was used to generate experimental program and collect response time of each trail. Only response made within 200~1000ms duration after the onset of visual stimulus was recorded as correct response. Neuroscan amplifier system was used to record EEG signal with 11 electrodes according to International 10–20 System during the whole experiment.
The detection rate (DR) and reaction time (RT) of different contrasts and eccentricities were calculated for statistical analysis. DR was the percentage of trails with correct response in 60 trails. RT was the average correct response time in 60 trails. Repeated measure ANOVA showed that the influence of contrast was significant on both DR and RT. DR increased, and RT decreased significantly when contrast increased. While the influence of eccentricity was not significant. This may because the eccentricity used in the experiment was too small to show the difference. Furthermore, literatures suggest that the influence of the eccentricity is smaller in mesopic vision than photonic vision.
Results of EEG signals were prepossessed into event-related potential (ERP) signals and group averaged according to contrast, eccentricity and response. Obvious P300 component was observed in Go trails with correct response, while absent in Go trails with no response and Nogo trails. Considering that P300 component is widely accepted as an indicator to reflect the allocation of cognitive resources

in earlier studies, the peak amplitude and peak latency of P300 was selected for analysis in the study. Repeated measure ANOVA showed that contrast influenced the amplitude and latency of P300 significantly. At central locations, such as Cz, CPz and Pz, the amplitude of P300 increased and the latency of P300 shortened significantly when contrast increased. The enhanced amplitude indicated increased allocation of cognitive resources, thus could explain the increased DR, and shortened latency was consistent with decreased RT. Same as DR and RT, the influence of eccentricity was not significant on ERP signals either.
In conclusion, the study showed that P300 component directly related with visual target visibility in mesopic vision. It was influenced by contrast between the visual stimulus and background significantly.
051
INFLUENCE OF FREQUENCY, WAVEFORM AND COLOUR ON THE VISIBILITY OF THE PHANTOM ARRAY EFFECT
Yu, X.L.1, Wang, L.L.1*, Tu, Y.1, Perz, M.2, Sekulovski, D. 2 1 School of Electronic Science and Engineering, Southeast University, Nanjing, China,
2 Philips Lighting Research, the Netherlands
Abstract
Temporally modulated light can give rise to three temporal light artifacts (TLAs), being flicker, the stroboscopic effect and the phantom array effect, also known as ghosting. The phantom array effect which is the focus of the current study, is defined as “change in perceived shape or spatial positions of objects, induced by a light stimulus the luminance or spectral distribution of which fluctuates with time, for a non-static observer in a static environment.” For instance, when making a large eye movement (saccade) over a small light source directly in an otherwise dark environment, such as a backlight of a car at night, which light output is temporally modulated with a square periodic waveform, the light source is perceived as a series of spatially extended light spots. The phantom array effect is visible in a frequency ranged up to about 2500 Hz, which means that it can occur at frequencies above the critical flicker frequency, i.e. 80 Hz.
In this paper, we present a perception experiment, in which we studied the influence of frequency, waveform and colour of light output of a LED source on the visibility of the phantom array effect. The results can be used to help finding an optimal balance between temporal light quality and design of driving electronics; the latter one having an impact on cost of LEDs, their efficiency, physical space and lifetime.
Two small LEDs were mounted in front of a black panel, with a vertical distance of 80 mm from each other. There were two white dots, positioned 550 mm horizontally to the left and right of the LEDs that served as fixation points. Subjects were seated at 1.5 m in front of the LEDs, resulting in a viewing angle of 40° between the two fixation points, and a 0.17°of each LED. During the experiment, subjects were asked to make rapid saccades over the LEDs and between the fixation points. The experiments used 2-alternative forced choice method. One of the LEDs generated a constant light output (DC) and the other modulated light (AC), in random order, and subjects’ task was to indicate which LED produced the phantom array effect. The visibility threshold, defined as the modulation depth at which participants could detect the phantom array effect with a probability of 50%, was measured using a weighted 3 up 1 down staircase method. Each staircase always started with full modulation depth. Additionally, a few practice trails were included before the actual start of the experiment, to familiarize the subjects with the task.
This study consisted of 2 sessions. In session 1, visibility thresholds of temporally modulated light with a sinusoidal waveform and a square waveform with 50 % duty cycle were measured, at six frequencies, including 80 Hz, 160 Hz, 300 Hz, 600 Hz, 900 Hz and 1200 Hz. The colour of light was white. In session 2, visibility thresholds of sinusoidally modulated light waveforms, at three frequencies of 100 Hz, 900 Hz and 1800 Hz, and with three different colours, being white, red and blue, were measured. Due to methodological limitations, session 2 was divided into three sub-sessions; in each sub-session one colour was tested. The luminance of the LEDs in both sessions was 1400 cd/m2. 10 subjects participated in both sessions, 6 males and 4 females, with age ranged between 22 and 27.
Results of session 1 show that, the visibility thresholds of both sinusoidal and square waveforms follow a U-shape function of frequency. The thresholds are the highest at the lowest frequency of 80 Hz, having modulation depth of 59% for sinusoidal, and 39% for square waveforms. Then, the thresholds decrease, reaching a minimum at around 600 Hz, having modulation depth of 23% for sinusoidal, and 18% for square waveforms. Above the frequency of 600 Hz the thresholds increase, reaching modulation depth of 46% for sinusoidal waveform and 26% for square waveform at frequency of 1200 Hz. Furthermore, we found that, the visibility of the phantom array effect, measured in the current study, could be predicted using the results of spatial contrast sensitivity function (CSF).
Next to that, the visibility thresholds of square waveforms are smaller compared to sinusoidal waveforms of the same frequency, which means more readily visible phenomenon with square waveforms. In earlier
studies of flicker and the stroboscopic effect, researchers have already revealed that, knowing the threshold of sinusoidal waveforms, it is possible to predict the threshold for square waveforms by dividing it by the amplitude ratio of the fundamental frequency of square and sinusoidal waveforms. Since the phantom array effect is partly produced also by periodic fluctuations of light, we want to check whether this prediction also works with the phantom array effect. Thus, the ratio of the visibility threshold of a square over a sinusoidal wave at the same frequency were calculated. Results show that, the ratio is smaller than the inverse of the amplitude ratio. This could be explained by the fact that, in some situations, higher harmonic Fourier components, which subjects were sensitive to, also played important roles. Based on what were found, we hypothesize that the threshold of a given waveform depends on the amplitudes of all Fourier components.
Results of session 2 show that, visibility thresholds measured for blue light are significantly higher than thresholds measured for red and white light, while no significant difference was found between latter two. Comparable to results of session 1, a U-shape dependence on frequency was measured for all the three colour conditions.
To ensure that the light has a high temporal quality, the occurrence of unwanted TLAs, including the phantom array effect, needs to be prevented. The results of the current study help to understand when this effect is visible, by showing its dependency on frequency, waveform and colour.
054
INFLUENCE OF CIRCADIAN STIMULUS AND COLOUR TEMPERATURE ON CHILDREN’S STUDY PERFORMANCE AND FATIGUE
M. Wang1, R. Luo1*, S. Zheng1, J. Qiang2, H. Wang2 1 State Key Laboratory of Modern Optical Instrumentation, Zhejiang University, Hangzhou, CHINA
2 Opple Lighting Co, Ltd.
Introduction
Over the years, researchers have strived to find the relationship between the lighting parameters and human biological and psycho-physiological responses. More intensive studies have been carried out after the finding of intrinsically photosensitive retinal ganglion cells (ipRGCs) which contains the photopigment melanopsin. The mechanism behind lighting and human biological performance is now becoming more clearly. It was also reported that since children’s lens have a higher transmittance than adults’, they may be more sensitive to lighting than adults. Some research results showed that lightings to have the same level of circadian stimulus (CS), adolescent have more melatonin suppression that that of adults.
In this study, the spectral power distributions of lightings were specially designed by optimising CS and CCT using a spectrum tuneable LED system. Furthermore, considering the daily life of primary school student, different testing methods surrounding study performance and eye fatigue were designed. Five different lighting conditions were investigated in this study according to three CCTs (3000, 4000 and 5000K) and two CS levels (0.2 and 0.4). They were designated as 3000K0.2CS, 3000K0.4CS, 4000K0.2CS, 4000K0.4CS and 5000K0.4CS, having a lux level of 500 at desk level. The melanopsin illuminance of each lighting source were 29, 34, 37, 53 and 65 respectively. Three different aspects of testing methods were adopted to evaluate study performance and fatigue: cognitive tasks, eye fatigue measurement and subjective questionnaire.
Methods
The experiment was set up in a typical office room at the university. The windows were covered with heavy curtain so daylight was cut off from the room and the only light source was an 11-channel spectrum tuneable LED lighting system on the celling. Twelve junior students including 6 girls and 6 boys have a mean age of 9.3 took part in the experiment. There were 5 different lighting conditions so that each participant came to the lab at 5 different days at a certain time period of each day. Each participant was asked to keep a regular sleeping schedule during the experiment.
Comprehensive methods were used in this experiment. For cognitive performance, d2 test was used to measure the attention and concentration level. Reading novels, painting colour and copying textbooks were adopted as the metal load tasks, which were similar to the routine work at school. Critical flicker frequency (CFF) and near point accommodation (NPA) were used to measure the degree of eye fatigue. SpO2 was measured by an oximeter which represent the degree of brain fatigue. Visual performance was measured by the Landolt rings with different size and orientations of gap generated by a computer software. Subjective questionnaires were also conducted including three parts: mood (sad\happy\angry\fun\laughing (exciting)), sleepiness (shown by 5 different pictures) and eye fatigue (eye uncomfortable\blurred vision\body pain).
The procedure was as following. Before the formal experiment, a 10-minutes training session was conducted to familiarize the testing methods. Participants then had a 5-minutes adaptation. And then did the questionnaire and the four fatigue tests to establish the base line result. Subsequently, they did the d2 test and three mental loads tasks which took about 65 minutes. Finally, eye fatigue and questionnaire were again measured. Each session lasted about 120 minutes. In total, 38 hours were spent and the whole experiment lasted about 1 week.
Results
The task performance results showed that CS had a significant effect on two tasks (d2 and reading speed), i.e. participants had a higher d2 score under higher CS lighting (p=0.024, M-U test) and also faster reading speed under high CS lighting (p=0.029, M-U test) on both 3000K and 4000K. This implies that a higher CS lighting help to improve concentration and alertness which may cause a better study
performance. CCT also produced great effect on d2 test because 4000K lighting to have the highest score among all the CCTs especially comparing to 5000K (p=0.011, M-U test). This indicates that 4000K is a suitable CCT for children to raise attention.
For eye fatigue tests, CFF and NPA represent the difference between the post- and the pro-measurement. The larger the CFF and NPA difference values are, the heavier eye fatigue participants will feel after the tasks. Both CFF and NPA results showed the trend that a higher CS lighting would cause more eye fatigue than that of a lower CS lighting. The effect on CFF was much stronger than NPA. CFF showed that different CCT levels have influence on it (p=0.086, K-S test) and there was significant difference between 3000K and 4000K (p=0.044, M-U test), i.e. 4000K to have the highest CFF value (the highest eye fatigue) amongst all the lightings.
Participants performed better visual capacity test under a higher CS lighting, especially at 4000K. For the fatigue questionnaire “body pain”, 3000L and 4000L lighting caused higher body pain than 3000H and 4000H. Among all the CCTs, 4000K is more beneficial for higher visual acuity. Lighting source didn’t have significant effect on SpO2.
For different questionnaires, only “laughing” (excitement) showed a significant impact. A higher CS lighting made participants feel more exciting comparing to a lower CS lighting (p=0.031, M-U test).
Conclusions
Children tend to have higher concentration level and more excited under higher CS lighting conditions, but also higher CS lightings may lead to more fatigue.
Children’s cognitive performance may not improve at higher CCT level. They had the highest attention level at 4000K lighting condition.
Among all the CCTs, 5000K caused lower eye fatigue on children.
Among all the methods in this experiment, d2 test was the most effective test to evaluate the cognitive performance, CFF was the most effective test for measuring eye fatigue.
Both subjects’ attent ion level and eye fatigue had a significant weak negative correlation.

055
A LIGHT THAT CAN IMPROVE SLEEPING QUALITY IN TERMS OF HORMONE CONCENTRATION
Shiqi Zheng1, Ronnier Luo1*, Meilin Wang1, Zhong Ren2, Aimin Bao2, Jie Qiang3, Huihui Wang3 1 State Key Laboratory of Modern Optical Instrumentation, Zhejiang University, Hangzhou, CHINA
2 Department of Neurobiology; Key Laboratory of Medical Neurobiology of Ministry of Health of China; Zhejiang University School of Medicine, Hangzhou, Zhejiang, CHINA
3 Opple Lighting Co, Ltd.
Introduction
Experiments were conducted to develop a sleeping light that can create cozy and relaxing atmosphere and to improve the sleeping quality at night. The results showed that people feel more relaxed and sleepy in a low saturated Red-Yellow light than a phase of daylight.
Experiment
The experiment was conducted in a windowless office-like room. Two light conditions were used in the experiment. Both had an illuminance of 180 lux. and had similar circadian stimulus (CS) of 0.16 and about same energy excited by blue LED. One was the 2700K pink-coloured sleeping light, denoted as SP. The other was a 5000K white light as a phase of daylight, designated as SW. Ten participants experienced each lighting condition for three continuous days. Below is the experimental procedure:
19:45 ~20:00 to adapt in a dim light (<10 lux)
20:00~20:05 to collect saliva sample and to answer questionnaire
20:05~21:00 to be free to read the books brought by themselves
21:00~21:05 to collect saliva sample and to answer questionnaire
21:05~22:00 to read their own books
22:00 to collect saliva sample and to answer questionnaire before leaving the office
Next Morning to fill the sleep log
Note that the sleeping activities were recorded using wrist watch.
Five testing methods were used in the experiment: Critical Flicker Frequency (CFF), fatigue questionnaire, Karolinska sleepiness scale (KSS), Pittsburgh Sleep Diary (PSD) and salivary hormones (melatonin and cortisol) concentration.
CFF was used to measure eye fatigue. A smaller CFF reading indicates a more exhausted eye.
The fatigue questionnaire contains ten scales, including tired eyes, sore eyes, irritated eyes, dry eyes, burning eyes, double vision, blurred vision, headache, dizziness and neck/shoulder/back pain. Each scale had a range from 0 to 4, where 0 means no feeling and 4 means strong feeling.
The KSS ranges from 1 to 9, where 1 = “very alert,” and 9 = “very sleepy, fighting sleep, an effort to remain awake.”
The Pittsburgh Sleep Diary (PSD) is a dairy with a set of questionnaires to be completed at bedtime and awake time. The bedtime ones relate to the events of the day. The awake time ones reflect the sleeping period and contain questions like bed and awake times, sleep continuity parameters, sleep quality, wakeup mood and wakeup alertness.
Participants’ saliva sample were collected using the Sarstedt Salivette® Cortisol, code blue system (SciMart, St. Louis, MO). Melatonin ELISA kit (IBL, German) and enzyme immunoassay kit (R&D Systems, Minneapolis, MN) were used to determine melatonin and cortisol concentrations in the samples.

Results
The ANOVA results revealed that for the fatigue questionnaire, two lights did show significant difference for the ‘dry eyes’, for which subjects felt their eyes were drier under SW than under SP. Although the results from the other tests were not significant, there is a trend SP outperformed SW, i.e. participants did show higher wakeup mood, wakeup alertness and better sleep quality under SP than SW.
However, both cortisol and melatonin concentrations supported that SP had significantly better sleep effect than SW. Salivary cortisol level under SP showed a significant lower concentration at 22:00 than those at 21:00 and 20:00, While under SW, salivary cortisol level at different time points did not have significant differences. Note that a lower cortisol level means less stress.
The salivary melatonin results also showed that SP significantly outperformed SW. Under SP, salivary melatonin at 20:00 was significantly lower than that at 21:00 and 22:00, while under SW, only salivary melatonin at 22:00 was significantly higher than that under 21:00. And salivary melatonin level at 21:00 and 22:00 under SP were both higher than that under SW although the difference was not significant.
In summary, the present results from most of the tests suggested that SP outperformed SW to show a positive effect on creating relaxing atmosphere and to feel a higher sleepiness.
056
THE IMPACT OF LIGHT WITH DIFFERENT CIRCADIAN STIMULUS AND ILLUMINANCE
Shiqi Zheng1, Ronnier Luo1*, Meilin Wang1, Jie Qiang2, Huihui Wang2 1 State Key Laboratory of Modern Optical Instrumentation, Zhejiang University, Hangzhou, CHINA
2 Opple Lighting Co, Ltd.
Introduction
It is now known conclusively that light can have a large impact on physiological and psychological effects in human. It is highly desired to design lighting to contribute to good well-being if this can be accurately quantified. CIE has recently recommended 5 illuminances relating to physiological and psychological quantities in SI units, named Lscone, Lmcone, Llcone, Lrod, LipRGC. Based on the active spectrum data for acute melatonin suppression and fundamental knowledge of retinal neurophysiology, Rea et al. proposed a model, named CS, for predicting human circadian phototransduction with the input of 5 illuminances. It considers all the 5 retinal photoreceptors and their supporting neural mechanism. However, since the human circadian system is still not well understood, the CS metric needs further verification. It did not consider the spectral and absolute sensitivity of the non-visual alerting effects of light exposure. The goal of the present study was to compare the impact of the CS and illuminance of lights on human responses and to evaluate the accuracy of CS.
Experiment
The experiment was conducted in a windowless office-like room. The experiment is still ongoing, and the full results will be reported in the full paper. The experiment is aimed to have 17 participant number and the results from seven of them are reported here. Each participant experienced three light
conditions:
(1) a 500lux white light with a CS of 0.241 (Lscone=42.67, Lmcone=144.88, Llcone=169.32, Lrod=105.73, LipRGC=72.70);
(2) a 500lux white light with CS of 0.455 (Lscone=64.51, Lmcone=157.08, Llcone=181.55, Lrod=133.36, LipRGC=115.31);
(3) an 800lux white light with CS of 0.451 (Lscone=43.17, Lmcone=119.42, Llcone=139.52, Lrod=95.20, LipRGC=73.15).
They are designated as CSLIL, CSHIL, CSHIH respectively. For example, CSLIL represents lighting condition of low CS level and low illuminance. The hypothesis is a higher CS or a higher illuminance to show a higher alertness than their corresponding lower one.
The tests used in this experiment can be divided into four categories. These are questionnaires (fatigue questionnaire, Pittsburgh Sleep Diary (PSD) and Karolinska sleepiness scale (KSS)), task performance (acoustic GO/NOGO task, psychomotor vigilance test (PVT) and n-back task), physiological methods (Electroencephalographic (EEG) and Critical Flicker Frequency (CFF)) and biochemical method (salivary cortisol).
Each light condition was separated by at least one week for each participant. The procedure is given below:
12:45~13:00 to adapt in a dim light (<10 lux)
13:00~13:05 to collect saliva sample, EEG baseline and CFF baseline and to answer questionnaire
13:05~13:30 to be free to read the books brought by themselves
13:30~13:32 to collect saliva sample
13:32~14:00 to be free to read the books brought by themselves
14:00~14:05 to collect saliva sample, EEG signal and CFF and to answer questionnaire
14:05~14:30 to be free to read the books brought by themselves
14:30~14:32 to collect saliva sample
14:32~15:00 to be free to read the books brought by themselves
15:00~15:05 to collect saliva sample, EEG signal and CFF and to answer questionnaire
15:05~15:30 to be free to read the books brought by themselves
15:30~15:35 to collect saliva sample, EEG signal and CFF and to answer questionnaire
15:35~16:00 to complete tasks, including Go/NoGo (measuring ERP in the meantime), PVT and n-back
16:00~16:05 to collect saliva sample and to answer questionnaire
Each participant wore a wrist watch, which was used to monitor their sleeping activities, during the whole experimental period.
The PSD was used to monitor whether participants were kept a regular schedule and did not take drugs or drink coffee during the whole experimental period. The fatigue questionnaire contains ten scales, including tired eyes, sore eyes, irritated eyes, dry eyes, burning eyes, double vision, blurred vision, headache, dizziness and neck/shoulder/back pain. Each scale had a range from 0 to 4, where 0 means no feeling and 4 means strong feeling. The KSS ranges from 1 to 9, where 1 = “very alert,” and 9 = “very sleepy, fighting sleep, an effort to remain awake.”
The GO/NOGO task contains 4 trials under each light condition and participants use keyboard to respond. Each trial contained 50 acoustic stimuli and the ratio of go and no-go stimuli were 1:1. The PVT contained two trials. Each trial contained 50 stimuli. The n-back task in this experiment contained numeral 2-back, numeral 3-back and spatial 2-back. These three kinds of n-back each lasted 4 trials. Each trial contained 20 stimuli.
For biochemical method, participants’ saliva sample were collected using the Sarstedt Salivette® Cortisol, code blue system (SciMart, St. Louis, MO). Cortisol concentrations in the saliva samples will be determined using enzyme immunoassay kit® (R&D Systems, Minneapolis, MN).
Results
Due to the fact that some data did not fit normal distribution and had uneven variance, ANOVA test cannot be conducted, and Wilcoxon signed-rank test with 95% confidence interval was used.
It was found that CS had a significant impact on eye fatigue questionnaire. Participants felt a more severe tired eyes and irritated Eyes under CSHIL than CSLIL conditions (P=0.011, P=0.014). Participants also performed better in all the tasks, i.e. shorter reaction time, under CSHIH than CSHIL, but the differences were not statistically significant, similarly for KSS, CFF, EEG.
Wilcoxon signed-rank test revealed that illuminance had a significant influence on n-back task performance while it did not have significant impact on eye fatigue questionnaire, KSS, CFF, EEG, GO/NOGO task and PVT task. Participants had significantly shorter reaction time under CSHIH than under CSHIL for the numeral and spatial 2-back tasks.
In summary, the present results showed that light condition with a higher CS can generate more severe eye fatigue but cannot improve the alertness and task performance. Furthermore, light condition with high illuminance can significantly improve the alertness and task performance while not generating higher eye fatigue. We should use CS with caution. The full results will be reported when the other 10 participants’ results are accumulated.
060
PEDESTRIANS SUPPORT SYSTEM USING VISIBLE LIGHT COMMUNICATION
Kitaguchi, S., Kitani, Y., Oshiba, S., Morimoto, K. Kyoto Institute of Technology, Kyoto, JAPAN
Abstract
1. Introduction
Currently, more than 200 thousand people are in low vision condition in Japan. People in low vision are visually impaired but not completely blind. Their conditions are various, e.g., double or blurred vision, vision distortion, or peripheral vision loss. With the development of the technology, more and more people with low vision use computers and smartphones. Therefore, they are able to find a route to their destination beforehand and, Global Positioning System (GPS) is able to guide them to destinations. However, the accuracy of GPS walking assistance deteriorates in the shadow and inside of buildings. Furthermore, the maps does not indicate any steps and obstacles on the route, and also there could be many difficulties on the road such as barriers for construction works. Written notices or safety cones with vivid colours/ high contrast colours are often used to indicate caution. They are enough for people with normal vision, however they may not be easy to see by people with low vision, particularly in the night. It is important to make more accessible environment for everyone. Information using light and audio message could be more appropriate for people with low vision. However, constant audio message from a speaker could disturb people with normal vision and residents. Therefore, we are developing a pedestrian support system for people with low vision. The system utilizes Visible Light Communication (VLC) with Light-Emitting Diodes (LEDs). VLC is wireless communication using light in the human-visible wavelength ranged from 380 to 780 nm, and is a communication technology which can be incorporated into existing illumination. The directionality of LEDs is suitable for controlling the communication areas. Therefore, by using this system on streets, pedestrians with low vision can not only get helps from the light but also get audio information or caution anywhere they need including shadow and inside of buildings where GPS cannot reach.
In this study, the hearing and questionnaire survey was carried out to understand life style, difficulties in life and also to know needs of people with low vision, particularly during walking outside. From their need, the VLC system was proposed to be incorporated into illuminated bollards which were short, vertical posts placed on the road to control traffics or indication for people with low vision, and also tactile paving with illumination which is guidance, warning tile blocks for visually impaired people. We also proposed styles of receivers which have functions to receive the VLC signal from the light. By connecting receiver to smartphones, pedestrians are able to listen audio information.
2. Methods
The hearing and questionnaire survey was conducted in order to understand the difficulties of people with low vision particularly when they go out, and also their life style and fashion style such as types of bags they use, whether they use smartphone and so on. Based on their answers, the systems: hardware and software, were proposed. The prototypes of VLC system were made. One of them was a system incorporated into illuminated bollard. In order to find appropriate light, visual assessments were carried out by participants with normal vision and low vision. Different colours of LEDs (white or yellow) and luminescent patterns (the number of flash, flash pulse-width, etc.) were compared in terms of glare, flickering, sharpness, tiredness, surround visibility, preference, etc.
3. Results
From the results of the visual assessment, although the differences were found between participants with normal vision and low vision, some of the light found to be suitable for both normal and low vision people. Considering the characteristics of the light, white LED lights whose flash pulse-width of 1.25 ms, flash rate of 3.5 Hz was selected for the bollard. The data signal is superimposed on the blinking light emission of the bollard. The data is transmitted during one flash pulse. The data rate is 125 kbps so that a sufficient volume of data can be transmitted within the time period of the pulse. Because pulse-position modulation (PPM) is a technique that achieves very good average-power efficiency, 4-PPM is used as the signal modulation of the VLC transmitter.

From the results of the hearing and questionnaire survey, it was found that many people with low vision used smartphone therefore a few different types of receivers were proposed which have functions to receive the VLC signal from the light and play audio information.
4. Conclusions
A pedestrian support system for people with low vision were introduced. The system utilizes Visible Light Communication (VLC) with Light-Emitting Diodes (LEDs). VLC is wireless communication using light in the human-visible wavelength range. In this study, the ideas for the system such appropriate lights and receiver are proposed. The support system is still under development. This system will not only used for people with low vision, this could be extended to use for normal vision people to access information such as direction, tourist guide and advertisement.
063
CONTRAST RATIO STUDIES OF A LED-FLASHED TRAFFIC SIGN AT A FOGGY ROAD
Shau-Wei Hsu, Cheng-Hsien Chen, Shao-Tang Hung Center for Measurement Standards, Industrial Technology Research Institute, Hsinchu, CHINESE
TAIPEI
Abstract
1. Objective
LED lighted road in fog is a new challenging issue for road safety, especially for the recognition of traffic sign. This subject is quite complex because of many variables such as concentration of fog, distance between observer and traffic sign, passive or active type of traffic sign, and projection of headlight would influence the visibility. To systematically study the problem, we used an image luminance measuring device (ILMD) to capture the luminance images of a commercial traffic sign under various controllable conditions in an experimental road. We analysed the luminance images with contrast ratio on the ROIs of the traffic sign.
2. Methods
A left-turn traffic sign with flashed-LED function was placed at roadside of an experimental 2-lane road, which was lighted with LED or high pressure sodium (HPS) luminaires. Various levels of foggy environments were generated by several water mist machines along the road. The distance (d) of the traffic sign from the first pole of lighting was varied as 10 m, 20 m, and 30 m. A headlight was additionally used to project low or high beam to the traffic sign.
Under these experimental conditions, many of luminance images of the road were captured for the analyzations of the visibility, which was defined as area Michelson contrast ratios (C) between the sign area, paint area, and background. The luminance images of road were measured with a calibrated ILMD with 10-22 mm focal length. The ILMD was placed at distance of 30 m between the nearest pole, and the height of the ILMD is 1.5 m.
3. Results
The contrast ratio of paint area of the traffic sign to the surround background (Cpb) was defined as an index of influence of fog. The smaller Cpb means the more concentrated foggy environment, and vice versa. The average contrast ratio of paint area to signal area (Cps) can be evaluated as visibility of the traffic sign in the fog level of Cpb.
As both flashed-LED function and headlight off, in clear weather, Cps for the LED lighting case is varied from 0.62 at d =10 m to 0.27 at d = 30 m. This may be originated from the weak vertical illuminance at intermediate position between light poles. For the HPS case, however, Cps for the LED lighting case is varied from 0.67 at d =10 m to 0.49 at d = 30 m. The better contrast ratio of HPS than LED luminaires at intermediate position meets the visibility experience for some drivers.
In foggy environment, as flashed-LED function off, Cps for the LED lighted case is well proportional to Cpb with factor between 0.78 and 0.83 for all distances and headlight status (off, low beam, and high beam). For the HPS lighted case, the factor is between 0.76 and 0.84, which is close to that of LED. This feature may be caused from the nature of a passive, reflected traffic sign.
In foggy environment, as flashed-LED function on, Cps is approximately linear with Cpb for all headlight status. However, the slope (Spb) and intercept (Cpb0) are dependent on the type of luminaire and position of the traffic sign. For LED luminaire, (Spb, Cpb0) are (0, -0.27), (1.13, -0.93), and (1.63, -0.96) for d =10 m, 20 m, and 30 m, respectively. The positive Spb and negative Cpb0 means that in some conditions of fog concentration and headlight status, the visibility is contrarily lowered. This feature suggests more careful drive in these conditions because of bad recognition.
4. Conclusions
In this work, we have measured a traffic sign by an ILMD under various conditions to study the visibility of a LED or HPS lighted road in artificial fog. We defined contrast ratios Cpb and Cps as the level of fog

and index of visibility of the traffic sign, respectively. The analyses on the experimental results show that Cps of passive state of the traffic sign is about 0.8Cpb for all varieties of luminaire and headlight. While Cps of active state is linear with Cpb, and the intercept and slope are fairly dependent on position and type of luminaire.
071
A CROSS-CULTURAL STUDY OF COLOUR EMOTION FOR INTERIOR LIGHTING
Yeh, C. and Ou, L. National Taiwan University of Science and Technology, Taipei, CHINESE TAIPEI
Abstract
1. Motivation, specific objective
The term “colour emotion” has been used by several recent studies to describe a research area investigating the relationship between colour and affective quality of the colour itself (e.g. colour patches) or of the environment/product (e.g. a real-scale lit environment or simulated images). Recent development in this area, however, has involved investigations into emotional responses using methods similar to these studies. It is also agreed in the CIE TC 1-86 technical committee that the use of “colour emotion” will help broaden both the scope of the subject area and the applications in related industries.
The most important finding in this area was perhaps the underlying factors of colour emotion scales. Principal components identified in these studies suggest at least three common underlying factors: hue-related (e.g. warmth, warm/cool, colour heat, temperature), lightness-related (e.g. soft/hard, potency, colour weight) and chroma-related factors (impact, dynamism, clear/greyish, activity, colour activity, colour impact). And It seems clear that colour emotion responses are somewhat culture-independent, showing consistent patterns across the regions.
Most of studies were based on flat colour patches either shown on a cathode ray tube (CRT) display or shown in a viewing cabinet, situated at a darkened room of each experimental site. Little is known, however, as to whether these findings can also apply to interior lighting. LEDs have become a dominant light source and can easily manipulate light colours to create an atmosphere. Can the relationship between light colour and the observer’s response be also consistent and predictable, just like what has been discovered in the conventional colour emotion studies?
2. Methods
To answer these questions, the present study used four Philips Color Blast RGB LED lamps to light an entire experimental room, 3.5m (width) by 2.5m (depth) by 2.3m (height) in size, decorated like a fashion store to provide a context. Observers were asked to rate the room in terms of 4 scales “liking”, “brightness”, “tension” and “dizziness”. This was followed by rating of the observer’s own facial skin using a mirror in the room in terms of 5 semantic scales “like/dislike”, “smooth/rough”, “natural/unnatural”, “young/old” and “feminine/masculine”.
There were 40 light colours used in this study, consisting of 25 white lights and 15 coloured lights. Note that all the 40 light colours had the same luminance value, 300 cd/m2 and that the general colour rendering index (Ra) of the 25 white lights varied between 21 to 60. The 25 white lights were selected to cover 5 Duv levels, -0.02, -0.01, 0, 0.01 and 0.02, and to cover 5 CCTs, 3000K, 3500K, 4000K, 5000K and 6500K. The 15 coloured lights included 5 hue regions, red, yellow, green, blue and purple, and 3 levels of purity based on Illuminant E. Thirty observers, 15 females and 15 males, from National Taiwan University of Science and Technology with various nationalities, participated in the experiment. All observers had normal colour vision. During the experiment, each observer was seated at the room and was asked to wear a grey coat in order to avoid any influence of their clothes colour on the experimental results. For each light colour, the observer was asked to rate the room as well as his/her facial skin using the 9 scales described above after the eyes were fully adapted to the lighting condition. The observer was asked to focus on the wall right before him/her when rating the room but could look around to better appreciate the appearance of the room.
Thirty observers, including 12 Taiwanese and 18 non-Taiwanese, participating the study. The non-Taiwanese observers were from Europe, South America and South Asia.
3. Results
For perceived room characteristics, it shows that Taiwanese observers consistently gave higher rating for “Liking” and “Brightness”, and lower rating for “Tension” and “Dizziness” than non-Taiwanese observers did. For perceived brightness of the room, Taiwanese observers tended to feel the brightest
for white lights at 6500K with a negative Duv, while the results for non-Taiwanese observers did not show such a tendency. For the liking for the room, the highest rating for Taiwanese observers was white lights at 6500K, and for non-Taiwanese observers the highest rating was for those at 5000K.
For perceived facial skin characteristics, it shows that “natural” was most similar between the two observer groups. There is more variation between the two observer groups in “smooth”, “young”, “Masculine” and “liking”. Under blue and yellow lights, non-Taiwanese observers felt that their faces were less smooth than Taiwanese observers. Under purple and red lights, non-Taiwanese observers felt younger than Taiwanese observers. Taiwanese observers preferred their skins under a yellow light, while non-Taiwanese observers preferred their skin under a purple light.
Although there is some difference between Taiwanese and non-Taiwanese observers, the Pearson correlation between the two kinds of observers for characteristics indicated that had significant correlation, except for “feminine/masculine”.
4. Conclusions
The results show that the “colour emotion” for room and facial skin characteristics were similarly agreed by observers of each region in a lit environment. There might be other experimental biases for each dataset collected, such as individual observer’s professional background, age, gender and his/her own definition of colour emotion. To clarify this will require further investigations into the impact of individual difference on colour emotion in a specific context, where the results may reveal how such an impact can influence real-world lighting design applications.
072
HUMAN VISUAL RESPONSES TO PAINTING AFFECTED BY LIGHTING CONDITIONS
Yu, J. and Ou, L. National Taiwan University of Science and Technology, Taipei, CHINESE TAIPEI
Abstract
1. Motivation, specific objective
Lighting as an environmental and architectural element can influence our perception, emotion and behaviour and is extensively applied to interior spaces, where layering lighting plays an essential role in creating a comfortable and appealing atmosphere. There is an increasing demand from the industry for understanding how the combination of accent and ambient lighting can affect the occupant’s visual perception in terms of comfort and attractiveness.
To see how such an issue can be properly addressed, the present study used a small room where a 3D polyhedron object served as a visual task, lit by LED lamps of the typical 3000K colour temperature and various lighting installations. A panel of observers participating in the study were asked to assess the 3D object as well as the experimental room in terms of a set of semantic scales. The psychophysical methods were used to quantify the visual responses.
2. Methods
The present study used a small experimental room, 3.5m (width) by 2.5m (depth) by 2.3m (height) in size, where a 2D painting was displayed to serve as a visual task for the observers. The three walls were grey in colour. The wood veneer floor appeared dark brown. The 2D painting was 41cm (width) by 31cm (height) in size, fixed on centre of a painting distance 1.68m from the ground.
A panel of 30 observers, 15 males and 15 females, with normal colour vision took part in the study, individually conducting visual assessment in the room. During the experiment, each observer was asked to stand in the middle of the experimental room to assess an oil painting in terms of “visibility of details in texture” and “intensity of reflective light”, “clearness” and “Liking”, followed by assessment of the entire room in terms of “brightness” and “comfort”.
An LED ceiling track light (1080lm, 14.8W), with a beam angle of 60 degrees, was used for the accent lighting. The light was located at either of two positions under the ceiling middle. The first position was right on top of the observer, providing a horizontal incident light angle of 0 degree to the painting, as can be seen in the top view of the room. This is called T1 in the study. The second position of the ceiling track light was located to the left side of the observer, with a distance of 1m, providing a horizontal angle of 45 degrees to the painting. This is called T2.
The ambient lighting was provided by indirect lighting from the background wall behind the painting. The background wall was lit by three linear LED light bars, called W in this study, recessed in the ceiling to down light the background wall. Each light bar (36.9W, 1360lm) was 1m in length. All lights used in this study had CCT = 3000K.
There were two light settings in this study. The first setting was that W and T1 were all switched on and were dimmed by changing the currency at the same rate, by 4 steps: 100%, 66%, 33% and 0%. The second setting was that W and T2 was switched on and was also dimmed using the 4 steps described above. The sequence of the dimming settings was randomised in the experiment for each observer.
3. Results
Experimental results show that for W all switched on and dimmed at the same rate, the observer responses were found to have different tendencies between T1 and T2. When T2 was on, the observers tended to see less reflective light, to like the painting more and to feel that the painting was more clearly presented than when T2 was on. This suggests that T2 had a more negative impact than T1 on the painting, the former having a horizontal incident light angle of 0 degree to the painting, and the latter 45 degrees.

Regarding the effect of W, the most preferred light setting was when W provided a medium luminance contrast for the painting, the ratio of vertical illuminance for the painting to the background wall being 3:1. This was when the painting felt most visible in details of texture, the painting being liked most, and the room being rated the most comfortable.
4. Conclusions
The findings described above reveal interesting insight into how the effect of ambient lighting on the visual response can be influenced by the position of lamp providing the accent lighting. The findings can help develop useful guidelines of lighting design for related applications.
079
CAN A DYNAMIC LIGHTING HELP PEOPLE FAST SLEEP?
Chen, C.Y.1*, Wu, P.J.2, Hsieh, B.H.3, Huang, B.R.3 1 Graduate Institute of Colour & Illumination Technology, National Taiwan University of Science and
Technology, Taipei, CHINESE TAIPEI, 2Institute of Imaging and Biomedical Photonics, National Chiao Tung University, Tainan, CHINESE
TAIPEI, 3Graduate Institute of Electro-Optical Engineering, National Taiwan University of Science and
Technology, Taipei, CHINESE TAIPEI,
Abstract
The high-pressure environment in the fiercely competitive society nowadays has increased the number of sleepless people who are influenced the physical and mental conditions because of inadequate rest time. A lot of people therefore seek for medication; however, it would cause bad side effects. It is expected to propose a method with less stimulation but being able to help people fall asleep faster, have sufficient sleep, and effective improve the quality of life.
To enhance the quality of sleep, a dynamic lighting system which could assist people in fast falling asleep is proposed in this study. The dynamic lighting source would periodically change the colour with time. Total 30 participants join in the experiment for 3 sets of experiment. The lighting environment for each experiment contains dynamic lighting (with 30-minutes colour change of red, yellow, and purple), low-colour temperature flat lighting (with illumination 9.1lux and colour temperature 2800K), and complete darkroom. The full experiment lasts for 1 hour, a questionnaire is preceded before and after the experiment, and the brainwave and electrocardiography are measured in the full experiment. The questionnaire is used for the subjective evaluation, and brainwave and the analysis of heart rate variability is regarded as the non-subjective evaluation.
According to the experimental results, the use of dynamic lighting could more easily have the participants fall asleep. A series of discussions aiming at promoting sleep will be preceded in this study to explain the effect of such lighting on sleep through the induction of light source changes to brain and the colour perception of people with closed eyes. Furthermore, such dynamic lighting will be applied to clinic, expecting to help sleepless people.
082
STABLE COLOUR APPEARANCE AMONG CHANGE IN THE DIFFUSENESS OF ILLUMINATION
Mizokami, Y.1, Nozaki, W.1, Yaguchi, H.1 1 Chiba University, Chiba, JAPAN
Abstract
1. Motivation
The recent development of new solid-state lamps including OLED lighting would realize a wide variety of lighting conditions by controlling the spectral power distribution and distribution of light. Especially, OLED lighting would be a surface light source with strong diffuseness. The appearance of object surface could be largely influenced by lighting conditions and object materials. However, it has not been systematically analysed how surface appearance is influenced by the diffuseness of lighting. Our previous study showed that the diffuseness of lighting influenced the appearance of the glossiness and the roughness of an object (ICVS 2017). Here, we specifically focus on the influence of the diffuseness on colour appearance which is one of the important properties of objects.
2. Methods
We examined how the colour appearance of object surface was influenced by the diffuseness of lighting in real miniature rooms. We used two miniature rooms illuminated by a diffused light and a direct light, respectively. We presented a test sample at the center of the room. Test samples were thick square-shape resin patches with sine-wave surface which depth were 1.0, 0.5 and 0 mm. Both glossy and matte surface materials with five colours (red, orange, green, blue, and grey) were prepared for the samples. We tested two illumination colour conditions (correlated colour temperature 4200 K and 3000 K). An observer judged the colour appearance of a colour sample under each lighting condition by selecting a corresponding colour from a Munsell colour chart placed in a separate viewing box illuminated uniformly by the same colour as the test room. Each observer repeated the judgment three times for each condition. Three observers with normal colour vision participated.
3. Results
The results of corresponding colour for test samples were similar in both diffused and direct lighting conditions even if the luminance distribution of the surface was largely changed depending on the diffuseness of lighting and the surface glossiness. This trend was similar in all colour samples and two illumination colour conditions. These results suggest that the colour appearance of samples that we tested was quite stable.
4. Conclusions
Although surfaces appearance such as glossiness and roughness were influenced by the diffuseness of illumination and the surface material of an object, the colour appearance hardly changed, implying stable colour appearance among the change in material and illumination. However, it should be noted that the materials and conditions which we tested in this study are limited and further investigation would be needed to clarify the influence in the wider range of illuminations and materials.
083
EXPERIMENTAL EVALUATION OF DIFFERENT BRIGHTNESS PERCEPTION MODELS BASED ON HUMAN PUPIL LIGHT RESPONSES
Zandi, B.1, Guo, X.1, Bodrogi, P. 1, Khanh, T.Q.1 1 Technical University Darmstadt, Laboratory of Lighting Technology,
Darmstadt, GERMANY
Abstract
1. Motivation
The spectral dependence of the pupil mechanism has a higher sensitivity in the short wavelength range possibly due to the intrinsically photosensitive retinal ganglion cells (ipRGCs). Various research studies have shown that if there are quasi-monochromatic stimuli at a constant luminance calculated by the
V()2° function, then the pupil diameter exhibits wavelength dependence. Further studies with quasi-monochromatic stimuli have shown that this effect disappears when using the luminance calculated by
the V()10° function. However, the time dependence of the ganglion cells’ adaptation process has to be taken into account, as well. The weighted contribution of ipRGCs in the pupil mechanism increases over time and reaches its saturation after 300 seconds of exposure time. Therefore, regarding the evaluation and modelling of the pupil mechanism, the temporal variation of the pupil diameter has to be considered, as well.
In this work, we investigate the accuracy of current brightness models to predict pupil diameter in comparison to classical 10° and 2° photopic luminance. The aim of this work is to find out whether it is possible to establish a correlation between brightness perception and pupil response by adding a time component to the brightness model.
2. Specific objective
The first step is to check the hypothesis whether pupil response can be described in terms of the
luminance signal. For this purpose, luminance is calculated with both the V()2° and the V()10° functions
to check if - in the shorter wavelength range - an increased sensitivity (V()10°) can represent a better description of the pupil mechanism. When determining the pupil diameter, the pupil’s response is divided into a long- and a short-term phase and these phases are examined separately. This separate consideration is probably necessary due to the time-dependent adaption process of the ipRGCs in pupil control.
Next, brightness models from literature are used to evaluate the pupil’s variation in diameter. The null hypothesis is that a correlation between the perception of brightness and pupil diameter can be assumed. To check the null hypothesis, only the pupil’s response in the long phase is considered. Thus, the maximum component of the ipRGCs can be determined in the brightness model equation. The minimum component of the ipRGCs in the model is represented by the short phase pupil response.
As a result, it is expected that an optimized time-dependent brightness model will be derived. In addition to subjective evaluation using questionnaires or brightness adjustment, objective parameters such as pupil response will allow us to design an extended brightness model.
3. Methods and results
A stable 11-channel LED light source is used in a box chamber with diffusely reflecting walls to provide different stimuli with the same luminance (measured on the bottom of the viewing box), but different R, S, ipRGC and L-M weightings. Six different stimuli are presented, each with an exposure time of 330 seconds. A reference stimulus (4000 K) is offered as an anchor between the stimuli for 330 seconds, in order to avoid influences from pre-stimulation. The main stimuli are presented randomly in order to avoid
systematic influence effects. Three different luminance levels 2661 cd/m2, 250.1 cd/m2 and 1.60.005 cd/m2 with homogeneous illumination on the bottom of the chamber are investigated. The two lower levels are achieved with spectrally neutral shadow masks below the luminaire.
The head position of the subject is fixed by a chinrest so that each subject has a constant viewing angle of 33° x 36°. The subject’s gaze position was nearly fixed with a target inside the experimental setup.

The pupil diameter is recorded with a sample rate of 40 Hz and the Eye Tracker System Tobii Pro x3-120.
4. Results
Based on the currently available results, the first null hypothesis which says that the pupil’s response depends on 2° photopic luminance could be rejected. These first results are based on five subjects aged between 25 to 31 years. All subjects had corrected visual acuity of 20/30 or better. Normal colour vision
was tested with Ishihara plates. The pupil’s differences of the right eye |dpupil| between the anchor stimulus and the main stimulus (that contain various amounts of R, S, ipRGC and L-M signals) were
evaluated. These values vary between |dpupil| = 0.3 mm and |dpupil| = 0.8 mm. There was no significant
variation of these pupil difference values among the two luminance levels 250.1 cd/m2 and 1.60.005 cd/m2.
In the detailed manuscript, further investigations (mentioned in the “Method” section), will be described. This will include at least 30 participants by the time of the paper submission in order to provide statistically robust results.
090
ENHANCING COMFORT, ALTERNESS AND PRODUCTIVITY IN INDOOR WORKING ENVIROMENTS USING DYNAMIC MULTI-CHANNEL LED LIGHTING SYSTEMS THAT
MIMIC DAYLIGHT
Llenas, A.1,2, Carreras, J.1 1 Catalonia Institute for Energy Research (IREC), Barcelona, SPAIN, 2 Ledmotive Technologies SL,
Barcelona, SPAIN
Abstract
1. Motivation and specific objectives
Light sources that generate white or coloured light are well known and can be easily found in the marketplace. In recent days, more indicators are appearing that account for the interaction between the spectral power distribution of a light source and different biological systems, such as the human brain, plants or other animals. All these applications, each of them with their own indicators, highlight the importance that a control over the spectral power distribution of the light has in professional environments where the properties of light need to be carefully controlled.
The light source is composed of individually addressable wavelength light channels and a control unit for calculating the Pulse Width Modulation (PWM) weights that need to be sent in order to sculpt the target spectrum (by minimizing the root-mean-square error or RMSE) between the two functions. In this process, several non-linearities occur that generate undesired deviations between target and emitted spectra. Over time (due to age or temperature-driven effects), the type of corrections that need to be undergone are twofold; (i) the LED’s efficiency of each channel decreases differently and (ii) channel colour shifts need to be corrected to accurately reproduce lighting spectra.
Within this work several methods to compensate such differences will be discussed, with strong emphasis on how to use an integrated low-cost colour sensor to monitor changes in the spectral components of the emitted light. This approach may seem counterintuitive since colour sensors measure only colour. However, we use advanced spectral algorithms that show how colour sensors can be used to match spectral shapes, without sacrificing much accuracy as compared to using more expensive devices (spectrophotometers or multi-band sensors).
Finally, the use of these multi-channel luminaires is validated in working environments. In particular, the light engines have been tested in a 24/7 working room over 1 year with a CCT-changing sequence designed for critical-task performing (the spectral shapes have been calculated from the outcomes of the project HI-LED, funded by the European Commission, http://www.hi-led.eu). This technology not only is used throughout the eight-hour shift work in tune with the employees’ biological clock (circadian rhythms) but it also aims at decreasing the task error rate of the workers (which are operators of highly critical environments in production plants).
2. Methods
The tunable light source developed is made of 10 different LED channels, essentially spread all over the most sensitive part of the visible region (400-700 nm). The amplitude of an LED channel is controlled with a pulse-width modulation (PWM) constant current driver with a 12 bit-depth resolution. A low-cost colour sensor is adapted inside the tunable LED light source and can collect a small fraction of the emitted light, after having been mixed by a mixing chamber and a diffuser.
Thus, we have designed a computationally efficient PID controller for accurate spectral fidelity against thermal junction variations and LED luminous flux depreciation. The integrated colour sensor reads real-time information of the colour coordinates and infers changes in the spectral shape, colour shifts and luminous flux variations. All the information is passed to the PID controller and a fine-tune of the weights for each channel is made when differences are found.
To test the light engines in a real environment setup, several luminaires were mounted in the ceiling of a 24/7 working room with 18 employees over a full year. These special luminaires were programmed to follow a pre-defined light sequence adapted to each work shift schedule depending on the time of the day. The lighting sequence changes automatically by gathering every few seconds the local time
information and reproducing the right spectrum accordingly. The degree of comfort and alertness was periodically rated by the workers and the production increment is currently underway. We expect to have further results on productivity that will be presented at the congress.
3. Results
Results prove that the use of complex algorithms combined with low-cost colour sensors in multi-channel LED light engines can give outstanding results in terms of colour quality and spectral fidelity. Our system can reproduce any arbitrary light spectra in the visible range with an accuracy within a 2-step MacAdam ellipse and <5% variation in spectral shape.
The employees under test, were workers performing critical control tasks in a refinery industry, where the lighting conditions are considered to be critical over the day to control the task error rate. The results of this study rate the new lighting system with a 8.6 out of 10, as compared to the old installation. When rated by the room workers, the results are also very promising; they have increased their level of satisfaction in comparison with the previous lighting systems from 6 (old installation) to a rating of 8.13 (new installation) out of 10. As stated before, statistical evaluation of task errors needs longer times and we are expecting to get the results from the company by Q1 2018.
4. Conclusions
Our results show that the use of a controller based on a colour sensor can be used to obtain relative spectral errors and ∆uv' between target and emitted spectra significantly below threshold values (∆uv' < 0.0025 in all cases, or within 2-step MacAdam ellipse).
These smart engines with added intelligence and spectral awareness offer great possibilities to create healthier and more productive living spaces by having a complete control over the full visible spectrum. The methods developed in this work provide tools and robust algorithms for the advent of novel SSL tunable light sources that can be used to improve the working conditions and to boost the levels of alertness and productivity.
093
OFFICE LIGHTING DESIGN IN CONSIDERATION OF EYE FATIGUE AND TASK PERFORMANCE
Lin, C.W.1, Hsu, F.M.2, Chou, C.J.3, Chen, H.S.2, Luo, M.R.4 1 Department of Electronic and Computer Engineering, National Taiwan University of Science and
Technology, Taipei, CHINESE TAIPEI 2 Graduate Institute of Electro-Optical Engineering, National Taiwan University of Science and
Technology, Taipei, CHINESE TAIPEI 3 Graduate Institute of Applied Science and Technology, National Taiwan University of Science and
Technology, Taipei, CHINESE TAIPEI 4 Graduate Institute of Color and Illumination Technology, National Taiwan University of Science and
Technology, Taipei, CHINESE TAIPEI
Lin, [email protected]; Chen, [email protected]
Abstract
1. Motivation, specific objective
People stay in artificial lighting for a long time in modern life. An intelligent lighting in the future possibly considers health and performance of human beings. Many lighting researches discussed health effects and human performance effects of correlated colour temperature (CCT) and illuminance. However, previous spectrums are limited by traditional lighting technologies, such as fluorescent lamp. With tunable LED lighting technology, a designed health-promotion illuminant is possible.
Because intrinsically photosensitive retinal ganglion cells discovered in 2002 mainly go in a non-imaging forming pathway to regulate human body, two lighting metamers look the same may offer different photobiological effects. However, there are seldom researches comparing the health or performance effects of lighting metamers. The objective of this research is a health-promotion office lighting based on eye fatigue and task performance under 12 lighting conditions. These lighting conditions not only vary in CCT and illuminance, but also three different blue-light peak wavelengths, which generates a series of lighting metamers. We are aiming to find the effects of CCT, illuminance and peak wavelengths by statistics. Moreover, IEC 62471 stipulates photobiological safety of lamps and lamp systems and formulates retinal thermal hazard and retinal blue-light hazard. We also intent to check whether retinal blue-light hazard value affects task performance or eye fatigue.
2. Methods
These 12 lighting conditions are built by the mixture of 11 specific narrow-band LEDs. They are designed under 3 independent variables including 2-level correlated colour temperature (4000 K, 6000 K), 2-level illuminance (400 lux, 700 lux) and 3-level blue-light peak wavelength (420 nm, 460 nm, 480 nm). According to IEC 62471, these lightings belong to exempt group (no-risk) and have 12 different retinal
blue-light hazard values (0.217 ~ 0.904 W/m2・sr), which is the forth independent variable.
To measure eye fatigue, we tested (1) subjective questionnaire with 5 questions, and (2) critical flicker fusion (CFF). To measure performance, we tested (3) paper-based Landolt C task performance (task performance is defined as correct ratio multiplies speed), (4) paper-based proofreading correct ratio under three kinds of tasks (Chinese article, random pairs of characters, colourful paired images formed by alphabets), and (5) monitor-based Go/No-Go task performance. 12 subjects (6 males, 6 females, 23 to 25 years old) participated in experiment under each lighting condition for two hours. Eye fatigue test and Landolt C task were performed in the beginning and the end of the experiment. The other task performance tests and several assigned reading works were carried out in the middle.
Repeated measures ANOVA is applied to compare the effects of CCT, illuminance, and blue-light peak wavelength. Pearson correlation and linear regression is applied to verify the effects of no-risk retinal blue-light hazard value. Paired t test is applied to check the difference between the beginning and the end.
3. Results
(A) Eye fatigue
During the two-hour experimental period, subjective feeling “eyes are tired” increases significantly more under 6000 K lighting condition than 4000 K (p = 0.034). The increases are both significant (6000 K: p < 0.001, 4000 K: p < 0.001). Subjective feeling “difficulty in gazing at objects” increases significantly more under 700 lux lighting condition than 400 lux (p = 0.040). The increases are significant under 700 lux condition (p = 0.002) but insignificant under 400 lux condition (p = 0.284). Considering individual difference, the difference of “eyes are tired” is significantly (p = 0.004) low-correlated (R = 0.233) to retinal blue light-hazard value. There is no significant CFF difference in this research.
(B) Task performance
During the two hours, Landolt C task performance significantly increases under 6000 K / 700 lux lighting condition (p = 0.020), but significantly decreases under 4000 K / 700 lux lighting condition (p = 0.044). Performance under 400 lux lighting condition, neither 6000 K nor 4000 K, changes significantly. There is an interaction between CCT and illuminance (p = 0.017).
There are some significant influences on performances among the independent variables. For example, CCT significantly affects Go/No-Go task performance and Chinese articles proofreading correct ratio. These two performances under 4000 K lighting condition are significantly better than 6000 K. Considering individual difference, Go/No-Go task performance is significantly (p = 0.023) low-correlated (R = 0.185) to retinal blue-light hazard value.
(C) Effects of blue light (including lighting metamers and retinal blue-light hazard values)
Since none of the eye fatigue or performance is significant influenced by blue-light peak wavelength, the effect of lighting metamers cannot be proofed in this research. However, retinal blue-light hazard value is significantly low-correlated to eye fatigue and some task performance as mentioned.
4. Conclusions
With tunable LED lighting technology, we designed 12 office lighting conditions with 12 different retinal blue-light hazard values according to 2 CCT (4000 K, 6000 K), 2 illuminance levels (400 lux, 700 lux) and 3 blue-light peak wavelengths (420 nm, 460 nm, 480 nm) and measured eye fatigue and task performance of 12 subjects. Subjective feeling “difficulty in gazing at objects” increases significantly less in a 400 lux environment than a 700 lux environment during two hours working period. Subjective feeling “eyes are tired” increases significantly less in a 4000 K illuminated environment than a 6000 K illuminated environment. “Eyes are tired” difference is significantly low-correlated to retinal blue-light hazard value. Thus, we conclude that a 400 lux and 4000 K illuminated environment (which has the lowest no-risk retinal blue light hazard in this research) is an eyes-health-promote office lighting condition. Task performance is influenced by lighting conditions. Detail results and conclusions will be reported in the full paper.
Retinal blue-light hazard value indeed influences human beings more than blue-light peak wavelength. Since low retinal blue-light hazard value is significantly but low-correlated to performance and eye fatigue. Besides CCT and illuminance, choosing a low retinal blue-light hazard spectrum may be a good strategy. To summarize, we promote that a 4000 K / 400 lux office lighting is the best one within our designed lighting conditions.
096
AN ADAPTIVE DISPLAY DIMMING CURVE FOR ENHANCED WORK PERFORMANCE AND VISUAL COMFORT
Hou, D.1,2, Lin, Y.1,2*, Wei, M.3 1lnstitute for Electric Light Sources, Fudan University, Shanghai, CHINA
2Engineering Research Center of Advanced Lighting Technology, Ministry of Education, Shanghai, CHINA
3Department of Building Services Engineering, The Hong Kong Polytechnic University, HONG KONG
Abstract
1. Motivation, specific objective
Self-luminous display devices, such as tablets, are becoming more and more common in our daily life and are also becoming essential devices in office spaces. This study aims to derive a dimming curve for adjusting the brightness of a display based on the ambient lighting, with a goal to enhance the work performance and visual comfort of users.
2. Methods
This experiment was carried out in an aircraft cab. Six high-power LED floodlights were used to produce five different ambient lighting conditions. The observers completed visual tasks on a display, which was set at five different brightness levels under each ambient lighting condition. Thus, each observer completed the visual tasks under 25 combinations of display brightness and ambient lighting conditions, with five in each trial, with a goal to avoid the visual fatigue caused by the long experiment.
For each combination, the observer performed the work performance test, visual fatigue test, and a questionnaire to rate the level of visual fatigue and visual comfort. Electro-oculogram (EOG) data was collected throughout the experiment and the Critical Fusion Frequency (CFF) test was performed before starting the visual task to evaluate the level of visual fatigue. The observers were asked to read the Ann Fermo J correction table. The hit rate, the false alarm rate, and the duration of the reading were recorded. When the observers completed the task, the CFF was carried out again. The difference of CFF before and after the visual task and characterize the visual fatigue. At the end, the observers completed a questionnaire to rate their level of fatigue and visual comfort. The same procedure was followed under each of the 25 combinations of ambient lighting and display brightness.
3. Results
Analytic hierarchy process was employed to comprehensively evaluate the work performance, visual fatigue and visual comfort of the observers under each condition. A dimming curve was derived to illustrate the optimal brightness level of the display under each ambient lighting condition
4. Conclusions
Psychophysical experiment was conducted to investigate the optimal brightness level of displays under different ambient lighting conditions, with a goal to enhance the work performance and visual comfort. A dimming curve was derived using the analytic hierarchy process.
097
EFFECTS OF COLOUR TEMPERATURE ON HEART RATE, BLOOD PRESSURE, AND ELECTROENCEPHALOGRAPH UNDER RESTING STATE
Weng, Z.1,2, Lin, Y.1,2* 1 Institute for Electric Light Sources, Fudan University, Shanghai, CHINA
2 Engineering Research Center of Advanced Lighting Technology, Ministry of Education Shanghai, CHINA
Abstract
1. Motivation, specific objective
Previous studies reported that light not only influence the subjective feelings but also change people’s physiological parameters. Optical radiation with a high CCT may suppress the melatonin level at night, which affects human circadian rhythm. At the same time, light, especially blue light, may also increase heart rate. This paper aims to investigate the psychological and physiological effect of colour temperature on young people by characterizing heart rate, blood pressure and electroencephalograph (EEG).
2. Methods
Twelve young subjects were recruited for the experiment. During the experiment, the heart rate, blood pressure, and EEG signals were recorded under each lighting condition, with a goal to evaluate the physiological effect of lighting with different colour temperature.
A colour tunable LED lamp was used to produce illumination with different CCT levels (i.e., 2700K, 4000K and 6500K) and a vertical illuminance of 50 lux at the eye level. The three lighting conditions were presented in a random order and each lasted for more than 10 minutes. In addition, the subjects completed subjective evaluations, using six pairs of words to describe the feelings under each lighting condition. Both CES-D and PSQI questionnaires were taken in advanced to assess subjects’ health conditions. The EEG signals were analysed in both time and frequency domains.
3. Results
Subjective evaluation showed that high colour temperature lighting produced higher brightens. The 2700K lighting provided the warmest feeling, and it made subjects more relaxed. The 4000K lighting was the most cheerful.
The heart rate and blood pressure had small fluctuations with significant individual differences. None of them showed significant interaction with colour temperatures.
As for questionnaires, nearly half of the 12 subjects had problems with both depressions and sleep qualities. Thus, subjects were divided into two groups to compare their EEG signals. EEG signal from 60 to 180 seconds was picked up and analysed. Subjects with bad health conditions had higher value of alpha wave and the fluctuations were greater. Subjects with good health conditions had lower and more stable alpha wave. There were significant differences between the two groups. Alpha wave decreased under all light conditions, especially 2700K, which had a more significant drop of alpha wave. The frequency domain analysis of EEG showed that alpha wave moved toward a low frequency range when light changed from high CCT to low CCT.
4. Conclusions
In terms of psychological effects, young people were more likely to choose low colour temperature and neutral white when they relaxed. As for physiological parameters, heart rate, diastolic and systolic blood pressure didn’t show significant interaction with colour temperature (p>0.05). Health conditions could influence EEG value, considering the facts that EEG signal in resting state was higher and more unstable for people with depression or bad sleep quality. Alpha wave in time domain analysis decreased in the before-sleep resting state. 4000K and 6500K had similar reduction of alpha wave. 2700K gave greater reduction of alpha wave value. In frequency domain analysis, alpha wave tended to move towards a lower frequency with low CCT.
098
STRUCTURAL MATERIAL EFFECTS ON DISCOMFORT GLARE IN THE DARK CAB
Zhou, L.1,2, Lin, Y.1,2* 1 lnstitute for Electric Light Sources, Fudan University, Shanghai, CHINA
2 Engineering Research Center of Advanced Lighting Technology, Ministry of Education, Shanghai, CHINA
Abstract
1. Motivation, specific objective
Lighting condition is one of the most essential elements of locomotive cab, where various recognition and detection tasks and delicate operations are carried out. Discomfort glare not only influences the security of the high-speed transportations, but also damages the operator's eye health, which is an urgent problem to be solved in the ergonomics design of lighting environment for locomotive cab. This study aims at exploring the effect of structural material on discomfort glare evaluation in locomotive cabs.
2. Methods
This paper summarizes the common structural material including chromaticity coordinate, reflectance and refractive index as a reference. Firstly, an integrated optical simulation in consideration of lamps, displays and indicator lights was conducted to evaluate and quantify glare indicators using various different materials. Secondly, ergonomics experiments were conducted to verify the relationship between discomfort glare and the reflectance and refractive index of materials by comparing the subjective visual feeling and visual search performance under different samples, all the tests in the dark cab were measured by instrument of high accuracy.
3. Results
It was found that discomfort glare in the dark cab can be improved by adjusting the reflectance and refractive index of materials inside, including direct glare and veiling reflection on the windshield and visual display terminal(VDT). The diffused and light-coloured coating material can extend space visually and improve discomfort glare. The brightness of veiling reflection on the windshield and VDT can be approximately 20 times lower than the existing typical windshield and visual performance significantly improves(P=0.001<0.05). Further, a multiple correlation relationship between discomfort glare and reflectance and refractive index can be built.
4. Conclusions
All the results will provide an effective method for reducing discomfort glare level and improve lighting condition, which can provide anti-glare design proposals, alleviate the visual fatigue of the driver and create a comfortable low-glare working environment.
099
EFFECTIVENESS OF BRIGHT LIGHT THERAPY IN THE TREATMENT FOR MOOD DISORDER
Zhuang, Y.1,2, Lin, Y.1,2* 1 lnstitute for Electric Light Sources, Fudan University, Shanghai, CHINA
2 Engineering Research Center of Advanced Lighting Technology, Ministry of Education, Shanghai, CHINA
Abstract
1. Motivation, specific objective
The mood disorder of depression is a common mental disease, which can be divided into seasonal affective disorder (SAD) and non-seasonal depression. Bright light therapy, as an effective treatment for seasonal affective disorder, has been studied for more than two decades. It has been found that bright light therapy has effective therapeutic effect on seasonal affective disorder, while the effect of bright light therapy on non-seasonal depression needs further investigation. The purpose of this study is to assess the evidence for the effect of bright light therapy on non-seasonal depression and depression oriented people.
2. Methods
This paper laid out two cases of treatment, each carried out with different bright light therapy conditions, based on the condition of effective bright light therapy for seasonal affective disorder. Two bright light therapy conditions were 6000 lux at 4400K with a period of 90 min in the morning and 4000 lux at 4400K with a period of 90 min in the evening. The participants were randomly selected between ages of 18-50 years old, with total number of 30 including 12 males and 18 females, average age at 22.54±(std)5.615. None of the participants took psychotropic drugs before and during the experiment.
Before the experiment, we used the Beck Depression Inventory (BDI), scoring from 0 to 40, to scale the degree of depression, with a higher BDI for a higher degree of depression. Before and after entering the light room, participants were asked to fill in the scale of PANAS (Positive and Negative Affect Schedule) which was used to measure the emotion, scoring from -20 to 20, with a higher score for more positive emotion. Also, we measured blood pressure and heart rate to evaluate the physiological health before and after the experiment.
3. Results
Both two conditions conducted showed significant effect (p<0.05) on the treatment for non-seasonal depression and depression oriented people. Both of the bright light therapy carried out in the morning at 6000 lux or in the evening at 4000 lux can lead to positive mood, raise heart rate, and improve blood pressure. Both of the non-seasonal depression group and depression oriented group showed similar variation (p>0.05) under bright light therapy of the two cases.
Also, there were differences in mood change and improvement before and after two cases of bright light therapy. The effect of evening bright light therapy condition used in this experiment were significantly better than morning bright light therapy condition used (p=0.004 <0.05). Bright light therapy carried out in the evening at 4400K of 4000 lux showed better improvement in the alleviation of non-seasonal depression.
4. Conclusions
The study of bright light therapy for non-seasonal depression and depress oriented people has been carried out. Experiments showed that both two cases reached improvement. Bright light therapy used had positive effect on emotion, leading to significant drop of heart rate and blood pressure. In this study, we obtained an optimum bright light therapy condition: LED light at 4400K of 4000 lux conducted in the evening tend to have good effect on non-seasonal depression and depress oriented people.
In conclusion, it verified the effect of improvement of bright light therapy for people with mood disorder of non-seasonal depression and oriented people.
113
PSYCHOPHYSICAL APPROACH FOR EVALUATION OF OLED PANEL PERFORMANCE
Yamauchi, Y.1, Kawashima, Y.1,2, Tashiro, T.1, Nagai, T.1 1 Yamagata University, Yonezawa, JAPAN,
2 National Institute of Standards and Technology, Gaithersburg, USA
Abstract
1. Motivation
Organic Light-Emitting Diode (OLED) is recently expected as one of the next generation lighting devices. OLEDs have many unique characteristics such as thickness and flexibility. One of the most unique features is that it is a planar, 2-dimensional surface-emitting lighting device. Since the OLED is a panel-shaped lighting device, non-uniformity of OLED is easily detected compared with conventional point or line light-emitting devices. Furthermore, due to the electric properties of the OLED and physical factors in its production process, OLED panels essentially have some non-uniformity in the chromaticity and luminance. Non-uniform current density mediates non-uniformity in luminance distribution, and the interference of the thin layers and films mediates angular dependent colour non-uniformity. Therefore, luminance uniformity inside the panel, and angular dependent uniformity in chromaticity are both important features that should be properly assessed for the performance of the OLED panel.
TC 2-68 has been working to propose appropriate measurement methods of the optical properties of OLED panel. The evaluation of luminance non-uniformity and angular dependent colour non-uniformity have been studied to find an evaluation metric to assess the uniformity of the OLED panel. It would be desirable if such metrics reflect human perceptual characteristics, as they are intuitively comprehensive. Thus, we have conducted several psychophysical experiments which enable us to propose a metric based on human perception.
2. Methods
We conducted two experiments on luminance non-uniformity (Exp. 1) and angular colour change (Exp.2). Both experiments were conducted with an LCD display, mimicking the real OLED panel.
In Exp. 1, we simulated 14 different patterns of luminance gradients to the square shaped stimulus. First the subjects were asked to score the intensity of the observed non-uniformity included in the stimulus. Then, the subjects conducted 2AFC experiment. In this session, the subjects observed a reference stimulus with random pattern non-uniformity and a test stimulus with luminance gradient, and selected the stimulus with larger non-uniformity. The magnitude of the luminance gradient was changed and a point of subjective equality (PSE) was obtained for each gradient pattern.
In Exp. 2, first the angular colour shifts were simulated as a temporally modulated colour change. The colour of the stimulus was modulated temporally along several colour directions. Considering the situation of the evaluation of the panel for angular dependent colour shift, it might be desirable that the observer can freely select the direction of the gaze. We developed a new device for this evaluation. The subject observed a stimulus whose chromaticity (and the shape) was changed according to the orientation of a tablet which the subject could freely manipulate. This mimicked the performance of an OLED panel. Three luminance levels and 8 different trajectories of colour shifts were tested. The task of the subject is to rate the perceived magnitude of chromatic change of the stimulus.
3. Results
From Exp. 1, it was found that, as expected, the larger the luminance gradient, the less uniform the stimulus appeared, and they showed the similar trends regardless of the gradient patterns and directions. However, when compared with a reference pattern, the results showed that uniformity perception was affected to some extent by the gradient patterns. While simple patterns of linear change showed almost the same trends, complex patterns, such as bath-tub or radial change, stimuli whose central area was brighter than its peripheral area had higher uniformity than those with the reverse pattern. These results indicate that the polarity of luminance on central area of the stimulus, whether it is higher or lower than average value, can also be the factor for uniformity perception. This finding is supported by our supplementary experiment, in which subjects were asked to select non-uniform stimulus out of two
different random patterns of the same magnitude. After conducting hundreds of trials, the average images were calculated, and the luminance of the central area was higher for “more” uniform stimulus. A metric based on the luminance gradient has been proposed previously. When compared with a uniformity index based on the maximum and minimum luminance values, the metric based on the gradient showed a better correlation with the evaluation rates.
The results of Exp.2 indicated that the perception of chromaticity change depends not only on its chromaticities but also on the luminance level. The results showed a MacAdam-like ellipse for the overall behaviors. Our findings were installed to the current metric adopted in IEC, which calculated the non-uniformity based on the colour difference among different colour directions. Compared with values predicted by the existing metric, our new model showed some improvement in its performance.
4. Conclusions
According to the results of our psychophysical experiments, it is suggested that not only the luminance gradient, but also the polarity of the gradient is important in non-uniformity evaluation, and it would be better to introduce a hue dependent factor in angular dependent colour evaluation.
In order to take the human perceptual properties into consideration, psychophysical experiments are essential, and we believe that the models or metrics will get improved with such properties.

118
PREFERENCES OF THE LIGHTING CONDITIONS FOR ACTIVATION AND RELAXATION IN DEPENDENCE OF GENDER AND AGE
Wenzl, F.P.1, Schweitzer, S.1, Schinagl, C.2, Djuras, G.2, Frühwirth, M.3, Hoschopf, H.4, Wagner, F.4, Schulz, B.5, Nemitz, W.1, Grote, V.3, Reidl, S.2, Pritz, P.5, Moser, M.3
1 Institute for Surface Technologies and Photonics, JOANNEUM RESEARCH Forschungsgesellschaft m.b.H., Franz-Pichler Straße 30, A-8160 Weiz, AUSTRIA
2 Institute for Economic and Innovation Research, JOANNEUM RESEARCH Forschungsgesellschaft m.b.H., Leonhardstraße 59, A-8010 Graz, AUSTRIA
3 Human Research Institute of Health Technology and Prevention Research GmbH, Franz-Pichler-Straße 30, A-8160 Weiz, AUSTRIA
4 LUMITECH Production and Development GmbH, Technologiepark 10, A-8380 Jennersdorf, AUSTRIA
5 Lightlab of the Institute for Spatial Design, Graz University of Technology, Rechbauerstraße 12/II, A-8010 Graz, AUSTRIA
In recent years, LED lighting became an indispensable alternative to conventional lighting systems. Sophisticated solutions offer not only comfortable white light with a good colour rendering. They also provide the possibility of changing illuminance and colour temperature. Some systems even mimic daylight over the entire day, some including natural variations as due to clouds. Such systems are supposed to support the chronobiological needs of human and to have a positive effect on well-being, performance, sleep-quality and health.
Still, research regarding suitable light-settings for specific situations is still incomplete. Therefore, we investigated the subjective preferences of men and women regarding light-settings for activity and relaxation as examples. We supplied two rooms and four cubes with light sources that provide the possibility of tuning individual light properties like illuminance and colour temperature. Individuals – belonging to four groups differing in gender and age – were asked to imagine activating and relaxing situations for which they were asked to adjust suitable and pleasant lighting by tuning the above mentioned light properties or they were exposed to predefined lighting conditions.
In the first phase we invited 85 persons to participate in the study. They were assigned to four different groups: young men (age from 18 to 30 years, 20 persons), young women (18 to 30 years, 20 persons), old men (50 to 80 years, 22 persons) and old women (50 to 80 years, 23 persons). The subjects were asked to look inside a white cube which was placed in a white room. The light settings of the cube could be tuned via twist dimmers. When the light settings in the cube were modified, the light in the room changed in the same manner For the tests, the participants were asked to imagine situations of
activation and relaxation and to tune either illuminance, colour temperature, or u’v’ (with two of these parameters fixed), or they could change all of those variables simultaneously, while looking into the cube, until they felt comfortable with the light in the cube for the envisioned situation.
In a second phase we invited 50 persons that were seated in the white rooms and were asked to do performance tests and to relax in fixed light situations that were chosen from the results of the first phase. Performance and preference values in the different light situations were deduced from this second phase
to assess the influence of illuminance, CCT and u’v’ on activation and relaxation.
From the results, it becomes evident that there are clear differences in the lighting conditions preferred for two situations of activation and relaxation. Also some combined gender- and age-specific differences, in particular with respect to young women and young men, became apparent.
122
NEW EMPIRICAL DATA FOR PEDESTRIAN LIGHTING: EFFECT ON RECOGNITION ABILITY ON REAL 3D FACIAL EXPRESSION
Tianyu Li, Biao Yang School of Architecture and Urban Planning, Harbin Institute of Technology, Shenzhen, Guangdong,
CHINA
Abstract
1. Introduction
With the technology development of LED lighting, the energy consumption of road lighting in many countries might be reduced by using better lighting. Road lighting need to be provided for pedestrians to ensure a safe walking environment and to meet their visual needs without any unnecessary energy consumption. Recognition of facial expression is an important part of interpersonal judgement, which is considered to be a critical visual task of pedestrians. Past studies investigating the effect of lighting level and SPD on facial expression mainly used 2D photos as visual stimuli in the lab-based experiments. There might be a systematically deviation on the results than in realistic scenario where human faces are presented as a 3D visual object. In this study, the ability of 3D facial expression recognition under different lighting conditions was tested, aiming to obtain the visual performance curve that can be used to provide scientific basis in formulating road lighting standards that are more suitable for LED lighting source in the future.
2. Methods
Laboratory experiments were performed to test the abilities of 3D facial expression recognition under 15 lighting conditions. Three spectral power distribution (SPD) equivalent to high pressure sodium (HPS), metal halide (MH) and LED with high scotopic/photopic ratio (LED-SP), as well as five lighting levels (0.33, 1.00, 3.33, 10.00 and 33.33 lux) were used. The SPD was modulated using a multi-channel and full-spectrum LED cube. Terracotta heads with four 3D facial expressions (angry, happy, surprise and sad) were placed in the self-developed electro-mechanical platform. The platform can display one of the expression in a counter-balanced manner, and can collect responding data onto a connected laptop.
Tasks will be performed by 30 young participants (15 male and 15 female). Participants were asked to identify the 3D expression under all 15 different lighting conditions, and to press one of the four corresponding keys on a keyboard as response. Correctness and reaction time of the response were recorded as raw data. Each test participant carried out all 240 possible trials (3 SPDs, 5 illuminances, and 16 trials). The order of the trials was counterbalanced to avoid order effect. In the task, practice trials were used to confirm understanding and familiarity on the task.
3. Results
The score of each trial is the frequency of correct response among the 16 times 3D facial expression recognition. The initial results show that when illuminance increasing from 0.33 lux to 10.00 lux, the score of recognition under LED-SP was also increasing from 2 to 10 points, and performance is no longer increasing when the illuminance is higher than 10 lux. In addition, the initial results also show that when illuminance was 33.33 lux, the score of trials under each SPD was similar, about 10 points. The score under LED-SP was the highest among three when illuminance was 0.33 lux and the performance under MH was the best when illuminance was 1.00 lux and 3.33 lux. Note that the initial results are based on only two participants. More results with statistical analyses will be included in full paper.
4. Conclusions
This study analyses the ability of 3D facial expression recognition under lighting for pedestrians, obtaining the response curve of pedestrians' visual reaction ability and lighting condition by experiments. It was found that higher illuminance can help pedestrians recognize people’s expression more easily, while it does not get better effect when the illuminance reaches a certain level. The effect 3D-versus-2D on the ability of facial expression recognition will be analysed in full paper.
129
JUNCTION TEMPERATURE OF SMART LIGHTING LUMINAIRES OBTAINED WITH PULSED DIMMING
Vaskuri, A.1, Baumgartner, H.1, Dönsberg, T.1, Kärhä, P.1, Ikonen, E.1,2 1 Metrology Research Institute, Aalto University, Espoo, FINLAND
2 MIKES Metrology, VTT Technical Research Centre of Finland Ltd, Espoo, FINLAND
Abstract
1. Motivation, specific objective
After the invention of blue light-emitting diodes (LED) and phosphor-converted white LEDs soon after, the lighting industry has been striving towards LED based light sources and smart lighting for reducing the energy consumption. The main parameter affecting the efficiency of LEDs is the junction temperature. One commonly used method for measuring the junction temperature is the forward voltage method that uses short current pulses with synchronous forward voltage measurement over the LED junction. The current pulses are kept short enough so that they do not heat the junction. However, in many of the LED products, the electronics is inaccessible and the forward voltage method cannot be used. Another method based on a contact measurement using a thermocouple may change the thermal properties of the system due to the small size of the LED junction. In addition, due to the strong temperature gradients, a thermocouple may underestimate the junction temperatures. Thus, a non-contact optical method is needed for measuring the junction temperature of an LED junction. In principle, the electroluminescence (EL) spectrum of an LED depends on the junction temperature and it is possible to model the spectrum with junction temperature being one of the fitting parameters.
In our previous studies, we have developed spectral models for InGaAlP, GaAs, and InGaN light-emitting diodes. These models are based on quantum mechanical principles; the EL spectrum of an LED is described by the Maxwell-Boltzmann distribution for the high-energy side and the effective joint density of states (DOS) for the low energy side of the spectrum. The spectral models developed bring the theoretical semiconductor physics and the actual measured properties closer together as the junction temperatures of the actual LED based light sources can be monitored spectrally for their junction temperature.
The spectral models developed require one spectrum of an LED at a known junction temperature to calibrate the parameters describing the effective DOS. Moreover, in our earlier studies we noted that especially the spectral properties of InGaN LEDs vary among LED individuals. Thus, the DOS parameters determined for one LED component do not necessarily describe the DOS of another LED individual. These variations arise from the high dislocation density of InGaN that is not easy to control during the manufacturing process. The InGaAlP LEDs are significantly more homogeneous in this respect, but to obtain the best accuracy, the calibration of the model parameters should be performed separately for each LED component.
2. Methods
In this work, we study the possibility of obtaining an LED spectrum at a known temperature by pulse-width-modulating the LED. Spectra are measured at varied duty cycles, and the results are extrapolated to the duty cycle of 0% to obtain a spectrum resembling the junction temperature equal to the ambient temperature. We study the effects of frequency and duty cycle on the junction temperature. Spectral measurements of pulse-width-modulated LEDs can be carried out by averaging over various pulses, or by synchronizing the measurements to the modulation. Also the effects of different heat sinks on the EL spectra obtained are investigated. The final goal of this work is to obtain a reference spectrum at room temperature that would be useful especially with smart lighting, where dimming is carried out by pulsing LEDs. Such a reference spectrum can be used to obtain the effective DOS by dividing the spectrum with the Maxwell-Boltzmann distribution.
The setup that is used for carrying out this study consists of a high quality function generator (Agilent 33521A) with the available duty cycles of 0,01 % – 99,99 % and frequencies up to 30 MHz, a custom-made pulsed voltage-to-current converter to drive LEDs and a high-quality array spectroradiometer
(Konica Minolta CS-2000) to measure the EL spectra. Different LED holders are used to see their effects on the spectral measurements.
3. Results
We have investigated how the pulse-width dimming affects the junction temperatures and the EL spectra of white and green InGaN, and red InGaAlP light emitting diodes. Our studies show that with red InGaAlP LEDs, the junction temperature is directly proportional to the duty cycle. However, it appears that with the InGaN blue LEDs the relationship may not be that simple, but their spectra blue-shift less towards shorter duty cycles compared with AlGaInP LEDs. Our approach is to extensively measure all the scenarios and find links to the underlying physics of the observations.
In theory, the EL spectrum at the room temperature is obtained by extrapolating the duty cycle to 0%. To validate this statement, we have measured the reference EL spectra of DC driven LEDs, calibrated with the forward voltage method and compared the extrapolated spectra with the reference spectra of the same LEDs.
We have also found a validation method for the non-synchronised spectral measurements of pulsed LEDs. The problem with such measurements is that with the short duty cycles, the ambient stray light and the finite rising and falling edges of the current pulses start to dominate measurement, distorting the EL spectrum measured. Thus, such distorted spectra have to be discarded from the analysis. We have found that a straightforward method for evaluating whether the distortion in the spectra is dominant is to check whether the normalised spectra intercept at a temperature invariant energy value. This intersection point formed by the spectra at different temperatures, over a sufficiently narrow temperature range, is a property existing in every LED component.
4. Conclusions
This work studies the effect of the pulse-width-modulation on the junction temperatures and the corresponding EL spectra of LED luminaires. The findings of this and future work can be used for creating an optical method based on pulse-width-modulation to obtain the EL spectrum at room temperature. Such a reference spectrum can then be used to calibrate the parameters of spectral models for junction temperature determination. The goal is to monitor the junction temperature of the LED luminaires optically when using the smart lighting where dimming is carried out by pulsing the LEDs.
130
NON-INVASIVE MEASUREMENT OF PHOSPHOR TEMPERATURE FOR PC-WLEDS
Yang, T.H., Huang, H.Y., Lee, X.H., Yu, Y.W., Sun, C.C. Department of Optics and Photonics, National Central University, Chungli, CHINESE TAIPEI
Abstract
1. Motivation, specific objective
Solid-state light source has played the most important role in modern lighting, in both the outdoor and the indoor applications. Among the lighting applications, phosphor-converted white LED (pc-WLED) is the key light source owing its advantages in low cost, fast response, high efficiency, good colour performance and acceptable reliability. Generally, the pc-WLED contains a yellow (or green with red) phosphor layer covering a blue die to emit white light in wide CCT (correlated colour temperature) range with acceptable CRI. The performance of a pc-WLED can be judged by the efficiency, colour accuracy and reliability. The reliability, i.e. lifetime evolution of these factors is related to heat flow and temperature distribution in the package volume. In our previous study, we found that the hottest spot in the package volume could be located at the top of the blue chip or in the phosphor layer which is a package with remote phosphor. High temperature in the package volume of a pc-WLED could cause thermal quenching in phosphor, and resulting in colour drift as to induce blue light leakage, efficiency droop and lifetime shortening. Thus, the thermal effect is an important factor in managing the lifetime of a pc-WLED. Generally, the junction temperature of the LED die is regarded as an indicator to show the thermal condition in both the research and the industrial products. But, the junction temperature of the LED die is not strongly correlated with the temperature in the phosphor layer. The temperature across the phosphor layer or volume needs more watch and thus there is an intense demand in monitoring the phosphor temperature. However, there is no effective way to detect the phosphor temperature for pc-WLEDs. Then, the thermal dynamics of the phosphor layer/volume in a pc-WLED lacks of useful support.
2. Methods
To detect the phosphor temperature in the experiment, an IR camera takes images of the conformal-coated phosphor on a blue die that is attached on a board. Since the phosphor layer is thin, the surface temperature by the IR camera can be used to indicate the phosphor temperature. The emission spectrum is caught by a spectrometer in free space or in an integrating sphere. The final approach is based on the feature band of the spectrum. A Gaussian function is used to fit the feature spectrum so that the equivalent peak wavelength and the bandwidth can be obtained. The experiments are done with different wavelength of the pumping blue light, different phosphor concentration, different thickness and with or without lens encapsulation. Both the fitting peak wavelength and bandwidth from the detected spectra are fitted with simple quadratic functions respectively. Then the fitting functions are used to predict the phosphor temperature in a real pc-WLED.
3. Results
Advanced analysis of the spectra with different blue emission and different phosphor concentrations are executed to find a more effective way to build up a single and simple function. A basic thinking is that it could bear less cross-talk for the crossover range of the short and long bands in the emission spectra away from the blue light. The spectra from 580 nm to 800 nm are almost identical in all cases under the room temperature. The spectra from 580 nm to 800 nm can be regarded as the feature band of the whole spectrum. The feature band for different phosphor temperature shows possibility to clearly reflect the temperature effect. Therefore, only one fitting is necessary in that process. We can apply a Gaussian function to fit a part of the emission spectrum along the feature band for different phosphor temperature. The peak wavelength as well as the bandwidth is a good factor to indicate the phosphor temperature. Various experiments were done to collect enough data to evaluate the consistency of the fitting factors, where various pc-WLEDs pumped by different blue dies in different phosphor concentrations. The most interesting part is that the fitting single Gaussian function is applicable to the package with or without lens encapsulation. We find that the bandwidth part is more accurate than the peak wavelength part because the bandwidth gets higher sensitivity in temperature. The proposed detecting model is to build up a database to obtain the featured quadratic functions for describing the relations between the fitted peak wavelengths or the fitted bandwidth of the feature band and the phosphor temperatures. The
conformal coating package without lens was used to build the database. Then the pc-WLEDs were encapsulated with a silicone lens. The database was used to indicate the temperature of the phosphor layer. The lens encapsulation blocks possible air convection of the phosphor layers and the temperature will be higher than the package without lens encapsulation. It is worth noting that the phosphor temperature as a function the injection current can be adopted only for the same thermal dissipation design.
4. Conclusions
A novel scheme for precisely detecting the phosphor temperature of a pc-WLED. The detection model can be adopted to different blue dies, different phosphor concentrations, different phosphor thickness, different CCTs and with or without lens encapsulation. The study starts from checking the emission spectra by the phosphor, and divided the spectrum into two sub-bands. The peak wavelength and the bandwidth have well correspondence to the phosphor temperature. Furthermore, the two correspondence can be well fitted by simple quadratic polynomials respectively. Using the two functions, we can detect the phosphor temperature at various conditions, including changing the blue die, phosphor concentration, the phosphor thickness, different CCT, and with or without lens encapsulation. The only restriction is that the phosphor must be the same. The features are diverse for different phosphors in principle. So, the coefficients in the empirical scheme will need to fine tune, individually. However, the method and the procedure should work still well. Meanwhile, this empirical scheme is based on the stable properties of the phosphors. The empirical scheme won’t expect to correctly predict the phosphor temperature after the phosphors become in ageing. During the ageing stage, the temperature of the phosphors might not become one of the most important issues. The proposed novel scheme based on spectrum fitting provides an effective way for remotely detecting phosphor temperature of a pc-WLED. Scientifically, we have successfully demonstrated well correspondence between the yellow spectrum and phosphor temperature from a white light spectrum with large cross-talk. In the real application, this study provides a very effective way to monitor the phosphor temperature. This accomplishment can help the sold-state lighting industry to develop more trust-able light source with high reliability, high colour stability and high efficiency.
133
THE INFLUENCE OF ADAPTING FIELD EXTENT ON CHROMATIC ADAPTATION
Ma, S.1, Hanselaer, P.1, Teunissen, K.2, Smet, K.1
1 ESAT/Light&Lighting Laboratory, KU Leuven, Ghent, BELGIUM; 2 Philips Research, High Tech Campus, Eindhoven, THE NETHERLANDS
Abstract
1. Motivation, specific objective
Chromatic adaptation is a perceptual phenomenon that keeps the colour appearance somewhat constant across the changes in the colour of the illumination environment. To predict the adaptive colour shift, over the years, many Chromatic Adaption Transforms (CAT) have been developed based on Corresponding Colours (CC). In the CAT02 transform, the equation predicting the degree of chromatic adaptation factor D, is only related to the luminance of adaptation field.
Recently, Smet et al. investigated the impact of the illumination chromaticity on D and developed a new model. He also found that the effective degree of adaptation was much less than 1 even under a high luminance background. This could be explained by the limited size of the adaptation field present during the experiments. Although the field of view might be an important factor in chromatic adaptation, few studies have been carried out on this topic. The goal of the present study is to investigate how the extent (field of view) of the adapting field influences the degree of adaptation and to develop an improved model.
2. Methods
Memory Colour Matching (MCM), a method which has more advantages over traditional asymmetric matching methods, has been used to collect corresponding colour sets for varying extents of the background (adapting field) illuminated by a number of neutral and coloured illuminations. Observers will be required to adjust the colour appearance of the presented stimuli until it matches the target colour in their memory. In the experiment, the stimulus background is a white 3D stage, providing the adaptation field, with several white, grey and black objects. The test stimulus is a 3D grey (spectrally flat) cube centrally positioned in the background scene. A calibrated data projector will be used to provide independent, but easily controlled, illumination on the background and the stimulus. The spectral radiance of the background and cube will be measured with a tele-spectroradiometer after suitable calibration.
Only one target colour, the neutral grey will be used in this experiment. The following thirteen adapting fields will be selected: illuminant A, EEW and D65, and the most neutral white found by Smet et al.; Planckian radiators of 2000K, 4000K, 12000K and infinite K together with five high chroma sources (Red, Yellow, Green, Blue, and magenta). They include 4 neural sources and 9 moderately to highly chromatic sources which covered a large range in colour space. The background luminance will be 150 cd/m2. Also, there will be 6 levels of field of view of the background: 0°, 10°, 20°, 40°, 60° and 80°, from no adaptation field to a quite immersive environment.
During the experiment, the observers will be asked to adjust, after a 45 seconds adaptation time, the apparent colour of the cube to neutral grey by navigating in the CIE 1976 u’v’ space using a keyboard. They then need to rate their satisfaction of their colour match on a 0 (not satisfied at all) to 10 (very satisfied) scale. To minimize starting bias, each experiment will be repeated 4 times with 4 different chromaticity starting points of the grey cube. The starting chromaticities is distributed evenly in hue. The mean value of the 4 memory colour matches for each background and illumination conditions will be used for further analysis and model testing and development. The illumination (background) colours and starting points will be presented randomly within a single experiment session. The extent of the adapting field (background) will be randomly varied for each session to avoid order bias. Ten observers (5 male and 5 female), all with normal colour vision as tested by the Ishihara 24-plate test, will participate in the experiments. Overall, 2640 estimations will be made: 1 stimulus target x 10 observers x (13 illumination conditions x 4 starting points x 5 background sizes + 4 starting points x 1 viewing fields). Note that only dark illumination will be applied for obtaining the memory colour without adaptation field (0°).
3. Analysis
Firstly, observer uncertainty and variability (intra- and inter-) should be investigated. The MedCDM (Median colour difference with the mean) in terms of u’v’ colour difference can be used to quantify the uncertainty. In addition, observer variability will be also assessed by the Standardized-Residual-Sum-of-Squares (STRESS). Note that intra-variability for each illuminant condition will be evaluated with observer’s own memory colour which was repeated 4 times corresponding to 4 starting points.
For each field of view except 0°, 156 (13 x (13-1)) sets of corresponding colour sets could be derived from the 13 illumination conditions (background chromaticities). Firstly, the performance of the CAT02 transform will be evaluated by calculating the colour difference between the CAT02 predictions and the visual result, with the degree of adaptation calculated from the CAT02 D-formula.
Secondly, to minimize the prediction error (colour difference), the D value needs to be optimized for each field of view and illumination condition. It can be expected that the D will increase as the field of view is extended. The performance of an optimized CAT02 could be compared with the original CAT02 to check if there is a significant improvement. Also, the relationship between D and field of view of the adapting field will be discussed. The aim is to develop a new model for the degree of adaptation with the consideration of background luminance, chromaticity and field of view.
134
LIMIT OF LUMINOUS EFFICACY AND PACKAGING EFFICIENCY IN PC-WLEDS
Lee, X.H., Chen, C.Y., Chang, Y.Y., Yu, Y.W., Sun, C.C., Yang, T.H. Department of Optics and Photonics, National Central University, Chungli, CHINESE TAIPEI
Abstract
1. Motivation, specific objective
Phosphor-converted white LED (abbreviated as pc-WLED) is a solid-state light source which emits white light based on a blue die covered by yellow or green-red phosphor]. Such a light source has been intensively applied to general lighting owing to its advantages, including high energy efficiency, fast response, acceptable colour rendering, and low cost. The property in high luminous efficacy enables pc-WLEDs to replace most light sources in general lighting and even in special lighting. The use of high-efficiency pc-WLEDs becomes one of the important topics in global energy saving. With no doubt, a pc-WLED could save energy due to the light emission mechanism in a semiconductor with p-n junctions. A well design with a suitable substrate such as low-cost sapphire makes a pc-WLED to perform luminous efficacy as high as 150 lm/W operated at 1 watt. Furthermore, a high quality GaN template could even rise the internal quantum efficiency (IQE) as high as 88% or potentially even higher. Also, well-developed chip process and die shaping could effectively increase the light extraction efficiency to a level of 90%. Combination of the IQE and LEE, the state-of-the-art external quantum efficiency of a blue die for a pc-WLED could reach as high as 80%. However, it is lack of detailed analysis for packaging efficiency to decide the limit of luminous efficacy of a pc-WLED with a certain spectrum. In this work, we present a study of packaging efficiency for several kinds of pc-WLEDs to figure out the possible limit of packaging efficiency. Then, we further consider the photopic spectral luminous efficiency function of human eye on pc-WLEDs according to the specific spectrum. In corporation with the state-of-the-art EQE, we study and discuss the potentially reachable luminous efficacy of a pc-WLED with different colour performance.
2. Methods
The study of the packaging efficiency is aimed to figure out the potentially highest efficiency so that people knows which the improvement space is for the current pc-WLEDs. In this study, several typical packaging structures are applied. The diameter of the encapsulation lens is 6 mm in all types. The blue dies are selected with a name of EZ700 by CREE. Yellow YAG phosphors with different diameter are used to achieve white light incorporated with a blue die in the experiment while Green YAG and Red Nitride phosphors are used in the simulation. The limit packaging efficiency can be analysed through examining the packaging loss budget through simulation with Monte Carlo ray tracing incorporated with the precise phosphor model that we developed. The practical packaging loss mainly comes from the geometry loss including the absorption in the bottom layer of the board and the absorption in the active layer of the blue die. To make fair comparison, we adjust the phosphor concentration and thickness to achieve similar particle number of the phosphor so that the CCT is controlled at 6500K ±100K.
3. Results
To estimate the limit of luminous efficacy of a pc-WLED, the scenarios are focused on the effect by the PkE, the CCT, and the LER. The first scenario is that there is no geometry loss and phosphor quantum loss, so Stokes loss is the only factor counted in the packaging efficiency. The second scenario is a more practical case, where the phosphor quantum loss is counted, and the geometry loss is also applied according to the lowest loss. If Stokes loss is the only loss in packaging level, it is possible to use green YAG phosphor to perform a limit of luminous efficacy of a pc-WLED as high as 300 lm/W, but the colour appearance might not be white, and the CRI could be below 30. If 4% of phosphor quantum loss and CCT-dependent geometry loss are counted, the practical limit of luminous efficacy of a pc-WLED for greenish white or yellowish white is about 260 lm/W for very low CRI and is about 240 for CRI around 60. For the yellow phosphor, it is possible to reach the limit of luminous efficacy of a pc-WLED in a range from 200 lm/W to 250 lm/W of a well-defined CCT around 6000K to 6500K and CRI around 70. To increase the CRI to 80 or even above, two phosphors must be used. Then, the limit of luminous efficacy of a pc-WLED in a range from 160 lm/W to 200 lm/W with a well-defined CCT around 4000K to 5000K. It means that better colour performance will dramatically sacrifice luminous efficacy.
4. Conclusions
We investigate the PkE in seven types of pc-WLED to figure out what the most efficient is among them. In order to know the details of the PkL, we analyse the PkL budget, which contains Stokes loss, phosphor quantum loss, and geometry loss. The Stokes loss depends on the blue spectrum and the spectrum of the down-conversion. The geometry loss is more complicated, and it relates to the phosphor, the reflective surface in the packaging volume and the absorption of the active layer of the blue die. The simulation shows that phosphor particle size could induce different backward scattering, and so does the geometry loss. Based on the analysis above, we try to estimate the limit of luminous efficacy of a pc-WLED with Type VII structure. In the calculation, we will obtain the limit of luminous efficacy of pc-WLEDs. The limit of practical limit of the LED will be sacrificed in obtaining higher CRI. To approach the optimal luminous efficacy and the optimal CRI in the same time always put us into a dilemma. For various applications in the daily life, it might be a good strategy to keep a minimal requirement on CRI first, then to optimize the luminous efficacy as possible. That will bring us as higher luminous efficacy but will not lose CRI too much in any specific application. In summary, the study of the PkE clarifies the PkL budget of a pc-WLED, so that the limit of the luminous efficacy and illumination luminance efficacy can be estimated. It will be much helpful for the people in the field related to pc-WLED to figure out what/how luminous efficacy can be achieved and what/how the people can do in the next.
146
INVESTIGATION OF GLARE METRICS FOR REFLECTED GLARE ON DISPLAYS
Hung, S.T.1, Wen, C.H.1, Liu, W.C.1 1 Industrial Technology Research Institute, Hsinchu, CHINESE TAIPEI
Abstract
1. Motivation
The world of electronic information displays has moved on a lot in the last few years. There are new technologies and certifications, all aimed at approaching display technology take the next leap forward. People typically watch displays under ambient light sources, even strong direct sunlit, that causes extremely intense perception by reflected light from the display surface. Extremely reflected glare on displays might affect visual performance, fatigue and headache, but there are rare reports to address the applicability of current glare metrics for the reflected glare on display, especially in low glare level. This paper reviewed the popular glare metrics and conducted an experiment to present the applicability of those metrics for predicting glare on electronic displays in indoor environments.
2. Methods
This work investigates three kinds of glossy, matte and light matte displays under 2 ambient lighting conditions. One is the normal condition with indirectly lighting on the target display and the other condition is the reflected glare condition that a set of linear fluorescent lamps is setup behind observers. For all treatments of the experiment, the luminous distributions of displays are measured by an Imaging Luminance Measuring Device (ILMD).
By device-dependent colour transformation, the colour image of the calibrated ILMD can be converted image pixel digital signal (RGB8-Bit) into CIE xyY colour tristimulus. In this study, the luminance of spatial 2D pixels is raw data for calculating glare metrics.
In addition, the surface reflection characteristics of displays are presented by their Bidirectional Reflectance Distribution Function (BRDF). Because the reflected lights of the display incident to eyes are integrated over visual field angles, multi-angle light reflection must be considered with different display surface material, relative incident angle and observer’s viewing angle. The measured BRDF of the displays is applied to fix the resultants from the ILMD.
To test the reflected glare on display, the joint effects of display polarity and illumination condition were assessed. There are total of 12 reflected glare conditions will be measured, three displays, two display polarity positive (dark characters on light background) and negative (light characters on dark background) and two kinds of ambient illumination. Six glare metrics are investigated and calculated to predict the reflected glare on displays, they are disability glare model (DGM), threshold increment (TI), deBoer discomfort glare rating (dBDGR), ASSIST discomfort glare (DG), ASSIST deBoer glare (DB) and unified glare rating (UGR) respectively.
3. Results
Background luminance and ambient illuminance are necessary parameters in current glare metrics. Background luminance was calculated for the positive content under normal condition, the results of glossy display, matte display and light matte were 82.9213, 83.4258 and 83.856. Ambient illuminance was measured under normal condition and the target display was closed, the result was 550 (lx). The values of two parameters were applied in current glare metrics.
Current glare metrics was implemented for analysing reflected glare on displays, the analysed results of DGM, TI, dBDGR, DG, DB and UGR were listed sequentially to present the applicability. The positive content were measured under direct linear fluorescent lamps condition, the glossy display results were 0.0004, 9.3477, 8.9429, -399547.3206, non and 7.7827, the matte display results were 0.0003, 24.6011, non, -1201452.633, non and 9.0424, the light matte display results were 0.0003, 2.3064, 9.2989, -111879.1874, non and -0.1511. All results were compared interactively, TI, DG and UGR present the similar trends, the dissimilar trends were found in DGM and dBDGR, DB cannot be calculated. DGM, dBDGR and DB was inappropriate to analyse reflected glare.

Results revealed that TI, DG and UGR present the similar trends which were appropriate to analyse reflected glare when the positive content was under direct linear fluorescent lamps condition. Another aspect, some issues were disclosed. The glare values of DG and UGR were over regular upper limited value, and the glare values of TI were extremely too close to showing a difference among 12 reflected glare conditions.
4. Conclusions
This paper explored the applicability of current glare metrics for reflected glare on displays. Some metrics present the similar trends, but the values are out of the prediction range. Results revealed that most glare metrics were not suitable to predict the reflected glare on modern displays. It is expected that there are more researches to address and to re-model the reflected glare assessment in the future.
147
EXPERIENCE OF LIGHT IN COMPARISON WITH RETINAL RESPONSE TO RADIATION
Enger, J.1, Laike, T.1, Fridell Anter, K.1 1 Lund University, Environmental Psychology, Lund, SWEDEN
Abstract
1. Motivation, specific objective
The tools available for defining light quality are based primarily on the knowledge of the eye’s sensitivity to light intensity, which is a very limited definition of the visual function. When photons hit the eye’s retina, a reaction is created which the visual perception system transforms into a basic and automatic sensory experience, and the visual impression created is interpreted both on an emotional and cognitive level. The processes are largely unconscious but in principle simultaneous. Although they represent different aspects of vision, it is in fact not possible to separate them if the goal is to create a basis for good light environments.
Knowledge and awareness of the effects of light on man is steadily increasing. One term that is increasingly used is human centric lighting. It focuses primarily on the effects of light on hormone levels and the circadian rhythm, and how lighting facilities can be planned and controlled based on that knowledge. Man is guided by biological, physiological and sensory functions and is at the same time a social and cultural creature, who also has specific needs and preferences at the individual level. A definition of light quality needs anchoring in all of these levels.
The study is conducted as part of a multidisciplinary research project. The overall objective is to develop definitions and concepts for light quality, as well as a basis for methods and tools for design and evaluation of light environments. Methods from different research disciplines are used in the studies carried out in the project. Sensory analysis, originally developed in the food and beverage industry, has well-established methods for using human sensory abilities as measuring instruments and quality assessments for products such as wine or different foods. The field of environmental psychology studies the interaction between humans and the environment and has among other developed methods for examining people’s experience of a spatial context. The research project is being carried out in close collaboration with a number of companies in the lighting industry. Through an iterative process during a number of meetings and workshops, a collection of concepts for visually experienced light quality has been defined. The concepts are validated through the research studies carried out in the project, of which the study presented here is one. In this study, the results are also compared with an analysis of how the eye’s receptors respond to the radiance of the light environments assessed.
The purpose of the study is to compare an investigation of how light environments are perceived visually with an analysis of the radiation and its impact of the photoreceptors. The aim of the study is to contribute to a tool based on a definition of light quality that is anchored in a holistic perspective on light experience.
2. Methods
The project’s definition of light environment is that it consists of the three factors light, colour and space that together determine how the light quality of a room is experienced. Three methods are used in the study. Two of them investigate the perceived light quality and the third is an analysis of the response of the receptors to the radiance of the examined environments.
The study is conducted with a number of scale models of environments that have different combinations of light and colour schemes. The designs of the models are identical and consist of different volumes and structures resembling furniture, but the rooms should not be associated with any specific function. The colour schemes have varying degrees of contrast and reflection and are illuminated according to different lighting principles, ranging from even lighting to varied. A selection of the concepts defined within the project describing visually perceived light quality is assessed by 25 subjects through semantic differential scales. Some examples of the concepts assessed for each model are: diffuse, distinct, intense, varied and monotonous light, as well as the perceived light level. Based on a few open questions, the subjects also describe in their own words the quality of light in each of the models, and whether they experience them as appealing or not.
The method for analysing the receptors response to the light environments radiance is done using photographs of the models, similar to a luminance analysis. A software calculates how the four different receptors of the eye, the three types of cones and the rods, respond to the radiance and the result is presented in logarithmic curves. Contrast is of greater importance to the photoreceptors, as well as for whole visual system, rather than the amount of light radiation and the experience of brightness as an isolated factor. The reason why radiance is used instead of luminance is precisely to exclude the photometric units’ correction to the visibility curve. The method, developed by a biologist, has so far only been used in outdoor environments.
A relatively large number of environments with different light situations have been analysed using the method. The logarithmic curves describe the receptors response to respectively short-wave, medium-wave and long-wave radiation, as well as a median value. As expected, they show quite different results for a natural light environment like a beach in daylight, compared to a nightly urban environment dominated by motley artificial light, or an environment illuminated with a low pressure sodium lamp. The starting point of the method is that the function of the eye is developed and adapted to the type of light and contrast conditions found in natural environments. The method allows you to read if a light environment differs from it. The method could thus also provide a basis for optimizing artificial light based on the function of the eye.
3. Result
The results of the three methods are relevant both individually and in comparison with each other. The scale models have been designed with both common and more extreme light and colour settings, and with varying degrees of contrast and brightness. The radiance analysis is compared with the material from the previous outdoor environments study to identify similarities and differences. The subjects' assessment of the scale models light quality and their preferences are also set against the results of the radiance analysis to identify possible correlations. Throughout the study, the concepts of light quality as defined in the project can also be validated in a first round.
4. Conclusions
The aim is that the results of both the sub study and the entire project will culminate in definitions and scales that describe light quality based on both visual and emotional values that can be used as a tool both in research and practice. It is also hoped that the result will ultimately be able to contribute to raising awareness of light and light experience.
149
POTENTIAL OF ENERGY SAVINGS IN TRAFFIC-FLOW CONTROLLED STREET LIGHTING SYSTEMS
Gasparovsky, D.1, Janiga, P.1, Dubnicka, R.1 1 Slovak University of Technology in Bratislava, SLOVAKIA
Abstract
1. Motivation, specific objective
Street lighting is a public service provided to inhabitants and visitors of our cities, towns and villages. Besides safety functions street lighting or urban lighting in general is important for creation of pleasant night-time atmosphere and beautification of night-time environment. Different approaches are used for illumination of roads, boulevards, footpaths, squares, parks, central zones, industrial zones and residential areas. Future development of urban lighting now relies on the advanced LED technology and aims to build free-to-control smart lighting systems as an essential part of smart cities. Lighting is losing its independence from other infrastructural subsystems and tends to integrate with traffic, telecommunication, utility services and others. Those interactions are in particular significant that have direct influence on setting of target lighting parameters: weather conditions, visibility level, traffic conditions (density, volume, speed), user presence and demand, composition of users etc. Traffic flow belongs undoubtly to those requiring special attention.
LED technology brought to urban lighting a number of benefits: high luminous efficacy, tailored optics, free choice of colours, dynamic control. Conventional light sources had very limited control possibilities: typical scheme offered a reduced (usually halved) lighting level during night-time hours with low traffic. Dimming, if any, was controlled centrally by means of e.g. voltage regulators. Controlling of LED luminaires offers unlimited freedom: switching or dimming has immediate response and does not affect negatively to lamp’s lifetime. Instead of central dimming, thanks to wireless network systems control of individual luminaires is easy. This is the technical precondition to provide lighting on demand – where and how much it is needed in terms of place and time. However, still there is lack of methodology how to describe the actual visual needs of drivers, cyclist, pedestrians or other users, and to define and setup the right lighting parameters to them.
In consequence of lacking methods, not smart-ready luminaires and first of all due to inherited lighting networks with mixed types of lamps, lighting systems are not optimally controlled and it is still a common practice to operate the lighting on full level throughout the night. It is obvious that there is huge potential of energy savings when comparing the state-of-the-art with what from the optimally designed lighting system can be expected. This paper is focused on lighting control based upon detection of traffic flow and its contribution to reduction of energy demand to lighting. Special regard is given to residential areas where the biggest reduction of lighting is supposed.
2. Methods
Energy consumption of road lighting depends on installed power, duration of time in operation and lighting control which implies the variation of power in time from both short-term and long-term perspective. The latter can be e.g. the effect of constant light output (CLO) control or due to maintenance of luminaires. Variation of power over time can be expressed by means of lighting control profiles. Standard control profiles are used to calculate then the energy consumption. Most of parameters are predictable, however, in systems with detectors probability functions must be used and energy demand of a lighting system has to be determined by estimation.
On the other hand, detection of moving cars or presence of persons has to be linked to area of luminaires which should react by increasing the light level locally, taking into account direction of movement and possible continuation by turning left or right at the crossings. Here further assumptions like the relevant road length, time of drive trough, light levels, time of sustaining light levels etc. have to be taken into account and probability of the overlapping of illuminated areas has to be estimated, too. The paper aims to describe situations for the most common lighting tasks in urban lighting and to specify the parameters for description of lighting profiles.
The paper also aims to introduce collection of data acquired from traffic detectors installed at different sites of road sections in poles of traffic lights. Counters are installed mainly on major roads, residential areas are not covered. Here for monitoring of traffic flow camera based devices are currently installed and installation of more advanced systems with image analysis is in preparation. Objective is to acquire figures of traffic flow in different periods of time for better imagination on detection probabilities and traffic density needed to derive the corresponding lighting class according to the Publication CIE 115.
In addition to energy consumption, energy performance of lighting system can be expressed through the couple of compound numerical indicators PDI and AECI as per EN 13201-5. AECI in particular incorporates the lighting control and will be dealt in the paper.
3. Results
Results presented in the paper comprise presentation of data on traffic flow at different sites of a capital city and a disctrict-size town on major roads and in residential areas. For different applications including main streets – arteries and radials, webbed streets of a residential area, settlement units, etc. standard schemes with lighting control profiles and descriptive parameters will be provided. For case studies, energy saving potential will be estimated.
4. Conclusions
Smart lighting is lighting adaptive to different external conditions, integrating additional functions, providing light on demand – increasing thus the comfort to the user and the same time cosiderable reducing energy demand in comparison to steady-state passive lighting systems. Implementing lighting control with traffic flow detectors may discover huge potential of energy savings and to help to preserve natural resources and the environment. Additional benefits are in reduction of obtrusive light, protecting the nocturnal life.
152
COMPREHENSIVE MODELLING OF COLOUR QUALITY FOR LED LIGHTING
Zhai, Q.1, Luo, M.R.*1, 2, Liu, Q.3 1 State Key Laboratory of Modern Optical Instrumentation, Zhejiang University, Hangzhou, CHINA,
2 School of Design, Leeds University, Leeds, UNITED KINGDOM 3 School of Printing and Packaging, Wuhan University, CHINA
Abstract
1. Objective
Colour Quality of lighting has usually been assessed as naturalness, colourfulness (vividness) and preference by asking observers to assess some familiar objects, such as apple, banana, vegetables, etc. This topic has been extensively studied by many researchers such as those by Wei et al, Royer et al, Khanh et al, Xu et al, Liu et al, Zhai et al. The experimental results were used to test and develop colour rendering metrics such as CIE-Ra, GAI by Rea, MCRI by Smet et al, CQS- Qg and Qp by Davis and Ohno, ∆C* (using CQS test samples by Khanh and Bodrogi), GVI by Liu et al, IES-TM-30 Rf and Rg by David et al, IES-TM-30 Rch1 by Royer, and CQ by Zhang et al. They can be divided into three categories, colour fidelity, colour gamut and colour preference of familiar objects. In this study, a comprehensive colour quality modelling between metrics and different sets of visual data were conducted. Several combined models were devised and the latest version of uniform colour space CAM16 by Li et al was adopted to replace CIELAB or CIECAM02 in the models.
2. Models and Results
The data of visual assessments of naturalness, colourfulness (vividness) and preference under testing lightings in previous studies were selected and grouped according to the environments (living, museum, mart), sample types (objects from natural world, artificial objects, paintings, objects grouped by hue), and CCT range (multi CCT/duv or metameric lighting which includes lighting having the same CCT and Duv but varying spectral power distributions). In total, experimental data under over sixty lighting conditions were accumulated. The correlation coefficient calculated between the visual data and metric’s predictions was used to report each model’s performance.
The first test was conducted for the existing individual metrics including CIE-Ra, GAI, MCRI, IES-TM-30 (Rf, Rg and Rch1), CQS, CQS-∆C*, GVI. It was found that CIE-Ra and Rf performed best in naturalness prediction as expected. Rch1 outperformed the other metrics for colourfulness data. GVI provided the most accurate prediction for preference data. This agrees well with the earlier findings from Liu et al and Xu et al. Note that the original GVI was calculating gamut volume in CIELAB, which was replaced by the most recent CAM16.
In consideration of comprehensive colour quality definitions, Rf, Rg or GVI, Rch1 and their cross term were modelled in polynomial equations to include all colour quality properties of fidelity, gamut size and gamut shape. Those were selected because they performed more or less the best in the first test. The present models were first trained by the data of metameric lightings with strict controlled parameters from the authors’ earlier data. For naturalness prediction, the term of Rf affected the results most while for colourfulness Rg, GVI or Rch1 play more important role than Rf. The polynomial equations of these four metrics were found to be the best choices. Pearson and Spearman correlation coefficients and STRESS values were used to test the performance of the models. Other data sets from previous studies were used as testing samples. The CAM16 was used to replace CIELAB or CIECAM02 in the models. Detail results will be given in the full paper.
3. Conclusions
Rch1 and GVI calculated by CAM16 outperformed other single metrics in predicting colourfulness and preference of lighting. Polynomial equations of several metrics were modelled and tested using different visual assessments data of naturalness, colourfulness and preference. The present results clearly support the general concept of the IES-TM 30 to have a colour fidelity and a colour gamut metric to describe a colour preference. In addition, the colourfulness increment in the red direction would further enhance the metric.