abstract title of dissertation: civic skills an d civic
TRANSCRIPT

ABSTRACT
Title of dissertation: CIVIC SKILLS AND CIVIC EDUCATION: AN EMPIRICAL ASSESSMENT
Melissa Kovacs Comber, Doctor of Philosophy, 2005
Dissertation directed by: Professor Christopher Foreman, Jr.School of Public Policy
Participation in public life requires sufficient civic skills. Civic skills include the
abilities to communicate with elected officials, organize to influence policy, understand
and participate in one’s polity, and think critically about civic and political life. One
source of civic skill development is civic education coursework, often provided in high
school or college. This dissertation tests for a correlation between civic skills (political
interpretation skills, news monitoring skills, group discussion skills, communication
skills, and English language skills) and civics coursework among fourteen to thirty-year-
olds using probit models and propensity score matching methods. Data sources include
the International Association for the Evaluation of Educational Achievement Civic
Education survey (1999), the Civic and Political Health of the Nation: A Generational
Portrait survey (2001), the American Citizen Participation Study (1990); and the National
Household Education Survey’s Civic Involvement study (2001).
Political interpretation skills are almost always correlated with the presence of
civic education. According to the IEA/CivEd study, studying the Constitution and the
Presidency almost always influences civic skill levels, while other civic education topics
sometimes influence civic skill levels. Civic education is not always correlated with
news monitoring skills. Civic education is sometimes correlated with the presence of

group discussion skills and communication skills. No evidence was found of a
correlation between civic education and English language skills. Among minorities,
females, low-income respondents, non-college respondents, and non-Hispanic whites,
differences exist in civic skill levels and the effect of civic education on civic skill
presence.
This dissertation recommends that all American high school students take at least
one semester of civics. This dissertation also recommends schools and communities seek
to prioritize teaching civic skills in schools, so as to equalize abilities of political
participation. Further research is needed to fully understand the relationship between the
content of civics courses, the classroom climate of civics courses, and civic skill
presence.

CIVIC SKILLS AND CIVIC EDUCATION: AN EMPIRICAL ASSESSMENT
by
Melissa Kovacs Comber
Dissertation submitted to the Faculty of the Graduate School of the University of Maryland, College Park in partial fulfillment
of the requirements for the degree of Doctor of Philosophy
2005
Advisory Committee:
Professor Christopher Foreman, Jr., ChairProfessor William GalstonProfessor James GimpelDr. Peter LevineProfessor Mark Hugo Lopez

©Copyright by
Melissa Kovacs Comber
2005

ii
In memory of Anna, a true heroine

iii
ACKNOWLEDGEMENTS
It takes a village to write a dissertation. I certainly did not do this alone, and have
many to thank for my success. I owe a debt of gratitude to my committee members for
their direction and advice. In particular, I wish to thank Chris Foreman for his endless
encouragement and keeping me on schedule. I thank Mark Hugo (Go Bears!) Lopez for
his significant gift of time toward this work, his calm guidance, and his sense of humor. I
thank Peter Levine for his prompt attention to my dissertation chapters and a valuable
perspective toward this research. Further acknowledgements go to Bill Galston and Jim
Gimpel for sharing their expertise on this topic. It has been an honor and a privilege to
have been able to work under the guidance of this committee.
I thank Jeff Smith for assistance with methodology related to propensity score
matching methods.
I thank the Center for Information and Research on Civic Learning and
Engagement (CIRCLE) in the School of Public Policy for grant support to conduct this
research.
I thank my fellow doctoral students Michelle, Sally, Nara, and Louis for their
encouragement, support, and “shrieking.” I am grateful to Soumya for helpful hints with
STATA. I thank my friend Bob for attempting to teach me how to write, and my friend
Chris for his never-complaining assistance with statistical methodology. I am grateful to
Sara as well for STATA help and her friendship.
Finally, and primarily, I thank my family and friends who have sacrificed for my
opportunity to study at Maryland. The majority of that sacrifice was borne by my
unconditionally supportive husband – I thank you Michael from the bottom of my heart.

iv
TABLE OF CONTENTS
List of Tables ………………………………………………….. v
List of Figures …………………………………………………….. ix
Chapter 1: Introduction ………………………………………………… 1
Chapter 2: Civic Skills and Civic Education ………………………………….. 9
Chapter 3: Data and Methods …………………………………………. 25
Chapter 4: Probit Models …………………………………………………. 44
Chapter 5: Matching Methods ………………………………………… 65
Chapter 6: Heterogeneous Links between Civic Education and Civic Skills ….. 78
Chapter 7: Conclusions and Policy Recommendations …………………… 117
Appendix A: Summary of Data Sets and Related Literature………………… 130
Appendix B: Civic Skill Survey Questions ………………………………… 132
Appendix C: Civic Education Survey Questions …………………………… 135
Appendix D: Instrumental Variables Methods …………………………… 136
Appendix E: Propensity Score Matching Methods …………………………… 139
List of References ………………………………………………………… 234

v
LIST OF TABLES
Table 1: IEA/CivEd: Means ……… p. 144Table 2: IEA/CivEd: Means ……… p. 145 Table 3: NGI: Means ……… p. 146Table 4: NHES: Means ……… p. 147 Table 5: ACPS: Means ……… p. 148Table 6: Political Interpretation Skills – Political Leaflets (IEA/CivEd), Probit Models
….... p. 149Table 7: Political Interpretation Skills – Political Cartoons (IEA/CivEd), Probit Models
……. p. 150Table 8: Monitoring the News (IEA/CivEd), Probit Models …p. 151Table 9: English Language Skills (IEA/CivEd), Probit Models …p. 152Table 10: Group Discussion Skills (IEA/CivEd), Probit Models …p. 153Table 11: Monitoring the News (NGI), Probit Models …p. 154Table 12: Collective Decision-Making Skills (NGI), Probit Models ….p. 155Table 13: Communication Skills (NHES), Probit Models …p. 156Table 14: Monitoring the News (NHES), Probit Models …p. 157Table 15: English Language Skills (NHES), Probit Models …p. 158Table 16: Communication Skills (ACPS), Probit Models …p. 159Table 17: Monitoring the News (ACPS), Probit Models …p. 160Table 18: Group Discussion Skills (ACPS), Probit Models …p. 161Table 19: English Language Skills (ACPS), Probit Models …p. 162Table 20: Political Interpretation Skills – Political Leaflets (IEA/CivEd), Matching
Methods … p. 163Table 21: Political Interpretation Skills – Political Cartoons (IEA/CivEd), Matching
Methods … p. 164Table 22: Monitoring the News (IEA/CivEd), Matching Methods …p. 165Table 23: Monitoring the News (IEA/CivEd), Matching Methods …p. 166Table 24: Group Discussion Skills (IEA/CivEd), Matching Methods …p. 167Table 25: Group Discussion and Monitoring the News (NGI), Matching Methods
… p. 168Table 26: Communication Skills and Monitoring the News (NHES), Matching Methods
… p. 169Table 27: Group Discussion, Monitoring the News, and Communication Skills (ACPS),
Matching Methods … p. 170Table 28: Political Interpretation Skills – Political Leaflets (IEA/CivEd), Full Probit
Models, African-Americans … p. 171Table 29: Political Interpretation Skills – Political Cartoons (IEA/CivEd), Full Probit
Models, African-Americans … p. 172Table 30: Monitoring the News (IEA/CivEd), Full Probit Models, African-Americans
… p. 173Table 31: Group Discussion Skills (IEA/CivEd), Full Probit Models, African-Americans
… p. 174Table 32: Political Interpretation Skills – Political Leaflets (IEA/CivEd), Full Probit
Models, Latinos … p. 175

vi
Table 33: Political Interpretation Skills – Political Cartoons (IEA/CivEd), Full Probit Models, Latinos … p. 176
Table 34: Monitoring the News (IEA/CivEd), Full Probit Models, Latinos…p. 177
Table 35: Group Discussion Skills (IEA/CivEd), Full Probit Models, Latinos …p. 178Table 36: Political Interpretation Skills – Political Leaflets (IEA/CivEd), Full Probit
Models, Females … p. 179Table 37: Political Interpretation Skills – Political Cartoons (IEA/CivEd), Full Probit
Models, Females … p. 180Table 38: Monitoring the News (IEA/CivEd), Full Probit Models, Females …p. 181Table 39: Group Discussion Skills (IEA/CivEd), Full Probit Models, Females …p. 182Table 40: Political Interpretation Skills – Political Leaflets (IEA/CivEd), Full Probit
Models, Non-college … p. 183Table 41: Political Interpretation Skills – Political Cartoons (IEA/CivEd), Full Probit
Models, Non-college … p. 184Table 42: Monitoring the News (IEA/CivEd), Full Probit Models, Non-college …p. 185Table 43: Group Discussion Skills (IEA/CivEd), Full Probit Models, Non-college
…p. 186Table 44: Monitoring the News (NGI), Full Probit Models, Females …p. 187Table 45: Collective Decision-Making Skills (NGI), Full Probit Models, Females
… p. 188Table 46: Monitoring the News and Communication Skills (NHES), Full Probit Models,
African-Americans … p. 189Table 47: Monitoring the News and Communication Skills (NHES), Full Probit Models,
Latinos … p. 190Table 48: Monitoring the News and Communication Skills (NHES), Full Probit Models,
Females … p. 191Table 49: Monitoring the News and Communication Skills (NHES), Full Probit Models,
Low-income … p. 192Table 50: Monitoring the News and Communication Skills (NHES), Full Probit Models,
Non-college … p. 193Table 51: Monitoring the News (ACPS), Full Probit Models, Females …p. 194Table 52: Communication Skills and Group Discussion Skills (ACPS), Full Probit
Models, Females … p. 195Table 53: Communication Skills and Group Discussion Skills (ACPS), Full Probit
Models, Non-college … p. 196Table 54: Monitoring the News (ACPS), Full Probit Models, Non-college …p. 197Table 55: Political Interpretation Skills – Political Leaflets (IEA/CivEd), Matching
Methods, African-Americans … p. 198Table 56: Political Interpretation Skills – Political Leaflets and Cartoons (IEA/CivEd),
Matching Methods, African-Americans … p. 199Table 57: Political Interpretation Skills – Political Cartoons and Monitoring the News
(IEA/CivEd), Matching Methods, African-Americans … p. 200Table 58: Monitoring the News (IEA/CivEd), Matching Methods, African-Americans
… p. 201

vii
Table 59: Monitoring the News and Group Discussion Skills (IEA/CivEd), Matching Methods, African-Americans … p. 202
Table 60: Group Discussion Skills (IEA/CivEd), Matching Methods, African-Americans… p. 203
Table 61: Political Interpretation Skills – Political Leaflets (IEA/CivEd), Matching Methods, Latinos … p. 204
Table 62: Political Interpretation Skills – Political Leaflets and Cartoons (IEA/CivEd), Matching Methods, Latinos … p. 205
Table 63: Political Interpretation Skills – Political Cartoons and Monitoring the News (IEA/CivEd), Matching Methods, Latinos … p. 206
Table 64: Monitoring the News (IEA/CivEd), Matching Methods, Latinos …p. 207Table 65: Monitoring the News and Group Discussion Skills (IEA/CivEd), Matching
Methods, Latinos … p. 208Table 66: Group Discussion Skills (IEA/CivEd), Matching Methods, Latinos …p. 209Table 67: Political Interpretation Skills – Political Leaflets (IEA/CivEd), Matching
Methods, Females … p. 210Table 68: Political Interpretation Skills – Political Leaflets and Cartoons (IEA/CivEd),
Matching Methods, Females … p. 211Table 69: Political Interpretation Skills – Political Cartoons and Monitoring the News
(IEA/CivEd), Matching Methods, Females … p. 212Table 70: Monitoring the News (IEA/CivEd), Matching Methods, Females …p. 213Table 71: Monitoring the News and Group Discussion Skills (IEA/CivEd), Matching
Methods, Females … p. 214Table 72: Group Discussion Skills (IEA/CivEd), Matching Methods, Females …p. 215Table 73: Political Interpretation Skills – Political Leaflets (IEA/CivEd), Matching
Methods, Non-college … p. 216Table 74: Political Interpretation Skills – Political Leaflets and Cartoons (IEA/CivEd),
Matching Methods, Non-college … p. 217Table 75: Political Interpretation Skills – Political Cartoons and Monitoring the News
(IEA/CivEd), Matching Methods, Non-college …p. 218Table 76: Monitoring the News (IEA/CivEd), Matching Methods, Non-college …p. 219Table 77: Monitoring the News and Group Discussion Skills (IEA/CivEd), Matching
Methods, Non-college … p. 220Table 78: Group Discussion Skills (IEA/CivEd), Matching Methods, Non-college
… p. 221Table 79: Monitoring the News (NGI), Matching Methods … p. 222Table 80: Group Discussion and Monitoring the News (NGI), Matching Methods
…p. 223Table 81: Communication Skills and Monitoring the News (NHES), Matching Methods,
African-Americans … p. 224Table 82: Communication Skills and Monitoring the News (NHES), Matching Methods,
Latinos … p. 225Table 83: Communication Skills and Monitoring the News (NHES), Matching Methods,
Females … p. 226Table 84: Communication Skills and Monitoring the News (NHES), Matching Methods,
Low-Income … p. 227

viii
Table 85: Communication Skills and Monitoring the News (NHES), Matching Methods, Non-College … p. 228
Table 86: Monitoring the News (ACPS), Matching Methods, Females …p. 229Table 87: Group Discussion and Communication Skills (ACPS), Matching Methods,
Females … p. 230Table 88: Group Discussion and Communication Skills (ACPS), Matching Methods,
Non-college … p. 231

ix
LIST OF FIGURES
Figure 1: Summary of Data Sets ……………………………… p. 27
Figure 2: Summary of Civic Skill Questions ………………… p. 28
Figure 3: Summary of Civic Education Measures ……………. p. 32
Figure 4: Summary of Tables for Chapter 4 – Probit Models …. p. 44
Figure 5: Civic Skills that are Positively Statistically Correlated with Civic Education in
Full Model Probits …………………………………………… p. 46
Figure 6: Other Factors Significantly Correlated with Civic Skill Presence in Full Model
Probits ………………………………………………….. p. 63
Figure 7: Summary of Tables for Chapter 5 – Matching Methods …. p. 67
Figure 8: ATEs for Political Interpretation Skills: IEA/CivEd …….. p. 69
Figure 9: ATEs for News Monitoring Skills: IEA/CivEd …………. p. 70
Figure 10: ATEs for News Monitoring Skills ……………………… p. 71
Figure 11: ATEs for Communication Skills ………………………. p. 73
Figure 12: ATEs for Group Discussion Skills: IEA/CivEd ……….. p. 75
Figure 13: ATEs for Group Discussion Skills ……………………… p. 76
Figure 14: Sample Sizes for Subgroup Analyses ………………….. p. 79
Figure 15: Summary of Tables for Chapter 6 – Subgroup Analyses .. p. 80
Figure 16: NHES Study, Percentage of Low-Income Sample who are Minority
Race/Ethnicity…………………………………………………….. p. 99

1
Chapter 1: INTRODUCTION
Civic skills include the abilities to communicate with elected officials, organize to
influence policy, understand and participate in one’s polity, and think critically about
civic and political life. In short, civic skills enable citizens to participate in the
democratic process. Without them, individuals cannot effectively engage in democratic
deliberation (Soltan 1999).
Civic skills originate from a number of sources, including one’s home
environment, participation in various groups, general education, and civic education.
Civic education courses are a potential source of civic skill development and acquisition.
Yet, civic education is not required of all American students, and as a result many
citizens have never taken a civics course.1
Some researchers hypothesize that higher education and professional employment
provide an alternative to civic education for acquiring civic skills (Schwadel 2002;
Putnam 1995; Verba et al. 1995). However, higher education and professional
employment are often only selectively available, primarily to people of higher
socioeconomic status. Citizens without access to professional employment, higher
education, civic education, or other paths to civic skill development are politically
disabled. The interests of disadvantaged groups often diverge from society’s more
prosperous members (Delli Carpini and Keeter 1996), and a lack of civic skills and
1 Civics coursework and / or social studies is currently mandated in 41 states (CIRCLE 2004). According to the International Association for the Evaluation of Educational Achievement Civic Education survey (IEA/CivEd), approximately 70% of U.S. fourteen-year-olds have studied a civics topic. According to Niemi and Junn (1998) 10% of students took no American government or civics coursework in grades 9 through 12 (p. 66).
2
political knowledge may further constrain their ability to effectively influence public
decision-making.
This dissertation empirically examines whether civics coursework and content
contribute to the acquisition of civic skills. In turn, this dissertation speaks to broader
issues of inequality in civic skill development and the distribution of civics coursework.
Researchers have defined and categorized civic skills, but empirical research on civic
skills is sparse. By examining civic skills, this dissertation investigates the ability, not
the willingness, of citizens to engage in political participation.
Decline in Youth Civic Engagement
Declining political participation among young people is a concern. Voter turnout
rates, one indicator of political participation, have declined since 1972 for Americans
under the age of 25. The exception to this is the most recent Presidential election. In
November of 2004, 42.3% of eligible 18-24 year-olds voted, compared with 36.5% in
November of 2000 (CIRCLE Staff 2004). In all, the rate of decline in voter turnout for
young Americans is greater than the rate of decline among Americans aged 25 and over
(Levine and Lopez 2002).
Other measures of civic and political participation also evidence decline among
all age groups, including young Americans (Putnam 1995). Community group
memberships, club memberships, organizational involvement, and citizen participation in
campaign activities have all decreased over the past thirty years (ibid.). However, youth
participation in community life has increased over the last ten years, with a rise in
voluntarism and participation in community service activities (Lopez 2004; Longo 2004).

3
Explanations for the decline in political participation include poor civic skills and
a lack of civic engagement. Understanding both components is crucial to explaining
declining political participation among young people. This dissertation begins to
comprehensively address the skills component, contributing to a greater understanding of
this problem.
Civic Education
The American founders felt education should provide a moral education and form
character in future citizens (Pangle and Pangle 2000). In particular, President George
Washington urged Congress to support a civic education that would consist of “teaching
the people themselves to know and value their own rights; [and] to distinguish between
oppression and the necessary exercise of lawful authority” (Fitzpatrick 1939 [1790] p.
493). John Dewey and Charles Merriam also espoused the necessity of education for
developing characteristics of citizenship in a democracy, and the responsibility of
American schools to teach youth how to participate in a democracy (Niemi and Junn
1998). Benjamin Franklin maintained that good schools should include the value of
promoting democracy (Hochschild and Scovronick 2000).
Today, the purpose and content of civic education remains a subject of
deliberation. Often, communities debate which normative purposes and values to teach.
Civic education teaches values that can conflict, such as patriotism vs. membership in
global society, or socially acceptable attitudes of character vs. independent thinking
(Nelson 1991). Civic education requirements and curricula differ among states, and even

4
among school districts within states. However, even when civic education policies
mandate civic requirements, they often do not mandate the values and norms to be taught.
State policies requiring civics coursework or examination vary widely. In
general, over 70% of American ninth grade students have studied a civics topic,
according to the IEA/CivEd survey (Torney-Purta et al. 2001). The majority of states
require a government or civics course for high school graduation, while fewer have a
state statute requiring schools to offer government or civics courses (CIRCLE 2004). As
of 2003, only five states required students to pass a social studies examination as a high
school graduation requirement (National Center for Learning and Citizenship 2003).
While state assessment systems are often a focus of education reform, only twenty-two
states’ assessment systems include knowledge of government or civics (Education
Commission of the States 2004).
Service-learning requirements also are becoming more common in high school
curricula. Service-learning is generally defined as including a “curriculum-based form of
community service” (Stagg 2004, p.1). In 1999, 30% of high school students participated
in a service-learning project (ibid.). In 2004, 44% of high schools participated in service-
learning projects (ibid.). Although data on service-learning is difficult to compare over
time due to different definitions of service-learning, general trends indicate an increase in
service-learning participation (ibid.). Civic education content is discussed further in
Chapter 2.

5
Civic Skills in the Literature
The majority of civic skills literature employs qualitative and theoretical research
methods.2 Studies that do employ quantitative methods examine civic skills as covariates
in models explaining political participation and civic engagement. Both Verba et al.
(1995) and Brady et al. (1995) provide bedrock studies by using civic skills and resources
as predictors of political participation. In contrast, Moely et al. (2002) use civic skills
and civic engagement as outcomes to gauge the success of service-learning programs.
Nie et al. (1996) include civic skills among the attributes of political engagement and
democratic enlightenment in an examination of their relationship with formal education.
These studies are noteworthy for their empirical explanations of political participation,
civic engagement, and citizenship. Yet they have not contributed to a deeper
understanding of civic skills themselves.
The delineation of civic skills has emerged only recently. Kirlin (2003) identifies
four skill categories: collective decision-making, communication, organizational, and
critical thinking. Only collective decision-making skills, communication skills, and some
organizational skills are empirically measurable. Patrick (2002) identifies two important
categories of civic skills: participatory and cognitive. Both categories are empirically
measurable. Patrick also distinguishes between cognitive skills (the capacity to analyze
and interpret) and civic knowledge (the recognition of facts and principles) (2002, 6).
This dissertation examines participatory, communication, collective decision-making, and
cognitive skill categories.
Two notable studies have examined civic skills as dependent, or outcome,
variables in an empirical setting. Campbell (2001) uses civic skills as a dependent
2 See, for example, Kirlin (2003) and Patrick (2002).

6
measure to examine differences among types of schools. Using an index of civic skills as
the dependent variable, he examines differences between public, private, and religious
schools. By creating an index of civic skills, Campbell’s method combines different
skills into one measure. However, data richness can be lost by combining skills into a
single index. Schwadel (2002) considers civic skills as direct outcomes in his
examination of religious group participation. Schwadel uses measures of church
leadership positions and church group participation as proxies for expressing civic skills
(ibid.). Both Campbell’s (2001) and Schwadel’s (2002) studies are helpful contributions
to the literature, yet neither tests for a correlation between civics coursework and civic
skill development.
A strong scholarly focus on civic skill research is absent, while much research
assumes an understanding of civic skill acquisition. For example, Verba, Schlozman and
Brady’s cornerstone study states as accepted fact that “civic skills are acquired
throughout the life cycle beginning at home and, especially, in school.” (1995, 305).
Since this 1995 work, the field has moved forward, incorporating the presumption that
individuals learn civic skills in schools. This dissertation empirically tests that claim and
focuses on civic skill acquisition.
Civic Education in the Literature
Civic education research also does not address civic skills. However, such
research does address civic engagement and political knowledge. Niemi and Junn
(1998), using the National Assessment of Educational Progress survey, find a positive
relationship between civics coursework and civic and political knowledge. Torney-Purta
7
(2002), using the International Association for the Evaluation of Educational
Achievement Civic Education survey (IEA/CivEd), finds increased civic knowledge and
engagement among students who take civics courses. The IEA/CivEd survey examined
numerous types of civic education requirements. A recent study by the National
Conference of State Legislatures and partners suggests that civic education results in an
increased likelihood to vote and increased civic knowledge and engagement (Kurtz et al.
2003). Finally, McDevitt et al. (2003) and the Carnegie Corporation of New York and
the Center for Information and Research on Civic Learning and Engagement (2003)
recognize program evaluations detailing the positive effects of specific civics curricula on
political engagement and knowledge.
A few studies have examined the contribution of civic education to building civic
knowledge and engagement. Niemi and Junn (1998) in particular have examined civic
education and civic knowledge. Torney-Purta (2002) reports the results of a study that
links formal education with civic knowledge and engagement. These studies have
incorporated civic skills within their analyses, but have not employed civic skills as
outcomes. These studies necessitate a focus on civics coursework as a predictor of civic
skills. This focus will clarify the contribution of civics coursework to the acquisition of
civic skills, furthering an understanding of civic education.
This dissertation’s contribution to understanding civic skill acquisition is twofold.
Primarily, its quantitative study of the correlation between civic skill presence and civics
coursework is unprecedented. The majority of existing research on both civic skills and
civic education has been qualitative, while a few quantitative studies exist. Existing
research has focused on either civic skills or civic education without their joint

8
examination. Second, this dissertation employs robust methods to examine the
relationship between civic skills and civic education. Other quantitative studies of civic
skills (Campbell 2001 and Schwadel 2002) have not examined civic education and have
not applied a matching methods framework to the study of civic education. This
dissertation uses probits and propensity score matching methods to examine civic skill
presence and civics coursework.
Map of the Dissertation
This dissertation tests for a correlation between civic education course-taking and
the presence of civic skills. Chapter 2 discusses theories of political participation and
highlights the absence of civic skill origination in these theories. The chapter continues
with a discussion of civic skill definition and skill links to political knowledge and
political competence. Chapter 2 concludes with a discussion of civic education.
Chapter 3 describes the datasets used throughout the dissertation and provides
descriptive statistics and tabulations. Chapter 3 also describes the dissertation’s research
methodology. Chapter 4 contains the majority of the data analyses and includes probit
models for all examined data sets and civic skills. Chapter 5 details the propensity score
matching analyses and compares results to the probit models in Chapter 4. Chapter 6
offers an analysis of heterogeneous effects of civics coursework on civic skills. The
chapter details subgroup analyses, exploring differences in the effects of civic education
on racial, ethnic, gender, income, and education groups. Chapter 7 concludes the study
and includes policy recommendations and thoughts for future research.

9
Chapter 2: CIVIC SKILLS AND CIVIC EDUCATION
Civic skills are essential for political participation. Verba et al. (1995) and Schur
(2003) have shown that increased levels of civic skills result in greater political
participation. A complete understanding of civic skills necessitates a review of theories
of political participation. An American link between a healthy democracy and citizen
participation was originally documented by Tocqueville in 1840. Tocqueville found that
egalitarian and individualistic mores dominated the American version of democracy.
These values threatened to undermine social cohesion, but they were checked by citizens’
participation in voluntary associations. Since Tocqueville’s first observations, theorists
have been examining political and societal participation.
Theories of Political Participation
Rational choice theory is one of the oldest theories of individual behavior to be
applied to political participation (Downs 1957). Rational choice theory explains
individual behavior as utility maximizing. Individuals make choices based on their
preferences to maximize their personal objectives. Rationality is assumed to be
consistent across all individuals (Green and Shapiro 1994). In the case of voting, the
individual rationally weighs the costs and benefits of voting to determine whether they
will vote. Voting is seen through the perspective of a market transaction. Costs include
the inconvenience of travel to the polls and the belief that one vote will not influence the
outcome of the election. Benefits include the gratification of seeing one’s preferred
candidate win the election and the gratification of the act of voting. When viewed as a

10
collective action problem, rational choice theory predicts that individuals will not vote.
The theory also predicts that voter turnout rates decline as the projected margin of victory
increases (Barzel and Silberberg 1973).
Rational choice theory has limitations. First, it attempts to explain the behavior of
a collectivity through individual actions, when collective actions should also be
considered. Also, it does not take into consideration psychological or emotional reasons
for voting and assumes that all individuals behave in a common rational manner.
Furthermore, Green and Shapiro (1994) assert that little empirical evidence exists to
support rational choice theory, despite a large quantity of research on the subject. As an
explanation of political behavior, rational choice theory is not methodologically sound
(ibid.).
Other theories of individual political participation are resource-based. Rosenstone
and Hansen (1993) document the importance of resources in promoting political
participation. Resources include money, time, knowledge, skills, and self-confidence
(ibid., p. 74). The authors include political efficacy as a psychological resource valuable
to participation. Verba et al. (1995) develop a resource-based theory in their civic
voluntarism model. The civic voluntarism model maintains that political participation is
a function of political engagement, recruitment through social networks, and resources.
Resources include time, money, and civic skills. Resource-based models are the only
theories to account for the contribution of civic skills and political abilities toward
political participation.
Social-psychological theories explain political participation through psychological
motivators. According to these theories, citizens’ attitudes, feelings of political efficacy,

11
beliefs about governmental responsiveness, and even threats of pending undesirable
policy changes all motivate political participation and voter turnout (Abramson and
Aldrich 1982; Miller and Krosnick 2004). From this perspective, market-like costs and
benefits are not influential to participation. Instead, these theories focus on providing
social and psychological explanations for political participation among citizens
(Fitzgerald 2001).
Finally, the institutional theory of political participation shifts the explanation for
political participation from the individual to institutions. For example, Rosenstone and
Hansen (1993) state that mobilization by political leaders and political parties explains
when citizens participate. Wattenberg (1984) explains political parties as instrumental in
mobilizing, socializing, organizing, and recruiting voters. More broadly, March and
Olsen (2000) describe interests, rules, and resource distributions as a function of the
political process.
While theories of political participation are numerous, theories of the origins of
political abilities are scarce. Most theories of political participation explain why people
want to participate, not whether they are able to participate. With the exception of the
resource-based theories, theories of participation do not consider the contribution of skills
and abilities to political participation. Yet even the resource-based theories do not
explain the derivation of civic skills and abilities in individuals. Although incomplete,
the resource-based theories provide the best available framework for this dissertation by
illustrating a relationship between civic skills and political participation. However, a
clear theory of the origins of civic skills remains absent.
12
Civic Skills
Civic skills comprise individual abilities. These abilities range from “…the
communications and organizational abilities that allow citizens to use time and money
effectively in political life” (Verba et al. 1995 p. 304) to “skills for political action,
communication, ability to identify social issues, and tolerance,” and “skills useful in civic
endeavors” (Moely et al. 2002 pp. 1, 3). Kirlin (2003) defines civic skills as “a set of
skills which are required to effectively participate in civic and political life …integral to
…political participation” (p.3). This section discusses civic skills and their relation to
political participation, political competence, and political knowledge.
Functions of Civic Skills
The primary role for civic skills is political participation. Verba and Nie (1972)
define political participation as individual political actions that influence government
actions. Verba et al. (1995) assert that civic skills foster individual political participation.
Gutmann (1987) espouses the necessity of civic skills for the pursuit of community
participation and deliberation to result in societal justice.
Verba et al. (1995) provide a clear purpose for civic skills in their civic
voluntarism model. Their model explains individual political participation as a function
of political engagement (political willingness), recruitment into political participation,
and resources. Civic skills, along with time and financial flexibility, are resources. The
model provides a neat view of individual political participation, but does not provide an
explanation of the origins of civic skills themselves.

13
According to Gutmann (1987), skill development is essential for democratic
individuals and communities. Her primary concern is democratic deliberation and its
participatory requirements. “Deliberation … calls upon skills of literacy, numeracy, and
critical thinking, as well as contextual knowledge, understanding, and appreciation of
other people’s perspectives.” (ibid., p. xiii). These skills are necessary not only for
individual political participation, but also for a society’s “collective capacity to pursue
justice.” (ibid.). This collective willingness to deliberate in pursuit of justice is the
hallmark of democratic citizens, in contrast to self-interested citizens. While both
democratic citizens and self-interested citizens require civic skills to participate,
democratic citizens require civic skills to deliberate to achieve societal justice.
Both Verba et al. and Gutmann highlight the importance of civic skill acquisition
and development. While individual participatory actions such as voting and writing
letters to elected officials are more common than collective actions, both are important to
understand. Also, more scholars focus on explaining individual participation than
collective participation. Yet both individual political participation and collective
deliberation are necessary for a healthy democracy. Civic skills play a role in the success
of both.
Civic Skills and Political Competence
Civic skills are closely associated with citizen competence, and are often viewed
as components of competence. Almond and Verba (1963) maintain that skills are
necessary for political competence. They define politically competent individuals as
those who can exert influence over a governmental decision. To them, politically

14
competent, yet ordinary, citizens can influence significant decisions. Almond and Verba
also assert that democracy involves high levels of participation in decision-making
(ibid.). They list actions necessary for citizen influence on government decision-making
such as organizing a protest or petition, contacting political leaders, voting, or even
violence (ibid., p. 191). While these actions are clearly behaviors, these behaviors
require civic skills.
Strate et al. (1989) also define civic competence as including components of
knowledge and “habits of knowledge acquisition relevant to politics” (p. 450). These
habits, such as monitoring public events to refresh political knowledge, are civic skills.
For Strate et al., civic competence requires civic skills. Competence is necessary for
political participation, and their study links life-cycle changes in civic competence with
changes in political participation.
Smiley (1999) warns against labeling citizens as competent or incompetent.
According to her, these labels resemble traditional defenses of barriers to participation,
such as voter registration exam requirements and voter disenfranchisement. She asserts
that citizen competence can be an assessment of one’s knowledge and abilities but should
not be a judgment about one’s knowledge and abilities (ibid., p. 375). Alternatively
stated, competence includes both knowledge and skills, to be assessed objectively.
Both Soltan (1999a) and Boyte (1999) define civic competence as comprising
civic skills. Soltan states that competence includes “a combination of attitudes and ideals
that include skills” (1999a, p. 20). Boyte defines civic competence as “capacities, traits
and skills tied to … practices of citizenship” (1999, p. 259). Boyte also emphasizes the
role competence plays in successful democratic deliberations, necessitating

15
communications skills (1999). Citizen competence and civic skills are necessary for a
democracy that creates common goals (ibid.).
According to these researchers, civic skills play a significant role in the makeup
of citizen competence. Competence, in turn, enables political participation and
successful democratic deliberation.
Civic Skills and Political Knowledge
Patrick (2002) maintains that a combination of political knowledge and civic
skills are necessary for thriving democratic citizens. In particular, “knowledgeable
citizens are better citizens of a democracy in regard to their possession and use of civic
skills” (ibid., p. 11). He links political knowledge with greater levels of political
engagement. He describes knowledge of concepts such as republicanism,
constitutionalism, human rights and liberalism, and citizenship as essential civic
knowledge components (ibid., p. 12). Although Patrick’s description of the relationship
between civic skills and political knowledge is brief, it is clear they are distinct
components of a democratic citizen.
Delli Carpini and Keeter (1996) define political knowledge as the “range of
factual information about politics stored in long-term memory … the most important
component of a broader notion of political sophistication” (p. 294). The authors strongly
link political knowledge with political action. Political knowledge, they assert,
contributes to political participation, the construction of citizens’ opinions, and political
action in relation to citizens’ interests (ibid., p. 219). Their study also asserts that
significant differences exist among Americans’ individual levels of political knowledge.

16
Importantly, greater knowledge leads to greater political participation, increasing the
legitimacy of a democracy. They also contend that political efficacy and trust influence
levels of political learning (ibid.). In all, their study of political knowledge is thorough
yet does not incorporate civic skills.
Popkin and Dimock (1999) study political knowledge, specifically examining
citizens’ knowledge of how government works. While they agree with Patrick (2002)
and Delli Carpini and Keeter (1996) that higher levels of political knowledge lead to
higher political participation in the form of voter turnout, they contend that high levels of
political knowledge are not necessary for voters to make informed political decisions.
They maintain that voters can be sufficiently competent through the use of information
short-cuts to make political judgments (p. 120). These short-cuts are used to help citizens
make political decisions by incorporating experiences of daily life, the media, and
campaigns to process political information (ibid., p. 120).
The study of political knowledge speaks to the question of whether citizens who
make public decisions are capable of the task. Lupia and McCubbins (1998) label this
problem the democratic dilemma. They conclude that a lack of knowledge is acceptable,
however, as decision-makers will substitute advice from other people and institutions for
their own lack of political knowledge. They assert that “reasoned choice does not require
full information” (ibid., p. 2). Other political scientists agree that judgmental short-cuts,
or heuristics, can be substituted for significant political knowledge to make political
decisions (Sniderman et al. 1991; Iyengar 1990; Hacker and Pierson 2005).
I define civic skills as abilities necessary for political participation. In this sense,
the short-cut process is a civic skill. For some citizens, sufficient political decision-

17
making may bypass the need for political knowledge when heuristics lead to informed
political judgments. Although extensive political knowledge may be unnecessary, the
skill of using heuristics is necessary for making political decisions.
Hacker and Pierson (2005) describe “New Pluralism” as the belief that “a rough
version of citizen control over politicians exists, even though political resources,
including political knowledge, are distributed unequally” (p. 5). In this sense, individuals
are capable of protecting their own interests. This differs from “Old Pluralism,” or the
concept that citizen power to shape politics was held in group memberships. Groups
could effectively fight for citizens’ interests (ibid.). Page and Shapiro (1992) provide
evidence of “Old Pluralism.” They contend that the aggregate value of voter decisions is
more powerful and more rational than individual voter decisions alone. These authors are
confident that successful political decision-making occurs, despite a lack of political
knowledge among individuals.
Though existing literature does not provide a particularly nuanced view of the
relationship between civic skills and political knowledge, a clear difference between
skills and knowledge exists. Civic skills are abilities necessary for political actions,
while political knowledge is familiarity with political information, regardless of the
intention of political action. Furthermore, extensive levels of political knowledge are
unnecessary when citizens use judgmental short-cuts to make political decisions. The
process of using heuristics to make political decisions is a civic skill. Overall, civic skills
are necessary for individuals to make political decisions. Political knowledge is helpful,
but not required, for individuals to make political decisions.

18
Origins of Civic S kills
Researchers have examined the origins of civic engagement and political
participation. For example, Miller and Kimmel (2003); Torney-Purta (1990); and
Skocpol (1999) explore youth development of citizenship behaviors, youth development
of civic engagement, and youth relations with social institutions. Their studies center on
political socialization theory. Political socialization theory explains the origins and
acquisitions of youth belief systems and the development of political consciousness in
individuals (Renshon 1977).
However, few researchers have examined how civic skills originate in citizens.
While political socialization research examines the development of political orientations
and behaviors, it does not examine how young people become capable of political
participation. In short, political socialization research has focused on the development of
political willingness, not political abilities. This section will examine research that
addresses civic skill origination.
Both Flanagan (2003) and Youniss et al. (2001) examine the benefits of youth
participation in groups toward developing skills and engagement. Flanagan (2003)
argues that youth membership in community institutions requires exercising rights and
responsibilities related to membership. These responsibilities build civic skills. As a
contrast to political socialization theory, she illuminates youth group participation as the
primary source for youth ties to a community (ibid., p. 257). Youniss et al. (2001)
examine youth development of civic identity through group participation. They maintain
that participation in groups “introduces youth to the basic roles and organizational

19
processes required for adult civic engagement” (ibid., p. 246). In turn, these roles and
processes lead to the development of civic skills.
Schur (2003) and Pateman (1970) assert that one source of civic skill
development is the workplace. Schur (2003), in her study of disabled workers, finds that
employment increases political activity by increasing income, efficacy, and civic skills.
Her research directionally links employment to civic skill development to political
participation. Pateman (1970) asserts that citizens practice political participation skills
through employment. She claims that political attitudes are formed in the workplace and
that professional workers have more opportunities to learn participatory skills than
laborers and non-professionals (ibid.). She contends that this gap affects family political
environments when non-professional workers have no opportunities to learn participatory
skills. She offers this as evidence of a socioeconomic gap among participatory skill
distribution (ibid.).
Verba and Nie (1972) also assert that socioeconomic status is related to political
participation. They claim that social status determines civic attitudes among people, in
turn influencing their participation. They propose that citizens need ample resources
(time, skills, and money) in order to participate. As one’s job and education largely
dictate resource development, these resources can be unequally distributed (ibid.). This
model is updated by Brady et al. (1995) who incorporate the importance of resources
(time, money and civic skills) into determining levels of political participation. They
maintain that skills and resources are distributed partially according to socioeconomic
status (ibid.).

20
Child Development
Research on the political socialization of children is ample. Once again, this
literature’s focus is the development of political socialization and attitudes in children,
not the development of civic skills. Early studies of childhood political socialization
focused on children’s awareness of politics and their development of ideas about
government structure, political ideology, and foreign policy (Connell 1971; Hess and
Torney 1967; Merelman 1971). Andrain (1971) also contributed to this line of study with
his research on civic awareness in children. However, he defines civic awareness as
including both “cognitive (intellectual) and affective (value-laden) dispositions” (ibid.,
p.6). He defines cognitive civic awareness as attention to political entities, with or
without political knowledge. For example, an awareness of political news may develop,
requiring cognitive skills. While his study distinguishes between cognitive skills and
value-laden dispositions, he measures cognitive skills as political knowledge (ibid.).
Recently, Kirlin (2004) has examined the origins of civic skills in adolescents.
Her work categorizes civic skills into groups, and then lists skill areas measurable for
researchers. She uses a developmental approach to examine when adolescents are best
able to learn different types of civic skills. For example, “basic communication skills
develop in early and middle childhood … and the more sophisticated critical thinking
skills appear in mid-late adolescence” (ibid., p. 8). Kirlin also asserts that even though
these capacities are present in adolescents according to their developmental clock,
adolescents require “instruction and exposure” to develop skills (ibid. p. 9). Her research
is original for its recognition of different types of civic skills and their association to
developmental abilities.

21
Finally, some researchers hypothesize that education can be a source of civic skill
development. Verba et al. (1995) correlate education to increased civic skills. They
assert that primary skills such as reading and writing are necessary for political
participation, and that increased education leads to greater political participation (ibid.).
More common, however, are studies such as Patrick’s (2002) that catalog the civic skills
that should be taught in schools. Yet his work and others lack a rigorous study of
whether schools are actually teaching these skills. Schools as originators of civic skills,
and the democratic purposes of schools, will be discussed further in the next section.
This section on civic skills serves to examine the relationship between civic skills
and other important areas of civic engagement, such as civic competence and political
knowledge. Some of the civic skill measures this dissertation examines may not be
purely or solely skills. This dissertation’s civic skill measures may examine both ability
and willingness to participate, or both ability and engagement. However, all the civic
skills in this dissertation are precursors to political participation. The skills this
dissertation examines are discussed individually in Chapter 3.
Civic Education Content
The nature of civic education coursework has changed over the last fifty years.
Coursework comprising problems in government has decreased, while coursework about
American government institutions has predominated (Niemi and Smith 2001; Weiss et al.
2001). Generally, “problems” courses invite more classroom discussion about public life,
while American government courses teach basic facts about government institutions and
processes (Carnegie and CIRCLE 2003). The difference between these two curricula is

22
teaching civic skills through group discussion. In turn, students today may be taking
American government and civics courses without learning communication and group
discussion skills.
The content of civic education curricula is often discussed. The 1983 Educational
Reform Reports (Ascher 1983) promoted literacy as the primary curricular focus for
schools. Literacy took precedence over teaching social and civic skills as the primary
goal for education (ibid.). In contrast, Patrick (2000) prioritizes civic education. Within
civic education curricula, he emphasizes equal teaching of both civic knowledge and
skills. Patrick claims that teaching civic knowledge coupled with cognitive and
intellectual civic skills is necessary for civic education to be “an effective agent of civic
development among American youth.” (2000, p.2). Gutmann (2000) also calls on public
schools to cultivate skills essential for democratic virtues.
Gutmann (1987) declares that teaching civic education, including knowledge,
virtues, and skills necessary for political participation, “has moral primacy over other
purposes of public education in a democratic society.” (p. 287). Gutmann further
contends that democratic virtue should be taught in history and civics courses (ibid.).
Teaching democratic virtue should carefully include the “willingness and ability of
citizens to reason collectively and critically about politics.” (ibid. p. 107). She also
emphasizes the importance of education as a means of conscious social reproduction for a
society, or a means of transmitting political values to other generations (ibid.). Patrick
(2002) points out the paradox inherent in her emphasis, in that the promotion of specific
political ideals is coupled with teaching the importance of free and independent thinking
as a cornerstone to democracy. In this sense, it is essential to teach competing ideas of an

23
individual’s right to liberties and the importance of civic republicanism (ibid.). Goodlad
(1996) also maintains that successful democratic education will find a common center
between teaching individuality and civic responsibility.
Currently, American civic education appears to embrace either individuality or
civicism, without meeting a common center. In practice, civic education is focused on
either civics courses or service-learning (Boyte 2003). While civics courses emphasize
liberal political theory and are rights-centered, service learning emphasizes voluntarism
and communitarianism (ibid.). Boyte maintains that teaching students about public work
and organizing skills is absent from these two common approaches (ibid.). In particular,
Patrick and Hoge (1991) show that high school civics textbooks are focused on teaching
American political institutions, and do not teach participatory civic skills.
Westheimer and Kahne (2004) document the accelerated increase in service
learning programs available to high school students. While these programs are important
to teach a commitment to serve others, they teach a non-participatory form of political
citizenship. In particular, the authors find “the emphasis placed on personal
responsibility and character an inadequate response to the challenges of educating a
democratic citizenry” (ibid. p. 243). Conrad (1991) asserts that experiential learning can
teach skills directly related to the learning environment, such as child-care skills learned
through interaction with a day care center. However, these skills can be particular to the
task at hand and not easily transferable to political participation. Neither traditional civic
education coursework nor service-learning approaches always teach civic skills.

24
A final word on civic skill definition is necessary. As stated earlier, civic skills
are the abilities needed to politically participate. They are distinct from civic confidence,
or the belief that one has civic skills. Coursework has been shown to increase confidence
without increasing skills, at times (Katila et al. 2004). Further, civic skills are separate
from civic motivations, or reasons prompting individuals to politically participate.
Although these are distinct, a small measure of all three – civic skills, civic confidence,
and civic motivations – must be present for political participation. As Chapter 3 will
reveal, some measures of civic skills used in this dissertation also document civic
confidence and motivation.
Overall, this chapter illustrates a lack of scholarship specific to civic skills,
particularly regarding their origins, their development in children, and their relation to
participation and engagement. While current research elaborates upon the relationship of
political willingness to political participation, engagement, and origins, the study of
political abilities is incomplete. This dissertation contributes to research on political
abilities, by examining the relationship between civic education and civic skills. Chapter
3 outlines the methodology and descriptive statistics for this study.

25
Chapter 3: DATA AND METHODS
This chapter describes the data sets used in this dissertation and their measures of
civic skills, civic education, and other background characteristics. It also provides
descriptive statistics for all four data sets. The chapter concludes by outlining the
research methodology used in this dissertation.
Datum
This dissertation employs the following four data sets: the International
Association for the Evaluation of Educational Achievement Civic Education survey
(Torney-Purta et al. 2001) (IEA/CivEd); the Civic and Political Health of the Nation: A
Generational Portrait (Keeter et al. 2002) (NGI); the American Citizen Participation
Study (Verba et al. 1990) (ACPS); and the National Household Education Survey’s Civic
Involvement study (U.S. Department of Education 2001) (NHES). Numerous data sets
were examined for their potential use in this study. While some existing data sets
thoroughly measure civics coursework, they do not measure civic skills.3 Only a small
number of data sets measure both civic skills and civic education. The four examined
data sets were chosen for their prevalence of appropriate skill and education measures.
Data Sets and Samples
The IEA/CivEd survey was conducted to measure civic skills and civic education
course content. The IEA/CivEd survey comprises data from 2,811 ninth-graders in the
U.S. as part of an international study of civics among fourteen-year-olds worldwide in
3 Examples include the National Assessment of Educational Progress, 1998, the National Educational Longitudinal Study of 1988, and High School and Beyond Surveys.

26
October of 1999. This dissertation uses only the U.S. data. U.S. schools were chosen for
participation in the survey through a three-stage design. Random sampling within
classrooms was not done; entire classrooms were administered the survey during their
school day. Response rates within schools were at least 85%. This dissertation uses all
of the American IEA/CivEd survey data. The data was adjusted for missing values and
weighted toward a nationally-representative sample. With these adjustments, the sample
size is 1,953.
The NGI survey was conducted to better understand civic engagement among
young people. The NGI survey is a random digit dialed telephone survey of 3,246
Americans aged fifteen and older conducted in the spring of 2002. The survey focused
on the fifteen to twenty-five-year-old age group. One thousand and one respondents
comprise the fifteen to twenty-five-year-old age group. This generation is identified in
the survey as the “DotNets.” The NGI contains a wide range of questions on civic
engagement. Only the fifteen to twenty-five-year-old students were examined from the
NGI data set. The sample was weighted appropriately for the use of this age group. The
resulting sample size is approximately 556.4
The NHES Youth Interview was part of a telephone survey consisting of three
sets of interviews: parent, youth, and teacher. The survey was developed by the National
Center for Education Statistics, U.S. Department of Education, and conducted in the
beginning of 1999 as a random digit dial telephone survey of households in the United
States. The response rate for the initial screener interview was approximately 76%; the
response rate for the completed extended interview was approximately 56%. The NHES
employed a stratified, list-assisted sample design. The NHES includes a variety of
4 Unlike the IEA/CivEd survey, the NGI sample includes college undergraduate students.

27
questions related to civic education, extracurricular activities, school curriculum, civic
knowledge, and civic skills. The survey was conducted of 6th through 12th grade
students; only tenth and eleventh grade students are examined for this study. Only the
Youth Interview component is used in this study. The sample size is approximately
2,100.
The ACPS was conducted in 1990 of adults aged eighteen and older. The survey
consisted of both telephone and in-person interviews of a nationally representative
sample. The data set includes most empirically measurable civic skills, except for
political material interpretation skills. The ACPS employed clustered and stratified
probability sampling techniques. ACPS respondents were asked whether they took a
course in high school that required them to pay attention to current events. For this
dissertation, respondents aged eighteen to thirty are examined. The sample size is
approximately 630.
These data sets are summarized in Figure 1 below.
Figure 1: Summary of Data SetsACPS NHES IEA/Civic
EducationNGI
Year Data Collected
1990 1999 1999 2002
Age Spanof Sample
18-30 year-olds 10th and 11th
grade students14 year-old students
15-25 year-old students
Sample Size
638 2,106 1,953 556
How Data Collected
Telephone and in-person surveys
Telephone survey
Survey administered to classrooms
Telephone survey

28
Civic Skill Measures
All four data sets provide measures of civic skills, though no one data set provides
measures of all civic skills. This dissertation examines participatory ski lls, cognitive
skills, communication skills, and collective decision-making skills to identify the effect
of civic education on the acquisition of civic skills. This study will only use empirically
measurable civic skills (see Appendix A for an abbreviated view of civic skills and their
background literature and Appendix B for survey questions measuring civic skills). Civic
skills fitting these criteria include:
- English language skills
- the ability to write a letter to an elected official
- the ability to give a speech or make a public statement
- the ability to interpret political cartoons or leaflets
- frequency of reading the newspaper or monitoring public events
- the ability to participate in a discussion with a group
The civic skill questions in each data set are summarized below in Figure 2.
Figure 2: Summary of Civic Skill QuestionsNHES IEA ACPS NGIEnglish proficiency, Ability to write letter, Ability to give speech, Monitor news
English proficiency, Political interpretation, Monitor news, Group discussion
English proficiency, Ability to write a letter, Ability to give a speech, Monitor news, Group discussion
Monitor news, Group discussion

29
Communication Skills
The IEA/CivEd survey, the NHES survey, and the ACPS measure English
proficiency by asking respondents what language is spoken at home or what language
they speak most. Verba et al. (1995) state that English language skills are necessary civic
skills, as participation in American democracy is difficult without them.
Both the NHES survey and the ACPS measure whether respondents feel they can
successfully write a letter or give a speech that conveys their opinion. Both surveys’
questions are worded to emphasize the abilities necessary to perform these actions. This
differs from the IEA/CivEd survey’s similar questions that ask students if they intend to
write a letter or give a speech when they are adults (see Appendix B). The primary
emphasis of the IEA/CivEd survey’s questions measures willingness or intention to write
a letter or give a speech, instead of ability. Therefore, the IEA/CivEd survey’s questions
are not used in this dissertation.
While the NHES survey questions and the ACPS questions measure the
respondent’s ability to write a letter or give a speech, these questions also measure
willingness or confidence to take these actions. For example, a respondent answering
“yes” to the question: “Do you feel that you could write a letter that clearly gives your
opinion?” is stating her positive assessment of her ability to write the letter and her
confidence that she could take this civic action. Even though these questions do not
purely measure ability, the NHES and ACPS measures of communication skills are the
best available measures of communication abilities, and are the ones used in this

30
dissertation. A thorough discussion of self-assessed skill measures occurs later in this
chapter.
Cognitive Skills (Political Interpretation Skills)
The IEA/CivEd survey measures political interpretation skills as ability measures.
Torney-Purta (2002) regards political information interpretation as a skill necessary for
political participation. Further, she argues that political communication interpretation
skills (such as interpreting political leaflets and cartoons) are primary components of
civic knowledge. Participatory behaviors, such as voting, require an ability to understand
political communication. In this dissertation, political interpretation skill measures
include the interpretation of political leaflets and political cartoons. Political
interpretation skills are measured as correct or incorrect answers to multiple choice
questions.
Participatory Skills (News Monitoring Skills)
The IEA/CivEd survey, the NGI survey, the NHES survey, and the ACPS include
news monitoring skill measures as self-assessed measures. News monitoring skill
measures include reading the newspaper, watching television news, listening to radio
broadcast news, and reading news on the internet. Patrick (2000) and Kirlin (2003)
define the monitoring of public events as a civic skill. Monitoring public events and
issues is another capacity necessary for political activity (Brady et al. 1995). These data
sets capture the frequency of monitoring the news. While news monitoring frequency is

31
at best a proxy for willingness and ability to monitor public events, these are the best
available measures of news monitoring ability.
Collective Decision-Making Skills
The IEA/CivEd survey, the ACPS, and the NGI survey measure group discussion
skills as self-assessments. Group discussion skills are necessary to make decisions in a
group and understand multiple perspectives about an issue. Group discussions provide
exposure to diverse viewpoints and populations (Hurtado et al. 2002). These abilities can
accelerate democratic outcomes (ibid.). Group discussion also provides interaction with
other citizens necessary to promote common interests (Kirlin 2003).
Unfortunately, these data sets do not measure how successful citizens are at group
discussion, or at coming to a consensus in a group, or at getting along well with others in
a decision-making group. The survey measures used in this dissertation catalog how
often, if ever, respondents have worked in a group or participated in a group discussion.
Clearly these questions are capturing not only ability to engage in group discussion, but
also willingness to engage and confidence in one’s group discussion skills. While it is
uncertain whether these measures are a pure reflection of group discussion skills, they are
the best available instruments.
Civic Education Measures
In this dissertation, civic education includes civics courses, government courses,
and courses requiring students to pay attention to current events. All four data sets used
in this dissertation measure civic education course-taking. The IEA/CivEd includes six

32
measures of civic education. Students were asked if they have studied the Constitution,
Congress, the Presidency, how laws are made, political parties and voting, and state and
local governments. NGI survey respondents reported whether any of their classes require
them to “keep up with politics or government.” The NHES survey and the ACPS record
whether respondents took high school courses requiring them to pay attention to politics
or current events. Appendix C details the civic education measures in these data sets.
Figure 3 below summarizes these measures.
Figure 3: Summary of Civic Education MeasuresIEA/CivEd Over the past year, have you studied the Constitution / Congress /
Presidency [etc] ?NGI Do any of your classes require you to keep up with politics or
government?NHES During this school year or last year did you have any courses that
required you to pay attention to government, politics or national issues?
ACPS In high school, did you have any courses that required you to pay attention to current events?
Some of the data sets’ samples were restricted due to the wording of their civic
education measures. According to Niemi and Junn (1998), approximately 60% of
Americans took a civic education course most recently in twelfth grade (p. 66). In this
sense, the IEA/CivEd survey may be measuring civic education course-taking too soon,
as its respondents were ninth-graders. However, because the IEA/CivEd measures
students at age fourteen, it fully captures a broad range of students, including those who
do not complete high school.
Similarly, part of the NHES survey sample could not be used for this dissertation
due to the wording of the civic education question. The NHES survey question

33
measuring civic education is: “Have you taken a civics course in school this year or last
year?” Therefore, the survey does not reveal the exact year the student took a civic
education course. This dissertation only examines tenth and eleventh grade students
because the majority of students take civic education courses in the tenth grade (Niemi
and Junn 1998). This resulted in a sample size of approximately 2,100. Including
younger students who have not had civic education but still may take a civics course in
the future in the sample would be inconsistent with considering civic education as a
treatment for the matching methods. Similarly, twelfth grade students in the sample who
had a civics course in tenth grade would respond “no” to the civic education measure,
even though they had a history of civic education course-taking. Specifically, 72.9% of
10th and 11th grade students responded that they had taken a civic education course “this
year or last year” (NHES 2001).
Among the fifteen to twenty-five-year-olds in the NGI data set, only those
respondents currently in school (high school or undergraduate college) were used for the
sample. Due to the phrasing of the civic education question, fifteen to twenty-five year-
olds not in school could not be examined for this dissertation. The NGI survey question
measuring civic education states, “Do any of your classes require you to keep up with
politics or government, either by reading the newspaper, watching TV, or going onto the
Internet, or not?” The resulting sample size is 556.
Other Measures
Another important factor that may influence the effectiveness of civic education
coursework on civic skill development is classroom climate. A democratic classroom is

34
open to student ideas and encourages students to comfortably disagree with each other on
political and social issues (Torney-Purta and Barber 2004). Researchers hypothesize that
classroom climate can greatly affect the learning environment and affect student
achievement (Fraser 1999; Freiberg and Stein 1999). In particular, student voice in
school decisions and student discussion are two approaches that can develop civic skills
(Carnegie and CIRCLE 2003; Kirlin 2004).
This dissertation includes three classroom climate measures as covariates in the
analysis of the IEA/CivEd data set. The included measures assess whether students feel
free to disagree openly with their teachers about political and social issues, are
encouraged to make up their own minds about issues, and feel free to express opinions in
class even when their opinions are different from most other students (IEA/CivEd 1999).
Other numerous factors are examined in this dissertation for their relation to civic
skills. Some of these controls include participation in student government and school
activities, type of job and job skills, political orientation, membership in political clubs or
groups, and membership and participation in religious groups. Existing literature
describes most of these variables as potentially correlated with the presence of civic skills
(see Appendix A). The data sets themselves limit the factors available for controls. As
no single data set contains a full set of controls, multiple data sets must be used. All
analyses will control for demographic factors such as age, race, sex, education level, and
household income.

35
Descriptive Statistics
Tables 1 through 5 depict descriptive statistics for all four data sets. Tables 1 and
2 show means for the IEA/CivEd survey separated by each of the six civic education
measures. For example, column (1) shows means for the full sample, while columns (2)
through (7) detail means for those respondents who report studying the Constitution,
Congress, etc. Column (8) shows means for students who only studied two or fewer civic
education topics, while Column (9) shows means for students who studied three or more
civic education topics. Table 3 shows means for both the students and non-students in
the NGI survey, separated by those who received civic education. Table 4 shows means
for 10th and 11th grade students from the NHES survey, while Table 5 depicts means from
the ACPS.
Table 1 depicts civic education course-taking and civic skill measures according
to the IEA/CivEd survey. Approximately 81% of students have studied the Constitution,
while only 67% of students have studied the Presidency. Overall, 79% of the students
report studying three or more of the civics education topics in the IEA/CivEd survey.
Also of note, students who have studied one of the civic education topics are more likely
to report studying other topics as well. For example, students who have studied the
Presidency are much more likely to have studied the other five civics content areas than
the full sample. In contrast, among students who have studied two or fewer civic
education topics, less than 20% of them have studied the Constitution, while less than 8%
of them have studied the Presidency.

36
Civic Education and Civic Skills
All four examined data sets indicate that survey respondents exhibit greater levels
of civic skills if they have had contact with civics courses. This is evident in Tables 1, 3,
4, and 5. Table 1 shows that respondents who have studied civics and government topics
are more likely to exhibit civic skills, according to the IEA/CivEd study. For example,
85.5% of the full sample correctly interpreted which party issued a political leaflet, while
at least 86.2% of students who have studied a civics education topic correctly interpreted
which party issued a political leaflet. In contrast, column (8) shows that less than 80% of
students who have studied two or fewer civic education topics correctly interpreted which
party issued a political leaflet.
Table 1 also reveals that students who have studied a civic education course topic
are more likely to engage in group discussion. For example, over 60% of the total sample
sometimes or often engages in group discussion with their teachers, while over 62% of
students who have studied a civic education course topic answer similarly. By
comparison, only 44% of students who have studied two or fewer civic education topics
sometimes or often engage in group discussion with their teacher.
According to the NGI survey, approximately half of the students currently in
school are enrolled in a course requiring their attention to government events. In Table 3,
a comparison of column (3) with column (2) shows that students who are taking a civic
education course primarily exhibit higher levels of civic skills. For example, 31.6% of all
students listen to news on the radio, while 32.3% of students who take a civic education
course listen to news on the radio. Column (4) shows that students who are not taking a
civic education course are slightly less likely, overall, to monitor the news.

37
A similar pattern is apparent with the group discussion skills in the NGI survey.
For example, approximately 43% of all students have worked informally with a group in
their community, while over 47% of students who take a civics course have worked
informally with a group in their community. However, less than 39% of students who are
not taking a civics course have worked informally with a group in their community.
According to the NHES survey, 10th and 11th grade students who have taken a
civics course are more likely to monitor the news (Table 4). For example, over 78% of
students who have taken a civics course watch television news almost daily or once a
week. In contrast, approximately 70% of students who have not had a civics course
watch television news almost daily or once a week. Students of civic education were also
more likely to feel they could write a letter to someone in government or make a
statement at a public meeting. English language skills were also slightly higher for
students of civic education.
Among the news monitoring skills measured by the ACPS, respondents who had
a civics course in high school were slightly more likely to monitor the news than
respondents who did not have a civics course in high school (Table 5). Over 80% of
respondents who had a civics course in high school felt they could write a convincing
letter to someone in government. Less than 72% of respondents who did not have a
civics course in high school felt they could write a convincing letter to someone in
government. Also, almost 62% of respondents who had a civics course in high school
discuss national events at least twice a week with others. In contrast, approximately 46%
of respondents who did not have a civics course in high school discuss national events at
least twice a week with others.

38
According to these four data sets, simple calculations of means suggest that civic
skills are present when respondents have a history of civic education course-taking. This
suggests that civic education influences civic skill levels. To determine whether this
pattern is statistically significant, probit models were conducted to test for a correlation
between civic skills and civic education. The results of the probit models are discussed in
Chapter 4. Also, the probit models control for factors other than civic education that may
influence civic skill levels. In turn, the probit analyses are a robust test of the influence
of civic education on civic skill levels.
Civic Education and Demographics
The means tables depict other measures outside of civic skills. For example,
according to the IEA/CivEd survey, 70.9% of the full sample expects to complete a four-
year college degree (Table 2). For students who report studying civic education topics,
over 72% of them expect to complete a four-year college degree. However, 56% of those
students who only studied two or fewer civics topics expect to complete a four-year
college degree. Also, African-American students make up over 11% of the full sample,
but comprise approximately 14% of the students who studied two or fewer civic
education topics. The same pattern is true for Latino, Asian, and immigrant students, but
not females.
Table 2 also shows that students who have studied civic education topics were
more likely to experience open classroom climates. For example, over 84% of students
who have studied the Constitution were sometimes or often encouraged to make up their
minds about issues in any class. In contrast, less than 71% of students who studied two

39
or fewer civic education topics were sometimes or often encouraged to make up their
minds about issues in any class. The same pattern appears with other measures of
classroom climate. For example, students who have studied two or fewer civic education
topics are less likely than other students to feel free to disagree openly with teachers
about political or social issues or express their opinions in class even when their opinions
are different.
Table 3 also shows other factors measured in the NGI survey. For example, over
37% of students in civic education courses feel that the political system in this country is
responsive to the genuine needs of the public, while only 27% of students not in civic
education courses feel similarly. Also, over 45% of students in civic education courses
think they will always vote in local and national elections, while only 31% of students not
in civic education courses think they will always vote. Similarly, 5% of students in civic
education courses think they will never vote, yet over 9% of students not in civic
education courses think they will never vote.
Other measures from the NHES survey are depicted in Table 4. Students of civic
education are more likely to expect to complete a college degree, be involved in student
government, and work outside their home than students who have not taken a civics
course. Immigrants, however, are less likely to have taken a civics course. For example,
4.5% of students who have taken a civics course are immigrants, while almost 8% of
students who have not taken a civics course are immigrants.
Other measures besides civic skills are depicted in Table 5 from the ACPS.
Respondents who had a civics course in high school were more likely to agree that
religion is very important to them, to be politically liberal, and to have completed some

40
college. Respondents who did not have a civics course in high school were more likely
to be immigrants and to be politically conservative. For example, approximately 7% of
the respondents who did have a civics course in high school are immigrants, while over
15% of the respondents who did not have a civics course in high school are immigrants.
Methods
This dissertation determines whether a correlation exists between civic skills and
civic education. To begin, the production capacity of certain variables on the six civic
skills is modeled in Chapter 4. I estimate a probit model for each examined civic skill as
Yi such that:
Yi = f [ CE, CLIMATE, GROUPS, POLITICAL, HOME, DEMOGRAPHICS ]
where Yi represents six different civic skills (English language skills, the ability to write a
letter to an elected official, the ability to give a speech or make a public statement, the
ability to interpret political cartoons or leaflets, frequency of reading the newspaper or
monitoring public events, and the ability to participate in a discussion with a group),
resulting in six distinct models. CE represents a vector of civic education participation.
CLIMATE represents a group of three measures of classroom culture and climate with
respect to democracy in the students’ schools. GROUPS represents covariates associated
with group membership and participation, such as student government membership and
after-school group participation. POLITICAL represents a group of covariates including
feelings of political efficacy, or the feeling that one’s actions can influence the political

41
process.5 HOME represents covariates measuring the home environment, such as the
number of books in the home and household income. DEMOGRAPHICS represents
basic demographic variables such as race, gender, religious views, and political
orientation. Students self-reported their race and were able to choose more than one race.
Robust standard errors are employed to control for the probability of heteroskedasticity.
An ideal experiment would randomly assign students to take civics courses and
then assess the impact of civic education on civic skills. Unfortunately, this is difficult
and expensive to do. As this dissertation’s analyses do not originate from a randomized
experiment, an issue of endogeneity exists. Acquiring civic skills and taking civic
education courses may both be affected by an outside, unobservable factor. For example,
students may select to take civic education courses based on their pre-existing interests,
which may explain their levels of civic skills. Systematic self-selection may indicate the
presence of an unobservable factor influencing civic education course-taking and level of
civic skill development.
Also, self-assessed civic skill measures introduce potential measurement error.
For example, the news monitoring skill items in the surveys were measured as self-
assessments of news monitoring frequency, which may overstate or understate actual skill
levels. Social psychologists indicate that some people overstate their knowledge and
abilities. At times, lower achieving people have a tendency to overstate their skills,
resulting in inaccurate self-reporting.6 Also, Katila et al. (2004) conclude that
coursework can increase one’s confidence without increasing ability, producing inflated
self-assessments. Other researchers, however, dispute any inaccuracy in self-assessments
5 A measure of political knowledge was not included as a covariate in any of the analyses as it may be endogeneous with the civic skill measures (dependent variable). 6 See Kruger and Dunning (1999), DeAngelis (2003), and Dunning et al. (2003).

42
(Ackerman et al. 2002). Furthermore, precedent exists for measuring civic skills as self-
assessments (Verba et al. 1995; Schur 2003; Moely et al. 2002).
As a parametric method, the probit model described earlier inherently controls for
selection on observables. In this dissertation, nonparametric methods (propensity score
matching) are also conducted as a more robust control for selection on the observable
factors. Precedent exists for the application of matching methods in order to construct
unbiased estimators when evaluating a program effect in a non-random setting (Dehejia
and Wahba 2002; Smith and Todd 2004). Although these strategies may not completely
correct for endogeneity within the analyses, they will contribute to a more robust measure
of civic skills and lessen bias. Propensity score matching methods are discussed further
in Chapter 5, along with the propensity score matching analysis results.
Instrumental variables methods were attempted in order to control for
unobservable factors that influence civic education course-taking. Data restrictions did
not allow for the use of instruments in this dissertation. Appendix D details this attempt.
This chapter described the data and methods used in this dissertation. Four
nationally representative data sets are used. The means tables (Tables 1-5) showed that
survey respondents exhibit greater levels of civic skills when civic education is present.
Chapter 4 will test this correlation with probit models. The means tables also showed
that minorities and immigrants are less likely to have taken a civics course and to have
civic skills. Chapter 6 tests the heterogeneous subgroup effects of civic education on
civic skill presence for racial/ethnic minorities, females, and low-income students.
Finally, this chapter outlined the statistical research methods used in the rest of the study.

43
Chapter 4 follows with probit analyses of the correlation between civic skill presence and
civic education within all four data sets.

44
Chapter 4: PROBIT MODELS
The means calculations presented in Tables 1-5 in Chapter 3 show that civic skills
are present more often when survey respondents have had contact with civic education.
This chapter will test for a statistical correlation between civic skills and civic education
using probit models with the four data sets. The results of the probit analyses are
displayed in Tables 6-19. This chapter discusses the results of the probit analyses.
Figure 4 below summarizes the tables discussed in this chapter. The chapter concludes
with a discussion of the weaknesses in conducting probit models and introduces the
propensity score matching methods used in Chapter 5.
Figure 4: Summary of Tables for Chapter 4 – Probit Models
Table Number
Civic Skill Measures Data Source
6 Political interpretation (leaflets) IEA/CivEd7 Political interpretation (cartoons) IEA/CivEd
8 Monitoring the news IEA/CivEd9 English language skills IEA/CivEd10 Group discussion IEA/CivEd11 Monitoring the news NGI12 Group discussion NGI13 Political communication (letter / speech) NHES14 Monitoring the news NHES15 English language skills NHES16 Political communication (letter / speech) ACPS17 Monitoring the news ACPS18 Group discussion ACPS19 English language skills ACPS

45
Probit Model Results
Tables 6 through 10 illustrate results from the IEA/CivEd study. Tables 11 and
12 show results from the NGI study. Tables 13 through 15 show results from the NHES
study, while Tables 16 through 19 display results from the ACPS study. The probit
results are discussed by civic skill type in the following four sections.
Overall, the probit models in this chapter provide evidence of a statistical
correlation between certain civic skills and civic education. Figure 5 summarizes the
statistically significant results between civic skills and civic education from the probit
models analyzed for this chapter.

46
Figure 5: Civic Skills that are Positively Statistically Correlated with Civic Education in Full Model Probits
Tableand
ColumnPOLITICAL INTERPRETATION SKILLS(IEA/CivEd) Who issued leaflet (with studying the Constitution and Presidency) 6, 2 Leaflet regarding taxes (with studying Constitution) 6, 4 Cartoon regarding political leader (with studying Presidency and Constitution)
7, 2
NEWS-MONITORING SKILLS(IEA/CivEd) International newspaper news (with studying political parties and voting)
8, 4
Television (with studying Constitution) 8, 6 Radio (with studying Presidency) 8, 8(NHES) Reading news 14, 2 Television or radio 14, 4
COMMUNICATION SKILLS(NHES) Writing letter 13, 2
GROUP DISCUSSION SKILLS(IEA/CivEd) Discussion with peers (with studying Presidency and political parties)
10, 2
Discussion with parents (with studying Presidency) 10, 4 Discussion with teachers (with studying state and local government) 10, 6(ACPS) Discusses national politics with others 18, 4
Figure 5 indicates that some data sets show a statistical correlation between civic
skills and civic education, while other data sets do not yield similar results for the same
civic skills. These differences in results may be explained by differences among the data
sets and samples, such as age span and the year the data was collected. Also, differences

47
among different civic education topics in the IEA/CivEd study exist. Often, studying the
Presidency or the Constitution significantly influences civic skill presence, while
studying other civic education topics does not. IEA/CivEd students were asked, “Have
you ever studied the Constitution / Congress…etc.” Potentially, students may be
responding “yes” to a topic they learned in a course besides civics, such as American
history. For example, students’ exposure to the Presidency may come from their
American history course, while students’ exposure to studying political parties and voting
may come from their civics course. Such differences in courses and topics may explain
the differences in civic skill outcomes.
Political Interpretation Skills
According to the IEA/CivEd study, some political interpretation skills are
significantly correlated with studying civic education topics. In particular, studying civic
education topics is correlated with correctly interpreting political leaflets. Interpreting
which political party issued a leaflet is both positively and negatively affected by civic
education topics, such as studying the Presidency (Table 6). For example, the probability
of interpreting this leaflet correctly for students who studied the Presidency is 4.8
percentage points higher than for students who did not study the Presidency, according to
the full model. Correctly interpreting what leaflet issuers think about taxes is positively
affected by the study of the Constitution, by 7.1 percentage points. Correctly interpreting
what policy leaflet issuers favor does not exhibit any significant effects from the civic
education topics.

48
Table 7 shows that civics coursework also has positive effects on political cartoon
interpretation skills. For example, studying the Presidency and the Constitution
significantly contribute to the ability to interpret a cartoon about a political leader. The
probability of correctly interpreting a cartoon about a political leader for students who
studied the Constitution is almost 6 percentage points higher than for students who did
not study the Constitution, according to the full model.
As stated earlier, differences in interpreting leaflets and cartoons among the civic
education topics may be explained by the course where the student learned the civics
topic. Differences may also be explained by the instruments themselves. For example,
none of the civic education topics influenced correct interpretation of a cartoon about
democracy. Potentially, that cartoon was too difficult for ninth-grade students to
interpret, or they had not yet been exposed to its lessons in their education.
Other significant findings from the probit models are shown in Tables 6 and 7.
For all three political leaflets examined, African-American students were significantly
less likely than white non-Hispanic students to correctly interpret the leaflets, once other
factors are controlled. For African-American students, the probability of correctly
choosing which policy leaflet issuers favor is 12.6 percentage points less than for white
non-Hispanic students. Expecting to complete a four-year college degree also holds
significant differences. The probability of interpreting the leaflets correctly is at least 7.1
percentage points higher for students who expect to complete a four-year college degree
than for students who do not expect to complete such a degree. Also, participation in
student government positively contributes to correct leaflet interpretation.

49
Various aspects of an open classroom climate are associated with correct political
leaflet interpretation. For students who feel free to express opinions in class, the
probability of correctly interpreting which policy leaflet issuers favor is 9 percentage
points higher than for students not in such classrooms. Also, for students who are
encouraged to make up their own minds about issues in their classrooms, the probability
of correctly interpreting which party issued a political leaflet is 4.3 percentage points
higher than for students in alternative classroom climates.
Also shown in Table 7, the probability of correctly interpreting political cartoons
for African-American students is significantly less than that for white non-Hispanic
students, once other factors are controlled. Also, students who expect to complete a four-
year college degree are significantly more likely to correctly interpret political cartoons
than students who do not expect to complete a college degree. Finally, open classroom
climates are associated with correct political cartoon interpretation, especially when
students feel free to express their opinions. Overall, one consistent finding of political
interpretation skills is the significantly lower ability of African-American students to
interpret leaflets and cartoons. This difference is further addressed in Chapter 6.
News-Monitoring Skills
According to the four examined data sets, civic education course-taking is
positively correlated with news monitoring skills, but the relationship often is not
statistically significant. According to the IEA/CivEd study, reading domestic news in the
newspaper is positively correlated with studying civic education topics, but the
relationship is not statistically significant. Reading the newspaper about other countries

50
is significantly correlated with studying political parties and voting in the full model
(Table 8, column 4). Watching television news and listening to radio news are
significantly correlated with studying the Constitution and studying the Presidency,
respectively. For example, the probability of listening to radio news for students who
studied the Presidency is 6.9 percentage points higher than for students who did not study
the Presidency. Also, the probability of watching television news for students who
studied the Constitution is 10.3 percentage points higher than for students who did not
study the Constitution.
According to the NGI study, news monitoring skills are not correlated with civic
education course-taking. The NGI study also reveals that Latino students are
significantly less likely than white non-Hispanic students to read news on the internet,
while African-American students are significantly more likely than white non-Hispanic
students to read newsmagazines (Table 11). Immigrant students are less likely to read
news in the newspaper than native-born students. Participation in student government
and religiosity are not significantly correlated with news-monitoring skills.
According to the NHES, civics course- taking is significantly correlated with
reading newspapers or newsmagazines or listening to radio news or watching television
news. For example, the probability of reading news is over 9 percentage points higher
for students who have had civic education than for other students, according to the full
model (Table 14, column 2). Also, the probability of watching television news or
listening to radio news is 7.3 percentage points higher for students who have had civic
education than for other students, according to the full model in column 4. According to

51
the ACPS, monitoring the news is not significantly correlated with civic education,
although the relationship is positive.
Overall, these four data sets did not always yield consistent results for news-
monitoring skills. The NHES study showed that civic education is correlated with
increased news-monitoring skills (Table 14). However, the other three data sets did not
show the same results. One explanation for overall differences in results from the NGI
study is its measure of civic education. As stated earlier, the NGI sample used in this
dissertation includes all fifteen to twenty-five-year-olds currently in school (high school
or college). These students were then asked whether any of their classes require them to
keep up to date with politics or government events. Potentially, the NGI respondents
may have had such a course prior to answering the survey, but are not currently enrolled
in such a course. If so, this survey question may not fully capture civics course-taking
among NGI respondents. This measurement error may also explain the lower percentage
of NGI students reporting civics course-taking (50.8%) compared with the other
examined data sets (73% - 79%). This may explain differences in results between the
NGI study and other data sources.
The probit models also depict differences among survey respondents who monitor
the news and their demographic characteristics. According to the IEA/CivEd study,
African-American students were significantly less likely to monitor newspaper articles
about other countries, while immigrant students were significantly more likely to monitor
newspaper articles about other countries, once other factors are controlled. However,
African-American students were more likely to watch television news and listen to radio
news than white non-Hispanic students, once other factors are controlled. Also of note,

52
female students are significantly more likely than male students to listen to radio news.
The probability of listening to radio news for female students is 7.3 percentage points
higher than for male students.
Open classroom climates are associated with monitoring the news. Students who
are encouraged to make up their own minds are significantly more likely to read the
newspaper. Students who express opinions in class are significantly more likely to read
the newspaper and watch television news. For example, the probability of reading the
newspaper about other countries for students who are encouraged to make up their own
minds in their classroom is 11.4 percentage points higher than for students not
experiencing an open classroom climate.
According to the NHES study, African-American students are consistently less
likely to monitor the news, although this difference is not significant. Immigrant students
are significantly more likely to monitor the news. For example, the probability of reading
newspapers or newsmagazines is 19.7 percentage points higher for immigrant students
than for non-immigrant students, according to the full model (Table 14, column 2). Also,
female students and students living in rural areas are significantly less likely to watch
television news or listen to radio news, and less likely to monitor news overall, than other
students.
Probit models from the ACPS study show that African-Americans are
significantly more likely to watch television news and read newspaper news than white
non-Hispanics. For example, the probability of watching television news is 16.2
percentage points higher for African-Americans than for white non-Hispanics, according
to the full model. Finally, respondents who have had at least some college education are

53
significantly more likely to read the newspaper than respondents with no college
experience.
Overall, according to the ACPS study (Table 17), African-Americans are
significantly more likely to read the newspaper than white non-Hispanics. According to
the IEA/CivEd study (Table 8), they are significantly less likely to read newspaper
articles about other countries than white non-Hispanic students. However, according to
the NGI study (Table 11), African-Americans are more likely than white non-Hispanic
students to read newsmagazines. According to the NHES study (Table 14), they are less
likely overall to exhibit news-monitoring skills, although the differences are not
significant.
Probit model results for immigrants’ news-monitoring skills also are mixed. The
IEA/CivEd and NGI studies (Tables 8 and 11) show immigrants exhibiting some news-
monitoring skills but not others. The NHES study (Table 14) shows that immigrant
students are more likely to monitor news sources than native-born students. The ACPS
study (Table 17), however, shows that immigrants are less likely to monitor news sources
than non-immigrants.
These different results between data sets may be due to different sample
populations or survey size. For example, the ACPS measures an older sample (18 to 30
year-olds) than the NGI study (15 to 25 year- olds). Also, the ACPS and the NGI study
measured smaller samples (n = 638 and 556, respectively) than the NHES study and the
IEA/CivEd study (n = 2,106 and 1,953, respectively). Small sample sizes may affect
outcomes when minorities are examined. The differences among African-Americans and
respondents of other races are further explored in chapter 6.

54
The year survey data was collected may also explain different results among data
sets. For example, the ACPS data was collected in 1990, much earlier than the other data
sets. The ACPS also measures respondents who are older than those in the other data
sets. As all four data sets measure civic education and civic skills at one point in time,
they do not consider changes over time. Despite all four data sets being nationally
representative, the year data was collected and age span may explain different results.
Communication Skills
English Language Skills
According to the IEA/CivEd, NHES, and ACPS studies, English language skills
are not significantly correlated with studying civic education or any of the civic education
topics. However, respondents’ English language skills cannot be precisely judged due to
the wording of the English language survey questions. In all three of these data sets,
respondents were asked how often they speak English at home. It is clear from the probit
analyses that Latinos and immigrants do not speak English at home as often as other
survey respondents. However, the survey questions are not measuring respondents’
actual English language skills, as the respondents may be fluent in English but choose not
to speak it at home. The survey questions are primarily measuring frequency of English
usage, language minority status, and whether the respondents come from a bilingual
household. Overall, the examined data sets do not allow for accurate testing of English
language skills as civic skills.
Other findings from the English language probit models are not surprising.
According to the IEA/CivEd study, Latino, Asian, and immigrant students are

55
significantly less likely to speak English at home than other students. For example, the
probability that Latino students speak English at home is over 17 percentage points less
than the probability that white non-Hispanic students speak English at home, according to
the full model (Table 9, column 2).
The NHES study reveals similar results. Latino and immigrant students are
significantly less likely to speak English at home, compared to other students. Also,
students who live in rural areas are significantly more likely to speak English at home
compared with other students.
The ACPS data yields results similar to the IEA/CivEd and the NHES studies.
Latino and immigrant students are significantly less likely to speak English at home,
compared to other students. Also, private school attendees are significantly less likely to
speak English at home, compared to public school attendees. This may be due to a
greater presence of immigrant or Latino students in Catholic or religious private schools.
The probit analyses of English language skills and civic education provide no
evidence of a correlation between civics course-taking and English as a civic skill. The
analyses do provide evidence that Latinos and immigrants are less likely to solely speak
English at home, compared to white non-Hispanics. However, while English language
skills have been documented as a skill necessary for participation in American politics,
bilingual skills may also be a civic asset to national and global political participation.
While this dissertation defines Latinos and immigrants as less skilled due to their levels
of English language skills, their dual language skills overall may actually be a political
asset.

56
In contrast, Fry and Lowell (2003) describe a U.S. labor market that does not
reward bilingualism with increased wages. This may explain immigrants’ generational
shifts toward monolingualism (ibid.). In turn, if the labor market does not value
bilingualism, other cultural or familial incentives to remain bilingual may fade as well.
Societal disincentives for bilingualism may mirror political disincentives to remain
bilingual.
Writing a Letter, Making a Statement or Speech
The NHES and ACPS surveys provide mixed evidence of a correlation between
civic education and writing a letter and making a statement or speech. According to the
NHES data, civics course-taking is significantly correlated with confidence in writing a
letter to someone in government. The probability of feeling confident in being able to
write a letter to someone in government is over 3 percentage points higher for students of
civics than for students who have not had a civics course (Table 13). Similarly, the
NHES provides evidence of a positive relationship between civic education and feeling
confident in being able to make a statement at a public meeting, although the correlation
is not statistically significant. Also, according to the ACPS, civic education is positively
correlated with confidence in being able to write a letter or make a statement, although
the correlation is not significant.
The NHES data also shows that students who participate in student government
are significantly more confident in their ability to make a comment or statement at a
public meeting than other students. Overall, immigrants, African-Americans, and

57
students from rural areas are much less confident in their own communication skills than
other students.
The ACPS data also shows that survey respondents who have had at least some
college education are significantly more likely to feel confident in their communication
skills than respondents with no college experience. For example, the probability of
feeling confident in making an effective statement for those who attended some college is
almost 17 percentage points higher than for those with no college experience, according
to the full model in column 4. According to the ACPS, immigrants are significantly less
likely to feel confident in their letter-writing abilities than non-immigrants, while
African-Americans are significantly more likely to feel confident in their letter-writing
abilities than others.
Probit analyses provide evidence of a correlation between civics course-taking
and communication skills such as writing a letter and making a statement or speech.
However, it is important to note what the NHES and the ACPS survey questions actually
measured. Respondents were asked if they “felt they could” write a letter, give a speech
or make a statement. Therefore, these survey questions are measuring ability,
willingness, and confidence. Ideal civic skill measures would isolate communications
abilities from confidence and willingness. However, the NHES and ACPS survey
questions are the best available measures of writing a letter and making a statement or
speech.

58
Group Discussion Skills
The group discussion survey questions measure both ability to engage in a group
discussion and willingness to do so, by asking the respondent how often they have
performed these actions. As discussed in chapter 3, the survey questions often do not
isolate ability from willingness to engage in group discussion, but they are the best
available measures of group discussion skills.
Some evidence of a correlation between civic education and group discussion
skills was found among the IEA/CivEd, NGI, and ACPS studies. According to the
IEA/CivEd study, group discussion skills are significantly correlated with studying the
Presidency and studying state and local government. In particular, studying the
Presidency is correlated with engaging in frequent discussions about U.S. government
events with parents and peers. Studying state and local government is correlated with
engaging in discussions with teachers. Also, studying political parties is significantly
related to engaging in discussions with peers about U.S. government events.
According to the NGI study, civics course-taking is positively related to group
discussion skills, though not significantly in the full models. Again, the NGI study
measures frequency of working in a community group and frequency of group
discussion. These measures do not isolate the ability to engage in group discussion or
work in a group, because by measuring frequency, they are measuring willingness and
ability.
According to the ACPS, group discussion about local and national politics is
correlated with civics course-taking. The relationship between civic education and
discussion of national politics is statistically significant, according to the full model

59
(Table 18, column 4). The probability of discussing national politics with others is over
13 percentage points higher for respondents who had civic education compared to
respondents who did not have civic education. The ACPS measures how frequently
respondents discuss local and national politics with others. Like the IEA/CivEd study
and the NGI study, ACPS questions do not solely measure group discussion skills; they
also measure willingness to engage in group discussion.
The probit models of group discussion skills also reveal other findings related to
demographic characteristics of respondents. The IEA/CivEd study shows that immigrant
students are significantly more likely to discuss U.S. government events with their peers
than native-born students. African-American, Asian, and female students are less likely
than other students to engage in group discussions, although the difference is not
statistically significant. Also, students who feel free to disagree openly with their
teachers are significantly more likely to engage in group discussions about U.S.
government events with their peers, parents, or teachers than students who do not feel
free to disagree with their teachers. In turn, the probability that students have frequent
discussions about U.S. government events with their teachers is 16.4 percentage points
higher for students in open classroom climates where students feel free to disagree with
their teachers than for students not in such classrooms, according to the full model (Table
10, column 6).
The NGI study also reveals that Latino, African-American, Asian, immigrant, and
sometimes female students are less likely to have worked in a community group or
engaged in group discussions than other students. Also, respondents who view
themselves as very religious are significantly more likely to have worked in a community

60
group than all other respondents. The probability of having worked informally in a group
to solve a community problem is over 14 percentage points higher for the very religious
than for all others.
The ACPS also shows that Latinos, African-Americans, immigrants, and females
are less likely than others to discuss local or national politics in a group. In particular, the
difference for females is statistically significant. Also, respondents who report having at
least some college education are significantly more likely to engage in discussions about
local and national politics with others than respondents with no college experience.
Overall, these group discussion measures do not purely reflect group discussion
skills. All of the group discussion survey questions from the IEA/CivEd, NGI, and
ACPS studies measure willingness and ability to engage in group discussion. Ideally, a
more precise measure of civic skills would solely consist of ability to engage in a group
discussion. A consistent correlation between civic education and group discussion skills
was not found in these three data sets.
Conclusions
Figure 5 above and Figure 6 below summarize the statistically significant results
of the probit models. This chapter illustrates how examining one civic skill among
multiple data sets can provide inconsistent results. For example, news-monitoring skills
were found to be significantly correlated with civics course-taking in the NHES and
IEA/CivEd studies, but not in other data sets.
Differences among data sources may explain differences in probit model results
for the same civic skill. For example, the NGI study’s civic education measure may

61
provide an explanation for inconsistent results among data sources. As stated earlier,
potential measurement error in the NGI survey’s civic education question may influence
the probit model results.
The probit models in this chapter revealed that often a civic skill is found to be
correlated with civics course-taking in one data set but not in another. Figure 6
summarizes the statistically significant correlations between civic skills and civic
education found in the probit models in this chapter. From the IEA/CivEd study, the
civic education topics that are correlated with civic skills were primarily studying the
Presidency and the Constitution. Often, other examined civic education topics were not
correlated with civic skill presence. Again, this difference among civic education topics
may be explained by different courses where the student was exposed to such topics.
Also, as stated earlier, news-monitoring skills are correlated with civics course-
taking in the IEA/CivEd and NHES studies, but not in the NGI or ACPS studies.
Communication skills, such as writing a letter, are correlated with civics course -taking in
the NHES study but not in the ACPS study. Group discussion skills, as they were
measured, are correlated with civics course-taking in the IEA/CivEd study, but not in the
NGI or ACPS studies. Finally, the measures of English language skills are imprecise and
not an adequate assessment of English as a civic skill. English language skill measures in
this dissertation only capture language minority status and whether the respondent comes
from a bilingual household.
Probit model analyses in this chapter also reveal findings about factors other than
civic education related to civic skill presence. Figure 6 below summarizes other factors
examined in the probit models that are statistically related to civic skill presence.

62
A secondary finding of this chapter’s probit models is an apparent civic skill
shortage held by African-Americans, immigrants, Latinos, and sometimes females.
While immigrants, Latinos, and females do not always hold lower levels of civic skills
than others, African-Americans are almost always shown to hold lower levels of civic
skills than others, according to these four data sets. Clearly, an inequality of opportunity
to learn civic skills exists. Also, according to the civic skill measures examined from
these data sources, African-Americans appear to have less civic skills than others.
However, African-Americans may hold different civic skills that are not measured in this
dissertation, making any apparent deficiency false. These differences are further
explored in Chapter 6.
The probit models also reveal the positive presence of civic skills in those who
have either attended some college or plan to complete a college degree. These
respondents almost always hold higher levels of civic skills. Also, the IEA/CivEd study
shows that an open classroom climate may provide assistance in acquiring civic skills.
Whether an open classroom climate itself contributes to learning civic skills is unknown,
but the presence of civic skills is often accompanied by an open classroom climate.
Finally, the ACPS study reveals that very religious respondents are more likely to engage
in frequent group discussions with others than nonreligious respondents.

63
Figure 6: Other Factors Significantly Correlated with Civic Skill Presence in Full Model Probits7
Direction of Correlation TablesPOLITICAL INTERPRETATION SKILLS(IEA/CivEd) African-Americans, Immigrants - 6 and 7 College, Classroom climate measures, females + 6 and 7 Student government + 6 and 7
NEWS-MONITORING SKILLS(IEA/CivEd) Classroom climate measures + 8(NHES) Immigrants, College + 14 Females, Reside in rural areas - 14(ACPS) African-American, Some college + 17
ENGLISH LANGUAGE SKILLS(IEA/CivEd) Latinos, Asians, Immigrants - 9(NHES) Latinos, Immigrants, Females - 15 Reside in rural area + 15(ACPS) Latinos, Immigrants, Private school attendees - 19
LETTER / STATEMENT(NHES) Student government participation + 13(ACPS) African-American, Some college + 16 Immigrants - 16
GROUP DISCUSSION SKILLS(IEA/CivEd) Classroom climate measures, Immigrants + 10(NGI) Very religious + 12(ACPS) Latinos, Females - 18 Some college + 18
7 Number of books in the home, group participation, and feelings of political efficacy were also controlled for in the IEA/CivEd data. Other controls in the NGI data include Latino, African-American, Asian, immigrant, female, student government participation, household income, political views, group participation, voting behaviors, and feelings of political efficacy. Other controls in the NHES data include African-American, household income, region of U.S., group participation, and feelings of political efficacy. Other controls in the ACPS include household income, political orientation, group participation, and feelings of political efficacy.

64
As explained in Chapter 3, an issue of endogeneity may exist in these analyses
because they did not originate from a randomized experiment. Despite controlling for all
available observable factors, there may still be unobservable factors that are correlated
with both civic education and civic skills. For example, the strong correlation shown in
Table 7 between studying the Constitution and being able to correctly interpret a political
cartoon about a political leader may be influenced by other hidden factors such as civic
education self-selection. While this dissertation employs single equation estimates as a
multivariate approach to control for all observable factors in a non-random setting, it is
possible that the analyses do not include all relevant factors.
Chapter 5 introduces and discusses propensity score matching methods applied to
the correlation between civic education and civic skill presence. Chapter 5 also shows
results of the matching methods using the four data sets. While propensity score
matching methods will not control for selection on unobservable factors, they will
provide a more robust analysis on the observable factors.

65
Chapter 5: MATCHING METHODS
This chapter begins by describing the purpose of propensity score matching
methods as an alternative to probit models to evaluate the effect of civic education on
civic skill presence. This chapter discusses the results of the propensity score matching
methods conducted on the four data sets.
Propensity Score Matching Methods
The primary purpose of this dissertation is to answer the question, “Is civic
education correlated with the presence of civic skills?” To properly answer this question,
it is necessary to isolate the effect of civic education on civic skill development. While
many factors influence civic skill development in individuals, such as extracurricular
activities, religious participation, and home environment, this dissertation is concerned
with the influence of civic education.
The single equation probit models presented in the previous chapter control for
factors outside of civic education that may influence civic skill presence, and may
possibly be correlated with civic education participation. However, the probit models
may not control for every factor that influences civic skill presence. In turn, a factor
endogeneous to the probit analyses may influence civic skill presence and be correlated
with civic education participation, and may not be included in the probit models. As an
alternative means of isolating the effect of civic education on civic skill presence,
propensity score matching methods were conducted.

66
Propensity score matching methods were conducted using civic education as a
“treatment.” Survey respondents who have taken a civics course were compared to
respondents who have not taken a civics course in a multivariate probit model to produce
a single propensity score. Treated individuals (those with a history of civic education
coursework) were matched with untreated individuals (those with no history of civic
education coursework) along observed characteristics, according to the propensity score,
to assess the effect of civic education. Once the individuals were matched based on
common background characteristics, a truer picture of the effect of civic education
course-taking was determined.
Bootstrapped standard errors and matching-weighted probits were also conducted
to provide another assessment of the magnitude of the effect of civic education.
Appendix E provides more details on the propensity score matching methods.
Matching methods were conducted for every full-model probit conducted in
Chapter 4 except the English language skill analyses. English language skills were
initially included in this dissertation in order to explore their correlation with civic
education coursework. No evidence of a correlation between civic education and English
language skills was found in the IEA/CivEd, NHES, and ACPS studies. Verba et al.
(1995) describe English language skills as a civic skill, or a skill necessary for
participation in American democracy. However, a theoretical link between civic
education course-taking and English language skills is untenable. The primary purpose
of civics and government courses is not to teach English. Furthermore, the measures of
English language used in this dissertation are merely capturing language minority status
and whether the respondent comes from a bilingual household. As English language

67
skills do not appear to be linked to civic education, propensity score matching methods
were not applied to their analysis.
Matching Methods Results
The probit models presented in Chapter 4 indicate evidence of some correlations
between civic skills and civic education. These correlations were further examined with
propensity score matching methods. At times, the matching methods reveal different or
stronger results than the full-model probit analyses. The results of the matching methods
are displayed in Tables 20-27. This chapter discusses the results of the matching
methods. Figure 7 below summarizes the tables discussed in this chapter.
Figure 7: Summary of Tables for Chapter 5 –Matching Methods
Table Number
Civic Skill Measures Data Source
20 Political interpretation (leaflets) IEA/CivEd21 Political interpretation (cartoons) IEA/CivEd
22 Monitoring the news IEA/CivEd23 Monitoring the news IEA/CivEd24 Group discussion IEA/CivEd25 Group discussion, monitoring the news NGI26 Monitoring the news, Political communication
(letter / speech)NHES
27 Monitoring the news, Group discussion, Political communication (letter / speech)
ACPS
Tables 20 through 24 provide matching results for the IEA/CivEd study. Table 25
shows results from the NGI study, and Table 26 shows results from the NHES study.
Table 27 shows all matching results from the ACPS. The results of the matching
methods are discussed by civic skill type in the next few sections.

68
The primary parameter of interest from the matching methods is the average
treatment effect (ATE). The average treatment effect indicates the magnitude of the
influence of civic education on all respondents, whether they had civic education or not.
In this sense, the ATE predicts the expected effect of civic education on all survey
respondents. This is the most policy-relevant statistic, as it mirrors the effect of
mandating civic education for everyone.
Political Interpretation Skills
The average treatment effect of studying civic education topics on interpreting
political communication material is not greater than 8 percentage points, according to the
IEA/CivEd study. As expected, ATE values are higher for civic education topics that
were found to be significant in the probit analyses. For example, the average effect of
studying the Presidency results in a 7.8 percentage point increase in the ability to
interpret which party issued a political leaflet (Table 20, Column (3)). Studying the
Presidency was found to be significantly correlated with the ability to interpret which
party issued a political leaflet in the full-model probits. This correlation is also
statistically significant in the matching-weighted probit. Figure 8 below shows the ATEs
for the political interpretation skills.

69
Figure 8: ATEs for Political Interpretation Skills: IEA/CivEd
-2%
0%
2%
4%
6%
8%
10%
Leaflet 1 Leaflet 2 Leaflet 3 Cartoon 1 Cartoon 2
Studied Constitution Studied CongressStudied Presidency Studied How Laws are MadeStudied Political Parties Studied Local Government
While the full-model probits indicate statistical significance among different civic
education topics and political interpretation skills, the matching methods indicate the
magnitude of the average treatment effects for political interpretation skills. For
example, Figure 8 shows that studying the Presidency yields larger effects on political
interpretation skill presence than other civic education topics. Also, all of the civic
education topics yield substantial effects on interpreting a cartoon about a political leader.
These results are similar to the full model probit results. For example, the ATE
values show that all of the civic education topics appear to influence correct
interpretation of a cartoon about a political leader. The full-model probit analyses reveal
similar results. Similar differences among civic education topics are also found between
the full-model probits and the matching methods. Again, studying the Presidency and the
Constitution appear to have the most prominent correlation with political interpretation
skills. These differences potentially can be explained by students taking different courses
(American history or civics) to learn these topics.
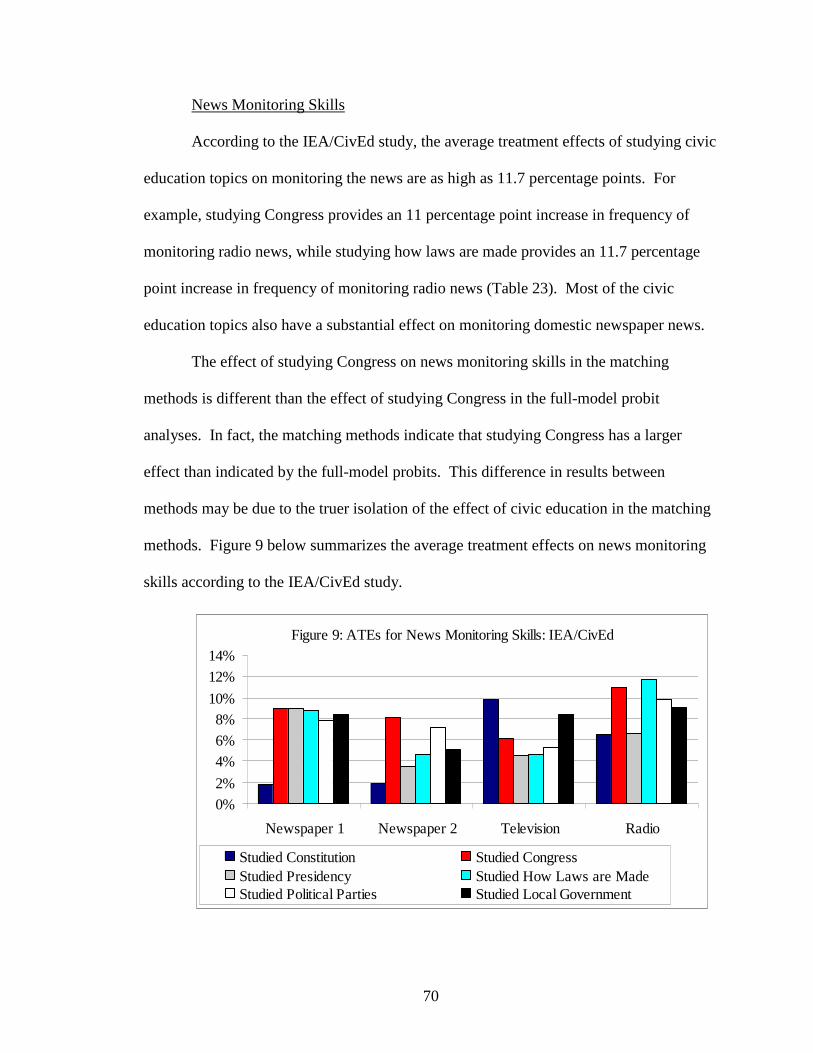
70
News Monitoring Skills
According to the IEA/CivEd study, the average treatment effects of studying civic
education topics on monitoring the news are as high as 11.7 percentage points. For
example, studying Congress provides an 11 percentage point increase in frequency of
monitoring radio news, while studying how laws are made provides an 11.7 percentage
point increase in frequency of monitoring radio news (Table 23). Most of the civic
education topics also have a substantial effect on monitoring domestic newspaper news.
The effect of studying Congress on news monitoring skills in the matching
methods is different than the effect of studying Congress in the full-model probit
analyses. In fact, the matching methods indicate that studying Congress has a larger
effect than indicated by the full-model probits. This difference in results between
methods may be due to the truer isolation of the effect of civic education in the matching
methods. Figure 9 below summarizes the average treatment effects on news monitoring
skills according to the IEA/CivEd study.
Figure 9: ATEs for News Monitoring Skills: IEA/CivEd
0%
2%
4%
6%
8%
10%
12%
14%
Newspaper 1 Newspaper 2 Television Radio
Studied Constitution Studied CongressStudied Presidency Studied How Laws are MadeStudied Political Parties Studied Local Government
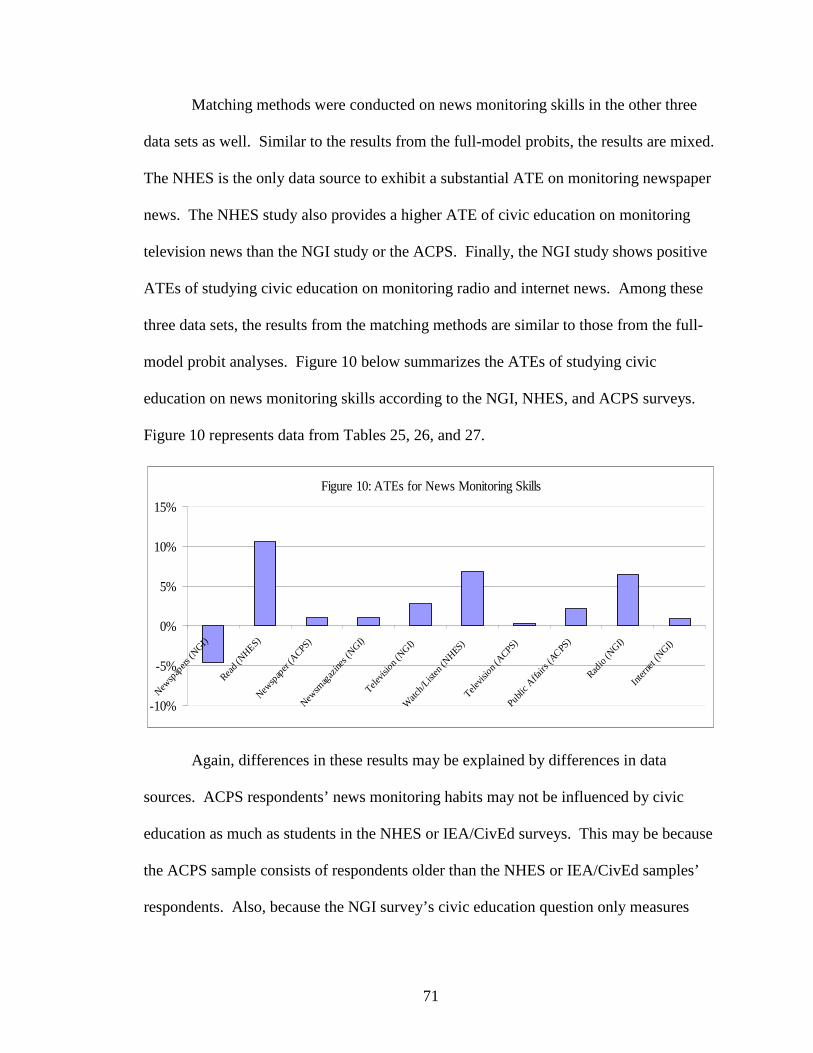
71
Matching methods were conducted on news monitoring skills in the other three
data sets as well. Similar to the results from the full-model probits, the results are mixed.
The NHES is the only data source to exhibit a substantial ATE on monitoring newspaper
news. The NHES study also provides a higher ATE of civic education on monitoring
television news than the NGI study or the ACPS. Finally, the NGI study shows positive
ATEs of studying civic education on monitoring radio and internet news. Among these
three data sets, the results from the matching methods are similar to those from the full-
model probit analyses. Figure 10 below summarizes the ATEs of studying civic
education on news monitoring skills according to the NGI, NHES, and ACPS surveys.
Figure 10 represents data from Tables 25, 26, and 27.
Figure 10: ATEs for News Monitoring Skills
-10%
-5%
0%
5%
10%
15%
Newsp
apers
(NGI)
Read (
NHES)
Newsp
aper
(ACPS)
Newsm
agaz
ines (
NGI)
Televis
ion (
NGI)
Watc
h/List
en (N
HES)
Televis
ion (
ACPS)
Public A
ffairs
(ACPS
)
Radio
(NGI)
Inter
net (
NGI)
Again, differences in these results may be explained by differences in data
sources. ACPS respondents’ news monitoring habits may not be influenced by civic
education as much as students in the NHES or IEA/CivEd surveys. This may be because
the ACPS sample consists of respondents older than the NHES or IEA/CivEd samples’
respondents. Also, because the NGI survey’s civic education question only measures

72
current students of civic education, the magnitude of the average effect of civic education
on news monitoring skills may be affected by measurement error.
Communication Skills
Writing a Letter, Making a Statement or Speech
The average effect of civic education on communication skills is greater in the
ACPS survey data than in the NHES survey data. The average effect of civic education
on confidence in being able to write a letter to someone in government is less than 4
percentage points, according to the NHES data (Table 26). However, this same effect is
over 11 percentage points according to the ACPS data. This same pattern between data
sets is true for feeling confident in making an effective statement or speech in a public
forum. Often these results differ from the insignificant results found in the full-model
probit analyses. For example, according to the ACPS data, the marginal effect of civic
education on writing a letter is less than 4 percentage points (Table 27). However,
matching methods indicate the ATE to be greater than 11 percentage points, and the
marginal effect from the matching-weighted probit is greater than 10 percentage points.
This difference is explained by the difference in methods – the matching methods provide
a more robust analysis of the effect of civic education. Figure 11 below illustrates the
ATEs for communication skills according to the NHES and ACPS surveys.

73
Figure 11: ATEs for Communication Skills
0%
5%
10%
15%
20%
Letter (NHES) Letter (ACPS) Statement(NHES)
Statement(ACPS)
The differences in results between the two data sets may be explained by the age
of the respondents. NHES respondents are 10th and 11th grade students, while ACPS
respondents are up to 30 years old. While a 29-year-old may feel confident in her ability
to write a letter or make a statement in a public forum, she may not have had such
confidence as a tenth-grade student. For the 29-year-old, factors that influenced her civic
education selection may also influence her confidence in communication skills as an
adult. For example, an advantaged high school student who had access to civic education
may also have access to societal opportunities to practice letter-writing and public
speaking skills. Even though analyses using the ACPS study control for household
income and job skills, factors that play out in life past age 18 may explain the greater
effects of civic education on confidence in communication skills for older survey
respondents.

74
Group Discussion Skills
The average effect of civic education topics on group discussion skills is greater
for students discussing matters with their teachers or parents than with their peers,
according to the IEA/CivEd study (Table 24). For example, the average effects of
studying political parties or state and local government on discussing U.S. government
events with teachers is over 13 percentage points. The matching-weighted probits also
indicate the strong effect of studying civic education topics on discussing U.S.
government events with parents and teachers.
The ATEs are not always similar to the marginal effects in the full-model probits.
For example, studying state and local government has a negative effect on discussing
U.S. events with peers, according to the full-model probit results (Table 24). However,
this effect is positive according to the matching methods, and is even significantly
positive in the matching-weighted probit model. This pattern is also reflected in the
effect of studying how laws are made on group discussions with teachers. These
differences reflect the increased capability of the matching methods to isolate the effect
of civic education. Figure 12 below summarizes the ATEs for group discussion skills
according to the IEA/CivEd study.

75
Figure 12: ATEs for Group Discussion Skills: IEA/CivEd
0%2%4%6%8%
10%12%14%16%
People Own Age Parents Teachers
Studied Constitution Studied CongressStudied Presidency Studied How Laws are MadeStudied Political Parties Studied Local Government
The NGI study and the ACPS also measure group discussion skills. Similar to the
results of the communication skills discussed previously, the average effects of civic
education on group discussion skills is greater for the older respondents of the ACPS
survey than for the younger respondents of the NGI survey. For example, the average
effect of civic education on engaging in discussion about national events is over 17
percentage points according to the ACPS data, while it is less than 6 percentage points
according to the NGI data. These results are similar to those in the full-model probits.
Figure 13 below summarizes the ATEs of civic education on group discussion skills
according to the NGI and ACPS data sets.

76
Figure 13: ATEs for Group Discussion Skills
0%2%4%6%8%
10%12%14%16%18%20%
Work Informally(NGI)
Group Discussion(NGI)
Local Discussion(ACPS)
NationalDiscussion
(ACPS)
As discussed in Chapter 3, the group discussion survey questions measure
frequency of engagement in group discussions, and are not a pure measure of these skills.
Overall, civic education has a minimal effect on group discussion frequency, especially
according to the NGI study and the IEA/CivEd’s measure of group discussion with peers.
Conclusions
The probit models in Chapter 4 revealed that often a civic skill is found to be
correlated with civics course-taking in one data set but not in another. The same pattern
was found when matching methods were applied to the data. When these differences
include the NGI study, the NGI study’s civic education measure may explain this
difference. Differences in sample make-up may also explain different results, such as the
sample of older respondents from the ACPS survey.
For civic skills tested with the IEA/CivEd study, differences among civic
education topics remain. Similar to the full-model probit analyses, matching methods
reveal that studying the Constitution and the Presidency yield a greater effect on civic

77
skill presence over other topics. However, the matching methods indicate that studying
Congress is influential on civic skill presence, unlike the full-model probit analyses.
Also, studying state and local government often yields different results than studying
other civic education topics (Figures 8, 9, and 12). Some educators strongly advocate the
study of local government in civics courses.8
Overall, the matching methods revealed mixed results when compared to the
results of the probit models from Chapter 4. Most differences between the two methods
were found in news monitoring, communication, and group discussion skills. Where
differences exist, the matching methods reveal greater civic education effects than those
found in the full-model probits. Matching methods provide a more robust means of
isolating the effect of civic education on civic skill presence than probit models.
Chapter 6 consists of the heterogeneous sub-group analyses. The effect of civic
education on civic skill presence for different racial, ethnic, gender, and low-income
groups is examined.
8 For example, the Constitutional Rights Foundation promotes a focus on state and local government through service learning www.crf-usa.org. Also, a New Jersey program, Empowerment Civics, encourages a focus on local government in civics courses www.citizensarmynj.com/reform/empowermentcivics.html.

78
Chapter 6 – HETEROGENEOUS LINKS BETWEEN CIVIC EDUCATION AND
CIVIC SKILLS
This chapter reports the results of subgroup analyses. Subgroup analyses convey
differences in the effects of civic education on civic skill presence for different groups.
Statistical means shown in Chapter 3 reveal that some subgroups (African-American,
Latino, females, low-income, and non-college) differ in their levels of civic skills and
civic education participation. Differences in the effects of civic education on civic skill
presence for these subgroups may explain different levels of civic skills.
For example, civic skills may originate from numerous background factors, such
as families, home environments, and civic education. By examining the relationship
between civic education and civic skills among different subgroups, differences among
background factors may be revealed. For example, a different effect of civic education
on civic skill presence for African-American students than for non-Hispanic white
students may indicate differences in background factors between these two groups.
In order to determine the heterogeneous effects of civic education on different
populations (African-American, Latino, females, low-income, and non-college), probit
models and propensity score matching methods were conducted on each group
separately. The analysis of groups was limited by small sample sizes. As Figure 14
shows, once data sets were separated by population, some sub-samples were too small for
analysis. Values in bold type in Figure 14 were deemed large enough for analysis.

79
Figure 14: Sample Sizes for Subgroup AnalysesAfrican-America
n
Lat-inos
Females Immi-grants
Asians Low-in-
come
Non-Coll-ege
Full Sam-ple
IEA/CivEd
223 229 1,008 187 118 -- 599 1,953
NGI 93 80 271 44 18 125a 196 556NHES 343 255 1,062 115 -- 637b 261 2,106ACPS 70 -- 321 58 -- -- 289 638a) Household income $30,000 per year or less was considered low-income.b) Household income $25,000 per year or less was considered low-income. These values differ
between data sets due to the nature of the survey questions. Survey questions were asked ascategorical values of income.
All four data sets were examined for heterogeneous civic education effects on
females and males. The IEA/CivEd and NHES studies were examined for civic
education effects on African-Americans and Latinos. The NHES study was also
examined for civic education effects on low-income students. The IEA/CivEd, NHES,
and ACPS studies were analyzed for civic education effects on non-college respondents.
Overall, a sub-sample size of 200 was deemed the minimum sample size necessary for
probit model analyses or matching methods. A sample size of 200 is generally the
minimum needed for a robust regression, and is considered small, but not unprecedented,
for propensity score matching methods.9
The results of the heterogeneous analyses are discussed in this chapter. Overall,
the analyses show that differences in the effects of civic education on civic skill presence
exist among females, racial/ethnic minorities, low-income students, and students who do
not intend to attend college. Results are discussed by subgroup. Figure 15 below
summarizes the data tables associated with this chapter.
9 Jeffrey Smith, e-mail communication, January 31, 2005.

80
Figure 15: Summary of Tables for Chapter 6 –Subgroup Analyses
Table Numbers
Civic Skill Measures Data Source
28 – 31 African-Americans, probit models IEA/CivEd32 – 35 Latinos, probit models IEA/CivEd
36 – 39 Females, probit models IEA/CivEd40 – 43 Non-college, probit models IEA/CivEd44 – 45 Females, probit models NGI46 – 50 All probit models NHES51 – 54 All probit models ACPS55 – 60 African-Americans, matching methods IEA/CivEd61 – 66 Latinos, matching methods IEA/CivEd67 – 72 Females, matching methods IEA/CivEd73 – 78 Non-college, matching methods IEA/CivEd79 – 80 Females, matching methods NGI81 – 85 All, matching methods NHES86 – 89 All, matching methods ACPS
Racial/Ethnic Minorities
The means tables presented in Chapter 3 show that African-Americans and
Latinos receive less civic education than their non-Hispanic white or Asian counterparts.
The IEA/CivEd study shows that students who studied two or fewer civic education
topics (out of a total of six topics) were more likely to be African-American or Latino,
and less likely to be non-Hispanic white or Asian (Table 2). The ACPS reveals similar
results. The NGI study shows that African-Americans are less likely to study civics, but
the same is not true for Latino students. The NHES study shows that Latinos are less
likely to study civics, but the same is not true for African-American students (Tables 3, 4,
and 5).

81
The probit models presented in Chapter 4 reveal that minorities have lower levels
of civic skills than non-Hispanic whites. The IEA/CivEd study shows that Latinos hold
lower levels of civic skills than others, while African-Americans hold statistically
significantly lower levels of civic skills than others, except for group discussion skills.
Latino and African-American students hold lower levels of civic skills than others
according to the NGI and NHES studies, although the differences are not statistically
significant. The ACPS shows that Latinos hold lower levels of civic skills than others,
while African-Americans do not.
The probit models demonstrate the differences in civic skill levels when African-
Americans and Latinos are examined within full samples. However, they do not address
whether the effect of civic education on civic skill levels is different for African-
Americans compared to all others, or for Latinos compared to all others. That analysis is
discussed in this chapter.
In order to determine the differences in the effects of civic education on civic skill
presence for different subgroups, probit models and matching methods were conducted
on each subgroup separately. For example, a full model probit of the effect of civics
course-taking on correctly interpreting political leaflets was conducted on a subsample of
African-Americans only. The analysis was then repeated for all non-African-Americans
in the same data set. These probit model results are displayed adjacent to each other in
the data tables. A similar process was followed to conduct the propensity score matching
methods. For example, matching methods were conducted for a subsample of African-
Americans within the IEA/CivEd study only, and then compared to the matching method
results conducted on all non-African-Americans within the IEA/CivEd study. Therefore,
82
it is easy to compare the effects of civics course-taking on the African-American sub-
sample and the non-African-American sub-sample.
The subgroup analyses reveal that, overall, African-American and Latino
students’ civic skill levels are differently influenced by civic education than non-Hispanic
whites’ civic skill levels. While little research has been done to examine the differences
in civic education and civic skills between racial/ethnic minorities and non-Hispanic
whites, much research has examined the gap in overall student performance between
racial/ethnic minorities and non-Hispanic whites. Current research focuses particularly
on the academic achievement gap between African-American students and non-Hispanic
white students.
Jencks and Phillips (1998) describe the gap between African-American and white
students’ test scores in subjects such as reading and math. A significant gap exists.
Regardless of socioeconomic status, African-American children lag behind their non-
Hispanic white counterparts with respect to academic achievement. Jencks and Phillips
offer overall explanations for the gap, such as culture, schooling, and family (ibid.).
Being raised in an African-American family significantly reduces student test scores.
The student’s mother’s socioeconomic status and her parenting processes also explain the
gap. Teachers are to blame as well, as they have lower expectations for African-
American students than for non-Hispanic white students, often for historical reasons.
These expectations can affect student performance (ibid.).
Hochschild and Scovronick (2003) contend that while racial discrimination in
schools is no longer de jure, it remains de facto. Often a significant portion of a school’s
revenue originates from property tax revenue and local government revenue, resulting in

83
unequal tax bases among schools. Schools in wealthier neighborhoods receive higher
revenues from taxes than schools in poorer neighborhoods. As these wealthier
neighborhoods tend to be non-Hispanic white, this perpetuates discrimination. In turn,
racially segregated neighborhoods can result in separate school outcomes (ibid.).
Although the racial achievement gap improved in the 1980s, it has worsened from 1990
to the present. Furthermore, there is evidence that Latinos and students from urban areas
drop out of school more often than non-Hispanic whites (Hochschild and Scovronick
2003).
According to a new report by Orfield and Lee (2005), re-segregation has occurred
since 1980. Non-Hispanic white students, particularly in the Midwest, are more isolated
and attend the most segregated schools than other races and ethnicities. Phillips (2004)
reports that segregation stems from poverty, fueled by disparities in school funding.
Frequently, states are pressured to fund what districts themselves cannot fund, especially
as they try to finance No Child Left Behind programs (Winter 2004). Bankston and
Caldas (2000) also find that minorities in public schools perform poorly when the
majority of non-Hispanic white students in their school districts attend private schools.
While current studies focus on the achievement gap between African-American
and non-Hispanic white students, Latinos and inner-city residents also lag behind their
non-Hispanic white counterparts. Although there is disagreement as to how the high
school drop-out rate is calculated, it is clear that Latinos have a higher drop-out rate than
their non-Hispanic white counterparts (Fry 2003; Barton 2005).
At best, current research on the academic achievement gap can be assumed to
apply also to civic education and civic skills. However, it is clear that there is a

84
consistent difference in academic achievement between racial/ethnic minorities and non-
Hispanic whites. The following sections detail the results of this dissertation’s subgroup
analyses.
African-Americans
The IEA/CivEd study and the NHES study allow for the examination of African-
American students as a subgroup, due to their sample sizes. Overall, the effect of civic
education is different for African-American students than for all other students. For
certain civic skills, the effect of civic education on civic skill presence is stronger for
African-American students than other students. For other civic skills, the effect of civic
education is weaker for African-American students than other students. Also, other
factors in African-American students’ environments appear to strongly affect civic skill
presence, such as expecting to complete a four-year college degree.
Political Interpretation Skills
African-American students are both more and less likely to be capable of
interpreting political communication material than other students, depending on the
content of their civic education. According to the IEA/CivEd study, studying the
Constitution always contributes to the presence of political interpretation skills more
strongly for African-American students than for other students. For example, African-
American students who study the Constitution are over 15 percentage points more likely
to correctly interpret which political party issued a political leaflet. This same effect is
less than 6 percentage points for all other students (Tables 28 and 55). The matching

85
methods mirror these results. This same pattern is also true for correct interpretation of a
cartoon about a political leader (Tables 29 and 56).
In contrast, studying how laws are made is not always associated with political
interpretation skills in African-American students, but is for all other students. For
example, studying how laws are made has negative effects on correctly interpreting a
leaflet about what the leaflet issuers think of a policy and correctly interpreting a cartoon
about a political leader for African-American students (Table 56). The same is not true
for all other students. For other political interpretation skills, studying how laws are
made has a strong average effect for both African-American students and all other
students (Table 55).
The IEA/CivEd study also reveals a stark difference between African-American
students who expect to complete a four-year college degree and African-American
students who do not.10 For example, the probability of correctly interpreting leaflets
about political party issuance and taxes for African-American students who expect to
complete a four-year college degree is 28 and 30 percentage points greater, respectively,
than the probability of correct interpretation for other African-American students (Table
28). Among African-American students, this pattern is true for other political
interpretation skills. While this same difference exists for non-African-American
students, the difference is not as large.
Potentially, the large effects of studying civic education topics for African-
Americans may signify a variation in civic skill levels among African-American students.
It may also signify that some African-American students do not come to the classroom
10 Fifty-nine percent of African-American students in the IEA/CivEd study expect to complete a college degree. Over 71% of non-African-American students in the IEA/CivEd study expect to complete a college degree.

86
with pre-existing civic skills, unlike some non-African-American students. For example,
given that this dissertation provides evidence that civic education can influence civic skill
development, if African-American students have had no exposure to sources of civic skill
development, the effect of civic education on their civic skill levels would be greater than
this same effect on all other students. Similarly, if non-African-American students have
had previous exposure to numerous sources of civic skill development, once exposed to
civic education, they may show a smaller improvement in their civic skill levels than
African-American students. In other words, when alternative sources of civic skill
development are present (such as religious group participation, student government
participation, and home environment), civic education may have a smaller effect on civic
skill presence than when these sources are absent.
Broad variation in access to sources of civic skill development for African-
American students may explain the large difference in civic skill levels between African-
American students who expect to complete college and African-American students who
do not. For example, African-American students who expect to complete a four-year
college degree may experience other sources of civic skill development besides civic
education, such as a home environment conducive to learning civic skills. African-
American students who do not expect to complete a college degree may not have access
to other sources of civic skill development besides civic education. If this is the case, the
civic skill differences between African-American students who expect to complete
college and those who do not would be apparent.
Other studies reveal stronger effects of education treatments for disadvantaged
students than for non-Hispanic white students. For example, Winfield (1990) documents

87
a stronger effect of minimum competency tests on African-American students’ academic
achievement than non-Hispanic white students’ academic achievement. Sanders and
Rivers (1996) and Ascher and Fruchter (2001) find that high-quality teachers have a
greater impact on the academic achievement of low-achieving students than of high-
achieving students. These studies provide evidence that endeavors to improve education
can have stronger effects for lower achievers and minorities than for others. Civic
education may be one such endeavor.
The empirical results of this subgroup analysis are evidence of a wide distribution
of civic skills among African-American students. The results also provide evidence that
African-American students may have fewer means of learning civic skills outside of civic
education than their non-African-American counterparts. The often strong effect of civic
education on the presence of political interpretation skills may signify that for some
African-American students, civic education is a primary source of civic skill
development.
News Monitoring Skills
Studying civic education topics has a negative effect on African-American
students’ newspaper monitoring skills, according to the IEA/CivEd study (Tables 57 and
58). Studying civic education topics rarely has a negative effect on non-African-
American students’ newspaper monitoring skills. In particular, studying four of the six
examined civic education topics had a negative average effect on monitoring
international newspaper news for African-American students (Table 58). Studying these

88
same topics had a positive effect on international news monitoring for non-African-
American students.
However, studying other topics, such as political parties and voting, has positive
average effects on news monitoring skills for African-American and non-African-
American students. Also, studying any civic education topic had smaller average effects
on monitoring radio news for African-American students than for all other students
(Table 59).
The NHES study also reveals negative effects of studying civics on news
monitoring skills for African-American students. The average treatment effects of civic
education on news monitoring skills are negative for reading newspaper news, watching
television news, and listening to radio news for African-American students. These same
effects are positive for all other students (Table 81).
These analyses suggest that African-American students’ news monitoring skills
are not as strongly affected by civic education as their political interpretation skills. This
is similar to the results found for all students as reported in Chapter 4. Again, these
measures of news monitoring skills may capture behaviors along with skills. African-
American students may choose to monitor news in different amounts than other
subgroups. While news monitoring skills may be affected by other factors besides civic
education, political interpretation skills appear more elastic to civic education. The
negative effects may signify an alienation felt by African-American students toward civic
education. Feelings of alienation from the political mainstream may translate into
barriers to learning civics topics and civic skills. Spurious analyses due to small sample
sizes may also explain the negative impact of civic education on news monitoring skills.

89
Group Discussion Skills
According to the IEA/CivEd study, studying civic education topics has an overall
positive effect on the frequency of African-American students’ discussions of
government events with their peers and their teachers, but not with their parents. For
example, the average treatment effect of studying civic education topics on discussing
government events with one’s teachers ranges from 8 to almost 20 percentage points for
African-American students (Table 60). This same pattern is true for non-African-
American students, although the average effects are not as strong.
However, the average effect of studying civic education topics on discussions of
government events with one’s parents is negative for African-American students (Table
60). This pattern is not mirrored among non-African-American students. This may
evidence a difference in the home environments of African-American students and all
other students. These results may indicate that the home environment is not often a
viable source of civic skill development for African-American students, although it is a
viable source for non-African-American students.
Communication Skills
The NHES study provides measures of communication skills. The NHES reveals
that the average effect of civic education on letter-writing skills is negative for African-
American students, but positive for all other students. The effect of civic education on
letter-writing skills is over 2 percentage points for non-African-American students (Table

90
81). For both African-American and other students, the effect of civic education on
public speaking skills is identical, less than 1 percentage point (Table 81).
The NHES probit models reveal other communication skill results. African-
American female students are significantly more likely to feel they could make a
comment or statement at a public meeting than their African-American male
counterparts. The same pattern is not true for non-African-American females and males.
Also, non-African-American students who live in rural areas are significantly less likely
to feel they could write a letter to someone in government that clearly conveys their
opinion compared to their non-rural counterparts. The same is not true for African-
American students.
Overall, the negative impact of civic education on letter-writing skills represents a
different result from the political interpretation skills. Similar to the news monitoring
skills’ analyses, the negative effect may represent an alienation felt by African-American
students toward civic education, and an impediment to learning civics topics and civic
skills.
When African-Americans exhibit stronger effects of civic education on their civic
skill levels than non-African-Americans, this may indicate that civic education is a
primary source of civic skill development. However, this finding may be contrary to the
voting behavior of young African-Americans. In past Presidential elections, eighteen to
twenty-four-year-old African-Americans have voted at greater rates than their non-
Hispanic white counterparts (Levine and Lopez 2002). Yet young African -Americans
with few sources of civic skill development may be unlikely to vote. However, the

91
NHES and the IEA/CivEd studies measure students at young ages – 10th and 11th grade
and age 14 – well before voting age. This discrepancy in results may be explained by
what happens to these students after high school. While in school, these students may
have scant resources for civic skill development. Yet, once they are voting age,
individual or societal factors that influence political participation may increase.
Longitudinal data to track students throughout this time period is needed to fully
understand these patterns.
Latinos
Latino students experience different effects from civic education on their civic
skill levels than non-Latino students. At times, civic education has a stronger effect for
Latino students than for others. Overall, the results of the subgroup analyses are
comparable for Latino and African-American students. Similar to African-American
students, Latino students exhibit strong political interpretation skills when they study
civic education topics.
Political Interpretation Skills
For Latino students, studying the Constitution and political parties has a strong
effect on interpreting political leaflets about party issuance and taxes. The effect is also
positive for non-Latino students, but not as strong. For example, for Latino students,
studying the Constitution or political parties has an over 11 percentage point effect on
correctly interpreting which political party issued a leaflet. The effect for non-Latino

92
students who study the Constitution is 5 percentage points, while it is around zero for
non-Latino students who study political parties.
Similarly, studying civic education topics has a stronger effect on correctly
interpreting a cartoon about a political leader for Latino students than for non-Latino
students. Again, studying the Constitution and political parties has average effects of
over 15 percentage points on correctly interpreting a cartoon about a political leader. In
contrast, studying civic education topics often has a negative effect on correct
interpretation of a cartoon about democracy for Latino students. However, non-Latino
students experience a positive effect of studying civic education topics on correctly
interpreting a cartoon about democracy.
The probit models reveal other significant findings. All students, Latino or non-
Latino, who expect to complete a four-year college degree are significantly more likely to
correctly interpret political leaflets. While Latino students who expect to complete a
college degree are more likely to correctly interpret political leaflets when compared to
other Latinos, this same difference is not as pronounced for non-Latino students. This is
similar to the stark difference found between African-American students who expect to
complete a college degree and all other African-American students.
Overall, these results mirror those found for African-American students, although
the magnitudes of the effects are not as strong. These results may have similar
explanations. Again, Latino students as a whole may reflect a wide range of civic skill
levels. Some Latino students may have had no exposure to means of civic skill
development outside of civic education. This may explain the stronger influence of civic
education on political interpretation skills for Latino students compared to non-Latino

93
students. Also, negative effects of civic education on political interpretation skills may
be a factor of classroom climate or students’ feelings of alienation.
News Monitoring Skills
According to the IEA/CivEd study, studying civic education topics has a smaller
effect on monitoring newspaper news for Latino students than for non-Latino students.
Sometimes the effect is negative for Latino students. For example, studying the
Constitution and Congress has a negative effect on newspaper monitoring skills for
Latino students, but not for non-Latino students (Tables 63 and 64). Studying Congress
has a significantly negative effect on monitoring newspaper news for Latino students.
According to the matching method results, the average negative effect is approximately
12 percentage points.
In contrast, the NHES study provides evidence that civic education has a much
stronger effect on monitoring newspaper or newsmagazine news for Latino students than
for non-Latino students. The effect of civic education on reading news sources is over 20
percentage points for Latino students, and over 7 percentage points for non-Latino
students.
Like African-American students, Latino students may also experience alienation
from the political mainstream. These feelings of alienation may provide a barrier to
learning civic skills and may influence classroom climate, causing the negative results
seen in these analyses.
Differences in the data sources may explain differences in results between the two
data sets. While the IEA/CivEd study comprises ninth-grade students, the NHES study’s

94
sample is a year or two older. Although this age difference is small, if this is a
particularly crucial time for students to learn civic skills, the two data sets may provide
different outcomes. The small sample sizes may also explain these analyses’ results.
According to the IEA/CivEd study, studying civic education topics has a smaller
effect on monitoring television news for Latino students than for non-Latino students,
except for studying political parties. For example, the effects of studying the
Constitution, Congress, and the Presidency on monitoring television news are less for
Latinos than for non-Latino students. However, studying political parties and voting has
an over 10 percentage point effect on monitoring television news for Latino students and
a 4.5 percentage point effect for non-Latino students. Also, studying any civic education
topic has a stronger effect on monitoring radio news for Latino students than for non-
Latino students. According to the NHES study, the effect of civic education on watching
television news or listening to radio news is approximately equal for Latino and non-
Latino students.
Overall, the analysis of news monitoring skills and Latino students provides
mixed results. According to the IEA/CivEd study, civic education can have a negative
effect on some news monitoring skills, but can have a strong effect on monitoring radio
news. According to the NHES study, civic education can have a very strong effect on
monitoring newspaper news. These differences may be due to differences in the two data
sources, such as age of respondent or different sample sizes. For both data sets’ analyses,
the sample sizes are small.

95
Group Discussion Skills
The results of examining news monitoring skills among Latino students are
similar to the results among African-American students. This is not true for group
discussion skills. While the effect of civic education on group discussion skills among
African-American students was not strong, according to the IEA/CivEd study, the effect
of studying various civic education topics on group discussion skills is strong for Latino
students. At times, this effect is stronger than the same effect for non-Latino students.
For example, studying Congress and how laws are made has an over 20 and 15
percentage point average effect, respectively, on the frequency Latino students discuss
government events with their teachers. This effect is much smaller (over 8 and 4
percentage points, respectively) for non-Latino students (Table 66). Also, studying any
civic education topic has a stronger effect on the frequency Latino students discuss
government events with their parents than for non-Latino students.
This result contrasts with the analysis of African-American students. While
Latino students are influenced by studying civics topics to discuss government events
with their parents, African-American students are not. This may signify a difference in
the home environment between Latino and African-American students. This provides
evidence that a typical Latino student’s home environment may be more conducive to
learning civic skills than a typical African-American student’s home environment.
Communication Skills
For both measured communication skills – writing a letter to an elected official
and making a statement at a public meeting or forum – the effect of civic education on
96
the presence of these skills is greater for Latino students than for non-Latino students,
according to the NHES study. For example, the average effect of civic education on
feeling confident to write a letter is over 4 percentage points for Latino students but less
than 2 percentage points for all other students. The average effect of civic education on
feeling confident to make a statement or speech is over 5 percentage points for Latino
students and around zero for all other students (Table 82).
The probit model analyses reveal that Latina students’ letter-writing skills are
much more affected by civic education than their Latino counterparts’ letter-writing
skills. According to the full probit models, Latina students are 6.7 percentage points
more likely to feel confident in their letter-writing skills than their male counterparts
(Table 47). This same sex difference is true for non-Latino students, but the effect is not
as large.
Again, a potential explanation for the strong effect of civic education on
communication skills may be that the primary source of civic skill development for
Latino students is civic education. If other sources of civic skill development are not
present for Latino students, given that civics coursework influences civic skill
development, civic education would have a strong effect on Latino students’
communication skill levels.
Overall, the effects of civic education on civic skill levels differ between African-
American students and non-African-American students, and between Latino students and
non-Latino students. At times, the effects of civic education on minority racial/ethnic
students are stronger than the effects on non-minority students. This may be evidence

97
that civic education is a primary source of civic skill development for minority groups,
while non-minority students are exposed to other sources of civic skill development.
Other researchers also document strong effects of educational benefits on disadvantaged
students. In particular, the analyses reveal strong effects of civic education on political
interpretation skill levels.
In other instances, the effects of civic education on minority racial/ethnic groups
are much less, and even negative, than the effects on non-minority students. Negative
effects of civic education may signify feelings of alienation toward the political
mainstream by minority students or disparate classroom climates. Negative effects of
civic education were found on news monitoring skills.
Finally, this dissertation examines civic skills that are necessary for political
participation in the non-Hispanic white political system that dominates American
democracy. Political and civic participation in minority communities may require other
skills not measured in these analyses. Alternatively, different skills may be more
effective for minority youth than for non-Hispanic whites to effectuate political change.
For example, Rockeymoore (2004) encourages minority youth to use their artistic talents
to perpetuate political change, cleverness to obtain internships and jobs with major
political figures, and pure determination to lobby elected officials for political change.
However, by judging minority youth on the civic skills measured in this dissertation, I
may be perpetuating an evaluation of minority youth through an Anglo lens.

98
Low-Income
The means tables presented in Chapter 3 show that students residing in
households whose income is less than $25,000 per year receive less civic education than
their higher-income counterparts. The NHES study reveals that less than 30% of the
students who studied civic education were low-income. Over 31% of the students who
did not study civic education were low-income (Table 4).
While means tables can demonstrate differences in exposure to civic education,
they do not address whether the effect of civic education on civic skill levels is different
for low-income students than for all other students. This section discusses that analysis.
In order to determine the differences in the effects of civic education on civic skill
presence for low-income students, probit models and matching methods were conducted
on low-income and higher income students separately. These methods are similar to
those used to examine the different effects of civic education for African-American and
non-African-American students.
The subgroup analyses reveal that civic education has stronger effects on
communication skills for low-income students than for other students. However, the
analyses also reveal that higher income students experience a stronger effect from civic
education on their news monitoring skills than low-income students.
Current research has examined the difference in overall academic achievement
between low-income and higher income students. Hochschild and Scovronick (2003)
contend that an achievement gap between low-income and higher income students has
not changed over time. In Minnesota, low-income students have consistently lower test
scores than their counterparts from households with higher incomes (Minneapolis Office

99
of Educational Accountability 2002). However, in California, low-income students
perform better in charter schools than regular schools (Slovacek et al. 2002).
Often, low-income students comprise racial/ethnic minorities. Figure 16 below
shows that the sample of low-income students examined in the NHES study are much
more likely to be African-American or Latino than their counterparts from higher income
families.
Figure 16: NHES Study, Percentage of Low-income Sample who are Minority Race/Ethnicity
Percent African-American Percent LatinoLow-income 28.9% 28.5%Non-low-income 11.5% 11.9%
Economic differences in academic achievement levels are often multiplied by
racial/ethnic differences in academic achievement levels. Blau (2003) finds that the
racial/ethnic achievement gap in social studies among 10th and 12th grade students is less
if the racial/ethnic difference in the school is not compounded with economic disparities
as well. Wilson (1996) contends that underlying economic differences can explain the
problems of race/ethnicity, including the academic achievement gap. However, Jencks
(1992) maintains that when economic differences are removed, race/ethnicity still
predicts educational outcomes.
News Monitoring Skills
According to the NHES study, civic education has a greater effect on news
monitoring skills for higher income students than for low-income students. For example,
the average effect of civic education on monitoring newspaper news is over 11
100
percentage points for high-income students, and is less than 3 percentage points for low-
income students (Table 84). This same civic education effect is true for monitoring
television and radio news sources. While low-income students experience a positive
effect from civic education, the effect is less than that for higher income students.
This difference in the effect of civic education on news monitoring skills for low-
income and higher income students may be due to classroom differences. In some cases,
low-income students attend low-income schools. The civic education courses in these
schools may not teach civic skills, and these schools may have fewer resources overall.
As shown above in Figure 16, low-income students are more likely to be racial/ethnic
minorities. The examination of news monitoring skills yields similar results among low-
income, African-American, and Latino students.
Communication Skills
For both letter-writing skills and public speaking skills, the effect of civic
education is stronger for low-income students than for their higher income counterparts.
For example, the average effect of civic education on letter-writing skills for low-income
students is over 3 percentage points. The effect is approximately 1 percentage point for
higher income students (Table 84). Also, the average effect of civic education on public
speaking skills is over 9 percentage points for low-income students, and is around zero
for higher income students.
The strong effect of civic education on communication skills for low-income
students is similar to the results experienced by Latino students. Again, this result may
have a similar explanation to the strong effects experienced by African-American and

101
Latino students. In this sense, low-income students may have limited access to sources of
civic skill development, except for civic education. Civic education may have a stronger
effect for low-income students who lack other sources of civic skill development.
Gender
Females and males similarly report studying civic education topics. According to
the IEA/CivEd and ACPS studies, females are slightly more likely to study civic
education topics than males (Tables 2 and 5). The NGI and NHES studies show that
females are equally likely or slightly less likely to study civic education than males
(Tables 3 and 4). However, these differences between females and males are small and
insignificant. According to the full model probits reported in Chapter 4 from the
IEA/CivEd study, female students hold consistently higher levels of political
interpretation skills than their male counterparts. According to the NHES study, females
have slightly higher levels of communication skills than males, but results from the
ACPS study contradict these findings. Females also fare slightly worse on news
monitoring and group discussion skills than their male counterparts.
Again, the probit models in Chapter 4 examine the differences in skill levels for
females and males when they are evaluated together in the full sample. This section
discusses the results of separate analyses of females and males, to determine the
differences in the effects of civic education on their civic skill levels.
The subgroup analyses discussed below reveal that females and males are
differently affected by civic education. This difference is not always detrimental to
female students. Much research examines the gap in academic achievement between

102
young women and men. The early 1990s introduced a newfound awareness of a gender
gap in academic achievement in math and science courses. Since then, however, this
achievement gap has been shrinking, particularly since 1996 (Minneapolis Office of
Educational Accountability 2002). However, according to Blau (2003), a gender gap
remains in the gains made in social studies knowledge among students between 10th and
12th grades. This gap is not statistically significant, but is consistently present (ibid.).
Also troubling, while female students generally receive better grades than males, they
score lower on standardized tests (AAUW 1998).
Most researchers agree that academic differences between the sexes are a function
of socialization and not biology (Begley 2005). The only proven biological differences in
academic skills between the sexes involve mental rotation abilities (Gurny 2003).
However, these abilities are not necessary for success in secondary math and science. An
AAUW (1998) report focuses on the differences in socialization experienced by school-
age females. Females are the targets of harassment more often than males, and major
threats to female students’ success in school include depression and pregnancy. In all,
females face separate social issues than males. While sports and extracurricular activities
can mollify negative social effects, poverty is a significant barrier to participation in these
activities for young women (ibid.).
Orenstein (1995) explains the academic gender gap as a gap in self-confidence.
When young women are under social pressures, they are more likely to “opt out” instead
of “act out” (ibid.). While young men exhibit outwardly disruptive behavior in times of
stress, young women are more likely to shut down and shut out others around them, and
not participate in academic activities. A separate AAUW report asserts that as female

103
students age, their self-esteem lowers (1994). For example, females are less likely than
males to argue with their teachers when they think they are right (ibid.).
Political Interpretation Skills
According to the IEA/CivEd study, female students experience a positive effect of
studying civics topics on political interpretation skills. Although this effect is less than
the effect on male students, it is notable. For example, studying how laws are made has a
2.8 percentage point average effect on female students’ correct interpretation of which
party issued a political leaflet (Table 67). This same effect is over 9 percentage points for
male students. Similarly, studying political parties has a 3 percentage point average
effect on female students’ correct interpretation of a cartoon about a political leader. This
same effect is over 5 percentage points for male students (Table 68). While the subgroup
analysis shows that civic education has a smaller effect on political interpretation skill
presence for females than for males, females hold higher levels of political interpretation
skills overall.
The IEA/CivEd study shows that females who expect to complete a four-year
college degree are always significantly more likely than other female students to correctly
interpret political cartoons and leaflets. The same is true for male students as well
(Tables 36 and 37). Open classroom climates in schools, such as those that encourage
students to make up their own mind, are also associated with correct political
interpretation skills for both females and males.

104
News Monitoring Skills
Overall, the IEA/CivEd and NGI studies provide mixed results on the effects of
civic education on news monitoring skills for females and males. The NHES and ACPS
studies provide moderate evidence that males’ news monitoring skills are more strongly
affected by civic education than females’ skills. For example, according to the
IEA/CivEd study, the average effects of studying civic education topics on monitoring
domestic newspaper news ranges from zero to over 9 percentage points for female
students. These same effects range from 8 to almost 13 percentage points for male
students. However, the average effect of studying civic education topics on monitoring
radio news is almost always greater for female students than for male students (Table 71).
The NGI study reveals that studying civic education has a negative effect on
monitoring newspaper and newsmagazine news for female students. This same effect is
positive for male students. However, civic education has a stronger effect on monitoring
television and radio news for female students than it does for male students (Table 79).
Also of note, expecting to complete a four-year college degree does not significantly
influence news monitoring skills, according to the IEA/CivEd study (Table 38).
According to the NHES study, studying civic education has a strong effect on
news monitoring skills for female students and an even stronger effect for male students.
For example, studying civic education has an average effect of approximately 5
percentage points on news monitoring skills for female students. This same effect is
between 8 and 13 percentage points for male students (Table 83).

105
Finally, the ACPS reveals that the average effect of studying civic education on
monitoring television news and public affairs programming is greater for females than for
males. The opposite pattern is true for monitoring newspaper news.
Most examined data sources (IEA/CivEd, NGI, and ACPS studies) provide
evidence that the effect of civic education on monitoring newspaper news is stronger for
males than for females. Results for monitoring other news sources are mixed, although
female students’ radio news monitoring skills are more strongly affected by civic
education than male students’ radio news monitoring skills. Overall, these sex
differences and mixed results may be explained by classroom differences and the social
differences female and male students experience at this age.
Furthermore, throughout this dissertation, the examination of news monitoring
skills provides the least consistent results and has been less likely to be correlated with
civic education than other civic skills. This may indicate the presence of unobservable
factors that influence news monitoring skills. This potential is further discussed in
Chapter 7.
Group Discussion Skills
Overall, the IEA/CivEd study provides evidence of strong effects of studying
civic education topics on group discussion skills for both female and male students. For
example, the average effects of studying civic education topics on frequency of
discussing government events with parents ranges from zero to over 14 percentage points
for female students. The same effects range from 5 to over 17 percentage points for male
students (Table 72). Also, studying most of the civic education topics has stronger

106
effects on the frequency students discuss government events with people their own age
for females than for males. For both female and male students, a classroom climate
where students feel free to disagree openly with their teachers significantly contributes to
greater frequency of group discussion with peers, parents, and teachers (Table 39).
The NGI study provides evidence that civic education has a negative effect on the
likelihood that female students work together in a group to solve community problems.
The effect is positive for male students (Table 80). However, civic education has a
strong effect on the likelihood that female students discuss current events with others.
This average effect is over 5 percentage points, while the same effect for male students is
less than 2 percentage points.
The ACPS reveals large effects of studying civic education on the likelihood that
males and females discuss local and national politics with others. The effect for males is
especially strong. For example, studying civic education has a 10 percentage point
average effect on the likelihood females discuss local politics with others, and an over 13
percentage point average effect on the likelihood females discuss national politics with
others (Table 87). These same effects are 24 and 26 percentage points for males,
respectively. Also remarkable, females who reported some college experience are
significantly more likely to discuss local and national politics with others than females
without college experience (Table 52).
Communication Skills
According to the NHES study, civic education has a stronger effect on letter-
writing skills for male students than for females. However, the NHES also shows that

107
civic education has a stronger effect on confidence in making a public statement or
speech for female students than for males. For example, the average effect of civic
education on student confidence in making a statement is almost 3 percentage points for
females, and is near zero for males (Table 83). The average effect of civic education on
letter-writing skills is over 5 percentage points for males, but only 1.5 percentage points
for females.
The ACPS study provides evidence of results opposite the NHES results.
According to the ACPS study, civic education has a greater effect on letter-writing skills
for males than females. The ACPS also shows that civic education has a greater effect on
confidence in making a public statement or speech for females than for males (Table 87).
These differences in results between the NHES and the ACPS are consistent with the
overall results found in Chapter 5.
Overall, civic education affects female civic skill levels differently than male
civic skill levels. Differences in general academic achievement levels may explain
differences in the effect of civic education on civic skills. The social experiences of
females during their high school years vary from the experiences of males. Female
students experiencing stressful social situations are more likely to distance themselves
from their studies, unlike male students (Orenstein 1995). This may affect their civic
skill levels, particularly group discussion skills, news monitoring skills, and
communication skills.

108
Non-College
According to the IEA/CivEd and NHES studies, non-college-bound students are
less likely to study civic education than college-bound students (Tables 2 and 4). Means
from the IEA/CivEd study show that only 56% of students who have studied two or
fewer civics topics plan on completing a four-year college degree, while almost 74% of
students who have studied three or more civics topics plan on completing a four-year
college degree. The ACPS also reveals a similar pattern. Over 55% of respondents who
studied civics in high school went on to complete at least some college, yet only 41% of
respondents who did not study civics in high school went on to complete some college
(Table 5).
Students who expect to complete a four-year college degree hold significantly
higher levels of political interpretation skills than students who do not expect to complete
a four-year college degree, according to the IEA/CivEd study (Tables 6 and 7). Both
students who expect to complete a four-year college degree and survey respondents who
have had some college hold higher levels of news monitoring skills than others, but the
differences are not significant (Tables 8 and 17). According to the ACPS, adults with
some college experience are significantly more likely to engage in group discussions with
their peers than other adults (Table 18). However, the same pattern was not true of
students who expect to complete a four-year college degree, according to the IEA/CivEd
study (Table 10).
The probit models in Chapter 4 show differences in civic skill levels for students
who plan on completing a four-year college degree and students who do not plan on
completing a four-year college degree. Chapter 4 also shows civic skill differences

109
between adults who had some college experience and adults who did not, as measured by
the ACPS. For purposes of this dissertation, both the students surveyed in the IEA/CivEd
and NHES studies who do not plan on attending college and the ACPS respondents with
no college experience are considered “non-college.” This section discusses the results of
separate analyses of college and non-college respondents, to determine the differences in
the effects of civic education on their civic skill levels.
The subgroup analyses reveal that civic education has different effects on college
and non-college respondents. For younger students, civic education can have stronger
effects for college-bound students than non-college-bound students, according to the
IEA/CivEd and NHES studies. For adults, civic education can have stronger effects for
non-college respondents than for respondents with some college experience, according to
the ACPS.
Evidence from the means tables suggests that students who do not intend to go to
college are less likely to receive civic education. This may be a consequence of academic
tracking. Often, higher academic achievers are tracked into college preparatory courses
within schools. Similarly, lower academic achievers are put in tracks that emphasize
vocational and technical skills. Lower academic tracks may or may not include civic
education. While many schools have tracking systems for science and math, some have
tracking systems for civics and social studies as well (Oakes 1995).
Critics of tracking systems claim that tracking can internally segregate schools by
race and social class (Oakes 1995). For example, schools with strong tracking systems
have fewer minorities and low-income students in the tracks for higher achievers, and
more minorities and low-income students in the non-college-bound tracks (ibid.).

110
Proponents of tracking claim that this is an efficient organizational practice that
maximizes cognitive development (Hallinan 1994). However, moving from one track to
another within schools is often difficult (Oakes 1995).
Tracking may explain the differences in civic education participation between
college-bound and non-college-bound students. Tracking may also partly explain the
differences in the effects of civic education on civic skill levels for college and non-
college respondents.
Political Interpretation Skills
According to the IEA/CivEd study, studying civic education topics has strong
effects on political interpretation skill presence for non-college-bound students. These
effects are often stronger than the same effects for college-bound students. For example,
studying the Constitution, the Presidency, and state and local government results in
stronger average effects on correct political leaflet interpretation for non-college-bound
students than for college-bound students (Table 73). In particular, the effects of studying
civics topics for non-college-bound students on interpreting which political party issued a
leaflet range from over 8 to over 12 percentage points. These same effects range from 2
to less than 5 percentage points for college-bound students. The effects of studying civic
education topics on interpreting political cartoons reveal a similar pattern.
Large differences in political interpretation skill presence exist between college-
bound African-American students and all other college -bound students, and also between
non-college-bound African-American students and all other non -college-bound students.
While African-American students are less likely overall to correctly interpret political

111
leaflets and cartoons, non-college-bound African-American students are far less likely
than other non-college-bound students to correctly interpret political material. For
example, non-college-bound African-American students are over 25 percentage points
less likely to correctly interpret what leaflet issuers think about taxes than all other non-
college-bound students (Table 40).
These findings are consistent with Oakes’ observations of student tracking (1996).
She maintains that students on lower-achievement tracks within schools tend to be
minority race/ethnicity and low-income. This dissertation finds that minority
race/ethnicity and low-income students are less likely to have access to civic education.
This may be the result of their placement in lower-achieving tracks. However, this
subgroup analysis of political interpretation skills provides evidence that civic education
has stronger effects on civic skill presence for non-college-bound students than college-
bound students. Potentially, when non-college-bound students do receive civics
instruction, the effect is large because they have not had access to other means of civic
skill development in their coursework. This may be similar to the strong effect of civic
education on civic skill presence experienced by African-American students.
News Monitoring Skills
The effect of civic education on the presence of news monitoring skills for college
and non-college respondents differs from the effects of civic education on the presence of
political interpretation skills. According to the IEA/CivEd study, the average effect of
studying any civic education topic on monitoring domestic or foreign newspaper news is
greater for college-bound students than non-college-bound students (Tables 75 and 76).

112
A similar pattern holds for watching television news and listening to radio news.
According to the NHES study, the effect of civic education on news monitoring skills is
similar for college-bound and non-college-bound students (Table 85). However, the
effect of studying civics on news monitoring skills is greater for adults with no college
experience than for adults with some college experience, according to the ACPS (Table
89). These differences among data sets may be due to the age span of the data sample.
Both the NHES study and the ACPS reveal that non-college-bound African-
American students and African-American adults with no college experience hold strong
news monitoring skills (Tables 50 and 54). For example, according to the NHES study,
non-college bound African-American students are much more likely to follow news
sources than all other non-college-bound students, although the difference is not
significant. According to the ACPS, African-American adults, both with and without
college experience, are more likely to monitor news sources than all other adults, and the
differences are often significant.
The different results between news monitoring skills and political interpretation
skills may be due to the type of skill measured. Political interpretation skills are
cognitive skills, and are easier learned in schools. News monitoring skills are
participatory skills, and may not be as easily learned in classrooms. In turn, classroom
instruction may have a greater effect on political interpretation skills, while news
monitoring skills may be more sensitive to other civic skill development factors outside
of civics instruction, such as home environment.

113
Group Discussion Skills
According to the IEA/CivEd study, the effect of studying any civic education
topic on the frequency of discussions of government events with peers and parents is
greater for college-bound students than for non-college-bound students (Tables 77 and
78). This same effect is almost always greater on frequency of discussions with teachers
for college-bound students. However, while the effect of studying civic education topics
is strong on the frequency of group discussions for college-bound students, it is also
positive for non-college-bound students. The ACPS reveals a similar pattern. The
average effect of high school civics courses on frequency of discussing politics with
others is stronger for adults with some college experience than for adults with no college
experience (Table 88).
According to the IEA/CivEd study, classroom climate measures have strong
effects on group discussion skill presence for non-college-bound students. In particular,
when students feel free to disagree openly with their teachers and are encouraged to make
up their own minds, they are much more likely to discuss government events with their
peers, parents, and teachers (Table 43). For example, non-college-bound students who
feel free to disagree openly with their teachers are over 14 percentage points more likely
to engage in discussions with their peers than other non-college-bound students.
Similarly, non-college-bound students who are encouraged to make up their own minds
in their classrooms are almost 15 percentage points more likely to engage in discussions
with their teachers than other non-college-bound students.
Again, different results between group discussion skills and political
interpretation skills may be due to the type of skill measured. While political
114
interpretation skills may be more easily learned in schools, group discussion skills may
not be as easily learned in classrooms. In turn, classroom instruction may have a greater
effect on political interpretation skills, while group discussion skills may be more
sensitive to other civic skill development factors, such as classroom climate or home
environment.
Communication Skills
According to the NHES study, civic education has stronger effects on letter-
writing skills for non-college-bound students than college-bound students. However,
civic education has stronger effects on confidence in making a public statement for
college-bound students than for non-college-bound students (Table 85). Similarly, the
ACPS reveals that civic education has stronger effects on letter-writing skills for adults
with no college experience than for adults with some college experience (Table 88).
However, the ACPS shows that civic education has significantly strong effects on
confidence in making a public statement for adults with no college experience. The
effect of civic education on confidence in making a public statement for adults with some
college experience is also positive (Table 53).
The NHES study also reveals that non-college-bound Latino and African-
American students hold greater letter-writing and speaking skills than other non-college-
bound students (Table 50). Similarly, the ACPS shows that African-American adults
with no college experience hold greater letter-writing and speaking skills than other
adults with no college experience (Table 53).

115
In all, skills such as letter-writing and interpreting political leaflets and cartoons
may be easier to learn in a civics classroom setting for non-college respondents, as the
effect of civic education participation is strong for these skills. Other skills, such as
confidence in making a public statement or news monitoring skills, may be learned not
just in a civics classroom, but also through other means such as an open classroom
climate or a home environment conducive to learning civic skills.
Furthermore, civic education may not be a common course for students in lower-
achieving school tracks. When non-college-bound students receive civics instruction,
this may indicate they are participating in courses outside their track. Exposure to a
higher-achieving track itself may result in higher levels of civic skills for non-college-
bound students.
Discussion
To summarize, this subgroup analysis revealed that civics coursework has
dissimilar effects on civic skill levels for some populations over others. While civic
education has strong effects on some civic skills for African-Americans and Latinos, it
has negative effects on other civic skills within the same populations. Similar effects
were found among low-income students and non-college respondents. Females and
males also experience differences in the effects of their civics courses. While females
experience weaker effects of civic education on their civic skill levels in general, they
hold greater levels of civic skills than males. The explanation may be that they gain less
from courses since they start at a higher baseline.
116
This chapter’s analyses raise two points for further research. First, differences in
the effects of civics coursework should prompt an examination of the civics classroom.
Differences in civics classroom climate or content may explain wide variations in the
effects of civics coursework on civic skill levels among different populations. Second,
the role civic education plays among all sources of civic skill development should be
examined. As some populations have access to sources of civic skill development at
lower rates than more privileged populations, understanding how civic education
contributes to civic skill development compared to other sources is crucial. Chapter 7
concludes this dissertation.

117
Chapter 7 – CONCLUSIONS AND POLICY RECOMMENDATIONS
This dissertation examines the correlation between civic skills and civic education
using probit models and propensity score matching methods. The analyses reveal that a
history of civic education is correlated with civic skill presence for some civic skills, such
as political interpretation skills. For other skills, such as news monitoring skills, civic
education does not always influence their presence. The analyses show that the effect of
civic education on civic skill presence varies for different subgroups, such as minority
race/ethnicities, low-income, female, and non-college respondents. Key results are
summarized below.
This dissertation is a study of civic skills, defined as the abilities to participate in
politics. This dissertation examines numerous civic skills outside of voting. Skills
needed for participation often are more difficult to acquire and more difficult to measure
than the act of voting. They are also more difficult to teach. These are the skills that
youth increasingly do not have, but are eager to learn (Rockeymoore 2004). They are
also the skills that are not always taught in schools.
In the most recent Presidential election, the youth voter turnout rate greatly
increased. Partial credit for the increase in youth voter turnout rates belongs to grassroots
organizations and campaigns that targeted youth participation. While these organizations
encouraged youth to vote, and sometimes even taught them how to vote, they did not
teach youth other means of political participation besides voting. Many youth were
inspired to vote by current events and urged by these organizations to express their
political views through voting. For some young voters, this election experience

118
materialized a newfound willingness to participate in the political process. However,
many youth do not have the abilities to politically participate outside of voting. For these
young citizens, acting on willingness is futile without the capability to successfully
participate in politics.
This dissertation examines the ability to politically participate, not the willingness
to participate. Both ability and willingness are necessary for successful political
participation. Sources of learning participation abilities include part-time jobs,
extracurricular activities, religious group participation, parents, and civic education. This
dissertation focused on civic education as a source of civic skill development.
Prior to this research, a quantitative analysis of civic skills and civic education did
not exist. This dissertation provides such an analysis by applying quantitative research
methods to the relationship between skills and civic education. In particular, this
dissertation applies robust empirical methods (propensity score matching methods) to the
analysis of this relationship. Propensity score matching methods mimic a randomized
experiment and robustly control for observable factors in the analysis.
Research on civic education, political socialization, political participation, and the
development of civic engagement in youth focuses on the willingness of young citizens
to be politically engaged. An overall deficit in examining civic skills and abilities exists
– from their origins, to how they are taught, to links with education, to links with political
knowledge, and to links with political willingness. The relationship of civic skills to all
these factors remains unaddressed in the current literature.
This dissertation considers civic skills scarce resources that are unequally
distributed. The means tables and probit models in Chapters 3 and 4 show that minority

119
students hold lower levels of civic skills than more privileged students. Chapter 6
provides evidence that for some civic skills, such as political interpretation skills,
racial/ethnic minorities and low-income students may only have opportunities to learn
civic skills in school. Overall, civic skills are not equally distributed among different
race, ethnicity, household income, gender, and non-college populations.
Rockeymoore (2004) describes an 18 year-old African-American male who asked
how he might effectuate political change in his community beyond voting. He lacked the
skill but not the will to change the community around him. In turn, Rockeymoore wants
young minorities to recognize “what is at stake if [they] fail to become educated about
what is happening to them, why it is happening, and what they can do to confront the
people, systems, and policies that would cripple them before they’ve had a chance to
enter the race” (ibid., p. vii).
Are civic skills taught in high school civics courses? The answer to this question
is mixed: for some students, in some classrooms, some civic skills are being taught.
Unfortunately, this dissertation’s analyses did not reveal consistent, blanket results
among civic skills and civics topics. For example, studying the Constitution and the
Presidency often, but not always, is correlated with civic skill presence. Similarly, news
monitoring skills are correlated with civic education in some data sets but not others.
This dissertation finds that:
- Increased civic skill levels are present when contact with civic education is present
- Students of civic education are more likely to expect to complete a four-year college
degree

120
- Students who do not take civic education are more likely to be African-American,
Latino, or immigrants
- Students who do not take civic education are less likely to be in open classroom
climates
- Political interpretation skills are influenced by the study of the Constitution and the
Presidency
- Sometimes news monitoring skills are influenced by civic education; studying
Congress is associated with news monitoring skills
- Probit models reveal minimal evidence that civic education influences
communication skills; propensity score matching methods reveal small effects of
civic education on communication skills
- Studying the Presidency is correlated with an increased frequency of group
discussions; the propensity score matching methods provide minimal evidence of a
link between civic education and group discussion skills
- An open classroom climate almost always is positively correlated with higher levels
of civic skills
- African-American and immigrant students hold significantly lower levels of this
dissertation’s measured civic skills than other students
- Student government participation is correlated with increased communication skills
- Overall, the results of the propensity score matching methods support the probit
models’ results
- A strong difference exists in the effects of civic education on cognitive civic skills
between racial/ethnic minorities and non-Hispanic whites
121
- African-American and Latino students experience a stronger effect of civic education
on their cognitive skill levels than non-Hispanic whites
- The gap in skill levels between college-bound African-American students and non-
college-bound African-American students is far greater than the gap in skill levels
between college-bound non-Hispanic white students and non-college-bound non-
Hispanic white students
- No evidence of a link between civic education and English language skills was found
At times, the same civic skills reveal inconsistent results within and among data
sets. For example, the IEA/CivEd study reveals that studying the Constitution and the
Presidency often contributes to the presence of civic skills, while studying other civics
topics does not. This may be due to the students studying these topics in different
courses. The differences in the topics themselves may also explain different results.
Differences in the make-up of data sets may explain different results among the
data sets. For example, the ACPS study consisted of eighteen to thirty-year-old students
and non-students. All of the other data sets comprise students and survey younger
respondents. At the extremes, a fourteen-year-old student from the IEA/CivEd study was
compared to a thirty-year-old non-student in the ACPS study. Furthermore, the ACPS
and the NGI study were smaller than the other two data sets. Also of note, the ACPS data
was collected in 1990, much earlier than the other data sets. These differences in sample
make-up may explain different results among data sets that examine the same civic skills.
Finally, different civic skills themselves may engender different relationships with
civic education. While political interpretation skills often correlate with studying civic

122
education topics, news monitoring skills are often unrelated to studying civic education.
Civics classes may be more likely to teach cognitive skills (political interpretation skills)
than participatory or group discussion skills.
Broad Limitations to the Study
Limitations exist regarding the methodology, assumptions, and data sources used
in this study. Previous chapters discuss problems related to potential civic education
selection, civic education measures within data sets, and civic skill measures.
This study highlights a problem with the civic education measure in the NGI
study. The NGI study’s survey question measures current civic education course-taking
only, not prior civics course-taking. Due to this wording of the survey question, the
measure does not completely capture civics course-taking. Throughout the dissertation,
the NGI produced consistently weaker or different results than similar civic skill analyses
from other data sources. The disparity in results may signify a serious problem in using
the civic education measure found in the NGI study. This limitation should be
considered when regarding results from the NGI study.
Similarly, the civic education measures in the IEA/CivEd study lacked complete
information. The survey questions from the IEA/CivEd study asked students, “Have you
studied the Constitution / Presidency / Congress, etc.” Due to this wording, students may
answer “yes” to the survey questions, without relaying which courses taught them the
topic. In other words, students may answer “yes” if they studied these topics in their
American history courses. In this sense, these measures also do not fully capture civics
course-taking.

123
As discussed earlier, many of the civic skill measures examined were not pure
measures of civic skills. For example, the news monitoring skills measured frequency of
a behavior as indicative of a skill. Also, the communication skills measured confidence
along with the skill itself. Ideally, these abilities to politically participate would be
measured individually. However, the examined skills are the best available measures of
these abilities.
This study measured civic skills that have been previously defined in published
literature as civic skills. Yet other civic skills outside of the literature exist that this
dissertation did not measure. For example, as discussed in Chapter 2, the use of
“heuristics” as a civic skill, or short-cuts to effectuate political change in one’s
community, was not examined in this study. Also, the skills measured in this dissertation
are the skills needed to politically participate in a majority non-Hispanic white American
democracy. This dissertation judged all students on these same skills. This may explain
the lower levels of skills held by African-American and Latino students. Rockeymoore
(2004) encourages young minorities to learn alternative civic skills that this dissertation
does not measure, such as expression through artwork and lobbying.
Finally, this dissertation does not examine sources of civic skill development
outside of civic education. While the analyses controlled for many factors that may
influence civic skill development, such as home environment, after- school group activity,
and job requirements, they do not directly test how these factors are correlated with civic
skill presence. The relationship between civic skills and civic education should not be
examined in a vacuum; other sources of civic skill development should be considered
when studying this relationship.

124
Policy Recommendations
On December 21, 2004, President Bush signed into law the American History and
Civics Education Act of 2004. The purpose of the bill is to “… establish academies for
teachers and students of American history and civics and a national alliance of teachers of
American history and civics, and for other purposes” (HR 5360 2004). The legislation
institutionalizes the National Endowment for the Humanities’ “We the People” program
for elementary and secondary students. “We the People” teaches American history and
civics through grants to teachers and scholars and provides summer institutes and
seminars for American history teachers. The program provides curriculum suggestions
for teachers and recommends readings for students. The new legislation allocates funds
to establish Presidential learning academies for teachers of American history and civics,
Congressional summer academies for students, and forms a national alliance of American
history and civics teachers.
The legislation is laudable for its focus on teaching American history and civics,
and has inspired national debate on the proper content of history and civics curricula.
The legislation also provides much-needed funding for the continuing education of
history and civics teachers. In all, this federal legislation legitimizes the importance of
teaching history and civics. This is crucial, as No Child Left Behind Programs have not
prioritized American history and civics.
However, the “We the People” curriculum does not focus on civic skills. While a
solid history and civics curricula such as “We the People” can teach students about the
role of political participation in American democracy, its primary aim is not to teach

125
participatory skills and abilities. This dissertation provides evidence that such a
curriculum is desperately needed.
To start, every American high school graduate should take a civics course. Even
if this course teaches civic skills secondarily and American government institutions and
processes primarily, every student should have this background. An understanding of
American government processes and procedures is a crucial seedbed for future political
participation.
Along with basic concepts about American government, schools also need to
teach students how to politically participate. Civic education should simultaneously
teach civic skills and inspire willingness in students to be active, engaged citizens. To do
this, schools should teach students how to make decisions in a group setting when all
parties do not agree, how to be a successful political activist, how to organize others for a
common political cause, and even how to vote.
This dissertation provides evidence that for some students, particularly
racial/ethnic minorities and low-income students, civic education may be a sole reliable
source of civic skill development. Other sources of civic skill development, such as
after-school curricular activities and jobs, religious group participation, and parents and
families, are simply unavailable to some students. For some, civic education is the only
option for civic skill development. Civic education is the primary policy- manipulatable
source of civic skill development. Government and society cannot in good conscience
influence the civic skill development students receive in their jobs or at home; however,
policies can influence the teaching of civic skills in schools.

126
This burdens civics courses with a heavy responsibility. When youth who do
receive civic education and learn civic skills are mostly non-Hispanic white and higher
income, the future voice of American democracy is biased. Certainly the interests and
preferences of racial/ethnic minority, female, and low-income citizens differ from those
of non-Hispanic white, male, and higher income citizens. When schools do not teach
civic skills in civics courses, they perpetuate the current reality that racial/ethnic
minorities and low-income students have access to fewer sources of civic skill
development than their more privileged counterparts.
What should schools do with this burden? Current high school curricula prioritize
reading and math, and any skills likely to appear on standardized tests. Schools and
students may not have time in their schedules for further civics study with a focus on
civic abilities. School districts may not be able to afford to teach more in their current
civics courses. Yet the goal of teaching civic skills must be prioritized, to equalize the
citizen voice that our government hears. We must teach skills in high schools, to give all
young citizens at least one venue from which to learn civic skills. When families cannot
or do not teach civic skills and group participation and jobs are unavailable to
disadvantaged youth, civic skills should be taught in schools.
According to the Civic Mission of Schools report, a promising approach to
teaching civic skills includes class discussion, service-learning, student voice in school
government, and simulations (Carnegie Corporation and CIRCLE 2003). All these
methods should be used to teach civic skills. The New York Times’ Learning Network
Daily Lesson Plan11 offers numerous lesson plans for civics teachers. Many of these
implicitly teach civic skills. For example, in one lesson plan called “Stunning
11 See http://www.nytimes.com/learning/teachers/lessons/civics.html.

127
Recommendation,” students study current research on stun guns and safety and write
letters to their elected officials about whether stun guns should be further regulated. In
another lesson, students assess the charitable needs of their community and create a mock
charitable organization to address these needs. Still other lessons urge students to form
their own opinions on current topics, and to express themselves through writing or art.
These lessons can teach participatory, organizational, and communication skills to
students.
This dissertation stops short of recommending a separate semester of civic
education with a focus on civic skills for all American high school students. Although
this may be effective, such a requirement may not reflect overall community agreement
on the importance of fostering civic skill development. In a sense, it would be putting the
cart before the horse. The solution is to engender in schools and communities the
importance of teaching civic skills, so as to equalize the ability to politically participate.
Schools and their surrounding communities should seek to prioritize teaching civic skills
and equal political participation. Communities, in turn, should support schools in this
endeavor, and recognize the necessity of equal participation for a representative
democracy.12 Once communities, parents, students, and schools agree that equal ability
to politically participate is a priority, schools should teach civic skills.
Future Research
Overall, further research is needed to understand what is happening inside civic
education classrooms. This dissertation reveals different results of the effects of civic
12 Campbell (2002) also emphasizes school-community partnerships to equalize and engender political participation.

128
education on civic skill presence among different civic skills and different populations.
This study also reveals differences among students who study different civics topics, such
as the Constitution and political parties and voting. Classroom curriculum content,
classroom climate, and teacher behavior may explain these differences. The data sources
in this dissertation do not measure differences inside students’ civic education
classrooms. Better data needs to be collected that measures civic skills, civic education
content and environment, and students’ civics course-taking history. This data would
reveal whether differences inside the classroom contribute to differences in civic skill
levels.
A large gap in current research comprises the effects, influence, and interaction of
alterative sources of civic skill development with civic education. Alternative sources
include parents, families and students’ home environments; part-time job requirements
and activities; after-school group activities; group memberships; and participation in
religious organizations. While this study thoroughly examines the effect of civic
education on civic skill levels, further research should similarly examine the effect of
alternative sources of civic skill development on civic skill levels. Such studies would
provide insight into the most effective means of acquiring civic skills. By fully
understanding all sources of civic skill development, communities, parents, schools, and
organizations could work to better develop civic skills in young people.
In the U.S., the concept of equal political participation as a human right is
relatively new. Women have been voting for 85 years, African-Americans have had their
vote legally protected for only 40 years, and 18 year-olds have been voting for 34 years.

129
While political influence and political participation has historically been reserved for the
privileged, equalizing the ability for all to participate is a newer concept. How citizens
learn the abilities to participate, and how these abilities can be equalized among all
citizens is of grave concern to a fair and representative democracy. Schools, and civic
education courses, are one reliable source of civic skill development. Schools and
communities should prioritize teaching civic skills to all students.

130
Appendix A – Summary of Data Sets and Related Literature
NHES IEA ACPS NGIMeasurable Civic Skills
English proficiency, Ability to write letter, Ability to give speech, Monitor news
English proficiency, Political interpretation, Monitor news, Group discussion
English proficiency, Ability to write a letter, Ability to give a speech, Monitor news, Group discussion
Monitor news, Group discussion.
Civic Education Measure
High school courses that required attention to government, politics or national issues.
High school study of Congress, U.S. Constitution, Presidency, laws, court system, political parties, local government.
High school courses that required attention to current events.
High school courses that required attention to politics or government.
Covariates Student government participation, group participation, community service.
Student government participation, group participation, religious participation, number of books in home, expected educational level.
Student government participation, type of job, political orientation, group participation, religious participation.
Student government participation, political orientation, group participation, religious participation, hours per day watching television.
Data Subset Used
10th and 11th-grade students
Entire data set (14-year-olds)
18-30 year-olds 15-25 year-old students
Sample Size 2,106 1,953 638 556% in Sample with Civic Education
72.9% 69% - 81% 78.6% 50.7%
Note: Demographic factors such as age, race, sex, education level, and household income are absent from this chart but are included in the analyses.
ACPS = American Citizen Participation Survey 1990NHES = National Household Education Survey 1999IEA = IEA Civic Education Study 1999NGI = Civic and Political Health of the Nation, Generational Portrait 2002

131
Related Literature:Measurable Skills: Related Literature:English Proficiency Verba et al 1995Ability to write a letter Verba et al 1995Ability to give a speech Verba et al 1995Political interpretation Patrick 2002, Torney-Purta 2002Monitor news Patrick 2000, Kirlin 2002Group discussion Kirlin 2003, Hurtado et al 2002Covariates:Student government participation Patrick 2002Civics curriculum Niemi and Junn 1998, Torney-
Purta 2002Type of job and job skills Schur 2003Political knowledge measure Torney-Purta 2002Political orientationPolitical club or group Hurtado et al 2002Religious participation Schwadel 2002, Campbell 2001

132
Appendix B – Civic Skill Survey Questions
English proficiency
NHES: What language does [CHILD] speak at home?
IEA/CivEd: How often do you speak English at home?
ACPS: What language do you usually speak at home – English or something else?
Ability to write a letter / Political Communication
NHES: Suppose that you wanted to write a letter to someone in the government about something that concerned you. Do you feel that you could write a letter that clearly gives your opinion?
IEA/CivEd: When you are an adult, what do you expect you will do? Write letters to anewspaper about social or political concerns? [NOT USED]
ACPS: Suppose you wanted to write a letter to someone in the government – perhaps your Member of Congress or a local city official – on some issue or problem that concerned you. Do you feel that you write well enough to write a convincing letter expressing your point or do you feel that you do not?
Ability to give a speech
NHES: Imagine you went to a community meeting and people were making comments and statements. Do you think you could make a comment or a statement at a public meeting?
ACPS: Imagine you went to a community meeting and people were making comments and statements. Do you think you speak well enough to make an effective statement in public at such a meeting?
Political interpretation
IEA/CivEd: Which party issued political leaflet? What do issuers of leaflet think about taxes?What policy issuers of leaflet are likely to favor? [note: these are measured as correct / incorrect answers]
Main message of cartoon about political leader? [note: measured as correct / incorrect answers]

133
Monitor news
NHES: How often do you read about the national news in a newspaper or a newsmagazine like Newsweek, Time, or U.S. News and World Reports?
How often do you watch the national news on television or listen to the national news on the radio?
IEA/CivEd: How often do you read articles in the newspaper about what is happening in this country?
How often do you read articles in the newspaper about what is happening in other countries?
How often do you watch news broadcasts on television?
How often do you listen to news broadcasts on the radio?
ACPS: How often do you watch a national news broadcast on television?
Besides the news, how often do you watch some type of public affairs program on television?
How often do you read a newspaper?
NGI: How many days have you read a newspaper over the past seven days?
How many days have you read a magazine like Newsweek, Time, or U.S. News and World Reports over the past seven days?
How many days have you watched the national news on television over the past seven days?
How many days have you listened to the news on the radio over the past seven days?
How many days have you read news on the internet over the past seven days?
Some people seem to follow what’s going on in government and public affairs most of the time, whether there’s an election or not. Others aren’t that interested. Do you follow what’s going on in government and public affairs most of the time, some of the time, rarely or never?

134
Group discussion
IEA/CivEd: How often do you have discussions of what is happening in the U.S. government with people of your own age?
How often do you have discussions of what is happening in the U.S. government with parents or other adult family members?
ACPS: How often do you discuss local community politics or local community affairs with others?
How often do you discuss national politics and national affairs with others?
NGI: Have you ever worked together informally with someone or some group to solve problems in the community where you live?
How often do you talk about current events or things you have heard about in the news with your family and friends?

135
Appendix C – Civic Education Survey Questions
American Citizen Participation Survey (ACPS)
Thinking still about high school, did you have any courses that required you to pay attention to current events?
National Household Education Survey (NHES)
During this school year, have you had any courses that required you to pay attention to government, politics or national issues?
Last year, did you have any courses that required you to pay attention to government, politics or national issues?
IEA / Civic Education study
Over the past year, have you studied the United States Constitution?
Over the past year, have you studied Congress?
Over the past year, have you studied the President and the Cabinet?
Over the past year, have you studied how laws are made?
Over the past year, have you studied the court system?
Over the past year, have you studied political parties, elections, and voting?
Over the past year, have you studied state and local government?
Over the past year, have you studied other countries’ government?
Over the past year, have you studied international organizations (such as the United Nations)?
Civic and Political Health of the Nation, Generational Portrait (NGI)
Do any of your classes require you to keep up with politics or government, either by reading the newspaper, watching TV, or going onto the Internet, or no?
136
Appendix D – Instrumental Variables Methods
Instrumental variables methods require an instrument, or an exclusion restriction.
An exclusion restriction is a variable that is significantly related to the pri mary
independent variable of interest (civic education) but not related to the dependent variable
(civic skills). In this case, the exclusion restriction would affect whether the respondent
had civic education, but would not affect their skill level. The instrument acts as a proxy
for the unobservable factors that influence civic education selection that otherwise would
be included in the error term (Gujarati 1995).
Overall, reliable instruments are difficult to find. For this dissertation, I tested the
use of three different state-level civic education policies as exclusion restrictions. In
theory, state-level education policies should be related to civic education selection but not
related to individual civic skill level. The instruments tested include: state graduation
requirements in civics, citizenship education, or American government; civics,
citizenship education or social studies included in state assessments; and state statutes
that address civics, citizenship education, or social studies. Use of these instruments
requires state-specific identifying information in the data sets. Table A that follows
details the states that have these requirements, assessments, and statutes.

137
Table A: States that have Graduation Requirements, Include Civics in State Assessments, or Address Civics in State Statutes
Graduation Requirements State Assessments State StatutesAL, AZ, AR, CA, CO, CT, DC, FL, GA, HI, ID, IL, IN, IA, KS, KY, LA, ME, MD, MA, MI, MO, NV, NH, NM, NY, NC, ND, OH, OK, OR, PA, SC, SD, TN, TX, UT, VA, WA, WI, WY
CA, DE, GA, IN, KS, KY, LA, ME, MI, MO, MT, NH, NC, OR, SC, TX, UT, WI
AL, AZ, AR, CA, CO, CT, DE, GA, ID, IL, IN, IA, KS, KY, LA, ME, MA, MI, MN, MS, MO, NE, NH, NJ, NY, NC, OK, OR, PA, SC, TN, TX, UT, VT, VA, WA, WV, WI, WY
Source: Education Commission of the States (ECS) database. www.ecs.org.
As stated earlier, for these instruments to be valid, they must be significantly
correlated with the measure of civic education in the data sets. Two data sets allowed for
examination of instruments – the NGI and the NHES. Table B below shows coefficients
and standard errors of the three tested instruments from the first-stage of the bivariate
probit models. Civic education is the dependent variable.
Table B: Coefficients from First-Stage Bivariate Probit ModelsGraduation
RequirementsState Assessments State Statutes
NGI .035(.190)
.212(.122)
-.104(.164)
NHES -.069(.118)
-.021(.073)
-.190(.099)
Civic Education is the dependent variable in both models. Standard errors are in parentheses.
Because none of the tested instruments are significantly related to the civic
education measure in each data set, they cannot be used as exclusion restrictions. In fact,
the coefficients examined in the NHES study are negatively associated with civic
education participation.

138
If these instruments were significantly correlated with civic education
participation, they could be relied upon to absorb some of the exogenous variation in the
civic education measures. Unfortunately for this dissertation, this was not the case, and
the instruments are unusable.

139
Appendix E - Propensity Score Matching Methods
Viewing civic education as a treatment enables the construction of a counter-
factual to be used as an appropriate comparison group in the probit analyses. This
counter-factual is constructed to be as similar as possible (based on observable
background characteristics) to the group receiving the treatment. In doing so, an
unbiased estimate of the treatment outcome is obtained. In order for this to be correct,
the conditional independence assumption (CIA) is assumed. The CIA presumes that
given a background characteristic, or value of X available in the data sets, the outcome Y0
for the treated group is equal to the same outcome, Y0, in the untreated group.
Unfortunately this cannot be tested without experimental data.
An ideal experiment would observe what the civic skill development would have
been like in the respondents who did take a civic education course, had they not taken the
course. As this is not possible, a counter-factual will be approximated. For example, let
Y1i = the individual’s treated outcome
Y0i = the individual’s untreated outcome
X = a vector of observed individual background characteristic variables included as
covariates in the probit analyses.
The issue of common support is not a concern with any of the four data sets. For
the treated and untreated groups, the distributions where all X are supported generously

140
overlap. The chart at the end of this Appendix details the means and standard deviations
for the propensity scores for all four data sets. The similarity in propensity score values
between the treated and untreated groups in each of the four data sets indicates common
background characteristics (X vector variables) for each analysis.
D = 1 if treated
D = 0 if no treatment
where D is civic education, the treatment of interest. The stable unit treatment value
assumption (SUTVA) is presumed in this analysis. SUTVA presumes that the outcomes
for both the treated and untreated students (Y1i and Y0i) do not rely on the treatment
participation decisions of other students or the number of students receiving the
treatment.
These matching methods estimate a counter-factual of what would occur to the
treated student if they did not take civic education. This counter-factual, or comparison
group, will give the outcome E(Y0i | X, D=0). Therefore, the parameter of greatest
interest, the “average treatment effect” is estimated as:
E(Y1i | X) – E(Y0i | X)
And another parameter of interest, the “average treatment effect on the treated,” will be
estimated as:
E(Y1i | X, D=1) – E(Y0i | X, D=1)

141
Propensity score matching methods were employed to construct the counter-
factual. Propensity score matching methods were chosen for their simplicity; typically,
propensity score matching methods are employed to solve for the “curse of
dimensionality” (Heckman et al. 1998).
This dissertation employs nearest-neighbor matching methods with replacement.
Common support was imposed and tied propensity score observations were also matched.
The treated observations outnumbered the untreated observations in the IEA/CivEd,
NHES, and ACPS surveys. Treated and untreated observations were approximately
equal in the NGI survey. Due to the ratio of treated observations to untreated
observations, nearest-neighbor methods were deemed appropriate (Frölich 2004). When
matching is done with replacement, as in this dissertation, the same untreated individual
can be matched to more than one treated individual.
Matching methods increase model variance by estimati ng the propensity scores.
Bootstrapped standard errors were calculated as an alternative measure of variance.
Bootstrapped standard errors account for added variance, such as that introduced by the
estimation of the propensity scores and by matching with replacement (Efron 1993).
Also, matching-weighted probits were conducted. The matching weight is the frequency
the observation is used as a match. This weight is included in the probit models to
present an alternative means of estimating the civic education coefficients.

142
Propensity Score MeansD = 1 D = 0
IEA/CivEd:Studied Constitution: N 1,559 394 Propensity Score Mean .814 .747 Propensity Score Std. Deviation
.102 .125
Studied Congress: N 1,493 460 Propensity Score Mean .784 .699 Propensity Score Std. Deviation
.122 .149
Studied Presidency: N 1,312 641 Propensity Score Mean .688 .608
Propensity Score Std. Deviation
.130 .150
Studied How Laws are Made: N 1,520 433 Propensity Score Mean .790 .735 Propensity Score Std. Deviation
.097 .113
Studied Political Parties: N 1,427 526 Propensity Score Mean .739 .677
Propensity Score Std. Deviation
.103 .126
Studied State and Local Gov’t.: N 1,355 598 Propensity Score Mean .698 .644 Propensity Score Std. Deviation
.100 .112
NGI: N 277 278 Propensity Score Mean .543 .471 Propensity Score Std. Deviation
.133 .132
NHES: N 1,532 574 Propensity Score Mean .734 .699 Propensity Score Std. .079 .092

143
Deviation
ACPS: N 478 136 Propensity Score Mean .796 .687 Propensity Score Std. Deviation
.127 .175

144
Of those who studied…. Studied 2 Studied 3Political State/ or Fewer or More
Full Sample Constitution Congress Presidency Laws Parties Local Gov't. Topicsa Topics(1) (2) (3) (4) (5) (6) (7) (8) (9)
Studied: Constitution 81.11% 100.00% 94.95% 93.45% 90.76% 90.73% 90.82% 19.28% 94.21% Congress 77.73% 91.01% 100.00% 93.02% 89.85% 89.48% 89.73% 9.06% 92.30% Presidency 67.69% 77.99% 81.00% 100.00% 78.98% 79.71% 78.81% 7.63% 80.42% Laws 78.96% 88.35% 91.26% 92.13% 100.00% 89.74% 89.55% 19.36% 91.59% Political Parties 73.34% 82.05% 84.42% 86.36% 83.36% 100.00% 88.71% 16.93% 85.30% State/Local Gov't. 69.10% 77.38% 79.77% 80.45% 78.38% 83.59% 100.00% 16.63% 80.23%
Civic Skills:Political Interpretation: Leaflet 1b 85.59% 87.50% 87.20% 88.41% 87.04% 86.28% 86.54% 79.69% 86.84% Leaflet 2 86.48% 88.98% 88.80% 88.80% 87.75% 87.67% 88.02% 77.81% 88.32% Leaflet 3 74.78% 76.95% 76.84% 77.07% 75.84% 76.93% 75.41% 64.51% 76.95% Cartoon 1 90.30% 92.46% 92.10% 92.90% 91.95% 92.01% 92.17% 80.87% 92.30% Cartoon 2 78.75% 80.26% 80.58% 81.38% 79.74% 79.44% 78.52% 71.02% 80.39%News Monitoring: Monitor this countryc 62.87% 65.06% 65.80% 66.51% 65.20% 66.02% 66.36% 49.10% 65.78% Monitor other countries 53.57% 55.98% 56.17% 56.24% 55.22% 57.24% 56.78% 39.73% 56.51% Monitor TV 80.00% 82.87% 82.26% 82.72% 81.98% 82.73% 82.88% 68.13% 82.51% Monitor Radio 43.89% 45.97% 46.80% 48.40% 46.61% 47.79% 46.81% 30.12% 46.81%Englishd: 92.78% 93.64% 93.42% 94.18% 93.52% 93.70% 93.89% 88.39% 93.71%Group Discussion: w/ Own Agee 28.62% 30.03% 30.28% 32.01% 30.19% 31.40% 30.61% 22.46% 29.93%
w/ Parents 58.76% 61.78% 62.86% 64.46% 61.97% 61.55% 62.32% 41.40% 62.45% w/ Teachers 60.13% 63.10% 64.03% 64.57% 62.57% 63.91% 65.21% 44.50% 63.44%
sample size: 1,953 1,559 1,493 1,312 1,520 1,427 1,355 361 1,592
a) Students who report studying 0, 1 or 2 of the six listed civics education topics. b) Percent correctly interpreting political leaflets and political cartoonsLeaflet 1: Dependent variable =1 if student correctly interpreted which party issued the political leaflet.Leaflet 2: Dependent variable=1 if student correctly interpreted what leaflet issuers think about taxes.Leaflet 3: Dependent variable=1 if student correctly interpreted what policy the issuers of the leaflet favor.Cartoon 1: Dependent variable =1 if student correctly interpreted a political cartoon about a political leader. Cartoon 2: Dependent variable =1 if student correctly interpreted a political cartoon about democracy. c) Monitoring the news variables: percent answering "sometimes" or "often."d) Percent responding that they speak English always or almost always at home. e) Group discussion variables: percent answering "sometimes" or "often" to "How often do you have discussionsof what is happening in the U.S. government with people of your own age / parents / teachers?"
All calculations used the "total weight" as provided in the survey data.
Table 1International Association for the Evaluation of Educational Achievement Civic Education study: IEA/CivEd
Means

145
Of those who studied…. Studied 2 Studied 3Political State/ or Fewer or More
Full Sample Constitution Congress Presidency Laws Parties Local Gov't. Topicsa Topics(1) (2) (3) (4) (5) (6) (7) (8) (9)
Studied: Constitution 81.11% 100.00% 94.95% 93.45% 90.76% 90.73% 90.82% 19.28% 94.21% Congress 77.73% 91.01% 100.00% 93.02% 89.85% 89.48% 89.73% 9.06% 92.30% Presidency 67.69% 77.99% 81.00% 100.00% 78.98% 79.71% 78.81% 7.63% 80.42% Laws 78.96% 88.35% 91.26% 92.13% 100.00% 89.74% 89.55% 19.36% 91.59% Political Parties 73.34% 82.05% 84.42% 86.36% 83.36% 100.00% 88.71% 16.93% 85.30% State/Local Gov't. 69.10% 77.38% 79.77% 80.45% 78.38% 83.59% 100.00% 16.63% 80.23%
Classroom climate: Students disagree 69.42% 72.74% 74.21% 73.99% 72.32% 73.01% 73.26% 50.65% 73.41% Students' own minds 82.95% 84.98% 85.97% 85.24% 84.56% 85.44% 85.32% 70.82% 85.52% Student opinionsb 74.83% 77.85% 78.82% 79.15% 77.08% 78.08% 78.67% 59.33% 78.11%
Demographics: African-American 11.44% 10.84% 10.14% 10.22% 10.74% 11.37% 11.74% 14.15% 10.86% Latino 11.74% 11.09% 11.04% 10.56% 12.20% 11.32% 10.22% 13.41% 11.39% Asian 6.05% 6.12% 6.08% 5.35% 5.81% 6.13% 5.74% 6.51% 5.95% Whites 74.36% 75.85% 76.54% 77.40% 75.55% 75.13% 75.58% 67.12% 75.90% Female 51.66% 53.53% 52.80% 51.99% 53.08% 52.53% 52.58% 42.56% 53.59% Males 48.34% 46.47% 47.20% 48.01% 46.92% 47.47% 47.42% 57.44% 46.41% Immigrants 9.59% 9.25% 9.33% 8.14% 9.00% 9.08% 8.91% 12.22% 9.03% Student Gov't. 32.73% 35.44% 35.35% 35.75% 34.70% 34.97% 34.83% 21.61% 35.09% College Degreec 70.90% 73.87% 74.68% 75.83% 73.49% 74.11% 72.72% 56.34% 73.98% Over 100 books in Home 51.34% 52.49% 52.69% 53.88% 52.72% 53.79% 52.88% 44.66% 52.76% Newspaper in home 60.80% 62.22% 62.62% 63.00% 62.39% 62.05% 61.55% 52.42% 62.58%
sample size: 1,953 1,559 1,493 1,312 1,520 1,427 1,355 361 1,592
a) Students who report studying 0, 1 or 2 of the six listed civics education topics. b) "Students disagree" - Students 'sometimes' or 'often' feel free to disagree openly with their teachers about political and social issues
during class. "Students' own minds" - Students 'sometimes' or 'often' are encouraged to make up their minds about issues. "Studentopinions" - Students 'sometimes' or 'often' feel free to express opinions in class even when their opinions are different.
c) Percentage of students expecting to complete a four-year college degree.
All calculations used the "total weight" as provided in the survey data.
Table 2International Association for the Evaluation of Educational Achievement Civic Education study: IEA/CivEd
Means
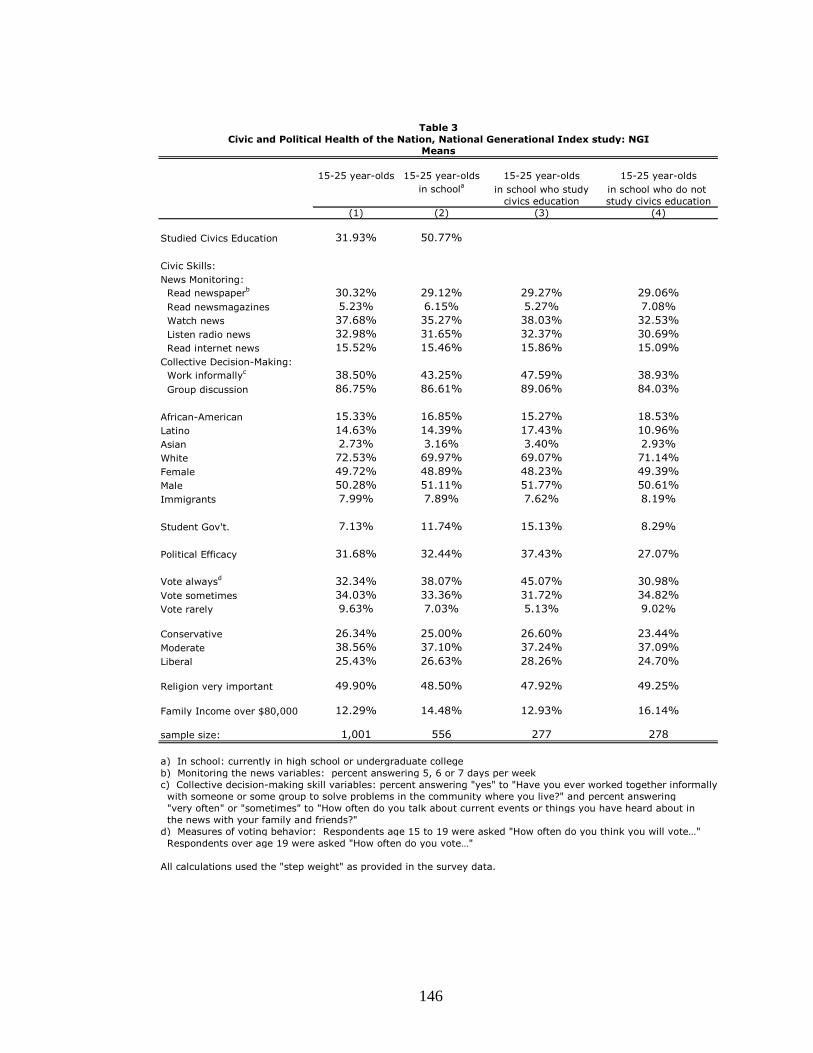
146
15-25 year-olds 15-25 year-olds 15-25 year-olds 15-25 year-oldsin schoola in school who study in school who do not
civics education study civics education(1) (2) (3) (4)
Studied Civics Education 31.93% 50.77%
Civic Skills:News Monitoring: Read newspaperb 30.32% 29.12% 29.27% 29.06% Read newsmagazines 5.23% 6.15% 5.27% 7.08% Watch news 37.68% 35.27% 38.03% 32.53% Listen radio news 32.98% 31.65% 32.37% 30.69% Read internet news 15.52% 15.46% 15.86% 15.09%Collective Decision-Making: Work informallyc 38.50% 43.25% 47.59% 38.93% Group discussion 86.75% 86.61% 89.06% 84.03%
African-American 15.33% 16.85% 15.27% 18.53%Latino 14.63% 14.39% 17.43% 10.96%Asian 2.73% 3.16% 3.40% 2.93%White 72.53% 69.97% 69.07% 71.14%Female 49.72% 48.89% 48.23% 49.39%Male 50.28% 51.11% 51.77% 50.61%Immigrants 7.99% 7.89% 7.62% 8.19%
Student Gov't. 7.13% 11.74% 15.13% 8.29%
Political Efficacy 31.68% 32.44% 37.43% 27.07% Vote alwaysd 32.34% 38.07% 45.07% 30.98%Vote sometimes 34.03% 33.36% 31.72% 34.82%Vote rarely 9.63% 7.03% 5.13% 9.02%Conservative 26.34% 25.00% 26.60% 23.44%Moderate 38.56% 37.10% 37.24% 37.09%Liberal 25.43% 26.63% 28.26% 24.70%Religion very important 49.90% 48.50% 47.92% 49.25%Family Income over $80,000 12.29% 14.48% 12.93% 16.14%sample size: 1,001 556 277 278
a) In school: currently in high school or undergraduate collegeb) Monitoring the news variables: percent answering 5, 6 or 7 days per weekc) Collective decision-making skill variables: percent answering "yes" to "Have you ever worked together informally with someone or some group to solve problems in the community where you live?" and percent answering "very often" or "sometimes" to "How often do you talk about current events or things you have heard about in the news with your family and friends?"
d) Measures of voting behavior: Respondents age 15 to 19 were asked "How often do you think you will vote…"Respondents over age 19 were asked "How often do you vote…"
All calculations used the "step weight" as provided in the survey data.
Table 3Civic and Political Health of the Nation, National Generational Index study: NGI
Means

147
Full Sample Had Civics Education Did not have Civicsthis year or Education this year
last year or last year(1) (2) (3)
Studied Civics Education 72.95%
Civic Skills:News Monitoring: Read newspapera 51.34% 54.24% 43.51% Watch news 76.04% 78.12% 70.40%English at home 96.05% 96.78% 94.10%Communication skills: Write letterb 92.12% 93.42% 88.60% Make statement 80.79% 81.28% 79.46% Female 50.36% 49.96% 51.45%
African-American 16.20% 17.05% 13.90%Latino 12.14% 10.37% 16.90% Student Gov't. 15.28% 16.37% 12.35%
Political Efficacy 69.11% 70.02% 66.66% Immigrants 5.43% 4.52% 7.90%
Private School Attendees 7.49% 7.63% 7.11%
Group Participation 69.59% 72.71% 61.18%
Work outside of school 59.58% 61.52% 54.35%
College Degreec 86.94% 87.85% 84.46%
Family Income under $25,000 30.29% 29.80% 31.60%sample size: 2,106 1,532 574
a) Monitoring the news variables: percent answering "almost daily" or "at least once a week"b) Communication skills: percent answering that they could write a letter to someone in government or
make a statement at a public meeting.c) Percentage of students expecting to complete a four-year college degree.
All calculations used the "FY" weight as provided in the survey data.
Table 4National Household Education Survey: NHES 10th and 11th grade only
Means

148
Full Sample Had Civics Education Did not have Civicsin high school Education in high
school(1) (2) (3)
Studied Civics Education 78.63%
Civic Skills:News Monitoring: Read newspapera 83.05% 85.06% 82.91% Watch public affairs 32.53% 32.84% 30.48% Watch news 77.22% 78.59% 74.24%English at home 94.91% 97.52% 90.00%Communication skills: Write letterb 77.16% 80.73% 71.55% Make speech 64.09% 68.12% 55.68%Group Disscussion Localc 42.67% 45.34% 31.71%Group Disscussion National 58.57% 61.79% 46.19% Female 50.40% 52.48% 42.50%
Black 10.95% 10.25% 11.69%Latino 8.66% 6.86% 13.36% Student Gov't. 29.61% 34.08% 16.04%
Political Efficacy locald 45.00% 48.45% 37.43%Political Efficacy national 15.84% 16.29% 15.30% Immigrants 9.13% 7.10% 15.62%
Private School Attendees 10.72% 9.98% 13.28%
Religion is very important 41.29% 41.38% 37.56%
Liberal 32.09% 33.59% 25.43%Conservative 33.67% 31.83% 42.56%
Some Collegee 51.67% 55.37% 41.32%
Family Income under $20,000 29.94% 28.61% 33.59%sample size: 638 478 136
a) Monitoring the news variables: percent answering at least once a weekb) Communication skills: percent answering that they could write a convincing letter to someonein government or make an effective public statement at a community meeting.
c) Group discussion skills: percent answering that they discuss local / national events every day,nearly every day, or once or twice a week with others.
d) Percent of respondents who feel they have "some" or "a lot" of influence over local / nationalgovernment decisions.
e) Percentage of respondents who completed some college.
All calculations used the "wt2517" weight as provided in the survey data.
Table 5American Citizen Participation Survey: ACPS
Means

149
(1) (2) (3) (4) (5) (6)Civic Education variables:
Studied Constitution .312* .267* .411* .360* .250* 0.196(.126) (.125) (.130) (.133) (.108) (.112)[.076] [.055] [.099] [.071] [.083] [.063]
Studied Congress -0.047 -0.251 0.161 0.004 0.098 -0.026(.135) (.135) (.135) (.137) (.113) (.118)[-.010] [-.043] [.035] [.000] [.031] [-.008]
Studied Presidency .300* .247* 0.121 0.012 0.086 0.016(.097) (.103) (.100) (.106) (.090) (.093)[.070] [.048] [.026] [.002] [.027] [.005]
Studied How Laws are Made 0.087 0.124 -0.075 -0.048 -0.089 -0.077(.117) (.120) (.124) (.128) (.103) (.103)[.019] [.024] [-.015] [-.008] [-.027] [-.023]
Studied Political Parties -0.149 -.257* -0.073 -0.146 0.194* 0.163(.112) (.118) (.116) (.125) (.091) (.093)[-.031] [-.044] [-.015] [-.023] [.063] [.051]
Studied State and Local Government -0.027 -0.01 0.021 -0.002 -0.163 -0.146(.100) (.102) (.100) (.106) (.085) (.087)[-.006] [-.001] [.004] [-.001] [-.050] [-.044]
Latino -0.071 -0.169 0.008(.115) (.112) (.101)[-.013] [-.031] [.002]
African-American -.435* -.522* -.372*(.103) (.103) (.097)[-.099] [-.114] [-.126]
Asian 0.12 0.073 0.078(.172) (.190) (.146)[.021] [.012] [.023]
Immigrant -0.131 -.257* -0.051(.119) (.122) (.115)[-.026] [-.050] [-.016]
Female 0.157 .284* 0.022(.086) (.086) (.075)[.029] [.049] [.007]
In Student Government .295* 0.179 0.097(.096) (.098) (.080)[.052] [.029] [.029]
Expecting to Complete a 4-year College Degree .518* .376* .380*(.084) (.088) (.076)[.110] [.071] [.123]
Classroom climate:Students feel free to disagree openly with teachers 0.08 .226* 0.089
(.089) (.090) (.084)[.015] [.041] [.027]
Students are encouraged to make up own minds .214* 0.084 0.047(.104) (.104) (.098)[.043] [.015] [.014]
Students express opinions in class even when different 0.038 0.116 .280*(.093) (.093) (.084)[.007] [.020] [.090]
Controls for Number of Books and Newspapers in Home yes yes yesControls for Group Participation yes yes yesControl for Feelings of Political Efficacy yes yes yesLog Pseudo-Likelihood -787.03 -682.32 -751.62 -639.12 -1088.22 -1024.08sample size: 1,953 1,953 1,953 1,953 1,953 1,953
Leaflet 1: Dependent variable =1 if student correctly interpreted which party issued the political leaflet.Leaflet 2: Dependent variable=1 if student correctly interpreted what leaflet issuers think about taxes.Leaflet 3: Dependent variable=1 if student correctly interpreted what policy the issuers of the leaflet favor."Controls for Group Participation" include youth, school paper, enivronmental, Model UN, student exchange, human
rights, volunteer, charity, Boy or Girl Scouts, ethnic, computer, art, sports, or religious groups. Robust standard errors are in parentheses. Marginal effects are in brackets. * significant at the α=.05 level. All calculations used the "total weight" as provided in the survey data.
Table 6Political Interpretation Skills - Political Leaflets (IEA/CivEd)
Probit Models
Leaflet 1 Leaflet 2 Leaflet 3
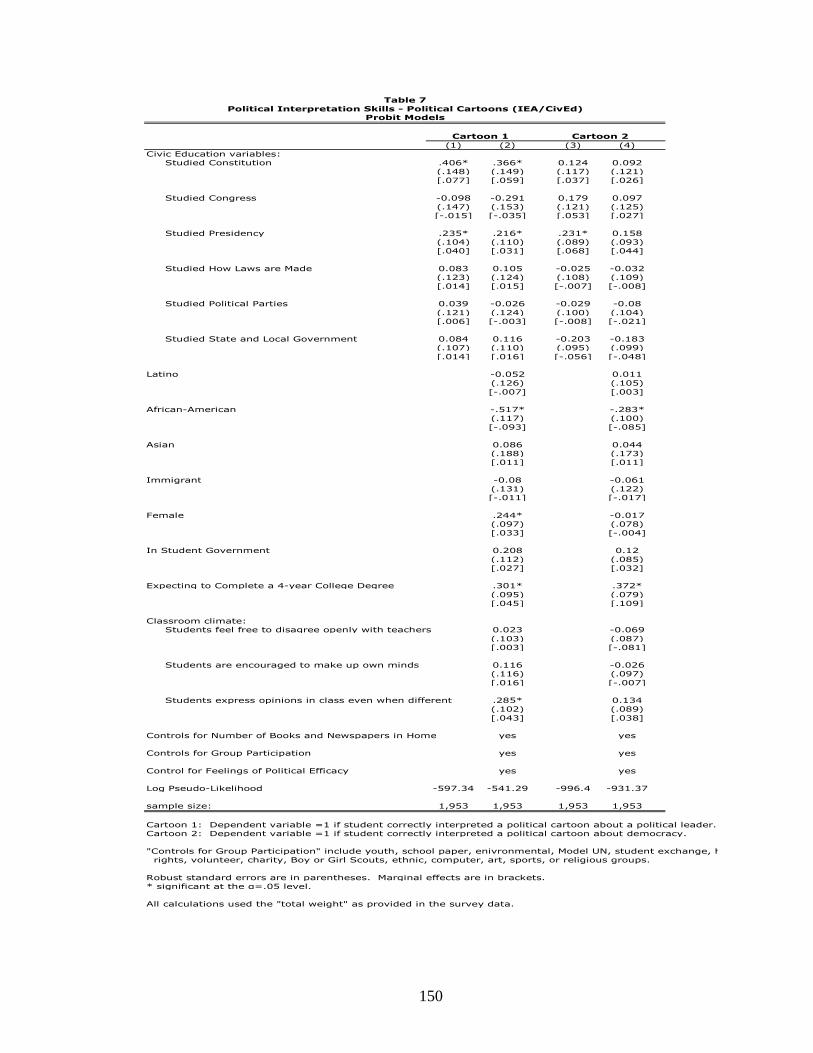
150
(1) (2) (3) (4)Civic Education variables:
Studied Constitution .406* .366* 0.124 0.092(.148) (.149) (.117) (.121)[.077] [.059] [.037] [.026]
Studied Congress -0.098 -0.291 0.179 0.097(.147) (.153) (.121) (.125)[-.015] [-.035] [.053] [.027]
Studied Presidency .235* .216* .231* 0.158(.104) (.110) (.089) (.093)[.040] [.031] [.068] [.044]
Studied How Laws are Made 0.083 0.105 -0.025 -0.032(.123) (.124) (.108) (.109)[.014] [.015] [-.007] [-.008]
Studied Political Parties 0.039 -0.026 -0.029 -0.08(.121) (.124) (.100) (.104)[.006] [-.003] [-.008] [-.021]
Studied State and Local Government 0.084 0.116 -0.203 -0.183(.107) (.110) (.095) (.099)[.014] [.016] [-.056] [-.048]
Latino -0.052 0.011(.126) (.105)[-.007] [.003]
African-American -.517* -.283*(.117) (.100)[-.093] [-.085]
Asian 0.086 0.044(.188) (.173)[.011] [.011]
Immigrant -0.08 -0.061(.131) (.122)[-.011] [-.017]
Female .244* -0.017(.097) (.078)[.033] [-.004]
In Student Government 0.208 0.12(.112) (.085)[.027] [.032]
Expecting to Complete a 4-year College Degree .301* .372*(.095) (.079)[.045] [.109]
Classroom climate:Students feel free to disagree openly with teachers 0.023 -0.069
(.103) (.087)[.003] [-.081]
Students are encouraged to make up own minds 0.116 -0.026(.116) (.097)[.016] [-.007]
Students express opinions in class even when different .285* 0.134(.102) (.089)[.043] [.038]
Controls for Number of Books and Newspapers in Home yes yesControls for Group Participation yes yesControl for Feelings of Political Efficacy yes yesLog Pseudo-Likelihood -597.34 -541.29 -996.4 -931.37sample size: 1,953 1,953 1,953 1,953
Cartoon 1: Dependent variable =1 if student correctly interpreted a political cartoon about a political leader. Cartoon 2: Dependent variable =1 if student correctly interpreted a political cartoon about democracy. "Controls for Group Participation" include youth, school paper, enivronmental, Model UN, student exchange, human
rights, volunteer, charity, Boy or Girl Scouts, ethnic, computer, art, sports, or religious groups. Robust standard errors are in parentheses. Marginal effects are in brackets. * significant at the α=.05 level. All calculations used the "total weight" as provided in the survey data.
Table 7Political Interpretation Skills - Political Cartoons (IEA/CivEd)
Probit Models
Cartoon 1 Cartoon 2

151
(1) (2) (3) (4) (5) (6) (7) (8)Civic Education variables:
Studied Constitution 0.027 -0.029 0.151 0.104 .394* .356* -0.023 -0.087(.107) (.110) (.106) (.112) (.112) (.115) (.108) (.111)[.010] [-.011] [.060] [.041] [.119] [.103] [-.009] [-.034]
Studied Congress 0.115 0.016 0.068 -0.046 -0.096 -0.22 0.066 0.026(.112) (.114) (.111) (.116) (.121) (.124) (.114) (.114)[.043] [.006] [.027] [-.018] [-.025] [-.055] [.026] [.010]
Studied Presidency 0.127 0.068 0.023 0.001 0.066 0.009 .212* .177*(.084) (.085) (.084) (.086) (.091) (.095) (.085) (.086)[.048] [.025] [.009] [.001] [.018] [.002] [.083] [.069]
Studied How Laws are Made 0.03 0.053 -0.073 -0.063 0.026 0.023 0.086 0.1(.096) (.099) (.096) (.100) (.105) (.106) (.098) (.099)[.011] [.020] [-.029] [-.025] [.007] [.006] [.033] [.039]
Studied Political Parties 0.104 0.062 0.234* .209* 0.128 0.087 .227* 0.183(.091) (.094) (.091) (.094) (.093) (.097) (.093) (.095)[.039] [.023] [.093] [.083] [.036] [.023] [.088] [.071]
Studied State and Local Government 0.134 0.124 0.088 0.077 0.125 0.117 0.008 -0.028(.085) (.087) (.084) (.086) (.089) (.092) (.085) (.086)[.051] [.047] [.033] [.030] [.035] [.031] [.003] [-.011]
Latino -0.079 0.068 0.051 -0.072(.100) (.100) (.111) (.101)[-.029] [.027] [.013] [-.028]
African-American -0.151 -.262* 0.06 0.14(.096) (.095) (.108) (.100)[-.057] [-.104] [.015] [.055]
Asian 0.088 0.239 0.088 -0.158(.149) (.143) (.160) (.142)[.032] [.093] [.022] [-.061]
Immigrant 0.149 .330* -0.001 -0.076(.111) (.111) (.120) (.111)[.054] [.127] [-.001] [-.029]
Female -0.115 -0.045 0.027 .187*(.071) (.070) (.077) (.070)[-.043] [-.018] [.007] [.073]
In Student Government 0.097 0.025 0.095 -0.006(.076) (.074) (.081) (.074)[.036] [.009] [.024] [-.002]
Expecting to Complete a 4-year College Degree 0.026 -0.018 0.041 0.05(.075) (.075) (.082) (.075)[.009] [-.007] [.010] [.019]
Classroom climate:Students feel free to disagree openly with teachers 0.092 0.051 .213* 0.14
(.079) (.078) (.083) (.079)[.034] [.020] [.058] [.054]
Students are encouraged to make up own minds .184* .287* 0.16 0.182(.093) (.093) (.097) (.095)[.070] [.114] [.044] [.070]
Students express opinions in class even when different .249* .259* .248* 0.096(.081) (.080) (.085) (.083)[.094] [.103] [.069] [.037]
Controls for Number of Books and Newspapers in Home yes yes yes yesControls for Group Participation yes yes yes yesControl for Feelings of Political Efficacy yes yes yes yesLog Pseudo-Likelihood -1268.61 -1198.35 -1329.96 -1240.95 -952.91 -901.66 -1314.13 -1255.3sample size: 1,953 1,953 1,953 1,953 1,953 1,953 1,953 1,953
Read Newspaper 1: Dependent variable =1 if respondent answered "sometimes" or "often" to "How often do you readarticles in the newspaper about what is happening in this country?"
Read Newspaper 2: Dependent variable =1 if respondent answered "sometimes" or "often" to "How often do you readarticles in the newspaper about what is happening in other countries?"
Watch: Dependent variable =1 if respondent answered "sometimes" or "often" to "How often do you watch news broadcasts on television?"
Listen: Dependent variable =1 if respondent answered "sometimes" or "often" to "How often do you listen to news broadcasts on the radio?"
"Controls for Group Participation" include youth, school paper, enivronmental, Model UN, student exchange, humanrights, volunteer, charity, Boy or Girl Scouts, ethnic, computer, art, sports, or religious groups.
Robust standard errors are in parentheses. Marginal effects are in brackets. * significant at the α=.05 level. All calculations used the "total weight" as provided in the survey data.
Listen to Radio
Table 8Monitoring the News (IEA/CivEd)
Probit Models
Read Newspaper 1 Read Newspaper 2 Watch TV
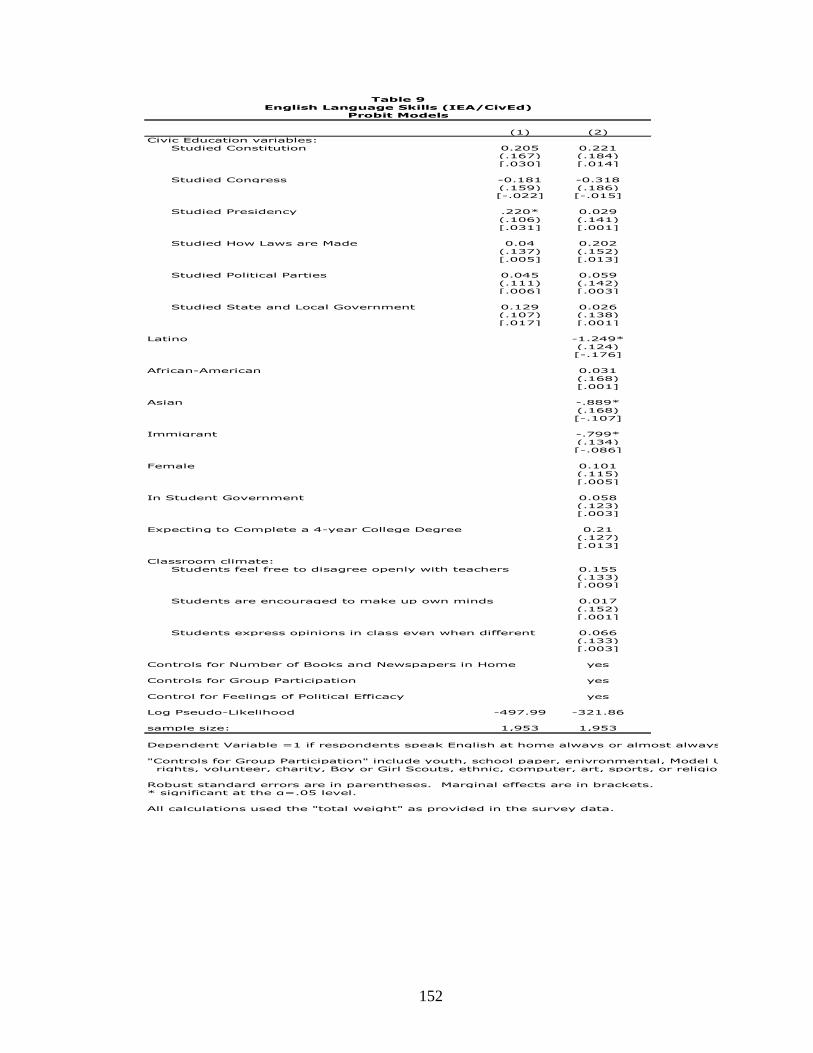
152
(1) (2)Civic Education variables:
Studied Constitution 0.205 0.221(.167) (.184)[.030] [.014]
Studied Congress -0.181 -0.318(.159) (.186)[-.022] [-.015]
Studied Presidency .220* 0.029(.106) (.141)[.031] [.001]
Studied How Laws are Made 0.04 0.202(.137) (.152)[.005] [.013]
Studied Political Parties 0.045 0.059(.111) (.142)[.006] [.003]
Studied State and Local Government 0.129 0.026(.107) (.138)[.017] [.001]
Latino -1.249*(.124)[-.176]
African-American 0.031(.168)[.001]
Asian -.889*(.168)[-.107]
Immigrant -.799*(.134)[-.086]
Female 0.101(.115)[.005]
In Student Government 0.058(.123)[.003]
Expecting to Complete a 4-year College Degree 0.21(.127)[.013]
Classroom climate:Students feel free to disagree openly with teachers 0.155
(.133)[.009]
Students are encouraged to make up own minds 0.017(.152)[.001]
Students express opinions in class even when different 0.066(.133)[.003]
Controls for Number of Books and Newspapers in Home yesControls for Group Participation yesControl for Feelings of Political Efficacy yesLog Pseudo-Likelihood -497.99 -321.86sample size: 1,953 1,953
Dependent Variable =1 if respondents speak English at home always or almost always"Controls for Group Participation" include youth, school paper, enivronmental, Model UN, student exchange, humanrights, volunteer, charity, Boy or Girl Scouts, ethnic, computer, art, sports, or religious groups.
Robust standard errors are in parentheses. Marginal effects are in brackets. * significant at the α=.05 level. All calculations used the "total weight" as provided in the survey data.
Table 9English Language Skills (IEA/CivEd)
Probit Models

153
(1) (2) (3) (4) (5) (6)Civic Education variables:
Studied Constitution 0.028 0.03 0.052 -0.002 0.078 0.027(.121) (.123) (.107) (.108) (.108) (.109)[.009] [.010] [.020] [-.001] [.030] [.010]
Studied Congress -0.052 -0.157 0.2 0.112 0.197 0.131(.123) (.127) (.111) (.111) (.113) (.118)[-.018] [-.053] [.078] [.043] [.077] [.051]
Studied Presidency .239* .214* .294* .239* 0.141 0.118(.088) (.089) (.084) (.085) (.086) (.087)[.078] [.069] [.115] [.093] [.054] [.045]
Studied How Laws are Made 0.014 0.043 0.077 0.072 -0.08 -0.083(.106) (.108) (.097) (.099) (.098) (.102)[.004] [.014] [.030] [.028] [-.030] [-.031]
Studied Political Parties .216* .213* -0.057 -0.114 0.075 0.032(.101) (.103) (.091) (.093) (.091) (.093)[.070] [.069] [-.022] [-.043] [.029] [.012]
Studied State and Local Government 0.013 -0.035 0.096 0.082 .261* .242*(.091) (.093) (.085) (.088) (.084) (.086)[.004] [-.011] [.037] [.032] [.101] [.094]
Latino -0.018 0.078 0.118(.106) (.100) (.102)[-.006] [.030] [.044]
African-American -0.025 -0.074 0.061(.105) (.099) (.097)[-.008] [-.028] [.023]
Asian -0.112 -0.13 0.126(.155) (.144) (.151)[-.036] [-.051] [.047]
Immigrant .251* 0.147 0.101(.112) (.110) (.114)[.088] [.056] [.038]
Female -0.121 0.013 0.065(.073) (.070) (.071)[-.040] [.005] [.025]
In Student Government -0.01 0.021 -0.007(.077) (.075) (.076)[-.003] [.008] [-.002]
Expecting to Complete a 4-year College Degree -0.101 0.089 -0.132(.079) (.076) (.074)[-.034] [.035] [-.050]
Classroom climate:Students feel free to disagree openly with teachers .277* .242* .421*
(.084) (.077) (.078)[.089] [.094] [.164]
Students are encouraged to make up own minds 0.184 .289* 0.071(.099) (.090) (.092)[.059] [.113] [.027]
Students express opinions in class even when different .234* 0.104 0.086(.089) (.081) (.083)[.075] [.040] [.033]
Controls for Number of Books and Newspapers in Home yes yes yesControls for Group Participation yes yes yesControl for Feelings of Political Efficacy yes yes yesLog Pseudo-Likelihood -1153.37 -1109.51 -1288.92 -1214.05 -1279.06 -1218.01sample size: 1,953 1,953 1,953 1,953 1,953 1,953
Dependent variable =1 if respondent answered "sometimes" or "often" to "How often do you have discussionsof what is happening in U.S. government with people your own age / your parents / your teachers?"
"Controls for Group Participation" include youth, school paper, enivronmental, Model UN, student exchange, humanrights, volunteer, charity, Boy or Girl Scouts, ethnic, computer, art, sports, or religious groups.
Robust standard errors are in parentheses. Marginal effects are in brackets. * significant at the α=.05 level. All calculations used the "total weight" as provided in the survey data.
Table 10Group Discussion Skills (IEA/CivEd)
Probit Models
People Own Age Parents Teachers

154
(1) (2) (3) (4) (5) (6) (7) (8) (9) (10)Civic Education 0.01 -0.023 -0.143 -0.107 0.139 0.062 0.043 0.016 0.056 -0.009
(.119) (.123) (.181) (.179) (.118) (.121) (.118) (.121) (.137) (.143)[.003] [-.007] [-.017] [-.010] [.051] [.022] [.015] [.005] [.013] [-.002]
Latino -0.13 -0.149 0.252 0.336 0.257 0.183 0.131 0.159 -0.458 -0.402(.183) (.200) (.238) (.244) (.174) (.185) (.177) (.185) (.237) (.268)[-.043] [-.048] [.034] [.038] [.098] [.069] [.047] [.057] [-.088] [-.073]
African-American 0.263 0.345 0.439 .605* 0.172 0.198 -0.009 -0.041 -0.359 -0.188(.164) (.179) (.220) (.237) (.162) (.179) (.167) (.181) (.213) (.217)[.093] [.123] [.064] [.079] [.065] [.074] [-.003] [-.014] [-.073] [-.038]
Asian 0.565 0.534 -- -- 0.446 0.202 -0.483 -0.513 0.417 0.404(.327) (.352) -- -- (.315) (.316) (.376) (.356) (.318) (.345)[.213] [.199] -- -- [.174] [.076] [-.149] [-.154] [.116] [.106]
Immigrant -.528* -0.36 0.116 0.205 0.376 0.121 0.044 0.009 0.099 0.212(.228) (.269) (.337) (.442) (.221) (.263) (.230) (.273) (.245) (.285)[-.154] [-.109] [.014] [.022] [.145] [.045] [.015] [.003] [.024] [.050]
Female -0.17 -0.151 -0.078 -0.041 -0.108 -0.103 0.207 0.168 -0.174 -0.102(.119) (.126) (.181) (.196) (.118) (.125) (.118) (.123) (.137) (.145)[-.057] [-.050] [-.009] [-.003] [-.040] [-.038] [.073] [.059] [-.040] [-.022]
In Student Government -0.232 -0.133 0.353 0.235 0.271(.213) (.286) (.203) (.196) (.219)[-.073] [-.011] [.135] [.086] [.065]
Very Religious -0.099 0.035 -0.029 0.205 -0.289(.175) (.290) (.180) (.174) (.206)[-.033] [.003] [-.010] [.072] [-.062]
Controls for Household Income yes yes yes yes yesControls for Political Views yes yes yes yes yesControls for Group Participation yes yes yes yes yesControls for Frequency of Voting / Intention to Vote yes yes yes yes yesControl for Feelings of Political Efficacy yes yes yes yes yesLog Pseudo-Likelihood -329.45 -316.6 -122.81 -112.41 -352.93 -333.81 -342.97 -331.44 -233.09 -218.28sample size: 555 555 532 532 555 555 555 555 555 555
Dependent variable =1 if respondent has read a newspaper 5, 6 or 7 days out of the past week.Dependent variable =1 if respondent has read a newsmagazine 5, 6 or 7 days out of the past week.Dependent variable =1 if respondent has watched the national news on television 5, 6 or 7 days out of the past week.Dependent variable =1 if respondent has listened to the news on the radio 5, 6 or 7 days out of the past week.Dependent variable =1 if respondent has read news on the internet 5, 6 or 7 days out of the past week."Controls for Group Participation" include youth, religious, enivronmental, political, civicor other groups.
Robust standard errors are in parentheses. Marginal effects are in brackets. * significant at the α=.05 level. All calculations used the "step weight" as provided in the survey data.Asians were dropped from the newsmagazine analysis due to their small sample size.
Listen to Radio Internet News
Table 11Monitoring the News (NGI)
Probit Models
Newspapers Newsmagazines Watch TV

155
(1) (2) (3) (4)Civic Education .227* 0.218 0.242 0.163
(.115) (.123) (.142) (.150)[.089] [.085] [.051] [.030]
Latino -0.182 -0.299 -0.178 -0.318(.177) (.192) (.218) (.233)[-.070] [-.114] [-.040] [-.067]
African-American -0.282 -0.334 -0.117 -0.218(.166) (.189) (.203) (.210)[-.108] [-.127] [-.026] [-.044]
Asian -0.291 -0.457 -0.015 -0.195(.325) (.324) (.403) (.485)[-.108] [-.166] [-.003] [-.040]
Immigrant -0.365 -0.149 -.179 -0.433(.235) (.275) (.265) (.344)[-.137] [-.057] [-.041] [-.099]
Female 0.048 -0.01 -0.001 0.098(.116) (.128) (.148) (.150)[.018] [-.003] [-.001] [.018]
In Student Government 0.158 -0.367(.193) (.251)[.062] [-.080]
Very Religious .362* 0.308(.177) (.204)[.141] [.057]
Controls for Household Income yes yesControls for Political Views yes yesControls for Group Participation yes yesControls for Frequency of Voting / Intention to Vote yes yesControl for Feelings of Political Efficacy yes yesLog Pseudo-Likelihood -372.46 -321.83 -216.2 -197.85sample size: 555 555 555 555
Dependent variable =1 if respondent has worked together informally, ever, with someone orsome group to solve a community problem.
Dependent variable =1 if respondent sometimes or very often talks about current events or newswith family or friends.
"Controls for Group Participation" include youth, religious, enivronmental, political, civicor other groups.
Robust standard errors are in parentheses. Marginal effects are in brackets. * significant at the α=.05 level. All calculations used the "step weight" as provided in the survey data.
Table 12Collective Decision-Making Skills (NGI)
Probit Models
Work Informally Group Discussion
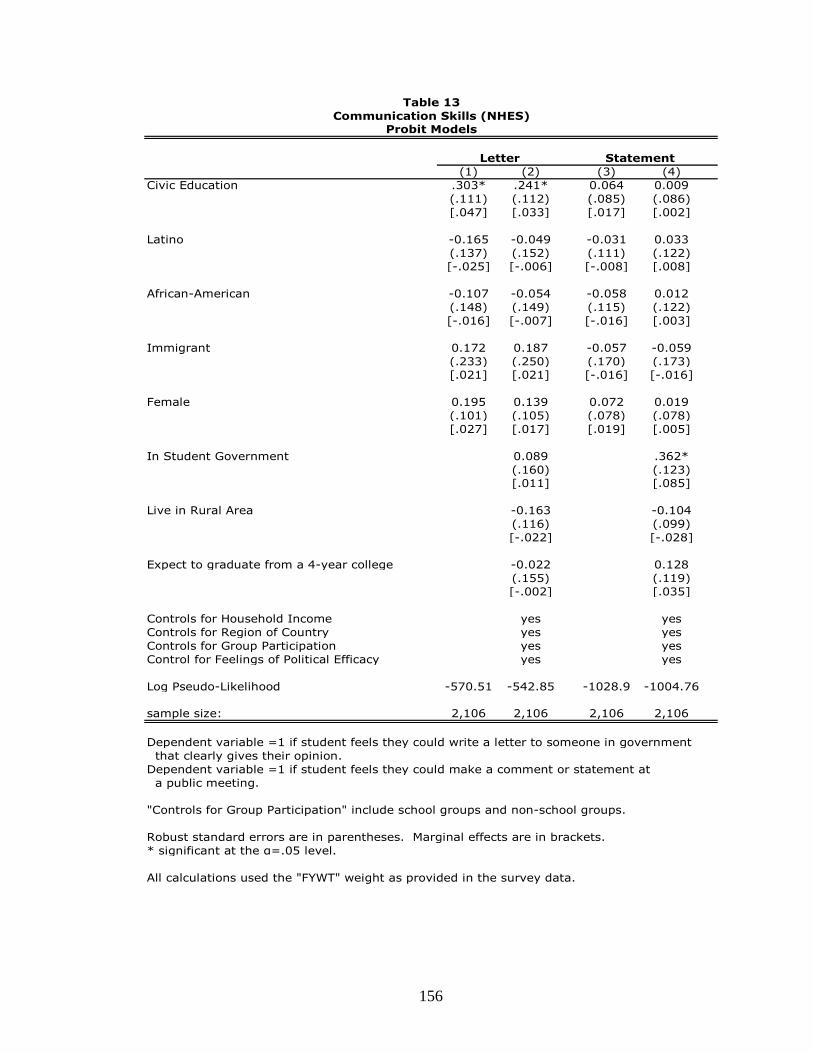
156
(1) (2) (3) (4)Civic Education .303* .241* 0.064 0.009
(.111) (.112) (.085) (.086)[.047] [.033] [.017] [.002]
Latino -0.165 -0.049 -0.031 0.033(.137) (.152) (.111) (.122)[-.025] [-.006] [-.008] [.008]
African-American -0.107 -0.054 -0.058 0.012(.148) (.149) (.115) (.122)[-.016] [-.007] [-.016] [.003]
Immigrant 0.172 0.187 -0.057 -0.059(.233) (.250) (.170) (.173)[.021] [.021] [-.016] [-.016]
Female 0.195 0.139 0.072 0.019(.101) (.105) (.078) (.078)[.027] [.017] [.019] [.005]
In Student Government 0.089 .362*(.160) (.123)[.011] [.085]
Live in Rural Area -0.163 -0.104(.116) (.099)[-.022] [-.028]
Expect to graduate from a 4-year college -0.022 0.128(.155) (.119)[-.002] [.035]
Controls for Household Income yes yesControls for Region of Country yes yesControls for Group Participation yes yesControl for Feelings of Political Efficacy yes yesLog Pseudo-Likelihood -570.51 -542.85 -1028.9 -1004.76sample size: 2,106 2,106 2,106 2,106
Dependent variable =1 if student feels they could write a letter to someone in governmentthat clearly gives their opinion.
Dependent variable =1 if student feels they could make a comment or statement ata public meeting.
"Controls for Group Participation" include school groups and non-school groups. Robust standard errors are in parentheses. Marginal effects are in brackets. * significant at the α=.05 level. All calculations used the "FYWT" weight as provided in the survey data.
Table 13Communication Skills (NHES)
Probit Models
Letter Statement

157
(1) (2) (3) (4)Civic Education .285* .229* .255* .231*
(.078) (.078) (.081) (.082)[.113] [.091] [.082] [.073]
Latino -0.104 0.01 -0.002 -0.006(.099) (.107) (.101) (.111)[-.045] [.004] [-.001] [-.002]
African-American -0.128 -0.031 -0.02 -0.038(.098) (.106) (.110) (.116)[-.051] [-.012] [-.006] [-.011]
Immigrant .499* .519* .546* .531*(.156) (.149) (.161) (.170)[.191] [.197] [.137] [.132]
Female -0.036 -0.093 -0.141 -.172*(.068) (.069) (.074) (.075)[-.014] [-.037] [-.043] [-.052]
In Student Government 0.008 0.005(.092) (.100)[.003] [.001]
Live in Rural Area -0.079 -.223*(.085) (.091)[-.031] [-.070]
Expect to graduate from a 4-year college .306* 0.13(.105) (.110)[.121] [.041]
Controls for Household Income yes yesControls for Region of Country yes yesControls for Group Participation yes yesControl for Feelings of Political Efficacy yes yesLog Pseudo-Likelihood -1440.07 -1375.1 -1143.76 -1121.69sample size: 2,106 2,106 2,106 2,106
Dependent variable =1 if student reads a newspaper or newsmagazine almostdaily or at least once a week.
Dependent variable =1 if student watches television news or listens to radio newsalmost daily or at least once a week.
"Controls for Group Participation" include school groups and non-school groups. Robust standard errors are in parentheses. Marginal effects are in brackets. * significant at the α=.05 level. All calculations used the "FYWT" weight as provided in the survey data.
Table 14Monitoring the News (NHES)
Probit Models
Read Watch/Listen

158
(1) (2)Civic Education 0.058 0.042
(.151) (.160)[.001] [.001]
Latino -1.248* -1.045*(.155) (.186)[-.116] [-.051]
African-American 0.255 0.396(.259) (.281)[.006] [.004]
Immigrant -1.573* -1.454*(.180) (.191)[-.213] [-.122]
Female -0.257 -0.314*(.143) (.156)[-.008] [-.005]
In Student Government -0.333(.202)[-.007]
Live in Rural Area 1.00*(.399)[.010]
Expect to graduate from a 4-year college 0.225(.235)[.004]
Controls for Household Income yesControls for Region of Country yesControls for Group Participation yesControl for Feelings of Political Efficacy yesLog Pseudo-Likelihood -214.75 -196.9sample size: 2,106 2,106
Dependent Variable =1 if student speaks English or English and another languageequally at home.
"Controls for Group Participation" include school groups and non-school groups. Robust standard errors are in parentheses. Marginal effects are in brackets. * significant at the α=.05 level. All calculations used the "FYWT" weight as provided in the survey data.
Table 15English Language Skills (NHES)
Probit Models

159
(1) (2) (3) (4)Civic Education 0.273 0.155 .334* 0.287
(.172) (.179) (.164) (.175)[.083] [.038] [.126] [.105]
Latino -0.309 -0.157 -0.3 -0.08(.174) (.200) (.162) (.194)[-.097] [-.039] [-.115] [-.028]
African-American 0.245 .521* 0.274 0.217(.166) (.199) (.152) (.180)[.064] [.098] [.095] [.073]
Immigrant -0.176 -.629* -0.049 0.327(.229) (.307) (.223) (.289)[-.053] [-.185] [-.018] [.106]
Female -0.091 0.025 -0.211 -0.235(.155) (.164) (.141) (.149)[-.026] [.006] [-.077] [-.082]
Some College .375* .481*(.185) (.161)[.089] [.169]
Private School Attendees 0.226 0.384(.373) (.256)[.048] [.123]
Controls for Household Income yes yesControls for Political Orientation yes yesControls for Group Participation yes yesControl for Feelings of Political Efficacy yes yesLog Pseudo-Likelihood -311.66 -260.85 -387.33 -338.72sample size: 614 614 614 614
Dependent variable =1 if respondent feels they could write a convincing letter to someone ingovernment that expresses their point of view.
Dependent variable =1 if respondent feels they speak well enough to make an effectivestatement at a public community meeting.
"Controls for Group Participation" include service clubs, religious, unions, business, political, youth, sports, health, or educational groups.
Robust standard errors are in parentheses. Marginal effects are in brackets. * significant at the α=.05 level. All calculations used the "wt2517" weight as provided in the survey data.
Table 16Communication Skills (ACPS)
Probit Models
Letter Statement

160
(1) (2) (3) (4) (5) (6)Civic Education 0.151 0.196 0.079 0.094 0.088 0.047
(.184) (.182) (.165) (.168) (.190) (.187)[.046] [.055] [.028] [.032] [.021] [.010]
Latino 0.001 -0.056 -0.047 0.022 0.083 0.277(.197) (.219) (.159) (.180) (.178) (.217)[.001] [-.015] [-.016] [.007] [.018] [.053]
African-American .545* .841* 0.159 0.301 .402* .578*(.183) (.227) (.148) (.175) (.194) (.220)[.133] [.162] [.058] [.111] [.079] [.097]
Immigrant 0.058 -0.2 -0.043 -0.292 -0.335 -0.241(.252) (.351) (.234) (.299) (.250) (.341)[.017] [-.058] [-.015] [-.095] [-.089] [-.058]
Female -0.001 -0.082 -0.164 -0.216 -0.077 -0.16(.153) (.169) (.138) (.139) (.166) (.164)[-.001] [-.022] [-.059] [-.076] [-.018] [-.035]
Some College 0.073 0.283 .421*(.163) (.156) (.191)[.019] [.099] [.093]
Private School Attendees -0.34 0.086 0.261(.252) (.234) (.266)[-.102] [.031] [.051]
Controls for Household Income yes yes yesControls for Political Orientation yes yes yesControls for Group Participation yes yes yesControl for Feelings of Political Efficacy yes yes yesLog Pseudo-Likelihood -322.1 -283.71 -384.62 -358.33 -260.49 -234.68sample size: 614 614 614 614 614 584
Dependent variable =1 if respondent watches television news once a week or more.Dependent variable =1 if respondent watches public affairs programming on television once a week or more.
Dependent variable =1 if respondent reads the newspaper once a week or more."Controls for Group Participation" include service clubs, religious, unions, business, political, youth, sports, health, or educational groups.
Robust standard errors are in parentheses. Marginal effects are in brackets. * significant at the α=.05 level. "Political club" membership perfectly predicted newspaper monitoring and was dropped from the analysis. All calculations used the "wt2517" weight as provided in the survey data.
Table 17Monitoring the News (ACPS)
Probit Models
Television News Public Affairs Newspaper

161
(1) (2) (3) (4)Civic Education .379* 0.253 .448* .343*
(.173) (.181) (.166) (.171)[.143] [.096] [.176] [.134]
Latino -.451* -0.338 -.363* -0.1(.154) (.181) (.161) (.176)[-.165] [-.125] [-.144] [-.039]
African-American -0.008 0.003 -0.177 -0.006(.148) (.184) (.147) (.181)[-.003] [.001] [-.069] [-.002]
Immigrant 0.056 -0.043 -0.015 0.048(.229) (.276) (.231) (.281)[.022] [-.016] [-.006] [.018]
Female -.351* -.322* -.579* -.593*(.137) (.147) (.137) (.145)[-.136] [-.125] [-.222] [-.225]
Some College .340* .523*(.153) (.153)[.131] [.200]
Private School Attendees 0.019 -0.135(.217) (.249)[.007] [-.053]
Controls for Household Income yes yesControls for Political Orientation yes yesControls for Group Participation yes yesControl for Feelings of Political Efficacy yes yesLog Pseudo-Likelihood -405.6 -360.96 -392.74 -352.91sample size: 614 614 614 614
Dependent variable =1 if respondent discusses local politics or affairs with others every day, nearly every day, or once or twice a week.
Dependent variable =1 if respondent discusses national politics or affairs with others every day, nearly every day, or once or twice a week.
"Controls for Group Participation" include service clubs, religious, unions, business, political, youth, sports, health, or educational groups.
Robust standard errors are in parentheses. Marginal effects are in brackets. * significant at the α=.05 level. All calculations used the "wt2517" weight as provided in the survey data.
Table 18Group Discussion Skills (ACPS)
Probit Models
Local National

162
(1) (2)Civic Education 0.372 0.439
(.277) (.277)[.006] [.001]
Latino -1.467* -1.666*(.251) (.343)[-.096] [-.035]
African-American -0.628 0.306(.427) (.430)[-.015] [.001]
Immigrant -2.143* -2.114*(.232) (.468)[-.245] [-.077]
Female 0.478* 0.48(.236) (.261)[.006] [.001]
Some College -0.376(.312)[-.001]
Private School Attendees -.601*(.285)[-.002]
Controls for Household Income yesControls for Political Orientation yesControls for Group Participation yesControl for Feelings of Political Efficacy yesLog Pseudo-Likelihood -47.64 -35.79sample size: 614 554
Dependent variable =1 if respondent speaks English at home. "Controls for Group Participation" include service clubs, religious, unions, business, political, youth, sports, health, or educational groups.
Robust standard errors are in parentheses. Marginal effects are in brackets. * significant at the α=.05 level. "Political Club" and "Service Club" membership perfectly predicted Englishlanguage skills and were dropped from the analysis.
All calculations used the "wt2517" weight as provided in the survey data.
Table 19English Language Skills (ACPS)
Probit Models

163
Probit Probit ProbitCoefficientc ATTd ATEe Coefficientf Coefficient ATT ATE Coefficient Coefficient ATT ATE Coefficient(Std. Error) (Std. Error)g (Std. Error) (Std. Error) (Std. Error) (Std. Error)
(1) (2) (3) (4) (5) (6) (7) (8) (9) (10) (11) (12)Civic Education variables:
Studied Constitution .267* 0.035 0.039 .295* .360* 0.024 0.039 .296* 0.139 0.021 0.031 0.159(.125) (.025)h (.133) (.022) (.107) (.029)[.055] [.050] [.071] [.043] [.045] [.046]
Studied Congress -0.251 0.022 0.029 0.12 0.004 0.037 0.042 0.13 0.008 0.007 0.014 0.008(.135) (.021) (.137) (.022)i (.112) (.031)[-.043] [.023] [.000] [.024] [.002] [.002]
Studied Presidency .247* 0.069 0.078 .443* 0.012 0.01 0.031 0.172 0.012 0.019 0.029 0.088(.103) (.023) (.106) (.019) (.089) (.026)[.048] [.089] [.002] [.025] [.003] [.027]
Studied How Laws are Made 0.124 0.052 0.046 0.074 -0.048 0.036 0.03 0.084 -0.041 0.01 0.01 -0.035(.120) (.026) (.128) (.024) (.099) (.031)[.024] [.017] [-.008] [.017] [-.013] [-.011]
Studied Political Parties -.257* 0.012 0.009 0.002 -0.146 -0.014 -0.005 -0.164 0.122 0.021 0.023 0.017(.118) (.024) (.125) (.021) (.090) (.030)[-.044] [.001] [-.023] [-.029] [.039] [.005]
Studied State and Local Government -0.01 0.011 0.017 0.013 -0.002 -0.001 0.005 -0.127 -0.124 -0.007 -0.005 -0.093(.102) (.022) (.106) (.020) (.083) (.027)[-.001] [.002] [-.001] [-.022] [-.038] [-.029]
a) Civic education variable is the treatment effect. Nearest-neighbor matching methods with replacement were employed. Individual matching analyses were conducted for each of the 6 treatment effects (civics education types).
b) Leaflet 1: Dependent variable =1 if student correctly interpreted which party issued the political leaflet.Leaflet 2: Dependent variable=1 if student correctly interpreted what leaflet issuers think about taxes.Leaflet 3: Dependent variable=1 if student correctly interpreted what policy the issuers of the leaflet favor.c) Coefficients, robust standard errors (in parentheses) and marginal effects (in brackets) from full probit models in Table 6.d) ATT= Average Treatment Effect on the Treated, interpreted as percentage points; "Treated" are those that report studying the above civic education topics.e) ATE= Average Treatment Effect.f) Coefficients are from matching-weighted probits. Marginal effects are in brackets.g) Bootstrapped standard errors are in parentheses.
Significance is based on the bias-corrected confidence intervals and the matching-weighted probit analyses. h) Significant in the matching-weighted probit but not the bias-corrected confidence interval. i) Significant in the bias-corrected confidence interval but not the matching-weighted probit. * significant at the α=.05 level. All calculations used the "total weight" as provided in the survey data, except the matching-weighted probits.
Leaflet 3
Table 20Political Interpretation Skills - Political Leaflets (IEA/CivEd)
Matching Methodsa
Leaflet 1 Leaflet 2

164
Probit ProbitCoefficientc ATTd ATEe Coefficientf Coefficient ATT ATE Coefficient(Std. Error) (Std. Error)g (Std. Error) (Std. Error)
(1) (2) (3) (4) (5) (6) (7) (8)Civic Education variables:
Studied Constitution .366* 0.038 0.05 .463* 0.092 0.026 0.029 0.133(.149) (.021)h (.121) (.031)[.059] [.051] [.026] [.037]
Studied Congress -0.291 0.033 0.042 .332* 0.097 0.035 0.04 .245*(.153) (.018)h (.125) (.027)h
[-.035] [.036] [.027] [.063]Studied Presidency .216* 0.043 0.057 .408* 0.158 0.057 0.07 .332*
(.110) (.018) (.093) (.025)[.031] [.051] [.044] [.090]
Studied How Laws are Made 0.105 0.063 0.063 .339* -0.032 0.054 0.036 0.035(.124) (.021) (.109) (.034)[.015] [.052] [-.008] [.011]
Studied Political Parties -0.026 0.045 0.048 0.162 -0.08 0.024 0.02 0.104(.124) (.022) (.104) (.027)[-.003] [.021] [-.021] [.029]
Studied State and Local Government 0.116 0.06 0.063 .382* -0.183 -0.01 -0.012 -0.134(.110) (.019) (.099) (.028)[.016] [.051] [-.048] [-.037]
a) Civic education variable is the treatment effect. Nearest-neighbor matching methods with replacement were employed. Individual matching analyses were conducted for each of the 6 treatment effects (civics education types).
b) Cartoon 1: Dependent variable =1 if student correctly interpreted a political cartoon about a political leader. Cartoon 2: Dependent variable =1 if student correctly interpreted a political cartoon about democracy. c) Coefficients, robust standard errors (in parentheses) and marginal effects (in brackets) from full probit models in Table 7.d) ATT= Average Treatment Effect on the Treated, interpreted as percentage points; "Treated" are those that report studying the above civic education topics.e) ATE= Average Treatment Effect.f) Coefficients are from matching-weighted probits. Marginal effects are in brackets.g) Bootstrapped standard errors are in parentheses.
Significance is based on the bias-corrected confidence intervals and the matching-weighted probit analyses. h) Significant in the matching-weighted probit but not the bias-corrected confidence interval. * significant at the α=.05 level. All calculations used the "total weight" as provided in the survey data, except the matching-weighted probits.
Table 21Political Interpretation Skills - Political Cartoons (IEA/CivEd)
Matching Methodsa
Cartoon 1 Cartoon 2b

165
Probit Coefficientc ATTd ATEe Coefficientf Probit Coefficient ATT ATE Coefficient(Standard Error) (Standard Error)g (Standard Error) (Standard Error)
(1) (2) (3) (4) (5) (6) (7) (8)Civic Education variables:
Studied Constitution -0.029 0.018 0.018 -0.038 0.104 0.018 0.019 0.04(.110) (.038) (.112) (.036)[-.011] [-.014] [.041] [.016]
Studied Congress 0.016 0.087 0.089 .174* -0.046 0.086 0.081 0.135(.114) (.035) (.116) (.035)i
[.006] [.067] [-.018] [.053]Studied Presidency 0.068 0.096 0.089 .271* 0.001 0.049 0.035 0.065
(.085) (.033) (.086) (.031)[.025] [.104] [.001] [.026]
Studied How Laws are Made 0.053 0.093 0.088 0.143 -0.063 0.046 0.046 0.091(.099) (.037)i (.100) (.038)[.020] [.055] [-.025] [.036]
Studied Political Parties 0.062 0.088 0.078 0.111 .209* 0.077 0.071 0.101(.094) (.031)i (.094) (.033)i
[.023] [.043] [.083] [.040]Studied State and Local Government 0.124 0.094 0.084 .201* 0.077 0.06 0.051 0.12
(.087) (.030) (.086) (.032)[.047] [.078] [.030] [.048]
a) Civic education variable is the treatment effect. Nearest-neighbor matching methods with replacement were employed. Individual matching analyses were conducted for each of the 6 treatment effects (civics education types).
b) Read Newspaper 1: Dependent variable =1 if respondent answered "sometimes" or "often" to "How often do you read articles in the newspaper about what is happening in this country?"Read Newspaper 2: Dependent variable =1 if respondent answered "sometimes" or "often" to "How often do you read articles in the newspaper about what is happening in other countries?"c) Coefficients, robust standard errors (in parentheses) and marginal effects (in brackets) from full probit models in Table 8.d) ATT= Average Treatment Effect on the Treated, interpreted as percentage points; "Treated" are those that report studying the above civic education topics.e) ATE= Average Treatment Effect.f) Coefficients are from matching-weighted probits. Marginal effects are in brackets.g) Bootstrapped standard errors are in parentheses.
Significance is based on the bias-corrected confidence intervals and the matching-weighted probit analyses. h) Significant in the matching-weighted probit but not the bias-corrected confidence interval. i) Significant in the bias-corrected confidence interval but not the matching-weighted probit. * significant at the α=.05 level. All calculations used the "total weight" as provided in the survey data, except the matching-weighted probits.
Table 22Monitoring the News (IEA/CivEd)
Matching Methodsa
Read Newspaper 2Read Newspaper 1b

166
Probit Coefficientc ATTd ATEe Coefficientf Probit Coefficient ATT ATE Coefficient(Standard Error) (Standard Error)g (Standard Error) (Standard Error)
(1) (2) (3) (4) (5) (6) (7) (8)Civic Education variables:
Studied Constitution .356* 0.108 0.098 .262* -0.087 0.072 0.065 .178*(.115) (.031) (.111) (.035)[.103] [.082] [-.034] [.067]
Studied Congress -0.22 0.057 0.061 .315* 0.026 0.129 0.11 .210*(.124) (.027) (.114) (.031)[-.055] [.082] [.010] [.077]
Studied Presidency 0.009 0.029 0.045 .232* .177* 0.072 0.066 .136*(.095) (.026)h (.086) (.033)[.002] [.059] [.069] [.052]
Studied How Laws are Made 0.023 0.035 0.046 .212* 0.1 0.114 0.117 .361*(.106) (.027)h (.099) (.037)[.006] [.054] [.039] [.138]
Studied Political Parties 0.087 0.054 0.053 0.101 0.183 0.108 0.098 .185*(.097) (.025) (.095) (.033)[.023] [.029] [.071] [.070]
Studied State and Local Government 0.117 0.085 0.084 .299* -0.028 0.102 0.09 .250*(.092) (.026) (.086) (.033)[.031] [.088] [-.011] [.095]
a) Civic education variable is the treatment effect. Nearest-neighbor matching methods with replacement were employed. Individual matching analyses were conducted for each of the 6 treatment effects (civics education types).
b) Watch: Dependent variable =1 if respondent answered "sometimes" or "often" to "How often do you watch news broadcasts on television?"Listen: Dependent variable =1 if respondent answered "sometimes" or "often" to "How often do you listen to news broadcasts on the radio?"c) Coefficients, robust standard errors (in parentheses) and marginal effects (in brackets) from full probit models in Table 8.d) ATT= Average Treatment Effect on the Treated, interpreted as percentage points; "Treated" are those that report studying the above civic education topics.e) ATE= Average Treatment Effect.f) Coefficients are from matching-weighted probits. Marginal effects are in brackets.g) Bootstrapped standard errors are in parentheses.
Significance is based on the bias-corrected confidence intervals and the matching-weighted probit analyses. h) Significant in the matching-weighted probit but not the bias-corrected confidence interval. * significant at the α=.05 level. All calculations used the "total weight" as provided in the survey data, except the matching-weighted probits.
Table 23Monitoring the News (IEA/CivEd)
Matching Methodsa
Watch TVb Listen to Radio

167
Probit Probit ProbitCoefficientc ATTd ATEe Coefficientf Coefficient ATT ATE Coefficient Coefficient ATT ATE Coefficient(Std. Error) (Std. Error)g (Std. Error) (Std. Error) (Std. Error) (Std. Error)
(1) (2) (3) (4) (5) (6) (7) (8) (9) (10) (11) (12)Civic Education variables:
Studied Constitution 0.03 0.02 0.02 0.002 -0.002 0.041 0.051 .213* 0.027 0.079 0.095 .414*(.123) (.030) (.108) (.034)h (.109) (.034)[.010] [.001] [-.001] [.082] [.010] [.156]
Studied Congress -0.157 0.057 0.05 0.066 0.112 0.108 0.108 .178* 0.131 0.095 0.084 .184*(.127) (.030)i (.111) (.035) (.118) (.037)[-.053] [.020] [.043] [.070] [.051] [.072]
Studied Presidency .214* 0.066 0.064 .150* .239* 0.122 0.115 .280* 0.118 0.075 0.087 .282*(.089) (.027) (.085) (.033) (.087) (.032)[.069] [.048] [.093] [.111] [.045] [.107]
Studied How Laws are Made 0.043 0.085 0.068 0.139 0.072 0.137 0.131 .389* -0.083 0.097 0.087 .244*(.108) (.032)i (.099) (.032) (.102) (.036)[.014] [.040] [.028] [.154] [-.031] [.095]
Studied Political Parties .213* 0.061 0.066 .225* -0.114 0.038 0.042 0.085 0.032 0.132 0.132 .397*(.103) (.030) (.093) (.033) (.093) (.032)[.069] [.073] [-.043] [.033] [.012] [.154]
Studied State and Local Government -0.035 0.026 0.037 .136* 0.082 0.091 0.082 .206* .242* 0.125 0.135 .413*(.093) (.027)h (.088) (.033) (.086) (.031)[-.011] [.046] [.032] [.081] [.094] [.158]
a) Civic education variable is the treatment effect. Nearest-neighbor matching methods with replacement were employed. Individual matching analyses were conducted for each of the 6 treatment effects (civics education types).
b) Student sometimes or often has discussions of what is happening in U.S. government withpeople their own age / their parents / their teachers
c) Coefficients, robust standard errors (in parentheses) and marginal effects (in brackets) from full probit models in Table 10.d) ATT= Average Treatment Effect on the Treated, interpreted as percentage points; "Treated" are those that report studying the above civic education topics.e) ATE= Average Treatment Effect.f) Coefficients are from matching-weighted probits. Marginal effects are in brackets.g) Bootstrapped standard errors are in parentheses.
Significance is based on the bias-corrected confidence intervals and the matching-weighted probit analyses. h) Significant in the matching-weighted probit but not the bias-corrected confidence interval. i) Significant in the bias-corrected confidence interval but not the matching-weighted probit. * significant at the α=.05 level. All calculations used the "total weight" as provided in the survey data, except the matching-weighted probits.
Teachers
Table 24Group Discussion Skills (IEA/CivEd)
Matching Methodsa
People Own Ageb Parents

168
ProbitCoefficientb ATTc ATEd Coefficiente
(Std. Error) (Std. Error)f
(1) (2) (3) (4)
Civic Education 0.218 0.058 0.065 0.166(.123) (.063)[.085] [.065]
Civic Education 0.163 0.075 0.058 .355*(.150) (.043)i
[.030] [.062]
Civic Education -0.023 -0.084 -0.046 -.264*(.123) (.061)[-.007] [-.094]
Civic Education -0.107 -0.001 0.011 0.114(.179) (.028)[-.010] [.008]
Civic Education 0.062 0.038 0.028 -0.064(.121) (.053)[.022] [-.023]
Civic Education 0.016 0.07 0.065 .532*(.121) (.055)i
[.005] [.181]
Civic Education -0.009 0.006 0.009 -0.06(.143) (.047)[-.002] [-.013]
a) Civic education variable is the treatment effect. Nearest-neighbor matching methods with replacement were employed.
b) Coefficients from full probit models in Tables 12 and 11.
c) ATT= Average Treatment Effect on the Treated, interpreted as percentage points; Treated are those that report studying civic education.
d) ATE= Average Treatment Effect.
e) Coefficients are from matching-weighted probits. Marginal effects are in brackets.
f) Bootstrapped standard errors are in parentheses.Significance is based on the bias-corrected confidence intervals and the matching-weighted probit analyses.
g) Worked together informally, ever, with someone or some group to solve a community problem. Sometimes or very often talks about current events or news with family or friends.
h) Newspapers: Read a newspaper 5, 6 or 7 days out of the past week.Newsmagazines: Read a newspaper 5, 6 or 7 days out of the past week.Watch: Watch the national news on television 5, 6 or 7 days out of the past week.Listen: Listen to the news on the radio 5, 6 or 7 days out of the past week.Internet: Read news on the internet 5, 6 or 7 days out of the past week.
i) Significant in the matching-weighted probit but not the bias-corrected confidence interval.
* significant at the α=.05 level. All calculations used the "step weight" as provided in the survey data,
except for the matching-weighted probits.
Listen to Radio
Internet News
Table 25Group Discussion and Monitoring the News (NGI)
Matching Methodsa
Newspapersh
Newsmagazines
Watch TV
Work Informallyg
Group Discussion

169
ProbitCoefficientb ATTc ATEd Coefficiente
(Std. Error) (Std. Error)f
(1) (2) (3) (4)
Civic Education .235* 0.104 0.106 .309*(.078) (.039)i
[.093] [.123]
Civic Education .236* 0.061 0.069 .342*(.082) (.032)i
[.074] [.102]
Civic Education 0.155 0.04 0.039 .453*(.179) (.020)i
[.038] [.050]
Civic Education 0.287 0.014 0.019 .171*(.175) (.025)i
[.105] [.041]
a) Civic education variable is the treatment effect. Nearest-neighbor matching methods with replacement were employed.
b) Coefficients from full probit models in Tables 14 and 16.
c) ATT= Average Treatment Effect on the Treated, interpreted as percentage points; Treated are those that report studying civic education.
d) ATE= Average Treatment Effect.
e) Coefficients are from matching-weighted probits. Marginal effects are in brackets.
f) Bootstrapped standard errors are in parentheses.Significance is based on the bias-corrected confidence intervals and the matching-weighted probit analyses.
g) Student reads a newspaper or newsmagazine almost daily or at least once a week. Student watches television news or listens to radio news almost daily or at least once a week. h) Student feels they could write a letter to someone in government that clearly gives their opinion. Student feels they could make a comment or statement at a public meeting. i) Significant in the matching-weighted probit but not the
bias-corrected confidence interval.
* significant at the α=.05 level. All calculations used the "FYWT" weight as provided in the survey data,
except for the matching-weighted probits.
Statement
Readg
Watch / Listen
Table 26Communication Skills and Monitoring the News (NHES)
Matching Methodsa
Letterh
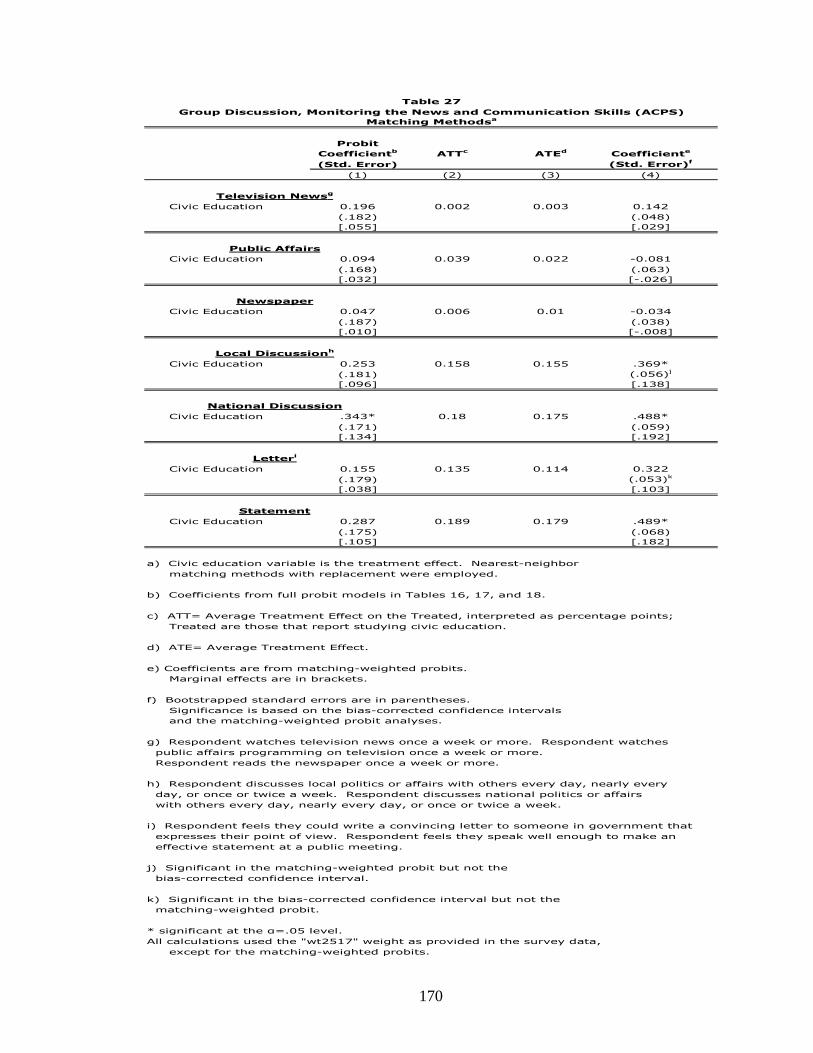
170
ProbitCoefficientb ATTc ATEd Coefficiente
(Std. Error) (Std. Error)f
(1) (2) (3) (4)
Civic Education 0.196 0.002 0.003 0.142(.182) (.048)[.055] [.029]
Civic Education 0.094 0.039 0.022 -0.081(.168) (.063)[.032] [-.026]
Civic Education 0.047 0.006 0.01 -0.034(.187) (.038)[.010] [-.008]
Civic Education 0.253 0.158 0.155 .369*(.181) (.056)j
[.096] [.138]
Civic Education .343* 0.18 0.175 .488*(.171) (.059)[.134] [.192]
Civic Education 0.155 0.135 0.114 0.322(.179) (.053)k
[.038] [.103]
Civic Education 0.287 0.189 0.179 .489*(.175) (.068)[.105] [.182]
a) Civic education variable is the treatment effect. Nearest-neighbor matching methods with replacement were employed.
b) Coefficients from full probit models in Tables 16, 17, and 18.
c) ATT= Average Treatment Effect on the Treated, interpreted as percentage points; Treated are those that report studying civic education.
d) ATE= Average Treatment Effect.
e) Coefficients are from matching-weighted probits. Marginal effects are in brackets.
f) Bootstrapped standard errors are in parentheses.Significance is based on the bias-corrected confidence intervals and the matching-weighted probit analyses.
g) Respondent watches television news once a week or more. Respondent watches public affairs programming on television once a week or more. Respondent reads the newspaper once a week or more.
h) Respondent discusses local politics or affairs with others every day, nearly every day, or once or twice a week. Respondent discusses national politics or affairs with others every day, nearly every day, or once or twice a week. i) Respondent feels they could write a convincing letter to someone in government that expresses their point of view. Respondent feels they speak well enough to make an effective statement at a public meeting. j) Significant in the matching-weighted probit but not the bias-corrected confidence interval.
k) Significant in the bias-corrected confidence interval but not the matching-weighted probit.
* significant at the α=.05 level. All calculations used the "wt2517" weight as provided in the survey data,
except for the matching-weighted probits.
Letteri
Statement
Table 27Group Discussion, Monitoring the News and Communication Skills (ACPS)
Matching Methodsa
Newspaper
Local Discussionh
National Discussion
Television Newsg
Public Affairs

171
(1) (2) (3) (4) (5) (6)African- All African- All African- All
Americans others Americans others Americans othersCivics Education variables:
Studied Constitution 0.46 .289* 0.471 .369* 0.162 0.178(.323) (.145) (.337) (.143) (.286) (.119)[.153] [.055] [.152] [.066] [.062] [.055]
Studied Congress 0.071 -.335* -0.06 0.075 -0.175 0.002(.313) (.162) (.338) (.160) (.289) (.128)[.022] [-.049] [-.017] [.011] [-.065] [.001]
Studied Presidency -0.092 .292* -0.199 -0.017 -.463* 0.084(.250) (.111) (.266) (.119) (.233) (.093)[-.028] [.053] [-.058] [-.002] [-.171] [.025]
Studied How Laws are Made -0.486 0.176 -0.112 -0.092 -0.259 -0.066(.300) (.129) (.291) (.136) (.256) (.111)[-.136] [.031] [-.032] [-.013] [-.096] [-.019]
Studied Political Parties -0.021 -.298* -0.538 -0.036 .735* 0.086(.262) (.125) (.279) (.123) (.244) (.102)[-.006] [-.046] [-.144] [-.005] [.283] [.025]
Studied State and Local Government 0.291 -0.055 0.288 -0.096 -0.07 -0.138(.266) (.115) (.275) (.118) (.242) (.094)[.093] [-.009] [.089] [-.014] [-.026] [-.040]
Female 0.299 0.132 .699* .244* -0.107 0.037(.210) (.095) (.216) (.099) (.182) (.077)[.092] [.022] [.207] [.037] [-.040] [.011]
In Student Government 0.017 .330* -.572* .319* -0.254 0.126(.229) (.110) (.239) (.115) (.202) (.083)[.005] [.051] [-.179] [.045] [-.097] [.036]
Expecting to Complete a 4-year College Degree .869* .496* .961* .312* .494* .369*(.222) (.093) (.232) (.097) (.199) (.081)[.280] [.096] [.301] [.052] [.188] [.116]
Classroom climate:Students feel free to disagree 0.178 0.038 0.318 .225* -0.011 0.125openly with teachers (.219) (.105) (.227) (.105) (.197) (.084)
[.056] [.006] [.097] [.036] [-.004] [.037]Students are encouraged to -0.087 .247* -0.022 0.092 0.064 0.029make up own minds (.249) (.120) (.256) (.123) (.218) (.103)
[-.026] [.046] [-.006] [.014] [.024] [.008]Students express opinions in class -0.083 0.085 0.384 0.07 .496* .246*even when different (.232) (.108) (.232) (.110) (.209) (.087)
[-.025] [.014] [.121] [.011] [.191] [.076]Log Likelihood -125.877 -543.334 -116.946 -503.436 -158.599 -854.386sample size: 283 1,670 283 1,670 283 1,670
Leaflet 1: Dependent variable =1 if student correctly interpreted which party issued the political leaflet.Leaflet 2: Dependent variable=1 if student correctly interpreted what leaflet issuers think about taxes.Leaflet 3: Dependent variable=1 if student correctly interpreted what policy the issuers of the leaflet favor.All models included controls for number of books and newspapers in the home, group participation, and feelings of political efficacy. Robust standard errors are in parentheses. Marginal effects are in brackets. * significant at the α=.05 level. All calculations used the "total weight" as provided in the survey data.
Table 28Political Interpretation Skills - Political Leaflets (IEA/CivEd)
Full Probit Models - African-Americans
Leaflet 1 Leaflet 2 Leaflet 3

172
(1) (2) (3) (4)African- All African- All
Americans others Americans othersCivics Education variables:
Studied Constitution .841* 0.261 0.33 0.008(.337) (.154) (.324) (.125)[.242] [.035] [.120] [.002]
Studied Congress -0.364 -0.288 -0.382 0.177(.348) (.175) (.306) (.134)[-.080] [-.030] [-.127] [.048]
Studied Presidency -0.06 .274* 0.419 0.168(.261) (.126) (.240) (.097)[-.014] [.035] [.148] [.045]
Studied How Laws are Made -0.589 0.194 0.144 -0.04(.304) (.141) (.263) (.115)[-.120] [.025] [.051] [-.010]
Studied Political Parties 0.212 -0.036 -0.22 -0.044(.273) (.134) (.256) (.106)[.052] [-.004] [-.074] [-.011]
Studied State and Local Government 0.234 0.106 0.364 -.280*(.273) (.128) (.252) (.099)[.058] [.012] [.131] [-.070]
Female 0.162 .262* -0.318 -0.008(.218) (.107) (.199) (.080)[.038] [.031] [-.110] [-.002]
In Student Government -0.283 .287* 0.327 0.099(.239) (.123) (.213) (.087)[-.070] [.031] [.111] [.025]
Expecting to Complete a 4-year College Degree 0.394 .287* 0.183 .391*(.233) (.107) (.213) (.083)[.097] [.037] [.064] [.110]
Classroom climate:Students feel free to disagree 0.252 0.008 -.779* 0.026openly with teachers (.232) (.116) (.213) (.089)
[.062] [.001] [-.252] [.006]Students are encouraged to -0.366 0.191 0.054 -0.073make up own minds (.265) (.133) (.236) (.111)
[-.078] [.025] [.019] [-.018]Students express opinions in class 0.473 .241* 0.412 0.09even when different (.246) (.114) (.225) (.093)
[.124] [.031] [.149] [.024]Log Likelihood -114.384 -416.737 -137.849 -768.985sample size: 283 1,670 283 1,670
Cartoon 1: Dependent variable =1 if student correctly interpreted a political cartoon about a political leader. Cartoon 2: Dependent variable =1 if student correctly interpreted a political cartoon about democracy. All models included controls for number of books and newspapers in the home, group participation, and feelings of political efficacy. Robust standard errors are in parentheses. Marginal effects are in brackets. * significant at the α=.05 level. All calculations used the "total weight" as provided in the survey data.
Table 29Political Interpretation Skills - Political Cartoons (IEA/CivEd)
Full Probit Models - African-Americans
Cartoon 1 Cartoon 2

173
(1) (2) (3) (4) (5) (6) (7) (8)African- All African- All African- All African- All
Americans others Americans others Americans others Americans othersCivics Education variables:
Studied Constitution -.741* 0.062 -0.456 0.179 0.223 .387* -0.154 -0.048(.302) (.113) (.300) (.111) (.317) (.123) (.288) (.114)[-.262] [.023] [-.180] [.071] [.059] [.112] [-.061] [-.019]
Studied Congress -0.124 0.028 -0.175 -0.057 -0.055 -0.231 0.227 -0.003(.300) (.119) (.290) (.117) (.336) (.135) (.284) (.120)[-.047] [.010] [-.069] [-.022] [-.013] [-.057] [.089] [-.001]
Studied Presidency 0.33 0.034 0.226 -0.031 -0.107 0.027 0.014 .185*(.236) (.087) (.225) (.087) (.253) (.098) (.215) (.086)[.128] [.013] [.088] [-.012] [-.026] [.007] [.005] [.072]
Studied How Laws are Made 0.252 0.027 0.07 -0.08 0.265 0.003 -0.13 0.124(.258) (.103) (.256) (.103) (.284) (.114) (.250) (.104)[.098] [.010] [.027] [-.031] [.071] [.001] [-.051] [.048]
Studied Political Parties 0.195 0.06 0.28 .215* 0.071 0.074 0.318 0.145(.247) (.093) (.242) (.092) (.271) (.104) (.236) (.093)[.076] [.022] [.108] [.085] [.018] [.019] [.124] [.056]
Studied State and Local Government 0.242 0.1 0.138 0.089 -0.198 0.15 -.578* 0.047(.239) (.085) (.237) (.084) (.265) (.096) (.235) (.085)[.094] [.037] [.054] [.035] [-.048] [.040] [-.227] [.018]
Female -0.233 -0.104 -0.264 -0.016 0.161 0.013 0.234 .207*(.189) (.072) (.183) (.070) (.204) (.081) (.181) (.070)[-.089] [-.038] [-.103] [-.006] [.040] [.003] [.092] [.081]
In Student Government 0.107 0.111 0.005 0.027 0.118 0.113 -0.08 0.001(.204) (.076) (.196) (.074) (.225) (.089) (.193) (.073)[.041] [.041] [.002] [.010] [.029] [.029] [-.031] [.001]
Expecting to Complete a 4-year College Degree -0.111 0.025 -0.133 -0.017 -0.087 0.053 0.242 0.013(.199) (.078) (.197) (.077) (.220) (.085) (.190) (.078)[-.042] [.009] [-.052] [-.007] [-.022] [.014] [.095] [.005]
Classroom climate:Students feel free to disagree .426* 0.044 0.184 0.038 0.12 .223* 0.02 .156*openly with teachers (.196) (.079) (.195) (.079) (.213) (.087) (.195) (.079)
[.165] [.016] [.072] [.015] [.030] [.061] [.007] [.060]Students are encouraged to 0.348 0.162 0.052 .325* 0.334 0.118 0.365 0.136make up own minds (.218) (.097) (.218) (.098) (.234) (.106) (.219) (.100)
[.136] [.061] [.020] [.129] [.091] [.032] [.141] [.053]Students express opinions in class .464* .260* .502* .229* 0.374 .241* 0.096 0.088even when different (.215) (.083) (.218) (.082) (.230) (.090) (.211) (.083)
[.181] [.098] [.191] [.091] [.102] [.066] [.038] [.034]Log Likelihood -152.638 -1020.41 -159.296 -1060.58 -126.91 -762.7 -168.86 -1064.94sample size: 283 1,670 283 1,670 283 1,670 283 1,670
a) Read Newspaper 1: Dependent variable =1 if respondent answered "sometimes" or "often" to "How often do you readarticles in the newspaper about what is happening in this country?"
Read Newspaper 2: Dependent variable =1 if respondent answered "sometimes" or "often" to "How often do you readarticles in the newspaper about what is happening in other countries?"
Watch: Dependent variable =1 if respondent answered "sometimes" or "often" to "How often do you watch news broadcasts on television?"
Listen: Dependent variable =1 if respondent answered "sometimes" or "often" to "How often do you listen to news broadcasts on the radio?"
All models included controls for number of books and newspapers in the home, group participation, and feelings of political efficacy. Robust standard errors are in parentheses. Marginal effects are in brackets. * significant at the α=.05 level. All calculations used the "total weight" as provided in the survey data.
Listen to Radio
Table 30Monitoring the News (IEA/CivEd)
Full Probit Models - African-Americans
Read Newspaper 1a Read Newspaper 2 Watch TV

174
(1) (2) (3) (4) (5) (6)African- All African- All African- All
Americans others Americans others Americans othersCivic Education variables:
Studied Constitution 0.104 0.066 -0.342 0.048 -0.033 0.067(.297) (.121) (.295) (.114) (.293) (.112)[.032] [.021] [-.134] [.018] [-.012] [.025]
Studied Congress -0.341 -0.146 0.189 0.12 0.525 0.079(.294) (.129) (.286) (.119) (.294) (.117)[-.114] [-.049] [.075] [.046] [.201] [.030]
Studied Presidency 0.011 .226* -0.095 .281* -0.439 .169*(.231) (.094) (.214) (.086) (.232) (.086)[.003] [.073] [-.037] [.109] [-.162] [.065]
Studied How Laws are Made -0.132 0.085 0.074 0.083 0.225 -0.137(.262) (.111) (.250) (.103) (.248) (.103)[-.043] [.027] [.029] [.032] [.086] [-.052]
Studied Political Parties 0.214 0.19 -0.309 -0.113 -0.155 0.05(.245) (.100) (.235) (.094) (.245) (.092)[.066] [.061] [-.122] [-.043] [-.057] [.019]
Studied State and Local Government 0.183 -0.033 -0.022 0.09 0.297 .249*(.249) (.090) (.231) (.085) (.238) (.084)[.057] [-.011] [-.008] [.035] [.113] [.097]
Female -.393* -0.083 0.198 -0.003 0.023 0.073(.187) (.074) (.177) (.072) (.186) (.071)[-.126] [-.027] [.079] [-.001] [.008] [.028]
In Student Government -0.103 -0.023 0.2 0.005 -0.391 0.03(.206) (.078) (.193) (.076) (.200) (.075)[-.033] [-.007] [.079] [.002] [-.149] [.011]
Expecting to Complete a 4-year College Degree -0.083 -0.095 0.028 0.101 0.127 -.175*(.202) (.082) (.192) (.077) (.196) (.079)[-.027] [-.032] [.011] [.039] [.048] [-.066]
Classroom climate:Students feel free to disagree openly with teachers 0.287 .300* 0.042 .274* 0.343 .424*
(.203) (.086) (.192) (.079) (.189) (.078)[.090] [.096] [.016] [.106] [.131] [.165]
Students are encouraged to make up own minds 0.115 0.202 0.246 .297* 0.021 0.082(.229) (.110) (.212) (.099) (.213) (.098)[.036] [.064] [.098] [.116] [.008] [.031]
Students express opinions in class even when different 0.168 .224* 0.35 0.069 -0.138 0.095(.226) (.090) (.209) (.083) (.210) (.082)[.052] [.072] [.139] [.026] [-.051] [.036]
Log Likelihood -150.219 -943.648 -169.598 -1023.09 -161.553 -1038.05sample size: 283 1,670 283 1,670 283 1,670
Dependent variable =1 if respondent answered "sometimes" or "often" to "How often do you have discussionsof what is happening in U.S. government with people your own age / your parents / your teachers?"
All models included controls for number of books and newspapers in the home, group participation, and feelings of political efficacy. Robust standard errors are in parentheses. Marginal effects are in brackets. * significant at the α=.05 level. All calculations used the "total weight" as provided in the survey data.
Table 31Group Discussion Skills (IEA/CivEd)
Full Probit Models - African-Americans
People Own Age Parents Teachers

175
(1) (2) (3) (4) (5) (6)All All All
Latinos others Latinos others Latinos othersCivics Education variables:
Studied Constitution .899* 0.135 .815* 0.252 0.021 0.216(.330) (.146) (.316) (.148) (.294) (.120)[.241] [.025] [.213] [.045] [.006] [.069]
Studied Congress -1.09* -0.067 0.086 0.061 -0.191 -0.014(.409) (.155) (.368) (.160) (.321) (.128)[-.176] [-.011] [.018] [.010] [-.058] [-.004]
Studied Presidency .526* 0.208 0.006 0.03 0.124 -0.005(.264) (.109) (.286) (.116) (.234) (.093)[.119] [.038] [.001] [.005] [.039] [-.001]
Studied How Laws are Made 0.12 0.116 -0.522 0.003 -0.091 -0.061(.336) (.125) (.350) (.130) (.293) (.109)[.026] [.021] [-.090] [.001] [-.028] [-.018]
Studied Political Parties 0.166 -.344* 0.153 -0.198 0.315 0.133(.290) (.124) (.283) (.123) (.247) (.101)[.036] [-.055] [.033] [-.030] [.103] [.042]
Studied State and Local Government -0.314 0.031 0.022 -0.012 -0.084 -0.167(.260) (.115) (.265) (.118) (.236) (.095)[-.064] [.005] [.004] [-.002] [-.026] [-.050]
Female 0.204 0.151 0.27 .269* -0.022 0.026(.231) (.092) (.238) (.096) (.198) (.076)[.043] [.026] [.057] [.043] [-.007] [.008]
In Student Government 0.444 .282* 0.598 0.129 0.124 0.091(.318) (.104) (.348) (.105) (.248) (.080)[.084] [.047] [.109] [.020] [.038] [.027]
Expecting to Complete a 4-year College Degree .567* .502* .644* .357* .504* .358*(.224) (.092) (.231) (.095) (.195) (.080)[.128] [.102] [.145] [.064] [.162] [.116]
Classroom climate:Students feel free to disagree 0.048 0.095 0.055 .231* 0.263 0.069openly with teachers (.250) (.102) (.250) (.102) (.216) (.083)
[.010] [.017] [.011] [.040] [.084] [.021]Students are encouraged to 0.438 0.158 0.276 0.06 -0.04 0.062make up own minds (.280) (.118) (.280) (.121) (.239) (.101)
[.106] [.030] [.063] [.010] [-.012] [.019]Students express opinions in class -0.065 0.084 -0.046 0.16 .485* .263*even when different (.273) (.104) (.271) (.105) (.242) (.085)
[-.013] [.015] [-.009] [.027] [.163] [.084]Log Likelihood -104.942 -563.362 -100.529 -525.342 -135.825 -876.896sample size: 273 1,679 273 1,679 273 1,679
Leaflet 1: Dependent variable =1 if student correctly interpreted which party issued the political leaflet.Leaflet 2: Dependent variable=1 if student correctly interpreted what leaflet issuers think about taxes.Leaflet 3: Dependent variable=1 if student correctly interpreted what policy the issuers of the leaflet favor.All models included controls for number of books and newspapers in the home, group participation, and feelings of political efficacy. Robust standard errors are in parentheses. Marginal effects are in brackets. * significant at the α=.05 level. All calculations used the "total weight" as provided in the survey data.
Table 32Political Interpretation Skills - Political Leaflets (IEA/CivEd)
Full Probit Models - Latinos
Leaflet 1 Leaflet 2 Leaflet 3

176
(1) (2) (3) (4)All All
Latinos others Latinos othersCivics Education variables:
Studied Constitution 1.23* 0.225 0.124 0.028(.380) (.153) (.327) (.124)[.198] [.033] [.035] [.007]
Studied Congress -0.67 -0.236 -0.743 0.251(.462) (.168) (.381) (.131)[-.048] [-.028] [-.175] [.072]
Studied Presidency 0.04 0.223 0.415 0.126(.371) (.121) (.259) (.096)[.003] [.031] [.119] [.035]
Studied How Laws are Made 0.153 0.106 0.089 -0.055(.395) (.136) (.324) (.112)[.015] [.014] [.025] [-.014]
Studied Political Parties 0.252 -0.094 -0.276 -0.088(.347) (.129) (.286) (.104)[.025] [-.012] [-.072] [-.023]
Studied State and Local Government 0.046 0.174 -.538* -0.138(.336) (.122) (.255) (.097)[.004] [.024] [-.141] [-.036]
Female 0.593 0.194 0.011 -0.034(.319) (.101) (.217) (.079)[.056] [.025] [.003] [-.009]
In Student Government -0.124 .254* 0.051 0.138(.376) (.114) (.284) (.085)[-.012] [.031] [.014] [.036]
Expecting to Complete a 4-year College Degree 0.002 .327* .739* .328*(.284) (.102) (.224) (.082)[.001] [.048] [.215] [.094]
Classroom climate:Students feel free to disagree 0.099 0.029 0.091 -0.081openly with teachers (.321) (.111) (.243) (.088)
[.009] [.003] [.025] [-.021]Students are encouraged to 0.188 0.115 0.027 -0.042make up own minds (.340) (.128) (.275) (.109)
[.019] [.016] [.007] [-.011]Students express opinions in class .769* .245* 0.324 0.126even when different (.329) (.109) (.276) (.090)
[.100] [.035] [.096] [.035]Log Likelihood -65.633 -453.374 -113.688 -791.668sample size: 273 1,679 273 1,679
Cartoon 1: Dependent variable =1 if student correctly interpreted a political cartoon about a political leader. Cartoon 2: Dependent variable =1 if student correctly interpreted a political cartoon about democracy. All models included controls for number of books and newspapers in the home, group participation, and
feelings of political efficacy. Robust standard errors are in parentheses. Marginal effects are in brackets. * significant at the α=.05 level. All calculations used the "total weight" as provided in the survey data.
Table 33Political Interpretation Skills - Political Cartoons (IEA/CivEd)
Full Probit Models - Latinos
Cartoon 1 Cartoon 2

177
(1) (2) (3) (4) (5) (6) (7) (8)All All All All
Latinos others Latinos others Latinos others Latinos othersCivics Education variables:
Studied Constitution -0.043 -0.008 0.248 0.062 0.327 .339* -0.025 -0.086(.283) (.114) (.271) (.112) (.312) (.124) (.287) (.114)[-.016] [-.003] [.099] [.025] [.087] [.097] [-.009] [-.034]
Studied Congress -.712* 0.063 -.796* 0.048 -0.628 -0.188 -0.459 0.056(.311) (.119) (.304) (.117) (.347) (.135) (.318) (.119)[-.257] [.023] [-.297] [.019] [-.133] [-.046] [-.176] [.022]
Studied Presidency 0.166 0.055 0.075 -0.02 -0.147 0.021 .506* 0.164(.220) (.088) (.217) (.087) (.271) (.098) (.225) (.086)[.064] [.020] [.030] [-.008] [-.035] [.005] [.184] [.064]
Studied How Laws are Made 0.536 0.013 0.278 -0.094 0.565 -0.013 0.317 0.092(.281) (.101) (.279) (.101) (.303) (.113) (.292) (.101)[.211] [.005] [.110] [-.037] [.163] [-.003] [.114] [.036]
Studied Political Parties 0.015 0.053 -0.193 .259* 0.177 0.075 0.128 .193*(.232) (.093) (.230) (.092) (.261) (.104) (.239) (.093)[.005] [.019] [-.076] [.103] [.045] [.019] [.047] [.075]
Studied State and Local Government 0.265 0.107 .463* 0.023 0.274 0.098 0.409 -0.094(.223) (.086) (.217) (.085) (.251) (.097) (.229) (.085)[.103] [.040] [.182] [.009] [.069] [.026] [.150] [-.037]
Female 0.218 -0.136 0.142 -0.058 0.049 0.035 0.04 .208*(.189) (.072) (.184) (.070) (.222) (.081) (.188) (.069)[.084] [-.050] [.056] [-.023] [.012] [.009] [.015] [.082]
In Student Government -0.344 0.134 -0.126 0.037 -0.155 0.122 0.295 -0.033(.232) (.075) (.226) (.073) (.274) (.086) (.225) (.072)[-.134] [.049] [-.050] [.014] [-.039] [.031] [.112] [-.013]
Expecting to Complete a 4-year College Degree -0.005 0.013 0.104 -0.045 -0.222 0.073 0.057 0.053(.189) (.078) (.187) (.077) (.219) (.085) (.196) (.077)[-.002] [.004] [.041] [-.018] [-.053] [.019] [.021] [.021]
Classroom climate:Students feel free to disagree 0.146 0.092 0.126 0.062 0.127 .233* 0.335 0.124openly with teachers (.206) (.079) (.203) (.078) (.234) (.086) (.213) (.078)
[.056] [.034] [.050] [.024] [.031] [.063] [.123] [.049]Students are encouraged to 0.346 0.151 .454* .249* 0.149 0.159 0.014 .207*make up own minds (.232) (.097) (.231) (.097) (.262) (.104) (.244) (.098)
[.136] [.057] [.179] [.099] [.038] [.043] [.005] [.080]Students express opinions in class 0.331 .248* 0.179 .281* .594* .225* 0.155 0.089even when different (.231) (.081) (.231) (.081) (.259) (.088) (.246) (.081)
[.130] [.094] [.071] [.111] [.167] [.061] [.057] [.035]Log Likelihood -157.831 -1020.12 -162.881 -1061.08 -116.277 -765.86 -151.906 -1080.22sample size: 273 1,679 273 1,679 273 1,679 273 1,679
a) Read Newspaper 1: Dependent variable =1 if respondent answered "sometimes" or "often" to "How often do you readarticles in the newspaper about what is happening in this country?"
Read Newspaper 2: Dependent variable =1 if respondent answered "sometimes" or "often" to "How often do you readarticles in the newspaper about what is happening in other countries?"
Watch: Dependent variable =1 if respondent answered "sometimes" or "often" to "How often do you watch news broadcasts on television?"
Listen: Dependent variable =1 if respondent answered "sometimes" or "often" to "How often do you listen to news broadcasts on the radio?"
All models included controls for number of books and newspapers in the home, group participation, and feelings of political efficacy. Robust standard errors are in parentheses. Marginal effects are in brackets. * significant at the α=.05 level. All calculations used the "total weight" as provided in the survey data.
Listen to Radio
Table 34Monitoring the News (IEA/CivEd)
Full Probit Models - Latinos
Read Newspaper 1a Read Newspaper 2 Watch TV

178
(1) (2) (3) (4) (5) (6)All All All
Latinos others Latinos others Latinos othersCivic Education variables:
Studied Constitution 0.521 -0.031 0.473 -0.081 0.044 0.027(.310) (.122) (.272) (.115) (.283) (.113)[.142] [-.010] [.187] [-.031] [.016] [.010]
Studied Congress -0.512 -0.133 -0.156 0.136 -0.146 0.158(.343) (.128) (.304) (.119) (.308) (.117)[-.169] [-.045] [-.060] [.053] [-.054] [.061]
Studied Presidency 0.296 .198* 0.123 .246* 0.116 0.087(.239) (.093) (.218) (.086) (.225) (.087)[.088] [.064] [.048] [.096] [.044] [.033]
Studied How Laws are Made .775* -0.012 0.423 0.05 0.225 -0.102(.342) (.109) (.281) (.101) (.273) (.101)[.192] [-.004] [.167] [.019] [.086] [-.038]
Studied Political Parties -0.36 .295* -0.042 -0.143 0.318 0.008(.262) (.100) (.233) (.094) (.235) (.093)[-.116] [.094] [-.016] [-.054] [.121] [.003]
Studied State and Local Government 0.202 -0.064 0.09 0.104 0.428 .259*(.244) (.090) (.225) (.085) (.225) (.085)[.061] [-.021] [.035] [.040] [.162] [.100]
Female -0.25 -0.106 0.088 -0.009 0.073 0.057(.202) (.073) (.189) (.071) (.195) (.070)[-.076] [-.035] [.034] [-.003] [.027] [.022]
In Student Government -0.135 0.002 0.255 0.005 0.346 -0.033(.245) (.076) (.234) (.073) (.242) (.073)[-.040] [.001] [.098] [.002] [.125] [-.012]
Expecting to Complete a 4-year College Degree -0.014 -0.103 0.029 0.089 -0.219 -0.124(.207) (.082) (.190) (.077) (.196) (.078)[-.004] [-.034] [.011] [.034] [-.081] [-.047]
Classroom climate:Students feel free to disagree openly with teachers 0.302 .275* 0.139 .255* 0.272 .437*
(.235) (.085) (.210) (.078) (.212) (.077)[.089] [.088] [.054] [.099] [.103] [.170]
Students are encouraged to make up own minds 0.359 0.196 .667* .251* 0.025 0.1(.265) (.109) (.240) (.097) (.243) (.097)[.101] [.062] [.261] [.098] [.009] [.039]
Students express opinions in class even when different 0.269 .245* 0.238 0.116 .479* 0.048(.267) (.089) (.238) (.081) (.240) (.081)[.078] [.078] [.094] [.045 [.184] [.018]
Log Likelihood -131.575 -953.115 -152.447 -1042.19 -144.109 -1050.82sample size: 273 1,679 273 1,679 273 1,679
Dependent variable =1 if respondent answered "sometimes" or "often" to "How often do you have discussionsof what is happening in U.S. government with people your own age / your parents / your teachers?"
All models included controls for number of books and newspapers in the home, group participation, and feelings of political efficacy. Robust standard errors are in parentheses. Marginal effects are in brackets. * significant at the α=.05 level. All calculations used the "total weight" as provided in the survey data.
Table 35Group Discussion Skills (IEA/CivEd)
Full Probit Models - Latinos
People Own Age Parents Teachers

179
(1) (2) (3) (4) (5) (6)Females Males Females Males Females Males
Civics Education variables:Studied Constitution 0.245 0.304 .453* 0.272 -0.042 .418*
(.194) (.178) (.197) (.178) (.155) (.163)[.041] [.071] [.073] [.062] [-.012] [.141]
Studied Congress -0.349 -0.185 -0.094 0.109 0.102 -0.17(.208) (.200) (.215) (.199) (.158) (.179)[-.046] [-.037] [-.011] [.023] [.030] [-.052]
Studied Presidency .279* 0.262 -0.069 0.099 0.102 -0.077(.140) (.145) (.156) (.149) (.115) (.131)[.045] [.059] [-.008] [.021] [.030] [-.024]
Studied How Laws are Made 0.222 -0.01 -0.001 -0.135 -0.019 -0.144(.166) (.167) (.178) (.169) (.141) (.150)[.037] [-.002] [-.001] [-.027] [-.005] [-.044]
Studied Political Parties -0.377 -0.161 -0.207 -0.115 0.095 0.234(.171) (.151) (.174) (.150) (.130) (.136)[-.050] [-.033] [-.024] [-.023] [.028] [.076]
Studied State and Local Government -0.045 -0.037 -0.122 0.043 -0.198 -0.106(.155) (.144) (.164) (.143) (.122) (.129)[-.006] [-.008] [-.015] [.009] [-.056] [-.033]
In Student Government 0.202 .390* 0.086 0.282 -0.03 .236*(.134) (.146) (.140) (.147) (.102) (.117)[.029] [.076] [.010] [.055] [-.008] [.072]
Expecting to Complete a 4-year College Degree .556* .552* .373* .463* .359* .407*(.129) (.113) (.137) (.115) (.109) (.103)[.102] [.131] [.055] [.106] [.113] [.134]
Classroom climate:Students feel free to disagree 0.207 0.046 0.125 .375* 0.097 0.097openly with teachers (.142) (.126) (.150) (.123) (.113) (.108)
[.033] [.010] [.016] [.084] [.029] [.031]Students are encouraged to 0.079 .276* 0.216 0.007 .311* -0.119make up own minds (.180) (.137) (.186) (.140) (.143) (.126)
[.012] [.064] [.031] [.001] [.100] [-.036]Students express opinions in class 0.008 0.064 0.058 0.146 .236* .336*even when different (.148) (.129) (.154) (.128) (.118) (.110)
[.001] [.014] [.007] [.031] [.073] [.111]Log Likelihood -303.212 -365.564 -267.893 -355.14 -503.3 -499.62sample size: 999 954 999 954 999 954
Leaflet 1: Dependent variable =1 if student correctly interpreted which party issued the political leaflet.Leaflet 2: Dependent variable=1 if student correctly interpreted what leaflet issuers think about taxes.Leaflet 3: Dependent variable=1 if student correctly interpreted what policy the issuers of the leaflet favor.All models included controls for number of books and newspapers in the home, group participation, and feelings
of political efficacy. Robust standard errors are in parentheses. Marginal effects are in brackets. * significant at the α=.05 level. All calculations used the "total weight" as provided in the survey data.
Table 36Political Interpretation Skills - Political Leaflets (IEA/CivEd)
Full Probit Models - Females
Leaflet 1 Leaflet 2 Leaflet 3

180
(1) (2) (3) (4)Females Males Females Males
Civics Education variables:Studied Constitution 0.229 .415* 0.263 -0.066
(.214) (.183) (.163) (.164)[.024] [.084] [.073] [-.018]
Studied Congress -0.339 -0.213 0.043 0.136(.234) (.209) (.172) (.179)[-.027] [-.034] [.011] [.039]
Studied Presidency 0.246 0.203 0.082 0.233(.166) (.156) (.123) (.131)[.025] [.037] [.021] [.068]
Studied How Laws are Made 0.163 0.077 0.062 -0.103(.189) (.175) (.147) (.151)[.016] [.014] [.016] [-.028]
Studied Political Parties 0.03 -0.099 -0.164 -0.058(.185) (.159) (.139) (.139)[.002] [-.016] [-.040] [-.016]
Studied State and Local Government -0.062 0.232 -0.233 -0.1(.179) (.152) (.129) (.130)[-.005] [.042] [-.057] [-.028]
In Student Government .327* 0.105 0.173 0.053(.163) (.145) (.110) (.119)[.028] [.017] [.043] [.015]
Expecting to Complete a 4-year College Degree .380* 0.267 .430* .373*(.150) (.125) (.111) (.105)[.042] [.049] [.121] [.111]
Classroom climate:Students feel free to disagree -0.075 0.093 -0.182 0.039openly with teachers (.165) (.131) (.124) (.111)
[-.006] [.016] [-.044] [.011]Students are encouraged to .425* -0.009 -0.17 0.066make up own minds (.193) (.149) (.168) (.128)
[.052] [-.001] [-.041] [.019]Students express opinions in class .450* 0.192 0.174 0.145even when different (.157) (.133) (.128) (.114)
[.053] [.035] [.046] [.042]Log Likelihood -212.287 -318.155 -444.61 -467.03sample size: 999 954 999 954
Cartoon 1: Dependent variable =1 if student correctly interpreted a political cartoon about a political leader. Cartoon 2: Dependent variable =1 if student correctly interpreted a political cartoon about democracy. All models included controls for number of books and newspapers in the home, group participation,
and feelings of political efficacy. Robust standard errors are in parentheses. Marginal effects are in brackets. * significant at the α=.05 level. All calculations used the "total weight" as provided in the survey data.
Table 37Political Interpretation Skills - Political Cartoons (IEA/CivEd)
Full Probit Models - Females
Cartoon 1 Cartoon 2

181
(1) (2) (3) (4) (5) (6) (7) (8)Females Males Females Males Females Males Females Males
Civics Education variables:Studied Constitution -0.138 0.056 0.107 0.084 .427* 0.31 0.104 -.335*
(.146) (.153) (.141) (.153) (.163) (.162) (.142) (.162)[-.050] [.021] [.042] [.033] [.117] [.093] [.041] [-.129]
Studied Congress -0.011 0.033 0.002 -0.103 -.448* 0.003 -0.037 0.14(.147) (.166) (.144) (.166) (.175) (.180) (.145) (.176)[-.004] [.012] [.001] [-.041] [-.093] [.001] [-.015] [.052]
Studied Presidency 0.077 0.058 0.07 -0.052 0.029 0.012 .296* 0.009(.108) (.123) (.107) (.122) (.123) (.136) (.105) (.125)[.028] [.022] [.027] [-.021] [.007] [.003] [.117] [.003]
Studied How Laws are Made 0.069 -0.012 -0.145 -0.011 0.096 -0.069 0.134 0.071(.130) (.139) (.131) (.139) (.148) (.153) (.128) (.146)[.026] [-.004] [-.056] [-.004] [.023] [-.019] [.053] [.026]
Studied Political Parties -0.044 0.228 0.091 .380* 0.048 0.182 0.062 .415*(.118) (.127) (.116) (.126) (.136) (.139) (.116) (.133)[-.016] [.087] [.036] [.150] [.011] [.053] [.025] [.150]
Studied State and Local Government 0.145 0.089 0.127 0.006 0.216 -0.035 -0.065 0.068(.109) (.118) (.107) (.118) (.125) (.130) (.107) (.122)[.054] [.033] [.050] [.002] [.054] [-.010] [-.025] [.025]
In Student Government -0.009 .232* -0.125 .212* -0.036 .297* -0.048 0.033(.094) (.109) (.093) (.105) (.110) (.126) (.091) (.106)[-.003] [.085] [-.049] [.084] [-.008] [.079] [-.019] [.012]
Expecting to Complete a 4-year College Degree 0.028 0.005 -0.138 0.073 0.006 0.043 0.05 0.07(.104) (.100) (.103) (.099) (.119) (.107) (.103) (.102)[.010] [.002] [-.054] [.029] [.001] [.012] [.019] [.026]
Classroom climate:Students feel free to disagree 0.081 0.131 0.057 0.077 .307* 0.173 0.117 0.152openly with teachers (.107) (.101) (.106) (.100) (.119) (.111) (.105) (.103)
[.030] [.049] [.022] [.030] [.078] [.049] [.046] [.057]Students are encouraged to 0.062 0.211 0.253 .306* -0.09 .250* 0.198 0.183make up own minds (.138) (.118) (.138) (.119) (.158) (.125) (.138) (.124)
[.023] [.081] [.100] [.121] [-.020] [.074] [.078] [.067]Students express opinions in class 0.207 .235* .245* .249* .256* 0.197 0.02 0.117even when different (.113) (.104) (.113) (.105) (.123) (.113) (.112) (.108)
[.078] [.090] [.097] [.099] [.066] [.057] [.008] [.044]Log Likelihood -607.723 -569.596 -632.58 -591.202 -427.523 -456.127 -649.492 -575.616sample size: 999 954 999 954 999 954 999 954
a) Read Newspaper 1: Dependent variable =1 if respondent answered "sometimes" or "often" to "How often do you readarticles in the newspaper about what is happening in this country?"
Read Newspaper 2: Dependent variable =1 if respondent answered "sometimes" or "often" to "How often do you readarticles in the newspaper about what is happening in other countries?"
Watch: Dependent variable =1 if respondent answered "sometimes" or "often" to "How often do you watch news broadcasts on television?"
Listen: Dependent variable =1 if respondent answered "sometimes" or "often" to "How often do you listen to news broadcasts on the radio?"
All models included controls for number of books and newspapers in the home, group participation, and feelings of political efficacy. Robust standard errors are in parentheses. Marginal effects are in brackets. * significant at the α=.05 level. All calculations used the "total weight" as provided in the survey data.
Listen to Radio
Table 38Monitoring the News (IEA/CivEd)
Full Probit Models - Females
Read Newspaper 1a Read Newspaper 2 Watch TV

182
(1) (2) (3) (4) (5) (6)Females Males Females Males Females Males
Civic Education variables:Studied Constitution 0.124 -0.077 0.057 -0.142 0.075 -0.034
(.157) (.164) (.145) (.158) (.144) (.153)[.039] [-.026] [.022] [-.055] [.028] [-.013]
Studied Congress -0.078 -0.24 -0.006 .343* 0.173 0.082(.161) (.179) (.146) (.169) (.145) (.165)[-.026] [-.082] [-.002] [.135] [.066] [.032]
Studied Presidency 0.211 0.186 .244* 0.214 0.095 0.138(.116) (.132) (.106) (.122) (.108) (.120)[.067] [.060] [.093] [.084] [.036] [.054]
Studied How Laws are Made 0.184 -0.131 0.005 0.189 -0.149 -0.037(.144) (.149) (.129) (.140) (.131) (.138)[.058] [-.044] [.002] [.075] [-.054] [-.014]
Studied Political Parties 0.074 .485* -0.106 -0.121 0.043 0.043(.125) (.140) (.118) (.130) (.119) (.125)[.024] [.150] [-.039] [-.047] [.016] [.017]
Studied State and Local Government -0.131 0.064 .218* -0.151 0.212 .294*(.113) (.128) (.108) (.120) (.109) (.116)[-.043] [.021] [.083] [-.059] [.080] [.116]
In Student Government 0.017 -0.094 -0.051 0.165 0.038 -0.035(.097) (.110) (.093) (.107) (.094) (.105)[.005] [-.031] [-.019] [.064] [.014] [-.013]
Expecting to Complete a 4-year College Degree -0.001 -0.141 0.073 0.092 -.297* 0.027(.112) (.104) (.104) (.098) (.108) (.098)[-.001] [-.047] [.028] [.036] [-.108] [.010]
Classroom climate:Students feel free to disagree openly with teachers .283* .292* .256* .312* .499* .364*
(.118) (.109) (.107) (.101) (.106) (.099)[.088] [.094] [.098] [.123] [.192] [.143]
Students are encouraged to make up own minds 0.256 0.146 0.237 0.23 0.081 0.071(.161) (.130) (.140) (.121) (.140) (.117)[.078] [.047] [.091] [.091] [.030] [.028]
Students express opinions in class even when different 0.183 .254* 0.091 0.094 0.14 0.036(.125) (.113) (.113) (.106) (.112) (.103)[.058] [.081] [.035] [.037] [.053] [.014]
Log Likelihood -554.516 -529.65 -611.02 -575.546 -604.167 -603sample size: 999 954 999 954 999 954
Dependent variable =1 if respondent answered "sometimes" or "often" to "How often do you have discussionsof what is happening in U.S. government with people your own age / your parents / your teachers?"
All models included controls for number of books and newspapers in the home, group participation, and feelings of political efficacy. Robust standard errors are in parentheses. Marginal effects are in brackets. * significant at the α=.05 level. All calculations used the "total weight" as provided in the survey data.
Table 39Group Discussion Skills (IEA/CivEd)
Full Probit Models - Females
People Own Age Parents Teachers

183
(1) (2) (3) (4) (5) (6)Non- Non- Non-
College College College College College CollegeCivics Education variables:
Studied Constitution 0.373 0.261 0.23 .514* -0.033 .458*(.197) (.177) (.193) (.183) (.152) (.166)[.055] [.085] [.031] [.158] [-.009] [.176]
Studied Congress -0.417 -0.228 0.097 -0.174 0.025 -0.091(.215) (.203) (.201) (.214) (.154) (.188)[-.042] [-.070] [.012] [-.048] [.007] [-.034]
Studied Presidency 0.237 .306* 0.072 -0.006 0.103 -0.09(.140) (.150) (.144) (.163) (.108) (.144)[.031] [.097] [.009] [-.001] [.028] [-.033]
Studied How Laws are Made .491* -0.133 0.083 -0.177 -0.029 -0.185(.167) (.167) (.168) (.177) (.133) (.160)[.076] [-.041] [.010] [-.048] [-.007] [-.068]
Studied Political Parties -.510* -0.053 -.321* 0.12 0.146 0.275(.174) (.156) (.158) (.167) (.121) (.149)[-.051] [-.016] [-.034] [.034] [.041] [.104]
Studied State and Local Government -0.15 0.193 -0.055 0.08 -.266* 0.045(.153) (.152) (.145) (.163) (.114) (.143)[-.017] [.062] [-.006] [.023] [-.068] [.017]
African American -.348* -.517* -.313* -.769* -.329* -.473*(.157) (.165) (.154) (.169) (.131) (.163)[-.053] [-.180] [-.046] [-.258] [-.099] [-.184]
Latino -0.098 -0.009 -0.026 -.334* 0.096 -0.107(.174) (.161) (.171) (.166) (.144) (.154)[-.012] [-.002] [-.003] [-.103] [.025] [-.040]
Female 0.095 .294* 0.203 .469* -0.028 0.105(.119) (.127) (.120) (.137) (.089) (.119)[.011] [.091] [.025] [.129] [-.007] [.039]
In Student Government .377* 0.092 .272* -0.163 0.059 0.264(.124) (.173) (.124) (.179) (.088) (.163)[.044] [.028] [.032] [-.048] [.016] [.096]
Classroom climate:Students feel free to disagree -0.011 0.219 0.207 .288* 0.055 0.127openly with teachers (.133) (.135) (.126) (.140) (.098) (.128)
[-.001] [.070] [.027] [.083] [.015] [.048]Students are encouraged to .572* -0.187 0.276 -0.101 .253* -0.229make up own minds (.147) (.156) (.149) (.160) (.120) (.147)
[.095] [-.057] [.039] [-.028] [.074] [-.084]Students express opinions in class 0.124 -0.091 0.121 0.052 0.225* .398*even when different (.135) (.140) (.133) (.144) (.102) (.130)
[.016] [-.028] [.015] [.015] [.064] [.152]Log Likelihood -352.44 -309.33 -346.25 -275.76 -646.16 -355.65sample size: 1,354 599 1,354 599 1,354 599
"College" are those students who expect to complete a four-year college degree. Leaflet 1: Dependent variable =1 if student correctly interpreted which party issued the political leaflet.Leaflet 2: Dependent variable=1 if student correctly interpreted what leaflet issuers think about taxes.Leaflet 3: Dependent variable=1 if student correctly interpreted what policy the issuers of the leaflet favor.All models included controls for number of books and newspapers in the home, group participation, and feelings of political efficacy. Robust standard errors are in parentheses. Marginal effects are in brackets. * significant at the α=.05 level. All calculations used the "total weight" as provided in the survey data.
Table 40Political Interpretation Skills - Political Leaflets (IEA/CivEd)
Full Probit Models - Non-College
Leaflet 1 Leaflet 2 Leaflet 3

184
(1) (2) (3) (4)College Non-College College Non-College
Civics Education variables:Studied Constitution 0.36 .416* 0.268 -0.074
(.209) (.186) (.156) (.170)[.043] [.100] [.068] [-.026]
Studied Congress -0.272 -0.413 -0.07 0.276(.227) (.218) (.166) (.189)[-.023] [-.082] [-.015] [.100]
Studied Presidency 0.043 .446* 0.148 0.156(.157) (.170) (.115) (.147)[.004] [.100] [.035] [.055]
Studied How Laws are Made 0.25 0.098 0.064 -0.192(.179) (.184) (.138) (.162)[.028] [.021] [.015] [-.067]
Studied Political Parties -0.192 0.102 -0.185 0.048(.170) (.172) (.130) (.152)[-.017] [.022] [-.041] [.017]
Studied State and Local Government 0.061 0.189 -0.136 -0.241(.155) (.169) (.117) (.144)[.006] [.042] [-.030] [-.084]
African American -.472* -.505* -.335* -0.147(.167) (.179) (.136) (.165)[-.063] [-.131] [-.088] [-.053]
Latino -0.191 0.094 0.123 -0.157(.181) (.189) (.148) (.156)[-.021] [.019] [.027] [-.057]
Female .278* 0.239 -0.034 -0.059(.128) (.144) (.094) (.121)[.028] [.051] [-.008] [-.021]
In Student Government .313* -0.014 0.175 -0.049(.132) (.192) (.094) (.161)[.029] [-.003] [.040] [-.017]
Classroom climate:Students feel free to disagree 0.248 -0.28 -0.005 -0.165openly with teachers (.133) (.160) (.104) (.132)
[.027] [-.059] [-.001] [-.058]Students are encouraged to 0.08 0.155 -0.04 0.014make up own minds (.161) (.171) (.135) (.149)
[.008] [.035] [-.009] [.005]Students express opinions in class .314* .311* 0.069 0.208even when different (.135) (.154) (.111) (.133)
[.036] [.071] [.016] [.075]Log Likelihood -294.25 -236.09 -568.1 -345.69sample size: 1,354 599 1,354 599
"College" are those students who expect to complete a four-year college degree. Cartoon 1: Dependent variable =1 if student correctly interpreted a political cartoon about a political leader. Cartoon 2: Dependent variable =1 if student correctly interpreted a political cartoon about democracy. All models included controls for number of books and newspapers in the home, group participation,
and feelings of political efficacy. Robust standard errors are in parentheses. Marginal effects are in brackets. * significant at the α=.05 level. All calculations used the "total weight" as provided in the survey data.
Table 41Political Interpretation Skills - Political Cartoons (IEA/CivEd)
Full Probit Models - Non-College
Cartoon 1 Cartoon 2
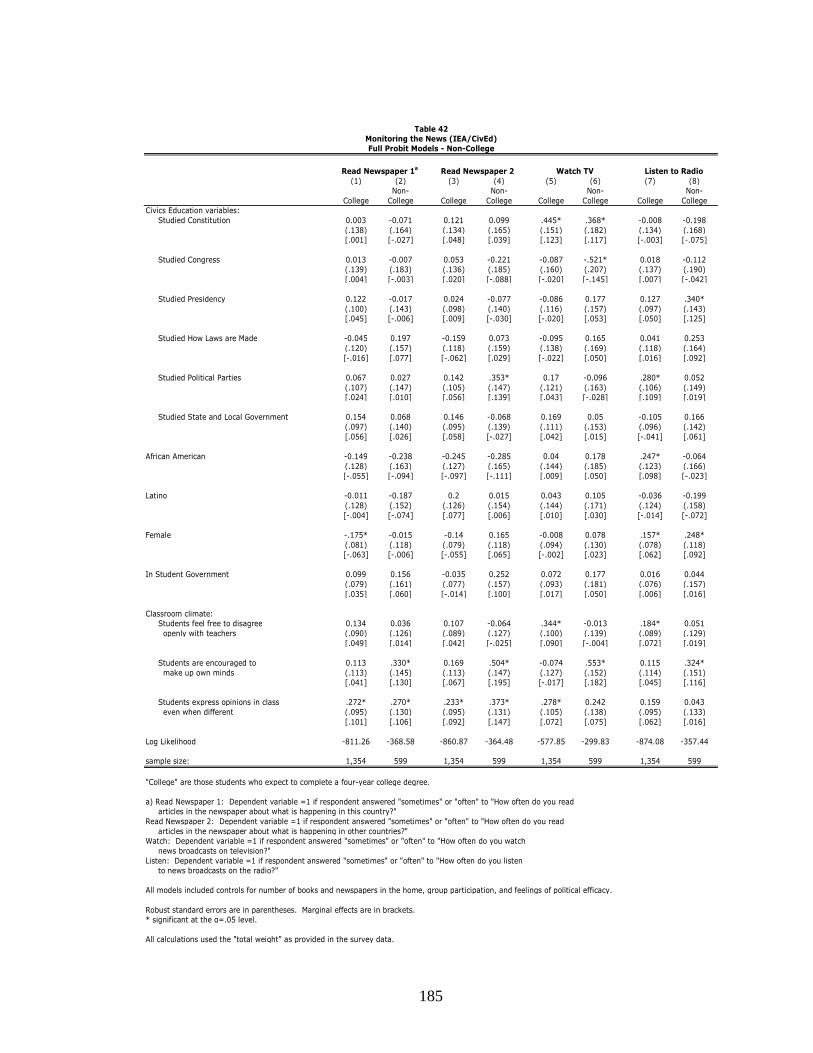
185
(1) (2) (3) (4) (5) (6) (7) (8)Non- Non- Non- Non-
College College College College College College College CollegeCivics Education variables:
Studied Constitution 0.003 -0.071 0.121 0.099 .445* .368* -0.008 -0.198(.138) (.164) (.134) (.165) (.151) (.182) (.134) (.168)[.001] [-.027] [.048] [.039] [.123] [.117] [-.003] [-.075]
Studied Congress 0.013 -0.007 0.053 -0.221 -0.087 -.521* 0.018 -0.112(.139) (.183) (.136) (.185) (.160) (.207) (.137) (.190)[.004] [-.003] [.020] [-.088] [-.020] [-.145] [.007] [-.042]
Studied Presidency 0.122 -0.017 0.024 -0.077 -0.086 0.177 0.127 .340*(.100) (.143) (.098) (.140) (.116) (.157) (.097) (.143)[.045] [-.006] [.009] [-.030] [-.020] [.053] [.050] [.125]
Studied How Laws are Made -0.045 0.197 -0.159 0.073 -0.095 0.165 0.041 0.253(.120) (.157) (.118) (.159) (.138) (.169) (.118) (.164)[-.016] [.077] [-.062] [.029] [-.022] [.050] [.016] [.092]
Studied Political Parties 0.067 0.027 0.142 .353* 0.17 -0.096 .280* 0.052(.107) (.147) (.105) (.147) (.121) (.163) (.106) (.149)[.024] [.010] [.056] [.139] [.043] [-.028] [.109] [.019]
Studied State and Local Government 0.154 0.068 0.146 -0.068 0.169 0.05 -0.105 0.166(.097) (.140) (.095) (.139) (.111) (.153) (.096) (.142)[.056] [.026] [.058] [-.027] [.042] [.015] [-.041] [.061]
African American -0.149 -0.238 -0.245 -0.285 0.04 0.178 .247* -0.064(.128) (.163) (.127) (.165) (.144) (.185) (.123) (.166)[-.055] [-.094] [-.097] [-.111] [.009] [.050] [.098] [-.023]
Latino -0.011 -0.187 0.2 0.015 0.043 0.105 -0.036 -0.199(.128) (.152) (.126) (.154) (.144) (.171) (.124) (.158)[-.004] [-.074] [.077] [.006] [.010] [.030] [-.014] [-.072]
Female -.175* -0.015 -0.14 0.165 -0.008 0.078 .157* .248*(.081) (.118) (.079) (.118) (.094) (.130) (.078) (.118)[-.063] [-.006] [-.055] [.065] [-.002] [.023] [.062] [.092]
In Student Government 0.099 0.156 -0.035 0.252 0.072 0.177 0.016 0.044(.079) (.161) (.077) (.157) (.093) (.181) (.076) (.157)[.035] [.060] [-.014] [.100] [.017] [.050] [.006] [.016]
Classroom climate:Students feel free to disagree 0.134 0.036 0.107 -0.064 .344* -0.013 .184* 0.051
openly with teachers (.090) (.126) (.089) (.127) (.100) (.139) (.089) (.129)[.049] [.014] [.042] [-.025] [.090] [-.004] [.072] [.019]
Students are encouraged to 0.113 .330* 0.169 .504* -0.074 .553* 0.115 .324*make up own minds (.113) (.145) (.113) (.147) (.127) (.152) (.114) (.151)
[.041] [.130] [.067] [.195] [-.017] [.182] [.045] [.116]Students express opinions in class .272* .270* .233* .373* .278* 0.242 0.159 0.043
even when different (.095) (.130) (.095) (.131) (.105) (.138) (.095) (.133)[.101] [.106] [.092] [.147] [.072] [.075] [.062] [.016]
Log Likelihood -811.26 -368.58 -860.87 -364.48 -577.85 -299.83 -874.08 -357.44sample size: 1,354 599 1,354 599 1,354 599 1,354 599
"College" are those students who expect to complete a four-year college degree. a) Read Newspaper 1: Dependent variable =1 if respondent answered "sometimes" or "often" to "How often do you read
articles in the newspaper about what is happening in this country?"Read Newspaper 2: Dependent variable =1 if respondent answered "sometimes" or "often" to "How often do you read
articles in the newspaper about what is happening in other countries?"Watch: Dependent variable =1 if respondent answered "sometimes" or "often" to "How often do you watch
news broadcasts on television?"Listen: Dependent variable =1 if respondent answered "sometimes" or "often" to "How often do you listen
to news broadcasts on the radio?"All models included controls for number of books and newspapers in the home, group participation, and feelings of political efficacy. Robust standard errors are in parentheses. Marginal effects are in brackets. * significant at the α=.05 level. All calculations used the "total weight" as provided in the survey data.
Listen to Radio
Table 42Monitoring the News (IEA/CivEd)Full Probit Models - Non-College
Read Newspaper 1a Read Newspaper 2 Watch TV

186
(1) (2) (3) (4) (5) (6)Non- Non- Non-
College College College College College CollegeCivic Education variables:
Studied Constitution -0.032 0.12 0.067 -0.168 -0.01 0.026(.146) (.175) (.137) (.165) (.135) (.166)[-.011] [.037] [.025] [-.067] [-.004] [.010]
Studied Congress -0.163 -0.034 0.205 -0.074 .303* -0.214(.148) (.200) (.138) (.185) (.136) (.187)[-.056] [-.011] [.078] [-.029] [.118] [-.082]
Studied Presidency .259* 0.162 .335* 0.105 0.157 0.053(.107) (.152) (.098) (.139) (.097) (.145)[.083] [.051] [.128] [.042] [.060] [.020]
Studied How Laws are Made 0.053 0.021 0.028 0.196 -0.126 0.016(.129) (.169) (.119) (.157) (.118) (.159)[.017] [.006] [.010] [.077] [-.047] [.006]
Studied Political Parties .393* -0.16 -0.201 0.034 -0.016 0.176(.116) (.157) (.108) (.146) (.106) (.149)[.122] [-.052] [-.074] [.013] [-.006] [.068]
Studied State and Local Government -0.128 0.094 0.081 0.052 .254* 0.229(.102) (.149) (.097) (.137) (.095) (.140)[-.043] [.030] [.030] [.020] [.098] [.089]
African American -0.054 -0.04 -0.153 0.02 0.128 -0.124(.132) (.172) (.125) (.160) (.128) (.163)[-.017] [-.012] [-.058] [.008] [.048] [-.048]
Latino -0.019 0.04 0.111 0.151 0.176 0.078(.130) (.164) (.128) (.152) (.127) (.158)[-.006] [.013] [.041] [.060] [.065] [.030]
Female -0.138 -0.147 -0.036 0.093 0.011 .261*(.083) (.126) (.081) (.115) (.080) (.119)[-.046] [-.046] [-.013] [.037] [.004] [.100]
In Student Government -0.001 -0.018 -0.033 0.103 0.001 -0.061(.081) (.167) (.079) (.155) (.078) (.161)[-.001] [-.005] [-.012] [.041] [.001] [-.023]
Classroom climate:Students feel free to disagree openly with teachers .206* .472* .278* 0.209 .372* .559*
(.097) (.140) (.089) (.125) (.088) (.127)[.067] [.145] [.106] [.083] [.144] [.217]
Students are encouraged to make up own minds 0.194 0.188 .253* .363* -0.119 .379*(.128) (.161) (.114) (.145) (.114) (.146)[.062] [.058] [.097] [.143] [-.044] [.149]
Students express opinions in class even when different .318* 0.076 0.044 0.218 0.135 0.022(.105) (.142) (.096) (.128) (.094) (.131)[.100] [.024] [.016] [.086] [.052] [.008]
Log Likelihood -767.14 -321.07 -818.28 -379.59 -844.85 -352.49sample size: 1,354 599 1,354 599 1,354 599
"College" are those students who expect to complete a four-year college degree. Dependent variable =1 if respondent answered "sometimes" or "often" to "How often do you have discussions
of what is happening in U.S. government with people your own age / your parents / your teachers?"All models included controls for number of books and newspapers in the home, group participation, and feelings of political efficacy. Robust standard errors are in parentheses. Marginal effects are in brackets. * significant at the α=.05 level. All calculations used the "total weight" as provided in the survey data.
Table 43Group Discussion Skills (IEA/CivEd)
Full Probit Models - Non-College
People Own Age Parents Teachers

187
(1) (2) (3) (4) (5) (6) (7) (8) (9) (10)females males females males females males females males females males
Civic Education -0.162 0.056 0.052 -0.184 0.154 -0.032 0.053 -0.062 0.239 -0.26(.189) (.171) (.308) (.305) (.184) (.168) (.176) (.175) (.229) (.201)[-.050] [.019] [.003] [-.014] [.054] [-.012] [.019] [-.020] [.040] [-.059]
Latino -0.146 -0.113 0.516 0.423 0.292 0.185 -0.003 0.32 -0.761 -0.344(.326) (.256) (.440) (.392) (.302) (.237) (.294) (.250) (.461) (.296)[-.044] [-.038] [.055] [.042] [.107] [.071] [-.001] [.111] [-.088] [-.069]
African-American .581* 0.14 .814* 0.441 0.446 0.131 0.314 -0.449 0.102 -0.547(.236) (.254) (.353) (.369) (.236) (.243) (.224) (.275) (.328) (.365)[.199] [.050] [.093] [.045] [.165] [.050] [.118] [-.131] [.018] [-.099]
Immigrant -0.393 -0.222 0.709 -0.322 0.716 -0.207 0.115 -0.449 0.868 -0.348(.483) (.402) (.671) (.689) (.427) (.364) (.424) (.391) (.583) (.445)[-.107] [-.073] [.091] [-.019] [.274] [-.075] [.042] [-.129] [.222] [-.067]
In Student Government 0.104 -.703* 0.071 -0.241 .931* -0.251 0.429 -0.138 0.165 0.535(.264) (.329) (.476) (.599) (.257) (.286) (.254) (.309) (.317) (.324)[.033] [-.200] [.005] [-.015] [.353] [-.090] [.164] [-.043] [.030] [.150]
Very Religious -0.414 0.078 -0.658 0.54 -0.164 0.085 -0.222 0.472 -0.639 -0.134(.300) (.225) (.480) (.443) (.302) (.217) (.288) (.227) (.364) (.260)[-.130] [.027] [-.053] [.045] [-.057] [.032] [-.081] [.157] [-.112] [-.030]
Log Likelihood -137.697 -166.08 -48.029 -56.067 -142.369 -177.47 -156.155 -160.725 -88.367 -118.504sample size: 266 289 266 289 266 289 266 289 266 289
Newspapers: Read a newspaper 5, 6 or 7 days out of the past week.Newsmagazines: Read a newspaper 5, 6 or 7 days out of the past week.Watch: Watch the national news on television 5, 6 or 7 days out of the past week.Listen: Listen to the news on the radio 5, 6 or 7 days out of the past week.Internet: Read news on the internet 5, 6 or 7 days out of the past week.All models include controls for household income, political views, group participation, frequency and intention of voting,
and feelings of political efficacy.Robust standard errors are in parentheses. Marginal effects are in brackets. * significant at the α=.05 level. All calculations used the "step weight" as provided in the survey data.
Listen to Radio Internet News
Table 44Monitoring the News (NGI)Full Probit Models - Females
Newspapers Newsmagazines Watch TV

188
(1) (2) (3) (4)females males females males
Civic Education 0.201 0.293 0.182 0.017(.179) (.177) (.234) (.220)[.079] [.114] [.027] [.003]
Latino -0.447 -0.216 -.673* -0.083(.314) (.263) (.339) (.307)[-.166] [-.083] [-.139] [-.016]
African-American -0.332 -0.34 0.13 -.714*(.234) (.262) (.310) (.294)[-.127] [-.128] [.018] [-.177]
Immigrant -0.294 -0.194 -0.39 -0.462(.467) (.402) (.583) (.449)[-.111] [-.074] [-.072] [-.107]
In Student Government 0.279 -0.008 -0.516 -0.114(.265) (.306) (.336) (.365)[.110] [-.003] [-.097] [-.022]
Very Religious 0.274 0.427 0.149 0.421(.306) (.231) (.355) (.285)[.107] [.166] [.022] [.076]
Log Pseudo-Likelihood -150.483 -156.844 -84.542 -99.965sample size: 266 289 266 289
Dependent variable =1 if respondent has worked together informally, ever, with someone orsome group to solve a community problem.
Dependent variable =1 if respondent sometimes or very often talks about current events or newswith family or friends.
All models include controls for household income, political views, group participation, frequencyand intention of voting, and feelings of political efficacy.
Robust standard errors are in parentheses. Marginal effects are in brackets. * significant at the α=.05 level. All calculations used the "step weight" as provided in the survey data.
Table 45Collective Decision-Making Skills (NGI)
Full Probit Models - Females
Work Informally Group Discussion

189
(1) (2) (3) (4) (5) (6) (7) (8)African- All African- All African- All African- All
Americans others Americans others Americans others Americans othersCivic Education 0.02 .290* -0.021 .288* 0.351 .209* 0.116 0.025
(.173) (.069) (.188) (.073) (.236) (.098) (.199) (.078)[.008] [.115] [-.006] [.091] [.057] [.027] [.031] [.006]
Female 0.248 -.143* 0.071 -.213* -0.059 .197* .602* -0.073(.152) (.062) (.163) (.067) (.227) (.094) (.177) (.070)[.098] [-.057] [.021] [-.064] [-.008] [.024] [.163] [-.019]
In Student Government 0.489 -0.062 -0.161 0.034 0.226 0.042 0.053 .398*(.260) (.085) (.270) (.094) (.474) (.141) (.312) (.110)[.191] [-.024] [-.051] [.010] [.028] [.005] [.013] [.092]
Live in Rural Area -0.108 -0.094 0.288 -.295* 0.574 -.273* -0.16 -0.106(.216) (.072) (.240) (.077) (.355) (.107) (.244) (.082)[-.043] [-.037] [.080] [-.093] [.063] [-.036] [-.045] [-.028]
Log Likelihood -212.86 -1155.1 -175.618 -932.703 -87.163 -444.82 -153.94 -843.269sample size: 328 1,781 328 1,781 328 1,781 328 1,781
Dependent variable =1 if student reads a newspaper or newsmagazine almostdaily or at least once a week.
Dependent variable =1 if student watches television news or listens to radio newsalmost daily or at least once a week.
Dependent variable =1 if student feels they could write a letter to someone in governmentthat clearly gives their opinion.
Dependent variable =1 if student feels they could make a comment or statement ata public meeting.
All models include controls for hoursehold income, region of the country, group participation,and feelings of political efficacy.
Robust standard errors are in parentheses. Marginal effects are in brackets. * significant at the α=.05 level. All calculations used the "FYWT" weight as provided in the survey data.
Letter Statement
Table 46Monitoring the News and Communication Skills (NHES)
Full Probit Models - African-Americans
Read Watch/Listen

190
(1) (2) (3) (4) (5) (6) (7) (8)All All All All
Latinos others Latinos others Latinos others Latinos othersCivic Education .402* .223* 0.151 .247* 0.267 .250* .432* -0.044
(.160) (.070) (.171) (.074) (.216) (.099) (.181) (.080)[.159] [.088] [.043] [.078] [.040] [.033] [.117] [-.011]
Female -0.041 -0.071 -0.172 -.158* .469* 0.091 -0.121 0.043(.147) (.062) (.161) (.067) (.214) (.094) (.168) (.071)[-.016] [-.028] [-.049] [-.048] [.067] [.011] [-.031] [.011]
In Student Government 0.123 -0.021 -0.218 0.029 -.789* 0.273 .666* .318*(.217) (.087) (.225) (.096) (.274) (.162) (.288) (.111)[.049] [-.008] [-.066] [.009] [-.162] [.028] [.136] [.076]
Live in Rural Area 0.011 -0.102 -.612* -.209* 0.03 -0.186 -0.228 -0.116(.261) (.072) (.258) (.077) (.376) (.107) (.283) (.082)[.004] [-.040] [-.206] [-.066] [.004] [-.024] [-.064] [-.031]
Log Likelihood -204.042 -1165.82 -166.039 -950.603 -97.14 -439.972 -154.151 -841.237sample size: 334 1,775 334 1,775 334 1,775 334 1,775
Dependent variable =1 if student reads a newspaper or newsmagazine almostdaily or at least once a week.
Dependent variable =1 if student watches television news or listens to radio newsalmost daily or at least once a week.
Dependent variable =1 if student feels they could write a letter to someone in governmentthat clearly gives their opinion.
Dependent variable =1 if student feels they could make a comment or statement ata public meeting.
All models include controls for hoursehold income, region of the country, group participation,and feelings of political efficacy.
Robust standard errors are in parentheses. Marginal effects are in brackets. * significant at the α=.05 level. All calculations used the "FYWT" weight as provided in the survey data.
Letter Statement
Table 47Monitoring the News and Communication Skills (NHES)
Full Probit Models - Latinos
Read Watch/Listen

191
(1) (2) (3) (4) (5) (6) (7) (8)females males females males females males females males
Civic Education 0.12 .406* 0.174 .330* 0.188 .274* 0.114 -0.074(.089) (.094) (.093) (.100) (.134) (.123) (.102) (.106)[.048] [.160] [.057] [.099] [.021] [.042] [.029] [-.019]
Latino 0.056 -0.094 -0.049 0.015 0.17 -0.184 0.027 0.062(.137) (.135) (.148) (.152) (.218) (.177) (.159) (.152)[.022] [-.037] [-.016] [.004] [.016] [-.029] [.006] [.016]
African-American 0.182 -.317* -0.027 -0.127 -0.287 0.136 0.274 -0.183(.117) (.123) (.125) (.135) (.176) (.180) (.145) (.132)[.072] [-.125] [-.008] [-.037] [-.035] [.018] [.063] [-.052]
Immigrant .384* .727* 0.311 0.923* -0.026 0.476 -0.106 0.066(.179) (.209) (.202) (.298) (.270) (.311) (.201) (.221)[.149] [.264] [.090] [.173] [-.002] [.049] [-.028] [.017]
In Student Government -0.123 0.201 0.003 0.039 0.032 0.201 0.17 .801*(.104) (.130) (.111) (.148) (.175) (.216) (.128) (.196)[-.049] [.079] [.001] [.011] [.003] [.025] [.040] [.158]
Live in Rural Area 0.004 -0.189 -0.237 -0.19 -0.23 -0.122 -.244* 0.036(.096) (.098) (.102) (.105) (.152) (.136) (.110) (.111)[.001] [-.075] [-.079] [-.056] [-.027] [-.018] [-.065] [.009]
Log Likelihood -704.074 -661.548 -600.54 -512.988 -237.68 -295.506 -482.762 -497.805sample size: 1,070 1,036 1,070 1,036 1,070 1,036 1,070 1,036
Dependent variable =1 if student reads a newspaper or newsmagazine almostdaily or at least once a week.
Dependent variable =1 if student watches television news or listens to radio newsalmost daily or at least once a week.
Dependent variable =1 if student feels they could write a letter to someone in governmentthat clearly gives their opinion.
Dependent variable =1 if student feels they could make a comment or statement ata public meeting.
All models include controls for hoursehold income, region of the country, group participation,and feelings of political efficacy.
Robust standard errors are in parentheses. Marginal effects are in brackets. * significant at the α=.05 level. All calculations used the "FYWT" weight as provided in the survey data.
Letter Statement
Table 48Monitoring the News and Communication Skills (NHES)
Full Probit Models - Females
Read Watch/Listen

192
(1) (2) (3) (4) (5) (6) (7) (8)Low- All Low- All Low- All Low- All
income others income others income others income othersCivic Education 0.065 .313* -0.001 .326* .454* 0.159 0.116 -0.06
(.135) (.073) (.145) (.077) (.182) (.106) (.149) (.084)[.026] [.124] [-.001] [.103] [.077] [.019] [.032] [-.015]
Females 0.016 -0.106 0.007 -.225* 0.335 0.082 0.306* -0.085(.118) (.065) (.128) (.071) (.174) (.100) (.134) (.075)[.006] [-.042] [.002] [-.067] [.049] [.009] [.084] [-.022]
In Student Government 0.023 0.019 0.425 -0.094 0.006 0.072 0.419 .333*(.194) (.088) (.240) (.096) (.308) (.151) (.255) (.112)[.009] [.007] [.113] [-.029] [.001] [.008] [.099] [.077]
Live in Rural Area 0.028 -0.123 -0.061 -.278* 0.073 -.238* -0.106 -0.086(.148) (.077) (.159) (.082) (.213) (.117) (.162) (.088)[.011] [-.049] [-.019] [-.088] [.010] [-.030] [-.030] [-.022]
Log Likelihood -319.297 -1052.86 -262.12 -842.872 -138.21 -385.76 -239.624 -750.381sample size: 490 1,619 490 1,619 490 1,619 490 1,619
Respondents with household income $25,000 per year or less are low income. Dependent variable =1 if student reads a newspaper or newsmagazine almostdaily or at least once a week.
Dependent variable =1 if student watches television news or listens to radio newsalmost daily or at least once a week.
Dependent variable =1 if student feels they could write a letter to someone in governmentthat clearly gives their opinion.
Dependent variable =1 if student feels they could make a comment or statement ata public meeting.
All models include controls for region of the country, group participation,and feelings of political efficacy.
Robust standard errors are in parentheses. Marginal effects are in brackets. * significant at the α=.05 level. All calculations used the "FYWT" weight as provided in the survey data.
Letter Statement
Table 49Monitoring the News and Communication Skills (NHES)
Full Probit Models - Low Income
Read Watch/Listen

193
(1) (2) (3) (4) (5) (6) (7) (8)Non- Non- Non- Non-
College College College College College College College CollegeCivic Education .235* 0.249 .237* 0.224 .212* 0.448 0.043 -0.183
(.068) (.187) (.073) (.186) (.097) (.244) (.078) (.194)[.093] [.088] [.073] [.078] [.028] [.062] [.011] [-.056]
Latino 0.02 -0.156 -0.098 0.546 -0.064 0.551 0.029 0.534(.103) (.278) (.113) (.301) (.148) (.416) (.070) (.311)[.008] [-.055] [-.030] [.165] [-.008] [.051] [-.012] [.147]
African American -0.067 0.246 -0.097 0.4 -0.086 0.658 -0.068 0.55(.088) (.279) (.097) (.287) (.130) (.483) (.101) (.294)[-.026] [.092] [-.029] [.125] [-.011] [.058] [-.017] [.151]
Female -0.068 -0.344 -.206* 0.083 .199* -0.209 0.029 -0.155(.060) (.185) (.067) (.184) (.091) (.250) (.070) (.192)[-.027] [-.121] [-.060] [.028] [.025] [-.026] [.007] [-.049]
Live in Rural Area -0.089 0.134 -.216* -0.128 -0.111 -0.467 -0.13 0.175(.073) (.211) (.078) (.212) (.110) (.287) (.083) (.219)[-.035] [.049] [-.067] [-.044] [-.014] [-.066] [-.034] [.054]
Log Likelihood -1214.26 -154.15 -963.34 -145.24 -462.42 -70.32 -856.57 -136.9sample size: 1,848 261 1,848 261 1,848 261 1,848 261
"College" are those students who think they will graduate from a four-year college.Dependent variable =1 if student reads a newspaper or newsmagazine almost
daily or at least once a week.Dependent variable =1 if student watches television news or listens to radio news
almost daily or at least once a week.Dependent variable =1 if student feels they could write a letter to someone in government
that clearly gives their opinion. Dependent variable =1 if student feels they could make a comment or statement at
a public meeting. All models include controls for hoursehold income, region of the country, group participation,
and feelings of political efficacy. Robust standard errors are in parentheses. Marginal effects are in brackets. * significant at the α=.05 level. All calculations used the "FYWT" weight as provided in the survey data.
Letter Statement
Table 50Monitoring the News and Communication Skills (NHES)
Full Probit Models - Non-College
Read Watch/Listen

194
(1) (2) (3) (4) (5) (6)females males females males females males
Civic Education 0.291 -0.029 0.22 -0.064 -0.042 0.169(.231) (.240) (.225) (.201) (.259) (.262)[.078] [-.007] [.069] [-.023] [-.008] [.034]
Latino -0.176 0.241 0.033 0.083 0.028 0.348(.306) (.410) (.295) (.362) (.314) (.467)[-.046] [.055] [.011] [.030] [.006] [.055]
African-American .810* .941* 0.455 0.352 0.317 0.937(.324) (.412) (.248) (.309) (.310) (.649)[.143] [.158] [.162] [.134] [.059] [.110]
Immigrant -0.64 0.448 0.146 -0.698 -.925* 0.616(.394) (.474) (.369) (.430) (.392) (.515)[-.195] [.095] [.049] [-.213] [-.277] [.086]
Some College 0.175 0.138 .676* 0.086 0.450* .613*(.204) (.224) (.175) (.189) (.212) (.264)[.043] [.035] [.217] [.031] [.097] [.116]
Private School Attendees -0.332 -0.315 .578* -0.18 -0.142 0.72(.306) (.304) (.276) (.277) (.337) (.503)[-.092] [-.089] [.211] [-.063] [-.032] [.097]
Log Likelihood -134.828 -119.045 -178.954 -161.663 -125.358 -84.062sample size: 339 275 339 275 339 275
Dependent variable =1 if respondent watches television news once a week or more.Dependent variable =1 if respondent watches public affairs programming on television
once a week or more.Dependent variable =1 if respondent reads the newspaper once a week or more.All models include controls for household income, political orientation, group participation,
and feelings of political efficacy. Robust standard errors are in parentheses. Marginal effects are in brackets. * significant at the α=.05 level. All calculations used the "wt2517" weight as provided in the survey data.
Table 51Monitoring the News (ACPS)Full Probit Models - Females
Television News Public Affairs Newspaper

195
(1) (2) (3) (4) (5) (6) (7) (8)females males females males females males females males
Civic Education .554* -0.108 .408* 0.079 0.007 0.362 0.139 0.443(.231) (.250) (.200) (.220) (.215) (.208) (.206) (.233)[.164] [-.024] [.157] [.020] [.002] [.142] [.055] [.146]
Latino -0.369 -0.08 -0.307 0.363 -.776* -0.005 -0.261 -0.232(.299) (.432) (.259) (.414) (.330) (.379) (.272) (.404)[-.107] [-.019] [-.118] [.104] [-.231] [-.002] [-.102] [-.076]
African-American .648* 0.282 0.427 0.091 0.29 -0.397 0.122 -0.389(.322) (.362) (.251) (.361) (.250) (.319) (.246) (.343)[.129] [.058] [.148] [.028] [.109] [-.154] [.048] [-.132]
Immigrant -0.602 -1.45* 0.815* -0.827 0.282 -0.007 0.617 -0.938(.403) (.602) (.342) (.477) (.361) (.439) (.340) (.515)[-.188] [-.489] [.251] [-.306] [.106] [-.002] [.237] [-.342]
Some College .424* .885* .636* .699* .602* 0.133 .688* .819*(.206) (.248) (.168) (.222) (.169) (.194) (.166) (.234)[.110] [.209] [.235] [.225] [.213] [.053] [.268] [.252]
Private School Attendees 0.463 0.06 0.197 .986* 0.309 0.001 0.526 -0.561(.387) (.370) (.294) (.371) (.280) (.277) (.292) (.308)[.098] [.013] [.071] [.233] [.116] [.001] [.204] [-.195]
Log Likelihood -132.366 -108.127 -195.56 -130.582 -184.48 -153.85 -195.273 -119.893sample size: 339 275 339 275 339 275 339 275
Dependent variable =1 if respondent feels they could write a convincing letter to someone ingovernment that expresses their point of view.
Dependent variable =1 if respondent feels they speak well enough to make an effectivestatement at a public community meeting.
Dependent variable =1 if respondent discusses local politics or affairs with others every day, nearly every day, or once or twice a week.
Dependent variable =1 if respondent discusses national politics or affairs with others every day, nearly every day, or once or twice a week.
All models include controls for household income, political orientation, group participation,and feelings of political efficacy.
Robust standard errors are in parentheses. Marginal effects are in brackets. * significant at the α=.05 level. All calculations used the "wt2517" weight as provided in the survey data.
National
Table 52Communication Skills and Group Discussion Skills (ACPS)
Full Probit Models - Females
Letter Statement Local

196
(1) (2) (3) (4) (5) (6) (7) (8)Non- Non- Non- Non-
College College College College College College College CollegeCivic Education -0.175 0.389 0.221 .605* 0.185 0.421 0.231 .523*
(.326) (.227) (.287) (.231) (.278) (.237) (.281) (.229)[-.027] [.138] [.063] [.237] [.073] [.137] [.080] [.201]
Latino -0.088 -0.063 -0.366 -0.029 -0.524 -0.262 -0.235 -0.157(.337) (.247) (.330) (.255) (.281) (.242) (.284) (.244)[-.015] [-.021] [-.112] [-.011] [-.202] [-.086] [-.083] [-.062]
African-American 0.482 0.396 0.465 0.234 0.069 0.094 0.099 -0.048(.315) (.254) (.289) (.241) (.260) (.258) (.279) (.261)[.062] [.121] [.103] [.090] [.027] [.033] [.032] [-.019]
Females -0.069 0.145 -0.103 -.438* -0.152 -.511* -.493* -.667*(.226) (.212) (.224) (.215) (.196) (.226) (.198) (.209)[-.011] [.049] [-.027] [-.171] [-.060] [-.176] [-.163] [-.260]
Immigrant -0.256 -0.698 -0.106 0.391 0.347 -0.555 0.151 -0.35(.497) (.400) (.467) (.400) (.404) (.385) (.424) (.400)[-.049] [-.262] [-.029] [.147] [.135] [-.165] [.048] [-.135]
Private School Attendees 0.481 -0.433 .871* -0.762 -0.113 0.397 -0.312 0.319(.436) (.459) (.329) (.423) (.260) (.395) (.283) (.501)[.065] [-.160] [.175] [-.291] [-.045] [.148] [-.110] [.126]
Log Likelihood -109.35 -152.43 -144.73 -174.17 -194.29 -142.72 -171.6 -166.36sample size: 325 289 325 289 325 289 325 289
"College" are those respondents who have completed at least one year of college. Dependent variable =1 if respondent feels they could write a convincing letter to someone ingovernment that expresses their point of view.
Dependent variable =1 if respondent feels they speak well enough to make an effectivestatement at a public community meeting.
Dependent variable =1 if respondent discusses local politics or affairs with others every day, nearly every day, or once or twice a week.
Dependent variable =1 if respondent discusses national politics or affairs with others every day, nearly every day, or once or twice a week.
All models include controls for household income, political orientation, group participation,and feelings of political efficacy.
Robust standard errors are in parentheses. Marginal effects are in brackets. * significant at the α=.05 level. All calculations used the "wt2517" weight as provided in the survey data.
National
Table 53Communication Skills and Group Discussion Skills (ACPS)
Full Probit Models - Non-College
Letter Statement Local

197
(1) (2) (3) (4) (5) (6)Non- Non- Non-
College College College College College CollegeCivic Education -0.073 0.168 -0.154 0.153 -0.667 0.385
(.305) (.224) (.253) (.229) (.400) (.239)[-.018] [.047] [-.058] [.047] [-.070] [.108]
Latino 0.021 -0.104 0.107 0.073 0.097 0.48(.326) (.281) (.274) (.239) (.378) (.300)[.005] [-.029] [.040] [.023] [.012] [.103]
African-American .936* .732* .499* 0.235 0.849 0.464(.367) (.308) (.250) (.251) (.445) (.282)[.156] [.151] [.194] [.079] [.074] [.100]
Females -0.186 0.067 0.053 -.533* -0.264 -0.018(.235) (.234) (.191) (.212) (.258) (.215)[-.046] [.018] [.019] [-.168] [-.037] [-.004]
Immigrant 0.564 -0.719 -0.09 -0.547 -0.452 -0.464(.453) (.519) (.424) (.395) (.557) (.418)[.111] [-.240] [-.033] [-.146] [-.081] [-.140]
Private School Attendees -.629* 0.978 -0.1 .935* 0.552 -0.307(.286) (.514) (.254) (.422) (.340) (.434)[-.187] [.166] [-.036] [.350] [.060] [-.089]
Log Likelihood -141.58 -126.92 -199.47 -142.21 -84.49 -129.25sample size: 325 289 325 289 325 289
"College" are those respondents who have completed at least one year of college. Dependent variable =1 if respondent watches television news once a week or more.Dependent variable =1 if respondent watches public affairs programming on television
once a week or more.Dependent variable =1 if respondent reads the newspaper once a week or more.All models include controls for household income, political orientation, group participation,
and feelings of political efficacy. Robust standard errors are in parentheses. Marginal effects are in brackets. * significant at the α=.05 level. All calculations used the "wt2517" weight as provided in the survey data.
Table 54Monitoring the News (ACPS)
Full Probit Models - Non-College
Television News Public Affairs Newspaper

198
Probit Probit Probit ProbitCoefficientc ATTd ATEe Coefficientf Coefficient ATT ATE Coefficient Coefficient ATT ATE Coefficient Coefficient ATT ATE Coefficient(Std. Error) (Std. Error)g (Std. Error) (Std. Error) (Std. Error) (Std. Error) (Std. Error) (Std. Error)
(1) (2) (3) (4) (5) (6) (7) (8) (9) (10) (11) (12) (13) (14) (15) (16)Civic Education variables:
Studied Constitution 0.46 0.261 0.253 1.27* .289* 0.022 0.027 .232* 0.471 0.138 0.158 3.35* .369* 0.036 0.043 .310*(.323) (.115) (.145) (.029)h (.337) (.069) (.143) (.025)h
[.153] [.416] [.055] [.032] [.152] -- [.066] [.038]Studied Congress 0.071 0.156 0.106 0.051 -.335* -0.003 0.003 0.001 -0.06 -0.027 -0.072 -.582* 0.075 0.015 0.03 0.154
(.313) (.078) (.162) (.021) (.338) (.067) (.160) (.021)[.022] [.019] [-.049] [.001] [-.017] [-.182] [.011] [.020]
Studied Presidency -0.092 0.023 0.045 0.382 .292* 0.05 0.041 0.091 -0.199 0.023 0.011 0.439 -0.017 0.029 0.025 0.052(.250) (.072) (.111) (.024) (.266) (.069) (.119) (.024)[-.028] [.081] [.053] [.016] [-.058] [.102] [-.002] [.007]
Studied How Laws are Made -0.486 0.086 0.074 0.383 0.176 0.045 0.044 0.151 -0.112 0.114 0.086 21.64 -0.092 0.001 0.002 -0.074(.300) (.095) (.129) (.027) (.291) (.134) (.136) (.020)[-.136] [.118] [.031] [.029] [-.032] [no effect] [-.013] [-.009]
Studied Political Parties -0.021 0.043 0.068 1.07* -.298* 0.004 -0.001 0.022 -0.538 -0.059 -0.068 -0.517 -0.036 0.028 0.023 0.13(.262) (.080)h (.125) (.023) (.279) (.066) (.123) (.023)[-.006] [.169] [-.046] [.003] [-.144] [-.040] [-.005] [.023]
Studied State and Local Gov't. 0.291 0.174 0.124 0.04 -0.055 0.046 0.024 0.09 0.288 0.123 0.073 0.01 -0.096 0.007 0.011 0.073(.266) (.114) (.115) (.024) (.275) (.131) (.118) (.019)[.093] [.014] [-.009] [.019] [.089] [.003] [-.014] [.009]
a) Civic education variable is the treatment effect. Nearest-neighbor matching methods with replacement were employed. Individual matching analyses were conducted for each of the 6 treatment effects (civics education types).
b) Leaflet 1: Dependent variable =1 if student correctly interpreted which party issued the political leaflet.Leaflet 2: Dependent variable=1 if student correctly interpreted what leaflet issuers think about taxes.c) Coefficients, robust standard errors (in parentheses) and marginal effects (in brackets) from full probit models in Table 28.d) ATT= Average Treatment Effect on the Treated, interpreted as percentage points; "Treated" are those that report studying the above civic education topics.e) ATE= Average Treatment Effect.f) Coefficients are from matching-weighted probits. Marginal effects are in brackets.g) Bootstrapped standard errors are in parentheses.
Significance is based on the bias-corrected confidence intervals and the matching-weighted probit analyses. h) Significant in the matching-weighted probit but not the bias-corrected confidence interval. i) Significant in the bias-corrected confidence interval but not the matching-weighted probit. * significant at the α=.05 level. All calculations used the "total weight" as provided in the survey data, except the matching-weighted probits.
Leaflet 2 - All others
Table 55Political Interpretation Skills - Political Leaflets (IEA/CivEd)
Matching Methodsa - African-Americans
Leaflet 2 - African-AmericansLeaflet 1 - African-Americans Leaflet 1 - All others

199
Probit Probit Probit ProbitCoefficientc ATTd ATEe Coefficientf Coefficient ATT ATE Coefficient Coefficient ATT ATE Coefficient Coefficient ATT ATE Coefficient(Std. Error) (Std. Error)g (Std. Error) (Std. Error) (Std. Error) (Std. Error) (Std. Error) (Std. Error)
(1) (2) (3) (4) (5) (6) (7) (8) (9) (10) (11) (12) (13) (14) (15) (16)Civic Education variables:
Studied Constitution 0.162 0.076 0.069 0.39 0.178 0.008 0.012 -0.043 .841* 0.08 0.099 .692* 0.261 0.048 0.058 .539*(.286) (.125) (.119) (.031) (.337) (.071)h (.154) (.020)[.062] [.130] [.055] [-.012] [.242] [.028] [.035] [.047]
Studied Congress -0.175 -0.081 -0.068 -0.562* 0.002 0.044 0.037 0.021 -0.364 -0.059 -0.049 -.644* -0.288 0.054 0.059 .464*(.289) (.084)h (.128) (.030) (.348) (.047)h (.175) (.019)[-.065] [-.189] [.001] [.006] [-.080] [-.085] [-.030] [.038]
Studied Presidency -.463* -0.197 -0.176 -0.954* 0.084 0.011 0.007 -0.016 -0.06 -0.017 0.003 -0.03 .274* 0.051 0.06 .420*(.233) (.076)h (.093) (.029) (.261) (.062) (.126) (.023)[-.171] [-.267] [.025] [-.005] [-.014] [-.003] [.035] [.042]
Studied How Laws are Made -0.259 -0.051 -0.069 -1.98* -0.066 0.033 0.027 -0.014 -0.589 -0.005 -0.004 71.105 0.194 0.073 0.069 0.129(.256) (.137)h (.111) (.028) (.304) (.118) (.141) (.024)[-.096] [-.192] [-.019] [-.004] [-.120] [no effect] [.025] [.018]
Studied Political Parties .735* 0.021 0.03 0.117 0.086 0.028 0.03 0.133 0.212 0.032 0.049 1.92* -0.036 0.05 0.039 0.047(.244) (.093) (.102) (.028) (.273) (.056)h (.134) (.021)[.283] [.038] [.025] [.039] [.052] [.056] [-.004] [.006]
Studied State and Local Gov't. -0.07 0.117 0.097 -0.15 -0.138 0.011 0.005 -0.051 0.234 0.028 0.054 [.002] 0.106 0.054 0.062 .445*(.242) (.124) (.094) (.033) (.273) (.087) (.128) (.021)[-.026] [-.059] [-.040] [-.015] [.058] [.000] [.012] [.045]
a) Civic education variable is the treatment effect. Nearest-neighbor matching methods with replacement were employed. Individual matching analyses were conducted for each of the 6 treatment effects (civics education types).
b) Leaflet 3: Dependent variable=1 if student correctly interpreted what policy the issuers of the leaflet favor.Cartoon 1: Dependent variable=1 if student correctly interpreted a political cartoon about a political leader. c) Coefficients, robust standard errors (in parentheses) and marginal effects (in brackets) from full probit models in Tables 28 and 29.d) ATT= Average Treatment Effect on the Treated, interpreted as percentage points; "Treated" are those that report studying the above civic education topics.e) ATE= Average Treatment Effect.f) Coefficients are from matching-weighted probits. Marginal effects are in brackets.g) Bootstrapped standard errors are in parentheses.
Significance is based on the bias-corrected confidence intervals and the matching-weighted probit analyses. h) Significant in the matching-weighted probit but not the bias-corrected confidence interval. i) Significant in the bias-corrected confidence interval but not the matching-weighted probit. * significant at the α=.05 level. All calculations used the "total weight" as provided in the survey data, except the matching-weighted probits.
Cartoon 1 - All others
Table 56Political Interpretation Skills - Political Leaflets and Cartoons (IEA/CivEd)
Matching Methodsa - African-Americans
Cartoon1 - African-AmericansLeaflet 3 - African-Americans Leaflet 3 - All others

200
Probit Probit Probit ProbitCoefficientc ATTd ATEe Coefficientf Coefficient ATT ATE Coefficient Coefficient ATT ATE Coefficient Coefficient ATT ATE Coefficient(Std. Error) (Std. Error)g (Std. Error) (Std. Error) (Std. Error) (Std. Error) (Std. Error) (Std. Error)
(1) (2) (3) (4) (5) (6) (7) (8) (9) (10) (11) (12) (13) (14) (15) (16)Civic Education variables:
Studied Constitution 0.33 0.095 0.117 0.544 0.008 -0.002 0.001 -0.133 -.741* -0.128 -0.121 -.874* 0.062 0.067 0.06 0.089(.324) (.122) (.125) (.034) (.302) (.099)h (.113) (.039)[.120] [.166] [.002] [-.034] [-.262] [-.282] [.023] [.034]
Studied Congress -0.382 0.162 0.133 0.021 0.177 -0.003 0.001 -0.072 -0.124 -0.005 -0.003 -.549* 0.028 0.081 0.083 .200*(.306) (.095) (.134) (.029) (.300) (.092)h (.119) (.037)[-.127] [.008] [.048] [-.019] [-.047] [-.212] [.010] [.076]
Studied Presidency 0.419 0.089 0.15 .551* 0.168 0.045 0.03 0.003 0.33 0.041 0.109 1.02* 0.034 0.033 0.036 0.102(.240) (.095)h (.097) (.029)i (.236) (.095)h (.087) (.033)[.148] [.120] [.045] [.001] [.128] [.282] [.013] [.038]
Studied How Laws are Made 0.144 0.189 0.16 .683* -0.04 0.004 -0.001 -0.113 0.252 0.091 0.09 -0.007 0.027 0.038 0.047 0.094(.263) (.129) (.115) (.030) (.258) (.134) (.103) (.043)[.051] [.254] [-.010] [-.030] [.098] [-.002] [.010] [.035]
Studied Political Parties -0.22 -0.037 0.007 0.416 -0.044 0.018 0.014 0.157 0.195 0.162 0.137 .498* 0.06 0.104 0.092 .250*(.256) (.082) (.106) (.028) (.247) (.105) (.093) (.036)[-.074] [.105] [-.011] [.041] [.076] [.196] [.022] [.096]
Studied State and Local Gov't. 0.364 0.168 0.151 0.37 -.280* -0.03 -0.034 -.177* 0.242 0.078 0.108 0.557 0.1 0.075 0.078 .222*(.252) (.133) (.099) (.026)h (.239) (.091) (.085) (.033)h
[.131] [.145] [-.070] [-.046] [.094] [.184] [.037] [.084]
a) Civic education variable is the treatment effect. Nearest-neighbor matching methods with replacement were employed. Individual matching analyses were conducted for each of the 6 treatment effects (civics education types).
b) Cartoon 2: Dependent variable =1 if student correctly interpreted a political cartoon about democracy. Read Newspaper 1: Dependent variable =1 if respondent answered "sometimes" or "often" to "How often do you read
articles in the newspaper about what is happening in this country?"c) Coefficients, robust standard errors (in parentheses) and marginal effects (in brackets) from full probit models in Tables 29 and 30.d) ATT= Average Treatment Effect on the Treated, interpreted as percentage points; "Treated" are those that report studying the above civic education topics.e) ATE= Average Treatment Effect.f) Coefficients are from matching-weighted probits. Marginal effects are in brackets.g) Bootstrapped standard errors are in parentheses.
Significance is based on the bias-corrected confidence intervals and the matching-weighted probit analyses. h) Significant in the matching-weighted probit but not the bias-corrected confidence interval. i) Significant in the bias-corrected confidence interval but not the matching-weighted probit. * significant at the α=.05 level. All calculations used the "total weight" as provided in the survey data, except the matching-weighted probits.
Read Newspaper 1 - All others
Table 57Political Interpretation Skills - Political Cartoons and Monitoring the News (IEA/CivEd)
Matching Methodsa - African-Americans
Read Newspaper 1 - African-AmericansCartoon 2 - African-Americans Cartoon 2 - All others

201
Probit Probit Probit ProbitCoefficientc ATTd ATEe Coefficientf Coefficient ATT ATE Coefficient Coefficient ATT ATE Coefficient Coefficient ATT ATE Coefficient(Std. Error) (Std. Error)g (Std. Error) (Std. Error) (Std. Error) (Std. Error) (Std. Error) (Std. Error)
(1) (2) (3) (4) (5) (6) (7) (8) (9) (10) (11) (12) (13) (14) (15) (16)Civic Education variables:
Studied Constitution -0.456 -0.171 -0.143 -0.616 0.179 0.069 0.059 0.111 0.223 0.138 0.099 0.089 .387* 0.083 0.085 .201*(.300) (.096) (.111) (.035) (.317) (.115) (.123) (.037)[-.180] [-.214] [.071] [.044] [.059] [.021] [.112] [.058]
Studied Congress -0.175 -0.162 -0.144 -.851* -0.057 0.059 0.053 0.076 -0.055 0.129 0.114 -0.135 -0.231 0.015 0.03 0.138(.290) (.094)h (.117) (.040) (.336) (.072) (.135) (.028)[-.069] [-.329] [-.022] [.030] [-.013] [-.043] [-.057] [.033]
Studied Presidency 0.226 -0.071 -0.041 -0.045 -0.031 0.04 0.027 0.093 -0.107 0 0.007 0.107 0.027 0.066 0.049 0.03(.225) (.089) (.087) (.037) (.253) (.062) (.098) (.031)i
[.088] [-.018] [-.012] [.037] [-.026] [.024] [.007] [.009]Studied How Laws are Made 0.07 -0.068 -0.049 -0.399 -0.08 -0.004 0.003 0.019 0.265 0.149 0.164 108.41 0.003 0.03 0.04 .202*
(.256) (.139) (.103) (.039) (.284) (.127)i (.114) (.031)[.027] [-.157] [-.031] [.007] [.071] [no effect] [.001] [.050]
Studied Political Parties 0.28 0.108 0.091 0.069 .215* 0.075 0.066 0.131 0.071 0.037 0.038 0.544 0.074 0.056 0.06 .197*(.242) (.106) (.092) (.038) (.271) (.073) (.104) (.030)[.108] [.026] [.085] [.052] [.018] [.016] [.019] [.053]
Studied State and Local Gov't. 0.138 0.061 0.054 -0.294 0.089 0.049 0.05 0.126 -0.198 0.089 0.054 -0.183 0.15 0.072 0.078 .359*(.237) (.119) (.084) (.037) (.265) (.130) (.096) (.028)[.054] [-.116] [.035] [.050] [-.048] [-.040] [.040] [.094]
a) Civic education variable is the treatment effect. Nearest-neighbor matching methods with replacement were employed. Individual matching analyses were conducted for each of the 6 treatment effects (civics education types).
b) Cartoon 2: Dependent variable =1 if student correctly interpreted a political cartoon about democracy. Read Newspaper 1: Dependent variable =1 if respondent answered "sometimes" or "often" to "How often do you read
articles in the newspaper about what is happening in this country?"c) Coefficients, robust standard errors (in parentheses) and marginal effects (in brackets) from full probit models in Table 30.d) ATT= Average Treatment Effect on the Treated, interpreted as percentage points; "Treated" are those that report studying the above civic education topics.e) ATE= Average Treatment Effect.f) Coefficients are from matching-weighted probits. Marginal effects are in brackets.g) Bootstrapped standard errors are in parentheses.
Significance is based on the bias-corrected confidence intervals and the matching-weighted probit analyses. h) Significant in the matching-weighted probit but not the bias-corrected confidence interval. i) Significant in the bias-corrected confidence interval but not the matching-weighted probit. * significant at the α=.05 level. All calculations used the "total weight" as provided in the survey data, except the matching-weighted probits.
Watch TV - All others
Table 58Monitoring the News (IEA/CivEd)
Matching Methodsa - African-Americans
Watch TV - African-AmericansRead Newspaper 2 - African-Americans Read Newspaper 2 - All others

202
Probit Probit Probit ProbitCoefficientc ATTd ATEe Coefficientf Coefficient ATT ATE Coefficient Coefficient ATT ATE Coefficient Coefficient ATT ATE Coefficient(Std. Error) (Std. Error)g (Std. Error) (Std. Error) (Std. Error) (Std. Error) (Std. Error) (Std. Error)
(1) (2) (3) (4) (5) (6) (7) (8) (9) (10) (11) (12) (13) (14) (15) (16)Civic Education variables:
Studied Constitution -0.154 0.033 0.003 -0.331 -0.048 0.071 0.07 .252* 0.104 0.104 0.11 -0.218 0.066 0.058 0.063 .272*(.288) (.123) (.114) (.038) (.297) (.072) (.121) (.033)h
[-.061] [-.115] [-.019] [.097] [.032] [-.003] [.021] [.087]Studied Congress 0.227 0.091 0.034 -0.296 -0.003 0.109 0.102 .230* -0.341 0.07 0.026 -0.358 -0.146 0.077 0.066 .220*
(.284) (.103) (.120) (.039) (.294) (.081) (.129) (.034)[.089] [-.098] [-.001] [.086] [-.114] [-.079] [-.049] [.065]
Studied Presidency 0.014 -0.041 -0.041 -.815* .185* 0.105 0.095 .305* 0.011 -0.173 -0.131 -.748* .226* 0.113 0.099 .382*(.215) (.093)h (.086) (.034) (.231) (.098)h (.094) (.030)[.005] [-.309] [.072] [.116] [.003] [-.243] [.073] [.115]
Studied How Laws are Made -0.13 -0.045 -0.074 -0.525 0.124 0.105 0.1 .263* -0.132 0.04 0.045 0.129 0.085 0.056 0.063 .323*(.250) (.131) (.104) (.040) (.262) (.131) (.111) (.036)[-.051] [-.167] [.048] [.099] [-.043] [.037] [.027] [.106]
Studied Political Parties 0.318 -0.064 -0.068 -.602* 0.145 0.099 0.1 .288* 0.214 0.081 0.125 0.413 0.19 0.093 0.082 0.149(.236) (.102)h (.093) (.032) (.245) (.097) (.100) (.029)i
[.124] [-.228] [.056] [.110] [.066] [.122] [.061] [.045]Studied State and Local Gov't. -.578* 0.089 0.05 0.348 0.047 0.07 0.068 0.124 0.183 0.174 0.136 .637* -0.033 0.039 0.034 0.14
(.235) (.132) (.085) (.031)i (.249) (.109) (.090) (.033)i
[-.227] [.132] [.018] [.047] [.057] [.138] [-.011] [.045]
a) Civic education variable is the treatment effect. Nearest-neighbor matching methods with replacement were employed. Individual matching analyses were conducted for each of the 6 treatment effects (civics education types).
b) Listen: Dependent variable =1 if respondent answered "sometimes" or "often" to "How often do you listen to news broadcasts on the radio?"
Dependent variable =1 if respondent answered "sometimes" or "often" to "How often do you have discussionsof what is happening in U.S. government with people your own age / your parents / your teachers?"
c) Coefficients, robust standard errors (in parentheses) and marginal effects (in brackets) from full probit models in Tables 30 and 31.d) ATT= Average Treatment Effect on the Treated, interpreted as percentage points; "Treated" are those that report studying the above civic education topics.e) ATE= Average Treatment Effect.f) Coefficients are from matching-weighted probits. Marginal effects are in brackets.g) Bootstrapped standard errors are in parentheses.
Significance is based on the bias-corrected confidence intervals and the matching-weighted probit analyses. h) Significant in the matching-weighted probit but not the bias-corrected confidence interval. i) Significant in the bias-corrected confidence interval but not the matching-weighted probit. * significant at the α=.05 level. All calculations used the "total weight" as provided in the survey data, except the matching-weighted probits.
People Own Age - All others
Table 59Monitoring the News and Group Discussion Skills (IEA/CivEd)
Matching Methodsa - African-Americans
People Own Age - African-AmericansListen to Radio - African-Americans Listen to Radio - All others

203
Probit Probit Probit ProbitCoefficientc ATTd ATEe Coefficientf Coefficient ATT ATE Coefficient Coefficient ATT ATE Coefficient Coefficient ATT ATE Coefficient(Std. Error) (Std. Error)g (Std. Error) (Std. Error) (Std. Error) (Std. Error) (Std. Error) (Std. Error)
(1) (2) (3) (4) (5) (6) (7) (8) (9) (10) (11) (12) (13) (14) (15) (16)Civic Education variables:
Studied Constitution -0.342 -0.176 -0.143 -0.008 0.048 0.083 0.096 .460* -0.033 0.095 0.121 .853* 0.067 0.113 0.117 .470*(.295) (.105) (.114) (.038)h (.293) (.126)h (.112) (.040)[-.134] [-.002] [.018] [.176] [-.012] [.273] [.025] [.181]
Studied Congress 0.189 -0.075 -0.064 -.604* 0.12 0.149 0.138 .290* 0.525 0.227 0.197 .533* 0.079 0.119 0.117 .300*(.286) (.073) (.119) (.042) (.294) (.095) (.117) (.041)[.075] [-.235] [.046] [.115] [.201] [.209] [.030] [.118]
Studied Presidency -0.095 -0.101 -0.105 -0.277 .281* 0.14 0.133 .371* -0.439 0.185 0.135 .448* .169* 0.076 0.08 .290*(.214) (.079) (.086) (.035) (.232) (.094) (.086) (.035)[-.037] [-.108] [.109] [.146] [-.162] [.177] [.065] [.111]
Studied How Laws are Made 0.074 -0.04 -0.012 0.132 0.083 0.069 0.079 .250* 0.225 0.212 0.185 2.29* -0.137 0.064 0.056 0.106(.250) (.115) (.103) (.038)h (.248) (.134) (.103) (.036)[.029] [.051] [.032] [.097] [.086] [.720] [-.052] [.041]
Studied Political Parties -0.309 -0.064 -0.061 -0.124 -0.113 0.059 0.071 .240* -0.155 0.059 0.08 0.521 0.05 0.103 0.095 .234*(.235) (.099) (.094) (.037)h (.245) (.102) (.092) (.036)[-.122] [-.049] [-.043] [.092] [-.057] [.179] [.019] [.092]
Studied State and Local Gov't. -0.022 0.011 -0.019 -0.133 0.09 0.103 0.1 .334* 0.297 0.157 0.163 .812* .249* 0.108 0.119 .382*(.231) (.125) (.085) (.032) (.238) (.136)h (.084) (.033)[-.008] [-.053] [.035] [.131] [.113] [.292] [.097] [.146]
a) Civic education variable is the treatment effect. Nearest-neighbor matching methods with replacement were employed. Individual matching analyses were conducted for each of the 6 treatment effects (civics education types).
b) Dependent variable =1 if respondent answered "sometimes" or "often" to "How often do you have discussionsof what is happening in U.S. government with people your own age / your parents / your teachers?"
c) Coefficients, robust standard errors (in parentheses) and marginal effects (in brackets) from full probit models in Table 31.d) ATT= Average Treatment Effect on the Treated, interpreted as percentage points; "Treated" are those that report studying the above civic education topics.e) ATE= Average Treatment Effect.f) Coefficients are from matching-weighted probits. Marginal effects are in brackets.g) Bootstrapped standard errors are in parentheses.
Significance is based on the bias-corrected confidence intervals and the matching-weighted probit analyses. h) Significant in the matching-weighted probit but not the bias-corrected confidence interval. i) Significant in the bias-corrected confidence interval but not the matching-weighted probit. * significant at the α=.05 level. All calculations used the "total weight" as provided in the survey data, except the matching-weighted probits.
Teachers - All others
Table 60Group Discussion Skills (IEA/CivEd)
Matching Methodsa - African-Americans
Teachers - African-AmericansParents - African-Americans Parents - All others

204
Probit Probit Probit ProbitCoefficientc ATTd ATEe Coefficientf Coefficient ATT ATE Coefficient Coefficient ATT ATE Coefficient Coefficient ATT ATE Coefficient(Std. Error) (Std. Error)g (Std. Error) (Std. Error) (Std. Error) (Std. Error) (Std. Error) (Std. Error)
(1) (2) (3) (4) (5) (6) (7) (8) (9) (10) (11) (12) (13) (14) (15) (16)Civic Education variables:
Studied Constitution .899* 0.089 0.113 4.39* 0.135 0.052 0.054 .334* .815* 0.099 0.116 1.68* 0.252 0.063 0.071 .454*(.330) (.083)h (.146) (.027) (.316) (.081)h (.148) (.026)[.241] [.041] [.025] [.052] [.213] [.009] [.045] [.066]
Studied Congress -1.09* 0.108 0.101 0.977 -0.067 0.021 0.025 0.054 0.086 0.158 0.157 0.475 0.061 0.067 0.065 0.178(.409) (.112) (.155) (.026) (.368) (.118) (.160) (.027)i
[-.176] [.331] [-.011] [.010] [.018] [0] [.010] [.035]Studied Presidency .526* 0.18 0.156 .804* 0.208 0.043 0.041 0.04 0.006 0.18 0.122 0.094 0.03 0.034 0.035 0.08
(.264) (.081) (.109) (.025) (.286) (.075)i (.116) (.022)i
[.119] [.219] [.038] [.007] [.001] [.026] [.005] [.013]Studied How Laws are Made 0.12 -0.015 0.032 2.01* 0.116 0.062 0.051 0.098 -0.522 -0.047 -0.008 0.317 0.003 0.041 0.033 0.055
(.336) (.069)h (.125) (.025) (.350) (.070) (.130) (.024)i
[.026] [.082] [.021] [.021] [-.090] [.041] [.001] [.009]Studied Political Parties 0.166 0.118 0.111 1.59* -.344* 0.006 -0.006 -0.18 0.153 0.026 0.061 1.52* -0.198 -0.009 -0.01 -0.14
(.290) (.073) (.124) (.022) (.283) (.062)h (.123) (.021)[.036] [.108] [-.055] [-.037] [.033] [.118] [-.030] [-.024]
Studied State and Local Gov't. -0.314 0.02 0.003 0.311 0.031 0.025 0.029 0.075 0.022 0.053 0.085 1.26* -0.012 0.024 0.03 0.118(.260) (.073) (.115) (.026) (.265) (.072)h (.118) (.025)[-.064] [.069] [.005] [.013] [.004] [.206] [-.002] [.018]
a) Civic education variable is the treatment effect. Nearest-neighbor matching methods with replacement were employed. Individual matching analyses were conducted for each of the 6 treatment effects (civics education types).
b) Leaflet 1: Dependent variable =1 if student correctly interpreted which party issued the political leaflet.Leaflet 2: Dependent variable=1 if student correctly interpreted what leaflet issuers think about taxes.c) Coefficients, robust standard errors (in parentheses) and marginal effects (in brackets) from full probit models in Table 32.d) ATT= Average Treatment Effect on the Treated, interpreted as percentage points; "Treated" are those that report studying the above civic education topics.e) ATE= Average Treatment Effect.f) Coefficients are from matching-weighted probits. Marginal effects are in brackets.g) Bootstrapped standard errors are in parentheses.
Significance is based on the bias-corrected confidence intervals and the matching-weighted probit analyses. h) Significant in the matching-weighted probit but not the bias-corrected confidence interval. i) Significant in the bias-corrected confidence interval but not the matching-weighted probit. * significant at the α=.05 level. All calculations used the "total weight" as provided in the survey data, except the matching-weighted probits.
Leaflet 2 - All others
Table 61Political Interpretation Skills - Political Leaflets (IEA/CivEd)
Matching Methodsa - Latinos
Leaflet 2 - LatinosLeaflet 1 - Latinos Leaflet 1 - All others
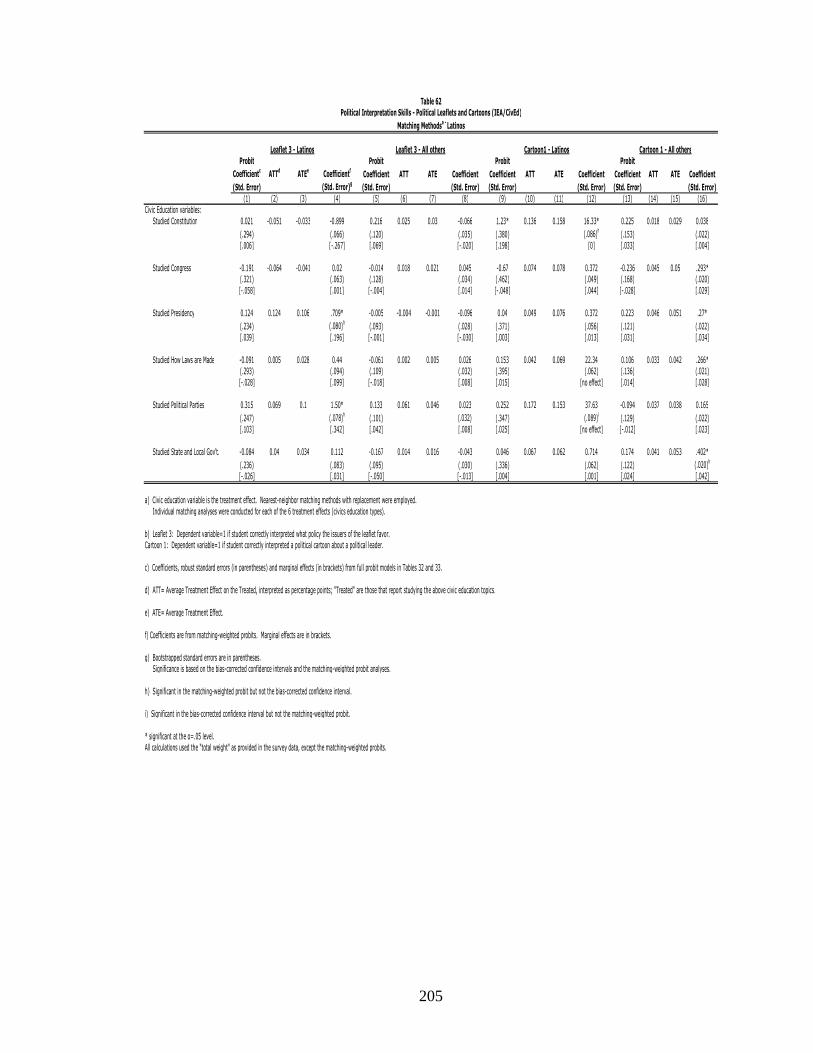
205
Probit Probit Probit ProbitCoefficientc ATTd ATEe Coefficientf Coefficient ATT ATE Coefficient Coefficient ATT ATE Coefficient Coefficient ATT ATE Coefficient(Std. Error) (Std. Error)g (Std. Error) (Std. Error) (Std. Error) (Std. Error) (Std. Error) (Std. Error)
(1) (2) (3) (4) (5) (6) (7) (8) (9) (10) (11) (12) (13) (14) (15) (16)Civic Education variables:
Studied Constitution 0.021 -0.051 -0.033 -0.899 0.216 0.025 0.03 -0.066 1.23* 0.136 0.158 16.33* 0.225 0.018 0.029 0.038(.294) (.066) (.120) (.035) (.380) (.086)h (.153) (.022)[.006] [-.267] [.069] [-.020] [.198] [0] [.033] [.004]
Studied Congress -0.191 -0.064 -0.041 0.02 -0.014 0.018 0.021 0.045 -0.67 0.074 0.078 0.372 -0.236 0.045 0.05 .293*(.321) (.063) (.128) (.034) (.462) (.049) (.168) (.020)[-.058] [.001] [-.004] [.014] [-.048] [.044] [-.028] [.029]
Studied Presidency 0.124 0.124 0.106 .709* -0.005 -0.004 -0.001 -0.096 0.04 0.049 0.076 0.372 0.223 0.046 0.051 .27*(.234) (.080)h (.093) (.028) (.371) (.056) (.121) (.022)[.039] [.196] [-.001] [-.030] [.003] [.013] [.031] [.034]
Studied How Laws are Made -0.091 0.005 0.028 0.44 -0.061 0.002 0.005 0.026 0.153 0.042 0.069 22.34 0.106 0.033 0.042 .266*(.293) (.094) (.109) (.032) (.395) (.062) (.136) (.021)[-.028] [.099] [-.018] [.008] [.015] [no effect] [.014] [.028]
Studied Political Parties 0.315 0.069 0.1 1.50* 0.133 0.061 0.046 0.023 0.252 0.172 0.153 37.63 -0.094 0.037 0.038 0.165(.247) (.078)h (.101) (.032)i (.347) (.089)i (.129) (.022)[.103] [.342] [.042] [.008] [.025] [no effect] [-.012] [.023]
Studied State and Local Gov't. -0.084 0.04 0.034 0.112 -0.167 0.014 0.016 -0.043 0.046 0.067 0.062 0.714 0.174 0.041 0.053 .402*(.236) (.083) (.095) (.030) (.336) (.062) (.122) (.020)h
[-.026] [.031] [-.050] [-.013] [.004] [.001] [.024] [.042]
a) Civic education variable is the treatment effect. Nearest-neighbor matching methods with replacement were employed. Individual matching analyses were conducted for each of the 6 treatment effects (civics education types).
b) Leaflet 3: Dependent variable=1 if student correctly interpreted what policy the issuers of the leaflet favor.Cartoon 1: Dependent variable=1 if student correctly interpreted a political cartoon about a political leader. c) Coefficients, robust standard errors (in parentheses) and marginal effects (in brackets) from full probit models in Tables 32 and 33.d) ATT= Average Treatment Effect on the Treated, interpreted as percentage points; "Treated" are those that report studying the above civic education topics.e) ATE= Average Treatment Effect.f) Coefficients are from matching-weighted probits. Marginal effects are in brackets.g) Bootstrapped standard errors are in parentheses.
Significance is based on the bias-corrected confidence intervals and the matching-weighted probit analyses. h) Significant in the matching-weighted probit but not the bias-corrected confidence interval. i) Significant in the bias-corrected confidence interval but not the matching-weighted probit. * significant at the α=.05 level. All calculations used the "total weight" as provided in the survey data, except the matching-weighted probits.
Cartoon 1 - All others
Table 62Political Interpretation Skills - Political Leaflets and Cartoons (IEA/CivEd)
Matching Methodsa - Latinos
Cartoon1 - LatinosLeaflet 3 - Latinos Leaflet 3 - All others

206
Probit Probit Probit ProbitCoefficientc ATTd ATEe Coefficientf Coefficient ATT ATE Coefficient Coefficient ATT ATE Coefficient Coefficient ATT ATE Coefficient(Std. Error) (Std. Error)g (Std. Error) (Std. Error) (Std. Error) (Std. Error) (Std. Error) (Std. Error)
(1) (2) (3) (4) (5) (6) (7) (8) (9) (10) (11) (12) (13) (14) (15) (16)Civic Education variables:
Studied Constitution 0.124 -0.018 -0.003 0.598 0.028 0.062 0.071 .392* -0.043 -0.108 -0.094 -1.46* -0.008 0.039 0.038 0.011(.327) (.101) (.124) (.034)h (.283) (.099)h (.114) (.039)[.035] [.066] [.007] [.104] [-.016] [-.514] [-.003] [.004]
Studied Congress -0.743 -0.168 -0.146 -.912* 0.251 0.071 0.079 .296* -.712* -0.128 -0.127 -1.055* 0.063 0.08 0.09 .256*(.381) (.097) (.131) (.032) (.311) (.108) (.119) (.036)[-.175] [-.100] [.072] [.083] [-.257] [-.379] [.023] [.094]
Studied Presidency 0.415 0.093 0.03 0.338 0.126 0.043 0.055 .235* 0.166 0.024 0.022 -0.118 0.055 0.038 0.04 0.067(.259) (.081)i (.096) (.028)h (.220) (.087) (.088) (.034)[.119] [.101] [.035] [.061] [.064] [-.044] [.020] [.025]
Studied How Laws are Made 0.089 -0.055 -0.03 -11.67 -0.055 0.033 0.038 0.17 0.536 -0.028 0.002 0.543 0.013 0.105 0.101 .307*(.324) (.094) (.112) (.029) (.281) (.087) (.101) (.034)[.025] [no effect] [-.014] [.046] [.211] [.135] [.005] [.117]
Studied Political Parties -0.276 -0.177 -0.192 -2.49* -0.088 0.018 0.017 0.068 0.015 0.043 0.03 -0.397 0.053 0.092 0.07 0.027(.286) (.066) (.104) (.028) (.232) (.100) (.093) (.036)i
[-.072] [-.033] [-.023] [.018] [.005] [-.157] [.019] [.010]Studied State and Local Gov't. -.538* -0.221 -0.209 -.706* -0.138 0.038 0.041 0.165 0.265 0.06 0.069 0.272 0.107 0.095 0.091 .284*
(.255) (.076)h (.097) (.030) (.223) (.095) (.086) (.032)[-.141] [-.067] [-.036] [.044] [.103] [.104] [.040] [.107]
a) Civic education variable is the treatment effect. Nearest-neighbor matching methods with replacement were employed. Individual matching analyses were conducted for each of the 6 treatment effects (civics education types).
b) Cartoon 2: Dependent variable =1 if student correctly interpreted a political cartoon about democracy. Read Newspaper 1: Dependent variable =1 if respondent answered "sometimes" or "often" to "How often do you read
articles in the newspaper about what is happening in this country?"c) Coefficients, robust standard errors (in parentheses) and marginal effects (in brackets) from full probit models in Tables 33 and 34.d) ATT= Average Treatment Effect on the Treated, interpreted as percentage points; "Treated" are those that report studying the above civic education topics.e) ATE= Average Treatment Effect.f) Coefficients are from matching-weighted probits. Marginal effects are in brackets.g) Bootstrapped standard errors are in parentheses.
Significance is based on the bias-corrected confidence intervals and the matching-weighted probit analyses. h) Significant in the matching-weighted probit but not the bias-corrected confidence interval. i) Significant in the bias-corrected confidence interval but not the matching-weighted probit. * significant at the α=.05 level. All calculations used the "total weight" as provided in the survey data, except the matching-weighted probits.
Read Newspaper 1 - All others
Table 63Political Interpretation Skills - Political Cartoons and Monitoring the News (IEA/CivEd)
Matching Methodsa - Latinos
Read Newspaper 1 - LatinosCartoon 2 - Latinos Cartoon 2 - All others

207
Probit Probit Probit ProbitCoefficientc ATTd ATEe Coefficientf Coefficient ATT ATE Coefficient Coefficient ATT ATE Coefficient Coefficient ATT ATE Coefficient(Std. Error) (Std. Error)g (Std. Error) (Std. Error) (Std. Error) (Std. Error) (Std. Error) (Std. Error)
(1) (2) (3) (4) (5) (6) (7) (8) (9) (10) (11) (12) (13) (14) (15) (16)Civic Education variables:
Studied Constitution 0.248 -0.047 -0.03 -0.142 0.062 -0.004 0.001 -0.067 0.327 0.07 0.045 -0.434 .339* 0.113 0.113 .422*(.271) (.106) (.112) (.041) (.312) (.093) (.124) (.036)[.099] [-.055] [.025] [-.026] [.087] [-.122] [.097] [.123]
Studied Congress -.796* -0.094 -0.093 -0.468 0.048 0.061 0.064 0.146 -0.628 -0.054 -0.048 0.948 -0.188 0.053 0.052 0.153(.304) (.121) (.117) (.041) (.347) (.053) (.135) (.033)[-.297] [-.177] [.019] [.058] [-.133] [0] [-.046] [.042]
Studied Presidency 0.075 0.006 0.019 0.179 -0.02 0.042 0.038 0.122 -0.147 -0.037 0.015 -0.08 0.021 0.021 0.031 0.028(.217) (.082) (.087) (.036) (.271) (.064) (.098) (.026)[.030] [.069] [-.008] [.048] [-.035] [-.010] [.005] [.007]
Studied How Laws are Made 0.278 -0.05 -0.03 0.327 -0.094 0.068 0.068 .267* 0.565 0.047 0.052 0.454 -0.013 0.062 0.061 .227*(.279) (.100) (.101) (.038)h (.303) (.077) (.113) (.027)[.110] [.101] [-.037] [.105] [.163] [.040] [-.003] [.061]
Studied Political Parties -0.193 0.026 0.015 -0.243 .259* 0.119 0.095 0.113 0.177 0.064 0.103 66.33 0.075 0.044 0.045 0.076(.230) (.094) (.092) (.034)i (.261) (.094) (.104) (.027)[-.076] [-.096] [.103] [.045] [.045] [no effect] [.019] [.021]
Studied State and Local Gov't. .463* 0.02 0.062 0.128 0.023 0.083 0.078 .326* 0.274 0.04 0.062 0.95 0.098 0.109 0.096 .346*(.217) (.098) (.085) (.034) (.251) (.077) (.097) (.030)[.182] [.049] [.009] [.129] [.069] [.181] [.026] [.101]
a) Civic education variable is the treatment effect. Nearest-neighbor matching methods with replacement were employed. Individual matching analyses were conducted for each of the 6 treatment effects (civics education types).
b) Cartoon 2: Dependent variable =1 if student correctly interpreted a political cartoon about democracy. Read Newspaper 1: Dependent variable =1 if respondent answered "sometimes" or "often" to "How often do you read
articles in the newspaper about what is happening in this country?"c) Coefficients, robust standard errors (in parentheses) and marginal effects (in brackets) from full probit models in Table 34.d) ATT= Average Treatment Effect on the Treated, interpreted as percentage points; "Treated" are those that report studying the above civic education topics.e) ATE= Average Treatment Effect.f) Coefficients are from matching-weighted probits. Marginal effects are in brackets.g) Bootstrapped standard errors are in parentheses.
Significance is based on the bias-corrected confidence intervals and the matching-weighted probit analyses. h) Significant in the matching-weighted probit but not the bias-corrected confidence interval. i) Significant in the bias-corrected confidence interval but not the matching-weighted probit. * significant at the α=.05 level. All calculations used the "total weight" as provided in the survey data, except the matching-weighted probits.
Watch TV - All others
Table 64Monitoring the News (IEA/CivEd)
Matching Methodsa - Latinos
Watch TV - LatinosRead Newspaper 2 - Latinos Read Newspaper 2 - All others

208
Probit Probit Probit ProbitCoefficientc ATTd ATEe Coefficientf Coefficient ATT ATE Coefficient Coefficient ATT ATE Coefficient Coefficient ATT ATE Coefficient(Std. Error) (Std. Error)g (Std. Error) (Std. Error) (Std. Error) (Std. Error) (Std. Error) (Std. Error)
(1) (2) (3) (4) (5) (6) (7) (8) (9) (10) (11) (12) (13) (14) (15) (16)Civic Education variables:
Studied Constitution -0.025 0.037 0.056 0.391 -0.086 0.045 0.045 0.007 0.521 0.099 0.094 1.38 -0.031 0.032 0.025 -0.079(.287) (.109) (.114) (.040) (.310) (.076) (.122) (.036)[-.009] [.149] [-.034] [.003] [.142] [.052] [-.010] [-.023]
Studied Congress -0.459 0.232 0.176 0.051 0.056 0.114 0.116 .350* -0.512 -0.064 -0.063 -0.378 -0.133 0.059 0.049 .192*(.318) (.109) (.119) (.038) (.343) (.124) (.128) (.035)h
[-.176] [.007] [.022] [.135] [-.169] [-.112] [-.045] [.059]Studied Presidency .506* 0.124 0.133 .540* 0.164 0.04 0.056 0.136 0.296 0.037 0.08 0.191 .198* 0.068 0.066 .222*
(.225) (.080)h (.086) (.035) (.239) (.082) (.093) (.032)h
[.184] [.198] [.064] [.053] [.088] [.063] [.064] [.072]Studied How Laws are Made 0.317 0.126 0.13 1.46* 0.092 0.036 0.041 0.118 .775* 0.152 0.17 1.41* -0.012 0.018 0.018 0.019
(.292) (.100)h (.101) (.040) (.342) (.075)h (.109) (.036)[.114] [.480] [.036] [.046] [.192] [.227] [-.004] [.006]
Studied Political Parties 0.128 0.129 0.126 0.204 .193* 0.086 0.087 .212* -0.36 -0.005 0.023 0.318 .295* 0.078 0.065 0.061(.239) (.083) (.093) (.036) (.262) (.085) (.100) (.031)i
[.047] [.072] [.075] [.082] [-.116] [.096] [.094] [.018]Studied State and Local Gov't. 0.409 0.154 0.189 .943* -0.094 0.041 0.046 .215* 0.202 0.046 0.058 0.206 -0.064 0.02 0.016 -0.024
(.229) (.082)h (.085) (.037) (.244) (.090) (.090) (.033)[.150] [.352] [-.037] [.084] [.061] [.061] [-.021] [-.007]
a) Civic education variable is the treatment effect. Nearest-neighbor matching methods with replacement were employed. Individual matching analyses were conducted for each of the 6 treatment effects (civics education types).
b) Listen: Dependent variable =1 if respondent answered "sometimes" or "often" to "How often do you listen to news broadcasts on the radio?"
Dependent variable =1 if respondent answered "sometimes" or "often" to "How often do you have discussionsof what is happening in U.S. government with people your own age / your parents / your teachers?"
c) Coefficients, robust standard errors (in parentheses) and marginal effects (in brackets) from full probit models in Tables 34 and 35.d) ATT= Average Treatment Effect on the Treated, interpreted as percentage points; "Treated" are those that report studying the above civic education topics.e) ATE= Average Treatment Effect.f) Coefficients are from matching-weighted probits. Marginal effects are in brackets.g) Bootstrapped standard errors are in parentheses.
Significance is based on the bias-corrected confidence intervals and the matching-weighted probit analyses. h) Significant in the matching-weighted probit but not the bias-corrected confidence interval. i) Significant in the bias-corrected confidence interval but not the matching-weighted probit. * significant at the α=.05 level. All calculations used the "total weight" as provided in the survey data, except the matching-weighted probits.
People Own Age - All others
Table 65Monitoring the News and Group Discussion Skills (IEA/CivEd)
Matching Methodsa - Latinos
People Own Age - LatinosListen to Radio - Latinos Listen to Radio - All others

209
Probit Probit Probit ProbitCoefficientc ATTd ATEe Coefficientf Coefficient ATT ATE Coefficient Coefficient ATT ATE Coefficient Coefficient ATT ATE Coefficient(Std. Error) (Std. Error)g (Std. Error) (Std. Error) (Std. Error) (Std. Error) (Std. Error) (Std. Error)
(1) (2) (3) (4) (5) (6) (7) (8) (9) (10) (11) (12) (13) (14) (15) (16)Civic Education variables:
Studied Constitution 0.473 0.066 0.067 -0.513 -0.081 0.016 0.024 0.018 0.044 0.047 0.071 -0.051 0.027 0.102 0.1 .236*(.272) (.107) (.115) (.038) (.283) (.101) (.113) (.041)h
[.187] [-.200] [-.031] [.007] [.016] [-.018] [.010] [.092]Studied Congress -0.156 0.099 0.108 .918* 0.136 0.111 0.107 .217* -0.146 0.272 0.209 0.305 0.158 0.087 0.087 0.134
(.304) (.127)h (.119) (.039) (.308) (.140) (.117) (.043)[-.060] [.344] [.053] [.086] [-.054] [.112] [.061] [.052]
Studied Presidency 0.123 0.099 0.141 .517* .246* 0.068 0.076 .170* 0.116 0.055 0.118 .914* 0.087 0.091 0.104 .386*(.218) (.084)h (.086) (.034)h (.225) (.083)h (.087) (.033)[.048] [.197] [.096] [.066] [.044] [.260] [.033] [.147]
Studied How Laws are Made 0.423 0.192 0.176 0.293 0.05 0.064 0.07 .232* 0.225 0.155 0.156 0.323 -0.102 0.042 0.045 0.125(.281) (.095) (.101) (.033)h (.273) (.100) (.101) (.039)[.167] [.112] [.019] [.090] [.086] [.126] [-.038] [.048]
Studied Political Parties -0.042 -0.059 0.026 .726* -0.143 0.003 0.015 -0.011 0.318 0.064 0.123 .864* 0.008 0.118 0.109 .200*(.233) (.109)h (.094) (.033) (.235) (.111)h (.093) (.037)[-.016] [.186] [-.054] [-.004] [.121] [.262] [.003] [.078]
Studied State and Local Gov't. 0.09 0.127 0.065 0.197 0.104 0.078 0.072 .154* 0.428 0.147 0.151 0.474* .259* 0.143 0.142 .507*(.225) (.093) (.085) (.035)h (.225) (.084)h (.085) (.033)[.035] [.078] [.040] [.061] [.162] [.155] [.100] [.194]
a) Civic education variable is the treatment effect. Nearest-neighbor matching methods with replacement were employed. Individual matching analyses were conducted for each of the 6 treatment effects (civics education types).
b) Dependent variable =1 if respondent answered "sometimes" or "often" to "How often do you have discussionsof what is happening in U.S. government with people your own age / your parents / your teachers?"
c) Coefficients, robust standard errors (in parentheses) and marginal effects (in brackets) from full probit models in Table 35.d) ATT= Average Treatment Effect on the Treated, interpreted as percentage points; "Treated" are those that report studying the above civic education topics.e) ATE= Average Treatment Effect.f) Coefficients are from matching-weighted probits. Marginal effects are in brackets.g) Bootstrapped standard errors are in parentheses.
Significance is based on the bias-corrected confidence intervals and the matching-weighted probit analyses. h) Significant in the matching-weighted probit but not the bias-corrected confidence interval. i) Significant in the bias-corrected confidence interval but not the matching-weighted probit. * significant at the α=.05 level. All calculations used the "total weight" as provided in the survey data, except the matching-weighted probits.
Teachers - All others
Table 66Group Discussion Skills (IEA/CivEd)
Matching Methodsa - Latinos
Teachers - LatinosParents - Latinos Parents - All others

210
Probit Probit Probit ProbitCoefficientc ATTd ATEe Coefficientf Coefficient ATT ATE Coefficient Coefficient ATT ATE Coefficient Coefficient ATT ATE Coefficient(Std. Error) (Std. Error)g (Std. Error) (Std. Error) (Std. Error) (Std. Error) (Std. Error) (Std. Error)
(1) (2) (3) (4) (5) (6) (7) (8) (9) (10) (11) (12) (13) (14) (15) (16)Civic Education variables:
Studied Constitution 0.245 -0.01 0 0.061 0.304 0.06 0.063 0.238 .453* -0.011 0.008 0.303 0.272 0.067 0.08 .514*(.194) (.029) (.178) (.038)i (.197) (.025) (.178) (.037)[.041] [.005] [.071] [.053] [.073] [.015] [.062] [.095]
Studied Congress -0.349 -0.019 -0.023 -.285* -0.185 0.087 0.074 0.029 -0.094 -0.009 -0.009 -0.275 0.109 0.078 0.077 0.144(.208) (.024)h (.200) (.053) (.215) (.022) (.199) (.038)i
[-.046] [-.036] [-.037] [.007] [-.011] [-.028] [.023] [.036]Studied Presidency .279* 0.043 0.055 .382* 0.262 0.065 0.044 -0.055 -0.069 0.023 0.012 0.08 0.099 0.031 0.025 -0.009
(.140) (.029)h (.145) (.040)i (.156) (.025) (.149) (.034)[.045] [.053] [.059] [-.014] [-.008] [.010] [.021] [-.002]
Studied How Laws are Made 0.222 0.019 0.028 0.291 -0.01 0.115 0.092 0.13 -0.001 -0.015 -0.012 -0.021 -0.135 0.071 0.053 0.023(.166) (.035) (.167) (.045)i (.178) (.021) (.169) (.043)i
[.037] [.037] [-.002] [.038] [-.001] -0.001 [-.027] [.006]Studied Political Parties -0.377 -0.026 -0.025 -0.269 -0.161 0.026 0.016 -0.108 -0.207 -0.01 -0.013 -0.105 -0.115 -0.006 0.002 -0.18
(.171) (.028) (.151) (.036) (.174) (.022) (.150) (.030)[-.050] [-.030] [-.033] [-.026] [-.024] [-.009] [-.023] [-.037]
Studied State and Local Gov't. -0.045 0.033 0.017 -0.261 -0.037 0.069 0.058 0.042 -0.122 -0.009 -0.012 -0.23 0.043 0.018 0.019 -0.055(.155) (.037) (.144) (.045) (.164) (.027) (.143) (.032)[-.006] [-.054] [-.008] [.010] [-.015] [-.028] [.009] [-.012]
a) Civic education variable is the treatment effect. Nearest-neighbor matching methods with replacement were employed. Individual matching analyses were conducted for each of the 6 treatment effects (civics education types).
b) Leaflet 1: Dependent variable =1 if student correctly interpreted which party issued the political leaflet.Leaflet 2: Dependent variable=1 if student correctly interpreted what leaflet issuers think about taxes.c) Coefficients, robust standard errors (in parentheses) and marginal effects (in brackets) from full probit models in Table 36.d) ATT= Average Treatment Effect on the Treated, interpreted as percentage points; "Treated" are those that report studying the above civic education topics.e) ATE= Average Treatment Effect.f) Coefficients are from matching-weighted probits. Marginal effects are in brackets.g) Bootstrapped standard errors are in parentheses.
Significance is based on the bias-corrected confidence intervals and the matching-weighted probit analyses. h) Significant in the matching-weighted probit but not the bias-corrected confidence interval. i) Significant in the bias-corrected confidence interval but not the matching-weighted probit. * significant at the α=.05 level. All calculations used the "total weight" as provided in the survey data, except the matching-weighted probits.
Leaflet 2 - Males
Table 67Political Interpretation Skills - Political Leaflets (IEA/CivEd)
Matching Methodsa - Females
Leaflet 2 - FemalesLeaflet 1 - Females Leaflet 1 - Males
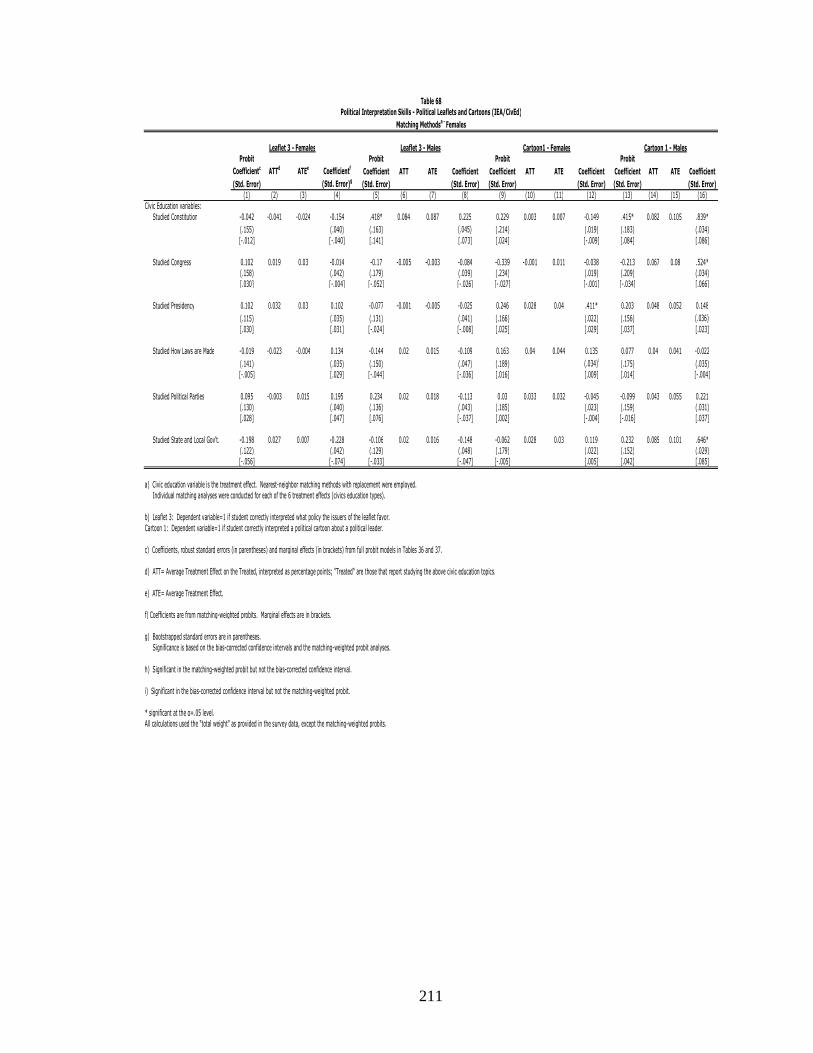
211
Probit Probit Probit ProbitCoefficientc ATTd ATEe Coefficientf Coefficient ATT ATE Coefficient Coefficient ATT ATE Coefficient Coefficient ATT ATE Coefficient(Std. Error) (Std. Error)g (Std. Error) (Std. Error) (Std. Error) (Std. Error) (Std. Error) (Std. Error)
(1) (2) (3) (4) (5) (6) (7) (8) (9) (10) (11) (12) (13) (14) (15) (16)Civic Education variables:
Studied Constitution -0.042 -0.041 -0.024 -0.154 .418* 0.084 0.087 0.225 0.229 0.003 0.007 -0.149 .415* 0.082 0.105 .839*(.155) (.040) (.163) (.045)i (.214) (.019) (.183) (.034)[-.012] [-.040] [.141] [.073] [.024] [-.009] [.084] [.086]
Studied Congress 0.102 0.019 0.03 -0.014 -0.17 -0.005 -0.003 -0.084 -0.339 -0.001 0.011 -0.038 -0.213 0.067 0.08 .524*(.158) (.042) (.179) (.039) (.234) (.019) (.209) (.034)[.030] [-.004] [-.052] [-.026] [-.027] [-.001] [-.034] [.066]
Studied Presidency 0.102 0.032 0.03 0.102 -0.077 -0.001 -0.005 -0.025 0.246 0.028 0.04 .411* 0.203 0.048 0.052 0.148(.115) (.035) (.131) (.041) (.166) (.022) (.156) (.036)i
[.030] [.031] [-.024] [-.008] [.025] [.029] [.037] [.023]Studied How Laws are Made -0.019 -0.023 -0.004 0.134 -0.144 0.02 0.015 -0.109 0.163 0.04 0.044 0.135 0.077 0.04 0.041 -0.022
(.141) (.035) (.150) (.047) (.189) (.034)i (.175) (.035)[-.005] [.029] [-.044] [-.036] [.016] [.009] [.014] [-.004]
Studied Political Parties 0.095 -0.003 0.015 0.195 0.234 0.02 0.018 -0.113 0.03 0.033 0.032 -0.045 -0.099 0.043 0.055 0.221(.130) (.040) (.136) (.043) (.185) (.023) (.159) (.031)[.028] [.047] [.076] [-.037] [.002] [-.004] [-.016] [.037]
Studied State and Local Gov't. -0.198 0.027 0.007 -0.228 -0.106 0.02 0.016 -0.148 -0.062 0.028 0.03 0.119 0.232 0.085 0.101 .646*(.122) (.042) (.129) (.048) (.179) (.022) (.152) (.029)[-.056] [-.074] [-.033] [-.047] [-.005] [.005] [.042] [.085]
a) Civic education variable is the treatment effect. Nearest-neighbor matching methods with replacement were employed. Individual matching analyses were conducted for each of the 6 treatment effects (civics education types).
b) Leaflet 3: Dependent variable=1 if student correctly interpreted what policy the issuers of the leaflet favor.Cartoon 1: Dependent variable=1 if student correctly interpreted a political cartoon about a political leader. c) Coefficients, robust standard errors (in parentheses) and marginal effects (in brackets) from full probit models in Tables 36 and 37.d) ATT= Average Treatment Effect on the Treated, interpreted as percentage points; "Treated" are those that report studying the above civic education topics.e) ATE= Average Treatment Effect.f) Coefficients are from matching-weighted probits. Marginal effects are in brackets.g) Bootstrapped standard errors are in parentheses.
Significance is based on the bias-corrected confidence intervals and the matching-weighted probit analyses. h) Significant in the matching-weighted probit but not the bias-corrected confidence interval. i) Significant in the bias-corrected confidence interval but not the matching-weighted probit. * significant at the α=.05 level. All calculations used the "total weight" as provided in the survey data, except the matching-weighted probits.
Cartoon 1 - Males
Table 68Political Interpretation Skills - Political Leaflets and Cartoons (IEA/CivEd)
Matching Methodsa - Females
Cartoon1 - FemalesLeaflet 3 - Females Leaflet 3 - Males

212
Probit Probit Probit ProbitCoefficientc ATTd ATEe Coefficientf Coefficient ATT ATE Coefficient Coefficient ATT ATE Coefficient Coefficient ATT ATE Coefficient(Std. Error) (Std. Error)g (Std. Error) (Std. Error) (Std. Error) (Std. Error) (Std. Error) (Std. Error)
(1) (2) (3) (4) (5) (6) (7) (8) (9) (10) (11) (12) (13) (14) (15) (16)Civic Education variables:
Studied Constitution 0.263 0.046 0.053 .301* -0.066 -0.003 0.016 0.11 -0.138 -0.008 -0.003 -0.001 0.056 0.076 0.086 .348*(.163) (.040)h (.164) (.041) (.146) (.051) (.153) (.052)h
[.073] [.072] [-.018] [.024] [-.050] [-.001] [.021] [.130]Studied Congress 0.043 0.015 0.011 -0.002 0.136 0.067 0.065 0.074 -0.011 0.003 -0.009 -.328* 0.033 0.117 0.098 .251*
(.172) (.041) (.179) (.054) (.147) (.047)h (.166) (.059)h
[.011] [-.001] [.039] [.022] [-.004] [-.124] [.012] [.099]Studied Presidency 0.082 0.037 0.046 .302* 0.233 0.042 0.047 0.039 0.077 -0.002 0.005 0.026 0.058 0.097 0.091 .289*
(.123) (.036)h (.131) (.042) (.108) (.042) (.123) (.047)h
[.021] [.075] [.068] [.011] [.028] [.009] [.022] [.112]Studied How Laws are Made 0.062 0.018 0.02 -0.027 -0.103 0.021 0.002 -.298* 0.069 0.06 0.064 0.188 -0.012 0.167 0.17 .491*
(.147) (.049) (.151) (.044)h (.130) (.042) (.139) (.048)[.016] [-.006] [-.028] [-.092] [.026] [.069] [-.004] [.191]
Studied Political Parties -0.164 0.006 0.014 0.212 -0.058 0.014 0.012 -.307* -0.044 -0.006 0 -0.069 0.228 0.123 0.128 .347*(.139) (.037) (.139) (.039)h (.118) (.048) (.127) (.057)h
[-.040] [.047] [-.016] [-.090] [-.016] [-.024] [.087] [.134]Studied State and Local Gov't. -0.233 -0.019 -0.027 -0.224 -0.1 0.048 0.025 -0.164 0.145 0.096 0.097 .349* 0.089 0.128 0.109 .197*
(.129) (.041) (.130) (.048) (.109) (.047) (.118) (.056)[-.057] [-.062] [-.028] [-.051] [.054] [.129] [.033] [.077]
a) Civic education variable is the treatment effect. Nearest-neighbor matching methods with replacement were employed. Individual matching analyses were conducted for each of the 6 treatment effects (civics education types).
b) Cartoon 2: Dependent variable =1 if student correctly interpreted a political cartoon about democracy. Read Newspaper 1: Dependent variable =1 if respondent answered "sometimes" or "often" to "How often do you read
articles in the newspaper about what is happening in this country?"c) Coefficients, robust standard errors (in parentheses) and marginal effects (in brackets) from full probit models in Tables 37 and 38.d) ATT= Average Treatment Effect on the Treated, interpreted as percentage points; "Treated" are those that report studying the above civic education topics.e) ATE= Average Treatment Effect.f) Coefficients are from matching-weighted probits. Marginal effects are in brackets.g) Bootstrapped standard errors are in parentheses.
Significance is based on the bias-corrected confidence intervals and the matching-weighted probit analyses. h) Significant in the matching-weighted probit but not the bias-corrected confidence interval. i) Significant in the bias-corrected confidence interval but not the matching-weighted probit. * significant at the α=.05 level. All calculations used the "total weight" as provided in the survey data, except the matching-weighted probits.
Read Newspaper 1 - Males
Table 69Political Interpretation Skills - Political Cartoons and Monitoring the News (IEA/CivEd)
Matching Methodsa - Females
Read Newspaper 1 - FemalesCartoon 2 - Females Cartoon 2 - Males
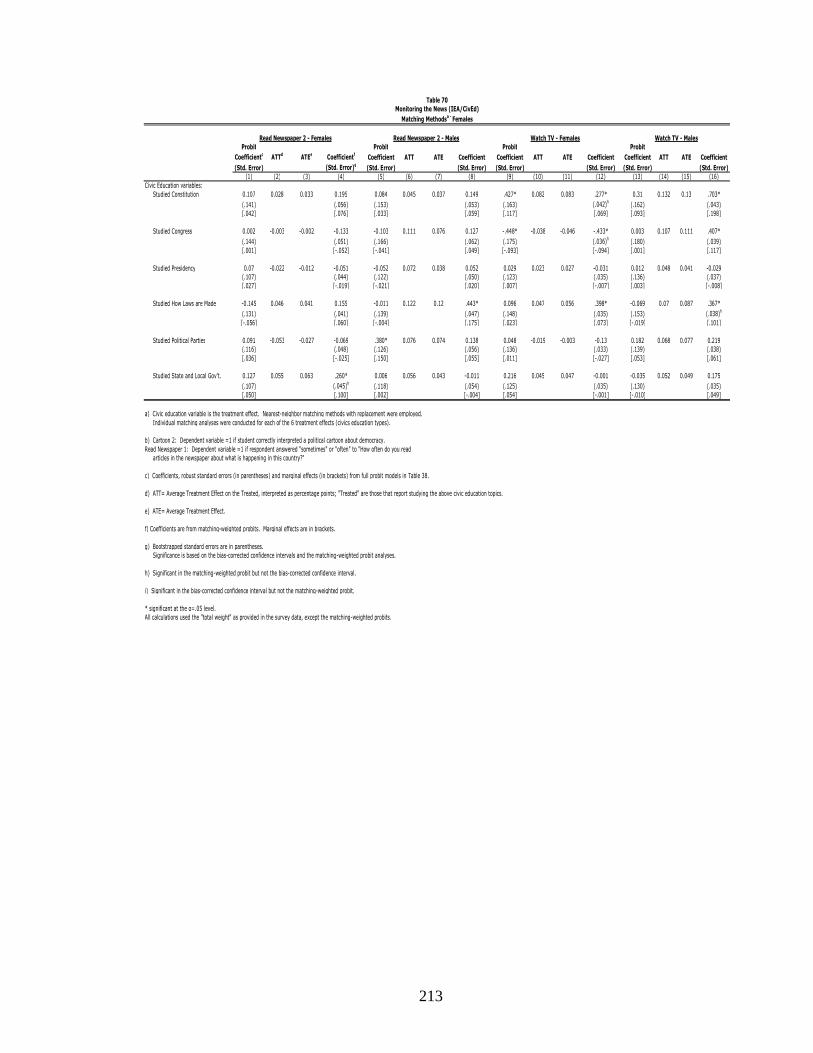
213
Probit Probit Probit ProbitCoefficientc ATTd ATEe Coefficientf Coefficient ATT ATE Coefficient Coefficient ATT ATE Coefficient Coefficient ATT ATE Coefficient(Std. Error) (Std. Error)g (Std. Error) (Std. Error) (Std. Error) (Std. Error) (Std. Error) (Std. Error)
(1) (2) (3) (4) (5) (6) (7) (8) (9) (10) (11) (12) (13) (14) (15) (16)Civic Education variables:
Studied Constitution 0.107 0.028 0.033 0.195 0.084 0.045 0.037 0.149 .427* 0.082 0.083 .277* 0.31 0.132 0.13 .703*(.141) (.056) (.153) (.053) (.163) (.042)h (.162) (.043)[.042] [.076] [.033] [.059] [.117] [.069] [.093] [.198]
Studied Congress 0.002 -0.003 -0.002 -0.133 -0.103 0.111 0.076 0.127 -.448* -0.038 -0.046 -.433* 0.003 0.107 0.111 .407*(.144) (.051) (.166) (.062) (.175) (.036)h (.180) (.039)[.001] [-.052] [-.041] [.049] [-.093] [-.094] [.001] [.117]
Studied Presidency 0.07 -0.022 -0.012 -0.051 -0.052 0.072 0.038 0.052 0.029 0.023 0.027 -0.031 0.012 0.048 0.041 -0.029(.107) (.044) (.122) (.050) (.123) (.035) (.136) (.037)[.027] [-.019] [-.021] [.020] [.007] [-.007] [.003] [-.008]
Studied How Laws are Made -0.145 0.046 0.041 0.155 -0.011 0.122 0.12 .443* 0.096 0.047 0.056 .398* -0.069 0.07 0.087 .367*(.131) (.041) (.139) (.047) (.148) (.035) (.153) (.038)h
[-.056] [.060] [-.004] [.175] [.023] [.073] [-.019] [.101]Studied Political Parties 0.091 -0.053 -0.027 -0.069 .380* 0.076 0.074 0.138 0.048 -0.019 -0.003 -0.13 0.182 0.068 0.077 0.219
(.116) (.048) (.126) (.056) (.136) (.033) (.139) (.038)[.036] [-.025] [.150] [.055] [.011] [-.027] [.053] [.061]
Studied State and Local Gov't. 0.127 0.055 0.063 .260* 0.006 0.056 0.043 -0.011 0.216 0.045 0.047 -0.001 -0.035 0.052 0.049 0.175(.107) (.045)h (.118) (.054) (.125) (.035) (.130) (.035)[.050] [.100] [.002] [-.004] [.054] [-.001] [-.010] [.049]
a) Civic education variable is the treatment effect. Nearest-neighbor matching methods with replacement were employed. Individual matching analyses were conducted for each of the 6 treatment effects (civics education types).
b) Cartoon 2: Dependent variable =1 if student correctly interpreted a political cartoon about democracy. Read Newspaper 1: Dependent variable =1 if respondent answered "sometimes" or "often" to "How often do you read
articles in the newspaper about what is happening in this country?"c) Coefficients, robust standard errors (in parentheses) and marginal effects (in brackets) from full probit models in Table 38.d) ATT= Average Treatment Effect on the Treated, interpreted as percentage points; "Treated" are those that report studying the above civic education topics.e) ATE= Average Treatment Effect.f) Coefficients are from matching-weighted probits. Marginal effects are in brackets.g) Bootstrapped standard errors are in parentheses.
Significance is based on the bias-corrected confidence intervals and the matching-weighted probit analyses. h) Significant in the matching-weighted probit but not the bias-corrected confidence interval. i) Significant in the bias-corrected confidence interval but not the matching-weighted probit. * significant at the α=.05 level. All calculations used the "total weight" as provided in the survey data, except the matching-weighted probits.
Watch TV - Males
Table 70Monitoring the News (IEA/CivEd)
Matching Methodsa - Females
Watch TV - FemalesRead Newspaper 2 - Females Read Newspaper 2 - Males

214
Probit Probit Probit ProbitCoefficientc ATTd ATEe Coefficientf Coefficient ATT ATE Coefficient Coefficient ATT ATE Coefficient Coefficient ATT ATE Coefficient(Std. Error) (Std. Error)g (Std. Error) (Std. Error) (Std. Error) (Std. Error) (Std. Error) (Std. Error)
(1) (2) (3) (4) (5) (6) (7) (8) (9) (10) (11) (12) (13) (14) (15) (16)Civic Education variables:
Studied Constitution 0.104 0.138 0.135 .464* -.335* 0.1 0.08 .278* 0.124 0.07 0.082 .329* -0.077 0.047 0.049 .383*(.142) (.048) (.162) (.044) (.157) (.048)h (.164) (.043)h
[.041] [.180] [-.129] [.097] [.039] [.105] [-.026] [.118]Studied Congress -0.037 0.099 0.075 -0.113 0.14 0.069 0.084 .362* -0.078 0.085 0.071 0.145 -0.24 0.034 0.015 -0.146
(.145) (.047) (.176) (.061)h (.161) (.043) (.179) (.051)[-.015] [-.042] [.052] [.135] [-.026] [.042] [-.082] [-.041]
Studied Presidency .296* 0.127 0.133 .325* 0.009 0.064 0.042 0.057 0.211 0.119 0.106 .379* 0.186 0.063 0.042 -0.013(.105) (.044) (.125) (.047) (.116) (.034) (.132) (.043)[.117] [.128] [.003] [.020] [.067] [.112] [.060] [-.004]
Studied How Laws are Made 0.134 0.104 0.123 .543* 0.071 0.112 0.093 0.163 0.184 0.068 0.073 0.179 -0.131 0.034 0.028 0.049(.128) (.047)h (.146) (.048) (.144) (.044) (.149) (.048)[.053] [.214] [.026] [.053] [.058] [.053] [-.044] [.014]
Studied Political Parties 0.062 0.082 0.08 0.133 .415* 0.126 0.122 .324* 0.074 0.033 0.033 .269* .485* 0.137 0.117 .438*(.116) (.045) (.133) (.048)h (.125) (.044)h (.140) (.038)[.025] [.052] [.150] [.116] [.024] [.086] [.150] [.119]
Studied State and Local Gov't. -0.065 0.026 0.018 -0.035 0.068 0.101 0.099 .301* -0.131 0.005 0.017 .295* 0.064 0.052 0.044 0.063(.107) (.048) (.122) (.058)h (.113) (.043)h (.128) (.047)[-.025] [-.014] [.025] [.111] [-.043] [.099] [.021] [.019]
a) Civic education variable is the treatment effect. Nearest-neighbor matching methods with replacement were employed. Individual matching analyses were conducted for each of the 6 treatment effects (civics education types).
b) Listen: Dependent variable =1 if respondent answered "sometimes" or "often" to "How often do you listen to news broadcasts on the radio?"
Dependent variable =1 if respondent answered "sometimes" or "often" to "How often do you have discussionsof what is happening in U.S. government with people your own age / your parents / your teachers?"
c) Coefficients, robust standard errors (in parentheses) and marginal effects (in brackets) from full probit models in Tables 38 and 39.d) ATT= Average Treatment Effect on the Treated, interpreted as percentage points; "Treated" are those that report studying the above civic education topics.e) ATE= Average Treatment Effect.f) Coefficients are from matching-weighted probits. Marginal effects are in brackets.g) Bootstrapped standard errors are in parentheses.
Significance is based on the bias-corrected confidence intervals and the matching-weighted probit analyses. h) Significant in the matching-weighted probit but not the bias-corrected confidence interval. i) Significant in the bias-corrected confidence interval but not the matching-weighted probit. * significant at the α=.05 level. All calculations used the "total weight" as provided in the survey data, except the matching-weighted probits.
People Own Age - Males
Table 71Monitoring the News and Group Discussion Skills (IEA/CivEd)
Matching Methodsa - Females
People Own Age - FemalesListen to Radio - Females Listen to Radio - Males

215
Probit Probit Probit ProbitCoefficientc ATTd ATEe Coefficientf Coefficient ATT ATE Coefficient Coefficient ATT ATE Coefficient Coefficient ATT ATE Coefficient(Std. Error) (Std. Error)g (Std. Error) (Std. Error) (Std. Error) (Std. Error) (Std. Error) (Std. Error)
(1) (2) (3) (4) (5) (6) (7) (8) (9) (10) (11) (12) (13) (14) (15) (16)Civic Education variables:
Studied Constitution 0.057 0.061 0.059 0.103 -0.142 0.066 0.07 .396* 0.075 0.105 0.111 .501* -0.034 0.044 0.062 .308*(.145) (.044) (.158) (.050)h (.144) (.054) (.153) (.047)h
[.022] [.040] [-.055] [.155] [.028] [.186] [-.013] [.117]Studied Congress -0.006 0.051 0.036 -0.125 .343* 0.19 0.155 .336* 0.173 0.09 0.084 0.168 0.082 0.105 0.101 .329*
(.146) (.050) (.169) (.061) (.145) (.049) (.165) (.054)[-.002] [-.049] [.135] [.130] [.066] [.065] [.032] [.130]
Studied Presidency .244* 0.172 0.144 .435* 0.214 0.216 0.174 .554* 0.095 0.108 0.118 .530* 0.138 0.076 0.107 .450*(.106) (.043) (.122) (.047) (.108) (.041) (.120) (.047)h
[.093] [.171] [.084] [.216] [.036] [.193] [.054] [.172]Studied How Laws are Made 0.005 0.02 0.026 -0.071 0.189 0.135 0.141 .428* -0.149 0.08 0.078 .242* -0.037 0.058 0.063 .267*
(.129) (.044) (.140) (.050) (.131) (.053) (.138) (.050)h
[.002] [-.027] [.075] [.169] [-.054] [.092] [-.014] --Studied Political Parties -0.106 -0.026 -0.008 -0.021 -0.121 0.048 0.055 0.192 0.043 0.145 0.149 .491* 0.043 0.137 0.123 .294*
(.118) (.044) (.130) (.045) (.119) (.047) (.125) (.052)[-.039] [-.007] [-.047] [.076] [.016] [.187] [.017] [.117]
Studied State and Local Gov't. .218* 0.11 0.117 .432* -0.151 0.146 0.118 .320* 0.212 0.117 0.129 .474* .294* 0.122 0.135 .425*(.108) (.045) (.120) (.053) (.109) (.040) (.116) (.051)[.083] [.164] [-.059] [.126] [.080] [.174] [.116] [.165]
a) Civic education variable is the treatment effect. Nearest-neighbor matching methods with replacement were employed. Individual matching analyses were conducted for each of the 6 treatment effects (civics education types).
b) Dependent variable =1 if respondent answered "sometimes" or "often" to "How often do you have discussionsof what is happening in U.S. government with people your own age / your parents / your teachers?"
c) Coefficients, robust standard errors (in parentheses) and marginal effects (in brackets) from full probit models in Table 39.d) ATT= Average Treatment Effect on the Treated, interpreted as percentage points; "Treated" are those that report studying the above civic education topics.e) ATE= Average Treatment Effect.f) Coefficients are from matching-weighted probits. Marginal effects are in brackets.g) Bootstrapped standard errors are in parentheses.
Significance is based on the bias-corrected confidence intervals and the matching-weighted probit analyses. h) Significant in the matching-weighted probit but not the bias-corrected confidence interval. i) Significant in the bias-corrected confidence interval but not the matching-weighted probit. * significant at the α=.05 level. All calculations used the "total weight" as provided in the survey data, except the matching-weighted probits.
Teachers - Males
Table 72Group Discussion Skills (IEA/CivEd)
Matching Methodsa - Females
Teachers - FemalesParents - Females Parents - Males

216
Probit Probit Probit ProbitCoefficientc ATTd ATEe Coefficientf Coefficient ATT ATE Coefficient Coefficient ATT ATE Coefficient Coefficient ATT ATE Coefficient(Std. Error) (Std. Error)g (Std. Error) (Std. Error) (Std. Error) (Std. Error) (Std. Error) (Std. Error)
(1) (2) (3) (4) (5) (6) (7) (8) (9) (10) (11) (12) (13) (14) (15) (16)Civic Education variables:
Studied Constitution 0.373 0.048 0.048 0.097 0.261 0.122 0.107 .468* 0.23 0.061 0.061 .388* .514* 0.118 0.111 .328*(.197) (.028)i (.177) (.058)h (.193) (.028) (.183) (.054)h
[.055] [.009] [.085] [.155] [.031] [.042] [.158] [.106]Studied Congress -0.417 0.041 0.037 .281* -0.228 0.079 0.059 0.218 0.097 0.049 0.045 0.218 -0.174 0.094 0.083 .284*
(.215) (.028) (.203) (.057) (.201) (.024)i (.214) (.058)h
[-.042] [.032] [-.070] [.071] [.012] [.022] [-.048] [.087]Studied Presidency 0.237 0.027 0.021 -0.086 .306* 0.148 0.124 .335* 0.072 -0.003 -0.002 -.268* -0.006 0.077 0.059 0.088
(.140) (.025) (.150) (.053) (.144) (.021)h (.163) (.057)[.031] [-.014] [.097] [.110] [.009] [-.033] [-.001] [.027]
Studied How Laws are Made .491* 0.045 0.053 .442* -0.133 0.023 0.025 -0.033 0.083 0.023 0.028 0.276 -0.177 0.081 0.07 .321*(.167) (.025)h (.167) (.058) (.168) (.051)i (.177) (.063)h
[.076] [.045] [-.041] [-.010] [.010] [.021] [-.048] [.094]Studied Political Parties -.510* -0.001 -0.01 -.299* -0.053 0.055 0.046 0.234 -.321* -0.012 -0.011 -0.169 0.12 0.031 0.043 0.162
(.174) (.027)h (.156) (.053) (.158) (.021) (.167) (.055)[-.051] [-.042] [-.016] [.073] [-.034] [-.019] [.034] [.045]
Studied State and Local Gov't. -0.15 0.031 0.02 0.08 0.193 0.087 0.084 0.058 -0.055 0.008 -0.004 -0.182 0.08 0.069 0.083 0.121(.153) (.027) (.152) (.058) (.145) (.026) (.163) (.061)[-.017] [.010] [.062] [.019] [-.006] [-.026] [.023] [.033]
"College" are those students who expect to complete a four-year college degree. a) Civic education variable is the treatment effect. Nearest-neighbor matching methods with replacement were employed.
Individual matching analyses were conducted for each of the 6 treatment effects (civics education types).b) Leaflet 1: Dependent variable =1 if student correctly interpreted which party issued the political leaflet.Leaflet 2: Dependent variable=1 if student correctly interpreted what leaflet issuers think about taxes.c) Coefficients, robust standard errors (in parentheses) and marginal effects (in brackets) from full probit models in Table 40.d) ATT= Average Treatment Effect on the Treated, interpreted as percentage points; "Treated" are those that report studying the above civic education topics.e) ATE= Average Treatment Effect.f) Coefficients are from matching-weighted probits. Marginal effects are in brackets.g) Bootstrapped standard errors are in parentheses.
Significance is based on the bias-corrected confidence intervals and the matching-weighted probit analyses. h) Significant in the matching-weighted probit but not the bias-corrected confidence interval. i) Significant in the bias-corrected confidence interval but not the matching-weighted probit. * significant at the α=.05 level. All calculations used the "total weight" as provided in the survey data, except the matching-weighted probits.
Leaflet 2 - Non-College
Table 73Political Interpretation Skills - Political Leaflets (IEA/CivEd)
Matching Methodsa - Non-College
Leaflet 2 - CollegeLeaflet 1 - College Leaflet 1 - Non-College

217
Probit Probit Probit ProbitCoefficientc ATTd ATEe Coefficientf Coefficient ATT ATE Coefficient Coefficient ATT ATE Coefficient Coefficient ATT ATE Coefficient(Std. Error) (Std. Error)g (Std. Error) (Std. Error) (Std. Error) (Std. Error) (Std. Error) (Std. Error)
(1) (2) (3) (4) (5) (6) (7) (8) (9) (10) (11) (12) (13) (14) (15) (16)Civic Education variables:
Studied Constitution -0.033 0.009 0.007 -0.031 .458* 0.129 0.126 .342* 0.36 0.021 0.028 0.194 .416* 0.152 0.129 0.269(.152) (.034) (.166) (.064) (.209) (.025) (.186) (.050)i
[-.009] [-.007] [.176] [.132] [.043] [.012] [.100] [.077]Studied Congress 0.025 0.044 0.033 -0.002 -0.091 0.076 0.087 .292* -0.272 0.018 0.023 0.071 -0.413 0.021 0.05 0.141
(.154) (.038) (.188) (.070)h (.227) (.022) (.218) (.037)[.007] [-.001] [-.034] [.109] [-.023] [.004] [-.082] [.024]
Studied Presidency 0.103 0.042 0.035 0.147 -0.09 0.136 0.078 0.21 0.043 0.045 0.035 0.047 .446* 0.102 0.1 .335*(.108) (.030) (.144) (.058)i (.157) (.022)i (.170) (.049)[.028] [.041] [-.033] [.083] [.004] [.006] [.100] [.081]
Studied How Laws are Made -0.029 -0.001 -0.005 -0.067 -0.185 0.042 0.033 0.076 0.25 0.034 0.037 0.185 0.098 0.145 0.131 .410*(.133) (.039) (.160) (.063) (.179) (.025) (.184) (.057)[-.007] [-.018] [-.068] [.029] [.028] [.012] [.021] [.099]
Studied Political Parties 0.146 0.019 0.011 0.01 0.275 0.122 0.114 .373* -0.192 0.023 0.017 -0.173 0.102 0.122 0.117 .573*(.121) (.032) (.149) (.061)h (.170) (.026)i (.172) (.051)[.041] [.002] [.104] [.142] [-.017] [-.016] [.022] [.124]
Studied State and Local Gov't. -.266* -0.036 -0.042 -.253* 0.045 0.089 0.093 0.036 0.061 0.045 0.044 .295* 0.189 0.082 0.109 .466*(.114) (.031)h (.143) (.061) (.155) (.022) (.169) (.054)[-.068] [-.069] [.017] [.013] [.006] [.026] [.042] [.090]
"College" are those students who expect to complete a four-year college degree. a) Civic education variable is the treatment effect. Nearest-neighbor matching methods with replacement were employed.
Individual matching analyses were conducted for each of the 6 treatment effects (civics education types).b) Leaflet 3: Dependent variable=1 if student correctly interpreted what policy the issuers of the leaflet favor.Cartoon 1: Dependent variable=1 if student correctly interpreted a political cartoon about a political leader. c) Coefficients, robust standard errors (in parentheses) and marginal effects (in brackets) from full probit models in Tables 40 and 41.d) ATT= Average Treatment Effect on the Treated, interpreted as percentage points; "Treated" are those that report studying the above civic education topics.e) ATE= Average Treatment Effect.f) Coefficients are from matching-weighted probits. Marginal effects are in brackets.g) Bootstrapped standard errors are in parentheses.
Significance is based on the bias-corrected confidence intervals and the matching-weighted probit analyses. h) Significant in the matching-weighted probit but not the bias-corrected confidence interval. i) Significant in the bias-corrected confidence interval but not the matching-weighted probit. * significant at the α=.05 level. All calculations used the "total weight" as provided in the survey data, except the matching-weighted probits.
Cartoon 1 - Non-College
Table 74Political Interpretation Skills - Political Leaflets and Cartoons (IEA/CivEd)
Matching Methodsa - Non-College
Cartoon 1 - CollegeLeaflet 3 - College Leaflet 3 - Non-College

218
Probit Probit Probit ProbitCoefficientc ATTd ATEe Coefficientf Coefficient ATT ATE Coefficient Coefficient ATT ATE Coefficient Coefficient ATT ATE Coefficient(Std. Error) (Std. Error)g (Std. Error) (Std. Error) (Std. Error) (Std. Error) (Std. Error) (Std. Error)
(1) (2) (3) (4) (5) (6) (7) (8) (9) (10) (11) (12) (13) (14) (15) (16)Civic Education variables:
Studied Constitution 0.268 0.129 0.12 .430* -0.074 0.109 0.08 .391* 0.003 0.085 0.081 .207* -0.071 0.03 0.032 0.222(.156) (.041) (.170) (.059) (.138) (.049)h (.164) (.057)[.068] [.110] [-.026] [.146] [.001] [.078] [-.027] [.087]
Studied Congress -0.07 0.038 0.04 0.143 0.276 0.085 0.091 .364* 0.013 0.199 0.163 .239* -0.007 0.071 0.06 0.255(.166) (.035) (.189) (.069)h (.139) (.043) (.183) (.069)[-.015] [.031] [.100] [.130] [.004] [.095] [-.003] [.101]
Studied Presidency 0.148 0.046 0.047 0.165 0.156 0.082 0.041 -0.049 0.122 0.081 0.079 .201* -0.017 0.049 0.06 .252*(.115) (.030)i (.147) (.054) (.100) (.035) (.143) (.057)h
[.035] [.038] [.055] [-.018] [.045] [.075] [-.006] [.098]Studied How Laws are Made 0.064 0.004 0.019 0.233 -0.192 0.05 0.05 0.089 -0.045 0.081 0.074 0.04 0.197 0.071 0.053 -0.156
(.138) (.042) (.162) (.062) (.120) (.046) (.157) (.064)[.015] [.039] [-.067] [.031] [-.016] [.015] [.077] [-.062]
Studied Political Parties -0.185 -0.022 -0.018 -0.093 0.048 0.057 0.09 .399* 0.067 0.11 0.105 .197* 0.027 0.039 0.029 -0.034(.130) (.029) (.152) (.065)h (.107) (.040) (.147) (.063)[-.041] [-.019] [.017] [.131] [.024] [.075] [.010] [-.013]
Studied State and Local Gov't. -0.136 0.019 0.019 .201* -0.241 -0.022 -0.047 -.272* 0.154 0.105 0.105 .284* 0.068 0.087 0.086 0.25(.117) (.031)h (.144) (.061)h (.097) (.039) (.140) (.062)[-.030] [.043] [-.084] [-.099] [.056] [.106] [.026] [.098]
"College" are those students who expect to complete a four-year college degree. a) Civic education variable is the treatment effect. Nearest-neighbor matching methods with replacement were employed.
Individual matching analyses were conducted for each of the 6 treatment effects (civics education types).b) Cartoon 2: Dependent variable =1 if student correctly interpreted a political cartoon about democracy. Read Newspaper 1: Dependent variable =1 if respondent answered "sometimes" or "often" to "How often do you read
articles in the newspaper about what is happening in this country?"c) Coefficients, robust standard errors (in parentheses) and marginal effects (in brackets) from full probit models in Tables 41 and 42.d) ATT= Average Treatment Effect on the Treated, interpreted as percentage points; "Treated" are those that report studying the above civic education topics.e) ATE= Average Treatment Effect.f) Coefficients are from matching-weighted probits. Marginal effects are in brackets.g) Bootstrapped standard errors are in parentheses.
Significance is based on the bias-corrected confidence intervals and the matching-weighted probit analyses. h) Significant in the matching-weighted probit but not the bias-corrected confidence interval. i) Significant in the bias-corrected confidence interval but not the matching-weighted probit. * significant at the α=.05 level. All calculations used the "total weight" as provided in the survey data, except the matching-weighted probits.
Read Newspaper 1 - Non-College
Table 75Political Interpretation Skills - Political Cartoons and Monitoring the News (IEA/CivEd)
Matching Methodsa - Non-College
Read Newspaper 1 - CollegeCartoon 2 - College Cartoon 2 - Non-College

219
Probit Probit Probit ProbitCoefficientc ATTd ATEe Coefficientf Coefficient ATT ATE Coefficient Coefficient ATT ATE Coefficient Coefficient ATT ATE Coefficient(Std. Error) (Std. Error)g (Std. Error) (Std. Error) (Std. Error) (Std. Error) (Std. Error) (Std. Error)
(1) (2) (3) (4) (5) (6) (7) (8) (9) (10) (11) (12) (13) (14) (15) (16)Civic Education variables:
Studied Constitution 0.121 0.123 0.114 .199* 0.099 0.076 0.056 0.119 .445* 0.066 0.083 .348* .368* 0.023 0.044 0.179(.134) (.046) (.165) (.069) (.151) (.041)h (.182) (.053)[.048] [.079] [.039] [.046] [.123] [.079] [.117] [.042]
Studied Congress 0.053 0.169 0.128 0.012 -0.221 0.011 0.008 0.045 -0.087 0.083 0.087 .624* -.521* -0.009 0.017 0.058(.136) (.042)i (.185) (.070) (.160) (.037) (.207) (.055)[.020] [.004] [-.088] [.018] [-.020] [.131] [-.145] [.014]
Studied Presidency 0.024 0.057 0.052 0.104 -0.077 0.044 0.035 0.127 -0.086 0.024 0.043 .244* 0.177 0.063 0.048 0.037(.098) (.039) (.140) (.062) (.116) (.030)h (.157) (.054)[.009] [.041] [-.030] [.050] [-.020] [.053] [.053] [.011]
Studied How Laws are Made -0.159 0.008 0.007 -0.076 0.073 -0.038 -0.039 -0.202 -0.095 0.024 0.028 0.018 0.165 0.097 0.055 -0.005(.118) (.047) (.159) (.059) (.138) (.035) (.169) (.054)i
[-.062] [-.030] [.029] [-.080] [-.022] [.004] [.050] [-.001]Studied Political Parties 0.142 0.056 0.054 0.021 .353* 0.057 0.044 0.188 0.17 0.123 0.12 .445* -0.096 -0.011 -0.023 -.341*
(.105) (.041) (.147) (.060) (.121) (.035) (.163) (.049)h
[.056] [.008] [.139] [.074] [.043] [.122] [-.028] [-.102]Studied State and Local Gov't. 0.146 0.07 0.073 .196* -0.068 -0.029 -0.012 -0.174 0.169 0.075 0.087 .352* 0.05 -0.009 0.011 -0.042
(.095) (.039)h (.139) (.070) (.111) (.031) (.153) (.053)[.058] [.077] [-.027] [-.069] [.042] [.090] [.015] [-.011]
"College" are those students who expect to complete a four-year college degree. a) Civic education variable is the treatment effect. Nearest-neighbor matching methods with replacement were employed.
Individual matching analyses were conducted for each of the 6 treatment effects (civics education types).b) Cartoon 2: Dependent variable =1 if student correctly interpreted a political cartoon about democracy. Read Newspaper 1: Dependent variable =1 if respondent answered "sometimes" or "often" to "How often do you read
articles in the newspaper about what is happening in this country?"c) Coefficients, robust standard errors (in parentheses) and marginal effects (in brackets) from full probit models in Table 42.d) ATT= Average Treatment Effect on the Treated, interpreted as percentage points; "Treated" are those that report studying the above civic education topics.e) ATE= Average Treatment Effect.f) Coefficients are from matching-weighted probits. Marginal effects are in brackets.g) Bootstrapped standard errors are in parentheses.
Significance is based on the bias-corrected confidence intervals and the matching-weighted probit analyses. h) Significant in the matching-weighted probit but not the bias-corrected confidence interval. i) Significant in the bias-corrected confidence interval but not the matching-weighted probit. * significant at the α=.05 level. All calculations used the "total weight" as provided in the survey data, except the matching-weighted probits.
Watch TV - Non-College
Table 76Monitoring the News (IEA/CivEd)Matching Methodsa - Non-College
Watch TV - CollegeRead Newspaper 2 - College Read Newspaper 2 - Non-College

220
Probit Probit Probit ProbitCoefficientc ATTd ATEe Coefficientf Coefficient ATT ATE Coefficient Coefficient ATT ATE Coefficient Coefficient ATT ATE Coefficient(Std. Error) (Std. Error)g (Std. Error) (Std. Error) (Std. Error) (Std. Error) (Std. Error) (Std. Error)
(1) (2) (3) (4) (5) (6) (7) (8) (9) (10) (11) (12) (13) (14) (15) (16)Civic Education variables:
Studied Constitution -0.008 0.135 0.122 .279* -0.198 0.065 0.055 0.047 -0.032 0.073 0.072 .440* 0.12 0.013 0.028 0.281(.134) (.039) (.168) (.065) (.146) (.036) (.175) (.060)[-.003] [.104] [-.075] [.016] [-.011] [.138] [.037] [.098]
Studied Congress 0.018 0.14 0.125 .350* -0.112 0.121 0.099 0.196 -0.163 0.124 0.11 .481* -0.034 0.058 0.034 0.074(.137) (.042) (.190) (.072)i (.148) (.035) (.200) (.048)[.007] [.132] [-.042] [.068] [-.056] [.135] [-.011] [.017]
Studied Presidency 0.127 0.084 0.078 .171* .340* 0.151 0.112 0.23 .259* 0.075 0.078 .235* 0.162 0.08 0.058 .318*(.097) (.041) (.143) (.054)i (.107) (.034)h (.152) (.050)h
[.050] [.066] [.125] [.078] [.083] [.076] [.051] [.092]Studied How Laws are Made 0.041 0.073 0.065 0.03 0.253 0.035 0.021 -0.26 0.053 0.091 0.088 .197* 0.021 0.059 0.042 0.022
(.118) (.050) (.164) (.067) (.129) (.043)h (.169) (.058)[.016] [.011] [.092] [-.090] [.017] [.057] [.006] [.004]
Studied Political Parties .280* 0.125 0.125 .352* 0.052 0.029 0.042 0.105 .393* 0.135 0.12 .228* -0.16 -0.023 -0.025 -.288*(.106) (.039) (.149) (.061) (.116) (.038) (.157) (.053)h
[.109] [.136] [.019] [.039] [.122] [.065] [-.052] [-.076]Studied State and Local Gov't. -0.105 0.074 0.077 .294* 0.166 0.16 0.137 .270* -0.128 0.025 0.025 0.083 0.094 -0.02 0.013 0.089
(.096) (.039)h (.142) (.059) (.102) (.038) (.149) (.061)[-.041] [.116] [.061] [.094] [-.043] [.027] [.030] [.030]
"College" are those students who expect to complete a four-year college degree. a) Civic education variable is the treatment effect. Nearest-neighbor matching methods with replacement were employed.
Individual matching analyses were conducted for each of the 6 treatment effects (civics education types).b) Listen: Dependent variable =1 if respondent answered "sometimes" or "often" to "How often do you listen
to news broadcasts on the radio?"Dependent variable =1 if respondent answered "sometimes" or "often" to "How often do you have discussions
of what is happening in U.S. government with people your own age / your parents / your teachers?"c) Coefficients, robust standard errors (in parentheses) and marginal effects (in brackets) from full probit models in Tables 42 and 43.d) ATT= Average Treatment Effect on the Treated, interpreted as percentage points; "Treated" are those that report studying the above civic education topics.e) ATE= Average Treatment Effect.f) Coefficients are from matching-weighted probits. Marginal effects are in brackets.g) Bootstrapped standard errors are in parentheses.
Significance is based on the bias-corrected confidence intervals and the matching-weighted probit analyses. h) Significant in the matching-weighted probit but not the bias-corrected confidence interval. i) Significant in the bias-corrected confidence interval but not the matching-weighted probit. * significant at the α=.05 level. All calculations used the "total weight" as provided in the survey data, except the matching-weighted probits.
People Own Age - Non-College
Table 77Monitoring the News and Group Discussion Skills (IEA/CivEd)
Matching Methodsa - Non-College
People Own Age - CollegeListen to Radio - College Listen to Radio - Non-College
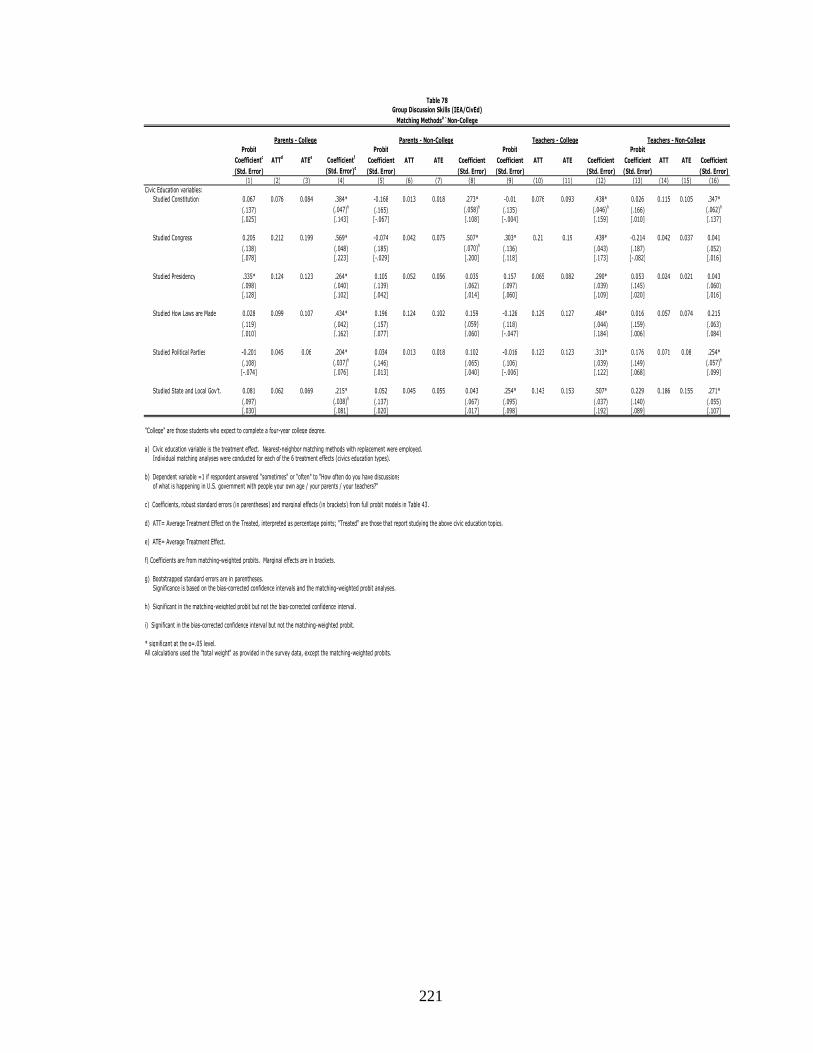
221
Probit Probit Probit ProbitCoefficientc ATTd ATEe Coefficientf Coefficient ATT ATE Coefficient Coefficient ATT ATE Coefficient Coefficient ATT ATE Coefficient(Std. Error) (Std. Error)g (Std. Error) (Std. Error) (Std. Error) (Std. Error) (Std. Error) (Std. Error)
(1) (2) (3) (4) (5) (6) (7) (8) (9) (10) (11) (12) (13) (14) (15) (16)Civic Education variables:
Studied Constitution 0.067 0.076 0.084 .384* -0.168 0.013 0.018 .273* -0.01 0.076 0.093 .438* 0.026 0.115 0.105 .347*(.137) (.047)h (.165) (.058)h (.135) (.046)h (.166) (.062)h
[.025] [.143] [-.067] [.108] [-.004] [.159] [.010] [.137]Studied Congress 0.205 0.212 0.199 .569* -0.074 0.042 0.075 .507* .303* 0.21 0.19 .439* -0.214 0.042 0.037 0.041
(.138) (.048) (.185) (.070)h (.136) (.043) (.187) (.052)[.078] [.223] [-.029] [.200] [.118] [.173] [-.082] [.016]
Studied Presidency .335* 0.124 0.123 .264* 0.105 0.052 0.056 0.035 0.157 0.065 0.082 .290* 0.053 0.024 0.021 0.043(.098) (.040) (.139) (.062) (.097) (.039) (.145) (.060)[.128] [.102] [.042] [.014] [.060] [.109] [.020] [.016]
Studied How Laws are Made 0.028 0.099 0.107 .434* 0.196 0.124 0.102 0.159 -0.126 0.129 0.127 .484* 0.016 0.057 0.074 0.215(.119) (.042) (.157) (.059)i (.118) (.044) (.159) (.063)[.010] [.162] [.077] [.060] [-.047] [.184] [.006] [.084]
Studied Political Parties -0.201 0.045 0.06 .204* 0.034 0.013 0.018 0.102 -0.016 0.123 0.123 .313* 0.176 0.071 0.08 .254*(.108) (.037)h (.146) (.065) (.106) (.039) (.149) (.057)h
[-.074] [.076] [.013] [.040] [-.006] [.122] [.068] [.099]Studied State and Local Gov't. 0.081 0.062 0.069 .215* 0.052 0.045 0.055 0.043 .254* 0.143 0.153 .507* 0.229 0.186 0.155 .271*
(.097) (.038)h (.137) (.067) (.095) (.037) (.140) (.055)[.030] [.081] [.020] [.017] [.098] [.192] [.089] [.107]
"College" are those students who expect to complete a four-year college degree. a) Civic education variable is the treatment effect. Nearest-neighbor matching methods with replacement were employed.
Individual matching analyses were conducted for each of the 6 treatment effects (civics education types).b) Dependent variable =1 if respondent answered "sometimes" or "often" to "How often do you have discussions
of what is happening in U.S. government with people your own age / your parents / your teachers?"c) Coefficients, robust standard errors (in parentheses) and marginal effects (in brackets) from full probit models in Table 43.d) ATT= Average Treatment Effect on the Treated, interpreted as percentage points; "Treated" are those that report studying the above civic education topics.e) ATE= Average Treatment Effect.f) Coefficients are from matching-weighted probits. Marginal effects are in brackets.g) Bootstrapped standard errors are in parentheses.
Significance is based on the bias-corrected confidence intervals and the matching-weighted probit analyses. h) Significant in the matching-weighted probit but not the bias-corrected confidence interval. i) Significant in the bias-corrected confidence interval but not the matching-weighted probit. * significant at the α=.05 level. All calculations used the "total weight" as provided in the survey data, except the matching-weighted probits.
Teachers - Non-College
Table 78Group Discussion Skills (IEA/CivEd)
Matching Methodsa - Non-College
Teachers - CollegeParents - College Parents - Non-College

222
ProbitCoefficientb ATTc ATEd Coefficiente
(Std. Error) (Std. Error)f
(1) (2) (3) (4)
Civic Education -0.162 -0.076 -0.096 -0.336(.189) (.085)[-.050] [-.071]
Civic Education 0.056 0.038 0.028 -0.001(.171) (.079)[.019] [-.001]
Civic Education 0.052 -0.015 -0.026 -1.59(.308) (.035)[.003] [-.086]
Civic Education -0.184 0.028 0.01 1.06(.305) (.030)[-.014] [0]
Civic Education 0.154 0.13 0.064 .698*(.184) (.079)[.054] [.204]
Civic Education -0.032 0.039 0.043 0.102(.168) (.078)[-.012] [.038]
Civic Education 0.053 0.016 0.025 0.19(.176) (.089)[.019] [.070]
Civic Education -0.062 -0.057 -0.01 0.377(.175) (.080)[-.020] [.132]
a) Civic education variable is the treatment effect. Nearest-neighbor matching methods with replacement were employed.
b) Coefficients from full probit models in Table 44.
c) ATT= Average Treatment Effect on the Treated, interpreted as percentage points; Treated are those that report studying civic education.
d) ATE= Average Treatment Effect.
e) Coefficients are from matching-weighted probits. Marginal effects are in brackets.
f) Bootstrapped standard errors are in parentheses.Significance is based on the bias-corrected confidence intervals and the matching-weighted probit analyses.
g) Newspapers: Read a newspaper 5, 6 or 7 days out of the past week.Newsmagazines: Read a newspaper 5, 6 or 7 days out of the past week.Watch: Watch the national news on television 5, 6 or 7 days out of the past week.Listen: Listen to the news on the radio 5, 6 or 7 days out of the past week.
* significant at the α=.05 level. All calculations used the "step weight" as provided in the survey data,
except for the matching-weighted probits.
Table 79Monitoring the News (NGI)
Matching Methodsa
Newsmagazines - Females
Newspapers - Femalesg
Newspapers - Males
Radio - Males
Watch TV - Males
Radio - Females
Newsmagazines - Males
Watch TV - Females
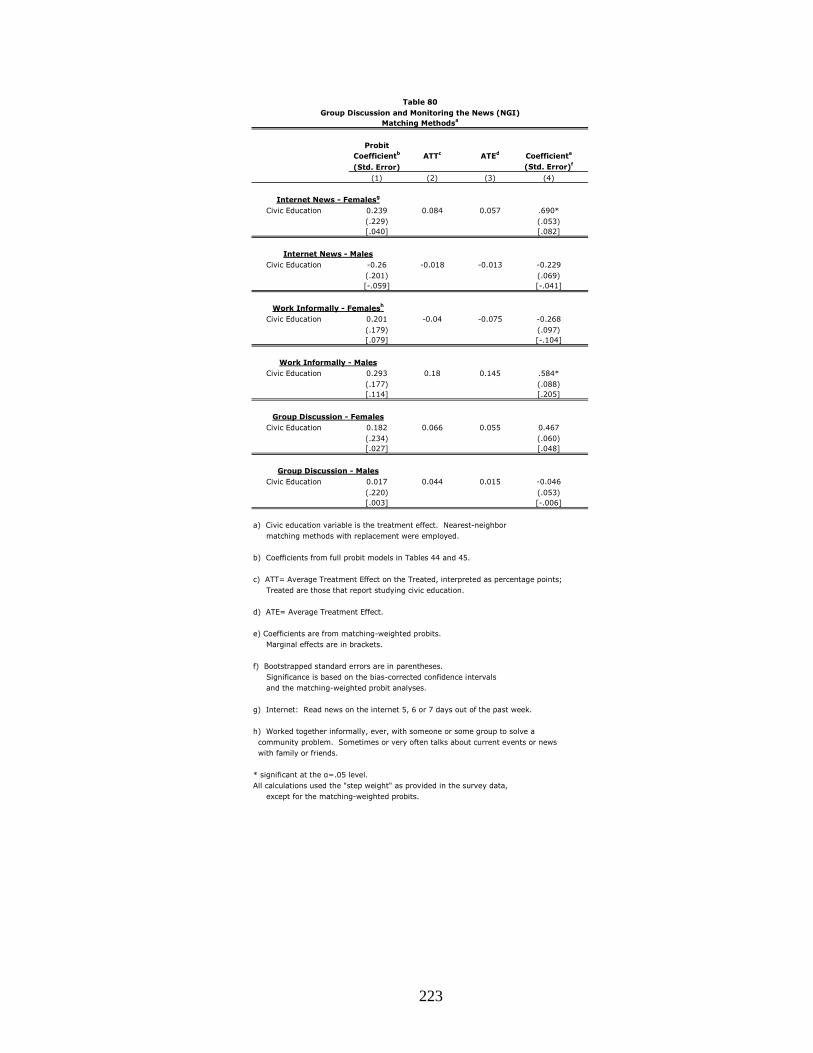
223
ProbitCoefficientb ATTc ATEd Coefficiente
(Std. Error) (Std. Error)f
(1) (2) (3) (4)
Civic Education 0.239 0.084 0.057 .690*(.229) (.053)[.040] [.082]
Civic Education -0.26 -0.018 -0.013 -0.229(.201) (.069)[-.059] [-.041]
Civic Education 0.201 -0.04 -0.075 -0.268(.179) (.097)[.079] [-.104]
Civic Education 0.293 0.18 0.145 .584*(.177) (.088)[.114] [.205]
Civic Education 0.182 0.066 0.055 0.467(.234) (.060)[.027] [.048]
Civic Education 0.017 0.044 0.015 -0.046(.220) (.053)[.003] [-.006]
a) Civic education variable is the treatment effect. Nearest-neighbor matching methods with replacement were employed.
b) Coefficients from full probit models in Tables 44 and 45.
c) ATT= Average Treatment Effect on the Treated, interpreted as percentage points; Treated are those that report studying civic education.
d) ATE= Average Treatment Effect.
e) Coefficients are from matching-weighted probits. Marginal effects are in brackets.
f) Bootstrapped standard errors are in parentheses.Significance is based on the bias-corrected confidence intervals and the matching-weighted probit analyses.
g) Internet: Read news on the internet 5, 6 or 7 days out of the past week.
h) Worked together informally, ever, with someone or some group to solve a community problem. Sometimes or very often talks about current events or news with family or friends.
* significant at the α=.05 level. All calculations used the "step weight" as provided in the survey data,
except for the matching-weighted probits.
Internet News - Males
Internet News - Femalesg
Table 80Group Discussion and Monitoring the News (NGI)
Matching Methodsa
Work Informally - Femalesh
Work Informally - Males
Group Discussion - Females
Group Discussion - Males

224
ProbitCoefficientb ATTc ATEd Coefficiente
(Std. Error) (Std. Error)f
(1) (2) (3) (4)
Civic Education 0.02 -0.046 -0.028 -0.054(.173) (.073)[.008] [-.021]
Civic Education .290* 0.112 0.115 .352*(.069) (.044)i
[.115] [.139]
Civic Education -0.021 -0.052 -0.035 -.460*(.188) (.072)i
[-.006] [-.110]
Civic Education .288* 0.063 0.071 .318*(.073) (.038)i
[.091] [.096]
Civic Education 0.351 -0.024 -0.013 -0.026(.236) (.042)[.057] [-.002]
Civic Education .209* 0.026 0.027 .249*(.098) (.232)i
[.027] [.030]
Civic Education 0.116 -0.012 0.007 0.024(.199) (.060)[.031] [.005]
Civic Education 0.025 -0.001 0.007 0.079(.078) (.029)[.006] [.019]
a) Civic education variable is the treatment effect. Nearest-neighbor matching methods with replacement were employed.
b) Coefficients from full probit models in Table 46.
c) ATT= Average Treatment Effect on the Treated, interpreted as percentage points; Treated are those that report studying civic education.
d) ATE= Average Treatment Effect.
e) Coefficients are from matching-weighted probits. Marginal effects are in brackets.
f) Bootstrapped standard errors are in parentheses.Significance is based on the bias-corrected confidence intervals and the matching-weighted probit analyses.
g) Student reads a newspaper or newsmagazine almost daily or at least once a week. Student watches television news or listens to radio news almost daily or at least once a week. h) Student feels they could write a letter to someone in government that clearly gives their opinion. Student feels they could make a comment or statement at a public meeting. i) Significant in the matching-weighted probit but not the
bias-corrected confidence interval.
* significant at the α=.05 level. All calculations used the "FYWT" weight as provided in the survey data,
except for the matching-weighted probits.
Statement - All others
Statement - African-Americans
Readg - African-Americans
Watch / Listen - African-Americans
Letter - All others
Table 81Communication Skills and Monitoring the News (NHES)
Matching Methodsa - African-American
Letterh - African-Americans
Read - All others
Watch / Listen - All others

225
ProbitCoefficientb ATTc ATEd Coefficiente
(Std. Error) (Std. Error)f
(1) (2) (3) (4)
Civic Education .402* 0.211 0.208 .709*(.160) (.077)[.159] [.274]
Civic Education .223* 0.068 0.071 0.194(.070) (.043)[.088] [.077]
Civic Education 0.151 0.045 0.046 0.158(.171) (.069)[.043] [.045]
Civic Education .247* 0.056 0.051 0.112(.074) (.033)[.078] [.036]
Civic Education 0.267 0.047 0.047 0.225(.216) (.054)[.040] [.032]
Civic Education .250* 0.02 0.019 0.125(.099) (.023)[.033] [.013]
Civic Education .432* 0.036 0.056 0.127(.181) (.063)[.117] [.027]
Civic Education -0.044 -0.015 -0.008 0.002(.080) (.030)[-.011] [.001]
a) Civic education variable is the treatment effect. Nearest-neighbor matching methods with replacement were employed.
b) Coefficients from full probit models in Table 47.
c) ATT= Average Treatment Effect on the Treated, interpreted as percentage points; Treated are those that report studying civic education.
d) ATE= Average Treatment Effect.
e) Coefficients are from matching-weighted probits. Marginal effects are in brackets.
f) Bootstrapped standard errors are in parentheses.Significance is based on the bias-corrected confidence intervals and the matching-weighted probit analyses.
g) Student reads a newspaper or newsmagazine almost daily or at least once a week. Student watches television news or listens to radio news almost daily or at least once a week. h) Student feels they could write a letter to someone in government that clearly gives their opinion. Student feels they could make a comment or statement at a public meeting. i) Significant in the matching-weighted probit but not the
bias-corrected confidence interval.
* significant at the α=.05 level. All calculations used the "FYWT" weight as provided in the survey data,
except for the matching-weighted probits.
Table 82Communication Skills and Monitoring the News (NHES)
Matching Methodsa - Latinos
Letterh - Latinos
Read - All others
Watch / Listen - All others
Statement - All others
Statement - Latinos
Readg - Latinos
Watch / Listen - Latinos
Letter - All others

226
ProbitCoefficientb ATTc ATEd Coefficiente
(Std. Error) (Std. Error)f
(1) (2) (3) (4)
Civic Education 0.12 0.047 0.054 .175*(.089) (.057)i
[.048] [.070]
Civic Education .406* 0.115 0.133 .360*(.094) (.055)i
[.160] [.142]
Civic Education 0.174 0.052 0.057 .263*(.093) (.046)i
[.057] [.082]
Civic Education .330* 0.087 0.079 .357*(.100) (.043)[.099] [.104]
Civic Education 0.188 0.015 0.015 0.114(.134) (.026)[.021] [.010]
Civic Education .274* 0.048 0.051 .613*(.123) (.033)i
[.042] [.062]
Civic Education 0.114 0.021 0.027 0.06(.102) (.039)[.029] [.014]
Civic Education -0.074 -0.01 -0.001 0.056(.106) (.035)[-.019] [.012]
a) Civic education variable is the treatment effect. Nearest-neighbor matching methods with replacement were employed.
b) Coefficients from full probit models in Table 48.
c) ATT= Average Treatment Effect on the Treated, interpreted as percentage points; Treated are those that report studying civic education.
d) ATE= Average Treatment Effect.
e) Coefficients are from matching-weighted probits. Marginal effects are in brackets.
f) Bootstrapped standard errors are in parentheses.Significance is based on the bias-corrected confidence intervals and the matching-weighted probit analyses.
g) Student reads a newspaper or newsmagazine almost daily or at least once a week. Student watches television news or listens to radio news almost daily or at least once a week. h) Student feels they could write a letter to someone in government that clearly gives their opinion. Student feels they could make a comment or statement at a public meeting. i) Significant in the matching-weighted probit but not the
bias-corrected confidence interval.
* significant at the α=.05 level. All calculations used the "FYWT" weight as provided in the survey data,
except for the matching-weighted probits.
Statement - Males
Statement - Females
Readg - Females
Watch / Listen - Females
Letter - Males
Table 83Communication Skills and Monitoring the News (NHES)
Matching Methodsa - Females
Letterh - Females
Read - Males
Watch / Listen - Males

227
ProbitCoefficientb ATTc ATEd Coefficiente
(Std. Error) (Std. Error)f
(1) (2) (3) (4)
Civic Education 0.065 0.004 0.029 -0.001(.135) (.067)[.026] [-.001]
Civic Education .313* 0.109 0.111 .337*(.073) (.046)i
[.124] [.133]
Civic Education -0.001 -0.004 0.013 0.004(.145) (.058)[-.001] [.001]
Civic Education .326* 0.056 0.058 .200*(.077) (.036)i
[.103] [.062]
Civic Education .454* 0.021 0.034 0.306(.182) (.041)[.077] [.027]
Civic Education 0.159 0.013 0.012 0.157(.106) (.021)[.019] [.015]
Civic Education 0.116 0.083 0.096 .367*(.149) (.062)i
[.032] [.098]
Civic Education -0.06 -0.026 -0.018 -0.072(.084) (.029)[-.015] [-.016]
Respondents with household income $25,000 per year or less are low income.
a) Civic education variable is the treatment effect. Nearest-neighbor matching methods with replacement were employed.
b) Coefficients from full probit models in Table 49.
c) ATT= Average Treatment Effect on the Treated, interpreted as percentage points; Treated are those that report studying civic education.
d) ATE= Average Treatment Effect.
e) Coefficients are from matching-weighted probits. Marginal effects are in brackets.
f) Bootstrapped standard errors are in parentheses.Significance is based on the bias-corrected confidence intervals and the matching-weighted probit analyses.
g) Student reads a newspaper or newsmagazine almost daily or at least once a week. Student watches television news or listens to radio news almost daily or at least once a week. h) Student feels they could write a letter to someone in government that clearly gives their opinion. Student feels they could make a comment or statement at a public meeting. i) Significant in the matching-weighted probit but not the
bias-corrected confidence interval.
* significant at the α=.05 level. All calculations used the "FYWT" weight as provided in the survey data,
except for the matching-weighted probits.
Table 84Communication Skills and Monitoring the News (NHES)
Matching Methodsa - Low-Income
Letterh - Low-income
Read - All others
Watch / Listen - All others
Statement - All others
Statement - Low-income
Readg - Low-income
Watch / Listen - Low-income
Letter - All others

228
ProbitCoefficientb ATTc ATEd Coefficiente
(Std. Error) (Std. Error)f
(1) (2) (3) (4)
Civic Education .235* 0.138 0.13 .363*(.068) (.045)i
[.093] [.144]
Civic Education 0.249 0.099 0.118 .818*(.187) (.092)i
[.088] [.300]
Civic Education .237* 0.057 0.061 .234*(.073) (.035)[.073] [.069]
Civic Education 0.224 0.088 0.11 .724*(.186) (.095)i
[.078] [.223]
Civic Education .212* 0.016 0.02 .229*(.097) (.020)i
[.028] [.024]
Civic Education 0.448 0.11 0.066 -0.457(.244) (.074)[.062] [-.047]
Civic Education 0.043 -0.008 0.003 0.009(.078) (.027)[.011] [.002]
Civic Education -0.183 -0.172 -0.153 -1.03*(.194) (.062)[-.056] [-.191]
"College" are those students who think they will graduate from a four-year college.
a) Civic education variable is the treatment effect. Nearest-neighbor matching methods with replacement were employed.
b) Coefficients from full probit models in Table 50.
c) ATT= Average Treatment Effect on the Treated, interpreted as percentage points; Treated are those that report studying civic education.
d) ATE= Average Treatment Effect.
e) Coefficients are from matching-weighted probits. Marginal effects are in brackets.
f) Bootstrapped standard errors are in parentheses.Significance is based on the bias-corrected confidence intervals and the matching-weighted probit analyses.
g) Student reads a newspaper or newsmagazine almost daily or at least once a week. Student watches television news or listens to radio news almost daily or at least once a week. h) Student feels they could write a letter to someone in government that clearly gives their opinion. Student feels they could make a comment or statement at a public meeting. i) Significant in the matching-weighted probit but not the
bias-corrected confidence interval.
* significant at the α=.05 level. All calculations used the "FYWT" weight as provided in the survey data,
except for the matching-weighted probits.
Table 85Communication Skills and Monitoring the News (NHES)
Matching Methodsa - Non-College
Letterh - College
Read - Non-College
Watch / Listen - Non-College
Statement - Non-College
Statement - College
Readg - College
Watch / Listen - College
Letter - Non-College

229
ProbitCoefficientb ATTc ATEd Coefficiente
(Std. Error) (Std. Error)f
(1) (2) (3) (4)
Civic Education 0.291 0.007 0.007 0.12(.231) (.076)[.078] [.015]
Civic Education -0.029 -0.055 -0.031 2.32*(.240) (.067)h
[-.007] [.120]
Civic Education 0.22 0.062 0.056 .692*(.225) (.091)h
[.069] [.230]
Civic Education -0.064 -0.015 -0.027 -0.099(.201) (.111)[-.023] [-.028]
Civic Education -0.042 0.066 0.052 -0.237(.259) (.071)[-.008] [-.065]
Civic Education 0.169 0.075 0.093 2.46(.262) (.080)[.034] [.190]
a) Civic education variable is the treatment effect. Nearest-neighbor matching methods with replacement were employed.
b) Coefficients from full probit models in Table 51.
c) ATT= Average Treatment Effect on the Treated, interpreted as percentage points; Treated are those that report studying civic education.
d) ATE= Average Treatment Effect.
e) Coefficients are from matching-weighted probits. Marginal effects are in brackets.
f) Bootstrapped standard errors are in parentheses.Significance is based on the bias-corrected confidence intervals and the matching-weighted probit analyses.
g) Respondent watches television news once a week or more. Respondent watches public affairs programming on television once a week or more. Respondent reads the newspaper once a week or more.
h) Significant in the matching-weighted probit but not the bias-corrected confidence interval.
* significant at the α=.05 level. All calculations used the "wt2517" weight as provided in the survey data,
except for the matching-weighted probits.
Table 86Monitoring the News (ACPS)Matching Methodsa - Females
Newspaper - Males
Public Affairs - Males
Newspaper - Females
Television Newsg - Females
Public Affairs - Females
Television News - Males

230
ProbitCoefficientb ATTc ATEd Coefficiente
(Std. Error) (Std. Error)f
(1) (2) (3) (4)
Civic Education 0.007 0.117 0.106 0.294(.215) (.078)[.002] [.091]
Civic Education 0.362 0.24 0.24 .990*(.208) (.086)[.142] [.372]
Civic Education 0.139 0.133 0.133 0.26(.206) (.081)[.055] [.097]
Civic Education 0.443 0.275 0.263 1.01*(.233) (.105)[.146] [.313]
Civic Education .554* 0.029 0.043 0.286(.231) (.068)[.164] [.030]
Civic Education -0.108 0.185 0.147 -0.037(.250) (.110)[-.024] [-.011]
Civic Education .408* 0.154 0.17 .664*(.200) (.077)[.157] [.239]
Civic Education 0.079 0.145 0.139 1.30*(.220) (.103)i
[.020] [.287]
a) Civic education variable is the treatment effect. Nearest-neighbor matching methods with replacement were employed.
b) Coefficients from full probit models in Table 52.
c) ATT= Average Treatment Effect on the Treated, interpreted as percentage points; Treated are those that report studying civic education.
d) ATE= Average Treatment Effect.
e) Coefficients are from matching-weighted probits. Marginal effects are in brackets.
f) Bootstrapped standard errors are in parentheses.Significance is based on the bias-corrected confidence intervals and the matching-weighted probit analyses.
g) Respondent discusses local politics or affairs with others every day, nearly every day, or once or twice a week. Respondent discusses national politics or affairs with others every day, nearly every day, or once or twice a week. h) Respondent feels they could write a convincing letter to someone in government that expresses their point of view. Respondent feels they speak well enough to make an effective statement at a public meeting. i) Significant in the matching-weighted probit but not the bias-corrected confidence interval.
* significant at the α=.05 level. All calculations used the "wt2517" weight as provided in the survey data,
except for the matching-weighted probits.
Table 87Group Discussion and Communication Skills (ACPS)
Matching Methodsa - Females
National Discussion - Females
Local Discussiong - Females
Local Discussion - Males
National Discussion - Males
Letter - Males
Statement - Males
Letterh - Females
Statement - Females

231
ProbitCoefficientb ATTc ATEd Coefficiente
(Std. Error) (Std. Error)f
(1) (2) (3) (4)
Civic Education 0.185 0.146 0.14 .845*(.278) (.090)i
[.073] [.327]
Civic Education 0.421 0.072 0.102 **(.237)[.137]
Civic Education 0.231 0.084 0.101 .839*(.281) (.095)i
[.080] [.242]
Civic Education .523* 0.015 0.085 **(.229)[.201]
Civic Education -0.175 0.034 0.024 **(.326)[-.027]
Civic Education 0.389 0.129 0.137 **(.227)[.138]
Civic Education 0.221 0.092 0.101 0.269(.287) (.097)[.063] [.067]
Civic Education .605* 0.202 0.189 .788*(.231)[.237] [.300]
"College" are those respondents who have completed at least one year of college.
a) Civic education variable is the treatment effect. Nearest-neighbor matching methods with replacement were employed.
b) Coefficients from full probit models in Table 53.
c) ATT= Average Treatment Effect on the Treated, interpreted as percentage points; Treated are those that report studying civic education.
d) ATE= Average Treatment Effect.
e) Coefficients are from matching-weighted probits. Marginal effects are in brackets.
f) Bootstrapped standard errors are in parentheses.Significance is based on the bias-corrected confidence intervals and the matching-weighted probit analyses.
g) Respondent discusses local politics or affairs with others every day, nearly every day, or once or twice a week. Respondent discusses national politics or affairs with others every day, nearly every day, or once or twice a week. h) Respondent feels they could write a convincing letter to someone in government that expresses their point of view. Respondent feels they speak well enough to make an effective statement at a public meeting. i) Significant in the matching-weighted probit but not the bias-corrected confidence interval.
* significant at the α=.05 level. ** unable to calculate due to dropped covariatesAll calculations used the "wt2517" weight as provided in the survey data,
except for the matching-weighted probits.
National Discussion - Non-College
Letter - Non-College
Statement - Non-College
Letterh - College
Statement - College
Table 88Group Discussion and Communication Skills (ACPS)
Matching Methodsa - Non-College
National Discussion - College
Local Discussiong - College
Local Discussion - Non-College

232
ProbitCoefficientb ATTc ATEd Coefficiente
(Std. Error) (Std. Error)f
(1) (2) (3) (4)
Civic Education -0.073 -0.03 -0.025 -0.808(.305) (.076)[-.018] [-.030]
Civic Education 0.168 -0.036 -0.018 **(.224)[.047]
Civic Education -0.154 0.023 0.012 0.429(.253) (.083)[-.058] [.156]
Civic Education 0.153 0.088 0.08 **(.229)[.047]
Civic Education -0.667 0.034 0.032 **(.400)[-.070]
Civic Education 0.385 0.061 0.056 **(.239)[.108]
"College" are those respondents who have completed at least one year of college.
a) Civic education variable is the treatment effect. Nearest-neighbor matching methods with replacement were employed.
b) Coefficients from full probit models in Table 54.
c) ATT= Average Treatment Effect on the Treated, interpreted as percentage points; Treated are those that report studying civic education.
d) ATE= Average Treatment Effect.
e) Coefficients are from matching-weighted probits. Marginal effects are in brackets.
f) Bootstrapped standard errors are in parentheses.Significance is based on the bias-corrected confidence intervals and the matching-weighted probit analyses.
g) Respondent watches television news once a week or more. Respondent watches public affairs programming on television once a week or more. Respondent reads the newspaper once a week or more.
h) Significant in the matching-weighted probit but not the bias-corrected confidence interval.
* significant at the α=.05 level. ** unable to calculate due to dropped covariatesAll calculations used the "wt2517" weight as provided in the survey data,
except for the matching-weighted probits.
Table 89Monitoring the News (ACPS)
Matching Methodsa - Non-College
Newspaper - Non-College
Public Affairs - Non-College
Newspaper - College
Television Newsg - College
Public Affairs - College
Television News - Non-College

233
References
American Association of University Women. 1994. “Shortchanging Girls, Shortchanging America.” Washington: AAUW. www.aauw.org.
American Association of University Women. 1998. “Gender Gaps: Where Schools Still Fail Our Children, Executive Summary.” Washington: AAUW. www.aauw.org.
Abramson, Paul R. and Aldrich, John H. 1982. “The Decline of Electoral Participation in America.” American Political Science Review 76, pp. 502-521.
Ackerman, Phillip L., Beier, Margaret E., and Bowen, Kristy R. 2002. “What We Really Know About our Abilities and our Knowledge.” Personality and Individual Differences, 33 pp. 587-605.
Almond, Gabriel and Verba, Sidney. 1963. The Civic Culture. Princeton: Princeton University Press.
Andrain, Charles. 1971. Children and Civic Awareness. Columbus: Charles E. Merrill.
Ascher, Carol. 1983. The 1983 Educational Reform Reports. ERIC pub. no. ED252636.
Ascher, Carol and Fruchter, Norm. 2001. “Teacher Quality and Student Performance in New York City’s Low-Performing Schools,” Journal of Education for Students Placed at Risk 6 (3) pp. 199-214.
Bankston, Carl and Caldas, Stephen. 2000. “White Enrollment in Nonpublic Schools, Public School Racial Composition, and Student Performance” Sociological Quarterly 41 (4) pp. 539-551.
Barton, Paul. 2005. “One-Third of a Nation: Rising Dropout Rates and Declining Opportunities,” Educational Testing Service Report, www.ets.org.
Barzel, Yoram and Silberberg, Eugene. 1973. “Is the Act of Voting Rational?” Public Choice 16, pp. 51-58.
Begley, Sharon. 2005. “Harvard Chief’s Words on Innate Differences Lack Basis in Science” Wall Street Journal, January 28.
Blau, Judith. 2003. Race in the Schools. Boulder: Lynne Reiner Publishers.
Boyte, Harry. 1999. “Building the Commonwealth: Citizenship as Public Work,” pp. 259-278 in Citizen Competence and Democratic Institutions, edited by Stephen Elkin and Karol Soltan. University Park: Pennsylvania State University Press.
Boyte, Harry. 2003. “Civic Education and the New American Patriotism Post-9/11.”

234
Cambridge Journal of Education 33 (1), pp. 85-100.
Brady, Henry E., Verba, Sidney and Schlozman, Kay Lehman. 1995. “Beyond SES: A Resource Model of Political Participation.” American Political Science Review, 89 (2) pp. 271-294.
Campbell, David E. 2001. “Bowling Together: Private Schools, Serving Public Ends.” Education Next, Fall.
Campbell, David. 2002. Participation in Context: How Communities and Schools Shape Civic Engagement. Ph.D. diss., Harvard University.
Carnegie Corporation of New York and the Center for Information and Research on Civic Learning and Engagement. 2003. “The Civic Mission of Schools,” http://www.civicyouth.org.
Center for Information and Research on Civic Learning and Engagement (CIRCLE). 2004. Around the CIRCLE – Research Roundup, 1 (3). http://www.civicyouth.org/PopUps/v1.i.3.pdf.
Center for Information and Research on Civic Learning and Engagement (CIRCLE) Staff. 2004. “Youth Voting in the 2004 Election,” http://www.civicyouth.org.
Connell, R.W. 1971. The Child’s Construction of Politics. Melbourne University Press.
Conrad, Dan. 1991. “School-Community Participation for Social Studies,” pp. 540-548 in Handbook of Research on Social Studies Teaching and Learning, ed. James P. Shaver, New York: Macmillan.
Dahejia, Rajeev and Wahba, Sadek. 2002. “Propensity Score-Matching Methods for Nonexperimental Causal Studies.” The Review of Economics and Statistics, 84 (1) pp. 151-161.
DeAngelis, Tori. 2003. “Why we Overestimate our Competence.” Monitor on Psychology, 34 (2) http://www.apa.org/monitor/feb03/overestimate.html.
Delli Carpini, Michael X. and Keeter, Scott. 1996. What Americans Know About Politics and Why it Matters. New Haven: Yale University Press.
Downs, Anthony. 1957. An Economic Theory of Democracy. New York: Harper and Row.
Dunning, David, Johnson, Kerri, Ehrlinger, Joyce, and Kruger, Justin. 2003. “Why People Fail to Recognize Their Own Incompetence.” Current Directions in Psychological Science, 12 (3) pp. 83-87.

235
Education Commission of the States. 2004. “State Citizenship Education Policies.” April 2004. www.ecs.org.
Fitzgerald, Mary. 2001. Alternative Voting Techniques and Electoral Participation: Voting Reform in the American States, 1972-1998. Ph.D. diss., University of Maryland.
Fitzpatrick, John. 1939. The Writings of George Washington from the Original Manuscript Sources, vol.30. Washington: Government Printing Office.
Flanagan, Constance. 2003. “Developmental Roots of Political Engagement,” PS Political Science and Politics, 36 (2) pp. 257-261.
Fraser, Barry J. 1999. Using Learning Environment Assessments to Improve Classroom and School Climates. In School Climate: Measuring, Improving and Sustaining Healthy Learning Environments, ed. Jerome Freiberg, pp. 65-83. Philadelphia: Falmer Press.
Freiberg, Jerome and Stein, T.A. 1999. Measuring, Improving and Sustaining Healthy Learning Environments, in School Climate: Measuring, Improving and Sustaining Healthy Learning Environments, ed. Jerome Freiberg, pp. 65-83. Philadelphia: Falmer Press.
Frölich, Markus. 2004. Finite-Sample Properties of Propensity-Score Matching and Weighting Estimators. The Review of Economics and Statistics, 86 (1) pp. 77-90.
Fry, Richard. 2003. “Hispanic Youth Dropping Out of U.S. Schools: Measuring the Challenge,” Pew Hispanic Center report, www.pewhispanic.org.
Fry, Richard and Lowell, B. Lindsay. 2003. The Value of Bilingualism in the U.S. Labor Market. Industrial and Labor Relations Review, 57 (1) pp. 128-141.
Goodlad, John. 1996. “Democracy, Education, and Community.” pp. 87-124 in Democracy, Education, and the Schools. ed. Roger Soder. San Francisco: Jossey Bass.
Green, Donald and Shapiro, Ian. 1994. Pathologies of Rational Choice Theory, A Critique of Applications in Political Science. New Haven: Yale University Press.
Gujarati, Damodar. 1995. Basic Econometrics. New York: McGraw Hill.
Gurny, Helen Graham. 2003. High School Students’ Performance on Vandenberg’s Mental Rotations Test. Master’s thesis, College of New Rochelle.
Gutmann, Amy. 1987. Democratic Education. Princeton: Princeton University Press.

236
Gutmann, Amy. 2000. “Why Should Schools Care About Civic Education?”, pp. 73-90 in Rediscovering the Democratic Purposes of Education, eds. Lorraine McDonnell, P. Michael Timpane and Roger Benjamin. Lawrence: University Press of Kansas.
Hacker, Jacob S. and Pierson, Paul. 2005. “Abandoning the Middle: The Revealing Case of the Bush Tax Cut of 2001,” forthcoming, Perspectives on Politics.
Hallinan, Maureen. 1994. “Tracking: From Theory to Practice.” Sociology of Education67 (2) pp. 79-91.
Heckman, James J.; Ichimura, Hidehiko and Todd, Petra. 1998. “Matching as an Econometric Evaluation Estimator.” Review of Economic Studies, 65 pp. 261-294.
Hess, Robert D. and Torney, Judith. 1967. The Development of Political Attitudes in Children. Chicago: Aldine.
Hochschild, Jennifer L. and Scovronick, Nathan. 2000. “Democratic Education and the American Dream,” pp. 209-242 in Rediscovering the Democratic Purposes of Education. Lawrence: University Press of Kansas.
Hochschild, Jennifer L. and Scovronick, Nathan. 2003. The American Dream and the Public Schools. New York: Oxford University Press.
Hurtado, Sylvia, Engberg, Mark, Ponjuan, Luis, and Landreman, Lisa. 2002. “Students’ Precollege Preparation for Participation in a Diverse Democracy.” Research in Higher Education, 43 (2) pp. 163-186.
Iyengar, Shanto. 1990. “Shortcuts to Political Knowledge: The Role of Selective Attention and Accessibility.” In Information and Democratic Processes, eds. John A. Ferejohn and James H. Kuklinski. Urbana: Illinois University Press.
Jencks, Christopher. 1992. Rethinking Social Policy. Cambridge: Harvard University Press.
Jencks, Christopher and Phillips, Meredith. 1998. “The Black-White Test Score Gap: An Introduction.” In The Black-White Test Score Gap, eds. Christopher Jencks and Meredith Phillips. Washington: Brookings Institution.
Katila, Ari, Keskinen, Esko, Hatakka, Mika, and Laapotti, Sirkku. 2004. “Does Increased Confidence Among Novice Drivers Imply a Decrease in Safety?” Accident Analysis and Prevention, 36 (4) pp. 543-551.
Keeter, Scott, Zukin, Cliff, Andolina, Molly, and Jenkins, Krista. 2002. The Civic and Political Health of the Nation: A Generational Portrait.

237
http://www.civicyouth.org/research/products/youth_index.htm.
Kirlin, Mary. 2003. “The Role of Civic Skills in Fostering Civic Engagement.” Center for Information and Research on Civic Learning and Engagement working paper 06, http://www.civicyouth.org/research/products/working_papers.htm.
_____. 2004. “Defining and Measuring Civic Skills: New Developments.” Paper presented at Conference on Civic Education Research, Reno NV September 2004.
Kruger, Justin and Dunning, David. 1999. “Unskilled and Unaware of it: How Difficulties in Recognizing One’s Own Incompetence Lead to Inflated Self-Assessments.” Journal of Personality and Social Psychology, 77 (6) pp. 1121-1134.
Kurtz, Karl, Rosenthal, Alan and Zukin, Cliff. 2003. “Citizenship; A Challenge for All Generations,” National Conference of State Legislatures. http://www.ncsl.org.
Levine, Peter and Lopez, Mark Hugo. 2002. “Youth Voter Turnout has Declined, by Any Measure,” Center for Information and Research on Civic Learning and Engagement fact sheet. http://www.civicyouth.org.
Longo, Nicholas V. 2004. “The New Student Politics: Listening to the Political Voice of Students.” Journal of Public Affairs, 7 (1) pp. 61-74.
Lopez, Mark Hugo. 2004. “Volunteering Among Young People,” Center for Information and Research on Civic Learning and Engagement fact sheet. http://www.civicyouth.org.
Lupia, Arthur and McCubbins, Mathew. 1998. The Democratic Dilemma: Can Citizens Learn What They Need to Know. Cambridge: Cambridge University Press.
March, James G. and Olsen, Johan P. 2000. “Democracy and Schooling: An Institutional Perspective.” In Rediscovering the Democratic Purposes of Education, ed. Lorraine McDonnell, P.Michael Timpane, and Roger Benjamin, pp. 148-173. Lawrence: University Press of Kansas.
McDevitt, Michael, Kiousis, Spiro, Wu, Xu, Losch, Mary, and Ripley, Travis. 2003. “The Civic Bonding of School and Family: How Kids Voting Students Enliven the Domestic Sphere,” Center for Information and Research on Civic Learning and Engagement Working paper 07. http://www.civicyouth.org.
Merelman, Richard M. 1971. “The Development of Policy Thinking in Adolescence,” American Political Science Review, 65 (4) pp. 1033-1047.
Miller, Joanne M. and Krosnick, Jon A. 2004. “Threat as a Motivator of Political Activism: A Field Experiment.” Political Psychology 25 (4), pp. 507-523.

238
Miller, Jon and Kimmel, Linda. 2003. “A Longitudinal Study of the Development of Citizenship Behaviors in Adolescence and Young Adulthood.” Paper presented to the International Society of Political Psychology, Boston, MA July 8.
Minneapolis Office of Educational Accountability. 2002. “The Minnesota Basic Skills Test: Performance Gaps on the Reading and Mathematics Tests from 1996 to 2001 by Gender, Ethnicity, Limited English Proficiency, Individual Education Plans, and Socioeconomic Status.” EDRS, Minnesota University.
Moely, Barbara E., Mercer, Sterett H., Ilustre, Vincent, Miron, Devi; and McFarland, Megan. 2002. “Psychometric Properties and Correlates of the Civic Attitudes and Skills Questionnaire (CASQ): A Measure of Students’ Attitudes Related to Service-Learning.” Michigan Journal of Community Service Learning, Spring.
National Center for Learning and Citizenship. 2003. Citizenship Education Policy Brief, State Policies to Support Citizenship Education. November. www.ecs.org.
Nelson, Jack L. 1991. “Communities, Local to National, as Influences on Social Studies Education,” pp. 332-344 in Handbook of Research on Social Studies Teaching and Learning. Ed. James P. Shaver, New York: Macmillan.
Nie, Norman H., Junn, Jane, and Stehlik-Barry, Kenneth. 1996. Education and Democratic Citizenship in America. Chicago: The University of Chicago Press.
Niemi, Richard G. and Junn, Jane. 1998. Civic Education. New Haven: Yale University Press.
Niemi, Richard G. and Smith, Julia. 2001. “Enrollments in High School Government Classes: Are We Short-Changing Both Citizenship and Political Science Training?” PS Political Science and Politics, June, pp. 281-287.
Oakes, Jeannie. 1995. “Two Cities’ Tracking and Within-School Segregation” Teachers’ College Record 96 (4) pp. 681-690.
Orenstein, Peggy. 1995. Schoolgirls: Young Women, Self-Esteem and the Confidence Gap. New York: Anchor Books.
Orfield, Gary and Lee, Chungmei. 2005. “Why Segregation Matters: Poverty and Educational Inequality.” Civil Rights Project, Harvard University. http://www.civilrightsproject.harvard.edu.
Page, Benjamin and Shapiro, Robert. 1992. The Rational Public: Fifty Years of Trends in Americans’ Policy Preferences. Chicago: University of Chicago Press.
Pangle, Lorraine Smith and Pangle, Thomas L. 2000. “What the American Founders

239
Have to Teach us About Schooling for Democratic Citizenship,” pp. 21-46 in Rediscovering the Democratic Purposes of Education. Lawrence: University Press of Kansas.
Pateman, Carole. 1970. Participation and Democratic Theory. Cambridge: Cambridge University Press.
Patrick, John J. and Hoge, John D. 1991. “Teaching Government, Civics, and Law,” pp. 427- 436 in Handbook of Research on Social Studies Teaching and Learning, ed. James P. Shaver, New York: Macmillan.
Patrick, John J. 2000. “Introduction to Education for Civic Engagement in Democracy,” pp. 1- 8 in Education for Civic Engagement: Service Learning and Other Promising Practices, eds. Sheilah Mann and John Patrick. ERIC pub. no. ED447065.
Patrick, John J. 2002. “Defining, Delivering and Defending a Common Education for Citizenship in a Democracy.” Paper presented at the Summit on Civic Learning in Teacher Preparation, Boston, MA May 15, 2002.
Phillips, Stephen, “Still in the Grip of a Troubled History,” New York Times, May 28, 2004.
Popkin, Samuel L. and Dimock, Michael A. 1999. “Political Knowledge and Citizen Competence,” pp. 117-146 in Citizen Competence and Democratic Institutions, edited by Stephen Elkin and Karol Soltan. University Park: Pennsylvania State University Press.
Putnam, Robert D. 1995. Bowling Alone. New York: Simon and Schuster.
Rensohn, Stanley. 1977. “Assumptive Frameworks in Political Socialization Theory,” chp. 1 in Handbook of Political Socialization, ed. Stanley Renshon. New York: Macmillan.
Rosenstone, Steven J. and Hansen, John M. 1993. Mobilization, Participation, and Democracy in America. New York: Macmillan Publishing Company.
Sanders, William and Rivers, June. 1996. “Cumulative and Residual Effects of Teachers on Future Student Academic Achievement,” University of Tennessee Value-Added Research and Assessment Center, www.coe.ohio-state.edu/ahoy/Sanders%20and%20Rivers.pdf.
Schur, Lisa. 2003. “Employment and the Creation of an Active Citizenry.” British Journal of Industrial Relations 41 (4) pp. 751-771.
Schwadel, Philip. 2002. “Testing the Promise of the Churches: Income Inequality in the

240
Opportunity to Learn Civic Skills in Christian Congregations.” Journal for the Scientific Study of Religion, 41 (3) pp. 565-576.
Skocpol, Theda. 1999. “How Americans Became Civic,” pp. 27-80 in Civic Engagement in American Democracy, eds. Theda Skocpol and Morris Fiorina. Washington: Brookings Institution Press.
Slovacek, Simeon; Kunnan, Antony; and Kim, Hae-Jin. 2002. “California Charter Schools Serving Low-SES Students: An Analysis of the Academic Performance Index.” Program Evaluation and Research Collaborative, Charter College of Education, California State University, Los Angeles.
Smiley, Marion. 1999. “Democratic Citizenship: A Question of Competence?” pp. 371-384 in Citizen Competence and Democratic Institutions, edited by Stephen Elkin and Karol Soltan. University Park: Pennsylvania State University Press.
Sniderman, Paul M., Brody, Richard A., and Tetlock, Philip E. 1991. Reasoning and Choice: Explorations in Political Psychology. Cambridge: Cambridge University Press.
Smith, Jeffrey and Todd, Petra. 2004. “Does Matching Overcome LaLonde’s Critique of Nonexperimental Estimators?” forthcoming, Journal of Econometrics.
Soltan, Karol. 1999. “Introduction: Civic Competence, Democracy, and the Good Society,” pp. 1-13 in Citizen Competence and Democratic Institutions, edited by Stephen Elkin and Karol Soltan. University Park: Pennsylvania State University Press.
Soltan, Karol. 1999a. “Civic Competence, Attractiveness, and Maturity,” pp. 17-38 in Citizen Competence and Democratic Institutions, edited by Stephen Elkin and Karol Soltan. University Park: Pennsylvania State University Press.
Stagg, Allison. 2004. “Service Learning in K-12 Public Education,” Center for Information and Research on Civic Learning and Engagement fact sheet. http://www.civicyouth.org.
Strate, John M., Parrish, Charles J., Elder, Charles D., and Ford, Coit III. 1989. “Life Span Civic Development and Voting Participation.” American Political Science Review (2) pp. 443-464.
Tocqueville, Alexis de. 1993. Democracy in America, Book Two. trans. Gerald Bevan. New York: Penguin Books.
Torney-Purta, Judith. 2002. “The School’s Role in Developing Civic Engagement: A Study of Adolescents in Twenty-Eight Countries.” Applied Developmental Science, 6 (4) pp. 203-212.

241
Torney-Purta, Judith and Barber, Carolyn Henry. 2004. “Democratic School Participation and Civic Attitudes among European Adolescents: Analysis of Data from the IEA Civic Education Study.” Paper presented at the Conference on Civic Education Research, Reno, NV September 2004.
Torney-Purta, Judith, Lehmann, Rainer, Oswald, H., Schultz, W. 2001. Citizenship and Education in Twenty-Eight Countries: Civic Knowledge and Engagement at Age Fourteen. Amsterdam: International Association for the Evaluation of Educational Achievement. http://www.wam.umd.edu/~iea.
Torney-Purta, Judith. 1990. “Youth in Relation to Social Institutions,” pp. 457-477 in At the Threshold, The Developing Adolescent. Eds. S. Shirley Feldman and Glen R. Elliott. Cambridge: Harvard University Press.
U.S. Department of Education, National Center for Education Statistics. 2001. National Household Education Surveys, Civic Involvement Youth Survey. http://nces.ed.gov/nhes/.
Verba, Sidney and Nie, Norman H. 1972. Participation in America. New York: Harper and Row.
Verba, Sidney, Kay Lehman Schlozman, and Henry E. Brady. 1995. Voice and Equality. Cambridge: Harvard University Press.
Verba, Sidney, Kay Lehman Schlozman, Henry E. Brady, and Norman Nie. 1990. American Citizen Participation Study [Computer file]. ICPSR version. Chicago, IL: University of Chicago, National Opinion Research Center (NORC) [producer], 1995. Ann Arbor, MI:
Wattenberg, Martin P. 1984. The Decline of American Political Parties, 1952-1980. Cambridge: Harvard University Press.
Weiss, Andrew R., Lutkus, Anthony, Grigg, Wendy, and Niemi, Richard. 2001. “The Next Generation of Citizens: NAEP Civics Assessments: 1988 and 1998.” Education Statistics Quarterly, 3 (3) pp. 21-24.
Westheimer, Joel and Kahne, Joseph. 2004. “Educating the ‘Good’ Citizen: Political Choices and Pedagogical Goals.” PS Political Science and Politics, April, pp. 241-247.
Wilson, William Julius. 1996. When Work Disappears. New York: Vintage Books.
Winfield, Linda. 1990. “School Competency Testing Reforms and Student Achievement: Exploring a National Perspective,” Educational Evaluation and Policy Analysis 12 (2) pp. 157-173.

242
Winter, Greg, “Financial Gap is Widening for Rich and Poor Schools,” New York Times, October 6, 2004.
Youniss, James; McLellan, Jeffrey; and Yates, Miranda. 2001. “A Developmental Approach to Civil Society.” pp. 243-253 in Beyond Tocqueville: Civil Society and the Social Capital Debate in Comparative Perspective. eds. Bob Edwards, Michael Foley and Mario Diani. Hanover: University Press of New England.