abstract - open repositoryarizona.openrepository.com/arizona/bitstream/10150/244475/1/azu... ·...
TRANSCRIPT

Covert IR-Laser Remote Listening Device
Item Type text; Electronic Thesis
Authors Melena, Nicholas; Neuenfeldt, Nicholas; Slagel, Adam; Hamel,Matthew; Mackin, Charles; Smith, Collin
Publisher The University of Arizona.
Rights Copyright © is held by the author. Digital access to this materialis made possible by the University Libraries, University of Arizona.Further transmission, reproduction or presentation (such aspublic display or performance) of protected items is prohibitedexcept with permission of the author.
Download date 18/06/2018 12:18:28
Link to Item http://hdl.handle.net/10150/244475


Abstract: This honors thesis details the performance, specifications, and process used in designing and building the Covert IR‐Laser Remote Listening Device (RLD.) In the interests of national security and law enforcement, it is some times necessary to perform covert surveillance of a target. The purpose of this product was to create an inexpensive, novel prototype capable of detecting and recording conversation from behind a window or within an automobile. Our final product utilizes window vibrations to deflect an infrared laser beam reflected off of the window surface. The deflections of this reflected beam cause changes in intensity of the light incident upon the photodetector within our product, and these fluctuations are then reconverted to audible sound. The final design prototype has been used to reliably detect sound from behind a window at ranges up to at least 20 feet in the direct reflection condition. This product is the result of funding by Lockheed Martin Advanced Systems in conjunction with the University of Arizona engineering senior design class.
1
Statement of Rolls and Responsibilities Nicholas Melena‐ My contribution to this product was to serve as the expert and guide in theory and physics behind our product. In this role I assessed the impact of acoustic vibrations on a window, and the correlation that these would have on light incident on a vibrating window. I was also responsible for analyzing the impact that reflection and propagation has on the laser light used in our system in terms of coherence, polarization, attenuation, and other key parameters that affect the ability to gather reflected light and produce a useable signal.
In addition to this largely theory based roll, I also served as a key contributor in the designing, building, and testing of our system. I personally designed and build the webcam alignment system which is used to aim our collection system, and which we can use to see the infrared spot produced by our laser(which is invisible to the naked eye.) I also selected the detector used in our system, and have worked with the team assembling and testing the system as a whole and in pieces as our project has progressed.
Nicholas Neuenfeldt‐ One of his largest rolls has been to serve as the team leader and liaison between our team, our sponsor at Lockheed Martin, and our team mentor. In addition to this he has also been responsible for submitting part orders, and making sure all our system components get to us. He has also worked in lab assembling and testing our system.
Matt Hamel‐ Matt’s primary responsibility was making sure our system gathered enough light to produce a useable signal. This entailed making sure that we got a laser that outputs enough light, and that our collection system is large enough to collect enough light for our detector to work with. In addition to the math required design our system, Matt also played a major role in modeling much of our original system in solid works, so that we would have a digital model to work off of .
Charles Mackin‐ Charles was the only electrical engineer on our team, and so he handled the majority of the electrical and software side of our project. This meant using labview to interact with our analog to digital converter and using programs like matlab and adobe audition to filter our signal in to audible conversation.
Adam Slagel‐ One of Adam’s primary accomplishments was designing the optical collection system used by our project. This was a 4 element system that needed to deal with collimating, filtering, and then refocusing the light from our giant 8” collection lens. Adam also worked in the lab and in the shop to build, assemble, and test our system.
Collin Smith‐ Collin was the only mechanical engineer on our team, and because of this he was primarily responsible for designing the two boxes that hold our system, and machining the them to hold all of our components. He also worked with us in lab to build, assemble, and test our system at all steps of the process.

2
Remote Listening Device Final Report
Submitted by: Team 4961
Nicholas Neuenfeldt, Matthew Hamel, Adam Slagel,
Nicholas Melena, Collin Smith, Charles Mackin
Submitted to:
Mentor: Patrick Marcus
Sponsor: Richard Tansey
Submitted on:
May 3, 2012
Interdisciplinary Engineering Design Program
University of Arizona
We, the undersigned authors, hereby declare the originality of all material in this report, unless properly cited or referenced.

4
Table of Contents REMOTE LISTENING DEVICE .............................................................................................................................................................................. 3
1.0 INTRODUCTION: ..................................................................................................................................................................... 6
1.1 EXECUTIVE SUMMARY .............................................................................................................................................................................. 6 1.2 MISSION STATEMENT AND BACKGROUND............................................................................................................................................... 6 1.3 CUSTOMER DESCRIPTION ......................................................................................................................................................................... 7 1.4 PROJECT SCOPE AND EXPECTATIONS ....................................................................................................................................................... 7 1.5 CHANGES SINCE CRITICAL DESIGN REVIEW ............................................................................................................................................... 7
2.0 SYSTEM REQUIREMENTS: ..................................................................................................................................................... 8
2.1 CUSTOMER REQUIREMENTS ..................................................................................................................................................................... 8 2.2 DESIRED REQUIREMENTS .......................................................................................................................................................................... 8
3.0 SUMMARY OF PDR RESULTS: ............................................................................................................................................... 8
4.0 HIGH LEVEL OVERVIEW: ..................................................................................................................................................... 10
5.0 SUBSYSTEM/SUB‐ASSEMBLY AND INTERFACE DESIGN (HARDWARE): .................................................................... 10
5.1 LASER SUBSYSTEM ........................................................................................................................................................................... 11 5.2 COLLECTION SUBSYSTEM ................................................................................................................................................................. 12 5.3 DETECTOR SUBSYSTEM .................................................................................................................................................................... 13 5.4 ALIGNMENT SUBSYSTEM ................................................................................................................................................................. 15 5.5 MECHANICAL SUPPORT SUBSYSTEM .............................................................................................................................................. 17
5.5.1 Optical Component Mounting .............................................................................................................................................. 17 5.5.2 Housing ......................................................................................................................................................................................... 17 5.5.3 Main Lens Barrel ........................................................................................................................................................................ 17
5.1 ELECTRICAL HARDWARE SUBSYSTEM ....................................................................................................................................................... 18
6.0 ALGORITHM DESCRIPTION & INTERFACE DOCUMENT (SOFTWARE): ....................................................................... 18
6.1 LABVIEW FOR SIGNAL ACQUISITION AND SIGNAL STORAGE ................................................................................................................. 18 6.2 MATLAB FOR BAND‐PASS AND NOTCH FILTERING ............................................................................................................................... 18 6.3 ADOBE AUDITION FOR AUDIO EDITING AND RESTORATION ................................................................................................................... 19
7.0 ANALYSIS: ............................................................................................................................................................................. 20
7.1 MECHANICAL SUBSYSTEM ........................................................................................................................................................................ 20 7.2 OPTICAL SUBSYSTEM ................................................................................................................................................................................ 21 7.3 ELECTRICAL SUBSYSTEM ........................................................................................................................................................................... 23
8.0 DEVELOPMENT PLAN AND IMPLEMENTATION: ............................................................................................................ 24
9.0 OPERATION MANUAL: ........................................................................................................................................................ 26
9.1 SETUP ........................................................................................................................................................................................................ 26
10.0 REQUIREMENTS REVIEW AND THE ACCEPTANCE TEST PLAN: ................................................................................. 27
PART 1: THE ACCEPTANCE TEST PLAN: .......................................................................................................................................................... 27 PART 2: REQUIREMENTS REVIEW BASED ON FINAL DESIGN: ........................................................................................................................ 30

5
11.0 CLOSURE: ............................................................................................................................................................................ 31
REFERENCES ................................................................................................................................................................................ 33
APPENDIX A: FIGURES AND TABLES ....................................................................................................................................... 34
APPENDIX B: BUDGET AND MATERIALS LIST ........................................................................................................................ 51
APPENDIX C: PROJECT MANAGEMENT .................................................................................................................................. 52
APPENDIX D: TEAM MEMBER CONTRIBUTIONS ................................................... ERROR! BOOKMARK NOT DEFINED.

6
1.0 Introduction:
1.1 Executive Summary There currently exists a void for a long range covert listening device capable of being easily deployed against an adversary in a vehicle. Existing system designs focus on retrieving audible sound between 100‐3000Hz, i.e. sensitive receivers, wireless transmitters, etc. These systems functionality becomes useless when the target has a physical medium between themselves and the receiver i.e. in an enclosed car. A reflected light based system would be capable of retrieving the remote audio despite the limitations other designs encounter.
The objective of developing a Remote Listening Device is to construct a system capable of receiving a conversation held inside a vehicle. This concept has enormous implications for use in military, government, commercial, and law enforcement applications. The design will incorporate a laser light source, collection aperture, detector, and data‐processing backend. The laser will be emitted against the target window, while the collections system and detector will capture the diffuse scattering of the reflection in order to be processed into an audio signal.
Initially, the device will be tested against a window with a constant signal generator mounted behind it to provide a proof of concept and baseline. Once the system is receiving a reliable signal, the signal generator will be replaced with a speaker system to try and capture the changing frequencies of a human voice. Finally the device will be tested in real‐world conditions outside of the lab in order to finalize the product. If the device performs exceptionally well, an alternate goal of using reflected sunlight to transmit the signal will be explored using the same process.
The final product of this project will be a device capable of being focused on a window mounted in a remote car, which has a conversation taking place inside, and listen in covertly and reliably.
1.2 Mission Statement and Background The mission statement is stated as the following: “Design, fabricate and test a device to listen to conversations produced by people talking at normal levels in a car or room. Recommended approach is to reflect a suitable laser from the window of the car or room and use a telescope and electronics to detect the conversation. Students are encouraged to also try using sunlight from a mirror reflection off the window as a possible source. However the laser technique must be first implemented before the sunlight source is attempted.”
The problems associated with current market designs is the need to be positioned correctly to receive the direct reflection, and the additional interference introduced due to the device not having an integrated light source. Some devices that exist can overcome the light source issue, but they come at a significantly higher cost which makes them very cost prohibitive, as well as still requiring the direct reflection off the surface to function.

7
Receiving the diffuse light scattered during reflection would allow a device to operate from all reasonable angles. As such, there exists no device which is designed to capture the diffuse scattering of a reflected laser source and convert it to an audio signal. From this mission statement and background information, design requirements and goals were created in order to determine final product performance.
1.3 Customer Description This project is sponsored by Richard Tansey at Lockheed Martin Advanced Technology Center. Dr. Tansey has a PhD in Physics, patents in electro‐optics, and research interests in remote sensing, low light sensors, laser design, etc.
1.4 Project Scope and Expectations In this project, the device will be designed for ranged audio detection in an enclosed
vehicle. This objective will be achieved by the use of a unit that will emit, detect, and analyze a laser light source. The light source that is emitted will be aimed at a glass window on a vehicle in order to detect the vibrations caused by a standard conversation. The method that will interpolate the signal will consist of a hardware and software system. This will convert the feedback from the light source into the audio signal being detected.
This project is expected to be operable by a single trained person, be reasonably portable, and safe to the target. The product is only designed to be targeted at glass windows in a car, additional variables might exist for other surfaces which are not tested. Additionally, it is desired that the device reach a certain degree of accuracy with the received signal, and be able to interface with standard audio equipment.
1.5 Changes Since Critical Design Review The changes since our critical design review have been very minimal. The only change since our CDR is the signal collection system. We have moved from a cylindrical mount that houses all of the optical components to mounting all components on posts, but keeping the large diameter collection lens in a barrel. The posts were mounted using ¼‐20 screws and washers to correct for height. The aluminum plate had a slit added to it so the optics could be slid along the optical axis for proper alignment.
The last change that we made was the alignment system. Our original design incorporated a flip mirror to direct the light to a webcam so that we could view where the system was aimed. In the final design we placed the flip mirror on a rotating post so it could be moved into the optical axis. This was done because the aberrations were to great with the other method and no image was obtainable.

8
2.0 System Requirements:
2.1 Customer Requirements The device must be capable of collecting scattered light from a car window and converting the signal into an audio signal of a conversation. The system must be able to detect frequencies between 100‐3000Hz in order to cover most of the range used by the human voice. In order to be remote and covert, the system must be able to receive a usable signal from at least 20ft. Since cost and size are huge factors in product choice for individuals, the device must cost less than $3,000 and weigh no more than 70lbs. Above all, the device and laser light emitted must not be dangerous to anyone.
2.2 Desired Requirements Covert
- Use of a near‐infrared (NIR) laser source so it is undetectable by the target Additional light sources
- Use of reflected sunlight as the signal source, which would eliminate a large cost, weight, and dangerous aspect from the device.
3.0 Summary of PDR Results: The primary goal of the preliminary design review (here after PDR) was to take the rough design outline that was conceived following the concept of operations and systems requirements review, and examine various paths of fulfilling our system design requirements. The PDR was structured such that our team would explore at least three different designs that could be used to complete our project. Our group was in good agreement going into the PDR about what general form our design was going to take, due to this it was decided that our PDR would focus on creating different design options and tradeoff studies for the most important systems within our design. The systems that we analyzed were: the light emission system, the light collection system, the detector system, the alignment system, and the signal processing system.
The light emission system is the means by which our device will illuminate the target with light that will then be reflected off a vibrating surface picking up vibration information. Our primary design options were a diode laser or an LED array with a collimating lens system. Due to the higher irradiance and lower divergence of a diode laser, we chose to use an 830nm 10 mW continuous wave laser.
The light collection system is what our device will use to collect light reflected off of the target surface, and then focus this light onto the detector in our system. There were three viable design options that we considered for this system. The first was a reflecting telescope system, the second was a commercial off the shelf zoom lens, and the third was a custom made lens system. At the time our conclusion was that a commercial off

9
the shelf zoom lens would provide the optimum balance between cost, light gathering capability, and size.
The detector system is what will turn the collected optical signal from our system into a useable electrical signal. There were a number of detectors examined for our system, it was decided based on noise equivalent power and frequency response that the NewFocus 2001FS‐M would be the optimal detector for the frequencies and intensities of light that we would be dealing with. This detector will be paired with a narrow bandwidth wavelength filter that will allow us to filter out any unwanted wavelengths of light and drastically reduce optical noise.
The alignment system is what will allow us to point our system and know that we are aimed correctly and receiving signal reflected from our target. The major design options considered were: bore sighting a visible laser so that we could see where our reflected beam was going, using a flip mirror or beam splitter to divert the signal going to our detector onto a webcam and image in real time what our system is seeing, or using a dual red dot sight alignment system to aim our light collector and emitter at the target. Based on the added ability to see what our target is looking at, we opted to use a beam splitter to image our target in real time.
The signals processing system is the system that will take the raw output voltage or current signal from our detector and turn it into useable audio sound. We concluded that the method that would allow us the most flexibility in our signal filtering and formatting was to use LabView possibly in tandem with MatLab to do all our signals processing.
In the month following the PDR, our system has undergone some changes. The major changes are that we plan to use 100 mW 808nm modulated laser for our light emitter. This change was made because this laser will allow us more flexibility in the output power from our system. While our final system will still be limited to 10 mW max output power for safety reasons, this extra power will make testing and optimization of our system in lab easier. In addition, since the laser is modulated, we will be using amplitude modulation to further reduce noise in our signal. Another change since the PDR is that we have opted to go with a custom designed light collection system based around a 5 inch aperture lens. This choice was made based on a radiometric analysis which indicated that the 3 inch aperture of a standard zoom lens would not produce as much signal as was desired for our system. In addition this will allow us to have an intermediate area within the lens of collimated light that will allow our system to use a very narrow wavelength filter. These comprise the major results of our preliminary design review, and the major changes to our system that have followed.

10
4.0 High Level Overview: This section will give a high level design behind the remote listening device. The device
will be able to detect an audio signal in an enclosed vehicle. This will be accomplished by using a modulated laser source to bounce off the window of the vehicle. The return signal will be collected and processed through an integrated software system. After the signal processing the system will be able to interface with standard audio listening devices and recording devices. You can see a visual depiction of the basic setup in Figure 1 below.
Figure 1: High Level Design
The device will consist of the following:
A light emission source to illuminate the intended target A light collection system to increase the amount of light collected A detector to detect the modulation in the light collected A data processing system to demodulate the signal into an audible
conversion
5.0 Subsystem/Sub‐assembly and Interface Design (Hardware):
The Remote Listening Device is comprised of five main hardware subsystems. The laser subsystem to emit light, the collection system to receive and focus the reflected signal, the detector to convert the optical signal into an electrical signal and output it to the backend signal processing system and a webcam for alignment. The fifth main hardware system is the framing
11
and mounting structure used to hold and align the system. Each subsystem and its components will be fully discussed in the sections to follow.
5.1 Laser Subsystem The laser subsystem was designed to emit a coherent beam of light that will be able to
pick up modulations due to the vibrating target window. These modulations can then be transformed into a useable electrical signal by the detector. It consists of a laser, its power supply and a mechanical housing. Choosing a laser came down to four main parameters: the wavelength at which it emits, the output power, safety, and the cost. We want to covertly listen to conversations, so this limits the range of wavelengths that we can use to the ultraviolet region and the infrared region. Using ultraviolet light would give us near 100% reflection off of the window, but its rays are dangerous when used near human eyes and skin. This option was quickly defeated. We then looked at using infrared light. Using infrared light does not give us as much reflectivity as the Ultraviolet light does, but it is still invisible to the human eye and not harmful to the human skin. It can still be damaging to the human eye, as any laser can, when the power is high enough and exposure time is long enough. The choice for choosing a laser then came down to finding a safe and cost effective infrared laser.
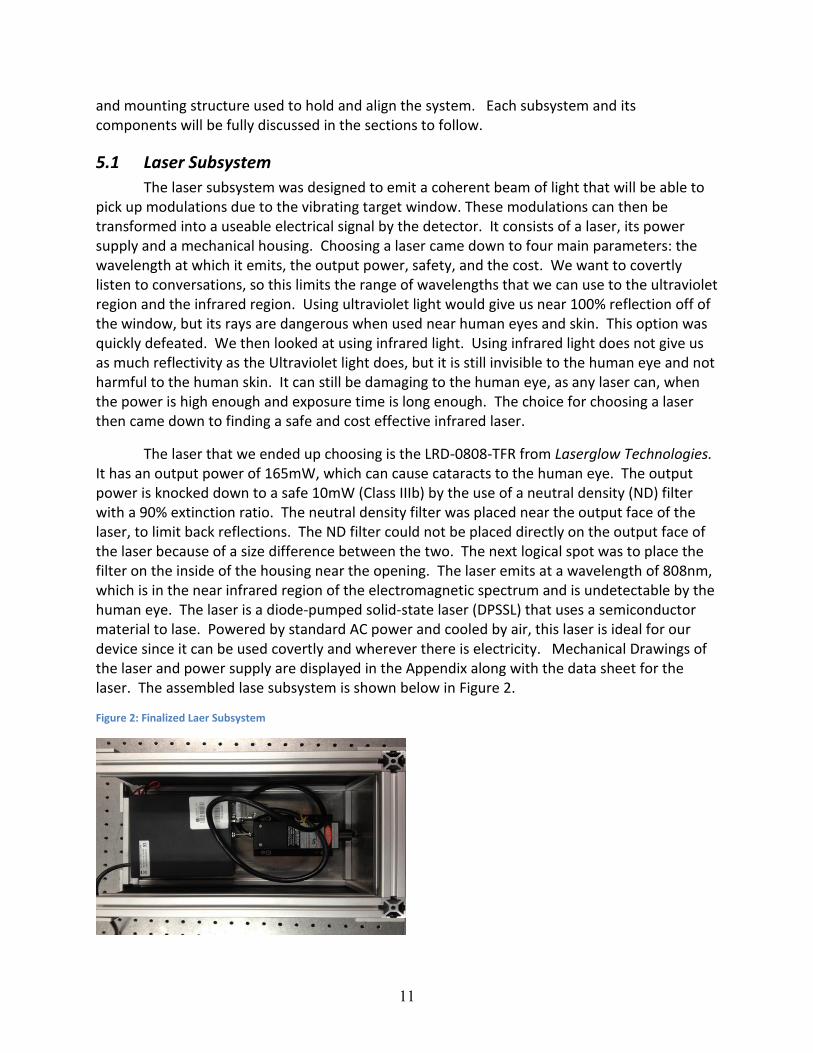
The laser that we ended up choosing is the LRD‐0808‐TFR from Laserglow Technologies. It has an output power of 165mW, which can cause cataracts to the human eye. The output power is knocked down to a safe 10mW (Class IIIb) by the use of a neutral density (ND) filter with a 90% extinction ratio. The neutral density filter was placed near the output face of the laser, to limit back reflections. The ND filter could not be placed directly on the output face of the laser because of a size difference between the two. The next logical spot was to place the filter on the inside of the housing near the opening. The laser emits at a wavelength of 808nm, which is in the near infrared region of the electromagnetic spectrum and is undetectable by the human eye. The laser is a diode‐pumped solid‐state laser (DPSSL) that uses a semiconductor material to lase. Powered by standard AC power and cooled by air, this laser is ideal for our device since it can be used covertly and wherever there is electricity. Mechanical Drawings of the laser and power supply are displayed in the Appendix along with the data sheet for the laser. The assembled lase subsystem is shown below in Figure 2.
Figure 2: Finalized Laer Subsystem

12
5.2 Collection subsystem The collection subsystem is an all optical system that was designed to collect the
modulated signal from the window and focus it onto a detector for post processing. The main design considerations were that it needed to collect the low intensity light being reflected off the window and optically filter the collected signal to help reduce the noise. We wanted to design the collection system to collect the most light possible. We are expecting to collect very little light since we want to be able to pick up the non‐direct reflection off of the window. This would allow us to collect the signal from anywhere and not have to be concerned with aligning the system to the direct reflection. This was achieved by using radiometric calculations and assuming that we are getting a percent of 1% of the light reflected off the window. A table including the results from these calculations is included in Appendix A. From these calculations we determined that we needed an 8 inch (200mm) diameter lens at the front of our collection system. We found a plano‐convex lens from Edmund Optics that had an 8 inch diameter with a 16 inch (400mm) focal length. Knowing the parameters for our collection lens and that we wanted to use an optical bandpass filter, we could begin designing this subsystem. Optical filters have the inherent property that the transmissivity varies greatly with the angle of incidence on the filter. Due to this effect, we decided to design an optical system that produces collimated light (light that does not diverge) incident on the filter. This means that the angle of incidence on the filter will be zero degrees, which should allow maximum transmission at our laser wavelength. Collimated light was achieved by placing a negative lens (diverging lens) behind the 8 inch collection lens a distance equal to the sum of the focal lengths of the two lenses. This forms a Galilean telescope. The filter was then placed after the negative (collimation) lens.
We chose to use an optical bandpass filter from Edmund Optics with a 50nm bandwidth centered around 800nm. This allowed us to filter out the optical noise outside the wavelength range of our laser to help improve the signal to noise ratio of our signal. The bandpass filter blocks wavelengths outside of the “window” by causing the waves to destructively interfere with themselves, thus not letting those wavelengths through.
The last optical element of the collection subsystem is the focusing lens. This lens takes the collimated light that has been filtered and focuses it onto our detector. This lens is a positive (bi‐convex) lens (converging lens) and needed to have a relatively short focal length in order to minimize the spot size and decrease the length of the subsystem. We chose a 20mm diameter, 20mm focal length lens from Edmund Optics. This is a fast lens (F/1) and had the shortest focal length given that the lens needed to have a diameter greater than our beam diameter, in order to focus our entire signal onto the detector.
Our finalized collection subsystem is shown in Figure 3 below. Before being built, the system was modeled in Zemax, an optical design software, to ensure that the design was feasible given our off the shelf components and that we could produce collimated light for the bandpass filter. We verified that our design would produce collimated light. The model also

13
verified that the optical system could focus the light to a spot size smaller than the active area of the detector. In the model, the reflected light enters the system from the left by passing through the 8 inch lens and then gets collimated by the negative lens. The collimated light passes through the optical bandpass filter and is then focused on to the detector by the positive lens. Figure 4 shows the assembled collection subsystem.
Figure 3: 2D Layout of Collection Subsystem
Figure 4: Finalized Collection Subsystem
5.3 Detector Subsystem The detector subsystem is responsible for converting the optical signal collected by the collection system into a useable electrical signal that can be measured and manipulated by a computer. The design of our detector subsystem was constrained by several factors. The light was going to be near infrared, the light collected was going to be low intensity, and the cutoff frequency only needed to be in the 10 kHz range.
Knowing that the detector would be used in the near infrared(NIR) made the selection of the detector material easy. Silicon photodetectors are the obvious choice for affordable detectors in the 0.6‐1.1m wavelength range. The silicon band gap of 1.13 microns causes the

14
responsivity curve to peak in this NIR range, where responsivity is the measure of conversion efficiency between photon power and electrical current. A graph of the responsivity curve for our detector is presented in Figure 5 below as was reported in the NewFocus 2001 FS‐M users manual.
Figure 5: Detector responsivity curve
The other key parameters (cutoff frequency and low intensity measurement) were both used to pick the specific detector that the system would use. The cutoff frequency of approximately 10kHz is very low in terms of detector operations, this was so low that it meant that detector area and capacitance would have virtually no impact on our ability to measure the signal frequencies we were interested in, regardless of the detector we chose. This allowed us to focus on finding the detector with the best noise equivalent power rating that we could find. Noise equivalent power(NEP) is the measure of how much signal power is required to get above the noise floor of the detector, and therefore a very low NEP is desirable because it implies that the detector is capable of detecting even very faint optical signals.
Based on these factors we were able to make a detector selection. We compared a number of different types of detectors based on these criteria as well as some others, and used a decision matrix to find the best detector for our project. This decision matrix, complete with values, can be found below in Table 1. The best choice was found to be the NewFocus FS‐M. This detector is slow in terms of most detectors (cutoff frequency around 200kHz) but well fast enough for the purpose of this project, but it has a very low NEP (0.25 pW/(Hz)1/2 at the maximum gain setting.) In addition this detector has an adjustable built‐in high pass filter, low pass filter, and variable gain setting. These built‐in adjustment settings allow us to perform some initial signals processing so that the electrical signal output by the detector is above the minimum voltage threshold for our analog to digital converter. The detector used in our system was graciously lent to us by our sponsor, Dr. Richard Tansey.
Table 1: Detector selection matrix
New Focus 2001 FS‐M
Thor Labs PDA100A‐EC
Newport 1621 Nanosecond Photodetector
Newport 818‐SL‐L/DB

15
5.4 Alignment Subsystem The design choice to use a NIR laser as the illumination source for this system is nice in terms of the functionality of the product, but it adds a number of additional constraints and considerations to the system design. One of these design considerations was that because we could not see the illuminating beam, it was no longer possible to easily see the reflected beam as it was with the HeNe laser that was used to test our design concept in lab. In order to remedy this, as well as provide some additional functionality to our system, we decided we needed an alignment system that was capable of collecting video of the area being observed by our collection system, both in visible light as well as in the near infrared, and was also able to move out of the way of the beam path so that all the light makes it to the detector when performing audio surveillance.
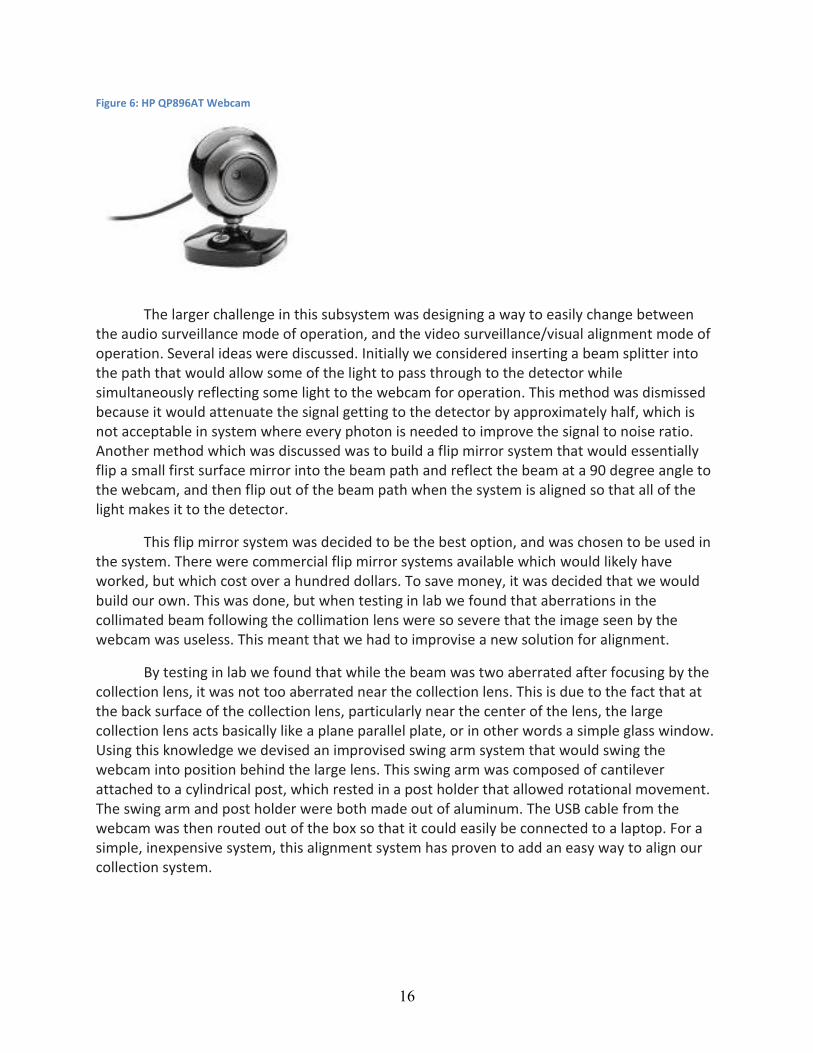
In order to accomplish this, it was decided that a webcam was the best choice to collect real time video signal. This was due to the fact that webcams are readily available, inexpensive, easy to use, and capable of seeing in the near IR. The webcam chosen for our system was the HP QP896AT, which was small, relatively easy to mount, and under twenty dollars. An image of the webcam is presented below in Figure 6.
Parameters Weight Option 1 Option 2 Option 3 Option 4
Cost 0.18 0.068 0.176 0.113 0.146
Frequency Range 0.18 0.176 0.176 0.176 0.176 Noise Equivalent Power 0.29 0.294 0.035 ? 0.134
Wavelength Range 0.18 0.176 0.176 0.176 0.176
Max Gain 0.12 0.118 0.024 0.012 0.000
Size 0.06 0.004 0.016 0.007 0.059
Total Value 1 0.836 0.604 0.484‐0.774 0.691
16
Figure 6: HP QP896AT Webcam
The larger challenge in this subsystem was designing a way to easily change between the audio surveillance mode of operation, and the video surveillance/visual alignment mode of operation. Several ideas were discussed. Initially we considered inserting a beam splitter into the path that would allow some of the light to pass through to the detector while simultaneously reflecting some light to the webcam for operation. This method was dismissed because it would attenuate the signal getting to the detector by approximately half, which is not acceptable in system where every photon is needed to improve the signal to noise ratio. Another method which was discussed was to build a flip mirror system that would essentially flip a small first surface mirror into the beam path and reflect the beam at a 90 degree angle to the webcam, and then flip out of the beam path when the system is aligned so that all of the light makes it to the detector.
This flip mirror system was decided to be the best option, and was chosen to be used in the system. There were commercial flip mirror systems available which would likely have worked, but which cost over a hundred dollars. To save money, it was decided that we would build our own. This was done, but when testing in lab we found that aberrations in the collimated beam following the collimation lens were so severe that the image seen by the webcam was useless. This meant that we had to improvise a new solution for alignment.
By testing in lab we found that while the beam was two aberrated after focusing by the collection lens, it was not too aberrated near the collection lens. This is due to the fact that at the back surface of the collection lens, particularly near the center of the lens, the large collection lens acts basically like a plane parallel plate, or in other words a simple glass window. Using this knowledge we devised an improvised swing arm system that would swing the webcam into position behind the large lens. This swing arm was composed of cantilever attached to a cylindrical post, which rested in a post holder that allowed rotational movement. The swing arm and post holder were both made out of aluminum. The USB cable from the webcam was then routed out of the box so that it could easily be connected to a laptop. For a simple, inexpensive system, this alignment system has proven to add an easy way to align our collection system.

17
5.5 Mechanical Support Subsystem The mechanical design is relatively simple aside from one critical component. The components will be housed in two separate 6061T6 aluminum boxes with 80/20 aluminum T‐Slot framing. The laser and power supply will have its own housing while the light collection system, optical filters, and detector will be in a separate housing. The housing for both the laser and collection system will be separate in order to increase the ease with which the reflected signal can be aligned and detected. The laser source will be positioned and rotated about 70‐90o from the main axis of the collection system housing. Allowing the laser to be angled towards the housing when reflecting off the target surface increases the amount of reflected light into the collection system for detection.
5.5.1 Optical Component Mounting All components contained inside the collection system housing are mounted on standard optical posts and secured to the breadboard with traditional ¼‐20 hex bolts of ½ inch length. The breadboard is machined to allow adjustments in the position of the optical filters – which serves to future proof the board if additional components require addition or replacement is required.
5.5.2 Housing The laser and collection system housing’s will be constructed from T‐Slot 1 inch‐square aluminum framing, with precision machined aluminum panels for critical components. Only the front side and bottom plate of both housings are machined aluminum plate – the other four sides are painted Acrylic which significantly reduces the overall weight of the system.
Using T‐Slotted framing with panels greatly increases the modularity of the system, as it becomes simplistic to assemble/disassemble the entire system for transport. The frame also increases the overall rigidity to reduce vibrations interfering with the detected signal.
5.5.3 Main Lens Barrel The main collection lens is 200 millimeter in diameter with a focal length of nearly 16 inches. The lens is used to focus all available incoming light to a single point for filtering, detection, and analysis. The lens barrel was precision machined from a single solid 9 inch diameter round shaft, which was mounted on a 14 inch lathe. In order to maintain the precise focal point required for detection, the inside diameter of the lens barrel was machined to be 200 millimeter nominal with less than 2o of overall taper. The lens barrel achieved a tolerance of 1/20th of 1 millimeter with less than 0.5o taper.
The barrel with secured lens was mounted through a CNC‐milled 6061 aluminum plate in the front face of the collection system. The barrel is secured with four ¼‐20 set screws which are positioned 90o apart around the outside diameter of the barrel. The set screws allowed for minute adjustments to be made to align the barrel with the main axis of the housing, and then were further equally tightened to securely mount it in place. A schematic drawing the lens barrel can be found in Appendix A.
18
5.1 Electrical Hardware Subsystem The electrical hardware subsystem serves two main purposes: to translate the analog
sensor signal to a digital signal and to provide this data to the software subsystem. The electrical hardware subsystem consists solely of the National Instruments USB‐6009 data acquisition (DAQ) unit. The DAQ contains a 14‐bit analog‐to‐digital converter (ADC) and a maximum sample rate of 48 ksps. In addition, the tool is designed to connect to a computer via USB and use LabVIEW for the hardware‐software interface.
6.0 Algorithm Description & Interface Document (Software):
The Remote Listening Device project incorporates several software tools. LabVIEW operates in conjunction with National Instruments data acquisition hardware to obtain and store the photo‐detector signal. Post‐acquisition signal processing may then be performed using whatever software tools the user is most competent and comfortable with. Two post‐acquisition processing tools were explored: custom MATLAB code which offers a great deal of control over signal manipulation at the cost writing time‐consuming code; and Adobe Audition, a commercial software tool designed specifically for audio editing and restoration, which offers many built‐in features but does not allow for the same control over signal manipulation specifics.
6.1 LabVIEW for Signal Acquisition and Signal Storage The basis for the LabVIEW code is rather straightforward. Its primary purpose is to acquire the photo‐detector signal and store it in a lossless file format such as a WAV for later processing. This involves a number of other steps including correctly interfacing with hardware, setting an appropriate sample rate, and incorporating basic while loop timing.. Experimental results consistently showed noise at frequencies of 3.5 kHz and above. Because of this, the LabVIEW code performs some preliminary filtering using a low‐pass filter with a 3.2 kHz cutoff frequency. If desired, the LabVIEW code is capable of playing the unprocessed photo‐detector signal to the user in real‐time. For the specific layout of the LabVIEW Diagram Panel please see the appendix.
6.2 MATLAB for Band‐pass and Notch Filtering Figure 7: MatLab filtering Scheme Overview

19
MATLAB code was written to perform ideal band‐pass and notch filtering of the signal data. The code was flexible enough to allow the user to easily modify the band‐pass cutoff frequencies. Additionally, the code allows the user to incorporate an arbitrary number of notch filters to remove noise known to occur at specific frequencies (e.g. 60 Hz hum and multiples thereof). Because 60 Hz hum is created by large mechanical generators which may not always rotate at precisely 60 Hz, it is important to allow the user to vary the widths of the notch filters. The MATLAB code is also capable of removing white noise via a simple but non‐linear filtering process. These filtering schemes produced noticeably better audio quality. The following illustration is of the filtering process. Please see the appendix for the actual code.
Figure 8:MATLAB plots showing the original audio data, band‐pass and notch‐filtered data, and white noise filtered data.
6.3 Adobe Audition for Audio Editing and Restoration Adobe Audition software allowed for quick audio enhancement. Given proper system
alignment, the speech within the acquired photo‐detector signal was usually understandable after a simple normalization process in Adobe Audition. This served to increase signal amplitude (and therefore volume) by one to two orders of magnitude.
If the speech remained unclear at some times, a number of other Adobe Audition features could be employed to further enhance the audio. The application of a high‐order band‐pass filter usually helped remove more of the noise present at 3.5 kHz frequencies and above. Beyond this, Adobe Audition can be used to create noise profile and further remove background noise.

20
The following include some key built‐in features used for the this project
Normalization to increase signal amplitude, and therefore volume.
Hard‐limiting to truncate spikes and allow for better normalization.
Noise profile creation to remove background noise.
High‐order band‐pass filtering – to retain only voice‐range frequencies.
7.0 Analysis:
7.1 Mechanical Subsystem The mechanical analysis was done to determine the effects of vibration on the system.
To determine this we can find the resonant frequency of the entire system by using Equation 1.
𝜔 = #𝑘𝑚
Equation 1: Resonant Frequency K is the stiffness of the material which is a constant property of aluminum. M is the
mass of the housing. The mass of all the components inside has to be considered in this mass because this will affect the resonant frequency as well. We can use this method to determine the resonant frequency of the system in order to incorporate rubber dampeners that will be used to connect the housing to the tripod. Equation 2 shows the total deflection for the housing with respect to the base.
Equation 2: Deflection of Housing
In the equation above g is the force of gravity, 9.8m/s2, fn is the resonant frequency in Hz, T is the transmissibility of the system which can be calculated using Equation 3 below.
Equation 3: Transmissibility of the System
Q is the maximum amplification at resonance which is a function of the critical dampening ratio. These values can be calculated using the equations below.

21
Equation 4: Maximum Amplification at Resonance
𝐶" =𝐶𝐶$
Equation 5: Critical Dampening Ratio In the equation above C is the system dampening, and CC is the critical dampening coefficient and it has the relationship below.
𝐶$ = 2𝑚𝜔 Equation 6: Critical Dampening Coefficient
The final variable in the equation is PSBBASE, which is the power spectral density of the base and it is estimated to be 10‐9G2/Hz, for an area with light traffic. As mentioned earlier we want to minimize the deflection caused by this resonance, so rubber dampeners are used to minimize the transmissibility. Figure 2 in Appendix A shows the transmissibility as a function of the ratio between system frequency and resonant frequency. It can be seen that as the critical dampening ratio approaches one that the transmissibility reaches a minimum, but this is very difficult to do. Rubber is a cheap efficient material with a critical dampening ratio of about 0.05.
7.2 Optical Subsystem The optical analysis was done to confirm that the system would collect enough light so that we could filter and analyze the signal so that we could get a comprehensible conversation. The analysis primarily consists of radiometric calculations to determine the flux on the detector based on lens size, detector size, and solid angle. We first had to determine the irradiance on the window, which can be found by determining the spot size on the window. Below is the equation for determining the spot size.
𝜖 = 𝐷* ∗ 𝜃 ∗ 2 + 𝐷* Equation 7: Spot Size on the Window
In the equation above DB is the beam diameter when it leaves the laser cavity and θ is the divergence of the laser. Although the laser has a Gaussian beam so its divergence is not completely linear this is a sufficient approximation to calculate the spot size. The extra addition of the original beam diameter is added because the first part of the equation is solving for the added size due to the divergence. Assuming that the radiance is constant along all rays we can determine the irradiance on the window by the relation in Equation 8.
𝐸 = 𝛷𝑆𝑝𝑜𝑡 𝑆𝑖𝑧𝑒
Equation 8: Irradiance on the Window

22
In the equation Φ corresponds to the flux or power of the laser. The units of irradiance are W/mm2. We want to maximize the irradiance on our window so we wanted a small spot size which is why we want a laser with low divergence and high power.
Next we need to determine the radiance that is reflected from the window. This is a function of the Bidirectional Reflectance Distribution Function, or BRDF. This cannot be calculated and can only be measured experimentally. We assumed that 0.01% will be reflected back off the window. A figure showing the reflected radiance off a surface as a function of the BRDF can be seen below.
Figure 3: Bidirectional Reflectance Distribution Function of Aluminum
The figure above shows the BRDF for aluminum. The picture shows incident light on the left coming down to an aluminum surface and the distribution on the right corresponds to the radiance of the reflected light. The BRDF for a glass window is much lower but will have relatively the same shape. The reflected radiance can be calculated using the equation below.
𝐿 = 𝐵𝑅𝐷𝐹 ∗ 𝐸 Equation 9: Reflected Radiance In the equation L is the reflected radiance and E is the irradiance incident on the window.
Next we had to determine the amount of flux incident on the detector which is a function of the reflected radiance, area of the spot size, and the projected solid angle subtended by the lens as seen from the window. Projected solid angle is the two dimensional angle in three dimensional space that an object subtends at a point, or a measure of how large that object appears to an observer looking from that point. We want to maximize the power on our detector so we want to have a large lens to collect more light thus increasing the solid angle. The equation for solid angle can be seen in Equation 10.
Ω = 𝜋 ∗ sin .𝜃0121
Equation 10: Projected Solid Angle In the equation θ1/2 is the half angle of a right circular cone and can be found using
trigonometry between the window and the lens. The calculation to find the flux on the detector can be seen below in Equation 11.
23
𝛷 = 𝐿 ∗ 𝐴 ∗ Ω Equation 11: Irradiance on the Window All of these variables have been previously stated and calculated.
The Excel Spreadsheet, Table 1, used to calculate these values can be viewed in Appendix A.
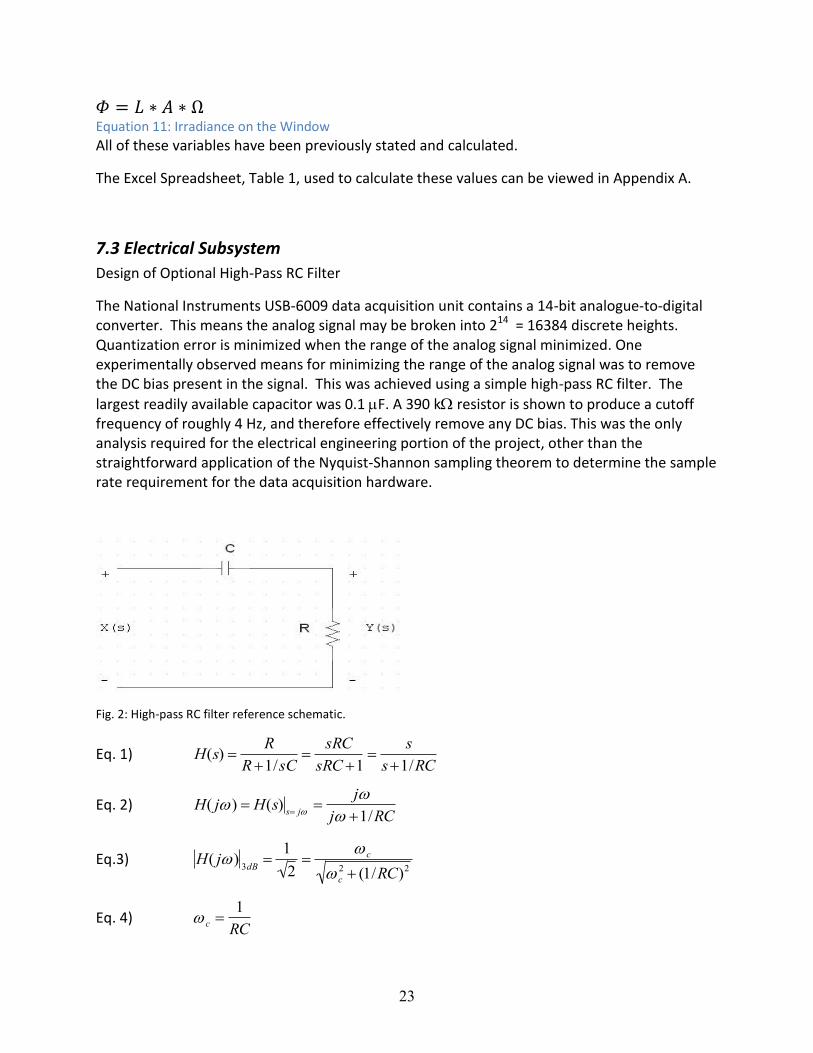
7.3 Electrical Subsystem Design of Optional High‐Pass RC Filter
The National Instruments USB‐6009 data acquisition unit contains a 14‐bit analogue‐to‐digital converter. This means the analog signal may be broken into 214 = 16384 discrete heights. Quantization error is minimized when the range of the analog signal minimized. One experimentally observed means for minimizing the range of the analog signal was to remove the DC bias present in the signal. This was achieved using a simple high‐pass RC filter. The largest readily available capacitor was 0.1 F. A 390 k resistor is shown to produce a cutoff frequency of roughly 4 Hz, and therefore effectively remove any DC bias. This was the only analysis required for the electrical engineering portion of the project, other than the straightforward application of the Nyquist‐Shannon sampling theorem to determine the sample rate requirement for the data acquisition hardware.
Fig. 2: High‐pass RC filter reference schematic.
Eq. 1)
H(s) R
R1/sCsRCsRC 1
s
s1/RC
Eq. 2)
H( j) H(s) s j j
j 1/RC
Eq.3)
H( j) 3dB 12
c
c2 (1/RC)2
Eq. 4)
c 1RC

24
Eq. 5)
fc 1
2RC
12(390)(103)(0.1)(106)
4Hz
8.0 Development Plan and Implementation: The design layout required extensive planning in order to meet the objectives of; proof of concept, construction, programming, and field testing. These tasks were organized and delegated over the three and a half month period leading up to design day. In our planning document, we divided the work load into four different timelines in order to maximize productivity. Each of these was run by a different individual. The first priority was obtaining a lab for testing our theory which was acquired in late January. This allowed us to begin testing our proofs of concept. Since the programming did not immediately need any orderable material, production on that was initiated at the same time and continued throughout the design until the prototyping was finished. One person was in charge of ordering materials. They started with the aluminum since this need time to be machined to specific criteria. Then the laser and optical components were ordered. This was not the highest priority because the lab had adequate supplies to continue working on the proof of concept. The last items to be ordered were the webcam, flip mirror and mounting brackets since these were only needed for the finalization of the device. One person was in charge of finding a webcam that will image 808nm light. It also had to be cheap and easy to mount in our system. They were also in charge of making sure the webcam integration would not block any of the incoming light to the detector. We also had one person overseeing, and managing the different tasks in order to keep the progress moving forward toward our overall objective. This would ensure that all of the different timelines would intertwine, and effectively maximizing everyone’s performance. The initial plan had all of the machining and assembly complete and the programming mostly complete by the end of February. This was pushed back due to delays in component arrival into late March. This delayed our final assembly into April. A calendar detailing this process break down can be found in Appendix C.
In order to prove our concept we had to have access to the labs offered in the optical sciences and engineering building. The setup needed to have a high degree of precision. We aligned a 5mW helium neon laser to an optical rail and used a pinhole with a reference height to ensure the laser was parallel to the rail. After this we used a piece of glass held vertically by two steel rods. The glass was adjusted using two translation stages secured to the optical table. Next we placed another rail after the window in the direction of the spectral reflection. Using the reference pinhole we were able to see if the reflection was still parallel with the second optical rail and make sure the second rail was aligned. Since at this point we did not have our optical elements in lab yet we used a 2.5 inch lens as our collection element. We originally used a large area silicon diode provided in lab. Both of these items were mounted on the rail using posts and rail carriers provided by the lab. We connected the diode to an oscilloscope. Last we placed speakers behind the window to attempt to modulate the window. This attempt was unsuccessful and we determined that the diode we used was too low of quality to detect our light source. A schematic drawing of this original proof of concept test setup is provided in Appendix A.

25
Our second attempt had one major modification. This was obtaining the detector we would be using for our final design. Our first test we performed was basic but necessary. We blocked the signal using a note card and then removed it to see if the oscilloscope would detect it. After this was accomplished we tapped on the glass to see if the vibration would be detected. This was also a success. Initially, we played different types of music to see the effects on the oscilloscope. We could see oscillation that correlated to the music to a slight degree. As we chose songs with a more prominent bass we notice a more dominate signal on the oscilloscope. There were still sections of the songs that had no defining features on the scope this lead us to believe that the signal we were picking up was dampened heavily. We attempted to modulate our signal to see if this would help any of the results. When we the analyzed the results we found that there was a correlation to frequency and location on the square wave modulation. We found that lower frequencies tend to be at the beginning of the square wave and the higher frequencies were at the end of the wave. This was an informative discovery but this square wave modulation was abandoned. It was abandoned because of our detector’s ability to amplify the signal through its gain setting. We were able to get a good response on our oscilloscope.
The next step was to integrate a digital process to demodulate the collected signal back into a reconstructed audible frequency. We first started with a combination of MatLab and LabVIEW. LabVIEW was used to interface with our data acquisition for collection the signal from window. We exported it to MatLab for signal filtering. This choice was made because of our familiarity with MatLab. The implementation allowed us to reconstruct a wave file and analyzing its frequency range. From this we could filter noise and play the audio form of the file. As time progressed our group’s familiarity with LabVIEW grew and we learned how to integrate filters into our code. This integration allowed for real time processing for our collected signal. This lead to our final code for LabVIEW which included a filtered wave plot and its Fourier transform for additional spot filtering. We still utilized other programs for additional signal processing to refine our output. This included additional MatLab processing and Adobe Digital Processing.
The last stage of our design implementation is the finalized construction of the remote listening device. At this point of the design we have obtained all of the parts need for assembly. We replaced the test lens with our lens system we designed and integrated our optical filter. The HeNe laser originally used was replaced with the 808nm 160mW laser. Once we aligned the optical components of the system we constructed the housing around it. The next step was to implement the web cam. The construction consisted of a swing arm that positioned the camera in front of the main collection lens. We aligned the spot to the detector and position the camera so the spot will be centered. This gave us a good reference to where the collection spot should be to align the system. We did finalized testing to meet the objective of 20 feet away from the target. A schematic drawing of the system components is provided in Appendix A.

26
9.0 Operation Manual:
9.1 Setup To begin the setup process it is best to begin by removing the Acrylic planes that enclose the laser emitter system and the signal collection system. To remove these use a 3/16” allan wrench to listen the screws for the mechanical structure. After removing the Acrylic windows we can turn on the laser emitter by turning the turn to the on position and turning the switch on on the back of the power source.
Next we need to align the system. This will prove to be the most challenging task. Use the IR detection card to view where the laser is leaving the laser emitting system and track the beam to see where it hits the oscillating window. Continue to use the IR detection card to track the beam to the signal collection system. The beam should hit the 8” lens at about the center. If there is any misalignment it should be a little low. Next place the IR detection card behind the lens to confirm the laser is passing through the lens. Follow the path of the laser to ensure it passes through the two lenses and band pass filter. The collection system may need to be adjusted by means of shims or rotating the back end to align the system.
Once the spot is focused on the detector we need to connect the detector to the data acquisition tool. To do this we use a BNC to alligator clip connector to complete the circuit between the detector and data acquisition tool. The data acquisition tool connects to a computer via a USB connection. Once this process is complete we need to start the signal processing software. The computer being used needs to have LabVIEW on it for the system to work. Open the LabVIEW program, RLD, to run the program. Once the program is running we should hear an audible noise due to electrical noise. If the alignment is correct we should be able to detect the audio from within the enclosed system.
9.2 Troubleshooting
If the system is malfunctioning the problem is most likely due to misalignment in the system. Use the IR detection card to check the alignment to ensure that the laser is refracting through the system properly. If the laser is not refracting properly adjust the angle of the laser or the signal collection system. Other methods to ensure the system is aligned are using something to modulate the signal by chopping the reflecting beam and view the changes in the output. If the output remains unchanged then the system is not aligned properly.
If excessive noise appears in the output wavefile this may be due to incorrect settings of the gain or high/low pass filters of the detector. There is no correct setting for these filters, it is best to use a known signal and vary the gain and filter settings for optimal signal output.

27
10.0 Requirements Review and the Acceptance Test Plan:
Part 1: The Acceptance Test Plan: 1 Acceptance Test Plan Overview
1.1 Purpose
The acceptance test plan (here after ATP) is a structured procedure created to measure the success of our project and verify that our design has met all necessary system requirements. The ATP will describe: the testing approach, test procedure, team member roles as they pertain to testing for acceptance, the general test configuration, and identify the necessary tests that will be employed.
1.2 Background
In the original concept of operations for this project we laid down some basic needs that our remote listening device must fulfill. Following this initial conception of our design, our systems requirements review laid down the firm requirements that our system needs to meet in order to be considered a success. These have since been modified slightly as the goals of our project have progressed over time, but almost all of our initial project goals remain the same. Put simply, the goal of this project is to create a remote listening device that is capable of detecting conversation from within a vehicle at a maximum range of at least 20 feet. In addition this system needs to be operable without being detected by targets within the vehicle, and our project must be able to be designed and built for less than three thousand dollars.
1.3 Scope
This document shall describe the tests required to verify that our project meets all of the system requirements established by our system requirements review memorandum. It shall establish tests only for acceptance in these previously specified areas, and shall not delve into tests which would verify performance outside of the scope of our specified system requirements. The goal of this document is to provide an outline for the general process that our testing will follow as well as a list of specific tests that will be required to verify final system acceptance based on our requirements.
2 Test Plan
2.1 Testing Approach
The testing for this project will be conducted in two major phases. Phase 1 consists of preliminary testing and subsystem/component testing that we will perform in order to verify the performance of our design theory as well as assure that all our system components are operating up to manufacturer spec. Phase 2 testing will consist of validating our final as‐built system. This will be broken down in to two stages: testing the limitations of our system in a

28
controlled laboratory setting, and testing our system outdoors in real world application scenarios.
Phase 1 Testing: – Build mockup in lab with HeNe laser and plate glass window to verify proof of
concept • Vary glass distance and reflectivity • Observe results from single frequency sound on oscilloscope
– Assemble final subcomponents in lab to determine performance • Vary range/angle of glass • Analyze data with oscilloscope and LabView/MatLab
Phase 2 Testing: – Build field deployable product, test in lab
• Assess speech clarity in signal • Assess impact of noise and vibrations • Vary ambient light level and assess impact • Analyze data with LabView/MatLab
– Test final product outside of lab • Test product at night to determine performance • Test product in direct sunlight to determine impact • Test product on range of cars (e.g., sedan, SUV...) • Verify final product meets all acceptance criteria
2.2 Test Procedure
To assure that our testing is completed in a timely manner, and that our final product adheres to the system requirements the tests listed in this report shall occur as they logically fall within the two phase testing plan as described above. Theory and component tests shall be carried out first in phase 1 testing. Final system tests for acceptance shall be carried out after all of the phase 1 testing has been completed and is found to be satisfactory. When doing the final system tests it is expected that we will test some aspects outside of the strict tests for acceptance, however these tests shall take low priority, following only after all applicable tests for acceptance have been completed.
The tests shall be completed by the members of Team #4961 (aka Team Remote Listening Device.) There will be no preordained test coordinator for all of the testing, but each test shall have a presiding test coordinator. The test coordinator shall be responsible for taking appropriate notes and data for the test, or delegating this duty such that all the test findings are recorded for posterity. Following the test and any necessary data reduction, the presiding test coordinator shall record a score of either Pass or Fail for the test. If it is found while testing

29
that the test is inadequate, then the test coordinator shall be responsible for describing the procedure of any follow up tests used to validate a system requirement acceptance criteria.
After the completion of acceptance testing, the results will be sent to the customer for customer approval.
The testing is expected to take approximately 60 days to complete.
2.3 Roles and Responsibilities
The roles and responsibilities for the acceptance testing fall into three major groups. There are team responsibilities, test coordinator responsibilities, and test conductor responsibilities.
The team as a whole is responsible for ensuring that our product meets all the system requirements. As such, it is our duty to make sure that acceptance testing is conducted on our product for all system requirements.
The test coordinator is responsible for making sure that the test being conducted is set up such that it will constitute a valid test for acceptance. They are responsible for assuring that the testing happens according to the test procedure, and that all relevant data is collected from the test. Following the test and any necessary data reduction, the test coordinator is responsible for assigning a Pass or Fail to the test, based on the systems performance. Also, if it should so happen that during the test it becomes apparent that the test will not constitute a sufficient test for acceptance, the test coordinator is responsible for spearheading the effort to design a new test for acceptance that will generate a satisfactory result.
The test conductors shall be constituted of all other team members who are
conducting the test (i.e. those who are not acting as the test coordinator.) These team members shall be responsible for making sure that the test is set up correctly to the best of their expertise, and that all data is recorded accurately and truthfully. If any of the test conductors have revelations while conducting the test regarding the validity of the test or other relevant input, it is their responsibility to bring up these insights with the test coordinator.
2.4 Test Configuration
The general procedure for the test is described below:
The Acceptance Test Case Specification Form will be filled out prior to the test
30
o The Acceptance Test Case Specification Form is the document wherein relevant test observations and data will be recorded during the test. It is also the document that will describe the procedure and objectives for the test.
o The Acceptance Test Case Specification Form with field explanations is included in Appendix A at the end of this report.
The test will be set up as per the Test Case Specification Form o This includes not only setting up any equipment and parts for the test,
but also adjusting ambient conditions when applicable (i.e. changing light levels or reducing ambient sound while the test is being conducted.)
The test will be conducted o While the test proceeds, all necessary data shall be recorded
Following the conclusion of the test all equipment will be shut off Any necessary data reduction will be performed on the collected test data A grade of Pass or Fail will be assigned by the test coordinator
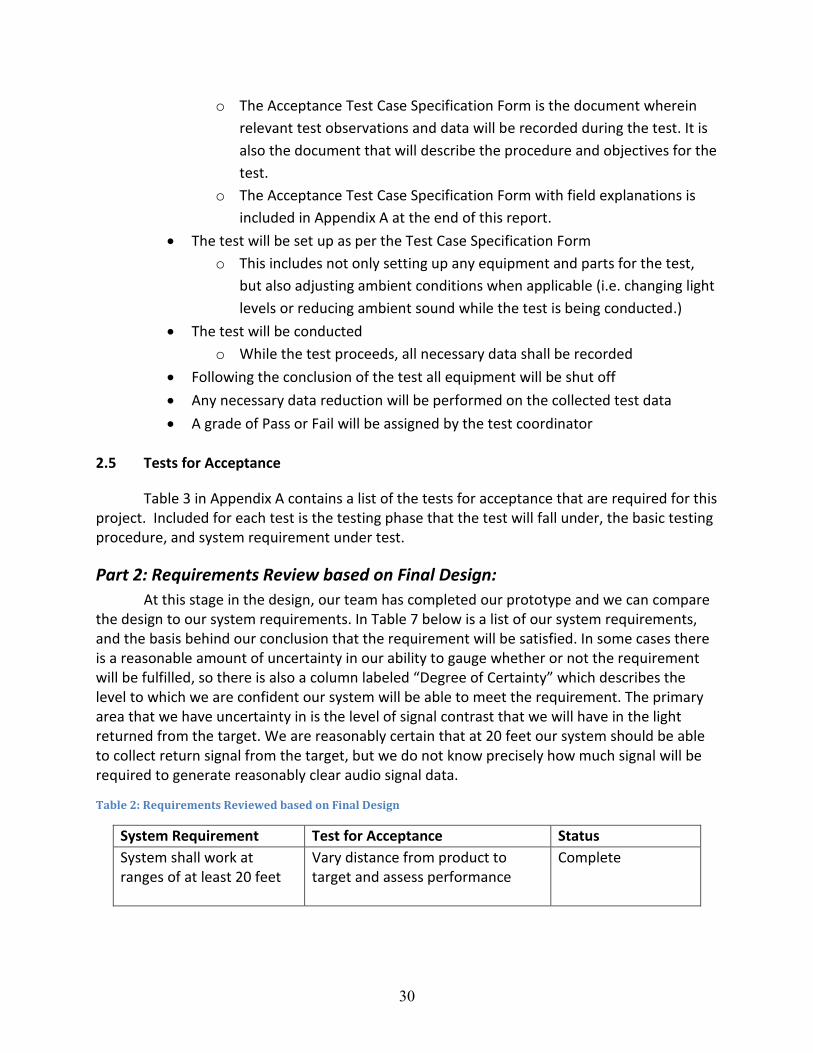
2.5 Tests for Acceptance
Table 3 in Appendix A contains a list of the tests for acceptance that are required for this project. Included for each test is the testing phase that the test will fall under, the basic testing procedure, and system requirement under test.
Part 2: Requirements Review based on Final Design: At this stage in the design, our team has completed our prototype and we can compare the design to our system requirements. In Table 7 below is a list of our system requirements, and the basis behind our conclusion that the requirement will be satisfied. In some cases there is a reasonable amount of uncertainty in our ability to gauge whether or not the requirement will be fulfilled, so there is also a column labeled “Degree of Certainty” which describes the level to which we are confident our system will be able to meet the requirement. The primary area that we have uncertainty in is the level of signal contrast that we will have in the light returned from the target. We are reasonably certain that at 20 feet our system should be able to collect return signal from the target, but we do not know precisely how much signal will be required to generate reasonably clear audio signal data.
Table 2: Requirements Reviewed based on Final Design
System Requirement Test for Acceptance Status System shall work at ranges of at least 20 feet
Vary distance from product to target and assess performance
Complete

31
System shall be able to detect conversation in vehicle
Test product on car with known sound in it to assess performance
Incomplete
System shall not be detectable by target
Sit in car while product operates and assess visibility of light source
Complete
System shall not be dangerous to targets or pedestrians
Measure output power, if less than class IIIb, the product is safe
Complete
System shall cost no more than $3000.00
Total system cost was about $2400 Complete
System shall weigh less than 70 lbs
Weigh final system to test compliance
Complete
We have tested and completed all system requirements except for the requirement of detecting a signal within a closed vehicle. The primary difficult with completing this requirement was due to the late completion time of our project. We only had one week between completion of our project and submission of this report. This was due to problems with ordering parts. With regards to finishing this project we would be more proactive with the ordering process. We would follow up on all orders to ensure that parts have been ordered as well as proper timely shipment of orders.
If we were to change things within our design it would be the alignment system. The use of reflective optics could be advantageous if we are trying to detect the diffuse reflection from the window. This would also allow us to cut down on the size of the light collection system. Also, if we had more time and money we would have used adjustable height post holders. This would made alignment for the system much easier. Unfortunately, in our design we use posts and washers to adjust the height which proved to work for our design, but adjust post holders would allow for individual optic adjustment thus making overall alignment simpler. The final change we would make to the design would be attempting the analog approach compared to the digital approach to signal processing. Analog signal processing would be much more user friendly as well as being the best option financially. An analog approach would allow the use to plug headphones into the circuitry and listening to the output waveform compared to opening a computer, running a software program, and listening to the waveform.
11.0 Closure: Over the last 9 months our team has worked to create a new product from the ground up. Our initial scope of work was to design, fabricate, and test a device capable of listening to conversation produced by people speaking at a normal volume within a car or behind a window. From the very beginning we had a design concept in mind that would utilize an infrared laser and reflect it off of a window behind which as conversation was being held. This

32
reflected beam was to be collected and focused on a detector, which would read variations in the signal intensity as a modulated signal which could be reconverted in to audible sound. Despite have a good grasp of the concepts that would be used, it took a lot of hard engineering to produce a working prototype by the end of the class.
The primary challenge that we battled all throughout this project was how we were going to get enough signal back to our detector to produce a signal that was clear enough for us use. Initially we went into this project with the idea that our product would be capable of working on the diffuse scattered light reflected in all angles by the window. This operating condition would have been optimal because it is much easier to simply point a collection system at the window, rather than having to align it with a reflected laser beam. In addition, it would have allowed us to create a system that was all contained within one box. Unfortunately, we were not able to reliably verify that this would be possible in lab, and were forced to scale back our design to require the collection of the direct reflected laser beam from the window surface. This is one of area where a combination of the physics and the budget constrained the functionality of our product. While we believe that there are ways that this could be done physically, it would require a substantial increase in the funding of the project to produce results.
Another challenge that we faced in this project was due to the difficulty in aligning a system around a laser source that was visible to the human eye. While our laser scored high marks for covertness, it made alignment of the system very tedious and difficult. Despite this, we were able to solve the problem relatively simply in lab by tracking the beam path with an index card that fluoresced due to NIR excitation. While this method worked in lab, it would be quite difficult to remain covert while trying to align the system with this method in the field. This is another area that likely limits the practicality and functionality of our product.
Despite the hiccups that we have encountered in the process of the designing, fabricating, and testing our system, we feel that we have accomplished a significant achievement with the creation of the Covert IR‐Laser Remote Listening Device. We started with nothing but an idea, and designed, prototyped, built, and tested a working product with only a $3000.00 budget. We built a product capable of detecting and recording sound at ranges of at least 20 feet, and a product which can operate covertly without any visible signature to any targets behind the window.
With additional funding and time, this product could easily be turned into a practical, useable technology. By exploiting phase sensitive detection, or implementing a position sensitive detector, it would likely be possible to turn this product into remote listening device that is not constrained by the need to collect the direct reflected beam. Hopefully in the future more time and effort will be invested in this very promising new technology. Covert surveillance is one of the tools needed by the national security and law enforcement agencies, with some more research and development this technology could be out there helping to save lives.
33
References III, Forrest M. Mims. "Surreptitious Interception of Conversations with Lasers." Optics News 11(11) 1985:
6‐12. Print.
"J1796 Spectral Transmission Test." SAE Handbook (2006): 8.
"J673 Automotive Safety Glasses." SAE Handbook (2006): 8.
Mims, Forrest M. Light‐beam Communications. Indianapolis: H.W. Sams, 1975. Print.
Mims, Forrest M. "A Pulse‐Frequency Modulated Infrared Communicator." Popular Electronics 1982. Print.
—. "Beware of Laser Eavesdropping." American Journal of Physics 55(10) 1987. Print.
—. Lasers: The Incredible Light Machines. New York: McKay, 1977. Print.
—. Light Emitting Diodes. Indianapolis: H.W. Sams, 1973. Print.
—. "Remote Sensing (Part 2)." Popular Electronics 1981. Print.
Prigo, Joel Solomon and Robert. "Eavesdropping with a Laser." American Journal of Physics 55(10) October 1987. Print.
New Focus, Inc. 2001 FS‐M Silicon Photoreceiver. Rep. Web. 26 Apr. 2012. Optomechanical Engineering. Burge,Prof. James. University of Arizona. <
http://www.optics.arizona.edu/optomech/Fall11/Notes/21%20Vibration.pdf>

34
Appendix A: Figures and Tables The following is a description of the content of key fields in the test case form.
Test Case: A sequential number assigned to the test case for tracking purposes using an X.YY number scheme where X is the test phase and YY is a sequential number.
Test Phase: The number of the test phase that will be verified by this test case. A breakdown of the two test phases is described in the Acceptance Test Plan.
Version: The version numbers <<product or product component>> used for this test case.
Executed By: The person executing or performing the test. This person will sign/date each test case at the conclusion of the test.
Witnessed By: The person witnessing the test on behalf of the client. This person will sign/date each test case at the conclusion of the test.
Test Scenario Objectives: The objective of this test case. Test cases are developed to be narrow in scope and verify a single aspect of the functions represented by a functional group.
Instructions: General overall instructions to perform the test.
Pre‐test Configuration: Any special pretest setup or configuration, or required test equipment for this test.
STEP: A number (sequential) associated with the step to be performed in the test scenario. Each step should be followed in sequence.
Action: The action to be performed for this step.
Expected Result: The expected result in response to the action taken. The expected result will be used to determine pass/fail for this step of the test. The expected result will indicate the acceptance thresholds for each performance measure.
P/F: Pass/Fail – based on criteria identified in the expected result.
Comments: Additional comments concerning this step of the test. Any relevant observations or issues should be noted here and additional pages used as necessary. This information will be used to generate the final report results.

35
Acceptance Test Case Specification Form
Test Case: 1.02
Test Phase: 1
version
<<name>>
version
Executed By Date
Witnessed By
Date
Test Scenario Objective: . Instructions: . Pre‐test Conditions:
STEP ACTION EXPECTED RESULT P/F COMMENTS
1 2 3 4 5

36
Figure 9: Transmissibility Curve
Table 3: Excel Spreadsheet of Calculations
Laser Power[W] distance[m] Spot size[m] irradiance[W/mm^2]0.1 6.096 0.003006 0.014090687
Beam diameter[m]0.003
Divergence[rad]0.001
BRDF Radiance reflected[W/mm^2sr] Power collected[W]0.0001 1.40907E‐06 8.4532E‐09
Clear Aperture[m] Focal Length[m] Detector sized J Capacitance[F] Resistor[ohms] Induced current[A]0.2 0.3 1E‐11 1000000 3.80394E‐09
F/# Time constant Frequency cut off1.5 0.00001 15915.49431
V out0.003803939
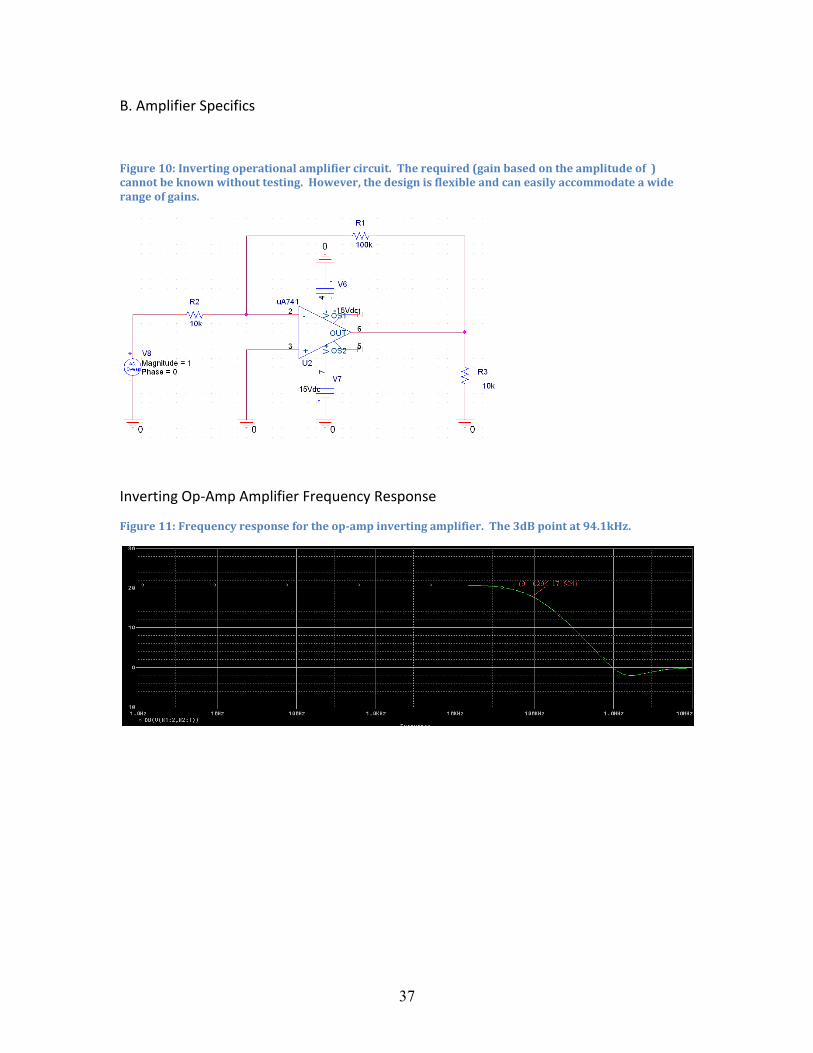
37
B. Amplifier Specifics
Figure 10: Inverting operational amplifier circuit. The required (gain based on the amplitude of ) cannot be known without testing. However, the design is flexible and can easily accommodate a wide range of gains.
Inverting Op‐Amp Amplifier Frequency Response
Figure 11: Frequency response for the op‐amp inverting amplifier. The 3dB point at 94.1kHz.
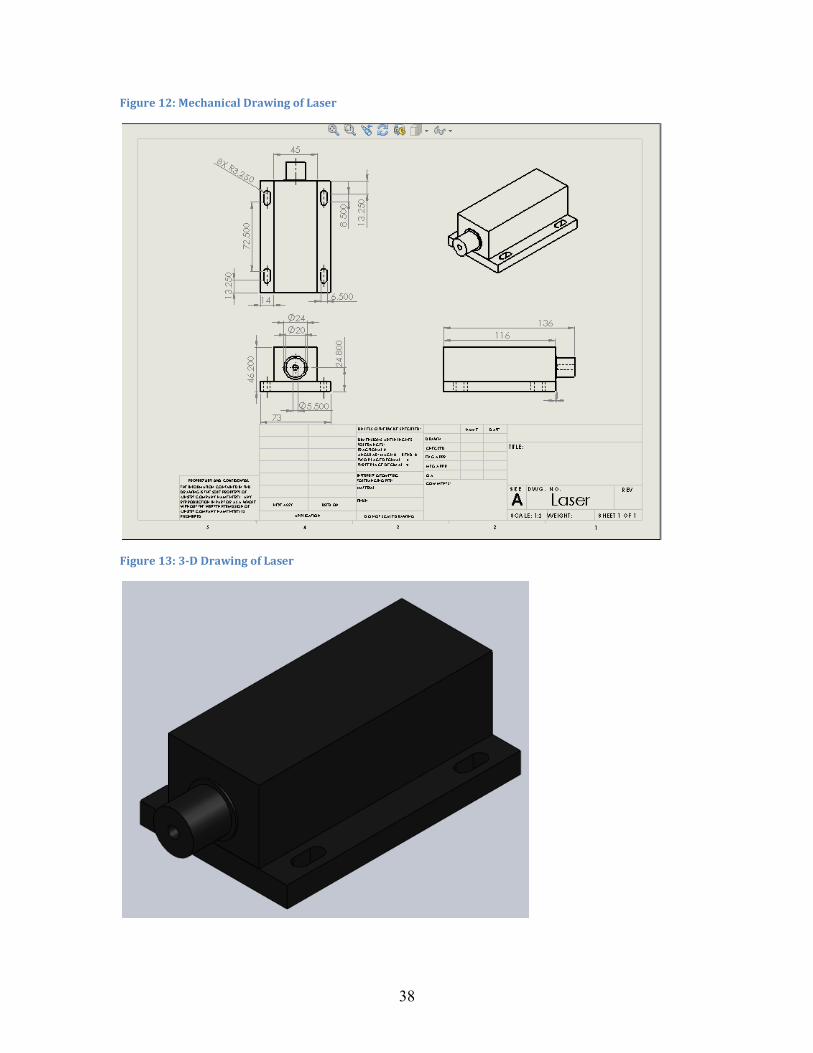
38
Figure 12: Mechanical Drawing of Laser
Figure 13: 3‐D Drawing of Laser

39
Figure 14: Mechanical Drawing of Power Source
Figure 15: 3‐D Drawing of Power Source for Laser

40
Table 4: Laser Specification Sheet
Figure 16: Mechanical Drawing of Detector
41
LabVIEW Virtual Instrument – Data acquisition, real‐time audio playback, and WAV file generation
Figure 17: LabVIEW Diagram Panel Code
Matlab Code – Band‐pass and notch filtering for post‐acquisition processing function[] = RLD(inpFile,outpFile)
% Sampling Parameters
%==========================================================================
fs = 20e3; % sample rate in Hz
%fs = 48e3; % sample rate in Hz (max, device spec)
ts = 1/fs; % sample rate in time
bits = 16; % bit resolution
kwn = 0.8; % white noise filtering constant
% Filter Parameters
%==========================================================================
%
% | |
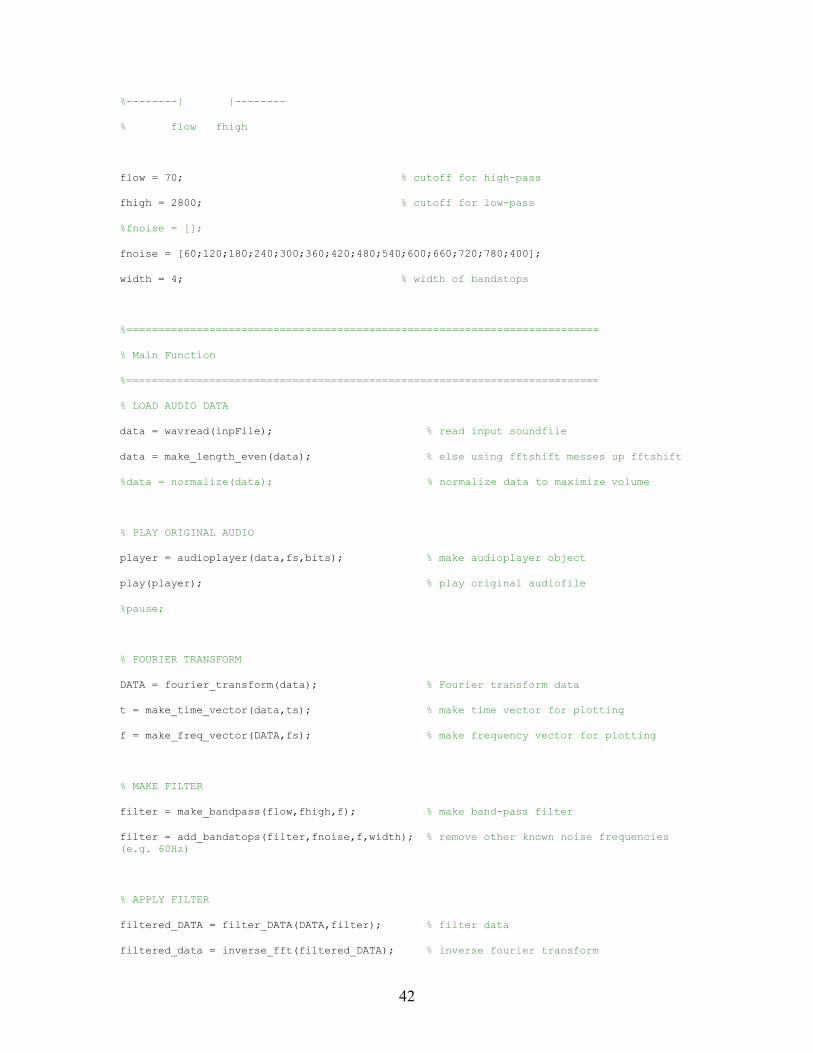
42
%| |
% flow fhigh
flow = 70; % cutoff for highpass
fhigh = 2800; % cutoff for lowpass
%fnoise = [];
fnoise = [60;120;180;240;300;360;420;480;540;600;660;720;780;400];
width = 4; % width of bandstops
%==========================================================================
% Main Function
%==========================================================================
% LOAD AUDIO DATA
data = wavread(inpFile); % read input soundfile
data = make_length_even(data); % else using fftshift messes up fftshift
%data = normalize(data); % normalize data to maximize volume
% PLAY ORIGINAL AUDIO
player = audioplayer(data,fs,bits); % make audioplayer object
play(player); % play original audiofile
%pause;
% FOURIER TRANSFORM
DATA = fourier_transform(data); % Fourier transform data
t = make_time_vector(data,ts); % make time vector for plotting
f = make_freq_vector(DATA,fs); % make frequency vector for plotting
% MAKE FILTER
filter = make_bandpass(flow,fhigh,f); % make bandpass filter
filter = add_bandstops(filter,fnoise,f,width); % remove other known noise frequencies (e.g. 60Hz)
% APPLY FILTER
filtered_DATA = filter_DATA(DATA,filter); % filter data
filtered_data = inverse_fft(filtered_DATA); % inverse fourier transform

43
% FULLSCREEN PLOT SIZE
scrsz = get(0,'ScreenSize');
figure('Position',[1 scrsz(4)/2 scrsz(3) scrsz(4)]);
% GET AXIS BOUNDARIES
xmin = min(f);
xmax = max(f);
ymin = log10(min(abs(DATA))) 10000;
ymax = log10(max(abs(DATA))) + 10000;
% TRY TO REMOVE WHITE NOISE
temp = filtered_DATA(filtered_DATA ~= 0); % Find points != 0 (set freqs = 0)
temp = abs(temp); % Get magnitude of nonzero frequencies
ave = mean(temp); % Get average magnitude of nonzero frequencies
filtered_DATA2 = filtered_DATA; % Make copy of filtered data
filtered_DATA2(abs(filtered_DATA2) < kwn*ave) = 0; % If freq magnitude < kwn*ave, remove
filtered_data2 = ifft(fftshift(filtered_DATA2)); % Inverse FFT to get audio back
% PLOT DATA
subplot(7,1,1); plot(t,data);
title('Original Audio in Time Domain');
subplot(7,1,2); plot(t,filtered_data);
title('Filtered Audio in Time Domain');
subplot(7,1,3); plot(t,filtered_data2);
title('White Noise Filtered Audio in Time Domain');
subplot(7,1,4); semilogy(f,abs(DATA));
title('Original Audio in Frquency Domain');
axis([xmin xmax ymin ymax]);
subplot(7,1,5); plot(f,filter);
44
title('Filter Transfer Function');
axis([xmin xmax 1 2]);
subplot(7,1,6); semilogy(f,abs(filtered_DATA));
title('Filtered Audio in Frequency Domain');
axis([xmin xmax ymin ymax]);
subplot(7,1,7); semilogy(f,abs(filtered_DATA2));
title('White Noise Filtered Audio in Frequency Domain');
axis([xmin xmax ymin ymax]);
% PLAY FILTERED AUDIO 1
pause;
player = audioplayer(filtered_data,fs,bits); % play filtered audio data
play(player); pause; % play bandpass and bandstop filtered audio file
% PLAY FILTERED AUDIO 2
player = audioplayer(filtered_data2,fs,bits); % play filtered audio data
play(player); pause; % play white noise filtered audio file
% WRITE TO OUTPUT FILE
wavwrite(filtered_data,fs,outpFile); % write wav file (provide sample rate & output filename)
pause;
close all; % close all plots
%==========================================================================
% Sub Functions
%==========================================================================
% Make Bandpass Filter
%==========================================================================
function[filter] = make_bandpass(flow,fhigh,f)
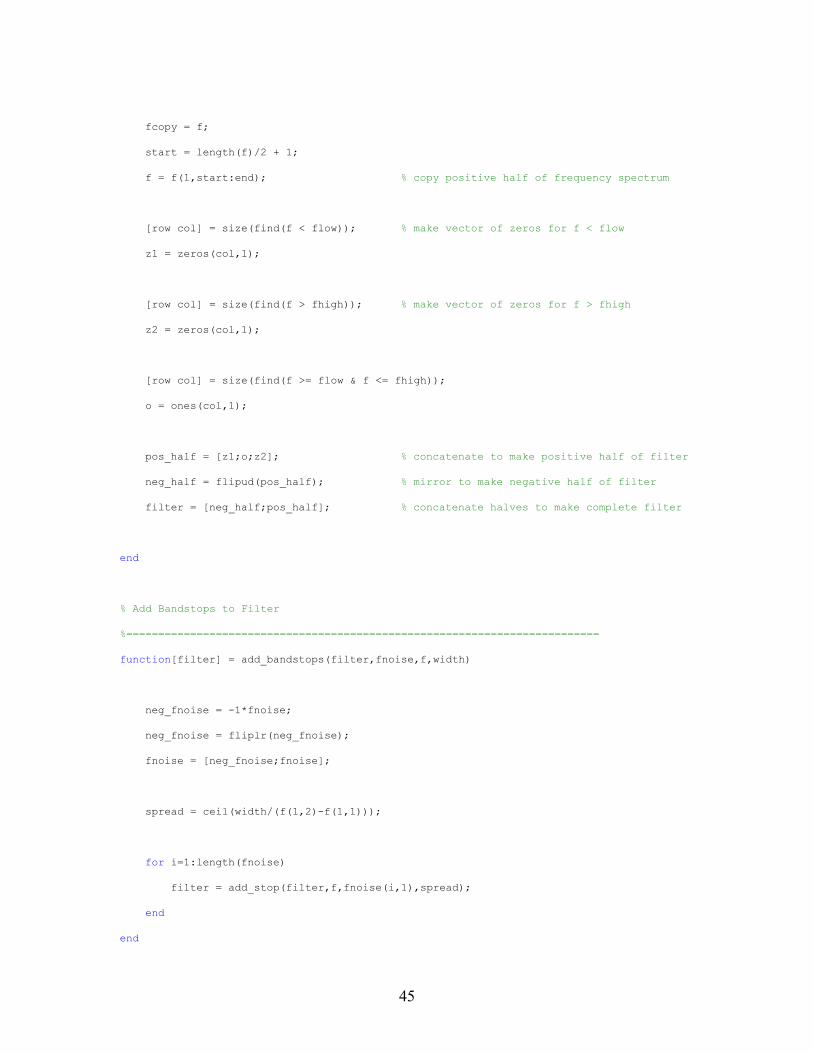
45
fcopy = f;
start = length(f)/2 + 1;
f = f(1,start:end); % copy positive half of frequency spectrum
[row col] = size(find(f < flow)); % make vector of zeros for f < flow
z1 = zeros(col,1);
[row col] = size(find(f > fhigh)); % make vector of zeros for f > fhigh
z2 = zeros(col,1);
[row col] = size(find(f >= flow & f <= fhigh));
o = ones(col,1);
pos_half = [z1;o;z2]; % concatenate to make positive half of filter
neg_half = flipud(pos_half); % mirror to make negative half of filter
filter = [neg_half;pos_half]; % concatenate halves to make complete filter
end
% Add Bandstops to Filter
%==========================================================================
function[filter] = add_bandstops(filter,fnoise,f,width)
neg_fnoise = 1*fnoise;
neg_fnoise = fliplr(neg_fnoise);
fnoise = [neg_fnoise;fnoise];
spread = ceil(width/(f(1,2)f(1,1)));
for i=1:length(fnoise)
filter = add_stop(filter,f,fnoise(i,1),spread);
end
end
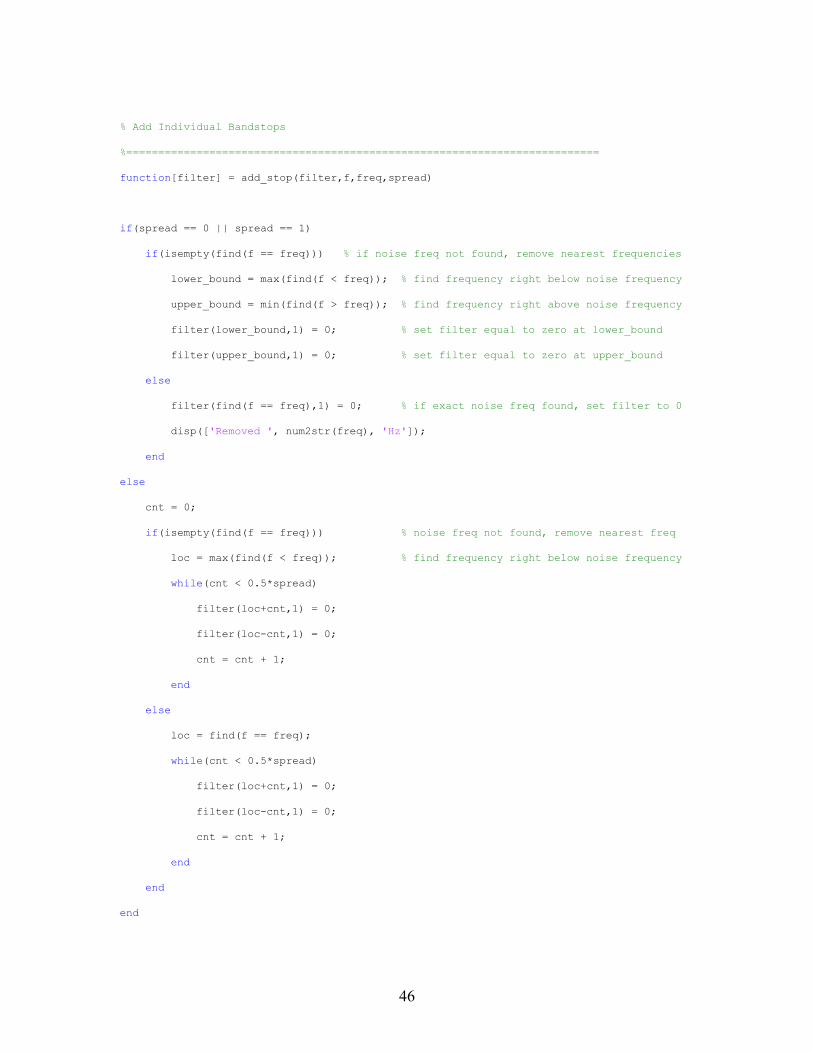
46
% Add Individual Bandstops
%==========================================================================
function[filter] = add_stop(filter,f,freq,spread)
if(spread == 0 || spread == 1)
if(isempty(find(f == freq))) % if noise freq not found, remove nearest frequencies
lower_bound = max(find(f < freq)); % find frequency right below noise frequency
upper_bound = min(find(f > freq)); % find frequency right above noise frequency
filter(lower_bound,1) = 0; % set filter equal to zero at lower_bound
filter(upper_bound,1) = 0; % set filter equal to zero at upper_bound
else
filter(find(f == freq),1) = 0; % if exact noise freq found, set filter to 0
disp(['Removed ', num2str(freq), 'Hz']);
end
else
cnt = 0;
if(isempty(find(f == freq))) % noise freq not found, remove nearest freq
loc = max(find(f < freq)); % find frequency right below noise frequency
while(cnt < 0.5*spread)
filter(loc+cnt,1) = 0;
filter(loccnt,1) = 0;
cnt = cnt + 1;
end
else
loc = find(f == freq);
while(cnt < 0.5*spread)
filter(loc+cnt,1) = 0;
filter(loccnt,1) = 0;
cnt = cnt + 1;
end
end
end
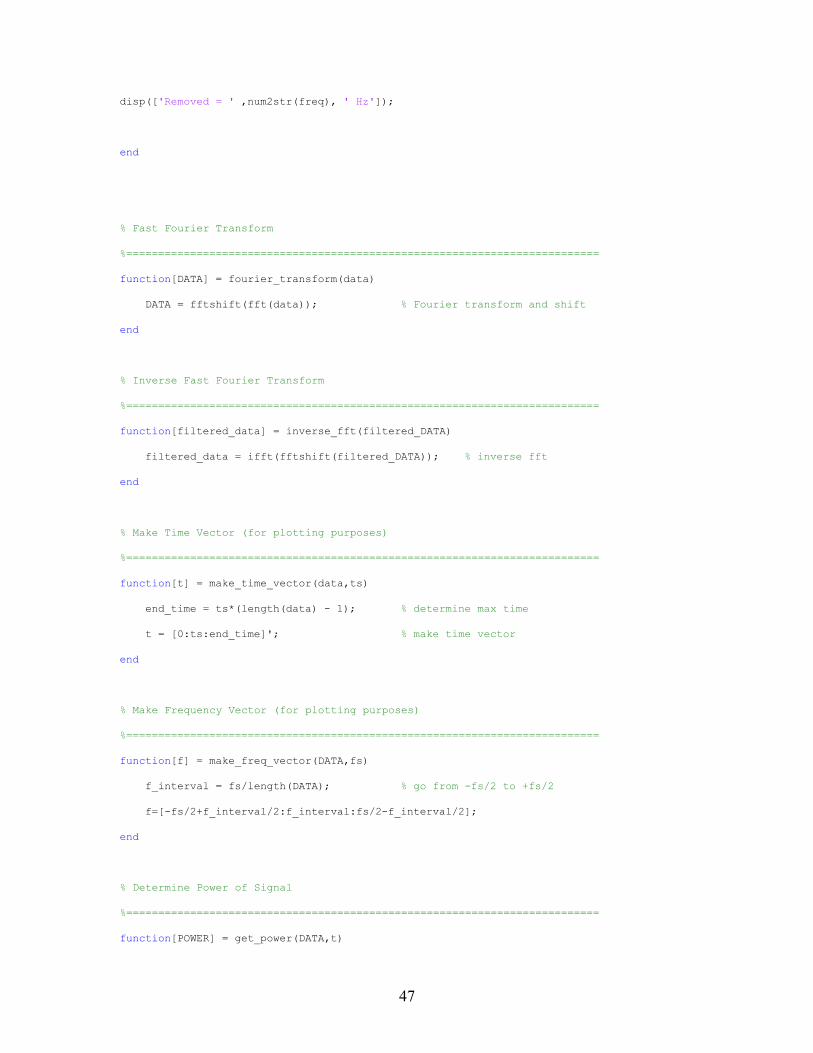
47
disp(['Removed = ' ,num2str(freq), ' Hz']);
end
% Fast Fourier Transform
%==========================================================================
function[DATA] = fourier_transform(data)
DATA = fftshift(fft(data)); % Fourier transform and shift
end
% Inverse Fast Fourier Transform
%==========================================================================
function[filtered_data] = inverse_fft(filtered_DATA)
filtered_data = ifft(fftshift(filtered_DATA)); % inverse fft
end
% Make Time Vector (for plotting purposes)
%==========================================================================
function[t] = make_time_vector(data,ts)
end_time = ts*(length(data) 1); % determine max time
t = [0:ts:end_time]'; % make time vector
end
% Make Frequency Vector (for plotting purposes)
%==========================================================================
function[f] = make_freq_vector(DATA,fs)
f_interval = fs/length(DATA); % go from fs/2 to +fs/2
f=[fs/2+f_interval/2:f_interval:fs/2f_interval/2];
end
% Determine Power of Signal
%==========================================================================
function[POWER] = get_power(DATA,t)
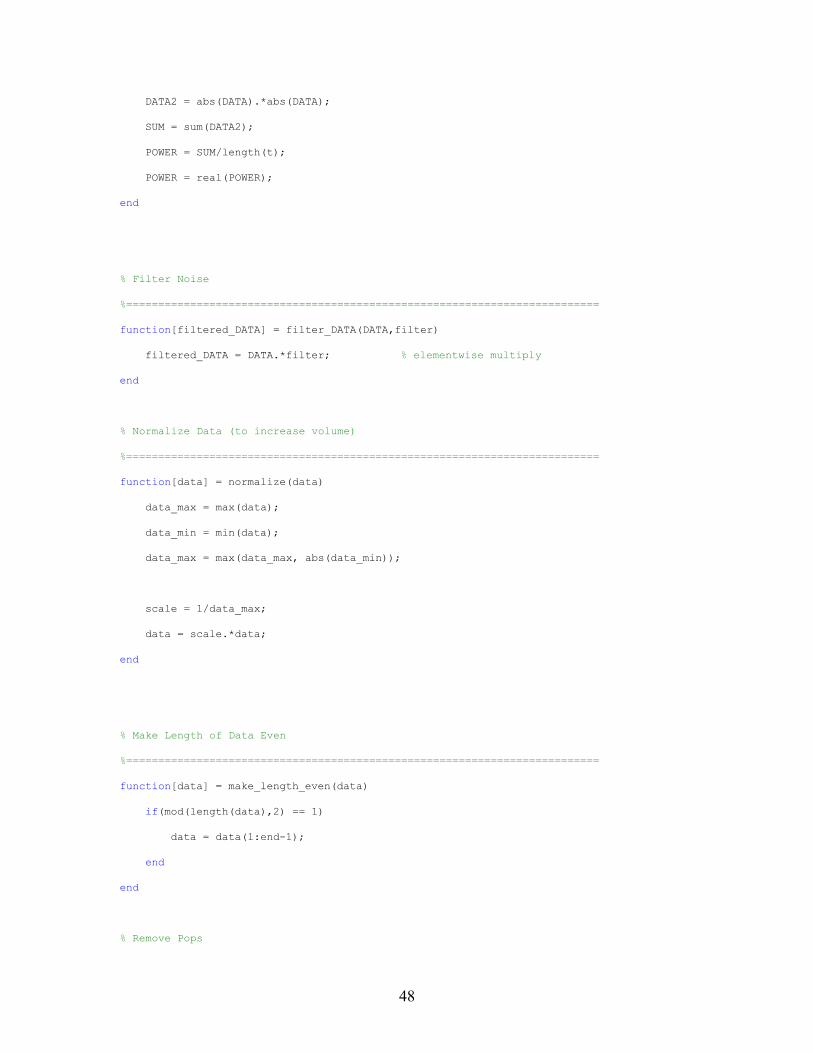
48
DATA2 = abs(DATA).*abs(DATA);
SUM = sum(DATA2);
POWER = SUM/length(t);
POWER = real(POWER);
end
% Filter Noise
%==========================================================================
function[filtered_DATA] = filter_DATA(DATA,filter)
filtered_DATA = DATA.*filter; % elementwise multiply
end
% Normalize Data (to increase volume)
%==========================================================================
function[data] = normalize(data)
data_max = max(data);
data_min = min(data);
data_max = max(data_max, abs(data_min));
scale = 1/data_max;
data = scale.*data;
end
% Make Length of Data Even
%==========================================================================
function[data] = make_length_even(data)
if(mod(length(data),2) == 1)
data = data(1:end1);
end
end
% Remove Pops

49
%==========================================================================
function[data] = remove_pops(data)
data1 = data(1:end1,1);
data2 = data(2:end,1);
s = data2 data1;
plot(s);
pause;
loc = find(s > 0.5);
loc = loc + 1;
for i=1:length(loc)
data(loc,1) = 0.5*(data(loc1,1)+data(loc+1,1));
end
data1 = data(1:end1,1);
data2 = data(2:end,1);
s = data2 data1;
while(~isempty(find(s > 0.5)))
plot(s);
pause;
loc = find(s > 0.5);
loc = loc + 1;
for i=1:length(loc)
data(loc,1) = 0.5*(data(loc1,1)+data(loc+1,1));
end
data1 = data(1:end1,1);
data2 = data(2:end,1);
s = data2 data1;
end
end
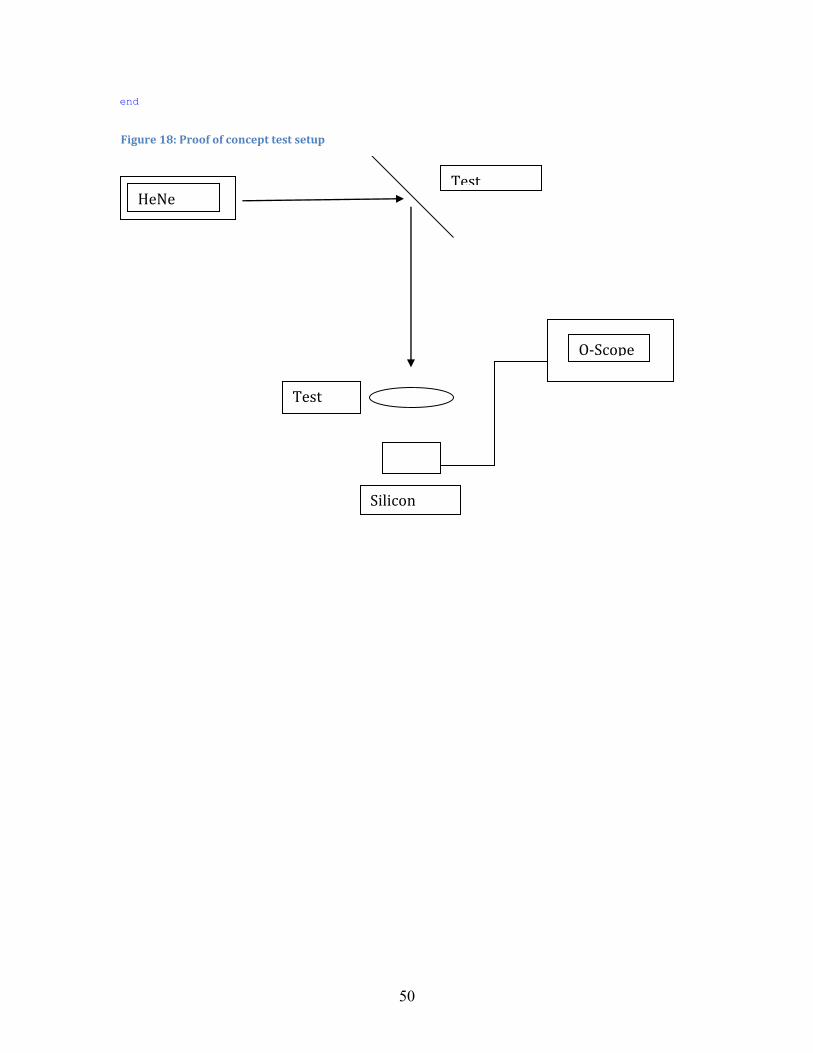
50
end
HeNe Laser
Test Window
Test Lens
O‐Scope
Silicon Diode
Figure 18: Proof of concept test setup

51
Appendix B: Budget and Materials List Table 5: Bill of Materials and Supplier List
Date Payee Rev/Exp Description Expenses
1/6/12 Thorlabs 29.17 1/2" Diameter ND Filter.
1/6/12 Anchor Optics 26.27 340mm Focal Length 5in diameter Bi‐Convex Lens. 1/17/2012 National Instruments 285.30 Multifunction DAQ 1/23/2012 LaserGlow Technologies 528.74 808nm NIR Collimated Diode Laser System. 2/3/2012 Edmund Optics 105.93 PCX Condenser Lens 200mm. 2/10/2012 Edmund Optics 74.62 Double convex lens and plano convex lens. 2/27/2012 Discount Steel 136.57 Aluminum Round Bar. 2/27/2012 Edmund Optics 206.85 Wave mirror and interface filter. 2/27/2012 Best Buy 23.73 Webcam. 3/1/2012 Automation 4 Less 277.67 T slotted extrusion pieces, hole joining strip and t‐nut.
Newport Silicon Photodiode
HeNe Laser
Test
Test system
DAQ
Computer Audio Reconstruction
Figure 19: Final system schematic layout

52
3/1/2012 Discount Steel 99.12 Aluminum Plates. 3/1/2012 Edmund Optics 147.15 Optic mounts. 3/23/2012 Edmund Optics 79.10 Stainless steel mounting post. 3/23/2012 McMaster Carr 20.96 Aluminum Male Threaded Hex. 3/23/2012 Discount Steel 38.17 Aluminum Plate. 3/30/2012 McMaster Carr 39.83 Steel retaining ring. 4/5/2012 Home Depot 65.00 Acrylic panels 4/30/2012 Kinko's/FedEx 127.00 Poster board Total Expenses 2,311.18
Appendix C: Project Management
Figure 20: Remote listening device team schedule
January 2012
Sunday Monday Tuesday Wednesday Thursday Friday Saturday 1 New Year’s Day
2 3 4 5 6 7
8 9 10 11 12 13 14
15 16 Martin Luther King Day
17 Start demodulation coding in MatLab
18 19 20 21
22 23 24 Acquire lab/ Begin prototype
25 26 27 28
29 30
31 Meet with Patty
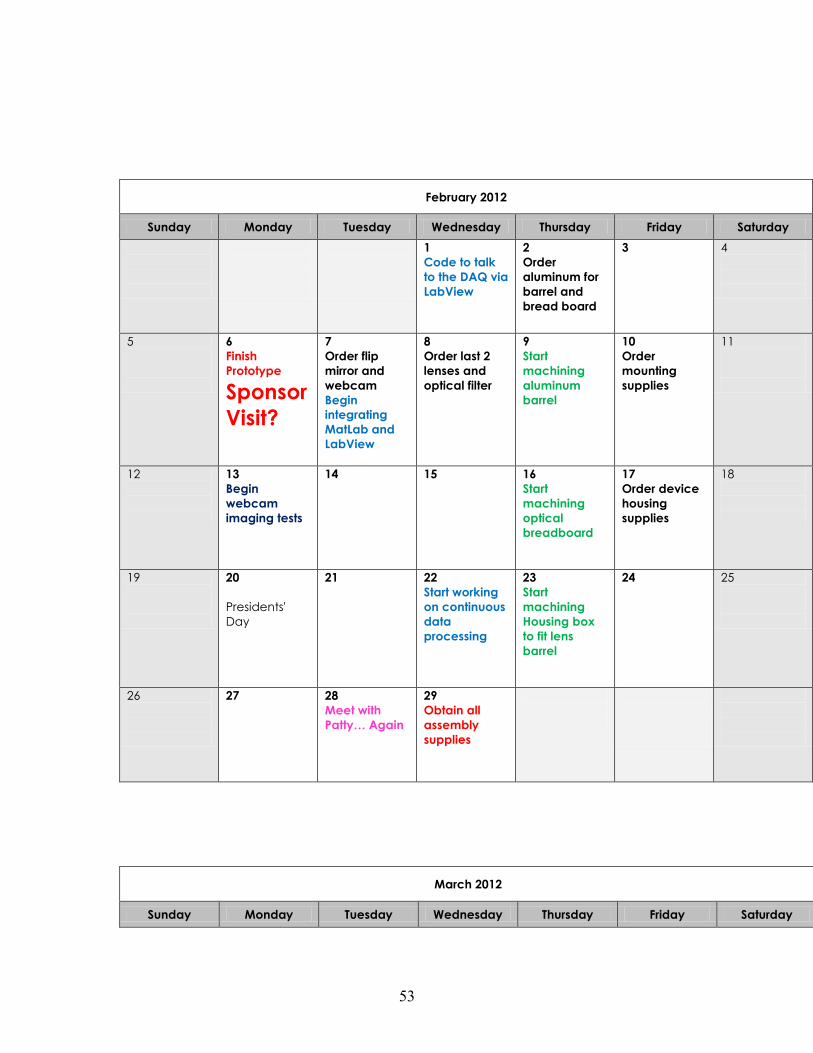
53
February 2012
Sunday Monday Tuesday Wednesday Thursday Friday Saturday
1 Code to talk to the DAQ via LabView
2 Order aluminum for barrel and bread board
3
4
5
6 Finish Prototype
Sponsor Visit?
7 Order flip mirror and webcam Begin integrating MatLab and LabView
8 Order last 2 lenses and optical filter
9 Start machining aluminum barrel
10 Order mounting supplies
11
12
13 Begin webcam imaging tests
14
15
16 Start machining optical breadboard
17 Order device housing supplies
18
19
20 Presidents' Day
21
22 Start working on continuous data processing
23 Start machining Housing box to fit lens barrel
24
25
26
27
28 Meet with Patty… Again
29 Obtain all assembly supplies
March 2012
Sunday Monday Tuesday Wednesday Thursday Friday Saturday

54
1 Begin Assemble
2 3
4
5
6 7 Finish Assembly
8 Begin field testing
9 10
11 12 13 14 15 16 17
18 19 20 21 22 Status update with sponsor
23 24
25 26 27 28 29 30 31
April 2012
Sunday Monday Tuesday Wednesday Thursday Friday Saturday 1 2 3
Final meeting with Patty
4 5 6 Good Friday
7
8 Easter Sunday
9 10 11 12 13 14

55
15 16 Begin Presentation Prep for design day
17 18
19 20 21
22 23 24 Finish poster
25 26 Finish Video
27 28
29 30 Finish presentation for design day
May 2012
Sunday Monday Tuesday Wednesday Thursday Friday Saturday 1
Oral Presentation
2 Design Day
3 4 5
Table 6: Gantt Chart ‐ Timeline showing important milestones and the dates of completion from fall semester