abstract introduction discussion
TRANSCRIPT

1
Full title: Lip-reading enables the brain to synthesize auditory features of unknown silent 1
speech. 2
Running title: Synthesizing auditory features of silent speech. 3
4
Authors: Mathieu Bourguignon1,2,3,*, Martijn Baart1,4, Efthymia C. Kapnoula1, Nicola 5
Molinaro1,5 6
7
Affiliations 8 1BCBL. Basque Center on Cognition, Brain and Language, 20009 San Sebastian, Spain. 9 2Laboratoire de Cartographie fonctionnelle du Cerveau, UNI – ULB Neuroscience Institute, Université libre de 10 Bruxelles (ULB), Brussels, Belgium. 11 3Laboratoire Cognition Langage et Développement, UNI – ULB Neuroscience Institute, Université libre de 12 Bruxelles (ULB), Brussels, Belgium. 13 4Department of Cognitive Neuropsychology, Tilburg University, Tilburg, the Netherlands. 14 5Ikerbasque, Basque Foundation for Science, Bilbao, Spain. 15 *Corresponding author. E-mail: [email protected]. 16
17
Number of pages: 47, number of figures: 9, number of tables: 1, number of words in 18
Abstract: 250, number of words in Introduction: 624, number of words in Discussion: 19
1490. 20
21
Conflict of interest 22
The authors have no conflict of interest to declare. 23
24
Acknowledgment 25
Mathieu Bourguignon was supported by the Innoviris Attract program (grant 2015-BB2B-26
10), by the Spanish Ministry of Economy and Competitiveness (grant PSI2016-77175-P), and 27
by the Marie Skłodowska-Curie Action of the European Commission (grant 743562). Martijn 28
Baart was supported by the Netherlands Organization for Scientific Research (NWO, VENI 29

2
grant 275-89-027). Efthymia C. Kapnoula was supported by the Spanish Ministry of 30
Economy and Competitiveness, through the Juan de la Cierva-Formación fellowship, and by 31
the Spanish Ministry of Economy and Competitiveness (grant PSI2017-82563-P). Nicola 32
Molinaro was supported by the Spanish Ministry of Science, Innovation and Universities 33
(grant RTI2018-096311-B-I00), the Agencia Estatal de Investigación (AEI), the Fondo 34
Europeo de Desarrollo Regional (FEDER) and by the Basque government (grant 35
PI_2016_1_0014). The authors acknowledge financial support from the Spanish Ministry of 36
Economy and Competitiveness, through the “Severo Ochoa” Programme for Centres/Units of 37
Excellence in R&D” (SEV�2015�490) awarded to the BCBL. 38
We thank Riitta Hari at Department of Art (Aalto University School of Arts, Design, and 39
Architecture, Espoo, Finland) for helpful comments on the manuscript. 40
41

3
Abstract 42
Lip-reading is crucial for understanding speech in challenging conditions. But how 43
the brain extracts meaning from—silent—visual speech is still under debate. Lip-reading in 44
silence activates the auditory cortices, but it is not known whether such activation reflects 45
immediate synthesis of the corresponding auditory stimulus or imagery of unrelated sounds. 46
To disentangle these possibilities, we used magnetoencephalography to evaluate how 47
cortical activity in 28 healthy adults humans (17 females) entrained to the auditory speech 48
envelope and lip movements (mouth opening) when listening to a spoken story without visual 49
input (audio-only), and when seeing a silent video of a speaker articulating another story 50
(video-only). 51
In video-only, auditory cortical activity entrained to the absent auditory signal at 52
frequencies below 1 Hz more than to the seen lip movements. This entrainment process was 53
characterized by an auditory-speech–to–brain delay of ~70 ms in the left hemisphere, 54
compared to ~20 ms in audio-only. Entrainment to mouth opening was found in the right 55
angular gyrus at below 1 Hz, and in early visual cortices at 1–8 Hz. 56
These findings demonstrate that the brain can use a silent lip-read signal to synthesize 57
a coarse-grained auditory speech representation in early auditory cortices. Our data indicate 58
the following underlying oscillatory mechanism: Seeing lip movements first modulates 59
neuronal activity in early visual cortices at frequencies that match articulatory lip movements; 60
the right angular gyrus then extracts slower features of lip movements, mapping them onto 61
the corresponding speech sound features; this information is fed to auditory cortices, most 62
likely facilitating speech parsing. 63
64
Significance statement 65
4
Lip-reading consists in decoding speech based on visual information derived from 66
observation of a speaker’s articulatory facial gestures. Lip reading is known to improve 67
auditory speech understanding, especially when speech is degraded. Interestingly, lip-reading 68
in silence still activates the auditory cortices, even when participants do not know what the 69
absent auditory signal should be. However, it was uncertain what such activation reflected. 70
Here, using magnetoencephalographic recordings, we demonstrate it reflects fast synthesis of 71
the auditory stimulus rather than mental imagery of unrelated—speech or non-speech—72
sounds. Our results also shed light on the oscillatory dynamics underlying lip-reading. 73
74
75
Keywords 76
Lip reading; silent speech; audiovisual integration; speech entrainment; 77
magnetoencephalography 78
79

5
Introduction 80
In everyday situations, seeing a speaker’s articulatory mouth gestures, here referred to 81
as lip-reading or visual speech, can help us decode the auditory speech signal (Sumby and 82
Pollack, 1954). In fact, lip movements are intelligible even without an auditory signal, likely 83
because there is a strong connection between auditory and visual speech (Munhall and 84
Vatikiotis-Bateson, 2004; Chandrasekaran et al., 2009). It is however not clear how the brain 85
extracts meaning from visual speech. 86
Some evidence points to the possibility that visual speech is recoded into acoustic 87
information. For example, seeing silent visual speech clips of simple speech sounds such as 88
vowels or elementary words activates auditory cortical areas (Calvert et al., 1997; Pekkola et 89
al., 2005), even when participants are not aware of what the absent auditory input should be 90
(Calvert et al., 1997; Bernstein et al., 2002; Paulesu et al., 2003). However, recoding visual 91
speech into an acoustic representation (here referred to as synthesis) is computationally 92
demanding. It has therefore been suggested that meaning is directly extracted from visual 93
speech within visual areas and heteromodal association cortices (Bernstein and Liebenthal, 94
2014; O’Sullivan et al., 2016; Lazard and Giraud, 2017; Hauswald et al., 2018). According to 95
this view, activation in early auditory cortices driven by lip reading might reflect imagery of 96
unrelated—speech—sounds (Bernstein and Liebenthal, 2014), but not a direct recoding of 97
visual speech into its corresponding acoustic representation. As previous work has relied on 98
time-insensitive neuroimaging techniques (Calvert et al., 1997; Bernstein et al., 2002; 99
Paulesu et al., 2003; Pekkola et al., 2005), there was no empirical evidence to disentangle 100
these two alternatives. Here, we took advantage of auditory cortical entrainment to look for 101
decisive evidence to support the existence of a synthesis mechanism whereby visual speech is 102
recoded into its corresponding auditory information. 103

6
When people listen to continuous natural speech, oscillatory cortical activity 104
synchronises with the auditory temporal speech envelope (Luo and Poeppel, 2007; 105
Bourguignon et al., 2012; Gross et al., 2013; Peelle et al., 2013; Molinaro et al., 2016; Vander 106
Ghinst et al., 2016; Meyer et al., 2017; Meyer and Gumbert, 2018). Such “speech-brain 107
entrainment” originates mainly in auditory cortices at frequencies matching phrase (below 1 108
Hz) and syllable rates (4–8 Hz), and is thought to be essential for speech comprehension 109
(Ahissar et al., 2001; Luo and Poeppel, 2007; Peelle et al., 2013; Ding et al., 2016; Meyer et 110
al., 2017). An electroencephalography study suggested that silent lip-read information 111
entrains cortical activity at syllable rate when participants are highly familiar with speech 112
content (Crosse et al., 2015). However, since participants knew what the absent speech sound 113
should be in this study, it remains unclear whether entrainment is driven by the (i) lip-read 114
information, (ii) covert production or repetition of the speech segment, (iii) top-down lexical 115
and semantic processes, or (iv) some combination of these factors. 116
Here, we address the following critical question: does the brain use lip-read input to 117
bring auditory cortices to entrain to the audio speech signal even when there is no physical 118
speech sound and participants do not know the content of the absent auditory signal? To do 119
so, we evaluated entrainment to a spoken story without visual input (audio-only), and 120
compared these data to a silent condition with a video of a speaker articulating another story 121
(video-only). To determine the ‘lip-read specificity’ of these entrainment patterns, we also 122
included a condition in which the mouth configuration of the speaker telling another story 123
was transduced into a dynamic luminance contrast (control-video-only). If the brain can 124
synthesize properties of missing speech based on concurrent lip-reading in a timely manner, 125
auditory cortical entrainment with the envelope of the audio signal should be similar in 126
audio-only and video-only, even if the speech sound was not physically present in the latter 127
condition. 128

7
129
Materials and Methods 130
Participants 131
Twenty-eight healthy human adults (17 females) aged 24.1±4.0 years (mean ± SD) 132
were included in the study. All reported being native speakers of Spanish and right-handed. 133
They had normal or corrected-to-normal vision and normal hearing, had no prior history of 134
neurological or psychiatric disorders, and were not taking any medication or substance that 135
could influence the nervous system. 136
The experiment was approved by the BCBL Ethics Review Board and complied with 137
the guidelines of the Helsinki Declaration. Written informed consent was obtained from all 138
participants prior to testing. 139
Experimental paradigm 140
Figure 1 presents stimulus examples and excerpts. The stimuli were derived from 8 141
audio-visual recordings of a female native Spanish speaker talking for 5 min about a given 142
topic (animals, books, food, holidays, movies, music, social media, and sports). Video and 143
audio were simultaneously recorded using a digital camera (Canon Legria HF G10) with an 144
internal microphone. Video recordings were framed as head shots, and recorded at the PAL 145
standard of 25 frames per second (videos were 1920 × 1080 pixels in size, 24 bits/pixel, with 146
an auditory sampling rate of 44100 Hz). The camera was placed ~70 cm away from the 147
speaker, and the face spanned about half of the vertical field of view. Final images were 148
resized to a resolution of 1024 × 768 pixels. 149
For each video, a “control” video was created in which mouth movements were 150
transduced into luminance changes (Fig. 1C). To achieve this we extracted lip contours from 151
each individual frame of the video recordings with an in-house Matlab code based on the 152
8
approach of Eveno et al. (2004). In the control video, the luminance of a Greek cross changed 153
according to mouth configuration (Fig. 1C). Its size (300 × 300 pixels) was roughly matched 154
with the extent of the eyes and mouth, which are the parts of the face people tend to look at 155
when watching a speaker’s face (Vatikiotis-Bateson et al., 1998). Mouth configuration 156
variables (mouth opening, width, and surface) were rescaled so that their 1st and 99th 157
percentiles corresponded to the minimum and maximum luminance levels. The center of the 158
cross encoded the mouth surface area, its top and bottom portions encoded mouth opening, 159
and its left- and rightmost portions encoded mouth width. In this configuration, the three 160
represented parameters were spatially and temporally congruent with the portion of the mouth 161
they parametrized. All portions were smoothly connected by buffers along which the weight 162
of the encoded parameters varied as a squared cosine. These control videos were designed to 163
determine if effects were specific to lip-reading. The transduced format was preferred to other 164
classical controls such as meaningless lip movements or gum-chewing motions because 165
preserved the temporal relation between the visual input and underlying speech sounds. 166
For each sound recording, we derived a non-speech “control” audio consisting of 167
white noise modulated by the auditory speech envelope. These control sounds were designed 168
to determine whether uncovered effects were specific to speech. However, conditions that 169
included these control sounds were not analyzed because they were uninformative about lip-170
reading driven oscillatory entrainment. 171
In total, participants completed 10 experimental conditions while sitting with their 172
head in a MEG helmet. This included all 9 possible combinations of 3 types of visual stimuli 173
(original, control, no video) and 3 types of audio stimuli (original, control, no audio). The test 174
condition with no audio and no video was trivially labeled as the rest condition and lasted 5 175
min. Each of the other 8 conditions was assigned to 1 of the 8 stories (condition–story 176
assignment counterbalanced across participants). In this way, we ensured that each condition 177

9
was presented continuously for 5 min, and that the same story was never presented twice. The 178
tenth condition was a localizer condition in which participants attended 400-Hz pure tones 179
and checkerboard pattern reversals lasting 10 min. This condition is not analyzed in this 180
paper. All conditions were presented in random order, separated by short breaks. Videos were 181
shown on a back-projection screen (videos were 41 cm × 35 cm in size) placed in front of the 182
participants at a distance of ~1 m. Sounds were delivered at 60 dB (measured at ear-level) 183
through a front-facing speaker (Panphonics Oy, Espoo, Finland) placed ~1 m behind the 184
screen. Participants were instructed to watch the videos and listen to the sounds attentively. 185
To investigate our research hypotheses, we focussed on the following conditions: 1) 186
the original speech audio with no video, referred to as audio-only, 2) the original video with 187
no audio, referred to as video-only, 3) the control video with no audio, referred to as the 188
control-video-only, and 4) the rest. 189
Data acquisition 190
Neuromagnetic signals were acquired with a whole-scalp-covering 191
neuromagnetometer (Vectorview; Elekta Oy, Helsinki, Finland) in a magnetically shielded 192
room. The recording pass-band was 0.1–330 Hz and the signals were sampled at 1 kHz. The 193
head position inside the MEG helmet was continuously monitored by feeding current to 4 194
head-tracking coils located on the scalp. Head position indicator coils, three anatomical 195
fiducials, and at least 150 head-surface points (covering the whole scalp and the nose surface) 196
were localized in a common coordinate system using an electromagnetic tracker (Fastrak, 197
Polhemus, Colchester, VT, USA). 198
Eye movements were tracked with an MEG-compatible eye tracker (EyeLink 1000 199
Plus, SR Research). Participants were calibrated using the standard 9-point display and 200
monocular eye movements were recorded at a sampling rate of 1 kHz. Eye-movements were 201
recorded for the duration of all experimental conditions. 202

10
High-resolution 3D-T1 cerebral magnetic resonance images (MRI) were acquired on a 203
3 Tesla MRI scan (Siemens Medical System, Erlangen, Germany) facility available at the 204
BCBL. 205
MEG preprocessing 206
Continuous MEG data were first preprocessed off-line using the temporal signal space 207
separation method (correlation coefficient, 0.9; segment length, 10 s) to suppress external 208
sources of interference and to correct for head movements (Taulu et al., 2005; Taulu and 209
Simola, 2006). To further suppress heartbeat, eye-blink, and eye-movement artifacts, 30 210
independent components (Vigário et al., 2000; Hyvärinen et al., 2004) were evaluated from 211
the MEG data low-pass filtered at 25 Hz using FastICA algorithm (dimension reduction, 30; 212
non-linearity, tanh). Independent components corresponding to such artifacts were identified 213
based on their topography and time course and were removed from the full-rank MEG 214
signals. 215
Coherence analysis 216
Coherence was estimated between MEG signals and 1) the auditory speech temporal 217
envelope, 2) mouth opening, 3) mouth width, and 4) mouth surface. The auditory speech 218
temporal envelope was obtained by summing the Hilbert envelope of the auditory speech 219
signal filtered through a third octave filter bank (central frequency ranging linearly on a log-220
scale from 250 Hz to 1600 Hz; 19 frequency bands), and was further resampled to 1000 Hz 221
time-locked to the MEG signals (Fig. 1B). Continuous data from each condition were split 222
into 2-s epochs with 1.6-s epoch overlaps, affording a spectral resolution of 0.5 Hz while 223
decreasing noise on coherence estimates (Bortel and Sovka, 2014). MEG epochs exceeding 5 224
pT (magnetometers) or 1 pT/cm (gradiometers) were excluded from further analyses to avoid 225
data contamination by artifact sources that had not been suppressed by the temporal signal 226

11
space separation or removed with independent component analysis. These steps led to an 227
average of 732 artifact-free epochs across participants and conditions (SD = 36). A one-way 228
repeated measures ANOVA revealed no differences between conditions (F2,54 = 1.07, p = 229
0.35). Next, we estimated sensor-level coherence (Halliday, 1995) and combined gradiometer 230
pairs based on the direction of maximum coherence (Bourguignon et al., 2015). Only values 231
from these gradiometer pairs are presented in the results. 232
In coherence analyses, we focused on four frequency ranges (0.5 Hz, 1–3 Hz, 2–5 Hz, 233
and 4–8 Hz) by averaging coherence across the frequency bins they encompassed. The 2–5-234
Hz, and 4–8-Hz frequency ranges were well matched to the count rate of words (3.34 ± 0.12 235
Hz; mean ± SD across the 8 videos) and syllables (5.91 ± 0.12 Hz), while the count rate of 236
phrases (1.01 ± 0.20 Hz) fell in between the two lowest ranges. As in a previous study 237
(Vander Ghinst et al., 2019), rates were assessed as the number of phrases, words, or 238
syllables manually extracted from audio recordings divided by the corrected duration of the 239
audio recording. For phrases, the corrected duration was trivially the total duration of the 240
audio recording. For words and syllables, the corrected duration was the total time during 241
which the talker was actually talking, that is the total duration of the audio recording (here 5 242
min) minus the sum of all silent periods when the auditory speech envelope was below a 243
tenth of its mean for at least 100 ms. Note that setting the threshold for the duration defining 244
a silent period to a value obviously too low (10 ms) or too high (500 ms) changed the 245
estimates of word and syllable count rates by only ~10 %. These frequency ranges were 246
selected also because auditory speech entrainment dominates at 0.5 Hz and 4–8 Hz (Luo and 247
Poeppel, 2007; Bourguignon et al., 2012; Gross et al., 2013; Peelle et al., 2013; Molinaro et 248
al., 2016; Vander Ghinst et al., 2016; Meyer et al., 2017; Meyer and Gumbert, 2018) but is 249
also present at intermediate frequencies (Keitel et al., 2018), and because lip entrainment has 250

12
previously been identified at 2–5 Hz (Park et al., 2016; Giordano et al., 2017). Coherence 251
maps were also averaged across participants for illustration purposes. 252
We only report coherence estimated between MEG signals and 1) the auditory speech 253
envelope and 2) mouth opening. Although tightly related, the two latter signals displayed 254
only a moderate degree of coupling, that peaked at 0.5 Hz, and 4–8 Hz (Fig. 2Ai), with a 255
visual–to–auditory speech delay of ~120-ms (maximum cross-correlation between auditory 256
speech envelope and mouth opening; Fig. 2Bi). Mouth opening and mouth surface were 257
coherent at > 0.7 across the 0–10-Hz range (Fig. 2Aii) and yielded similar results. Mouth 258
width displayed a moderate level of coherence with mouth opening (Fig. 2Aiii) and an unclear 259
visual–to–auditory speech delay (Fig. 2Bii). Mouth width was not included in the main 260
analyses because it led to lower coherence values with MEG signals than mouth opening, but 261
was retained as a nuisance factor in the partial coherence analyses (see below). 262
It is worth noting that the magnitude of the coupling between the auditory speech 263
envelope and mouth opening (as assessed by coherence) we report for our audio-visual 264
stimuli was 2–3 times lower than that reported elsewhere (Park et al., 2016; Hauswald et al., 265
2018). To ensure that this discrepancy was not due to the inadequacy of our lip-extraction 266
procedure, we compared our time-series of mouth parameters to those extracted using a deep-267
learning-based solution (Visage Technology; face tracking and analysis). This revealed a 268
good correspondence between the estimated time-series for mouth opening (r = 0.95 ± 0.01; 269
mean ± SD across the 8 videos), mouth width (r = 0.88 ± 0.01), and mouth surface (r = 0.95 270
± 0.01). The genuine difference between the level of audio-visual speech coupling found in 271
our study compared to others might be due to the language used (Spanish here vs. English 272
elsewhere), or to the idiosyncrasies of our talker. Nevertheless, this relative decoupling 273
between audio- and visual speech signals provided an opportunity to separate their respective 274
cortical representations more efficiently. 275
13
Coherence was also estimated at the source level. To do so, individual MRIs were 276
first segmented using the Freesurfer software (Reuter et al., 2012; RRID:SCR_001847). 277
Then, the MEG forward model was computed using the Boundary Element Method 278
implemented in the MNE software suite (Gramfort et al., 2014; RRID:SCR_005972) for three 279
orthogonal tangential current dipoles (corresponding to the 3 spatial dimensions) placed on a 280
homogeneous 5-mm grid source space covering the whole brain. At each source, the forward 281
model was further reduced to its two first principal components, which closely corresponded 282
to sources tangential to the skull; the discarded component corresponded to the radial source 283
which is close to magnetically silent. Coherence maps were produced within the computed 284
source space at 0.5 Hz, 1–3 Hz, 2–5 Hz, and 4–8 Hz using a linearly constrained minimum 285
variance beamformer built based on the rest data covariance matrix (Van Veen et al., 1997; 286
Hillebrand and Barnes, 2005). Source maps were then interpolated to a 1-mm homogenous 287
grid and smoothed with a Gaussian kernel of 5 mm full-width-at-half-maximum. Both planar 288
gradiometers and magnetometers were used for inverse modeling after dividing each sensor 289
signal (and the corresponding forward-model coefficients) by the standard deviation of its 290
noise. The noise variance was estimated from the continuous rest MEG data band-passed 291
through 1–195 Hz, for each sensor separately. 292
Coherence maps were also produced at the group level. A non-linear transformation 293
from individual MRIs to the MNI brain was first computed using the spatial normalization 294
algorithm implemented in Statistical Parametric Mapping (SPM8; Ashburner et al., 1997; 295
Ashburner and Friston, 1999; RRID:SCR_007037) and then applied to individual MRIs and 296
coherence maps. This procedure generated a normalized coherence map in the MNI space for 297
each subject and frequency range. Coherence maps were then averaged across participants. 298
Individual and group-level coherence maps for the auditory speech envelope (mouth 299
opening, respectively) were also estimated after controlling for mouth opening and mouth 300

14
width (the auditory speech envelope, respectively) using partial coherence (Halliday, 1995). 301
Partial coherence is the direct generalization of partial correlation (Kendall and Stuart, 1968) 302
to the frequency domain (Halliday, 1995). 303
The same approach was used to estimate coherence between MEG (in the sensor and 304
source space) and global changes (or edges) in the visual stimulus, and to partial out such 305
“global visual change” from coherence maps for the auditory speech envelope. The global 306
visual change signal was computed at every video frame as the sum of squares of the 307
difference between that frame and the previous frame, divided by the sum of squares of the 308
previous frame. This signal predominantly identified edges corresponding to periods when 309
the speaker moved her head, eyebrows and jaw (see Fig. 3). The rationale being that these 310
periods may tend to co-occur with the onset of phrases and sentences (Munhall et al., 2004) 311
and could modulate oscillatory activity in auditory cortices (Schroeder et al., 2008). 312
Finally, individual and group-level coherence maps for the auditory speech envelope 313
in video-only were estimated after shifting the auditory speech envelope by ~30 s, ~60 s, … 314
~240 s, and ~270 s. For each subject and time-shift, the exact time-shift applied was selected 315
within a ±10 s window around the target time-shift, at the silent period for which the auditory 316
speech envelope smoothed with a 1-s square kernel was at the minimum. Ensuing values of 317
coherence were used to rule out the possibility that coherence with the genuine auditory 318
speech envelope results from general temporal characteristics of auditory speech. 319
Estimation of temporal response functions 320
We used temporal response functions (TRFs) to model how the auditory speech 321
envelope affected the temporal dynamics of auditory cortical activity. Based on our results, 322
TRFs were estimated only for the 0.2–1.5-Hz frequency range, in the audio-only and video-323
only conditions. A similar approach has been used to model brain responses to speech at 1–8 324
Hz (Lalor and Foxe, 2010; Zion Golumbic et al., 2013), and to model brain responses to 325
15
natural force fluctuations occurring during maintenance of constant hand grip contraction 326
(Bourguignon et al., 2017b). TRFs are the direct analogue of evoked responses in the context 327
of continuous stimulation. 328
We used the mTRF toolbox (Crosse et al., 2016) to estimate the TRF of auditory 329
cortical activity associated with the auditory speech envelope. In all conditions, source 330
signals were reconstructed at individual coordinates of maximum 0.5-Hz coherence with the 331
auditory speech envelope in audio-only. These two-dimensional source signals were 332
projected onto the orientation that maximized the coherence with the auditory speech 333
envelope at 0.5 Hz. Then, the source signal was filtered at 0.2–1.5 Hz, the auditory speech 334
envelope was convolved with a 50-ms square smoothing kernel and both were down-sampled 335
to 20 Hz (note that for auditory speech envelope, this procedure is equivalent to taking the 336
mean over samples 25 ms around sampling points). For each subject, the TRFs were modeled 337
from –1.5 s to +2.5 s, for a fixed set of ridge values (λ = 20, 21, 22… 220). We adopted the 338
following 10-fold cross-validation procedure to determine the optimal ridge value: For each 339
subject, TRFs were estimated based on 90% of the data, and used to predict the 10% of data 340
left out and the Pearson correlation was then estimated between predicted and measured 341
signals. The square of the mean correlation value across the 10 runs provided an estimate of 342
the proportion of variance explained by entrainment to the auditory speech envelope. TRFs 343
were recomputed based on all the available data for the ridge value maximizing the mean 344
explained variance. To deal with sign ambiguity, the polarity of each TRF was adapted so 345
that correlation with the first singular vector of all subjects’ TRF in the range –0.5 s to 1.0 s is 346
positive. 347
Based on our results, the TRF framework was also used to model brain responses to 348
mouth opening and the global visual change signal at 0.2–1.5 Hz and mouth opening at 2–5 349
Hz, and to model the evolution of the auditory speech envelope at 0.2–1.5 Hz associated with 350

16
the time course of (i) mouth opening, (ii) global visual change, and (iii) the Hilbert envelope 351
of mouth opening in the 2–5-Hz band. Note that the last TRF seeks phase–amplitude 352
coupling between auditory speech envelope at 0.2–1.5 Hz (phase) and mouth opening at 2–5 353
Hz (amplitude), with the—perhaps not that common—perspective that the amplitude signal 354
drives the phase signal. We used exactly the same parameters as reported above, except the 355
data for the brain response to mouth opening at 2–5 Hz where were downsampled to 50 Hz 356
and modeled from –0.7 to 1.2 s. 357
Eye-tracking data 358
As in previous studies using eye-tracking (McMurray et al., 2002; Kapnoula et al., 359
2015), eye-movements were automatically parsed into saccades and fixations using default 360
psychophysical parameters. Adjacent saccades and fixations were combined into a single 361
“look” that started at the onset of the saccade and ended at the offset of the fixation. 362
A region of interest was identified for each of the three critical objects: mouth and 363
eyes in video-only and flickering cross in control-video-only (Fig. 4). In converting the 364
coordinates of each look to the object being fixated, the boundaries of the regions of interest 365
were extended by 50 pixels in order to account for noise and/or head-drift in the eye-tracking 366
record. This did not result in any overlap between the eye and mouth regions. 367
Based on these regions of interest, we estimated the proportion of eye fixation to the 368
combined regions of interest encompassing eyes and mouth in video-only and flickering cross 369
in control-video-only. Eyes and mouth regions were combined because these are the parts of 370
the face people tend to look at when watching a talking face (Vatikiotis-Bateson et al., 1998). 371
Importantly, even when people are looking at the eyes, lip movements—in the periphery of 372
the field of view—still benefit speech perception (Paré et al., 2003; Kaplan and Jesse, 2019). 373
The two resulting areas were of comparable size: 100,800 pixels for the flickering cross vs. 374
77,300 pixels for the eyes and mouth. Data from one participant were excluded due to 375

17
technical issues during acquisition, and eye fixation analyses were thus based on data from 27 376
participants. 377
Experimental design and statistical analyses 378
Sample size was based on previous studies reporting entrainment to lip movements, 379
which included 46 (Park et al., 2016) and 19 (Giordano et al., 2017) healthy adults. 380
The statistical significance of the local coherence maxima observed in group-level 381
maps was assessed with a non-parametric permutation test that intrinsically corrects for 382
multiple spatial comparisons (Nichols and Holmes, 2002). Subject- and group-level rest 383
coherence maps were computed in a similar way to the genuine maps; MEG signals were 384
replaced by rest MEG signals while auditory/visual speech signals were identical. Group-385
level difference maps were obtained by subtracting genuine and rest group-level coherence 386
maps. Under the null hypothesis that coherence maps are the same irrespective of the 387
experimental condition, genuine and rest labels should be exchangeable at the subject-level 388
prior to computing the group-level difference map (Nichols and Holmes, 2002). To reject this 389
hypothesis and to compute a threshold of statistical significance for the correctly labeled 390
difference map, the permutation distribution of the maximum of the difference map’s 391
absolute value was computed for a subset of 1000 permutations. The threshold at p < 0.05 392
was computed as the 95th percentile of the permutation distribution (Nichols and Holmes, 393
2002). Permutation tests can be too conservative for voxels other than the one with the 394
maximum observed statistic (Nichols and Holmes, 2002). For example, dominant coherence 395
values in the right auditory cortex could bias the permutation distribution and overshadow 396
weaker coherence values in the left auditory cortex, even if these were highly consistent 397
across subjects. Therefore, the permutation test described above was conducted separately for 398
left- and right-hemisphere voxels. All supra-threshold local coherence maxima were 399

18
interpreted as indicative of brain regions showing statistically significant coupling with the 400
auditory or visual signal. 401
A confidence volume was estimated for all significant local maxima, using the 402
bootstrap-based method described in Bourguignon et al. (2017a). The location of the maxima 403
was also compared between conditions using the same bootstrap framework (Bourguignon et 404
al., 2017a). 405
For each local maximum, individual maximum coherence values were extracted 406
within a 10-mm sphere centered on the group level coordinates, or on the coordinates of 407
maxima for audio-only. Coherence values were compared between conditions or signals of 408
reference with two-sided paired t-tests. 409
The bootstrap method was used to assess the timing of peak TRFs (Efron and 410
Tibshirani, 1993). As a preliminary step, TRFs were upsampled by spline interpolation to 411
1000 Hz. A bootstrap distribution based on 10000 random drawings of subjects (or videos) 412
was then built for the timing of peak TFR, from which we extracted the mean and standard 413
deviation. Also the bias-corrected and accelerated bootstrap (Efron and Tibshirani, 1993) was 414
used to compare the timing of peak TRF between conditions. 415
For the eye-tracking data, individual proportions of fixations were transformed using 416
the empirical-logit transformation (Collins et al., 1992). Fixations to eyes and mouth in video-417
only were compared to fixations to the flickering cross in control-video-only using a two-418
sided paired t-test across participants. 419
Data and software availability 420
MEG and eye-tracking data as well as video stimuli are available on request from the 421
corresponding author. 422
423

19
Results 424
Table 1 provides the coordinates and significance level of the loci of statistically 425
significant coherence with the auditory speech envelope (henceforth, speech entrainment) and 426
mouth opening (henceforth, lip entrainment) in all conditions (audio-only, video-only, and 427
control-video-only) at all the selected frequency ranges (0.5 Hz, 1–3 Hz, 2–5 Hz, and 4–8 428
Hz). 429
Entrainment to heard speech 430
In audio-only, significant speech entrainment peaked at sensors covering bilateral 431
auditory regions in all the explored frequency ranges: 0.5-Hz (Fig. 5A), 1–3 Hz (Fig. 6A), 2–432
5 Hz (Fig. 6B), and 4–8 Hz (Fig. 6C). Underlying sources were located in bilateral auditory 433
cortices (Fig. 5A, 6, and Table 1). 434
Auditory cortices entrain to absent speech at frequencies below 1 Hz 435
In visual-only, there was significant 0.5-Hz entrainment to the speech sound that was 436
actually produced by the speaker, but not heard by participants (see Fig. 5B and Table 1). The 437
significant loci for speech entrainment were the bilateral auditory cortices, the left inferior 438
frontal gyrus, and the inferior part of the left precentral sulcus (Fig. 5B and Table 1). 439
Critically, the location of the auditory sources where we observed maximum 0.5-Hz 440
entrainment did not differ significantly between audio-only and video-only (left, F3,998 = 1.62, 441
p = 0.18; right, F3,998 = 0.85, p = 0.47). Not surprisingly, the magnitude of 0.5-Hz speech 442
entrainment was higher in audio-only than in video-only (left, t27 = 6.36, p < 0.0001; right, t27 443
= 6.07, p < 0.0001). Nevertheless, brain responses associated with speech entrainment at ~0.5 444
Hz displayed a similar time-course in audio-only and video-only (see Fig. 5A and 5B). In the 445
left hemisphere, brain response peaked after the auditory speech envelope with a delay that 446
did not differ significantly between the two conditions (audio-only, 18 ± 19 ms, video-only, 447

20
73 ± 47 ms; p = 0.27); in the right hemisphere this delay was significantly shorter for audio-448
only (43 ± 38 ms) than video-only (216 ± 54 ms; p = 0.019). These results demonstrate that 449
within the auditory cortices, neuronal activity at ~0.5 Hz is modulated similarly by heard 450
speech sounds and absent speech when lip-read information is available, but incurs an 451
additional delay in the right hemisphere. Next, we address four critical questions related to 452
this effect: 1) Can it be explained by the general temporal characteristics of auditory speech? 453
2) Is it unspecific to seeing the speaker’s face? 3) Is it a direct result of lip-reading induced 454
visual activity simply being fed to auditory areas? 4) Is it mediated by edges in the visual 455
stimuli (predominantly reflecting head, eyebrows and jaw movements) that would prime 456
phrase/sentence onset and modulate auditory cortical activity. A negative answer to these 4 457
questions would support the view that auditory speech envelope is “synthesized” through 458
internal models that map visual speech onto sound features. 459
Below 1-Hz entrainment to absent speech is not explained by the general temporal 460
characteristics of auditory speech 461
In video-only, auditory sources (coordinates identified in audio-only) entrained 462
significantly more to the corresponding—though absent—auditory speech than to unrelated 463
auditory speech, here taken as the corresponding speech shifted in time (left, t27 = 3.08, p = 464
0.0047; right, t27 = 3.78, p = 0.0008; see Fig. 7A). In this analysis, individual subject values 465
were computed as the mean value across all considered time shifts. In addition, inspection of 466
the maps of entrainment to unrelated speech did not reveal any special tendency to peak in 467
auditory regions. This demonstrates that entrainment to absent speech in auditory cortices is 468
not a consequence of the general temporal characteristics of auditory speech. 469
21
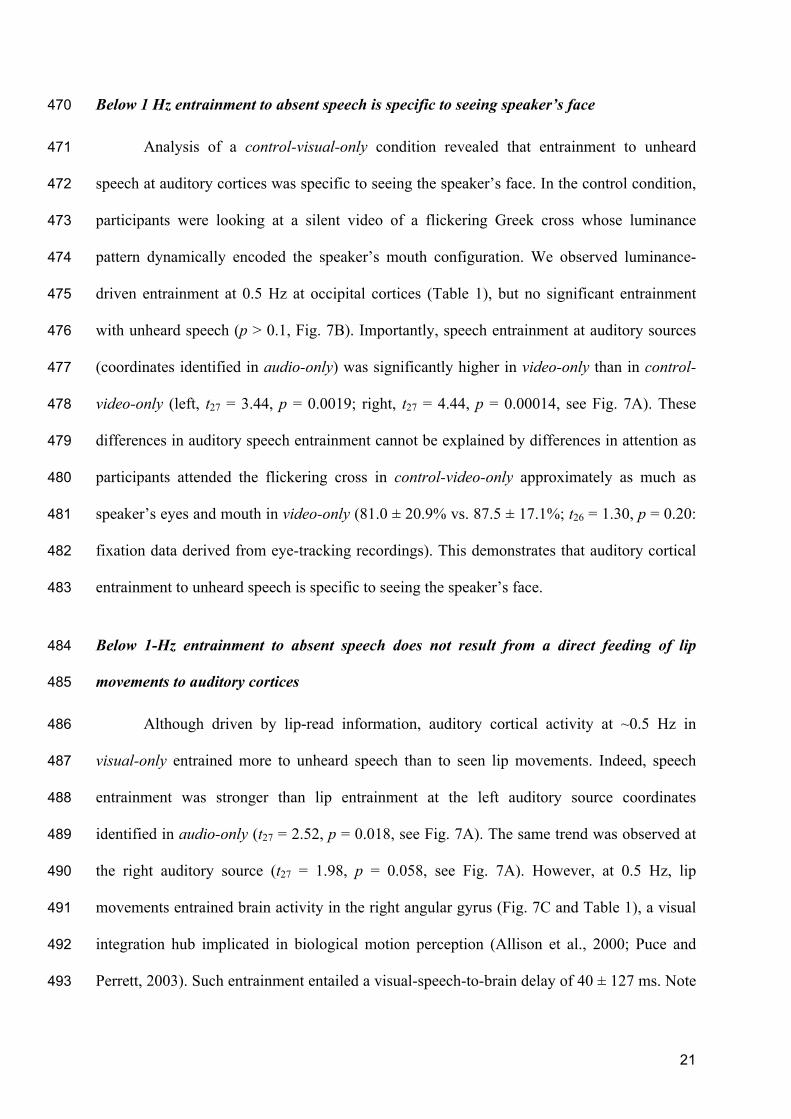
Below 1 Hz entrainment to absent speech is specific to seeing speaker’s face 470
Analysis of a control-visual-only condition revealed that entrainment to unheard 471
speech at auditory cortices was specific to seeing the speaker’s face. In the control condition, 472
participants were looking at a silent video of a flickering Greek cross whose luminance 473
pattern dynamically encoded the speaker’s mouth configuration. We observed luminance-474
driven entrainment at 0.5 Hz at occipital cortices (Table 1), but no significant entrainment 475
with unheard speech (p > 0.1, Fig. 7B). Importantly, speech entrainment at auditory sources 476
(coordinates identified in audio-only) was significantly higher in video-only than in control-477
video-only (left, t27 = 3.44, p = 0.0019; right, t27 = 4.44, p = 0.00014, see Fig. 7A). These 478
differences in auditory speech entrainment cannot be explained by differences in attention as 479
participants attended the flickering cross in control-video-only approximately as much as 480
speaker’s eyes and mouth in video-only (81.0 ± 20.9% vs. 87.5 ± 17.1%; t26 = 1.30, p = 0.20: 481
fixation data derived from eye-tracking recordings). This demonstrates that auditory cortical 482
entrainment to unheard speech is specific to seeing the speaker’s face. 483
Below 1-Hz entrainment to absent speech does not result from a direct feeding of lip 484
movements to auditory cortices 485
Although driven by lip-read information, auditory cortical activity at ~0.5 Hz in 486
visual-only entrained more to unheard speech than to seen lip movements. Indeed, speech 487
entrainment was stronger than lip entrainment at the left auditory source coordinates 488
identified in audio-only (t27 = 2.52, p = 0.018, see Fig. 7A). The same trend was observed at 489
the right auditory source (t27 = 1.98, p = 0.058, see Fig. 7A). However, at 0.5 Hz, lip 490
movements entrained brain activity in the right angular gyrus (Fig. 7C and Table 1), a visual 491
integration hub implicated in biological motion perception (Allison et al., 2000; Puce and 492
Perrett, 2003). Such entrainment entailed a visual-speech-to-brain delay of 40 ± 127 ms. Note 493

22
that the dominant source of lip and speech entrainment were ~4 cm apart (F3,998 = 4.68, p = 494
0.0030). Still, despite being distinct, their relative proximity might be the reason why speech 495
entrainment was only marginally higher than lip entrainment in the right auditory cortex. 496
Indeed, due to issues inherent to reconstructing brain signals based on extracranial signals 497
(known as source leakage), lip entrainment estimated at the auditory cortex was artificially 498
enhanced by the source in the angular gyrus. This leads us to conclude that entrainment in 499
bilateral auditory cortices occurred with unheard speech rather than with seen lip movements. 500
As further support for this claim, speech entrainment was still significant bilaterally in 501
auditory cortices after partialling out lip movements (mouth opening and width; see Fig. 7D). 502
In the right hemisphere, it peaked 2.2 mm away from sources observed without partialling out 503
lip movements. In the left hemisphere, the peak in the partial coherence map was displaced 504
towards the middle temporal gyrus (MNI coordinates: [–64 –21 –9]). Although it did not 505
peak in the left auditory cortex, the source distribution of the partial coherence was clearly 506
pulled towards that brain region. 507
Below 1-Hz entrainment to absent speech is not explained by modulation of auditory 508
activity by edges in the visual stimulus 509
Speech entrainment did not differ significantly from entrainment to the global visual 510
change signal at the coordinates of bilateral auditory sources identified in audio-only (left, t27 511
= 1.17, p = 0.25; right, t27 = 1.10, p = 0.28, see Fig. 7A). However, entrainment to the global 512
visual change signal at ~0.5 Hz was significant only in the posterior part of the right superior 513
temporal gyrus (MNI coordinates: [62 –32 21]), with a visual-change-to-brain delay of 149 ± 514
33 ms (See Fig. 7E). Most importantly, speech entrainment corrected for the global visual 515
change signal still peaked and was significant in three left hemisphere sources that were less 516
than 2.5 mm away from those of uncorrected speech entrainment (see Fig. 7F). Corrected 517
speech entrainment in the right hemisphere peaked 1 mm away from the right auditory source 518

23
of uncorrected speech entrainment and was only marginally significant (p = 0.085). In sum, 519
global changes in the visual stimulus modulated oscillatory brain activity at ~0.5 Hz in the 520
right posterior superior temporal gyrus, but such modulation did not mediate the entrainment 521
to absent speech. 522
Altogether, our results support the view that auditory speech envelope is synthesized 523
through lip-reading. 524
Entrainment to absent speech at other frequencies 525
At 1–3 Hz, there was significant entrainment to the absent speech in visual-only but 526
not in control-visual-only (see Table 1). Significant entrainment to absent speech in visual-527
only peaked in the posterior part of the left inferior temporal gyrus, and in the central part of 528
the middle temporal gyrus (see Table 1). 529
Entrainment in the posterior part of the left inferior temporal gyrus was specific to 530
seeing the speaker’s face (comparison visual-only vs. control-visual-only: t27 = 2.72, p = 531
0.011) but did not entail a synthesis process since speech entrainment at this location was not 532
significantly different from lip entrainment (t27 = 1.30, p = 0.20). It did not reach significance 533
after partialling out mouth movements (see Table 1). 534
Entrainment in the central part of the middle temporal gyrus was not specific to seeing 535
the speaker’s face (comparison visual-only vs. control-visual-only: t27 = 1.48, p = 0.15) and 536
did not entail a synthesis process since speech entrainment at this location was not 537
significantly different from lip entrainment (t27 = –0.10, p = 0.92) despite surviving 538
partialling out of mouth movements. 539
At 2–5 Hz, there was no significant entrainment to the absent speech in visual-only 540
nor in control-visual-only. 541

24
At 4–8 Hz, there was significant entrainment to the absent speech in video-only and 542
control-video-only, but only in occipital areas, and it vanished after partialling out the 543
contribution of lip movements. 544
Entrainment to lip movements 545
Lip entrainment at 1–3 Hz, 2–5 Hz, and 4–8 Hz trivially occured in occipital cortices 546
in video-only and control-video-only (Table 1). Figure 8 illustrates entrainment at 2–5 Hz 547
which we had planned to focus on based on previous reports (Park et al., 2016; Giordano et 548
al., 2017). Brain responses associated with lip entrainment at 2–5 Hz peaked with a delay of 549
115 ± 8 ms (first source) and 159 ± 8 ms (second source). 550
Our data do not suggest the presence of entrainment to unseen lip movements in 551
visual cortices in audio-only. Indeed, in that condition, significant lip entrainment at 0.5 Hz 552
occurred only in auditory cortices, and disappeared when we partialled out entrainment to the 553
auditory speech envelope. No significant lip entrainment in this condition was found at any of 554
the other tested frequency ranges: 1–3 Hz, 2–5 Hz and 4–8 Hz. 555
Delays between auditory and visual speech 556
Time-efficient synthesis of the auditory speech envelope might rely on the visual-to-557
auditory lag inherent to natural speech. Indeed, in our audio-visual stimuli, the ~0.5-Hz 558
auditory speech envelope peaked 87 ± 9 ms after the ~0.5-Hz mouth-opening time-course 559
(see Fig. 9 left). But our results indicate that in visual-only, visual activity entrains to 2–5-Hz 560
mouth movements while auditory activity entrains to an ~0.5-Hz absent auditory speech 561
envelope. The simplest way to connect these oscillations is through phase–amplitude 562
coupling, whereby the amplitude of 2–5-Hz visual activity modulates the phase of ~0.5-Hz 563
auditory activity. Accordingly, we also estimated the delay from the envelope of 2–5-Hz 564
25
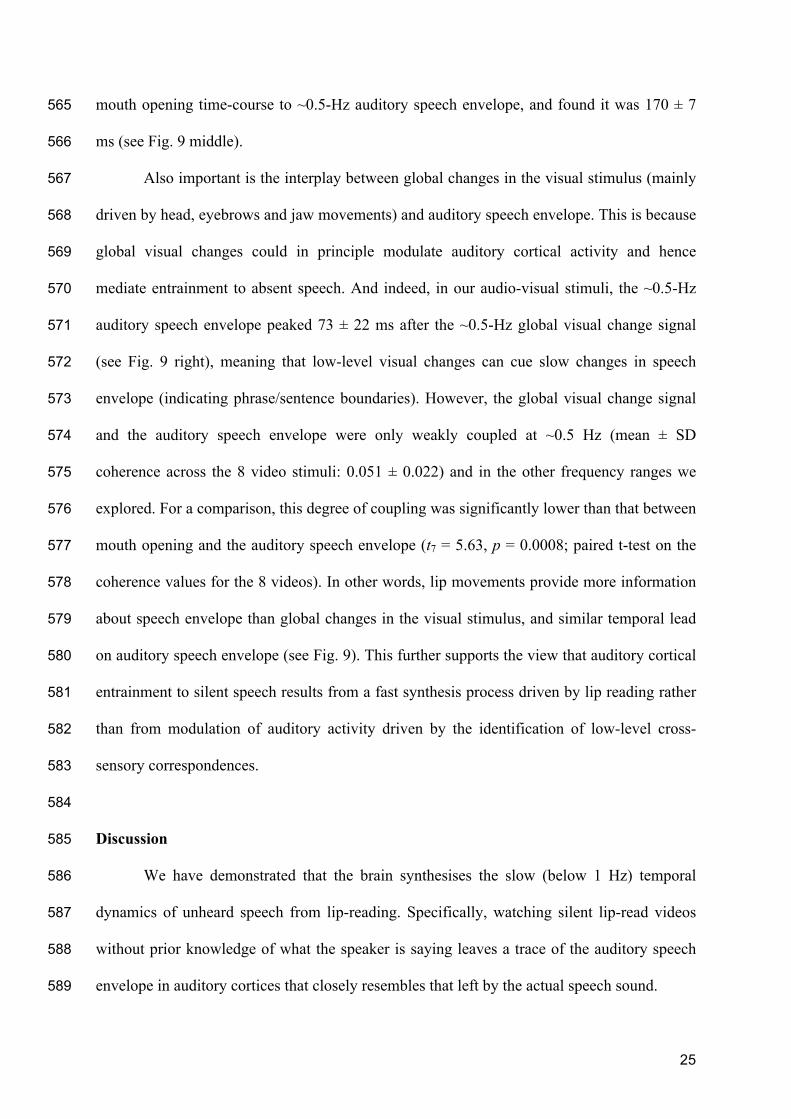
mouth opening time-course to ~0.5-Hz auditory speech envelope, and found it was 170 ± 7 565
ms (see Fig. 9 middle). 566
Also important is the interplay between global changes in the visual stimulus (mainly 567
driven by head, eyebrows and jaw movements) and auditory speech envelope. This is because 568
global visual changes could in principle modulate auditory cortical activity and hence 569
mediate entrainment to absent speech. And indeed, in our audio-visual stimuli, the ~0.5-Hz 570
auditory speech envelope peaked 73 ± 22 ms after the ~0.5-Hz global visual change signal 571
(see Fig. 9 right), meaning that low-level visual changes can cue slow changes in speech 572
envelope (indicating phrase/sentence boundaries). However, the global visual change signal 573
and the auditory speech envelope were only weakly coupled at ~0.5 Hz (mean ± SD 574
coherence across the 8 video stimuli: 0.051 ± 0.022) and in the other frequency ranges we 575
explored. For a comparison, this degree of coupling was significantly lower than that between 576
mouth opening and the auditory speech envelope (t7 = 5.63, p = 0.0008; paired t-test on the 577
coherence values for the 8 videos). In other words, lip movements provide more information 578
about speech envelope than global changes in the visual stimulus, and similar temporal lead 579
on auditory speech envelope (see Fig. 9). This further supports the view that auditory cortical 580
entrainment to silent speech results from a fast synthesis process driven by lip reading rather 581
than from modulation of auditory activity driven by the identification of low-level cross-582
sensory correspondences. 583
584
Discussion 585
We have demonstrated that the brain synthesises the slow (below 1 Hz) temporal 586
dynamics of unheard speech from lip-reading. Specifically, watching silent lip-read videos 587
without prior knowledge of what the speaker is saying leaves a trace of the auditory speech 588
envelope in auditory cortices that closely resembles that left by the actual speech sound. 589

26
590
Entrainment to unheard speech in auditory cortices 591
Our most striking finding was that lip-reading induced entrainment in auditory 592
cortices to the absent auditory speech at frequencies below 1 Hz. This entrainment 1) was 593
specific to lip-reading, 2) was not a consequence of the general temporal characteristics of 594
auditory speech, 3) was not a mere byproduct of entrainment to lip movements, and 4) was 595
not mediated by low-level changes in the visual stimulus (at least in the left hemisphere). 596
Instead, this genuine entrainment is similar to the entrainment induced by actual auditory 597
speech: both are rooted in bilateral auditory cortices and are characterized by similar time-598
courses, though with an additional delay of ~200 ms in the right hemisphere. This suggests 599
the existence of a time-efficient synthesis mechanism that maps facial articulatory mouth 600
gestures onto corresponding speech sound features. Such a mechanism would likely leverage 601
the natural visual–to–auditory speech delay (90–170 ms) and could be explained by visually-602
driven predictive coding (Friston and Kiebel, 2009). Likewise, auditory-driven predictive 603
coding could account for the short (below-50-ms) latencies observed here in audio-only (Park 604
et al., 2015). 605
Importantly, such auditory entrainment is unlikely to be driven by auditory imagery. 606
Auditory imagery reflects perceptual auditory processing not triggered by external auditory 607
stimulation (Nanay, 2018). In principle, observation of lip movements could lead to auditory 608
imagery of related or unrelated speech or non-speech sounds. Clearly, auditory imagery of 609
the actual speech sounds was never an option since participants were not professional lip-610
readers and were not cued about speech content. Furthermore, our results demonstrate that 611
the auditory entrainment we observed cannot be linked to auditory imagery of unrelated 612
sounds either since it was stronger for the corresponding but absent sound than for either seen 613

27
lip movements or unrelated speech. Accordingly, the fast synthesis hypothesis we have 614
suggested seems to be the most likely interpretation of the observed entrainment. 615
The synthesis mechanism we have uncovered is likely grounded in the fact that lip-616
read information is coupled to the auditory signal in space and time (Munhall and Vatikiotis-617
Bateson, 2004; Chandrasekaran et al., 2009). In addition, the phonetic identity of each 618
phoneme is supported by sound as well by the configuration of the lips. Even young infants 619
are sensitive to this type of correspondence (Kuhl and Meltzoff, 1982), and phonetic 620
integration continues to develop into adulthood, where the first traces of speech-specific 621
phonetic integration are observed within ~250 ms after sound onset (Stekelenburg and 622
Vroomen, 2012; Baart et al., 2014). Presumably, the tight audiovisual coupling in speech lies 623
at the foundation of lip-read-induced entrainment to absent auditory speech in the brain, and 624
there is indeed much evidence for entrainment to auditory speech at phrase and syllable rates 625
(Luo and Poeppel, 2007; Bourguignon et al., 2012; Gross et al., 2013; Peelle et al., 2013; 626
Molinaro et al., 2016; Vander Ghinst et al., 2016; Meyer et al., 2017; Meyer and Gumbert, 627
2018). 628
Frequencies below 1 Hz match with phrasal, stress and sentential rhythmicity. 629
Accordingly, corresponding entrainment to heard speech sounds has been hypothesised to 630
subserve parsing or chunking of phrases and sentences (Ding et al., 2016; Meyer et al., 2017), 631
or to help align neural excitability with syntactic information to optimize language 632
comprehension (Meyer and Gumbert, 2018). Hence, our data suggest that such 633
entrainment/alignment can be obtained through lip-reading, thereby facilitating speech 634
chunking, parsing, and extraction of syntactic information. 635
As 4–8 Hz frequencies match with syllable rate, corresponding entrainment has been 636
hypothesised to reflect parsing or chunking of syllables. Supporting this view, 4–8-Hz 637
entrainment is enhanced when listening to intelligible speech compared to non-intelligible 638
28
speech (Ahissar et al., 2001; Luo and Poeppel, 2007; Peelle et al., 2013). However, we did 639
not observe such entrainment during silent lip-reading, which may suggest that the brain does 640
not synthesise the detailed phonology of unfamiliar silent syllabic structures based on lip-read 641
information only. After all, lip-reading is a very difficult task, even for professional lip-642
readers (Chung et al., 2017). This is because different phonemes correspond to very similar 643
lip configurations (e.g., /ba/, /pa/ and /ma/). However, when the auditory signal is known, this 644
ambiguity in the mapping between lip-reading and the corresponding phonemes disappears. 645
Indeed, it has been suggested that lip-reading can induce entrainment in auditory cortices at 646
frequencies above 1 Hz when participants are aware of the content of the visual-only speech 647
stimuli (Crosse et al., 2015). 648
649
Entrainment to lip movements 650
During silent lip-reading, activity in early visual cortices entrained to lip movements 651
mainly at frequencies above 1 Hz, in line with previous studies (Park et al., 2016; Giordano et 652
al., 2017). Such occipital lip entrainment was reported to be modulated by audio-visual 653
congruence (Park et al., 2016). This is probably the first necessary step for the brain to 654
synthesize features of the absent auditory speech. Our results suggest that corresponding 655
signals are forwarded to the right angular gyrus (Hauswald et al., 2018). 656
The right angular gyrus was the dominant source of lip entrainment at frequencies 657
below 1 Hz. It is the convergence area for the dorsal and ventral visual streams and is 658
specialised for processing visual biological motion (Perrett et al., 1989; Allison et al., 2000; 659
Puce and Perrett, 2003; Marty et al., 2015). The right angular gyrus—or more precisely an 660
area close to it termed the temporal visual speech area (Bernstein et al., 2011; Bernstein and 661
Liebenthal, 2014)—activates during lip-reading (Calvert et al., 1997; Allison et al., 2000; 662
Campbell et al., 2001) and observation of mouth movements (Puce et al., 1998). It has also 663

29
been suggested that it maps visual input onto linguistic representation during reading 664
(Démonet et al., 1992), and lipreading (Hauswald et al., 2018). Our results shed light on the 665
oscillatory dynamics underpinning such mapping during lip-reading: based on visual input at 666
dominant lip movement frequencies (above 1 Hz), the angular gyrus presumably extracts 667
features of lip movements below 1 Hz, which can then serve as an intermediate step to 668
synthesise speech sound features. Given the short lip-to-brain delay observed in this brain 669
area (~40 ms), such extraction might rely on the prediction of mouth movements. 670
671
Entrainment to unheard speech in visual cortices 672
Previous studies that have examined the brain dynamics underlying lipreading of 673
silent connected visual speech have essentially focused on visuo-phonological mapping in 674
occipital cortices (O’Sullivan et al., 2016; Lazard and Giraud, 2017; Hauswald et al., 2018). 675
For example, it was shown that occipital 0.3–15-Hz EEG signals are better predicted by a 676
combination of motion changes, visual speech features and the unheard auditory speech 677
envelope than by motion changes alone (O’Sullivan et al., 2016). Also, visual activity has 678
been reported to entrain more to absent speech at 4–7 Hz when a video is played forward 679
rather than backward (Hauswald et al., 2018). Importantly, this effect was not driven by 680
entrainment to lip movements since lip entrainment was similar for videos played forwards 681
and backwards. Instead, it came with increased top-down drive from left sensorimotor 682
cortices to visual cortices, indicating that visuo-phonological mapping had already taken 683
place in early visual cortices through top-down mechanisms (O’Sullivan et al., 2016; 684
Hauswald et al., 2018). Our study complements these results by showing that auditory 685
cortices also entrain to unheard speech, but at frequencies below 1 Hz, probably based on 686
earlier processes taking place in the occipital regions and the right angular gyrus. 687
688

30
Limitations and future perspectives 689
We did not collect behavioral data from our participants. Further studies should 690
clarify how the synthesis mechanism we have uncovered relates to individual lip-reading 691
abilities, or susceptibility to the McGurk effect. 692
It also remains to be clarified what features of speech are synthesised, and under 693
which circumstances auditory cortices can entrain to absent speech at higher frequencies 694
(especially 4–8-Hz). 695
Finally, it will be important to specify which features of the articulatory mouth 696
gestures lead to below-1-Hz auditory entrainment to absent speech. This would require visual 697
control conditions in which, for example, lip movements are shown in isolation, or replaced 698
by point-light stimuli. 699
700
Conclusion 701
Our results demonstrate that the brain can quickly synthesize a representation of 702
coarse-grained auditory speech features in early auditory cortices and shed light on the 703
underlying oscillatory dynamics. Seeing lip movements first modulates neuronal activity in 704
early visual cortices at frequencies that match articulatory lip movements (above 1 Hz). 705
Based on this activity, the right angular gyrus, putatively the temporal visual speech area, 706
extracts and possibly predicts the slower features of lip movements. Finally, these slower lip 707
movement dynamics are mapped onto their corresponding speech sound features and this 708
information is fed to auditory cortices. Receiving this information likely facilitates speech 709
parsing, in line with the hypothesised role of entrainment to heard speech at frequencies 710
below 1 Hz. 711
31
References 712
Ahissar E, Nagarajan S, Ahissar M, Protopapas A, Mahncke H, Merzenich MM (2001) 713
Speech comprehension is correlated with temporal response patterns recorded from 714
auditory cortex. Proc Natl Acad Sci U S A 98:13367–13372. 715
Allison T, Puce A, McCarthy G (2000) Social perception from visual cues: role of the STS 716
region. Trends in Cognitive Sciences 4:267–278 . 717
Ashburner J, Friston KJ (1999) Nonlinear spatial normalization using basis functions. Hum 718
Brain Mapp 7:254–266. 719
Ashburner J, Neelin P, Collins DL, Evans A, Friston K (1997) Incorporating prior knowledge 720
into image registration. Neuroimage 6:344–352. 721
Baart M, Stekelenburg JJ, Vroomen J (2014) Electrophysiological evidence for speech-722
specific audiovisual integration. Neuropsychologia 53:115–121. 723
Bernstein LE, Auer ET, Moore JK, Ponton CW, Don M, Singh M (2002) Visual speech 724
perception without primary auditory cortex activation. Neuroreport 13:311–315. 725
Bernstein LE, Jiang J, Pantazis D, Lu Z-L, Joshi A (2011) Visual phonetic processing 726
localized using speech and nonspeech face gestures in video and point-light displays. 727
Human Brain Mapping 32:1660–1676. 728
Bernstein LE, Liebenthal E (2014) Neural pathways for visual speech perception. Front 729
Neurosci 1:386. 730
Bortel R, Sovka P (2014) Approximation of the null distribution of the multiple coherence 731
estimated with segment overlapping. Signal Processing 96:310–314. 732
Bourguignon M, De Tiège X, Op de Beeck M, Ligot N, Paquier P, Van Bogaert P, Goldman 733
S, Hari R, Jousmäki V (2012) The pace of prosodic phrasing couples the listener’s 734
cortex to the reader's voice. Hum Brain Mapp 34:314–326. 735
Bourguignon M, Molinaro N, Wens V (2017a) Contrasting functional imaging parametric 736

32
maps: The mislocation problem and alternative solutions. Neuroimage 169:200–211. 737
Bourguignon M, Piitulainen H, De Tiège X, Jousmäki V, Hari R (2015) Corticokinematic 738
coherence mainly reflects movement-induced proprioceptive feedback. Neuroimage 739
106:382–390. 740
Bourguignon M, Piitulainen H, Smeds E, Zhou G, Jousmäki V, Hari R (2017b) MEG Insight 741
into the Spectral Dynamics Underlying Steady Isometric Muscle Contraction. J 742
Neurosci 37:10421–10437. 743
Calvert GA, Bullmore ET, Brammer MJ, Campbell R, Williams SC, McGuire PK, Woodruff 744
PW, Iversen SD, David AS (1997) Activation of auditory cortex during silent 745
lipreading. Science 276:593–596. 746
Campbell R, MacSweeney M, Surguladze S, Calvert G, McGuire P, Suckling J, Brammer 747
MJ, David AS (2001) Cortical substrates for the perception of face actions: an fMRI 748
study of the specificity of activation for seen speech and for meaningless lower-face 749
acts (gurning). Brain Res Cogn Brain Res 12:233–243. 750
Chandrasekaran C, Trubanova A, Stillittano S, Caplier A, Ghazanfar AA (2009) The natural 751
statistics of audiovisual speech. PLoS Comput Biol 5:e1000436. 752
Chung JS, Senior A, Vinyals O, Zisserman A (2017) Lip Reading Sentences in the Wild. In: 753
2017 IEEE Conference on Computer Vision and Pattern Recognition (CVPR). 754
Collins JJ, Fanciulli M, Hohlfeld RG, Finch DC, Sandri G v. H, Shtatland ES (1992) A 755
random number generator based on the logit transform of the logistic variable. 756
Computers in Physics 6:630. 757
Crosse MJ, Di Liberto GM, Bednar A, Lalor EC (2016) The Multivariate Temporal Response 758
Function (mTRF) Toolbox: A MATLAB Toolbox for Relating Neural Signals to 759
Continuous Stimuli. Front Hum Neurosci 10:604. 760
Crosse MJ, ElShafei HA, Foxe JJ, Lalor EC (2015) Investigating the temporal dynamics of 761

33
auditory cortical activation to silent lipreading. In: 2015 7th International IEEE/EMBS 762
Conference on Neural Engineering (NER). 763
Démonet JF, Chollet F, Ramsay S, Cardebat D, Nespoulous JL, Wise R, Rascol A, 764
Frackowiak R (1992) The anatomy of phonological and semantic processing in normal 765
subjects. Brain 115:1753–1768. 766
Ding N, Melloni L, Zhang H, Tian X, Poeppel D (2016) Cortical tracking of hierarchical 767
linguistic structures in connected speech. Nat Neurosci 19:158–164. 768
Efron B, Tibshirani RJ (1993) An Introduction to the Bootstrap. 769
Eveno N, Caplier A, Coulon P-Y (2004) Accurate and Quasi-Automatic Lip Tracking. IEEE 770
Trans Circuits Syst Video Technol 14:706–715. 771
Friston K, Kiebel S (2009) Predictive coding under the free-energy principle. Philos Trans R 772
Soc Lond B Biol Sci 364:1211–1221. 773
Giordano BL, Ince RAA, Gross J, Schyns PG, Panzeri S, Kayser C (2017) Contributions of 774
local speech encoding and functional connectivity to audio-visual speech perception. 775
Elife 6:e24763. 776
Gramfort A, Luessi M, Larson E, Engemann DA, Strohmeier D, Brodbeck C, Parkkonen L, 777
Hämäläinen MS (2014) MNE software for processing MEG and EEG data. 778
Neuroimage 86:446–460. 779
Gross J, Hoogenboom N, Thut G, Schyns P, Panzeri S, Belin P, Garrod S (2013) Speech 780
rhythms and multiplexed oscillatory sensory coding in the human brain. PLoS Biol 781
11:e1001752. 782
Halliday D (1995) A framework for the analysis of mixed time series/point process data—783
Theory and application to the study of physiological tremor, single motor unit 784
discharges and electromyograms. Prog Biophys Mol Biol 64:237–278. 785
Hauswald A, Lithari C, Collignon O, Leonardelli E, Weisz N (2018) A Visual Cortical 786

34
Network for Deriving Phonological Information from Intelligible Lip Movements. Curr 787
Biol 28:1453–1459.e3. 788
Hillebrand A, Barnes GR (2005) Beamformer Analysis of MEG Data. International Review 789
of Neurobiology 68:149–171. 790
Hyvärinen A, Karhunen J, Oja E (2004) Independent Component Analysis. John Wiley & 791
Sons. 792
Kaplan E, Jesse A (2019) Fixating the eyes of a speaker provides sufficient visual 793
information to modulate early auditory processing. Biol Psychol 146:107724. 794
Kapnoula EC, Packard S, Gupta P, McMurray B (2015) Immediate lexical integration of 795
novel word forms. Cognition 134:85–99. 796
Keitel A, Gross J, Kayser C (2018) Perceptually relevant speech tracking in auditory and 797
motor cortex reflects distinct linguistic features. PLoS Biol 16:e2004473. 798
Kendall MG, Stuart A (1968) The Advanced Theory of Statistics. The Statistician 18:163. 799
Kuhl PK, Meltzoff AN (1982) The bimodal perception of speech in infancy. Science 800
218:1138–1141. 801
Lalor EC, Foxe JJ (2010) Neural responses to uninterrupted natural speech can be extracted 802
with precise temporal resolution. Eur J Neurosci 31:189–193. 803
Lazard DS, Giraud A-L (2017) Faster phonological processing and right occipito-temporal 804
coupling in deaf adults signal poor cochlear implant outcome. Nat Commun 8:14872. 805
Luo H, Poeppel D (2007) Phase patterns of neuronal responses reliably discriminate speech 806
in human auditory cortex. Neuron 54:1001–1010. 807
Marty B, Bourguignon M, Jousmäki V, Wens V, Op de Beeck M, Van Bogaert P, Goldman 808
S, Hari R, De Tiège X (2015) Cortical kinematic processing of executed and observed 809
goal-directed hand actions. Neuroimage 119:221–228. 810
McMurray B, Tanenhaus MK, Aslin RN (2002) Gradient effects of within-category phonetic 811

35
variation on lexical access. Cognition 86:B33–42. 812
Meyer L, Gumbert M (2018) Synchronization of Electrophysiological Responses with 813
Speech Benefits Syntactic Information Processing. J Cogn Neurosci:1–10. 814
Meyer L, Henry MJ, Gaston P, Schmuck N, Friederici AD (2017) Linguistic Bias Modulates 815
Interpretation of Speech via Neural Delta-Band Oscillations. Cereb Cortex 27:4293–816
4302. 817
Molinaro N, Lizarazu M, Lallier M, Bourguignon M, Carreiras M (2016) Out-of-synchrony 818
speech entrainment in developmental dyslexia. Hum Brain Mapp 37:2767–2783. 819
Munhall KG, Jones JA, Callan DE, Kuratate T, Vatikiotis-Bateson E (2004) Visual prosody 820
and speech intelligibility: head movement improves auditory speech perception. 821
Psychol Sci 15:133–137. 822
Munhall KG, Vatikiotis-Bateson E (2004) Spatial and Temporal Constraints on Audiovisual 823
Speech Perception. In: The handbook of multisensory processes (Calvert GA, Spence 824
C, Stein BE, eds), pp 177–188. Cambridge, MA, US: MIT Press. 825
Nanay B (2018) Multimodal mental imagery. Cortex 105:125–134. 826
Nichols TE, Holmes AP (2002) Nonparametric permutation tests for functional 827
neuroimaging: a primer with examples. Hum Brain Mapp 15:1–25. 828
O’Sullivan AE, Crosse MJ, Di Liberto GM, Lalor EC (2016) Visual Cortical Entrainment to 829
Motion and Categorical Speech Features during Silent Lipreading. Front Hum Neurosci 830
10:679. 831
Paré M, Richler RC, ten Hove M, Munhall KG (2003) Gaze behavior in audiovisual speech 832
perception: the influence of ocular fixations on the McGurk effect. Percept Psychophys 833
65:553–567. 834
Park H, Ince RAA, Schyns PG, Thut G, Gross J (2015) Frontal top-down signals increase 835
coupling of auditory low-frequency oscillations to continuous speech in human 836

36
listeners. Curr Biol 25:1649–1653. 837
Park H, Kayser C, Thut G, Gross J (2016) Lip movements entrain the observers’ low-838
frequency brain oscillations to facilitate speech intelligibility. Elife 5:e14521. 839
Paulesu E, Perani D, Blasi V, Silani G, Borghese NA, De Giovanni U, Sensolo S, Fazio F 840
(2003) A functional-anatomical model for lipreading. J Neurophysiol 90:2005–2013. 841
Peelle JE, Gross J, Davis MH (2013) Phase-locked responses to speech in human auditory 842
cortex are enhanced during comprehension. Cereb Cortex 23:1378–1387. 843
Pekkola J, Ojanen V, Autti T, Jääskeläinen IP, Möttönen R, Tarkiainen A, Sams M (2005) 844
Primary auditory cortex activation by visual speech: an fMRI study at 3 T. Neuroreport 845
16:125–128. 846
Perrett DI, Harries MH, Bevan R, Thomas S, Benson PJ, Mistlin AJ, Chitty AJ, Hietanen JK, 847
Ortega JE (1989) Frameworks of analysis for the neural representation of animate 848
objects and actions. J Exp Biol 146:87–113. 849
Puce A, Allison T, Bentin S, Gore JC, McCarthy G (1998) Temporal cortex activation in 850
humans viewing eye and mouth movements. J Neurosci 18:2188–2199. 851
Puce A, Perrett D (2003) Electrophysiology and brain imaging of biological motion. Philos 852
Trans R Soc Lond B Biol Sci 358:435–445. 853
Reuter M, Schmansky NJ, Rosas HD, Fischl B (2012) Within-subject template estimation for 854
unbiased longitudinal image analysis. Neuroimage 61:1402–1418. 855
Schroeder CE, Lakatos P, Kajikawa Y, Partan S, Puce A (2008) Neuronal oscillations and 856
visual amplification of speech. Trends Cogn Sci 12:106–113. 857
Stekelenburg JJ, Vroomen J (2012) Electrophysiological evidence for a multisensory speech-858
specific mode of perception. Neuropsychologia 50:1425–1431. 859
Sumby WH, Pollack I (1954) Visual Contribution to Speech Intelligibility in Noise. J Acoust 860
Soc Am 26:212–215. 861

37
Taulu S, Simola J (2006) Spatiotemporal signal space separation method for rejecting nearby 862
interference in MEG measurements. Phys Med Biol 51:1759–1768. 863
Taulu S, Simola J, Kajola M (2005) Applications of the signal space separation method. 864
IEEE Trans Signal Process 53:3359–3372. 865
Vander Ghinst M, Bourguignon M, Niesen M, Wens V, Hassid S, Choufani G, Jousmäki V, 866
Hari R, Goldman S, De Tiège X (2019) Cortical Tracking of Speech-in-Noise Develops 867
from Childhood to Adulthood. J Neurosci 39:2938–2950. 868
Vander Ghinst M, Ghinst MV, Bourguignon M, Op de Beeck M, Wens V, Marty B, Hassid 869
S, Choufani G, Jousmäki V, Hari R, Van Bogaert P, Goldman S, De Tiège X (2016) 870
Left Superior Temporal Gyrus Is Coupled to Attended Speech in a Cocktail-Party 871
Auditory Scene. J Neurosci 36:1596–1606. 872
Van Veen BD, van Drongelen W, Yuchtman M, Suzuki A (1997) Localization of brain 873
electrical activity via linearly constrained minimum variance spatial filtering. IEEE 874
Trans Biomed Eng 44:867–880. 875
Vatikiotis-Bateson E, Eigsti I-M, Yano S, Munhall KG (1998) Eye movement of perceivers 876
during audiovisualspeech perception. Perception & Psychophysics 60:926–940. 877
Vigário R, Särelä J, Jousmäki V, Hämäläinen M, Oja E (2000) Independent component 878
approach to the analysis of EEG and MEG recordings. IEEE Trans Biomed Eng 879
47:589–593. 880
Zion Golumbic EM, Ding N, Bickel S, Lakatos P, Schevon CA, McKhann GM, Goodman 881
RR, Emerson R, Mehta AD, Simon JZ, Poeppel D, Schroeder CE (2013) Mechanisms 882
underlying selective neuronal tracking of attended speech at a “cocktail party.” Neuron 883
77:980–991. 884
Figures and Tables: 885
886
38
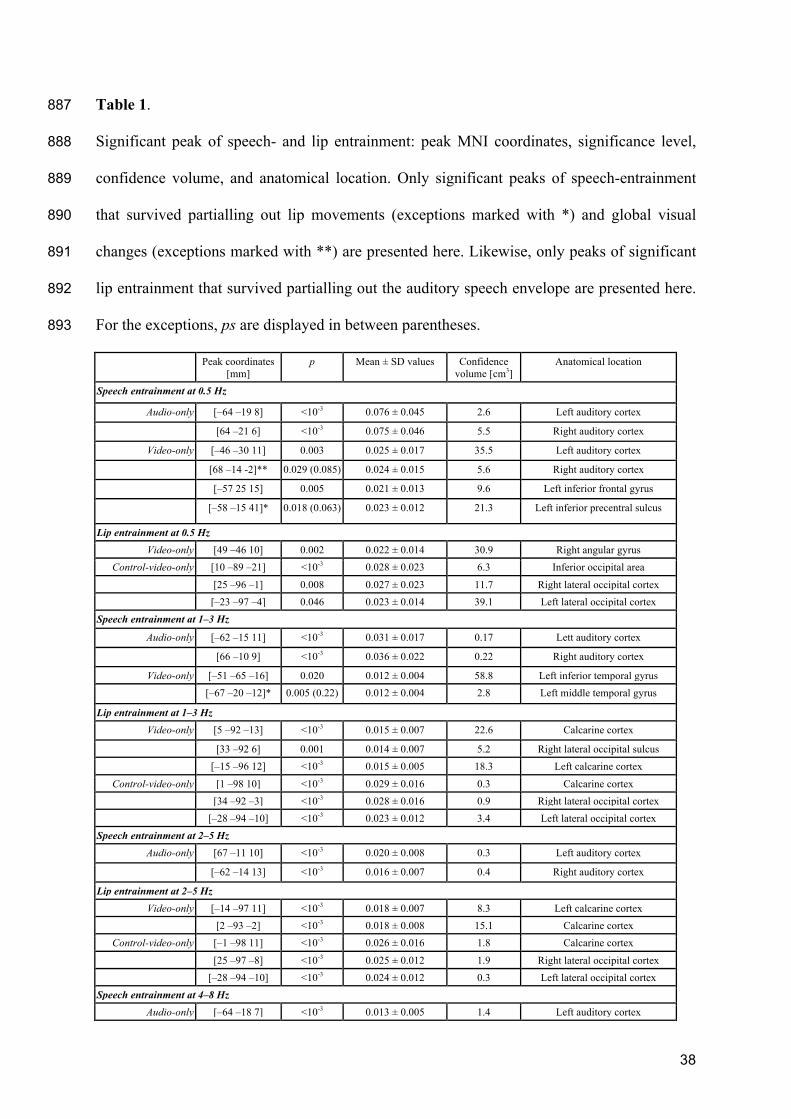
Table 1. 887
Significant peak of speech- and lip entrainment: peak MNI coordinates, significance level, 888
confidence volume, and anatomical location. Only significant peaks of speech-entrainment 889
that survived partialling out lip movements (exceptions marked with *) and global visual 890
changes (exceptions marked with **) are presented here. Likewise, only peaks of significant 891
lip entrainment that survived partialling out the auditory speech envelope are presented here. 892
For the exceptions, ps are displayed in between parentheses. 893
Peak coordinates [mm]
p Mean ± SD values Confidence volume [cm3]
Anatomical location
Speech entrainment at 0.5 Hz
Audio-only [–64 –19 8] <10-3 0.076 ± 0.045 2.6 Left auditory cortex
[64 –21 6] <10-3 0.075 ± 0.046 5.5 Right auditory cortex
Video-only [–46 –30 11] 0.003 0.025 ± 0.017 35.5 Left auditory cortex
[68 –14 -2]** 0.029 (0.085) 0.024 ± 0.015 5.6 Right auditory cortex
[–57 25 15] 0.005 0.021 ± 0.013 9.6 Left inferior frontal gyrus
[–58 –15 41]* 0.018 (0.063) 0.023 ± 0.012 21.3 Left inferior precentral sulcus
Lip entrainment at 0.5 Hz Video-only [49 –46 10] 0.002 0.022 ± 0.014 30.9 Right angular gyrus
Control-video-only [10 –89 –21] <10-3 0.028 ± 0.023 6.3 Inferior occipital area
[25 –96 –1] 0.008 0.027 ± 0.023 11.7 Right lateral occipital cortex [–23 –97 –4] 0.046 0.023 ± 0.014 39.1 Left lateral occipital cortex Speech entrainment at 1–3 Hz
Audio-only [–62 –15 11] <10-3 0.031 ± 0.017 0.17 Lett auditory cortex
[66 –10 9] <10-3 0.036 ± 0.022 0.22 Right auditory cortex
Video-only [–51 –65 –16] 0.020 0.012 ± 0.004 58.8 Left inferior temporal gyrus [–67 –20 –12]* 0.005 (0.22) 0.012 ± 0.004 2.8 Left middle temporal gyrus
Lip entrainment at 1–3 Hz Video-only [5 –92 –13] <10-3 0.015 ± 0.007 22.6 Calcarine cortex
[33 –92 6] 0.001 0.014 ± 0.007 5.2 Right lateral occipital sulcus [–15 –96 12] <10-3 0.015 ± 0.005 18.3 Left calcarine cortex
Control-video-only [1 –98 10] <10-3 0.029 ± 0.016 0.3 Calcarine cortex [34 –92 –3] <10-3 0.028 ± 0.016 0.9 Right lateral occipital cortex [–28 –94 –10] <10-3 0.023 ± 0.012 3.4 Left lateral occipital cortex Speech entrainment at 2–5 Hz
Audio-only [67 –11 10] <10-3 0.020 ± 0.008 0.3 Left auditory cortex
[–62 –14 13] <10-3 0.016 ± 0.007 0.4 Right auditory cortex
Lip entrainment at 2–5 Hz Video-only [–14 –97 11] <10-3 0.018 ± 0.007 8.3 Left calcarine cortex
[2 –93 –2] <10-3 0.018 ± 0.008 15.1 Calcarine cortex Control-video-only [–1 –98 11] <10-3 0.026 ± 0.016 1.8 Calcarine cortex
[25 –97 –8] <10-3 0.025 ± 0.012 1.9 Right lateral occipital cortex [–28 –94 –10] <10-3 0.024 ± 0.012 0.3 Left lateral occipital cortex
Speech entrainment at 4–8 Hz Audio-only [–64 –18 7] <10-3 0.013 ± 0.005 1.4 Left auditory cortex
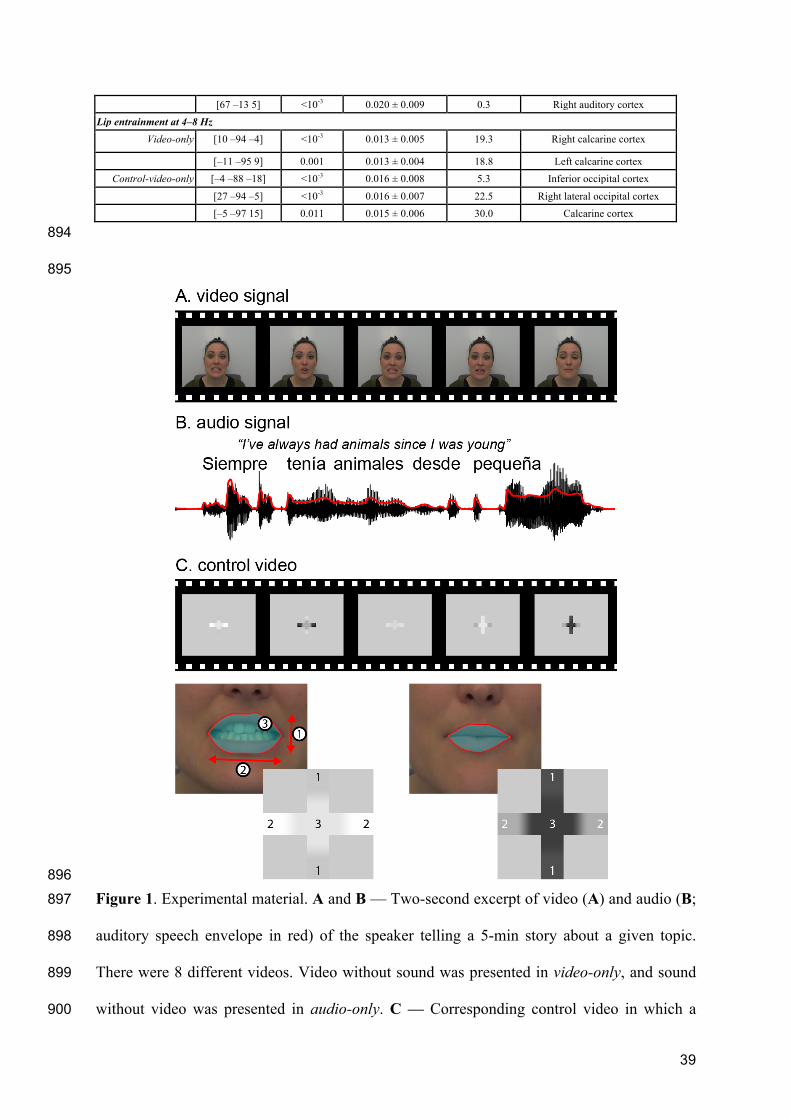
39
[67 –13 5] <10-3 0.020 ± 0.009 0.3 Right auditory cortex Lip entrainment at 4–8 Hz
Video-only [10 –94 –4] <10-3 0.013 ± 0.005 19.3 Right calcarine cortex
[–11 –95 9] 0.001 0.013 ± 0.004 18.8 Left calcarine cortex Control-video-only [–4 –88 –18] <10-3 0.016 ± 0.008 5.3 Inferior occipital cortex
[27 –94 –5] <10-3 0.016 ± 0.007 22.5 Right lateral occipital cortex [–5 –97 15] 0.011 0.015 ± 0.006 30.0 Calcarine cortex
894
895
896
Figure 1. Experimental material. A and B — Two-second excerpt of video (A) and audio (B; 897
auditory speech envelope in red) of the speaker telling a 5-min story about a given topic. 898
There were 8 different videos. Video without sound was presented in video-only, and sound 899
without video was presented in audio-only. C — Corresponding control video in which a 900

40
flickering Greek cross encoded speaker’s mouth configuration. Based on a segmentation of 901
mouth contours, the cross encoded mouth opening (1), mouth width (2), and mouth surface 902
(3). The resulting video was presented in control-video-only. 903
904
905
Figure 2. Relation between audio and visual speech signals. A — Frequency-dependent 906
coupling (coherence) of mouth opening with auditory speech envelope (i), mouth surface (ii), 907
and mouth width (iii). Coupling is quantified with coherence. There is one gray trace per 908
video (8 in total), and thick black traces are the average across them all. B — Delay between 909
visual and audio speech assessed with cross-correlation of auditory speech envelope with 910
mouth opening (i) and mouth width (ii). 911
912
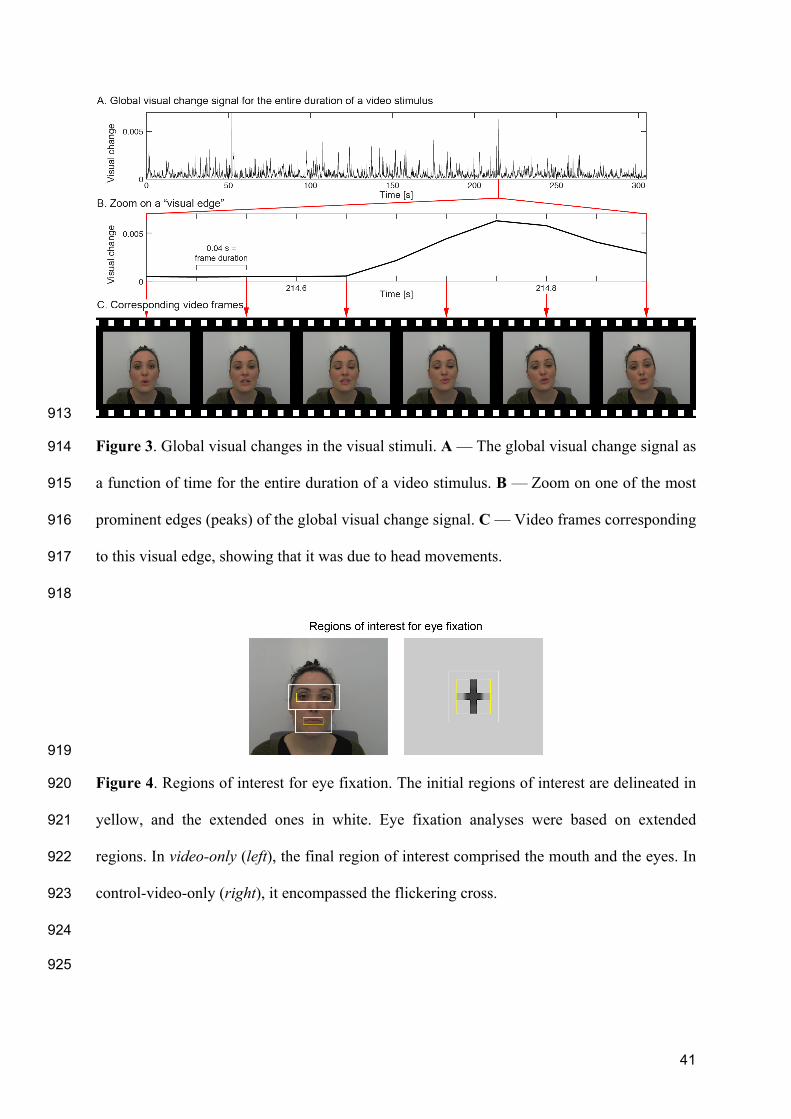
41
913
Figure 3. Global visual changes in the visual stimuli. A — The global visual change signal as 914
a function of time for the entire duration of a video stimulus. B — Zoom on one of the most 915
prominent edges (peaks) of the global visual change signal. C — Video frames corresponding 916
to this visual edge, showing that it was due to head movements. 917
918
919
Figure 4. Regions of interest for eye fixation. The initial regions of interest are delineated in 920
yellow, and the extended ones in white. Eye fixation analyses were based on extended 921
regions. In video-only (left), the final region of interest comprised the mouth and the eyes. In 922
control-video-only (right), it encompassed the flickering cross. 923
924
925

42
926
Figure 5. Speech entrainment at 0.5 Hz. A — Speech entrainment in audio-only. (i–iii) 927
Sensor distribution of speech entrainment at 0.5 Hz quantified with coherence (ii) and its 928
spectral distribution at a selection of 10 sensors in the left (i) and right hemisphere (iii) of 929
maximal 0.5 Hz coherence (highlighted in magenta). Gray traces represent individual 930
subject’s spectra at the sensor of maximum 0.5 Hz coherence within the preselection, and the 931
thick black trace is their group average. (iv–vii) Brain distribution of significant speech 932
entrainment quantified with coherence in the left (v) and right hemispheres (vi) and the 933
temporal response function (TRF) associated with auditory speech envelope at coordinates of 934
peak coherence (marked with white discs) in the left (iv) and right hemispheres (vii). In brain 935
images, significant coherence values at MNI coordinates |X| > 40 mm were projected 936
orthogonally onto the parasagittal slice of coordinates |X| = 60 mm. B — Same as in A for 937
video-only, illustrating that seeing speaker’s face was enough to elicit significant speech 938
entrainment at auditory cortices. Note that coherence spectra were estimated at the subject-939
specific sensor selected based on coherence in audio-only. 940
941

43
942
Figure 6. Speech entrainment quantified with coherence in audio-only at 1–3 Hz (A), 2–5 Hz 943
(B) and 4–8 Hz (C). (i–iii) Sensor distribution of speech entrainment (ii) and its spectral 944
distribution at a selection of 10 left- (i) and right-hemisphere (iii) sensors of maximum 945
coherence (highlighted in magenta). Gray traces represent individual subject’s spectra at the 946
sensor of maximum coherence across the considered frequency range and within the 947
preselection, and the thick black trace is their group average. (iv & v) Brain distribution of 948
significant speech entrainment in the left (iv) and right hemispheres (v) produced as 949
described in Fig. 5. 950
951

44
952
Figure 7. Control for the entrainment to absent speech at 0.5 Hz. A — Entrainment values 953
quantified with coherence at coordinates identified in audio-only (mean ± SD across 954
participants). B — Sensor and brain distribution of auditory speech entrainment in control-955
video-only wherein speech entrainment was not significant. C — Sensor and brain 956
distribution of lip entrainment in video-only and associated temporal evolution. Lip 957
entrainment was significant only in the right angular gyrus. D — Brain distribution of 958
significant speech entrainment at 0.5 Hz after partialling out lip movements (mouth opening 959
and mouth width). E & F — As in C & D but for the global visual change signal instead of 960
mouth opening. Brain images were produced as described in Fig. 5. 961
962

45
963
Figure 8. Lip entrainment at 2–5 Hz in audio-only (A), video-only (B) and control-video-only 964
(C). Lip entrainment is presented both in the sensor space and on the brain in all conditions 965
(audio-only, video-only, control-video-only). In brain maps, significant coherence values at 966
MNI coordinates Y < –70 mm were projected orthogonally onto the coronal slice of 967
coordinates |Y| = 90 mm. Locations of peak coherence are marked with white discs. Note that 968
coherence was not significant in audio-only. Additional parasagittal maps are presented for 969
all significant peaks of coherence. In these maps, the orthogonal projection was performed 970
for significant coherence values at Y coordinates less than 5 mm away from the selected slice 971
Y coordinate. The figure also presents a spectral distribution of coherence at a selection of 10 972
sensors of maximum 2–5 Hz coherence (highlighted in magenta) in video-only and control-973
video-only. Gray traces represent individual subject’s spectra at the sensor of maximum 2–5 974
Hz coherence within the preselection, and the thick black trace is their group average. 975
Finally, temporal response functions (TRF) to mouth opening are presented for the two 976
significant sources of peak entrainment to mouth opening in video-only. 977

46
978
979
980
Figure 9. Visual-to-auditory-speech delays at ~0.5-Hz. Temporal response function of 981
auditory speech envelope filtered through 0.2–1.5 Hz associated with the time course of 982
mouth opening (left), 2–5-Hz envelope of mouth opening (middle), and global visual changes 983
in video stimuli. There is one gray trace per video (8 in total), and thick red traces are the 984
average across them all. 985
986