abstract form, meaning and context in lexical...
TRANSCRIPT

ABSTRACT
Title of dissertation: FORM, MEANING AND CONTEXTIN LEXICAL ACCESS:MEG AND BEHAVIORAL EVIDENCE
Diogo Almeida, Doctor of Philosophy, 2009
Dissertation directed by: Professor David PoeppelDepartment of Linguistics
One of the main challenges in the study of cognition is how to connect brain
activity to cognitive processes. In the domain of language, this requires coordination
between two different lines of research: theoretical models of linguistic knowledge
and language processing on the one side and brain sciences on the other. The work
reported in this dissertation attempts to link these two lines of research by focusing
on one particular aspect of linguistic processing, namely lexical access.
The rationale for this focus is that access to the lexicon is a mandatory step
in any theory of linguistic computation, and therefore findings about lexical access
procedures have consequences for language processing models in general.
Moreover, in the domain of brain electrophysiology, past research on event-
related brain potentials (ERPs) - electrophysiological responses taken to reflect
processing of certain specific kinds of stimuli or specific cognitive processes - has
uncovered different ERPs that have been connected to linguistic stimuli and pro-
cesses. One particular ERP, peaking at around 400 ms post-stimulus onset (N400)

has been linked to lexico-semantic processing, but its precise functional interpre-
tation remains controversial: The N400 has been proposed to reflect lexical access
procedures as well as higher order semantic/pragmatic processing.
In a series of three MEG experiments, we show that access to the lexicon
from print occurs much earlier than previously thought, at around 200 ms, but
more research is needed before the same conclusion can be reached about lexical
access based on auditory or sign language input. The cognitive activity indexed
by the N400 and its MEG analogue is argued to constitute predictive processing
that integrates information from linguistic and non-linguistic sources at a later,
post-lexical stage.

FORM, MEANING AND CONTEXT IN LEXICAL ACCESS:MEG AND BEHAVIORAL EVIDENCE
by
Diogo Almeida
Dissertation submitted to the Faculty of the Graduate School of theUniversity of Maryland, College Park in partial fulfillment
of the requirements for the degree ofDoctor of Philosophy
2009
Advisory Committee:Professor David Poeppel, ChairProfessor Norbert HornsteinProfessor Colin PhillipsProfessor Rochelle NewmanProfessor Donald J. Bolger

© Copyright byDiogo Almeida
2009

Dedication
Em memoria do Manu, com todo o carinho e muitas saudades.
ii

Acknowledgments
This dissertation would not have been possible without the direct support and
help of many, many people. I would like to thank all my teachers, colleagues, friends
and family in the three different continents in which I went to school, for making
my graduate school years possible, enjoyable and meaningful. I am particularly
indebted to:
• David Poeppel, my advisor, for his unwavering support during all my years in
graduate school, for not letting me quit, for having enough confidence in me
for both of us, for sharing the exciting opportunity that is to be able to do
research and for being the kind of scientist I aspire to become one day.
• Norbert Hornstein, who always helped and supported me in so many differ-
ent ways, for always giving me great feedback and making time for me, for
participating on my committee and for having the nicest dog ever.
• Colin Phillips, whose insight and deep knowledge about all things linguistic
and psycholinguistic are a real inspiration, for giving me great feedback and
advice throughout my graduate school years, and for participating on my
committee.
• Rochelle Newman, for agreeing to be on my committee and for giving me very
interesting and detailed comments on my work, and for all her assistance in
the recording of my auditory stimuli.
iii

• DJ Bolger, for agreeing to be on my committee, and for giving me very inter-
esting and important feedback.
• Bill Idsardi, who, despite not being able to be on my committee, had a crucial,
pivotal role in this dissertation by offering me extensive feedback, advice and
encouragement over the years, for his generosity with his time and insight.
• Letıcia Sicuro Correa, my first advisor, for getting me interested in psycholin-
guistic research and showing me the way to pursue my then newly developed
interest, and for being such a great role model and scientist.
• Emmanuel Dupoux and Sharon Peperkamp, my MA advisors, who were always
supportive of me, and who gave me so much of their time and shared so much
of their passion for research with me.
• The faculty of the Department of Linguistics at the University of Maryland,
College Park for creating the best possible environment for an aspiring scien-
tist, and for making research fun and interesting.
• Jeff Walker, the best MEG technician one could hope for, for his friendship
and support, and for making research not only a possible experience, but also
a sane one.
• All my colleagues, current and former, and friends in Rio, Paris, Maryland
and elsewhere in the US, for being there for me and making the whole gradu-
ate school experience memorable, for all the collaborations and conversations
within and outside of school about work, science and life, during so many
iv

lunches, dinners, parties, road trips, conferences, concerts and video-game
nights. You are too many to thank individually in a way that would make
justice to my appreciation and the importance you have in my life, but you
know who you are!
• My parents and family, who have supported and encouraged me, specialement
maman, qui, avec son coeur geant, n’a jamais cesse de m’appuyer dans mes
decisions.
• Ellen Lau, for making an honest man out of my brother, becoming my little
sister, and being such a great friend and collaborator over the years.
• Meu irmao, por ser quem e, por todo o apoio e amizade tanto nos momentos
felizes quanto nas horas mais difıceis.
v

Table of Contents
List of Tables viii
List of Figures x
1 Introduction 11.1 Why care about the lexicon and access to lexical information? . . . . 31.2 Confronting lexical processing mythology: A critical review . . . . . . 6
1.2.1 Frequency effects in the visual processing of words . . . . . . . 71.2.1.1 Lexical frequency . . . . . . . . . . . . . . . . . . . . 71.2.1.2 Sublexical frequency . . . . . . . . . . . . . . . . . . 141.2.1.3 Subjective familiarity . . . . . . . . . . . . . . . . . . 201.2.1.4 Morpheme frequency . . . . . . . . . . . . . . . . . . 23
1.2.2 Frequency effects in the auditory processing of words . . . . . 261.2.2.1 Lexical frequency . . . . . . . . . . . . . . . . . . . . 261.2.2.2 Sublexical frequency . . . . . . . . . . . . . . . . . . 281.2.2.3 Subjective familiarity . . . . . . . . . . . . . . . . . . 571.2.2.4 Morpheme frequency . . . . . . . . . . . . . . . . . . 59
1.2.3 Orthographic similarity effects in the visual processing of words 591.2.4 Phonological similarity effects in the auditory processing of
words . . . . . . . . . . . . . . . . . . . . . . . . . . . . . . . 761.2.4.1 Similarity effects across tasks in English . . . . . . . 821.2.4.2 Cross–linguistic comparison of similarity effects across
tasks . . . . . . . . . . . . . . . . . . . . . . . . . . . 851.2.5 Phonological similarity effects in the visual processing of words 90
1.3 Outline of Thesis . . . . . . . . . . . . . . . . . . . . . . . . . . . . . 95
2 The role of frequency and similarity across modalities: Experiment 1 982.1 Introduction . . . . . . . . . . . . . . . . . . . . . . . . . . . . . . . . 982.2 Neural Correlates of Word Recognition . . . . . . . . . . . . . . . . . 101
2.2.1 The functional interpretation of the N400 . . . . . . . . . . . . 1032.2.2 Using MEG to investigate early aspects of lexical access . . . . 107
2.3 Neighborhood Density and Phonotactic Probability influences in WordRecognition . . . . . . . . . . . . . . . . . . . . . . . . . . . . . . . . 109
2.4 Modality of presentation and the effects of Neighborhood Density andPhonotactic Probability . . . . . . . . . . . . . . . . . . . . . . . . . 1202.4.1 Methods . . . . . . . . . . . . . . . . . . . . . . . . . . . . . . 1222.4.2 Results . . . . . . . . . . . . . . . . . . . . . . . . . . . . . . . 137
2.4.2.1 Behavioral . . . . . . . . . . . . . . . . . . . . . . . . 1372.4.2.2 MEG: M350 . . . . . . . . . . . . . . . . . . . . . . . 139
2.4.3 Discussion . . . . . . . . . . . . . . . . . . . . . . . . . . . . . 1422.5 General Discussion and Future Directions . . . . . . . . . . . . . . . . 147
vi

3 Memory representations in word recognition: Experiment 2 1503.1 Introduction . . . . . . . . . . . . . . . . . . . . . . . . . . . . . . . . 150
3.1.1 Methods . . . . . . . . . . . . . . . . . . . . . . . . . . . . . . 1553.1.2 Results . . . . . . . . . . . . . . . . . . . . . . . . . . . . . . . 158
3.1.2.1 Behavioral . . . . . . . . . . . . . . . . . . . . . . . . 1583.1.2.2 MEG: Hemisphere Analysis . . . . . . . . . . . . . . 1633.1.2.3 MEG: Quadrant Analysis . . . . . . . . . . . . . . . 1673.1.2.4 MEG: Sextant Analysis . . . . . . . . . . . . . . . . 172
3.1.3 General Discussion and conclusions . . . . . . . . . . . . . . . 177
4 Memory representations in word recognition: Experiment 3 1864.1 Introduction . . . . . . . . . . . . . . . . . . . . . . . . . . . . . . . . 186
4.1.1 Methods . . . . . . . . . . . . . . . . . . . . . . . . . . . . . . 1884.1.2 Results . . . . . . . . . . . . . . . . . . . . . . . . . . . . . . . 193
4.1.2.1 Behavioral Results . . . . . . . . . . . . . . . . . . . 1934.1.2.2 MEG Data – Deaf Group . . . . . . . . . . . . . . . 2034.1.2.3 MEG Data – Hearing Group . . . . . . . . . . . . . 212
4.1.3 General Discussion . . . . . . . . . . . . . . . . . . . . . . . . 2184.2 Summary and conclusion . . . . . . . . . . . . . . . . . . . . . . . . . 220
5 Concluding remarks 225
References 229
vii

List of Tables
1.1 Phonotactic probabilty in speech perception: Summary of Evidence . 47
1.2 Summary of empirical investigations of the effects of OrthographicNeighborhood structure (From Andrews (1997)). . . . . . . . . . . . . 65
1.3 Summary of empirical investigations of the effects of OrthographicNeighborhood structure since Andrews (1997). . . . . . . . . . . . . . 68
1.4 Summary of empirical investigations of the effects of PhonologicalNeighborhood (PN) structure on speech perception. . . . . . . . . . . 83
1.5 Phonotactic Probabilty vs Neighborhood Density: Summary of em-pirical investigations of the effects of Phonotactic Probability on speechperception. . . . . . . . . . . . . . . . . . . . . . . . . . . . . . . . . . 86
1.6 Summary of empirical investigations of the effects of PhonologicalNeighborhood structure on visual word recognition. . . . . . . . . . . 94
2.1 Materials: Phonotactic Probability for Words. . . . . . . . . . . . . . 128
2.2 Materials: Phonotactic Probability for Nonwords. . . . . . . . . . . . 129
2.3 Materials: Neighborhood Densities. . . . . . . . . . . . . . . . . . . . 131
2.4 Materials: Mean Uniqueness Points. . . . . . . . . . . . . . . . . . . . 133
2.5 Mean reaction time latencies for each experimental section. . . . . . . 137
2.6 Visual section M350 peak analysis. . . . . . . . . . . . . . . . . . . . 141
2.7 Auditory section M350 peak analysis. . . . . . . . . . . . . . . . . . . 142
4.1 Deaf group results: 150–250ms. . . . . . . . . . . . . . . . . . . . . . 206
4.2 Deaf group results: 300–500ms. . . . . . . . . . . . . . . . . . . . . . 208
4.3 Deaf group results: 600–800ms. . . . . . . . . . . . . . . . . . . . . . 210
4.4 Deaf group results: 800–1000ms. . . . . . . . . . . . . . . . . . . . . . 211
4.5 Hearing group results: 150–250ms. . . . . . . . . . . . . . . . . . . . 214
4.6 Hearing group results: 300–500ms. . . . . . . . . . . . . . . . . . . . 215
viii

4.7 Hearing group results: 600–800ms. . . . . . . . . . . . . . . . . . . . 217
4.8 Hearing group results: 800–1000ms. . . . . . . . . . . . . . . . . . . . 218
ix

List of Figures
2.1 Materials: Mean lexical frequency of High/Dense and Low/Sparsewords. . . . . . . . . . . . . . . . . . . . . . . . . . . . . . . . . . . . 125
2.2 Materials: Orthographic Mean Uniqueness Point for each experimen-tal condition. . . . . . . . . . . . . . . . . . . . . . . . . . . . . . . . 133
2.3 Mean reaction times (in ms) for each modality of presentation. . . . . 138
2.4 Visual section mean M350 latencies and mean RT. . . . . . . . . . . . 140
2.5 Auditory section mean M350 latencies and mean RT. . . . . . . . . . 141
3.1 Mean Repetition Effect. . . . . . . . . . . . . . . . . . . . . . . . . . 159
3.2 RT over the course of the experiment for individual subjects. . . . . . 160
3.3 Different partitions of the sensor space. . . . . . . . . . . . . . . . . . 163
3.4 MEG results: Hemispheric Analysis. . . . . . . . . . . . . . . . . . . 164
3.5 MEG results: Quadrant Analysis for Word condition. . . . . . . . . . 169
3.6 MEG results: Quadrant Analysis for Pseudoword condition. . . . . . 170
3.7 MEG results: Sextant Analysis for Word condition. . . . . . . . . . . 172
3.8 MEG results: Sextant Analysis for Pseudoword condition. . . . . . . 174
4.1 Discrimination between Signs and Pseudosigns . . . . . . . . . . . . . 194
4.2 Mean RT for the deaf and hearing groups. . . . . . . . . . . . . . . . 196
4.3 Planned Comparisons: Repetition effect for signs and pseudosigns. . . 199
4.4 RT over the course of the experiment for individual subjects. . . . . . 201
4.5 MEG results: Quadrant Analysis for Word condition: Deaf group. . . 204
4.6 MEG results: Quadrant Analysis for Pseudoword condition: Deafgroup. . . . . . . . . . . . . . . . . . . . . . . . . . . . . . . . . . . . 204
4.7 MEG results: Quadrant Analysis for Word condition: Hearing group. 213
x

4.8 MEG results: Quadrant Analysis for Pseudoword condition: Hearinggroup. . . . . . . . . . . . . . . . . . . . . . . . . . . . . . . . . . . . 213
xi

Chapter 1
Introduction
Amongst all cognitive domains, language is perhaps the most uniquely tied to
the human experience. Language supports our system of thought and not only helps
structure it, it also allows us to communicate our individual mental life in far greater
detail to our con–specifics than any other known animal communication system.
Language also supports other seemingly unique human traits, such as culture and
its transmission through time and space. It is unsurprising, therefore, that the study
of human language has occupied a privileged position within the cognitive sciences.
The very fact that language seems to be a cognitive domain unique to humans
creates challenges that set its study apart from the study of other areas of human
cognition. Whereas vision and audition, for instance, have benefitted greatly from
animal models, the study of human language has only very marginally benefitted
from the wealth of data that can be gathered by studying analogous systems in other
species, no doubt to a large extent due to the fact that no true analogous system
exists in the animal kingdom (Hauser, Chomsky, & Fitch, 2002; Fitch, Hauser,
& Chomsky, 2005). Despite the particular and peculiar nature of the the study of
human language within the realm of human cognition, much progress has been made
in the last half century, and detailed and articulate models of linguistic knowledge
and linguistic behavior have been advanced.
1

Until recently, the empirical bases underlying models of language was formed
mostly by observation and investigations of linguistic behavior, using either infor-
mal or semi–formal acceptability judgments or more structured mental chronometry
paradigms. However, recent advances in non–invasive brain imaging techniques have
expanded the set of tools available to the study of human language. These techno-
logical advances provide the basis on which a meaningful connection between the
study of the brain and the study of the mind could thrive. It is trivially true that by
allowing direct monitoring of brain activity during linguistic tasks, brain imaging
increases the amount of dependent measures available to the language researcher
to test hypothesis about linguistic representations and computations. What is less
obvious, but nonetheless promising, is the fact that brain imaging gives us a prin-
cipled way of tying the very detailed and articulate mental models of language to
its biological underpinnings. Linguistic models provide a candidate set of linguistic
representations and computations that operate upon them, and therefore, if taken
seriously, could be used to guide neuroscientists in understanding how the brain per-
forms different kinds of computations. In other words, to the extent that existing
language models provide us with an accurate list of representations and computa-
tions that the brain ought to be able to perform, these models can help neuroscien-
tists study what properties of the brain make it able to support said representations
and computations (Poeppel & Embick, 2005; Marantz, 2005).
Despite all the advances made in the field of language studies, however, there
are still several disputes about what kind of models best account for linguistic knowl-
edge and behavior. The disputes generally center on questions regarding the degree
2

of specificity of linguistic representations and the kind of linguistic computations
that are necessary to account for empirical data, but it is generally agreed by most
frameworks that whatever language may be, it involves some sort of lexicon. The
lexicon is a repository of information relevant for linguistic processes, involving at
the very least information about the perceptual code used for storage and recogni-
tion, motor code for pronunciation (or signing, in the case of sign languages), and
information about meaning units.
This dissertation reports on a series of behavioral and brain imaging studies
that investigates different aspects of lexical processing, focusing on the procedures
involved in retrieving linguistic information from different kinds of input signals
(visual vs auditory), but also how, once retrieved, lexical information is used in
language comprehension.
The following sections will elaborate on the rationale for focusing on the lex-
icon and lexical access, as well as provide a review of the current behavioral and
electrophysiological literature on word recognition, with a critical assessment of its
virtues and current shortcomings. Finally, an overview of the following chapters will
be sketched.
1.1 Why care about the lexicon and access to lexical information?
There are a number of reasons why studying lexical access routines and lexical
organization is theoretically important:
1. The lexicon is a theoretical necessity, and this fact affords a certain degree
3

of theoretical neutrality to the study of lexical access. Therefore, findings
about lexical organization and access routines will necessarily impact most or
even all theories of language. Since great controversies exist in the field of
language inquiry about the very nature of the object of study, it is perhaps in
the interest of the language researcher to try to explore in more detail areas
which most frameworks agree are relevant.
2. Access to the lexicon is arguably a processing bottleneck. Language processing
is a highly complex cognitive task involving many subroutines, with interac-
tions between them still poorly understood. Lexical access provides a bot-
tleneck between perceptual processes and linguistic computations, and could
be used as a principled way of getting insight in both areas, by providing a
clear endpoint for perceptual processes and a clear starting point for language–
specific computations.
3. Because access to the lexicon is a clear end point for perceptual processes of
input identification, lexical access routines can be used as a model for the
study of perceptual processes at large (see Balota, Yap, & Cortese, 2006), and
help shed light into the neurocognitive underpinnings of said routines.
4. Because access to the lexicon involves both access to short term and long
term memory representations, lexical access can be used as a model for the
neurocognitive study of memory.
5. A big divide within the field of linguistics involves the status of memory rep-
4

resentations in theories of linguistic knowledge. Some theories claim there
are clear boundaries between lexical items and the combinatorial rules that
operate on them (e.g. Chomsky, 1957, 1981, 1995). Other frameworks, how-
ever, propose either a continuum between words and combinatorial rules or
a complete elimination of the latter, by proposing that sentential frames are
represented in a manner akin to words (Langacker, 1987; Kay & Fillmore,
1999; Goldberg, 1995, 2003, 2006). Therefore, understanding lexical access
routines might help shed light on this theoretical issue, by serving as the basis
on which empirical predictions derived from both kinds of models could be
tested.
6. In the field of psycholinguistics, some theoretical proposals have hypothesized
that the dynamics of information retrieval from working memory might form
the basis of sentence parsing (e.g. Lewis & Vasishth, 2005; Lewis, Vasishth,
& Dyke, 2006). Certain paradigms used in lexical acess, like priming, might
tap into similar kinds of information retrieval mechanisms, and therefore help
shed light not only on lexical retrieval but on sentence processing as well.
Besides the theoretical reasons to study lexical access, there are reasons of a
more practical nature, due to the pervasive and ubiquitous use of written language
in the study of linguistic processing:
• Literacy is an integral part of modern societies. Given the central role read-
ing has in our culture, it is in our interest to understand its neuro–cognitive
underpinnings, for this might have implications for teaching methods for both
5

children and adults, as well as therapies to remedy its loss after brain lesions.
• A large portion of language research uses written linguistic stimuli, which as-
sumes a somewhat large degree of exchangeability between written and spoken
language at the relevant level of analysis. In other words, there is a strong but
reasonable assumption in the field that although written and spoken language
might engage different perceptual routines, they tap ultimately into the same
kind of higher–level linguistic entities. The systematic study of written and
spoken word recognition might help shed light into the question of what are
the real similarities and differences between spoken and written language.
1.2 Confronting lexical processing mythology: A critical review
Lexical access has been mostly studied as an instance of perceptual processes.
Therefore, a great deal of attention has been dedicated to tasks of discrimination. A
very influential paradigm has been the lexical decision task (LDT), where a visual
or auditory stimulus is presented to an experimental subject, who has to decide as
fast and accurately as possible whether or not the stimulus is a word. A number of
stimulus properties that seem to influence the speed and accuracy that experimental
subjects exhibit in this kind of task has been uncovered. What follows is a review of
a few of these properties that have been shown to exert influence in lexical processing
tasks and have been hypothesized to bear on lexical processing routines.
6

1.2.1 Frequency effects in the visual processing of words
1.2.1.1 Lexical frequency
One of the first properties of lexical items that has been shown to exert in-
fluence in lexical processing tasks is the frequency of occurrence of the item in the
language, as determined by counts in language corpora (Howes & Solomon, 1951;
Solomon & Howes, 1951; Postman & Schneider, 1951; Postman & Conger, 1954).
Overall, higher frequency of occurrence in the language is related to lower per-
ceptual identification thresholds and more accurate identification performance and
faster lexical decisions that are also less error prone.
Most models of word recognition (Morton, 1969; Forster, 1976; Becker, 1976;
Rumelhart & McClelland, 1981; Paap, Newsome, McDonald, & Schvaneveldt, 1982;
Seidenberg & McClelland, 1989; Plaut, 1997) have interpreted the word frequency
effect as informative of access routines. In these models, the availability of long term
memory representations is modulated by their frequency in the language, although
the details of each particular model differ. For instance, in the classic logogen model
of Morton (1969), the recognition threshold of each individual word is decreased ev-
ery time that word is accessed, whereas in activation–interaction models (Rumelhart
& McClelland, 1981; Monsell, Doyle, & Haggard, 1989), the resting activation level
of word units is thought to be somewhat directly determined by the frequency of use
of each particular word. In distributed–representation models (Plaut, 1997), it is
the strength of the connection between input and output units that is modulated by
frequency. Therefore, the word frequency effect is seen as a case of learning, or prac-
7

tice, in this kind of model. In search–based theories (Forster, 1976, 1992; Becker,
1979), on the other hand, frequency of occurrence is one of the basis on which the
lexicon is organized, and the search procedures are sensitive to this aspect of lexical
organization.
All these models are able to accommodate the effect of word frequency in lex-
ical identification tasks. However, given the difference in the mechanisms that are
proposed to underlie the effect (learning versus frequency–ranked search), these
models make different predictions regarding other related phenomena. For in-
stance, the relationship between reaction time latencies and the frequencies of words
has been described to be logarithmic since the effect was first reported (Howes &
Solomon, 1951; Whaley, 1978). As Murray and Forster (2004) remark, however, this
logarithmic relationship does not follow in any principled way from the architectural
properties of models that propose that frequency effects are due to learning, although
they can certainly accommodate the logarithmic relationship by stipulation. The bin
model of serial–search (Forster, 1976, 1992; Murray & Forster, 2004), on the other
hand, makes the direct prediction that the relationship between word frequency and
reaction time latency should approximate a logarithmic function. According to this
model, lexical access is a two–stage process. The lexicon itself is divided into bins,
which are subsets of words with similar orthographic characteristics. When an input
stimulus is encountered, a hash–code function maps the input to a particular bin.
Within each bin, candidate words are ranked from top to bottom based on their
frequency. A lexical search then proceeds in a linear fashion from the top ranked
entry. The frequency effect is then just the time it takes for a serial search within a
8

bin to find the correct entry. Since the search space is ranked by frequency, frequent
words will be recognized faster than low frequency words. In this model, RT is di-
rectly tied to the rank of the word within each bin, not with the absolute frequency
of the word in the language, and therefore explains why large increments of raw
frequency do not seem to have much of an effect in higher frequency ranges but
have substantial effects in lower frequency ranges (the approximately logarithmic
shape of the association between word frequency and RT latencies). As Murray and
Forster (2004) correctly point out, the bin model gives a principled explanation for
the shape of the relationship between RT and word frequency. In a series of exper-
iments and simulations, Murray and Forster (2004) showed that rank of frequency
was a slightly better overall predictor of lexical decision performance than the log
transformation, both in terms of RT and Error Rate, and both in aggregate and
individual subject’s data. Given how well rank of word frequency predicts perfor-
mance in the lexical decision task, and given how the use of this predictor follows
directly from the architectural properties of the search model, Murray and Forster
(2004) argue that this lends strong support for their model.
However, the central assumption that all these models make, namely that the
word frequency effect is indicative of facilitation at the level of lexical access, is not
without its critics. Balota and Chumbley (1984, 1990), for instance, have argued that
word frequency effects seem to be modulated to a large extent by the behavioral
task presented to the experimental subjects. Thus, frequency effects are standardly
reported for lexical decision, but are attenuated for word naming (Frederiksen &
Kroll, 1976; Scarborough, Cortese, & Scarborough, 1977; Balota & Chumbley, 1984,
9

1985, 1990; Gaygen & Luce, 1998; Balota, Cortese, Sergent-Marshall, Spieler, & Yap,
2004), and frequently null for semantic category verification or old/new judgement
task (Scarborough et al., 1977; Balota & Chumbley, 1984, 1990). Assuming that
lexical identification/activation is an automatic process, and therefore is involved in
all these tasks, it is somewhat surprising to find that not all tasks show the effect
of frequency. If lexical identification is indeed modulated by lexical frequency, this
pattern of results is unexpected. In order to explain this pattern of results, Balota
and Chumbley (1984, 1990) hypothesized that word frequency might influence post–
identification routines, which, if true, creates a problem in the interpretation of
reaction time results from lexical decision tasks as a clear index of lexical access.
According to this view, the word frequency effect elicited in lexical decision tasks is
not necessarily explained by facilitation of access but rather as a strategic effect in
performing different experimental tasks. Balota and Chumbley (1984, 1990) argue
that the task of deciding whether an input string is a word or not is basically a two–
way discrimination task, and while it is true that faster access to lexical information
could in principle translate into faster discrimination between words and nonwords,
it is by no means the only kind of information that subjects have available to them
in order to complete the task. Balota and Chumbley (1984, 1990) propose that
subjective familiarity with a word is also a dimension available to experimental
participants that could be recruited by them in order to help discriminate words from
nonwords. Familiarity is highly correlated with word frequency, and therefore higher
frequency words are more familiar than both less frequent words and nonwords.
Assuming that the information about subjective familiarity is indeed exploited in
10

the discrimination task, then a strategy of “fast guess” based on familiarity alone
would guarantee a fast response to higher frequency words. However, since low
frequency words and nonwords are both stimuli of low familiarity, the “fast guess”
strategy would not work as well for them, and the final decision would have to rely
on checking or double–checking lexical information. Therefore, less frequent words
and nonwords will elicit higher reaction times in their categorization due to the
increased difficulty in their discriminability from each other, not necessarily because
they are harder to access. Balota and Chumbley (1990, p. 232) offer an interesting
analogy:
“A researcher hypothesizes that lexical identification is faster for words
printed in red than for words printed in purple. To test this hypothesis,
red and purple words along with blue nonwords are presented in a lexical
decision task. The results support the hypothesis; that is, the words
printed in red produce faster response latencies than do the words printed
in purple. Therefore, the researcher argues that red word’s are identified
more quickly than purple words. The obvious interpretive problem here
is that the purple words are more difficult to discriminate from the blue
nonwords than are the red words. Thus the obtained pattern does not
necessarily indicate that color is influencing lexical identification, but
rather it indicates that color is a dimension available to subjects and
that this dimension is correlated with the discrimination between words
and nonwords.”
11

This alternative explanation provides an account for the word frequency effect
in lexical decision tasks that does not involve facilitation in access as the underlying
mechanism. However, nothing in this account constitutes an argument against the
idea that word frequency does influence lexical identification. Nonetheless, there are
good reasons to think that, regardless of whether or not word frequency influences
lexical access, it does influence post-access routines. Balota and Chumbley (1984)
reported a delayed naming experiment in which subjects had to wait 1400ms for a
cue before they had to pronounce the words that were visually presented to them.
This time–interval is long enough to have allowed subjects to have identified the
stimuli. Therefore, if word frequency plays a role in lexical identification, and if
identification was already carried out by the time subjects were required to initiate
their response, one would have predicted that no effects of frequency would have been
found under the delayed naming conditions. Contrary to this prediction, Balota and
Chumbley (1984, 1985) did report a frequency effect in this experiment. A similar
finding was also reported for word familiarity by Connine, Mullennix, Shernoff, and
Yelen (1990). This shows that whatever role word frequency might play in lexical
identification, the word frequency effect does not have lexical identification as its
single locus.
Although the delayed naming results show that lexical frequency affects levels
of processing beyond lexical identification, they are still not an argument support-
ing a view in which word frequency does not affect lexical identification. On this
point, there are two kinds of empirical findings that argue more directly against
an identification locus for the word frequency effect. The first comes from the se-
12

mantic categorization/verification task. In this task, subjects are required to judge
whether target words belong to a given category. Assuming that the semantic in-
formation necessary to perform this task only becomes available to the subject after
lexical identification of the target word, one should expect to find word frequency
effects in this task, but there is series of results reported and reviewed by Balota
and Chumbley (1984, 1990) showing that word frequency effects are only seldom
obtained in category verification tasks. Moreover, as Balota and Chumbley (1984,
1990) argue, the lack of frequency effects in this task cannot be ascribed to semantic
priming from the word describing the semantic category to the target words because
even targets that require a no response (and thus could not have been semantically
primed) fail to show frequency effects. However, despite several empirical findings
that do not support the view according to which word frequency influences lexical
identification, the evidence on this point is divided. Moreover, a number of different
category verification paradigms have been used, and there are a number of reports
of frequency effects in this task (see Monsell et al., 1989, for a review of the evi-
dence). Thus, the evidence from the semantic categorization task is suggestive, but
not entirely compelling. The second kind of evidence that argues directly against
the notion that word frequency affets lexical identification comes from distributional
analyses of RTs in LDTs done by Plourde and Besner (1997) and Yap and Balota
(2007) (see also Stanners, Jastrzembski, & Westbrook, 1975; Becker & Killion, 1977;
Paap & Johansen, 1994; Balota & Abrams, 1995; Paap, Johansen, Chun, & Von-
nahme, 2000; Yap, Balota, Tse, & Besner, 2008). These authors have shown, using
Sternberg’s (1969) additive factors logic, that stimulus quality (i. e., how clear or
13

how degraded the stimulus presentation is) has additive effects to the effect of lexical
frequency in the means, variances, and exGaussian1 parameters of the RT distribu-
tions, and therefore most likely impact different stages of processing (but see Norris,
1984; Allen, Smith, Lien, Weber, & Madden, 1997; Allen, Smith, Lien, Grabbe, &
Murphy, 2005, for empirical evidence arguing the opposite).
Taken together, this pattern of results does weaken the case for word frequency
effects having a locus in actual identification procedures and raises serious issues
about using reaction time measures from lexical decision tasks as a direct index of
lexical access, which is a standard assumption by most of the research carried out
on the topic of lexical retrieval.
1.2.1.2 Sublexical frequency
After lexical frequency had been found to influence visual recognition times, re-
searchers were interested in figuring out whether such effect was due to the frequency
of use (receptive and productive) or simply to visual familiarity. For instance, one
could imagine that, in general, more frequent words have also more frequent sub-
parts. The frequency of these subparts could make them easier to recognize and, if
that is the case, this could translate into faster recognition of the whole word. Put
differently, it could be the visual familiarity of the word that underlies the word
frequency effect. This hypothesis was directly tested by Postman and Conger (1954)
1The exGaussian is a probability distribution derived from the convolution of a normal and
an exponential distribution that has been show to fit RT distributions very well (See for example
Ratcliff, 1979; R. Luce, 1986; Balota & Spieler, 1999)
14

in a series of two experiments. The first tested the effects of lexical frequency versus
the frequency of three letter sequences (trigrams) within words. The second tested
the recognition of nonsensical three letter sequences varying in their frequency. The
conclusion was that no effects of trigram frequency were found in the recognition
times for words and nonwords:
“(...) the speed of recognition for letter sequences varies significantly
with the strength of the verbal habits associated with such stimuli. There
are no demonstrable effects of sheer frequency of exposure.” (p. 673)
Almost a decade later, however, Owsowitz (1963)2 crossed average bigram fre-
quency with lexical frequency and, contrary to expectations, found evidence of in-
hibitory effects of high compared to low bigram frequency, but only for low frequency
words; high frequency words displayed no effect of bigram frequency. However, the
author also found that low frequency words with low bigram frequency had lower
recognition thresholds than high frequency words with high bigram frequency:
“It is apparent that the initial hypothesis, that letter structure fa-
miliarity facilitates the perception of words, is not substantiated, and
indeed the reverse is in part indicated.
(...) words with unfamiliar letter structure have lower thresholds
both for familiar and unfamiliar words. (...) the unfamiliar words with
unfamiliar letter structure had lower thresholds than familiar words with
familiar letter structure. (p. 16)
2Wrongly quoted in Gernsbacher (1984) and Westbury and Buchanan (2002) as Orsowitz.
15

(...) letter structure familiarity resulted in inhibiting the perception
of unfamiliar words. Where the letter structure was less familiar, familiar
and unfamiliar words did not differ in threshold.” (p. 19)
The apparently paradoxical effect was later replicated by Broadbent and Gre-
gory (1968) using tachistoscopic presentation and by Rice and Robinson (1975) using
a LDT. However, contradictory effects have also been found. Biederman (1966) tried
to replicate Owsowitz (1963)’s study, but found that low frequency words with high
bigram frequency had lower recognition thresholds than low frequency words with
low bigram frequency, and so did Rumelhart and Siple (1974). Finally, McClelland
and Johnston (1977) reported no effect of bigram frequency in a LDT.
The conflicting nature of these findings prompted Gernsbacher (1984) to re-
assess the evidence in a series of experiments. In the first one, subjects were pre-
sented with the same list of items used by Rice and Robinson (1975), but this
time in an offline task in which subjects had to rate in a seven point scale how
confident they were whether each item was a word. This was done to investigate
the possibility that the low bigram frequency advantage found for low frequency
words in some of the previous studies was due to a “sophisticated guessing” strat-
egy. According to this hypothesis, subjects with inadequate visual information, as
in the tachistoscopic presentation paradigms, or under time pressure, like in the
LDT, would somehow be less willing or less likely to guess the lexical status of a
low frequency stimulus if it has higher visual familiarity, presumably because these
would be the hardest items to distinguish from pseudowords (this line of explana-
16

tion is very similar to Balota and Chumbley (1984, 1990)’s analysis of the frequency
effects in LDT). Gernsbacher (1984) reasoned that if “sophisticated guessing” was
indeed the underlying factor in the results found by Owsowitz (1963), Broadbent
and Gregory (1968) and Rice and Robinson (1975) due to task demands, then if
these demands were lifted, the low frequency bigram advantage for low frequency
words should disappear. However, Gernsbacher (1984) found the same kind of ef-
fect for the offline confidence judgment task than what had been found by Rice and
Robinson (1975), suggesting that the results found by the latter were not due to the
posited “guessing” strategy. Gernsbacher (1984) hypothesized then that the source
of all the conflicting results could be due to the way experimental lists were con-
structed. They all used their lexical and bigram frequency counts from older smaller
corpora (Thorndike & Lorge, 1944), which are particular prone to sampling error in
the frequency counts of low frequency words, which in turn might not necessarily
reflect the words’ actual familiarity to experimental subjects. In the second experi-
ment, the author asked experimental participants to subjectively rate how familiar
they were with the materials from some of the previous studies (Owsowitz, 1963;
Biederman, 1966; Broadbent & Gregory, 1968; Rice & Robinson, 1975). The goal
was to derive their subjective experiential familiarity, to see if real differences in this
variable were masked by unreliable corpus counts. The results showed that subjec-
tive familiarity did indeed match almost perfectly all the results from the previous
experiments. The materials of two of the experiments that reported a low bigram
frequency advantage for low frequency words (Broadbent & Gregory, 1968; Rice &
Robinson, 1975) also had an imbalance in terms of their subjective frequency, with
17

low bigram frequency words being overall more familiar than high bigram frequency
ones. The materials of one of the experiments (Biederman, 1966) that reported the
inverse effect (high bigram frequency advantage over low bigram frequency for low
frequency words) had accordingly a difference in subjective familiarity, with high
bigram frequency words being more familiar than low bigram frequency ones. To
test the idea that it was this difference in familiarity rather than bigram frequency
that caused the contradictory effects in the earlier studies, Gernsbacher (1984) fi-
nally conducted two experiments crossing two levels of word familiarity (high vs low)
with two levels of bigram frequency (high vs low), and found effects of familiarity,
but not bigram frequency.
In a different vein, another line of research has also investigated sublexical
frequency / visual familiarity as a potential variable influencing word recognition.
Interest in how visual similarity affect recognition of lexical items started in the
late 1970’s with the work of Coltheart, Davelaar, Jonasson, and Besner (1977, see
also section 1.2.3 for details). Visual similarity is normally assessed by computing
Coltheart’s N, which is the number of words that can be obtained from a string
by the substitution of one letter. This variable has been since then implicated in
visual word recognition, and its results have become known as the orthographic
neighborhood (ON) effect. Nonetheless, some researchers (eg. Grainger, 1990) have
tried to at least partially reduce the ON effect to a sublexical frequency effect.
However, this possibility has been repeatedly shown to be unlikely, given that sev-
eral researchers (eg. Andrews, 1992; Peereman & Content, 1995; Sears, Hino, &
Lupker, 1995) have controlled for bigram frequencies and still reported ON effects.
18

Conversely, other studies explicitly manipulated bigram frequency, and none found
significant effects, neither in LDT (Andrews, 1992) nor naming (G. D. A. Brown
& Watson, 1987; Treiman, Mullennix, Bijeljac-Babic, & Richmond-Welty, 1995).
In fact, precisely because of this pervasive lack of empirical evidence for effects of
sublexical frequency in visual word recognition, Balota et al. (2004) did not include
bigram frequency in the list of predictor variables in their large scale hierarchical
regression analysis (Balota et al., 2004, p. 285, footnote 1).
However, a series of three experiments recently reported by Westbury and
Buchanan (1999, 2002) has shown that, even when ON and lexical frequency are
controlled, effects of sublexical frequency can still be found. These authors used
a slightly different definition of sublexical frequency than the standard length and
place controlled bigram frequency. They computed the place–independent frequency
of all bigrams found in the CELEX database (Baayen, Piepenbrock, & Gulikers,
1995) (i. e., how many word would share each bigram in any position), and derived
experimental lists where items were matched for ON and lexical frequency, but
had their least frequent bigram be of either high (shared by lots of words) or low
frequency (shared by few words). The authors called this measure minimal bigram
frequency. The results of the three experiments were apparently paradoxical: while
no effects of minimal bigram frequency were observed for low frequency words, high
frequency words did show such an effect, but in the opposite direction of what was
expected. High frequency words with high minimal bigram frequency, instead of
being responded to faster than their low minimal bigram frequency counterpart,
were responded to slower. These results are unexpected for two reasons. First, it is
19

normally low frequency words that show effects of lexical level variables, such as ON.
The fact that only high frequency words showed the effect is therefore surprising.
Second, no lexical access theory really predicts this inhibition of performance due to
higher minimal bigram frequency within high frequency words (the authors actually
set out to test the opposite hypothesis, that high minimal bigram frequency would
facilitate access), and therefore they are hard to relate to other experimental results.
In summary, the idea that sublexical frequency (or visual familiarity) plays a
role in lexical identification is almost as old as the word frequency effect. Unlike
the latter, however, there is a surprising paucity of empirical results supporting its
influence in lexical processing. It seems to be hard to find sublexical frequency effects
at all, and in the rare instances where they are found, they have been reduced to some
other covarying variable, with the exception of the studies reported by Westbury
and Buchanan (1999, 2002). Moreover, all attempts to derive other experimental
effects from sublexical frequency have thus far failed.
1.2.1.3 Subjective familiarity
The fact that lexical frequency (as computed from language samples) seems to
affect RT performance across different behavioral tasks begs the question on what
exactly about the frequency of a given item is reflected by RT facilitation. A plausi-
ble possibility is that lexical frequency serves as a surrogate variable for something
else that does modulate lexical processing. This is in essence the proposal by Balota
and Chumbley (1984, 1990). As discussed above, one of the first attempts to pin
20

point the source of the frequency effect proposed that the effect could be due to
visual familiarity (as determined by the frequency of subparts of strings). How-
ever, as shown above, this variable has very little, if any, effect in lexical processing.
Moreover, a more general definition of familiarity, called experiential familiarity has
been shown by Gernsbacher (1984) to account for the few visual familiarity effects
that had been reported. In fact, Gernsbacher (1984) showed that subjective famil-
iarity was actually a better predictor of RTs in the LDT than lexical frequency. This
finding has since then been replicated several times, both for the LDT (eg. Connine
et al., 1990), and naming (eg. Treiman et al., 1995). A powerful demonstration
of the superiority of subjective familiarity over lexical frequency in predicting RT
latencies was reported in a mega study using 2,428 single–syllable English words
by Balota et al. (2004). These authors compared subjective familiarity with five
objective frequency estimates from different existing English corpora, and reported
that subjective frequency was a significantly better predictor than all the objective
counts, in both the LDT and naming.
Another piece of evidence consistent with the empirical results that subjective
familiarity is a better predictor of RT latencies than lexical frequencies comes from
an experiment by Forster (2000). Most of the experiments in the word recognition
literature uses groups of different stimuli whose properties, besides the ones being
manipulated, need to be controlled across lists. When several candidate items are
available to experimenters, however, they have to choose which stimuli to use in their
study. Forster (2000) was interested in assessing the extent, if any, of experimenter
bias due to experimenter choice of materials. Forster (2000) reasoned that the like-
21
lihood and extent of this potential issue depends to a large degree in experimenters
being able to intuit the likely difficulty of items they need to choose from. To test
this possibility, a group of experimenters were presented with a list of frequency–
matched word pairs and asked to choose which one in each pair they thought would
elicit faster reaction times in a LDT. Their predictions were then compared to actual
experimental data, and the results showed that all experimenters had above–chance
performance in predicting the experimental results. Furthermore, good performance
in predicting the experimental results was not related to experience in the field, with
even novices performing well.
A similar, more dramatic finding was reported by Schreuder and Baayen
(1997), who, in a series of five experiments, showed that for the same materials,
subjective familiarity ratings and reaction time latencies from LDT exhibited the
same pattern of results, with subjective familiarity being more closely correlated
with RT than lexical frequency. However, as noted by Schreuder and Baayen (1997),
although a very good predictor of RT latency in the LDT, subjective familiarity was
a poor predictor of RT in the progressive demasking task in one of their experiments,
as was another lexical level variable in which they were interested (morphological
family size). Progressive demasking is thought to affect early, perceptual stages
of lexical access, and the fact that morphological family size did not impact per-
formance in this task was taken by Schreuder and Baayen (1997) as evidence that
effects of morphological family size occur only at more central, post–identification
stages of lexical processing. The very same argument therefore can be made for
subjective familiarity, which is in line with proposals of late, post–identification ef-
22

fects for lexical frequency (see Plourde & Besner, 1997; Yap & Balota, 2007, and
the discussion above).
The fact that subjective familiarity correlates so well with RT latencies in the
LDT is a strong argument in support of Balota and Chumbley (1984, 1990)’s pro-
posal that performance in the LDT is due to two qualitatively different process, a
“fast guess” mechanism that is familiarity–based, and a longer and more laborious
lexical access route. It is also remarkable that a variable derived purely from intro-
spection is actually able to so directly predict RT latencies in both discrimination
(LDT) and production tasks.
1.2.1.4 Morpheme frequency
The lack of empirical evidence for a role of sublexical frequency (eg. bigram
and trigram frequencies) in visual word recognition could be taken as evidence that
general visual familiarity does not play a role in word recognition. However, it is
not the case that frequency of subparts of words does not influence lexical process-
ing. Several experiments in fact support the idea that subparts of words that have
meaning (morphemes) actually do influence lexical processing.
For instance, Taft and Forster (1976) reported in their fifth experiment that
the frequency of the first constituent of a compound speeds up the lexical decision
of the whole word when compared to an equally frequent compound with a lower
frequency first constituent. Taft (1979) further explored the issue, and showed that
the frequency of the stem of prefixed and inflected words (base frequency, in their
23

terminology) modulated the reaction time latencies in a LDT for words of the same
surface frequency (the presentation frequency of the full form). These results were
taken as evidence that the visual input lexicon (the orthographic representation of
words), is organized in term of decomposed morphological entries. In fact, the use
of the lexical frequency effect of morphemes as a diagnostic for independent repre-
sentation of the constituent morphemes of morphologically complex words became
the norm and has been heavily used in the field ever since (see for instance Cole,
Beauvillain, & Segui, 1989; Sereno & Jongman, 1997; Baayen, Dijkstra, & Schreuder,
1997; Schreuder & Baayen, 1997; Alegre & Gordon, 1999; Gordon & Alegre, 1999;
Domınguez, Cuetos, & Segui, 1999; New, Brysbaert, Segui, Ferrand, & Rastle, 2004;
Correa, Almeida, & Porto, 2004; Fiorentino & Poeppel, 2007; Dunabeitia, Perea, &
Carreiras, 2007).
Given the considerations about the precise locus of the frequency effect in
lexical processing (see section 1.2.1.1), the assumption that lexical frequency effects
of constituent morphemes are a direct diagnostic of morphologically decomposed
lexical representations becomes harder to maintain. This raises questions about the
correct interpretation of these results. However, there is independent evidence from
masked priming (eg. Rastle, Davis, & New, 2004) that does suggest that, at some
unspecified level of processing, lexical entries are morphologically decomposed. The
active debate in this line of research has focused mainly on whether decomposition
happens early (at the access level) or later (decisional level) in the processing stream,
and recent MEG evidence suggest that effects of morphological complexity can be
observed at the earliest stages of visual word form analysis (Zweig & Pylkkanen,
24

2009).
Finally, morphemic frequency effects could in principle be due to overall visual
similarity, and not necessarily to the frequency of the morpheme per se. Visual sim-
ilarity is normally computed using orthographic neighborhoods (ON, see Similarity
Effects below). Few studies have directly investigated the relationship between mor-
phological frequency or family size and ON density or frequency. However, Schreuder
and Baayen (1997, experiment 3) provides evidence that the effects morphological
constituency is independent from neighborhood effects. In a simple LDT, Schreuder
and Baayen (1997) presented items controlled along a number of dimensions known
to affect behavioral performance, but which differed in the amount of morphologi-
cally related words they possessed (Schreuder & Baayen, 1997, called this variable
morphological family size). One group of items had high morphological family size,
whereas the other group had lower morphological family size. It was found that
items with higher morphological family size were responded to faster than the items
possessing lower morphological family size. Schreuder and Baayen (1997) provided
two arguments for this effect being truly morphological and not just due to ortho-
graphic similarity. The first was that items with higher morphological family size
also had more orthographic neighbors than items with lower morphological family
size. However, ON size is thought to inhibit, not facilitate, RT in LDT3, which is
3The claim that ON size is an inhibitory factor in LDT is actually controversial in the literature,
as will be seen in the section 1.2.3, and does not seem to hold for English. However, the inhibitory
ON size effect does seem to hold for languages such as French, Spanish and Dutch. Since Schreuder
and Baayen (1997)’s study used Dutch stimuli, the controversy about whether or not ON size
25

exactly the opposite pattern than the one found by Schreuder and Baayen (1997).
Moreover, no post–hoc correlation was found to be significant between ON size and
RT in this study.
1.2.2 Frequency effects in the auditory processing of words
1.2.2.1 Lexical frequency
The word frequency effect was first demonstrated in the perceptual identifi-
cation of visually presented words, but was soon replicated in the auditory modal-
ity (Howes, 1957; Rosenzweig & Postman, 1957, 1958; Savin, 1963).
However, unlike what happened in the field of visual word recognition, the-
ories of spoken word recognition did not at first posit a lexical access role for the
effect of frequency. In fact, the first incarnation of the Cohort Theory (Marslen-
Wilson & Welsh, 1978) did not even mention any particular role for the frequency
of spoken words. In this theory, the mechanisms responsible for the initial access of
information about a word form stored in memory operate over a span of sensorial
information that evolves through time. The access procedures take into account
primarily the goodness of fit from this sensorial information with specific mem-
ory representations of word forms. This theory was later revised (Marslen-Wilson,
1987b), and in this new incarnation, lexical frequency was hypothesized to modulate
access to the lexicon, by either changing the resting activation levels of word forms
or their activation function.
inhibits or facilitate behavioral performance in the LDT does not necessarily apply to their study.
26

Other influential models, such as the Neighborhood Activation Model (NAM),
propose that lexical frequency plays only a biasing effect at selectional or decisional
stages (Goldinger, Luce, & Pisoni, 1989; Cluff & Luce, 1990; P. A. Luce & Pisoni,
1998), not at the early sensory encoding or lexical activation stage (see Connine
et al., 1990; Connine, Titone, & Wang, 1993, for further evidence supporting a
decisional bias role instead of a lexical activation role for lexical frequency).
Moreover, genuine lexical frequency effects, as opposed to morphological relat-
edness effects, were found when the cumulative frequency of the morphological fam-
ily (eg. Cole et al., 1989) to which the test items belonged was controlled (Hoen, Me-
unier, & Segui, in press; Meunier & Segui, 1999b, experiment 1). However, (Turner,
Valentine, & Ellis, 1998) found that when age of acquisition (a variable that is highly
correlated with lexical frequency) was controlled, no effects of lexical frequency were
found in auditory lexical decision task (see Morrison & Ellis, 2000, Garlock, Walley,
& Metsala, 2001 and Cuetos, Alvarez, Gonzlez-Nosti, Mot, & Bonin, 2006 for more
discussion on the relationship between age of acquisition and lexical frequency).
Finally, the frequency effect in auditory word recognition seems to be also
modulated by experimental task. While the frequency effect is attenuated in naming
from print, it is reported to disappear completely in auditory naming4 (P. A. Luce,
1986; Connine et al., 1990; Gaygen & Luce, 1998; P. A. Luce & Pisoni, 1998; Garlock
et al., 2001, when lexical frequency was decorrelated from age of acquisition)
4Auditory naming is alternatively referred to as shadowing, or word repetition.
27
1.2.2.2 Sublexical frequency
While there is little evidence that the frequency of subparts that carry no
meaning (simple n-grams) influence the processing of visually presented words, there
is substantial evidence that the frequency/probability of phonetic/phonological sub-
parts does play a role in different aspects of speech processing. In fact, unlike the
case of visually presented words, the configuration of phones within linguistic units
(eg. syllables, words) in speech even receives a name: phonotactics. Phonotactics
refer both to statistical generalizations about what sequences of phones are more or
less frequent in the language, or are more or less likely to follow or precede each other
and to categorical statements about whether or not certain phones are allowed to fol-
low or precede each other, or to figure in specific positions. For instance, the phone
[h] cannot occur in word final position in English, whereas the sound [N] cannot
occur in word initial position in English. It has been repeatedly shown that phono-
tactics does play a role in speech processing. For instance, pre–lexical 9–month–old
children discriminate between words in English and Dutch, two languages with sim-
ilar prosodic features, based solely on phonotactic constraints (Jusczyk, Frederici,
Wessels, Svenkerud, & Jusczyk, 1993), and discriminate between more and less fre-
quent phonetic patterns in their native language (Jusczyk, Luce, & Charles-Luce,
1994). Moreover, pre–lexical 8–month–old children have been shown to track tran-
sitional probabilities between syllables (Saffran, Aslin, & Newport, 1996), and this
ability has been linked to the onset of word–form segmentation from the speech
stream. Adults have also been shown to have access to phonotactic information.
28

For instance, Vitevitch, Luce, Charles-Luce, and Kemmerer (1997, experiment 1)
have shown that judgments of wordlikeness of nonsense strings varied as a function
of the phonotactic probability of items (see also Frisch, Large, & Pisoni, 2000; Bailey
& Hahn, 2001; Fais, Kajikawa, Werker, & Amano, 2005). Moreover, Vitevitch et al.
(1997, experiment 2) has shown that verbal repetition times (or auditory naming)
for the same nonsense words also varied as a function of phonotactic probability,
with pseudowords of high phonotactic probability being responded to faster and
more accurately than those with lower phonotactic probability.
However, the results obtained by Vitevitch et al. (1997) create a puzzle for cer-
tain theories of lexical access. According to the Neighborhood Activation Model (NAM,
P. A. Luce & Pisoni, 1998; Cluff & Luce, 1990), word recognition happens in the
context of a candidate set that is selected on the basis of similarity with the input
(this model will be discussed in more detail in the section dealing with similarity
effects). If the candidate set is large (ie. there are lots of words that could be
matched by the input), recognition will be slowed down due to competition be-
tween the words in the candidate set. This is called the Neighborhood (Density)
Effect. With this backdrop, Vitevitch et al. (1997)’s results conflict directly with
predictions from NAM, because high phonotactic probability is directly related to
neighborhood density: Phonetic sequences that appear in a large number of words
will have higher phonotactic probability, creating a natural tendency for higher
probability sequences to occur in dense neighborhoods (Vitevitch, Luce, Pisoni, &
Auer, 1999). Therefore, NAM would predict that phonetic sequences with higher
phonotactic probability (and therefore higher neighborhood density) be responded
29

to slower than sequences with lower phonotactic probability (and therefore lower
neighborhood density), contrary to the results reported by Vitevitch et al. (1997)
for pseudowords.
Therefore, Vitevitch and Luce (1998) decided to replicate the results from Vitevitch
et al. (1997), still using the auditory naming task, but this time with a different set
of stimuli, and including both words and pseudowords that differed in their neigh-
borhood density/phonotactic probability. Stimulus presentation was blocked by
lexicality, meaning that participants were presented with one block in which all the
items were words and one block in which all the items were pseudowords. The
pseudoword data replicated the results of Vitevitch et al. (1997), but the word data
showed the opposite effect, with words with denser neighborhoods/higher phonotac-
tic probability being responded to more slowly than words with less neighbors/lower
phonotactic probability. In other words, the predictions made by NAM were only
observed for the words, not pseudowords.
This pattern of results was later replicated with a speeded same–different
judgment task (Vitevitch & Luce, 1999, experiment 1), and the whole set of results
was interpreted as being evidence for two distinct modes of processing, one sublexical
and one lexical. Pseudowords, not having lexical representations, are biased towards
being processed via sublexical units. Phonotactic probability therefore seems to have
a facilitatory role at the sublexical level, explaining the results for pseudowords.
Words, on the other hand, do possess lexical representations, and therefore are
subject to more intense lexical competition, as proposed by NAM, explaining why
words display the standard neighborhood density effect. Having found evidence
30

for the two distinct processing modes, Vitevitch and Luce (1999) proceeded to test
the hypothesis that the relevant contribution of each in the processing of speech
could be modulated by manipulating task demands. In experiment 2, Vitevitch
and Luce (1999) presented the same stimuli used in experiment 1, but this time
not blocking the stimuli by lexicality. The reasoning was that, with an intermixed
list, subjects would be biased towards adopting a consistent strategy throughout the
experiment, and in this case the optimal strategy would be to focus on the sublexical
level, given that a same–different judgment can be obtained without making contact
with the lexicon. The authors’ prediction therefore was that while pseudowords
should still display the putative facilitatory effect due to phonotactic probability,
the performance for words should be less impaired by lexical competition. The
results confirmed the prediction: Pseudowords replicated the result of experiment 1,
while words did not show any neighborhood density/phonotactic probability effect.
Experiment 3 tested the hypothesis that when processing is biased towards the
lexical level, effects of lexical competition should be observed for pseudowords as
well. The authors used an auditory lexical decision task in order to make lexical level
processing more relevant. The results confirmed the prediction, with pseudowords of
high phonotactic probability and high neighborhood density now being responded to
more slowly than pseudowords of low phonotactic probability and low neighborhood
density.
In this series of studies, Vitevitch and Luce (1998, 1999, experiment 1–3) used
the same set of monosyllabic CVC items. The authors were nonetheless interested
in what would happen with longer stimuli, and therefore a new set of materials was
31

constructed. The CVC words used by Vitevitch and Luce (1998, 1999, experiment
1–3) were factorially combined in such a way as to create CVCCVC bisyllabic words.
Four groups of compound words were created: Words in which both syllables had
high phonotactic probability / high neighborhood density (High–High condition,
eg. pancake), words in which the first syllable had high phonotactic probability /
neighborhood density and the second had low phonotactic probability / neighbor-
hood density (High–Low condition, eg. bellhop), words in which the first syllable
had low phonotactic probability / neighborhood density, and the second had high
phonotactic probability / neighborhood density (Low–High condition, eg. bobcat)
and finally words in which both syllables had low phonotactic probability / neigh-
borhood density (Low–Low condition, eg. dishrag). The pseudowords were the ones
used in Vitevitch et al. (1997)’s original study. As predicted, when an auditory
naming task was used (experiment 4), pseudowords displayed an additive effect
of phonotactic probability across conditions: High–High pseudowords elicited the
fastest reaction times, followed by High–Low and Low–High items, which elicited
equally fast responses, with Low–Low items eliciting the slowest responses. This
result was interpreted as consistent with a sublexical focus in the processing of
pseudowords, especially in the context of an experimental design where stimuli pre-
sentation was blocked by lexicality. For the lexical decision task (experiment 5),
however, there was no additive effect of phonotactic probability across conditions,
with no effect of phonotactic probability for first syllables. This result was inter-
preted as evidence for lexical competition happening early in the processing stream
(in the first syllable), which is in line with the idea that the LDT task bias processing
32
towards the lexical level.
Unfortunately, this account of the pseudoword results from experiments 4–
5 is unsatisfactory. For instance, it is not clear how the pseudoword data from
experiment 5 confirms the idea of interacting processing levels. One of the key
findings of experiment 3 was that the previous facilitatory effect of phonotactic
probability for pseudowords found in both auditory naming (Vitevitch & Luce, 1998)
and the same–different judgment (Vitevitch & Luce, 1999, experiments 1 and 2)
was reversed when the task was biased towards processing at the lexical level. The
authors interpreted this result as being evidence of lexical competition in denser
neighborhoods, mirroring the effect found for words. However, in experiment 5,
which used the exact same task as experiment 3 (LDT), Low–Low pseudowords
were still the ones that elicited the lowest reaction times amongst all conditions,
contrary to what would be expected if the processing was indeed biased towards
the lexical level5. In fact, the pattern of pseudoword results from experiment 5 was
almost exactly the same found in experiment 4, which used auditory naming, a task
that according to the authors biases processing towards sublexical processing. Why
was the change in task from auditory naming to LDT enough to cause a reversal
in the pseudoword results in one case (Vitevitch & Luce, 1998 to Vitevitch & Luce,
1999, experiment 3) but not in the other (Vitevitch & Luce, 1999, experiment 4
to Vitevitch & Luce, 1999, experiment 5)? The authors’ solution for this apparent
contradiction is that, for longer pseudowords, the mode of processing slowly shifts
5Indeed, if processing was biased towards the lexical level, then a sparse neighborhood would
be less disruptive than a dense neighborhood, and faster reaction times would be predicted
33
in the course of recognition. The recognition process for bisyllabic pseudowords in
the LDT would start out as mostly lexical, but over time, the lack of a matching
lexical representation might bias the process towards the sublexical level. Therefore,
one might expect lexical competition to exert its effect only on the first syllable, but
not on the second, when sublexical processing might be privileged. The authors do
report a lack of a significant effect of phonotactic probability for the first syllables,
and based on that conclude that their explanation accounts for the results. However,
the logical consequence of their putative explanation would be the following pattern
of results: The fastest reaction times should be obtained by Low–High pseudowords,
because these items would suffer less competition when processing is biased towards
the lexical level (during the first syllable), and would benefit from more activation
when processing is biased towards the sublexical level (during the second syllable).
Conversely, High–Low pseudowords should elicit the slowest reaction time latencies,
because they would suffer from higher competition at the lexical level (first syllable)
and would only benefit from a small boost when processing turns to the sublexical
level (second syllable). In the same vein, it would seem that High–High and Low–
Low pseudowords should elicit intermediate reaction time latencies, due to both
having a penalty at some level (High–High in the fist syllable, and Low–Low on the
second), and a boost in the other (High–High at the second syllable, and Low–Low
at the first) that could perhaps cancel each other out. The graph of the results
obtained in experiment 5, however, shows a different pattern: the fastest reaction
times were elicited by High–High and Low–High pseudowords, and the slowest ones
by Low–Low items, with the results from the High–Low condition between the two
34

extremes (unfortunately, no planned comparisons or post–hoc tests are reported in
order to check for statistical significance). Therefore, the explanation invoked by the
authors in order to account for the lack of the predicted neighborhood competition
effects for pseudowords in experiment 5, when taken in full consideration, actually
fails to capture the pattern of results.
In the same vein, the word data obtained in experiments 4–6 is also problem-
atic. The results are remarkably stable across experiments, even though different
tasks were used (auditory naming, lexical decision and semantic categorization):
High–High items were responded to as fast as Low–Low items and both elicited
faster responses than High–Low and Low–High items, both of which elicited equally
fast responses. This was interpreted in the following fashion: The processing level
(lexical vs sublexical) that will dominate or receive focus in each task is determined
by how informative each level is. In the case of Low–Low words, most information
will be obtained via the lexical level, given that the low phonotactic probability will
not activate sublexical units very strongly, whereas the lack of lexical competition
will generate stronger lexical activation, due to less lateral inhibition. Since words
with a Low first syllable will attract particular focus on lexical processing, this ex-
plains why Low–High words elicited slower reaction times than Low–Low words:
The second syllable being High will exact a processing cost due to the higher den-
sity neighborhood. In the case of High–High words, on the other hand, processing
will be initially focused at the sublexical level, due to strong lexical competition
early on, making the higher activation of sublexical units more informative. This
explains why High–High words were responsed to faster than High–Low words: The
35

processing being focused on sublexical activation will create an advantage for second
syllables of higher phonotactic probability.
However, this account is also unsatisfactory in the light of the results of pre-
vious experiments (Vitevitch & Luce, 1998, 1999, experiments 1–3). Namely, in
the auditory naming study (Vitevitch & Luce, 1998), the same–different judgment
study Vitevitch and Luce (1999, experiment 1) and the auditory lexical decision
study Vitevitch and Luce (1999, experiment 3), inhibitory effects of neighborhood
density for words were reported, despite the fact that these words also had high
probability segments and biphones. This pattern was accounted for by positing
that a strong bias towards processing at the lexical level was at play. In the lex-
ical decision study (experiment 3), the bias stemmed from the nature of the task,
whereas in the auditory naming, same–different judgment and semantic categoriza-
tion studies (Vitevitch & Luce, 1998, Vitevitch & Luce, 1999, experiments 1 and
3), the lexical bias stemmed from the stimuli being presented blocked by lexicality.
When an intermixed list was used by Vitevitch and Luce (1999, experiment 2) in
a same–different judgment task, it attenuated the strong bias towards lexical level
processing, and words ceased to show competition effects. The authors interpreted
this particular result as evidence that the facilitatory effects of phonotactic proba-
bility at the sublexical level were therefore at play, even for real words. According
to this logic, the direct prediction for the experiments with bisyllabic stimuli (which
were created by combining the monosyllabic words from experiments 1–3) would
be that, unless a major bias towards sublexical processing is introduced, words
should be processed mainly at the lexical level, where competition from phonologi-
36
cal neighbors is observed. The only manipulation that has been shown to prevent or
diminish processing at the lexical level was the use of a list composed of both words
and pseudowords in a task that does not by itself requires contact with lexical word
forms (same–difference judgment). This kind of manipulation was conspicuously
absent in experiments 4–6: In both experiments 4 (auditory naming) and 6 (seman-
tic categorization), words were blocked together, whereas experiment 5 was a lexical
decision task. Therefore, given the lack of mitigating factors, the most direct and
natural prediction for experiments 4–6 would be that the processing of words should
be heavily biased towards the lexical level, and therefore an additive inhibitory ef-
fect of neighborhood density should be observed across conditions. More precisely,
High–High words should elicit the slowest reaction time latencies, followed by High–
Low and Low–High words, and finally by Low–Low, which should be the condition
where the fastest reaction times should be elicited. This was not the pattern that
was found, however, and in order to explain it, the authors are forced to posit that,
for bisyllabic words, the first syllable determines the dominant level of processing
across the two syllables. Moreover, the authors additionally claim that a High first
syllable will bias processing to the sublexical level, and a Low first syllable will bias
processing towards the lexical level. Not only is the first claim — that first sylla-
ble determines processing mode for the second syllable — in direct contradiction of
what the authors proposed in order to explain the pseudoword results — that the
dominant processing level would shift across the two syllables — but the proposal
that a High first syllable should bias processing to the sublexical level while a Low
first syllable should bias processing towards the lexical level is in direct contradiction
37
with the results from experiments 1–3. The logical consequence of this account is
that, in case the first syllables had been presented in isolation, roughly equivalent
reaction times would have been observed for High words (boosted by their higher
phonotactic probability) and Low words (boosted by less intense lexical competi-
tion). However, in experiments 1–3, these first syllables were presented in isolation,
and a clear difference was observed between the two classes. Moreover, that dif-
ference was clearly compatible with the effects that would be expected from lexical
competition, indicating that both classes of words were being processed mainly at
the lexical level, and not at different levels.
Given how contradictory and counterintuitive the results of experiments 4–6
are, it is difficult to know what to make of the claims that phonotactic probabil-
ity affects word recognition at a sublexical level. Thus far, the main arguments
supporting the influence of phonotactics on word identification rest on effects on
pseudowords, not words, and in tasks where lexical retrieval is arguably not a nec-
essary stage. No positive effect of phonotactic probability has been observed for
actual words, only a null effect in one experiment where neighborhood competition
effects were expected, given that they had been found in a previous experiment.
This state of affairs is particularly problematic given that there are several
issues with the pseudowords used by Vitevitch and Luce (1998, 1999, experiments
1–3). The first (minor) problem is that 18 out of the 120 (or 15%) low probability
pseudowords used by Vitevitch and Luce (1998, 1999) start with the segment [D]. The
occurrence of this segment in English is heavily restricted in word initial position,
with in fact only closed class words allowing it. It not entirely clear whether there
38

is a real grammatical restriction against segment [D]’s occurrence in first position of
open class words or whether this distributional fact is just spurious, but regardless of
the theoretical account, it is clear that the use of these items introduce an unwanted
confound in the data. A more serious problem was identified by Lipinski and Gupta
(2005), in a series of 12 experiments. In an attempt to replicate the early Vitevitch
and Luce (1998)’s results for pseudoword shadowing, Lipinski and Gupta (2005)
noticed that the actual sound files of the pseudowords used in Vitevitch and Luce
(1998)’s study (which were also used in Vitevitch & Luce, 1999, experiments 1–3)
contained substantial leading and trailing silence, and that their duration, which was
reported as controlled by Vitevitch and Luce (1998, 1999), was in fact only controlled
for total file duration (i. e., leading and trailing silences included), not true stimulus
duration. When true stimulus duration was compared, it was found out that high
phonotactic probability / high density pseudowords were on average a statistically
significant 58ms shorter than the low phonotactic probability / low density pseu-
dowords (Lipinski & Gupta, 2005, p. 174). In their first four experiments, Lipinski
and Gupta (2005) used the same tokens used in Vitevitch and Luce (1998, 1999), and
reported that when true stimulus duration was taken into account instead of simple
file duration, either by statistical adjustments in that analysis of results or by using
true stimulus offset as the basis for computing RT , the processing advantage of high
phonotactic probability pseudowords over low phonotactic probability pseudowords
turned into a processing disadvantage. In other words, the effect of phonotactic
probability was reversed when true stimulus duration was taken into account, in a
way that was consistent with standard neighborhood competition effects. In their
39

remaining eight experiments, Lipinski and Gupta (2005) found the same inhibitory
effect of phonotactic probability on the RT for pseudoword repetition (contrary to
what has been reported by Vitevitch & Luce, 1998) when true stimulus duration
was taken into account, regardless of whether they used new recordings of Vitevitch
and Luce (1998)’s materials (Lipinski & Gupta, 2005, experiments 5–8), or whether
they used a new list of materials (Lipinski & Gupta, 2005, experiments 9–12).
Concerned by the results reported by Lipinski and Gupta (2005), Vitevitch
and Luce (2005) attempted to replicate their original findings, using a new set of
materials properly controlled for true duration (this new set of pseudowords, like the
one used by Lipinski & Gupta, 2005, in their experiments 9–12, did not have any item
with segment [D] in initial position, effectively sidestepping any potential confounds
due to the segment’s particular distribution). In their first experiment, Vitevitch and
Luce (2005) reported an average 14 ms RT advantage for repetition of pseudowords
of high phonotactic probability / high neighborhood density over pseudowords of low
phonotactic probability / low neighborhood density. Using a hierarchical multiple
regression approach in which stimuli’s duration was included in the model prior to
the inclusion of phonotactic probability, Vitevitch and Luce were able to ascertain
that even when the influence of duration was partialled out, phonotactic probability
had a small but significant contribution. This led the authors to conclude that their
original findings about the effect of phonotactic probability, although problematic
due to the true stimulus duration confounds, were still valid.
However, this does not address or explain the fact that Lipinski and Gupta
(2005) only found inhibitory effects of phonotactic probability when duration was
40

taken into account. Vitevitch and Luce (2005) hypothesized that the source of this
disparity in empirical findings could be due to the different presentation rates used
across experiments: Lipinski and Gupta (2005) used a fixed ITI of either 1 or 4.5 s,
whereas in their series of experiments, Vitevitch and Luce (1998, 1999, 2005), trials
ended with subjects’ response or at time–out threshold (not reported for Vitevitch
& Luce, 1998, 3 s in Vitevitch & Luce, 1999 and 5 s in Vitevitch & Luce, 2005).
According to Vitevitch and Luce (2005), the 1 s ITI might have imposed too fast a
pace for subjects, who
“(...) may have experienced considerable difficulty in responding, affect-
ing accuracy and adding considerable noise to the data, thereby making
it potentially difficult to obtain the original (admittedly small) facilita-
tive effect” (Vitevitch & Luce, 2005, p. 198).
Conversely, the 4.5s ITI might have been too slow a pace:
“(...) reaction times to the stimuli are considerably longer than those
obtained in V&L98 or in the present experiments. Given research by
Newman, Sawusch, and Luce (1997) demonstrating fairly well-defined
and short time windows for effects of neighborhood density on phoneme
processing, it is not unreasonable to conclude that responses as long as
those reported by L&G in Experiments 3, 4, 7, 8, 11, and 12 reflect
processes that are well downstream from what are probably fast-acting
effects of sub-lexical probabilities.
41

(...) the presentation rate in Experiments 3, 4, 7, 8, 11, and 12 of
L&G may have been too slow. The response latencies observed with a
slower presentation rate may reflect processes that are well downstream
from what are probably fast-acting effects of sub-lexical probabilities,
thereby making it difficult to observe effects of phonotactic probability
on response latency” (Vitevitch & Luce, 2005, p. 200).
In order to explore this hypothesis, Vitevitch and Luce (2005) performed a
second experiment using the same materials used in the first one, but using a fixed
1 s ITI, like Lipinski and Gupta (2005, experiments 3, 4, 7, 8, 11 and 12) did.
This time, however, no effect of phonotactic probability was found, which the au-
thors interpreted as evidence supporting the idea that the disparity between the
results from Lipinski and Gupta (2005) and Vitevitch and Luce (2005) stems from
differences in the trial presentation regimen, concluding that
“(...) the effect of phonotactic probability originally reported by V&L98
is subtle, dependent of crucial aspects of timing of presentation of the
stimuli as well as the speed of the response itself.” (Vitevitch & Luce,
2005, p. 201)
Unfortunately, this account is highly unsatisfactory for a number of reasons.
The first is that the putative mechanism proposed by Vitevitch and Luce (2005) to
account for the lack of a facilitative effect in the experiments reported by Lipinski
and Gupta (2005), namely a “difficulty in responding affecting accuracy and adding
considerable noise to the data” (Vitevitch & Luce, 2005, p. 198) due to the fast
42

ITI, does not explain the fact that Lipinski and Gupta (2005) found only inhibitory
effects of phonotactic probability / neighborhood density for the repetition latency
of pseudowords. The second reason why this account is highly unsatisfactory is that
the mechanism proposed by Vitevitch and Luce (2005) to account for the lack of a
facilitative effect in the experiments reported by Lipinski and Gupta (2005) also fails
to explain the null effect in experiment 2 found by Vitevitch and Luce (2005). The
error rate in Vitevitch and Luce (2005)’s experiment 2 for pseudowords of high and
low phonotactic probability was 96% and 93% respectively (no significant difference),
while they were 95.2% and 95% in experiment 1. Therefore, while it is true that a
null effect was obtained in experiment 2, there is no evidence that this was caused by
an increased difficulty in responding from the part of the subjects when confronted
with a faster ITI. The third reason why the account proposed by Vitevitch and
Luce (2005) to explain the disparity between their own results from those reported
by Lipinski and Gupta (2005) is unsatisfactory is that Vitevitch and Luce (2005)’s
reasons to dismiss the results obtained by Lipinski and Gupta (2005) using a slower
presentation regimen of 4.5 s ITI are simply unwarranted. According to Vitevitch
and Luce (2005), the Lipinski and Gupta (2005)’s experiments using the 4.5 s ITI
elicited much slower RTs than the ones by Vitevitch and Luce (1998, 2005), which
shows the different nature of the results, making them incommensurable. While it
is true that the results of Vitevitch and Luce (2005), which figured in the range of
800–870 ms, were much faster than the ones obtained in experiments 3, 4, 7 and 8
by Lipinski and Gupta (2005), which were in the 1190–1290 ms range, experiments
11 and 12 showed very similar ranges (880–950 ms) to the ones in Vitevitch and
43

Luce (2005). Moreover, visual inspection of the graphs reporting the RTs obtained
by Vitevitch and Luce (1998) for the repetition of pseudowords show a range between
1000–1100 ms. In the absence of more detailed arguments, it is unclear why anything
aside from interpersonal variation should be inferred from the pattern of overall
speed of response across these experiments.
Despite all these conflicting results from pseudoword naming, there are at
least some positive results using real words pointing to a role of phonotactic prob-
ability in the processes of speech perception. P. A. Luce and Large (2001) used a
factorial design crossing phonotactic probability and neighborhood density for both
words and pseudowords in a same–different judgment task. The results for words
were that both an inhibitory main effect of neighborhood density and a facilitative
effect of phonotactic probability were obtained. However, no effects of phonotac-
tic probability or neighborhood density were observed for pseudowords, adding to
the complex pattern of results involving this class of stimuli. However, P. A. Luce
and Large (2001) argued that the lack of effects for pseudowords in that case was
due to one condition in particular: Pseudowords of high phonotactic probability /
low neighborhood density did not show the expected neighborhood density effect
compared to their high neighborhood density counterparts. P. A. Luce and Large
(2001) reasoned that one possible reasons for this lack of neighborhood density effect
for high phonotactic probability pseudowords could be due to underestimating the
actual amount of lexical competition these pseudowords endure:
“Lessened intralexical inhibition due to the relatively lower number
44

of competing neighbours in low density neighbourhoods, coupled with
heightened activation of the neighbours based on their higher phono-
tactic probabilities, may have produced particularly severe competitive
environments for these nonwords. Moreover, the lack of a single lexical
representation consistent with the input may have further exaggerated
the effects of lexical competition, given that no dominant representa-
tion would gain an immediate foothold and suppress activation of its
competitors.” (P. A. Luce & Large, 2001, p. 574–5)
It is unclear why this should be more of an issue for low than for high density
neighborhoods pseudowords (after all, the latter will have more competitors that
are highly activated, without a lexical representation in memory that matches the
input, and should therefore suffer more from competition). Nonetheless, P. A. Luce
and Large (2001) computed in their experiment 2 a behavioral measure of neigh-
borhood density that they called entropy. Entropy was measured by probing a new
group of participants with the pseudowords used in experiment 1 and asking them
to produce similar sounding real words. When the results of experiment 1 were
reanalyzed by splitting the items in high vs low entropy groups, the low entropy
group (ie, pseudowords with overall fewer lexical competitors) showed very similar
results to experiment 1: Main effects of neighborhood density (albeit marginal) and
phonotactic probability. The high entropy group, however, did not show any sig-
nificant main effect, and in fact showed a trend in the opposite direction for high
probability items, with low density pseudowords eliciting higher RTs than high den-
45

sity pseudowords. The authors interpreted this as evidence that at least some high
probability pseudowords with a supposedly low neighborhood density might suffer
from more lexical competition than the standard neighborhood density metric might
suggest.
Finally, Vitevitch (2003) showed that, in a same–judgment task, the puta-
tive effects of neighborhood density and phonotactic probability could be selectively
observed for real words. By using the same set of words varying in phonotactic
probability / neighborhood density and simply varying the ratio of words to pseu-
dowords presented to three different groups of subjects, Vitevitch (2003) was able to
demonstrate the competitive effects of neighborhood density on words when there
were more words than pseudowords, eliminate the effect when the number of words
was equal to that of pseudowords (replicating the result from experiment 2 from
Vitevitch & Luce, 1999), and demonstrate the facilitative effect of phonotactics
when the number of words was smaller than the number of pseudowords.
Summarizing the discussion so far, it is perhaps fair to say that when the body
of evidence is evaluated, the effect of phonotactic probability in word recognition
is far from clearly established or understood. When words are considered, only
one task, same–different judgment, has been able to show the putative facilitative
effect. This task is, amongst all the other that have been considered in this line of
research, like shadowing, lexical decision or semantic categorization, the one that
least requires lexical processing. In fact, the task could in principle be performed
without any lexical or even linguistic processing at all. Moreover, there are only
two studies showing positive facilitative effects for words. One of them (P. A. Luce
46

Table 1.1: Summary of Empirical Investigations of the Effects of Phonotactic Proba-bility in Speech Perception. Unless stated otherwise, (i) Dense Neighborhoods (DN)are confounded with High Phonotactic Probability (HP), and Sparse Neighborhoods(SN) with Low Phonotactic Probability (LP), (ii) Items are CVC monosyllables, (iii)RT is computed from onset of stimulus presentation and (iv) Facilitation is puta-tively due to Phonotactic Probability, and Inhibition is putatively due to Neighbor-hood Density.
Paper Experiments Words Pseudowords
Auditory Naming Task (also referred to as Shadowing or Repetition)
Vitevitch et al. (1997) Exp. 2o — FacilitationVitevitch & Luce (1998) Exp. 1a / W, PW blocked Inhibition FacilitationVitevitch & Luce (1999) Exp. 4o,p / W, PW blocked Facilitationi Facilitationi
Inhibitionj Facilitationj
Lipinski & Gupta (2005) Exp. 1a,d,f — Facilitation— Facilitationk
— Inhibition (trend)m
— Inhibitionl
Exp. 2a,b,d,f , 3a,d,g, 4a,b,d,g — Facilitation— Nullm
— Inhibitionl
Exp. 5a,e,f , 7a,e,g, 11a,g — Null— Inhibitionm
— Inhibitionl
Exp. 6a,e,f , 8a,e,g, 9f , 10c,f , 12c,g — Inhibition— Inhibitionm
— Inhibitionl
Vitevitch & Luce (2005) Exp. 1c,h — FacilitationExp. 2c,f — Null
Same–Different Judgment Task
Vitevitch & Luce (1999) Exp. 1a,d / W, PW blocked Inhibition FacilitationExp. 2a,d Null Facilitation
Luce & Large (2001) Exp. 1r Facilitation NullExp. 2s — Facilitation (marginal)
Vitevitch (2003) Exp. 1Aa,d,q / More PW than W Inhibition —Exp. 1Ba,d,q / PW equal W Null —Exp. 1Ca,d,q / Less PW than W Facilitation —
Auditory Lexical Decision Task
Vitevitch & Luce (1999) Exp. 3a,d Inhibition InhibitionExp. 5o,p Facilitationi Facilitationi
Inhibitionj Inhibitionj
Semantic Categorization Task
Vitevitch & Luce (1999) Exp. 6o,p Facilitationi —Inhibitionj —
aPseudowords’ duration biased: HP significantly shorter than LP. bStimuli equated for file duration (not trueduration). cStimuli equated for true duration. dSame pseudoword tokens from V&L(1998). eSame pseudowordtypes, but different tokens, from V&L(1998). fTrial duration fixed at 1s. gTrial duration fixed at 4.5s. hTrialsduration was determined by subjects’ responses, until 3 s post–stimulus onset. iWhen 1st syllable is DN/HP.jWhen 1st syllable is SN/LP. kRT computed from real stimulus onset. lRT computed from true stimulus offset.mStatistical control /adjustment for stimuli’s duration. oBisyllabic (CVC.CVC) stimuli used. pWord composedfrom V&L(1999) CVC words, and pseudowords from V.etal.(1997). qMaterials from V&L(1999). rFactorial design(ND and PP crossed). sReanalysis of Exp.1 with behavioral rather than statistical neighborhood metric.
47

& Large, 2001, experiment 1) shows the effect for words, but surprisingly not for
pseudowords. The other (Vitevitch, 2003), shows the effect, but only when a higher
ratio of pseudowords to words is used. While Vitevitch (2003) argues that this
is expected due to the environmental advantage for sublexical processing created
by the experiment’s design, an equally plausible alternative is that in fact this
manipulation affects processing at a different level (for instance, post–identification
stages) altogether. If that is the case, then it is unclear what the relevance of this
fact is for theories of spoken word recognition. To put these results into perspective,
two other experiments failed to show any effect of phonotactic probability on words
(Vitevitch & Luce, 1999, experiment 2, and Vitevitch & Luce, 2005, when equal
number of pseudowords and words were used), and three other only showed the
standard competition effects putatively due to neighborhood density (Vitevitch &
Luce, 1998, using a repetition task, and Vitevitch & Luce, 1999, experiment 1
and Vitevitch, 2003, when words outnumbered pseudowords, both using the same–
different judgment task). If phonotactic probability does play a role in spoken word
recognition, then, its effect is remarkably subtle. Finally, in no single study the
putative facilitative effect of phonotactic probability is observed concomitantly for
both words and pseudowords.
When it comes to pseudowords, the results are unfortunately very disparate.
The majority of results supporting a facilitative role for phonotactic probability
in word recognition are marred by stimulus duration confounds, and at present,
only one experiment (Vitevitch & Luce, 2005, experiment 1) shows an unambiguous
(albeit small) facilitative effect, that was nonetheless fragile enough to disappear
48

when the presentation rate was changed slightly in a follow up experiment6. Two
other studies showed a facilitation effect of phonotactic probability for longer items
(CVC.CVC pseudowords) (Vitevitch et al., 1997; Vitevitch & Luce, 1999, experi-
ment 4), but no attempt was made to partial out the effect of stimulus duration
in these cases. The rest of the evidence points to a standard neighborhood density
inhibitory effect (Lipinski & Gupta, 2005).
Given this state of affairs, what can be concluded about the putative role
of phonotactic probability in spoken word recognition? In order to answer this
question, however, it is important to discuss in more detail what is at stake at a
theoretical level. Historically, the driving force behind proposing a facilitative effect
of phonotactic probability was due to an empirical finding that was not possible
to account for in terms of NAM7, namely a facilitative effect for strings that had
denser neighborhood, putatively due to their also having higher phonotactic prob-
ability. However, this effect seemed to be sensitive to lexicality, and was found
only for pseudowords (Vitevitch & Luce, 1998, 1999, experiments 1–2). In a stan-
dard view of processing as a sequence of stages, this result would seem to indicate
that phonotactic probability affects post–identification procedures, given that its ef-
fect was only seen in items with no lexical representation; if the effect had its locus
pre–identification, it should apply to every input string, regardless of the lexical pro-
6As stated before, the alleged speeding up of the presentation rate did not produce the predicted
increase in errors, and therefore the disappearance of the facilitative effect found in the previous
experiment cannot be explained in terms of an overall increased difficulty encountered by subjects
in performing the task.7Neighborhood Activation Model (P. A. Luce & Pisoni, 1998).
49
cessing outcome. For instance, taking at face value the idea proposed by Vitevitch
and Luce (1999) that phonotactic probability is facilitative for sublexical processing
(due to higher frequency of subparts), but neighborhood density is inhibitory at
the lexical processing level (due to increased competition amongst candidate lexi-
cal entries) and adopting it in a classic two stage activation–selection framework,
the picture that would emerge would be the following: Input X comes in. Input
X has high phonotactic probability, and therefore it activates quickly a number of
candidate words. However, input X is also similar to lots of existing words in mem-
ory (i. e., it has high neighborhood density), and therefore its processing will be
inhibited by a large number of possible candidates. In this kind of model, it is com-
pletely irrelevant whether input X is a word or a pseudoword, and the processing
consequences at the identification level will be the same regardless of the input’s
lexicality. This is in fact the prediction made by NAM, and was what was found in
a lexical decision task by Vitevitch and Luce (1999, experiment 3). However, given
that facilitative effects were found for pseudowords only, two alternatives were avail-
able. One was simply to claim that auditory word repetition and the same–different
judgment task have different processing requirements either at post–identification
levels or parallel to the putatively automatic word identification procedures, and
that phonotactic probability affects processing only at those levels. In this case, the
theoretical implications of effects of phonotactic probability for theories of spoken
word recognition would only be of marginal interest, although they would be of im-
mense value in constraining theories of the experimental tasks in which phonotactic
probability effects are found. The other theoretical alternative would be to main-
50

tain that the locus of phonotactic probability would be indeed in pre–identification
stages, but its effect would be modulated by yet unspecified environmental influences
on word–identification procedures. In this case, effects of phonotactic probability
for theories of spoken word recognition would be highly relevant, because they could
be used to shed light directly on word identification routines. This is the theoretical
interpretation of the results favored by Vitevitch and Luce (1999), who invoked as
an explanatory framework an implementation of the Adaptive Resonance Theory
(ART) applied to the problem of spoken word perception (ARTPHONE, Grossberg,
Boardman, & Cohen, 1997).
Therefore, the debate surrounding any putative effect of phonotactic proba-
bility in word identification has two possible outcomes: (a) Phonotactic Probability
effects do influence some experimental tasks, but not at the lexical identification
level, and can therefore be ignored by word recognition models, or (b) Phonotactic
Probability does influence word identification, and therefore needs to be incorpo-
rated in current models of word recognition. Does the review of the literature
presented above allow us to draw any conclusions about which theoretical outcome
is best supported by the data? In order to answer this question, a more detailed
discussion of ARTPHONE relating it to the results it is supposed to explain is war-
ranted, given the strong explanatory power over the pattern of empirical findings
claimed by Vitevitch and Luce (1999).
According to ARTPHONE, word identification involves two different levels of
representation, each in a different memory system. The first is the representation
of input in Working Memory (WM), the second involves stored representations in
51

Short Term Memory (STM). In ARTPHONE terminology, WM representations are
called items, whereas STM representations are called lists or list chunks. Input
coming from sensory systems activates items in WM. Items then form excitatory
bidirectional connections with chunks in STM. Chunks in STM, however, only have
inhibitory connections amongst themselves. Specifically, (i) larger chunks inhibit
smaller ones if the latter are subsets of the larger chunks8, and (ii) chunks of the same
size inhibit each other. It is important to note that in ARTPHONE, list chunks are
not hierarchically organized, and there is no principled difference between words and
bundles of segments or even segments in isolation. All that is represented are chunks
of different sizes with their inhibitory wiring determined by their size (Grossberg
et al., 1997). The dynamics of the model work as follows: Incoming input [bæ. . . ]
will start by sequentially activating items [b] and [æ] in WM. These items will send
priming signals to STM representations, which in turn will start sending excitatory
expectation signals back to items in WM. The longer the chunk, the more activation
that chunk will need in order to send excitatory feedback signals to items in WM.
When expectation signals from STM list chunks match with items in WM, the
activation of these items in WM will become stronger, and therefore they will send
more powerful bottom up priming signals. The stronger the match from STM
chunks to WM representations, the stronger the feedback STM signal will be. This
excitatory feedforward–feedback loop is what is called a resonance in ARTPHONE.
In our example, list chunks in STM of small size (segment size, for instance) will be
the first ones to start sending excitatory expectation signals back to WM. The signals
8This kind of inhibition is called masking in ART.
52

sent back from STM list chunks [b] and [æ], will be the ones maximally matched
in WM, and these items therefore will establish stronger resonances at the onset of
processing. Over time, however, the increase in the strength of the priming signals
from the items in WM due to the early resonances will be sufficiently strong to cause
larger STM chunks such as [bæ] to start sending feedback excitatory signals to WM.
When these signals match WM items, resonances will be established, in this case
with STM chunk [bæ]. The larger STM chunk [bæ], now in a resonant state with
items in WM, will start inhibiting the subset chunks [b] and [æ], which will start
sending less excitatory feedback to the the items in WM, leading to the weakening
of the resonance between those chunks and items in WM. When the incoming signal
[bæN] has elapsed in its entirety, it will eventually activate the chunk [bæN] in STM,
creating a resonance. This newly activated chunk will start inhibiting STM chunks
[b] and [æ] and [bæ]. Over time, the network will reach a stable resonant state
between items [bæN] in WM and list chunk [bæN] in STM. This resonant state in
ARTPHONE constitutes the final speech percept.
How then do Vitevitch and Luce (1999) propose ARTPHONE account for the
peculiar finding of a facilitative effect of phonotactic probability for pseudowords,
but an inhibitory effect of neighborhood competition for words? By proposing that
(i) the largest STM chunks that pseudowords will activate will be sequences of
segments, and (ii) no single STM chunk will match the items activated by the
pseudoword in WM. By assuming the strength of the activation of STM chunks
to be dependent initially on frequency, Vitevitch and Luce (1999) claim that high
probability chunks will be activated more strongly, leading to stronger resonances
53

faster than low probability chunks. By assuming that there will be no single STM
chunk that will match the items activated in WM by the pseudoword, Vitevitch and
Luce (1999) claim that the effects of competition will be less intense.
There is a major problem with this interpretation of ARTPHONE, however:
Vitevitch and Luce (1999) seem to be introducing the notion of different levels
of representation in STM. In ARTPHONE, all that is represented are chunks of
different sizes. There is no distinction between lexical chunks that inhibit each other
and sublexical chunks that don’t. And yet, Vitevitch and Luce (1999)’s account
seems to be predicated on the idea that “sublexical” chunks won’t inhibit with each
other, at least not as strongly than “lexical” chunks. Given the architecture of
ARTPHONE, it is unclear that it can do what Vitevitch and Luce (1999) claims
it can, and therefore explain their results. In fact, when one takes into account
the amount of inhibitory connections of chunks in STM proposed by ARTPHONE,
it is clear that smaller chunks will receive much more inhibitory input from other
chunks than larger ones. Smaller chunks will not only share lateral inhibitory links
with chunks of the same size, but will also receive masking inhibitory links from
larger chunks of which they are a subset. Larger chunks, on the other hand, will
tend to have less masking inhibitory links, and will tend to have mostly lateral
inhibitory links. Given this architecture, it is not at all obvious that ARTPHONE
is able to accomodate the results Vitevitch and Luce (1998, 1999) report. This
particular issue was recently empirically investigated by Pitt, Myung, and Altieri
(2007). These authors were interested in whether ARTPHONE would be able to
generate the results reported by Vitevitch and Luce (1998), and if so, how it would do
54

it. The results of their simulation showed that ARTPHONE can indeed generate the
results from Vitevitch and Luce (1998), but only under very specific and constrained
arrangements of the parameter space of the model, and never as the most likely
pattern. More worrisome was the fact the specific configuration of the parameter
space that displayed the largest likelihood of generating Vitevitch and Luce (1998)’s
pattern of results (i) was totally unable to generate the standard neighborhood
competition effects for both words and pseudowords at the same time, which was
the result found in the lexical decision experiment reported by Vitevitch and Luce
(1999, experiment 3) and (ii) was in fact much more likely to generate the opposite
pattern of results from Vitevitch and Luce (1998), which is empirically unattested:
“Although it is reassuring that ARTphone can generate the empirical
pattern, it is somewhat disconcerting that this configuration of ART-
phone can also produce all of the other data patterns in the experi-
mental design except Pattern 1 [inhibitory effects for both words and
pseudowords]. In particular, that Pattern 7, which is the opposite of
the empirical pattern [facilitative effects for words, but inhibitory ef-
fects for pseudowords], is still the most stable suggests that the procliv-
ities of ARTphone have to be counteracted in order for it to perform
as listeners do. Together, these findings can cast doubt on ARTphone’s
suitability.” (Pitt et al., 2007, p. 69)
The results of the simulations by Pitt et al. (2007) therefore show that, con-
9From NIH–Author Manuscript
55

tra Vitevitch and Luce (1999), ARTPHONE does not actually accomodate their
results easily, if at all. If that is true, then the notion that phonotactic probability
has a pre–identification locus in lexical processing and should be included in word
recognition models becomes less tenable. On the one hand, it is not clear that the
theoretical framework invoked by Vitevitch and Luce (1999) in order to explain their
results and the putative role of phonotactic probability in word recognition is em-
pirically adequate. On the other hand, it is not clear that the pattern of results that
motivated the very notion of a facilitative effect of phonotactic probability in word
recognition (Vitevitch & Luce, 1998, 1999) is robust (see discussion above). If the
pattern is not robust, this could obviate the need for the theoretical commitment to
a role of phonotactic probability in word recognition.
In summary, there is no compelling empirical or theoretical reason to espouse
the view that phonotactic probability plays a role in online lexical retrieval for word
recognition. The existing results showing a facilitative role of phonotactic probabil-
ity in some behavioral tasks can very well be attributed to post–identification stages
of processing, possibly related to specific task demands. For instance, it has been
shown that 6–9 month babies can keep track of and represent phonotactic infor-
mation (Jusczyk et al., 1993, 1994; Saffran et al., 1996; Kajikawa, Fais, Mugitani,
Werker, & Amano, 2006). However, these babies do not have a lexicon. Therefore,
when it is shown that their performance in some experimental task is influenced by
phonotactic probability, it is highly unlikely that the source of the influence would
be claimed to be at the level of word recognition. This kind of result would more
likely just be taken to show that babies can represent, maintain in memory and use
56

phonotactic information in performing certain experimental tasks, such as word–
form segmentation from the speech stream. There is no reason that a similar kind
of explanation should not be used to account for the data from adults as well.
1.2.2.3 Subjective familiarity
There is a general paucity of experiments investigating the effects of subjective
familiarity in auditory recognition. Most studies try to match or control items
for their subjective familiarity rather than parametrically manipulate the variable,
using published norms (e.g. Nusbaum, Pisoni, & Davis, 1984; Stadthagen-Gonzalez
& Davis, 2006).
Subjective familiarity ratings have been shown to correlate better with fre-
quency counts based on spoken rather than written language samples (G. D. A. Brown,
1984), and to correlate even better with age of acquisition estimates (G. D. A. Brown
& Watson, 1987). In the same vein, Garlock et al. (2001) found that age of acqui-
sition effects, but not frequency effects, were found for auditory naming and gating
tasks for English speaking children and adults.
A number of studies assessed the specific role of subjective familiarity in audi-
tory word recognition. Connine et al. (1990) showed facilitatory effects of familiarity
in a lexical decision task for auditorily presented words equated in printed frequency
(and also showed frequency effects for auditorily presented words equated in their
familiarity ratings).
Gaygen and Luce (1998) collected familiarity judgments for three sets of words
57

that were in high, medium and low normative frequency and familiarity ranges.
The familiarity judgments were made upon either visual or auditory presentation
of the stimuli, in order to assess whether familiarity ratings would differ according
to modality of presentation. The same set of items was later presented to different
sets of participants in a visual and auditory lexical decision task. The results from
auditory lexical decision tasks were, for each normative frequency/familiarity bin,
significantly correlated with the collected familiarity ratings based on both visual
and auditory presentation.
Imai, Walley, and Flege (2005) reported a facilitative effect of subjective fa-
miliarity (but not normative frequency) in recognition scores for both native and L2
speakers of English.
However, Baumgaertner and Tompkins (1998) reported that a sample of older
normal adults failed to exhibit in an auditory lexical decision task any effect of famil-
iarity once the effects of frequency were partialled out. Interestingly, (Baumgaertner
& Tompkins, 1998) reported substantial effects of age of acquisition after the effects
of frequency were accounted for. This result seems to be at odds with the correla-
tional relationships reported by G. D. A. Brown (1984) and G. D. A. Brown and
Watson (1987) between subjective familiarity and frequency and between familiarity
and age of acquisition, but are in line with the empirical results from Garlock et al.
(2001). This could indicate that the two variables (subjective frequency and age of
acquisition) are in principle dissociable, and might have independent contributions
to lexical processing.
58

1.2.2.4 Morpheme frequency
As was discussed for the visual word recognition case, the word frequency
effect has been used as a diagnostic tool on how morphologically complex words
are represented and accessed. Much less research has been done in this topic on
auditory word recognition than in the field of visual word recognition. Meunier and
Segui (1999a), in a series of experiments using mophologically complex words in
French, reported both effects of surface frequency and effects of cumulative frequency
(the summed frequency of the stem and suffixes) in an auditory lexical decision
task. The effects of surface frequency were obtained when the cumulative frequency
was controlled, and the cumulative frequency effect was obtained when the surface
frequency was kept constant. This latter finding was recently replicated by (Hoen
et al., in press), also in French, both for prefixed and suffixed complex words.
1.2.3 Orthographic similarity effects in the visual processing of words
The average literate adult is estimated to know between 30.000 to 50.000 dif-
ferent words (Seidenberg & McClelland, 1990; Monsell et al., 1989). In cultures that
use alphabetic writing systems, all these words are represented by the concatena-
tion of a small number of building blocks (for instance, the English alphabet uses 26
letters). Given the large scale of the adult lexicon and the small scale of the basic
representational inventory that supports it (the alphabet), this means that every
written word will be to some extent similar in form with other words. However,
despite the potential for perceptual confusability, literate adults are remarkably fast
59

and precise in recognizing (reading) written words. For instance, in laboratory ex-
periments where participants can control the pace of sentences that are presented
word–by–word in a computer screen, the reading times of words are in the order of
300 ms, give or take 100 ms. Therefore, the main question in the study of lexical
access in reading is how can a single word be retrieved within a pool of 30.000 to
50.000 possible candidates, especially when every word is highly similar to other
words?
The proposed answer for this problem is that lexical retrieval normally oc-
curs in two stages. At first, sensory information activates a subset of likely candi-
dates, and then lexical selection happens within this candidate set. For instance,
search/verification models (Forster, 1976; Paap et al., 1982; Forster, 1992; Murray
& Forster, 2004) propose that sensory input will activate (via a hash function in
the serial search model; see Forster, 1992; Murray & Forster, 2004, for details) a
subset of the lexicon based on orthographic similarity, and then a proper search or
detailed verification will start within the candidate set, which is normally thought
to be ordered by frequency (see discussion in section 1.2.1.1). Parallel activation
models, on the other hand, propose that a set of lexical items will be activated
as a consequence of the activation of the input’s subparts, such as features or let-
ters (eg. Morton, 1969, 1979; Rumelhart & McClelland, 1981; Grainger & Jacobs,
1996), and then some mechanism will have to ensure that a selection will be made
amongst these partially activated words. In race models, such as the classic logogen
theory (Morton, 1969, 1979), selection happens as a function of activation levels: if
multiple words have been activated above the recognition threshold, the one with
60

the largest activation level “wins” and is recognized. In interactive–activation mod-
els, words have the property of laterally inhibiting other words as a function of their
activation. Put differently, evidence in favor a particular lexical item (in terms of
its activation level) will have the direct consequence of being evidence against all
other competitors. A word is recognized when its activation level rises above all the
others and is able to effectively inhibit them.
Thus, a common feature of all these recognition models is that, despite the
very different mechanistic proposals, visually similar words will compete for recogni-
tion. Since visual similarity is directly related to competition for recognition, words
that are similar to lots of other words will have to compete with them in order
to be recognized. This increase in competition will slow processing down. Serial
search/verification models (Forster, 1976; Paap et al., 1982; Forster, 1992; Murray
& Forster, 2004) will predict longer recognition times for words with high visual
similarity with other words because the size of the candidate set where search /
verification takes place is directly determined by orthographic similarity: higher vi-
sual similarity means larger candidate sets, which translates into longer search times
(because lexical search is serial), especially for lower frequency words (which will be
lower in the search list within the candidate set). Parallel activation models that
propose an “activation race” between word decision units, like the classic logogen
theory (Morton, 1969, 1979) will predict slower recognition because a strongly ac-
tivated word decision unit implies that the visual properties of the word are a good
match to the input signal, but if this word is visually similar to other words, this will
also mean that these other words will also have high activation levels (given that
61

activation is directly related with a good match between the input and the formal
properties of the word), which would make the “race” closer and harder to win.
Alternatively, a logogen–type of model could claim that as long as there is a winner,
the amount by which the race was won is irrelevant. In this case, the prediction
would be that visual similarity should have no impact whatsoever in recognition
times. Finally, parallel activation models positing lateral inhibition between words
will predict slower recognition times for words that are highly visually similar to
others because while they would be receiving similar activation from their subparts,
they would all be inhibiting each other at the lexical level, making it harder for a sin-
gle word to effectively emerge as the optimal candidate for recognition. Therefore,
as can be seen, a direct prediction of all these models is that visual similarity should
either be associated with a slow down in processing speed and a decrease in accu-
racy in visual word recognition, or, in one particular interpretation of race–models,
should have no effect at all.
A first test of this prediction was reported by Coltheart et al. (1977). These
authors operationalized the concept of visual similarity by proposing the notion
of orthographic neighborhood (ON). The ON of a given letter string is composed
by all existing words of the same orthographic length that share with it all but
one letter, and is computed by counting their number. This measure became, in
the visual word recognition literature, the de facto metric of visual similarity, and is
commonly referred to both as ON or Coltheart’s N (sometimes simply N). Using ON
as their metric of visual similarity, Coltheart et al. (1977) found no effect of visual
similarity in a lexical decision task for real words, but reported an inhibition in the
62

classification of nonwords. The authors interpreted this effect as being evidence for
a logogen–type model in which word decision units are activated based solely on
goodness of fit with the input, and act independent of each other, with the single
most active unit “winning” the recognition process. The inhibitory effect of ON
found for nonwords was attributed to a putative decision mechanism influenced by
overall word decision unit activation.
However, twelve years later, Andrews (1989) reported an experiment cross-
ing two levels of lexical frequency (high vs low) and two levels of ON (dense vs
sparse) in a full factorial design. In both naming and lexical decision tasks, ON
was found to affect RT latencies, but contrary to the inhibitory effect reported for
nonwords by Coltheart et al. (1977) and predicted by virtually all word recognition
models, Andrews (1989) reported that RT and accuracy performance were better
for words in dense neighborhoods. This effect was found for both high and low
frequency words in the naming task, but only for low frequency words in the lex-
ical decision task. In the same year, (Grainger, O’Regan, Jacobs, & Segui, 1989)
reported an experiment where both the number of neighbors (ON) and their fre-
quency composition was manipulated. In both a lexical decision task and a reading
experiment using eye–tracking, performance was slowed down when stimuli had at
least one high–frequency neighbor, irrespectively of ON size. This apparent contra-
diction between empirical findings led to a series of further investigations that were
exhaustively summarized by Andrews (1997). Table 1.2 is adapted from Andrews
(1997), focusing only on the results from lexical decision experiments. Our deci-
sion to focus exclusively on results from lexical decision experiments is motivated
63

by a number of reasons. The other tasks that have been used to investigate the
mechanisms of lexical retrieval all suffer from serious problems of interpretation.
Perceptual identification has been shown to be sensitive to several sophisticated
strategic effects (eg. Massaro, Taylor, Venezky, Jastrzembski, & Lucas, 1980) and
completely opposite results can be found for the same set of materials depending on
the paradigm that is used (eg. Grainger, Carreiras, & Perea, 2000). Naming (from
print input) is a task fraught with technical difficulties (Rastle & Davis, 2002),
and in which lexical access is not a necessary step for successful completion, which
means that lexical retrieval can sometimes be bypassed altogether (Andrews, 1997),
turning naming (from print) latencies into a potentially unreliable index of lexical
activation. Semantic categorization tasks normally elicit contradictory results (cf.
Forster & Shen, 1996; Carreiras, Perea, & Grainger, 1997; Sears, Lupker, & Hino,
1999) and is particularly prone to influence of strategic effects (Balota & Chumb-
ley, 1984, 1990; Monsell et al., 1989). In contrast, lexical decision, although not
impervious to task–specific strategic effects, is a relatively well understood task (eg.
Balota & Chumbley, 1984, 1990) that has given consistent results over time, and
is now by far the most widely used experimental task in visual word recognition.
Finally, it was the task used in all experiments reported in this dissertation, and
therefore a detailed review of past results is necessary to ground the experimental
results obtained in our studies.
In her review, Andrews (1997) concluded in general that (i) the size of the
orthographic neighborhood (ON) has facilitative effects in the performance of the
64

Table 1.2: Summary of empirical investigations of the effects of Orthographic Neigh-borhood structure (From Andrews (1997)). Lexical Decision data only.
Neighborhood NeighborhoodPaper Experiment/Conditions Size Effect Frequency Effect
Experiments in English
Andrews (1989) Exp. 1, 2 Facilitationa —Andrews (1992) Exp. 1 Facilitationa —
Exp. 3a / N blocked Facilitation InhibitionColtheart et al (1977) Exp. 2 Null —Forster & Shen (1996) Exp. 1a, 2a, 3a Facilitation NullHuntsman & Lima (1996) — InhibitionJohnson & Pugh (1994) Exp. 1a, 3a / Legal NW, N blocked RT: Inhibition
Errs: Facilitation —Exp. 2a, 3a / Illegal NW Facilitation —Exp. 4a / N mixed Facilitation —Exp. 5 / Legal NW, N blocked Inhibition —Exp. 6a / Legal NW, N blocked Facilitation —
Michie et al (1994)e Facilitation —Perea & Pollatsek (1997) — InhibitionSears et al (1995) Exp. 1 Facilitation Null
Exp. 3A Facilitationa —Exp. 4Aa, 6a Facilitation FacilitationExp. 5 / High N NW only Facilitation Null
Experiments in languages other than English
Carreiras et al (1997) Exp. 2a Null InhibitionGrainger et al (1989) Exp. 1 — InhibitionGrainger (1990) Exp. 1 — InhibitionGrainger et al (1992) Exp. 1, 2 — Inhibitionb
Grainger & Jacobs (1996) Exp. 1B / High N NW Null Inhibitionc
Exp. 1C / Low N NW Facilitationd Inhibitionc
Exp. 1D / High N NW Facilitationd NullaOnly low-frequency stimuli included or effect significant only for low-frequency words. bInhibitionsignificant for items with neighbors at the 4th but not the 2nd position of 5-letter words. cSignificantonly for words from small neighborhoods. dSignificant only for items with higher frequency neigh-bors. eUnpublished study.
65

lexical decision task10 (as can be observed from Table 1.2), with stronger effects for
low–frequency words and (ii) the frequency of orthographic neighbors might affect
performance in the LDT in what seems to be task– and (possibly) language–specific
ways, with French, Spanish and Dutch experiments reporting the majority of the
inhibitory effects, and English ones showing little evidence either way.
The fact that reliable facilitative effects are found for ON poses a major prob-
lem for most existing visual word recognition theories, especially parallel activation
theories that posit lateral inhibition as the implementation of lexical selection within
the candidate set. This pattern of results is exactly the opposite of what they would
predict.
However, a later review article (Perea & Rosa, 2000), focusing on more recent
findings, called into question the major conclusion from Andrews (1997)’s paper that
no inhibitory effects of neighborhood could be obtained. Perea and Rosa (2000) re-
ported two studies done in English in which inhibitory effects of relative neighborhood
frequency11, ie. the presence of words of higher frequency in the neighborhood of
the word in the input, were observed on eye–fixation in natural reading (Perea &
Pollatsek, 1998; Pollatsek, Perea, & Binder, 1999) and in lexical decision RT la-
tencies (Perea & Pollatsek, 1998). Together with Huntsman and Lima (1996, see
table 1.2), Perea and Rosa (2000) concluded that there was enough evidence for
inhibitory neighborhood frequency effects both in English and other languages to
lend support to standard competitive parallel activation models (like the classsic
10The same conclusion was drawn for naming.11Also referred to as neighborhood frequency
66

interactive activation model describe by Rumelhart & McClelland, 1981).
Given the conflicting accounts in the literature even after two major review
articles (Andrews, 1997; Perea & Rosa, 2000), and the theoretical relevance of es-
tablishing what role, if any, visual similarity plays in visual word recognition (com-
petitive parallel activation models are by far the most influential kinds of models of
reading, and they all predict that visual similarity should induce increase competi-
tion for recognition, and therefore should inhibit processing), we conducted a new
literature review focusing on papers published after 1997 (ie., after Andrews, 1997)
in which lexical decision data was reported. The results are shown in Table 1.3.
Two variables were tracked: ON Size refers to the number of words in the visual
neighborhood, ON Frequency refers to whether or not at least one neighbor was of
higher frequency than the input. Unlike Andrews (1997), we decided to also track
the effects of ON size for pseudowords, since a number of experiments reported this
information.
As can be clearly seen in Table 1.3, the effects of orthographic neighborhood
size (ON) is overwhelmingly reported as facilitative in the lexical decision task.
Facilitative effects for words are reported in 17 out of 21 studies manipulating the
ON size for words (ie. 81% of the time). Only two studies out of the 21 reported
a null effect of ON size in the LDT. However, 4 out of 21 studies did report an
inhibitory effect of ON size, but only for high frequency words, and 2 of those also
reported facilitative effects for low frequency words (the standard finding according
to Andrews, 1997). Only one study out of 21 reported an overall inhibitory effect,
and it used a non–standard N metric. These results largely confirm the conclusion
67

Table 1.3: Summary of empirical investigations of the effects of Orthographic Neigh-borhood structure since Andrews (1997). Lexical Decision data only. Unless depen-dent measure is mentioned, results refer both to RT latencies and accuracy rates.
Experiment/ Words Words PseudowordsPaper Condition ON Size ON Freq. ON Size
Experiments in English
Balota et al (2004) Young adults Facilitationa — InhibitionInhibitionb — —
Chateau & Jared (2000) Facilitationa,n — —Davis & Taft (2005) Exp. 1 — — Inhibitiono
Exp. 2 — Inhibitiono —Ferraro & Hansen (2002) Facilitationk Null —Holcomb et al (2002) Exp. 1 Facilitationa — InhibitionHuntsman & Lima (2002) Exp. 1 RT: Facilitation Nullb —
Exp. 2 Facilitation Nullc —Lavidor & Ellis (2002) Exp. 1 Facilitationi — —Lavidor & Walsh (2003) Facilitationf — —Lavidor et al (2004) Exp. 1 Facilitationf — Nullf
Perea et al (1998) Exp. 1e — Inhibitiona,g —Pollatsek et al (1999) Exp. 1e Facilitation Inhibitionj —Sears et al (2006) Exp. 1Ae,a — RT: Inhibitiona,b,c —
Exp. 1Ba — Null —Exp. 2Ae — Null —Exp. 2B — RT: Facilitationa —
Siakaluk et al (2002) Exp. 1Ae Facilitationa Facilitationa —Exp. 1Be Facilitationa Facilitationa —Exp. 1Ce Facilitationa Facilitationa InhibitionExp. 1De Nulla Nulla —
Inhibitionb Facilitationb
Exp. 1D-bisl Facilitationa not reported —Exp. Im Inhibitionb — —Exp. IIm Nulla — —Exp. 2A — (controlled) RT: FacilitationExp. 2B — (controlled) RT: Facilitation —
Whitney & Lavidor (2005) Exp. 2 RT: Facilitation — —Ziegler & Perry (1998) Exp. 1 Facilitationh — —
Exp. 2 Inhibitioni — —
Experiments in languages other than English
Perea & Rosa (2002) Exp. 1 Facilitationa — RT: InhibitionExp. 2 Facilitationa — RT: Inhibition
Inhibitionb
Arduino & Burani (2004) Exp. 1 — — NullaOnly low–frequency stimuli included or effect significant only for low–frequency words. bOnlyhigh–frequency stimuli included or effect significant only for high–frequency words. cAveragecontrolled; all less frequent than target. dAverage controlled; some more frequent and some lessfrequent than target. eDifferent instructions from standard LDT: Stress Accuracy over Speed.fMore Lead-Neighbors compared to Few Lead-Neighbors. gHigher frequency neighbor always byinterior letter change (spice - space). hBody neighbors only. iNon-body neighbors only. jSignificantin multiple regression post-hoc test. kOnly for unambiguous words with many High FrequencyNeighbors. lReported in footnote 5 in the original paper. mReported in footnote 7 in the originalpaper. nSame words used by Andrews (1992). oEffect due to Deletion Neighbors.
68

by Andrews (1997) that ON size does play a facilitative role in the lexical decision
task.
When it comes to orthographic neighborhood frequency, only 4 studies out of
17 studies done in English that manipulated that variable reported inhibitory effects.
One of them used a non–standard N metric (Davis & Taft, 2005), and the other three
used non–standard lexical decision instructions, explicitly stressing accuracy over
speed (Perea & Pollatsek, 1998; Pollatsek et al., 1999; Sears, Campbell, & Lupker,
2006, exp. 1A). Six out of 17 studies reported a facilitative effect of orthographic
frequency and another six out of 17 studies reported a null effect of orthographic
neighborhood frequency. Again, these results seem to largely confirm the conclusions
made by Andrews (1997) that the effects of neighborhood frequency are at best task–
specific and not cross–linguistically robust. In this new sample, there is as much
evidence for a facilitative effect as there is for a lack of effect, and all the evidence of
neighborhood frequency inhibition comes from studies where either non–standard
N metrics were used or non–standard instructions were given, which suggests that
this variable interacts with specific task demands rather than with lexical retrieval
per se.
Interestingly, the most robust finding in this review was the effect of ON
size on pseudowords, which was uniformly inhibitory: Six out of six experiments
reporting this manipulation for pseudowords reported inhibitory effects, and all of
them reported simultaneous facilitative effects for words for the same manipulation.
Therefore, after an extensive review of the literature, the data regarding the
effect of ON size and ON frequency seems well established: ON size plays a facil-
69

itative effect in the LDT for words and an inhibitory effect for pseudowords. ON
frequency, on the other hand, seems to interact with specific task demands and
linguistic environments, and there is little evidence of a consistent facilitatory or in-
hibitory effect in English. The overwhelming evidence in favor of facilitative effects
of ON size coupled with a conspicuous absence of reliable inhibitory effects of other
similarity variables (such as neighborhood frequency) constitute a major empirical
problem for competitive parallel activation models.
How can these facilitative effects be accounted for? A solution that has been
proposed and seemed to gather some support (Grainger & Jacobs, 1996; Andrews,
1997; Perea & Rosa, 2000) tries to explain the effects in terms of the specific de-
mands of the lexical decision task. The general idea is that accurate discrimina-
tion/classification does not necessarily require unique identification. Two different
kinds of accounts are in principle possible: An error account (for search models)
and a global familiarity account (model–neutral).
Explaining facilitative N effects: Search Model
Serial–search models (Forster, 1976, 1992; Murray & Forster, 2004) presup-
pose two things: (i) Candidate sets are ordered by frequency and (ii) Search within
each set is sequential. The standard frequency effect is explained by lower frequency
words taking longer to be verified and selected due to their position at the bottom of
the search list. In principle this model cannot account for any facilitative N effect,
unless some assumptions are relaxed or changed. For instance, suppose that the
search / verification mechanism, although fairly precise, makes mistakes from time
70

to time. These mistakes can be of two kinds: It fails to select the right entry, or
it selects the wrong entry. Suppose further that rate in which these errors occur
is constant. What happens when the input is a low frequency word from a dense
neighborhood? A somewhat large candidate set is accessed based on some notion of
visual similarity (although see Murray & Forster, 2004, p. 735, for arguments that
bin sizes should be equal), and the entry corresponding to the input word, being of
low frequency, will be placed at the bottom of the list. The search within the candi-
date set then starts and proceeds in a serial fashion. Since the set is large, there will
be a higher probability of selection error than if the set was small. Furthermore,
the probability of a false positive will be much higher than the probability of a
miss (failed selection), simply because there will be CandidateSetSize− 1 chances
for a false positive to occur, but there will always be only one chance of a miss,
regardless of set size. What happens in case there is a false positive? A recognition
response would be generated and a “word” response would be given. Even though
the response was due to a mistake, it will be coded as a correct response by the
experimenter and the RT, which would be that of a higher frequency word (hence
faster) would be saved. What happens in the case of a miss? The candidate set
will be exhausted and no response will be found, eliciting a “nonword” response.
Note however that the likelihood of this error occurring is constant across all words,
regardless of frequency or neighborhood composition. Therefore not only the likeli-
hood of each error is different, but their outcomes are very asymmetrical.
With this in mind, what happens when a low frequency word coming from a
sparse neighborhood is to be recognized? In this case, the number of comparisons
71

that will be necessary for a match to occur will be small, not because the entry
corresponding to the input will be at the top of the candidate set list (as it would
be in the case of a high frequency word), but simply because the candidate set will
be smaller. Therefore, the likelihood of errors occurring will be correspondingly
smaller. This means that there will be less chances that a higher frequency word
would be mistakenly selected, reducing the proportion of spurious RTs that are due
to faulty lexical access.
What happens in the case of high frequency words? Since this word will be
higher in the search list, the possibilities of a mistake will be lower: There will be
less chances for an error to occur simply because there will be fewer comparisons
necessary for establishing a match. Therefore, there will be much less chances that
a higher frequency word will be wrongly selected before the correct comparison is
attempted, reducing the proportion of spurious faster RT due to faulty access.
Finally, what happens in the case of pseudowords? A correct “nonword” re-
sponse would only be possible after the exhaustive search of the candidate set. When
the candidate set is large, it will take longer to exhaustively search it than when
the set is small. Therefore, there is a natural tendency for N size to slow down pro-
cessing. Moreover, in larger sets, the likelihood of selection errors would be larger.
Pseudowords are only subject to one kind of error: false positive. A false positive for
a pseudoword would result in a “word” response, and would be coded as an error.
Therefore, both a processing slow down and lower accuracy would be predicted for
pseudowords of high N size.
In summary, just by positing a fixed error rate in the selection mechanism, one
72

would expect that, by chance alone, low frequency words with lots of neighbors would
have the highest proportion of unusually fast RTs due to spurious lexical access. As
far as the experimenter is concerned, however, this tendency will look exactly like
a facilitative effect of neighborhood size for low frequency words alone. Moreover,
this explains the inhibitory N effects found for pseudowords as well. However, this
account does not explain the trend that high frequency words have of displaying
inhibitory N effects (see Table 1.3).
Explaining facilitative N effects: Global familiarity
Keeping with (Balota & Chumbley, 1984, 1990)’s proposal of a familiarity–
based strategic component affecting performance in the lexical decision task, some
researchers have proposed that the facilitative N effects observed in this task are
explainable by a similar, or perhaps even the same, mechanism (eg. Perea & Rosa,
2000).
Balota and Chumbley (1984, 1990)’s proposal to explain the inconsistent find-
ings about the frequency effect across different tasks was that strong frequency effects
are found in lexical decision tasks not because higher frequency words are accessed
faster, but because their higher familiarity allows them to be quickly classified as
“word” without need for precise lexical identification. These findings received em-
pirical support from a variety of studies, beginning with Gernsbacher (1984, see
section 1.2.1.3 for more discussion), who was able to demonstrate that subjective
familiarity was able to explain all the conflicting results due to sublexical frequency
in the visual domain, and culminating with Balota et al. (2004)’s finding in a mega
73

study that familiarity was a much better predictor of RT latency in the lexical de-
cision task than was lexical frequency. It is not clear precisely what “subjective
familiarity” is, and this variable is normally interpreted as being a composite of dif-
ferent sources of information: Gernsbacher (1984)’s study suggests that subjective
familiarity subsumes to some extent sublexical frequency, and Balota et al. (2004)’s
results suggests that it also subsumes to some extent lexical frequency. It might very
well be the case then that the same variable might subsume lexical neighborhood
size. In the auditory modality, Bailey and Hahn (2001) showed that wordlikeness, a
subjective measure of phonetic sequence typicality, was influenced by both phono-
tactic probability and neighborhood density. Therefore, it is not implausible to
think that the same would hold for words in the visual domain. It is not difficult to
imagine that orthographic neighborhoods could be related to the notion of ortho-
graphic typicality, which in turn could be a dimension that is strategically exploited
in the lexical decision task to quickly classify the stimuli as “word” or “not word”
without relying exclusively on exhaustive lexical search and identification.
In this view, higher orthographic similarity would mean that the input looks
like a lot of other words (it is very word–like), which could serve as the basis for
a quick “word” response in the LDT. This account then proposes that, all else
being equal, higher neighborhood size would mean higher familiarity, which in turn
seems to determine a fast “word” response in the LDT independently of precise
lexical identification. In the case of already highly familiar high frequency words,
this might not make a difference, but when it comes to less familiar lower frequency
words that would require precise lexical identification for a “word” response, a boost
74
in familiarity due to higher orthographic typicality might change their response
criterion. This would explain the prevalence of N size effects for low frequency
words.
In fact, at least one computational model of word recognition of the interactive
activation family (Grainger & Jacobs, 1996) propose two ways in which a “word”
response might be obtained. One would be through the regular identification route,
in which N size and frequency might play inhibitory roles due to the lateral inhibition
architecture of the system. Another way would be through the monitoring of overall
lexical activation through the network. Words in denser neighborhoods will cause
widespread lexical activity, and if this source of information is tracked and crosses
a threshold, then a “word” response might be output before lexical competition
determines a uniquely identified winner.
This mechanism would also predict the inhibitory effects of N on pseudowords,
given that pseudowords in dense neighborhoods will be more word–like, and might
change the response criterion by requiring that an exhaustive lexical search be per-
formed before a “not word” decision is reached.
Discussion
In summary, the overall picture that emerges is that, contary the predictions
from most reading models, N size has consistent facilitative effects in the lexical
decision task. Effects of N frequency, on the other hand, seem to vary within and
across tasks and languages, and have been proven to be hard to obtain.
This fact poses a major problem for theories that propose lateral inhibition
75

as a way of ensuring lexical identification in parallel activation models. No current
word recognition model can account for this pattern of results in terms of lexical
access routines. However, several researchers propose instead that this pattern of
findings only shows that lexical decision results must be interpreted carefully and
might not represent an accurate index of lexical access processes, rather reflecting
aspects of post–access decisional routines (Balota & Chumbley, 1984, 1990).
1.2.4 Phonological similarity effects in the auditory processing of
words
The abstract problem identified in the previous section (1.2.3) involving the
recognition of written words hold also for the recognition for spoken words. The
average adult has a vast lexicon of several tens of thousands of words, and yet
this knowledge database is structured around a small inventory of representational
units, called segments12 (Goldinger et al., 1989). Therefore, the same issues relat-
ing to efficient retrieval amongst numerous potentially confusable items in memory
that were identified with recognition of written words also apply to spoken word
recognition (P. A. Luce & Pisoni, 1998).
Likewise, the same solution offered to the problem of similarity in written word
recognition was also offered to the problem of recognizing spoken words. Two of the
most influential models of spoken word recognition, the Cohort Model (Marslen-
12According to most phonological theories, segments are not atomic units, but have internal
structure and are therefore not the most fundamental unit of representation in the lexicon, but
most research in speech perception ignores subsegmental information in their models.
76

Wilson, 1987a), and the Neighborhood Activation Model (NAM, P. A. Luce &
Pisoni, 1998; Goldinger et al., 1989) propose a two–stage access solution to lexical
retrieval. In both of these models, acoustic input first activates a set of possible
lexical candidates, which will then be evaluated until the identity of the stimulus
can be determined.
In the Cohort Model, the set of candidates is selected on the basis of acoustic–
phonetic consistency with the input. Word onsets have a privileged status according
to this model, because it is the onset that will determine the initial set of lexical
candidates (the cohort). In other words, once the onset of the stimulus is identified,
only words that match said onset will be activated. As more bottom–up senso-
rial information flows in and more of the phonetic structure of the input becomes
available, the initial cohort will progressively shrink in size, given that initial candi-
dates that are not consistent with the input will be eliminated from the candidate
set. Recognition happens at the point in which only one candidate remains consis-
tent with the input stimulus (called alternatively the uniqueness point or divergence
point). The size of the cohort can also be modulated by top–down information. For
instance, sentential information might eliminate certain candidates from the cohort
based on their lack of fit within the local context.
The Cohort Model makes two crucial claims, both of which have been em-
pirically disputed. The first is that the size of the set of competitors should not
necessarily influence retrieval, since lexical candidates are not actively competing
with each other, but rather they are being activated to different degrees by the
input, and parallel–activation is done at no cost by the processing system. The
77

second claim is that the initial set of lexical candidates should be primarily de-
termined by the onset of the input. The first initial cohort is supposed to be the
primary decisional space in which selection occurs; other words that match the in-
put in non–onset positions should not under normal circumstances be included in
the candidate set even if they provide a good match to the phonetic structure of
the input when the onset is ignored (no late entry in the candidate set). Both of
these claims have had some empirical support (see Marslen-Wilson, 1987a, for re-
view), but have more recently been directly challenged. For instance, (P. A. Luce &
Pisoni, 1998) have reported that the competitor set size, even when the uniqueness
points of the stimuli are controlled, plays an important factor in lexical retrieval,
with larger competitor sets having demonstrably inhibitory effects in performance
on the perceptual identification, lexical decision and auditory naming (or shadow-
ing) tasks. Moreover, Newman, Sawusch, and Luce (2005, experiment 2), building
on the earlier findings of competitor set size effects, have shown effects of lexical
competition on the processing of nonwords that could only be due to words that
were not members of the the onset–matching cohort. The authors presented one
group of subjects with two groups of nonwords that had overall the same degree
of lexical similarity, but differed in the amount of onset–matched neighbors they
possessed (their initial cohort). Newman et al. (2005) predicted that if onsets re-
ally have a privileged role in determining the set of lexical candidates for processing,
then one should expect to find similar effects of competitor set size to those reported
by P. A. Luce and Pisoni (1998) for the two groups of nonwords, since they differed
only in their initial cohort size. However, if onsets do not play a privileged role
78

in determining the size of the competitor set, then no effects of candidate set size
should be observed for the two groups of nonwords, given that they are matched
for their overall lexical neighborhood size. Another group of subjects was given two
different sets of nonwords, which were matched for their cohort size (onset–matched
neighborhood size), but varied in their overall lexical neighborhood size. Newman
et al. (2005) predicted that the results from this group should be the mirror image
of the results from the first group. If onsets are the main determiners of candidate
set size, then here no effects of set size should be observed, since the cohort size
has been matched in the two sets of items. Conversely, if overall similarity is the
main determiner of the candidate set size, then effects of competition should be ob-
served, given that the stimuli were varied in their overall lexical neighborhood size.
The results from the study were that when overall neighborhood size was controlled
(first group), no effects were seen in reaction time latencies in the lexical decision
task, even though the cohort size was explicitly manipulated. When cohort size
was matched but overall neighborhood size was manipulated (second group), on the
other hand, inhibitory effects in RT in the lexical decision task were observed for
the set of nonwords with higher neighborhood size.
Taken together, the results from P. A. Luce and Pisoni (1998) and Newman
et al. (2005) seem to suggest that (i) words compete for recognition (cf. inhibitory
effects of candidate set size based on formal similarity) and that (ii) the decisional
space in which lexical selection occurs is defined not by an onset–matched lexical
cohort but by a more general notion of overall similarity in which onsets do not have
a privileged role. These two set of results are also consistent with central claims
79

made by the Neighborhood Activation Model (NAM; see P. A. Luce & Pisoni, 1998;
Goldinger et al., 1989).
The NAM posits that spoken word recognition proceeds in the following way:
First, the input speech signal activates acoustic–phonetic patterns in memory. These
patterns, in turn, activate in parallel a number of decision units (like in the classic
Logogen model by Morton, 1969). These decision units also monitor information
(such as lexical frequency) coming from higher lexical levels in long term memory
but also any contextual information present in short term memory that might be
relevant to establishing the lexical identity of the input signal. Moreover, the word
decision units monitor the overall activity in the system of units and the activation
level of their corresponding acoustic–phonetic patterns. On the basis of these sources
of information, they continually compute decision values. Given that each decision
unit monitors both specific acoustic–phonetic activation and system–wide lexical
activation, decisions about the identity of the stimulus are akin to detecting a specific
signal in a noisy environment. For instance, if a specific acoustic–phonetic pattern
strongly activates a specific word decision unit (call it unit x) while simultaneously
activating several other decision units, the specific activation of x will be evaluated
relative to the total lexical activation. If the “background” lexical activation is also
large, then even strong bottom–up activation might not be enough to make the
decision unit x cross the decision criterion. In other words, it is not the absolute
bottom–up activation received by a decision unit that determines whether the unit
outputs a decision about the identity of the input signal, but the relative activation
compared to other decision units.
80

The most direct consequence of NAM is that similarity across lexical items
will generate larger candidate sets, which in turn will generate more lexical compe-
tition for recognition. Therefore, according to NAM, similarity will have, in most
situations, inhibitory effects on lexical access.
Quantification of acoustic–phonetic similarity amongst lexical items has been
operationalized in mainly two ways in the literature. Some researchers (e.g. Goldinger
et al., 1989) derive a similarity measure based on psychophysical data (confusion
matrices of individual segments collected for a number of experimental subjects, for
instance). Others have quantified similarity in terms of edit distance13 of size 1 on
phonetic transcriptions; any words that can be matched by the addition, deletion
or substitution of a single segment to a given string are said to be similar to the
string. This metric, although admittedly coarse (see P. A. Luce & Pisoni, 1998),
is easier to compute on machine readable corpora (Greenberg & Jenkins, 1964, are
credited with the first proposal for this similarity metric for speech research), which
are commonly readily available to researchers.
Inhibitory effects of similarity in the recognition of spoken words have been
reported using both kinds of similarity metric in a number of experiments across a
range of different tasks, such as perceptual identification (eg. Goldinger et al., 1989;
Cluff & Luce, 1990; P. A. Luce & Pisoni, 1998), lexical decision (P. A. Luce & Pisoni,
1998; Vitevitch & Luce, 1999; Newman et al., 2005) and auditory naming (P. A. Luce
& Pisoni, 1998; Vitevitch & Luce, 1999), which demonstrates that NAM enjoys well
grounded empirical support.
13also known as Levenshtein distance.
81

However, a closer inspection of the literature reveals that the effects of lexical
similarity in the processing of speech are in fact not as reliable as previously thought.
In fact, lexical similarity displays disparate effects across tasks, across materials and
even across languages, directly calling into question models that propose lexical
competition as a means of implementing selection amongst a set of candidate items,
such as NAM. Table 1.4 summarizes a number of studies focusing on the effects of
lexical similarity in tasks classically used in spoken word recognition research.
1.2.4.1 Similarity effects across tasks in English
The general finding that lexical similarity has inhibitory effects on lexical pro-
cessing finds some challenges in the auditory naming task, in which disparate results
are found according to whether or not the stimuli used are real words or pseudowords
and according to the similarity metric used.
Although auditory naming (also referred to as shadowing, or repetition) of
words has shown inhibitory effects of neighborhood size (Vitevitch & Luce, 1998,
experiment 1), it has failed to show inhibitory effects of neighborhood frequency14
14The term neighborhood frequency is used rather loosely in this context. This is because
different researchers have focused on different aspects of the frequencies of the neighbors. For
instance, P. A. Luce and Pisoni (1998) and Vitevitch and Rodrıguez (2005) manipulated the
mean neighborhood frequency of their items, whereas Newman et al. (2005) have manipulated
the frequency–weighted neighborhood density of their items, while Mousty, Radeau, Peereman, and
Bertelson (1996) and Dufour and Frauenfelder (2007) have manipulated the presence and number
of higher frequency neighbors within their items’ neighborhoods (a metric that is commonly used
in the orthographic neighborhood literature).
82

Table 1.4: Summary of empirical investigations of the effects of Phonological Neigh-borhood (PN) structure on speech perception. Unless dependent measure is men-tioned, results refer to both reaction time latencies (RT) and error rates (ER). Grayindicates studies in languages other than English.
Words PseudowordsPaper Experiment PN Size PN Freq. PN Size PN Freq.
Perceptual Identification Task
Goldinger et al (1989) E. 1A, 1B, 2 Inhibit.a,b — — —Cluff & Luce (1990) E. 1, 2, 3, 4 Inhibit.a,b — — —Luce & Pisoni (1998) E. 1 Inhibit. Inhibit. — —Amano & Kondo (1999) E. 2 ER: Inh.c — — —Amano & Kondo (2000) E. 2 ER: Inh.c — — —Dufour & Frauenfelder (2007) Inhibit. Inhibit. — —
Auditory Lexical Decision Task
Luce & Pisoni (1998) E. 2 RT: Inh.e RT: Inh. RT: Inh.f RT: Inh.ER: Fac.d ER: Inh. ER: Inh.f ER: Inh.g
Vitevitch & Luce (1999) E. 3 Inhibit. — Inhibit.j —E. 5i Facilit.k — Facilit.k —
Inhibit.l — Inhibit.l —Newman et al (2005) E. 1 — — ER: Inh. ER: Inh.
E. 2 — — RT: Inh. RT: Inh.Amano & Kondo (1999) E. 1 Null — — —Amano & Kondo (2000) E. 1 Null — — —Ziegler et a (2003) E. 1 Inhibit. — — —Mousty et a (1996) E. 1h — Null — Inhibit.Vitevich & Rodrıguez (2005) Facilit. Facilit. — —
Auditory Naming Task (also referred to as Shadowing or Repetition)
Vitevitch et al. (1997) E. 2i — — Facilit.m —Vitevitch & Luce (1998) E. 1j Inhibit. — Facilit.m —Vitevitch & Luce (1999) E. 4i Facilit.k — Facilit.k,m —
Inhibit.n — Facilit.l,m —Luce & Pisoni (1998) E. 3 RT: Inh. RT: Null — —
ER: Inh.i ER: Null — —Yoneyama & Johnson (2001) Facilit. — — —Mousty et a (1996) E. 2h — Null — NullZiegler et a (2003) E. 3A Inhibit. — — —
aPN defined by confusion matrices of segments. bNo phonetic overlap. cOffline id. task. dOnlylow–frequency (LF) stimuli included or effect significant only for LF words. eOnly high–frequency(HF) stimuli included or effect significant only for HF. fOnly high neighborhood frequency (HNF)stimuli included or effect significant only for HNF. gOnly high neighborhood density (HND) stimuliincluded or effect significant only for HND. hCohort neighbors only. iBisyllabic stimuli. jDurationbiased: DN shorter than SN. kWhen 1st syllable is from DN. lWhen 1st syllable is from SN.mAttributed to Phonotactic Probability.
83
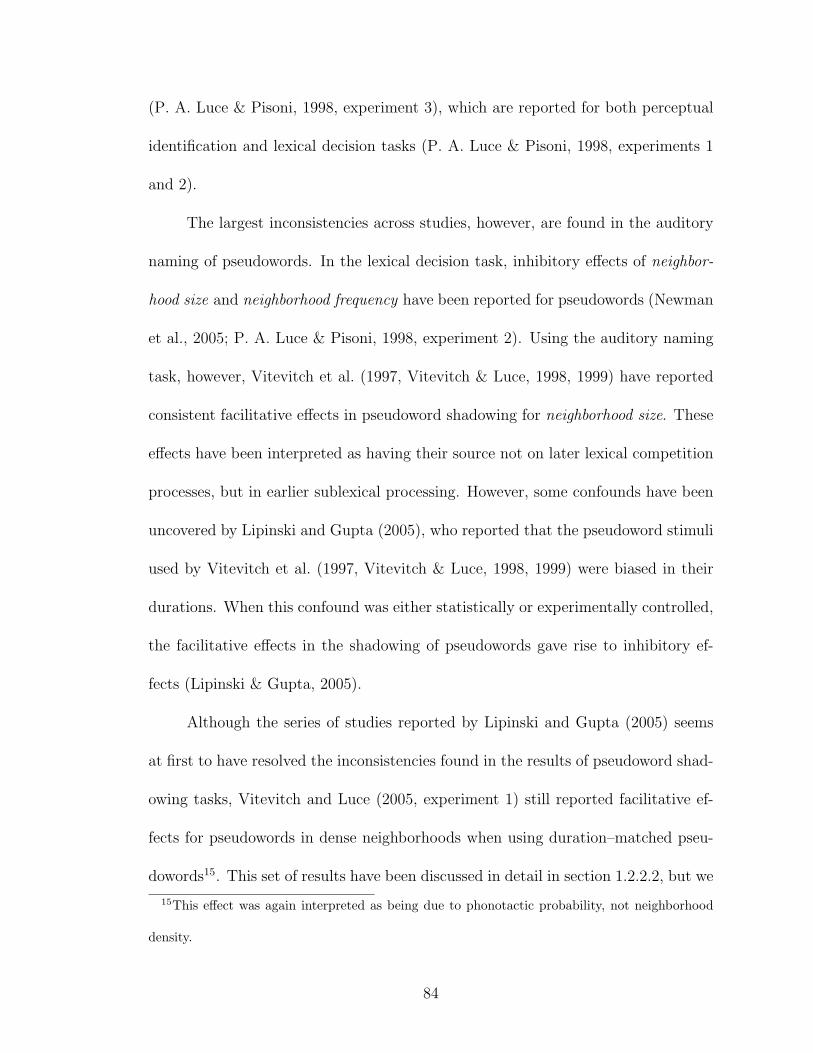
(P. A. Luce & Pisoni, 1998, experiment 3), which are reported for both perceptual
identification and lexical decision tasks (P. A. Luce & Pisoni, 1998, experiments 1
and 2).
The largest inconsistencies across studies, however, are found in the auditory
naming of pseudowords. In the lexical decision task, inhibitory effects of neighbor-
hood size and neighborhood frequency have been reported for pseudowords (Newman
et al., 2005; P. A. Luce & Pisoni, 1998, experiment 2). Using the auditory naming
task, however, Vitevitch et al. (1997, Vitevitch & Luce, 1998, 1999) have reported
consistent facilitative effects in pseudoword shadowing for neighborhood size. These
effects have been interpreted as having their source not on later lexical competition
processes, but in earlier sublexical processing. However, some confounds have been
uncovered by Lipinski and Gupta (2005), who reported that the pseudoword stimuli
used by Vitevitch et al. (1997, Vitevitch & Luce, 1998, 1999) were biased in their
durations. When this confound was either statistically or experimentally controlled,
the facilitative effects in the shadowing of pseudowords gave rise to inhibitory ef-
fects (Lipinski & Gupta, 2005).
Although the series of studies reported by Lipinski and Gupta (2005) seems
at first to have resolved the inconsistencies found in the results of pseudoword shad-
owing tasks, Vitevitch and Luce (2005, experiment 1) still reported facilitative ef-
fects for pseudowords in dense neighborhoods when using duration–matched pseu-
dowords15. This set of results have been discussed in detail in section 1.2.2.2, but we
15This effect was again interpreted as being due to phonotactic probability, not neighborhood
density.
84

reproduce below (as table 1.5, and solely to facilitate the comparison of the various
results) the table summarizing the disparate results found across experiments and
tasks where putative effects of phonotactic probability have been reported to offset
the expected inhibitory effects of lexical competition.
Ultimately, the reports of task–specificity of lexically–based similarity effects
do not, by themselves, call into question in any significant way the theoretical ac-
count laid out by NAM and other spoken word recognition models that lexical com-
petition based on formal similarity is what ensures correct identification within a set
of lexical candidates. More relevant theoretical challenges to the idea that lexically–
based similarity plays an inhibitory role in word identification, however, come from
the lack of robust cross–linguistic effects in tasks where inhibitory similarity effects
are found in English.
1.2.4.2 Cross–linguistic comparison of similarity effects across tasks
Perceptual identification task
The perceptual identification task is the only experimental task where all the
available evidence is consistent with the view that phonological similarity to a large
number of words inhibit spoken word recognition. Inhibitory effects of neighborhood
size were found for English (Goldinger et al., 1989; Cluff & Luce, 1990; P. A. Luce
& Pisoni, 1998), French (Dufour & Frauenfelder, 2007), and Japanese (Amano &
Kondo, 1999, 2000). Furthermore, inhibitory effects of neighborhood frequency were
found for English (P. A. Luce & Pisoni, 1998) and French (Dufour & Frauenfelder,
85

Table 1.5: Summary of empirical investigations of the effects of Phonotactic Prob-ability. Unless stated otherwise, (i) Dense Neighborhoods (DN) are confoundedwith High Phonotactic Probability (HP), and Sparse Neighborhoods (SN) with LowPhonotactic Probability (LP), (ii) Items are CVC monosyllables, (iii) RT is com-puted from onset of stimulus presentation and (iv) Facilitation is putatively due toPhonotactic Probability, and Inhibition is putatively due to Neighborhood Density.
Paper Experiments Words Pseudowords
Auditory Naming Task (also referred to as Shadowing or Repetition)
Vitevitch et al. (1997) Exp. 2o — FacilitationVitevitch & Luce (1998) Exp. 1a / W, PW blocked Inhibition FacilitationVitevitch & Luce (1999) Exp. 4o,p / W, PW blocked Facilitationi Facilitationi
Inhibitionj Facilitationj
Lipinski & Gupta (2005) Exp. 1a,d,f — Facilitation— Facilitationk
— Inhibition (trend)m
— Inhibitionl
Exp. 2a,b,d,f , 3a,d,g, 4a,b,d,g — Facilitation— Nullm
— Inhibitionl
Exp. 5a,e,f , 7a,e,g, 11a,g — Null— Inhibitionm
— Inhibitionl
Exp. 6a,e,f , 8a,e,g, 9f , 10c,f , 12c,g — Inhibition— Inhibitionm
— Inhibitionl
Vitevitch & Luce (2005) Exp. 1c,h — FacilitationExp. 2c,f — Null
Same–Different Judgment Task
Vitevitch & Luce (1999) Exp. 1a,d / W, PW blocked Inhibition FacilitationExp. 2a,d Null Facilitation
Luce & Large (2001) Exp. 1r Facilitation NullExp. 2s — Facilitation (marginal)
Vitevitch (2003) Exp. 1Aa,d,q / More PW than W Inhibition —Exp. 1Ba,d,q / PW equal W Null —Exp. 1Ca,d,q / Less PW than W Facilitation —
Auditory Lexical Decision Task
Vitevitch & Luce (1999) Exp. 3a,d Inhibition InhibitionExp. 5o,p Facilitationi Facilitationi
Inhibitionj Inhibitionj
Semantic Categorization Task
Vitevitch & Luce (1999) Exp. 6o,p Facilitationi —Inhibitionj —
aPseudowords’ duration biased: HP significantly shorter than LP. bStimuli equated for file duration (not trueduration). cStimuli equated for true duration. dSame pseudoword tokens from V&L(1998). eSame pseudowordtypes, but different tokens, from V&L(1998). fTrial duration fixed at 1s. gTrial duration fixed at 4.5s. hTrialsduration was determined by subjects’ responses, until 3 s post–stimulus onset. iWhen 1st syllable is DN/HP.jWhen 1st syllable is SN/LP. kRT computed from real stimulus onset. lRT computed from true stimulus offset.mStatistical control /adjustment for stimuli’s duration. oBisyllabic (CVC.CVC) stimuli used. pWord composedfrom V&L(1999) CVC words, and pseudowords from V.etal.(1997). qMaterials from V&L(1999). rFactorial design(ND and PP crossed). sReanalysis of Exp.1 with behavioral rather than statistical neighborhood metric.
86

2007).
Auditory lexical decision task
The effects of lexical neighborhood in the auditory lexical decision task seem
to vary cross–linguistically. The effect of neighborhood size in the lexical decision
of words has been reported to be inhibitory in English (P. A. Luce & Pisoni, 1998;
Vitevitch & Luce, 1999) and French (Ziegler, Muneaux, & Grainger, 2003), null in
Japanese (Amano & Kondo, 1999, 2000), and facilitative in Spanish (Vitevitch &
Rodrıguez, 2005). The effect of neighborhood frequency in the lexical decision of
words has been reported to be inhibitory in English (P. A. Luce & Pisoni, 1998), null
in French (Mousty et al., 1996), and facilitative in Spanish (Vitevitch & Rodrıguez,
2005).
When it comes to the processing of pseudowords, on the other hand, the little
data available point to more cross–linguistically robust results. The effect of neigh-
borhood frequency has been reported to be inhibitory in both English (P. A. Luce
& Pisoni, 1998; Vitevitch & Luce, 1999; Newman et al., 2005), and French (Mousty
et al., 1996).
Auditory naming task
The effects of lexical neighborhood in the auditory naming task also seem
to vary cross–linguistically. The effect of neighborhood size in the shadowing of
words has been reported to be inhibitory in English (P. A. Luce & Pisoni, 1998;
Vitevitch & Luce, 1998, 1999) and French (Ziegler et al., 2003) but facilitative
in Japanese (Yoneyama & Johnson, 2001). However, the effect of neighborhood
87

frequency in the shadowing of words has been reported to be null in both En-
glish (P. A. Luce & Pisoni, 1998) and French (Mousty et al., 1996).
When it comes to the processing of pseudowords, very little cross–linguistic
data is available for the auditory naming task. Some controversy exist as to whether
the effects of neighborhood size are facilitative or inhibitory in English (see discus-
sion is section 1.2.2.2 for more details). The effects of neighborhood frequency in
the shadowing of pseudowords have been reported to be null in French (Mousty et
al., 1996).
Summary
The only task in which inhibitory effects of neighborhood size and frequency
are robustly found cross–linguistically is the perceptual identification task. More-
over, the disparity in the other tasks does not reveal any potentially suggestive
pattern across languages. For instance, French patterns with English in the results
of almost all tasks and manipulated variables, except on the role of neighborhood
frequency in the lexical decision task, in which one English study reports inhibitory
effects (P. A. Luce & Pisoni, 1998), and one French study reports null effects (Mousty
et al., 1996). Spanish seems to be the mirror image of English in the auditory lexical
decision task (Vitevitch & Rodrıguez, 2005). Finally, Japanese only agrees with En-
glish in the perceptual identification task (Amano & Kondo, 1999, 2000), displays
different results (null) from both English (inhibitory) and Spanish (facilitative) in
the lexical decision task (Amano & Kondo, 1999, 2000), and diverges from English
and French in the auditory naming of words (Yoneyama & Johnson, 2001).
88

Discussion
The cross–linguistic results can be interpreted in two different ways. The first
one is to take the robust findings of inhibitory effects of lexical similarity in spo-
ken word recognition in the perceptual identification task as prima facie evidence
that this is the only task truly tapping into the lexical identification stage. In this
view, the results from the other tasks would have to be explained by a complex
interaction between task–demands and language–specific properties that have no
necessary relation with the processes of lexical identification. This interpretation is
theoretically appealing not only because it preserves the mechanistic explanation of
lexical competition due to lexical similarity, but also because it seems to point to
one particular experimental task that is optimally sensitive to the lexical identifi-
cation stages in lexical processing. However, this position has the disadvantage of
calling into question the relevance of most of the other tasks in the study of spoken
word recognition, which would drastically reduce the amount of empirical evidence
potentially available to researchers.
The other possible interpretation for the apparent lack of robust cross–linguistic
effects of lexical similarity in spoken word recognition would be that yet–unspecified
language–specific properties interact in complex ways with different task–specific
demands. This view is unappealing if one wants to preserve the idea that lexical
selection happens via competition between similar words within a candidate set, be-
cause it removes any empirical basis for the idea of lexical selection via competition
due to lexical similarity. In other words, the idea of inhibitory effects of lexical sim-
89

ilarity in word recognition might be true, but given the lack of a theoretical account
for the putative complex interaction between different language properties and dif-
ferent tasks demands, it means that we cannot know or test whether or not the idea
has empirical support. However, if one has good theoretical reasons to believe that
competition due to lexical similarity within the candidate set might not be correct
to begin with, then the lack of robust cross–linguistic evidence of inhibitory effects
of neighborhood size and frequency might be taken at face value as evidence against
the kind of theoretical proposal put forth by models such as NAM.
Finally, it must be acknowledged that the cross–linguistic evidence in this
domain is severely lacking, both in number of studies and range of cross–linguistic
variation. Given the small number of studies, there is always the possibility that
the controversial evidence is spurious, and it might obscure the true picture more
than illuminate it. Unfortunately, more cross–linguistic research is needed in order
to adjudicate amongst these alternatives.
1.2.5 Phonological similarity effects in the visual processing of words
The results reviewed so far generate an interesting problem. When it comes
to similarity effects, there seems to be a disparity in the kinds of results reported
according to the modality of presentation, at least in English. It has been shown con-
clusively that orthographic similarity (indexed by ON size) has a facilitative effect in
reading, whereas phonological similarity (as indexed by PN size) seems to have in-
hibitory effects in spoken word recognition (in English and French, not Spanish; see
90

discussion in section 1.2.4). Moreover, the well established lack of orthographic typ-
icality effects (indexed by orthotactic probability) in reading contrasts with several
reports of facilitatory effects of phonotactic probability in spoken word recognition
(but see section 1.2.2.2, for discussion on this topic).
This state of affairs is perhaps unexpected in light of a series of results im-
plicating phonological re–coding at an early processing level in reading across a
variety of tasks, such as semantic categorization (eg. Van Orden, 1987; Van Orden,
Johnston, & Hale, 1988), naming (eg. Lukatela & Turvey, 1990, 1991; Lukatela,
Lukatela, & Turvey, 1993; Lukatela & Turvey, 1993, 1994a, 1994b), lexical deci-
sion (eg. Lukatela, Frost, & Turvey, 1998, 1999; Pexman, Lupker, & Reggin, 2002;
Holyk & Pexman, 2004), perceptual identification (eg. Brysbaert, 2001) and repeti-
tion blindness paradigms (eg. Bavelier & Potter, 1992; Bavelier, Prasada, & Segui,
1994). The cross–task nature of these effects strongly suggest that reading relies on
access to the phonological lexicon. Moreover, recent experimental evidence suggests
that the phonological representations that mediate lexical recognition through read-
ing seem to be specified at the featural level (Lukatela, Eaton, Lee, & Turvey, 2001),
and even at the phonetic level (Abramson & Goldinger, 1997; Lukatela, Eaton, Saba-
dini, & Turvey, 2004). Lukatela et al. (2001) reported graded rhyme priming effects
in a lexical decision task according to the subsegmental featural distance between
the pseudoword prime (eg. ZEA vs VEA) and the target (SEA), with pseudowords
sharing all but one feature (ZEA) eliciting stronger priming effects than pseudoword
primes sharing less features (VEA). Abramson and Goldinger (1997) used pairs of
words that are lexically distinguished by a final consonant, which was either voiced or
91

unvoiced (BAD vs BAT). However, these words are also phonetically distinguished
in the realization of the vowel, which, when pronounced, is significantly longer when
the subsequent consonant is voiced. Abramson and Goldinger (1997) showed effects
of vowel length in a series of lexical decision task experiments, even though the
stimuli were visually presented, indicating that the information about the phonetic
realization of the vowel in the words was available to the decision making process (see
also Lukatela et al., 2004).
Given the pervasive effects of phonological and even phonetic structures in
reading, the finding that formal similarity plays opposite roles in visual and auditory
word recognition is of potential theoretical interest, especially when the discrepant
effects of frequency of non–morphemic subparts in the two modalities (null in visual
word recognition, facilitative in auditory word recognition) is considered. The effects
of frequency of non–morphemic subparts is hypothesized to occur earlier in the
processing stream, as opposed to the effects of formal similarity, which are supposed
to occur at the level of lexical selection. Because disparate modality effects are
found for these two variables that span early and late aspects of lexical selection,
this suggests that different memory structures are used for a substantial part of the
recognition process according to the modality of input.
It is important to note, however, that the effects of orthographic similarity are
computed over orthographic representations alone. In languages in which orthogra-
phy is not as transparent, such as English, it is possible that a word’s orthographic
neighborhood is only minimally overlapping with its phonetic neighborhood. If that
is the case, then it is in principle possible that the discrepant results of formal simi-
92

larity at the orthographic and phonetic level might be unified: Orthographic effects
are facilitatory, but Phonological effects are inhibitory, and they just happen to act
at different levels of processing. Moreover, given that there might be minimal over-
lap between orthographic and phonologic neighborhoods in languages like English,
orthographic effects might be easier to isolate in them than in languages with trans-
parent orthographies. This could potentially resolve the cross–linguistic disparity
for the neighborhood frequency effect found in the visual word recognition literature,
in which English shows very contradictory effects (facilitation, null, and inhibition),
whereas languages with more transparent orthographies, such as Dutch and Spanish,
show mostly effects of inhibition (see sections 1.2.3 and 1.2.4 for discussion).
Evidence from a MEG study performed by Pylkkanen, Stringfellow, and Marantz
(2002) supports this idea. In this experiment, the authors adapted the materials
from a word recognition experiment in the auditory modality (Vitevitch & Luce,
1999), but opted for visual presentation. Therefore, these items were manipulated
for Phonological, not Orthographic Neighborhood density, but were presented visu-
ally, not auditorily. Contrary to the vast majority of other visual lexical decision
studies done in English, who report facilitative effects for dense orthographic neigh-
borhoods, RT latencies in this experiment revealed an inhibitory effect of phonolog-
ical neighborhood, as is commonly found in the auditory word recognition literature
(see 1.2.4 for discussion).
Unfortunately, this unifying explanation falls short in explaining a series of
other results that point in the opposite direction. For instance, a naming experiment
in French (a language with a not–so–transparent orthography, like English) reported
93
Table 1.6: Summary of empirical investigations of the effects of Phonological Neigh-borhood structure on visual word recognition. Lexical decision data only.
Words PseudowordsPaper Experiment PN Size PN Freq. PN Size PN Freq.
Experiments in English
Pylkkanen et al (2002) Inhibition — Inhibition —Yates et al (2004) Exp. 1a,b,c,d Facilitation — — —
Exp.2a,b,c,d Facilitation — — —Stockall et al (2004) Facilitationf — not reported —Yates (2005) Exp. 1a,b,c,e Facilitation — — —
aControlled for Orthographic Neighborhood Size bControlled for Orthographic Neighborhood Fre-quency. cControlled for Average Phonological Neighborhood. dControlled for Summed BigramFrequency. eControlled for Positional Bigram Frequency. fOnly low-frequency stimuli included oreffect significant only for low-frequency words.
by Peereman and Content (1997) revealed facilitative effects in a visual naming
task when the orthographic and phonological neighborhood of the items overlapped
substantially (the so–called phonographic neighborhood). Moreover, it was shown
that the facilitative effect found was the exclusive contribution of the words that
were in the phonographic neighborhood. Therefore, in this experiment, it is clear
that the PN is having a facilitative effect when the stimuli are presented in the
visual modality, whereas PN is normally reported to have inhibitory effects when
the stimuli are presented auditorily.
Finally, a series of three experiments (Yates, Locker, & Simpson, 2004; Stock-
all, Stringfellow, & Marantz, 2004; Yates, 2005) that also explicitly manipulated PN
(while controlling ON) using the visual lexical decision task also reported that PN
has facilitative effects in visual word recognition, the opposite of what is found when
the stimuli are presented auditorily (see table 1.6). Moreover, Yates (2005) shows
that when PN effects are controlled, no effect of ON is actually found. Yates (2005)
also present a small review of materials used in previous experiments and shows that
94

in all the ones reviewed, ON was in fact highly correlated with PN, and speculated
that the facilitative ON effect found for visual word recognition in English could be
subsumed under a pure PN effect.
In summary, the evidence seems to suggest that phonological neighborhoods
do have qualitatively different effects in word recognition according to the modality
of stimulus presentation, suggesting that the way that phonological structures are
deployed in the course of lexical recognition is qualitatively different in reading and
hearing. Alternatively, it is possible that the kinds of lexical structures that are
contacted by reading and by hearing are in fact different at the level of retrieval.
1.3 Outline of Thesis
Chapter 2 describes an experiment whose goal is to identify an early neurophys-
iological correlate of lexical access. Specifically, previous experiments (Pylkkanen
et al., 2002; Stockall et al., 2004) have proposed that a particular MEG component
indexes lexical activation prior to lexical selection. However, these studies relied on
phonological similarity manipulations coupled with manipulation of the frequency
of non–morphemic subparts. As reviewed above, the role of phonological similarity
is dependent on the modality of presentation: it is facilitatory for visual presenta-
tion, but inhibitory for auditory presentation. The same holds for the frequency
of non–morphemic subparts: It elicits (controversial) facilitatory effects in auditory
presentation, while no effect is normally reported for visual presentation. Moreover,
the theoretical accounts for the two kinds of effects are qualitatively different: In
95

the auditory word recognition literature, facilitative effects of non–morphemic sub-
parts are interpreted as occurring at the lexical activation level, whereas inhibitory
effects of phonological similarity are interpreted as operating at the lexical selection
level. In the visual word recognition literature, on the other hand, the facilitative
effect due to orthographic and phonologic similarity is task–related, and does not
necessarily reflect lexical selection, but rather the results of speeded classification
strategies. Since the previous MEG experiments presented their materials visually,
it is unclear what interpretation the MEG component they describe should receive.
The experiment reported in chapter 2 explores the similarity effects for the same
set of items, presented in the two modalities, to investigate whether the MEG com-
ponent explored by Pylkkanen et al. (2002) and by Stockall et al. (2004) can be
appropriately described as an index of lexical activation.
Chapter 3 describes a second MEG experiment which seeks to identify a neuro-
physiological correlate of lexical access, by capitalizing on repetition priming effects
to written stimuli. An experimental paradigm that is apparently selective to repe-
tition of words (but not pseudowords) is used in trying to distinguish between two
sources of repetition priming effects that have been proposed in the literature: A
long–term memory retrieval source, based on lexical access, or a short–term memory
retrieval source, based on re–activation of an episodic memory trace formed upon
the first encounter with the item in the course of the experiment.
Chapter 4 describes a third MEG experiment that seeks to expand the results
of experiment 3 to American Sign Language, with the goal of exploring whether the
results reported in chapter 3 would be replicable with stimuli possessing a complex
96

temporal structure, while still controlling for modality of presentation.
Chapter 5 summarizes the results of the three experiments and elaborates on
what conclusions can be drawn from them.
97

Chapter 2
The role of frequency and similarity across modalities: Experiment 1
2.1 Introduction
Any theory of linguistic knowledge and linguistic behavior must posit a lex-
icon, a repository of information that is used in the different kinds of linguistic
computations our minds must perform in the course of language comprehension and
production. Understanding the workings of this mental structure and how it satisfies
the different requirements imposed by comprehension and production mechanisms
is therefore understandably a central research topic in psycholinguistics.
In order for language comprehension and production to occur at all, one must
assume that the information stored in the lexicon is properly retrieved. Different
units of representation have been proposed to compose the mental lexicon, such as
morphemes and idioms, but most of the research done in the field has assumed the
word1 as the privileged unit of analysis (Balota, 1994). Therefore, recognizing words
and retrieving the information they store is considered to be a central process in
language comprehension, and it has received a commensurate level of attention in
the psycholinguistic community.
1While the concept of word is intuitively accessible and easy to manipulate, there is considerable
disagreement in linguistic theories about what a word is, and whether it plays a central role in the
organization of the lexicon. However, for the present purposes, I will ignore this controversy.
98
The main problem researchers in the area of word recognition identify is that
the way the lexicon is organized is very conducive to large scale perceptual confus-
ability: an average adult is estimated to know between 30.000 to 50.000 different
words (Seidenberg & McClelland, 1990; Monsell et al., 1989), but the whole lexicon
is based on a small number of building blocks (around 40 phonetic segments for
spoken language) that are concatenated in different unique combinations to serve as
representational units (Goldinger et al., 1989; cf. Balota, 1994; Huntsman & Lima,
2002; Dehaene, Cohen, Sigman, & Vinckier, 2005 for similar arguments for the rep-
resentation of written words in cultures that use alphabetical writing systems). This
entails that overlap of building blocks amongst different words is rampant in the lex-
icon, which means that for each word actually present in the input, there will be
several others partially compatible with it (and arguably partially activated by it)
to different degrees of fit. Yet, despite this potential perceptual confusability issue,
human word recognition is extremely fast (as fast as 250ms for spoken and written
words) and robust to noise.
However, despite the extreme speed of the process, and despite how early lexi-
cal access can occur in the processing stream, much of the research done in the field
has relied on reaction time latencies in lexical decision tasks as their primary source
of empirical evidence. These latencies normally figure in the range of 500-800ms
for written words and up to 1000ms for spoken words. Even though reaction time
latencies can and have been used to constrain and test different models of lexical
access, they have the drawback of only providing a snapshot of the process at the
output of the decision making routines. This is considered by some researchers to
99

be a major problem in using reaction time latencies to tease apart different hy-
potheses about early stages of lexical access (eg. Balota & Chumbley, 1984), and
constitutes the main rationale underlying lexical decision research turning increas-
ingly more often to high–temporal resolution electrophysiological techniques (such
as EEG and MEG), which can record brain activity from stimulus presentation up
to the behavioral response with milisecond accuracy.
In this chapter, I will report one MEG experiment designed to investigate
stages of lexical access in which mapping between sensory input and lexical repre-
sentations occur, but also stages where selection mechanisms ensure convergence to
the (hopefully correct) response. In order to tap into these processes, I will attempt
to replicate and extend the findings of two previous studies (Pylkkanen et al., 2002;
Stockall et al., 2004), in which two different kinds of lexical variables were manip-
ulated in simple lexical decision tasks. The first kind of variable, the frequency
of subunits that compose words (their phonotactic and orthotactic probability), is
thought to facilitate lexical activation of possible candidates. The second kind, lex-
ical neighborhood size and frequency, is thought to influence selection within the
candidate set.
The ultimate goal of this work is to gain better understanding of early neural
correlates of lexical access across modalities such that they can be subsequentially
used to disentangle different hypotheses about lexical representations (cf. Pisoni &
Levi, 2007; Poeppel, Idsardi, & van Wassenhove, 2008 for discussion, and Almeida,
2005 for a proposal).
100

2.2 Neural Correlates of Word Recognition
The use of electrophysiological techniques such as EEG has been successfully
and fruitfully used in lexical access research for over twenty–five years, since the
pioneering work of Kutas and Hillyard (1980, 1984), and although potential neural
correlates of word recognition have been identified, I will argue that the standard
lexically–induced response reported in the EEG literature (the N400) is in fact not
entirely adequate for research focused on the precise time course of lexical access.
Kutas and Hillyard (1980, 1984) reported an Event–Related Potential (ERP)
to sentence–final visual words whose amplitude was modulated by its semantic fit in
the context in which it was presented. This ERP was identified as a large negative
polarity deflection ocurring between 200ms and 600ms post stimulus onset. Since
its peak activity normally occurs at around 400ms, it was named N400 (cf. Kutas
& Federmeier, 2000, Van Petten & Luka, 2006 and Lau, Phillips, & Poeppel, 2008
for reviews).
Subsequent research has found that this ERP displays many of the charac-
teristics we would expect a lexically–induced ERP to reflect. First, it is reliably
elicited by words or wordlike stimuli, either in sentential context (Van Petten & Ku-
tas, 1990) and in isolation or pairs (Bentin, McCarthy, & Wood, 1985), but not for
non word–like written stimuli, like strings of consonants (Rugg & Nagy, 1987). Sec-
ond, it is found across a variety of tasks (passive reading Kutas and Hillyard (1980,
1984), lexical decision (Rugg, 1983), semantic classification (Young & Rugg, 1992),
and repetition judgment (Rugg, Brovedani, & Doyle, 1992; Rugg, Cox, Doyle, &
101

Wells, 1995; Wilding, 2000), suggesting a high degree of task–independence. Third,
the N400 seems to reflect meaning retrieval, given that (i) its amplitude inversely
correlates with how appropriate a word is in particular sentential contexts (Kutas
& Hillyard, 1980, 1984), and (ii) its amplitude is modulated in the same way that
lexical–level variables such as frequency (Smith & Halgren, 1987; Van Petten & Ku-
tas, 1990), and semantic relatedness or identity of prime in word pair lists influence
recognition times at the behavioral level (Bentin et al., 1985; Holcomb, 1988, 1993;
Rugg, 1987, 1990): higher N400 amplitudes are found for lower frequency words,
which elicit longer RTs, and smaller N400 amplitudes are observed for semantic
relatedness or identity between prime and target words in pair lists, which in turn
elicit shorter RTs in behavioral tasks. Fourth, the ERP is found in both the visual
and auditory modalities of oral language (Holcomb & Neville, 1990, 1991; Bentin,
Kutas, & Hillyard, 1995) as well as for signed languages (Kutas, Neville, & Holcomb,
1987), suggesting a high–degree of modality independence.
However, there are two main reasons to think that the N400 is actually not
entirely adequate as a dependent measure to specifically tap into the precise time
course of lexical activation. First, the response is broad (it can span up to 400ms),
but only its amplitude is reliably manipulated, not its peak–latency (eg. Kounios
& Holcomb, 1992, p. 469). While this still allows the N400 to probe degrees of
relatedness of lexical items in memory and perhaps aspects of semantic processing,
it diminishes its usefulness as a tool for probing the fine–grained temporal structure
of lexical access. Second, and perhaps most importantly, is that despite an apparent
consensus in the field (eg. Kutas & Federmeier, 2000), there is to my knowledge no
102

coherent functional interpretation of the N400 that is able to account for all the
facts. I will address this second concern in more detail in the following section.
2.2.1 The functional interpretation of the N400
The standard interpretation of the N400 is that it is a neural correlate of
post-lexical meaning processing (Kutas & Federmeier, 2000). This interpretation is
backed up by the fact that the N400 is elicited by words that don’t provide a good
fit to the local semantic context of the sentence, as well as by semantic priming
in word pairs. There is also reason to believe that the N400 is not necessarily a
lexically–induced response, since it is not uniquely elicited by lexical information.
Modulation of the N400 has been found for matching pictures (Barrett & Rugg,
1990; McPherson & Holcomb, 1999), line–drawings (Holcomb & McPherson, 1994),
faces (Barrett, Rugg, & Perrett, 1988; Barrett & Rugg, 1989; Bobes, Valdes-Sosa, &
Olivares, 1994) and other non–linguistic material (see Kutas & Federmeier, 2000 for
review). This has led some researchers to posit that the N400 reflects meaning
integration and semantic expectancy across different levels of processing.2
However, this view cannot readily accomodate two families of results in the
N400 literature: (i) lack of semantic fit effects in sentences with simple linguistic
operators, such as negation and different quantifiers, that can modify the truth
value of propositions by being inserted in what would otherwise be the exact same
2Cloze probability, a variable that had been found to correlate with N400 amplitude modulation
in sentential contexts (Kutas, Lindamood, & Hillyard, 1984), served as a surrogate for these
elements in the literature regarding sentence comprehension.
103

structure, and (ii) N400 priming effects for unconsciously perceived words.
Lack of N400 effects for semantic anomalies
Soon after the first descriptions of the N400 and its association with semantic
processing, Fischler, Bloom, Childers, Roucos, and Perry (1983) conducted a study
that found that for simple sentences like “a robin is a bird” and “a robin is not
a bird”, the N400 elicited by the final word in the two sentences was equivalent in
its temporal profile and morphology. The truth value of the sentences, however, is
exactly the opposite and therefore the semantic fit of the final word in the second
sentence should be very low. If the interpretation of the N400 as meaning processing
is correct, the false sentences should elicit an N400 effect, contrary to fact.
Moreover, the N400 amplitudes for both sentences were smaller than the ones
obtained by pairs like “a robin is a vehicle” and “a robin is not a vehicle”, which
were in turn identical to each other. This strongly suggests that the N400 in those
cases reflects the degree of association between the subject and the object of the
predicates, but not the actual integrated linguistic meaning of the sentence.
This effect was later replicated using different quantifiers by Kounios and Hol-
comb (1992), who reported lexical association, but not sentence meaning effects us-
ing materials like“[all/some/no] [dogs/apples] are [animals/fruit]” and “[all/some/no]
[animals/fruit] are [dogs/apples]”. These results have recently been replicated and
extended in French (Noveck & Posada, 2003), German (Drenhaus, Graben, & Frisch,
2006) and Spanish (Beltran, Carreiras, Alvarez, & Santamarıa, 2006), and are hard
to accomodate if one takes the N400 to reflect semantic or expectancy–based inte-
104

gration.
N400 priming for unconsciously perceived words
One of the results that lent support to a semantic processing account of
the N400 response was the lack of semantic priming in masked priming environ-
ments (C. Brown & Hagoort, 1993). However, several subsequent studies revealed
that masked words that are unconsciously perceived can indeed elicit N400 seman-
tic priming effects (Deacon, Hewitt, Yang, & Nagata, 2000; Kiefer, 2002; Kiefer &
Brendel, 2006; Kreher, Holcomb, & Kuperberg, 2006), as can words presented under
the attentional blink (Luck, Vogel, & Shapiro, 1996; Vogel, Luck, & Shapiro, 1998;
Rolke, Heil, Streb, & Hennighausen, 2001).
All the results reviewed above are striking under a strictly sentential meaning
processing or contextual integration account of the N400. This is especially true in
light of recent work reporting discourse–level N400 effects (St. George, Mannes, &
Hoffman, 1994; van Berkum, Hagoort, & Brown, 1999; van Berkum, Zwitserlood,
Hagoort, & Brown, 2003; Nieuwland & van Berkum, 2006; Swaab, Camblin, &
Gordon, 2004; Ledoux, Camblin, Swaab, & Gordon, 2006; Coulson & Wu, 2005;
Coulson, Federmeier, Van Petten, & Kutas, 2005). The obvious question then is
how come we have high-level contextual information and very low level subliminal
information eliciting N400 effects, but not simple linguistic manipulations, such as
negation and quantification, that are readily available and easy to interpret? If
anything, those should be the bread and butter of semantic integration, and not the
exception.
105
Subliminal priming and the lack of semantic fit N400 effects in simple sentences
argue instead for a association/spreading activation account of the N400, a view that
has recently received new empirical support (Rhodes & Donaldson, 2006). This
interpretation was first proposed by Fischler and Raney (1989), who argued that
“. . . the reduction of N400 in linguistic contexts had little to do with
sentence structure or meaning, and was closely tied to the lexical associ-
ation of prime and target words” (p. 38, cited in Kounios and Holcomb
(1992), p. 461)
Although this would in principle explain most, if not all, the semantically–anomalous
N400 effects, it still fails to explain several of the aforementioned discourse–related
N400 effects, in which lexical association was, intentionally or not, controlled for (St.
George et al., 1994; van Berkum et al., 2003; Nieuwland & van Berkum, 2006;
Coulson & Wu, 2005, to name a few particularly hard cases).
Therefore, the functional interpretation of the N400 still eludes a unified coher-
ent account, and all we are left with is the generalization that it has “something to
do with meaning”. Therefore, even in the absence of the temporal coarseness issue,
the fact that a coherent interpretation of the N400 is currently lacking would defi-
nitely obscure any potential results one might find using this ERP as a dependent
measure.
106

2.2.2 Using MEG to investigate early aspects of lexical access
Recent investigation using magnetoencephalography (MEG) has identified a
candidate response that shows very good prospects for the study of the precise
time course of lexical access (Pylkkanen & Marantz, 2003, for review). There are
three main reasons for this. The first is that this response, which peaks at around
350ms for visually presented words (therefore within the same temporal window of
the N400), has a much more narrow temporal window than its EEG counterpart,
and does not span the whole 250-300ms that the N400 does; in fact, the response
normally assumes the form of a very narrow peak of activity. The second reason
is that this component has been reported to be sensitive to much the same kind of
manipulations that the N400 is sensitive to, such as semantically anomalous senten-
tial contexts (Helenius, Salmelin, Service, & Connolly, 1998; Halgren et al., 2002),
lexical frequency (Embick, Hackl, Schaeffer, Kelepir, & Marantz, 2001; Halgren
et al., 2002), stimulus repetition (Sekiguchi, Koyama, & Kakigi, 2000; Pylkkanen,
Stringfellow, Flagg, & Marantz, 2001) and multiple meaning ambiguities (Beretta,
Fiorentino, & Poeppel, 2005; Pylkkanen, Llinas, & Murphy, 2006). The third reason
is that it is the peak latency, and not its amplitude, that has been shown to sys-
tematically vary according to all these manipulations. Therefore, there is hope that
this component will allow research on lexical access to incorporate a more accurate
and precise temporal dimension.
Furthermore, MEG has the added benefit of being able to reveal something
about the underlying sources of activity, and could be useful in establishing spatio-
107
temporal maps and profiles of different linguistic processes (Dhond, Buckner, Dale,
Marinkovic, & Halgren, 2001; Dhond, Marinkovic, Dale, Witzel, & Halgren, 2003;
Marinkovic et al., 2003; Dhond, Witzel, Dale, & Halgren, 2005, 2006; Halgren et al.,
2006).
Due to the fact that the M350 could prove to be a very useful window into
the time course of lexical access, we decided to focus our attention in this response.
Moreover, three recent studies underscored the potential of the M350 to serve as an
index of activity in early lexical activation stages. Pylkkanen et al. (2002), building
on work of Vitevitch et al. (1999), was able to show that the M350 latency tracks
solely ease of lexical activation, which is thought to be dependent on the frequency
of sublexical constituents, but not lexical selection, which is thought to be affected
by lexical neighborhood frequency, and was found to be tracked by reaction time
latencies. Stockall et al. (2004) replicated and extended these results, with a very
similar design, and Fiorentino and Poeppel (2007) found M350 latency manipulation
for compound words of exact same lexical frequency based on the frequency of their
constituents being high or low, regardless of the behavioral outcome. These results
strongly suggest that the M350 is indeed tracking lexical activation routines, but
not decisional processes.
108
2.3 Neighborhood Density and Phonotactic Probability influences in
Word Recognition
As noted in the introduction, lexical access is often conceptualized as a percep-
tual confusability problem. Given the small number of building blocks used to store
lexical representations and the large number of words in the lexicon, this entails that
words will normally have a high degree of partial overalp with other words in terms
of the sub-units that compose them. The questions that arises then is what kind
of effect (if any) does similarity have in the processing of words? Does similarity
inhibit processing due to the possible competition amongst candidates? Or on the
contrary, does it have a facilitatory effect (for instance, familiarity), due to possible
synergistic effects of highly overlapping sub–units?
In this sense, lexical neighborhoods are of high theoretical interest because
they provide a way of quantifying the similarity space for words. With such a
metric, it is possible to investigate how much of an effect (either inhibitory or facil-
itatory) similarity might have in lexical processing. On this point, different models
make different predictions about what the effects of similarity might be. Models of
lexical access have historically espoused the idea that the process of lexical retrieval
rests primarily on either parallel search or multiple simultaneous activation of inde-
pendent units (cf. Morton, 1969; Coltheart et al., 1977; Rumelhart & McClelland,
1981, 1982, but see Forster, 1976 for a serial search proposal).
These models normally require a selection stage where, amongst all the possible
alternatives, only one (and hopefully the right) candidate is selected (see Marslen-
109

Wilson, 1987a, 1989; P. A. Luce & Pisoni, 1998; P. A. Luce, Goldinger, Auer, &
Vitevitch, 2000 for auditory word recognition and Seidenberg & McClelland, 1989;
Grainger & Jacobs, 1996 for visual word recognition). Further, most of these mod-
els assume that the mechanism that ensures convergence to the final decision is
competition between the different candidates (sometimes called lateral inhibition).
Therefore, all else being equal, these models uniformly predict that words with few
neighbors should be recognized faster than words with lots of neighbors. Likewise,
all else being equal, neighbors of lower frequency should impair recognition less
than neighbors of higher frequency. In summary, it is a straightforward prediction
of most multiple activation–based models that effects of lexical competition should
occur, and that more competition (either in terms of number or frequency of com-
petitors) should inhibit recognition. To the extent that inhibition effects from both
neighborhood size and neighborhood frequency have been reliably found in spoken
word recognition (Goldinger et al., 1989; Goldinger, Luce, Pisoni, & Marcario, 1992;
P. A. Luce & Pisoni, 1998), these models have some empirical support.
However, Vitevitch et al. (1997) have recently found that nonwords with highly
frequent sub–units (co-occurrences of phonemes that compose the word) were named
more quickly and accurately than nonwords with less frequent sub–units. This result
was surprising given the high degree of correlation between phonotactic probability
and neighborhood size that is reported for different languages. Therefore, this could
be an example where similarity between words might not impair recognition, but
actually facilitate it. However, these researchers posited that this facilitatory effect
was instead due to sublexical processing, and didn’t originate from lexical processing
110

per se. Given that a parametric independent manipulation of phonotactic proba-
bility and neighborhood density was deemed impossible by the authors (due to the
aforementioned high correlation between phonotactic probability and neighborhood
density), they decided to follow up on the issue in a series of studies (Vitevitch &
Luce, 1998; Vitevitch et al., 1999) adopting a different strategy. They used materials
in which these both phonotactic probability and neighorhood frequency were highly
correlated, but in which the use of different tasks (naming, same–different judgment
and lexical decision) would bias subjects’ mode of processing to focus either at a
sublexical or lexical level.
Vitevitch and Luce (1998); Vitevitch et al. (1999) were able to show then that
when tasks were biased towards sublexical processing, facilitatory effects in latencies
and accuracy in both the naming and same–different judgment tasks were found for
nonwords with high phonotactic probability, even though these very same words
also had more frequent neighbors. However, when the experimental task was biased
towards lexical processing (lexical decision task), then the standard inhibition effect
was found again for both words and nonwords with more frequent neighbors. These
authors then concluded that the locus of the two different effects were at two distinct
processing levels, and one can still maintain that neighborhood size and frequency
has inhibitory effects due to lexical competition.
Assuming a version of the activation–selection paradigm, Pylkkanen et al.
(2002) interpreted Vitevitch and Luce (1998); Vitevitch et al. (1999) results as an
indication that phonotactic probability might facilitate lexical activation of multiple
possible candidates, and in situations where lexical processing or competition is
111

not so strong (as in the processing of nonwords), these facilitatory effects might be
visible at the behavioral level. These researchers hypothesized then that since effects
of facilitation of phonotactic probability and inhibition due to lexical competition
seem to be in principle dissociable and act at different levels of representation, one
might be able to observe them in earlier periods of the processing stream if one uses
the right tools.
By using MEG and converting a subset of Vitevitch and Luce (1998); Vite-
vitch et al. (1999)’s materials to written form, Pylkkanen et al. (2002) were able
to show that although reaction time latencies displayed the standard neighborhood
frequency inhibition effect, the latency of the electrophysiological response elicited
by written words (the M350) was modulated in exactly the opposite way, displaying
a facilitatory effect for words and nonwords with highly probable sub–units, even
though they also had more neighbors than words with lesser probable sub–units.
It is worth stressing that the latter also had smaller neighborhoods, and were re-
sponded to faster than their counterparts at the behavioral level. Pylkkanen et al.
(2002) interpreted these results as a demonstration that the M350 selectively tracks
lexical activation without the effects of lexical competition. The electrophysiological
results were later replicated by Stockall et al. (2004) in a similar, albeit extended
manipulation of lexical frequency, phonotactic probability and neighborhood den-
sity.
These results, if correct, imply that we now have a powerful tool that allows
us to look at the fine temporal structure of lexical access. However, before these
results can be taken at face value, some discussion of the potential problems of the
112

studies is warranted.
First of all, it is worth keeping in mind that the original Vitevitch and Luce
(1998); Vitevitch et al. (1999)’s results were found for auditory word recognition,
while Pylkkanen et al. (2002)’s and Stockall et al. (2004)’s were found for visually
presented stimuli. This unfortunately introduces problems for the interpretation of
the results.
Although compelling given the nature of their predictions and findings, Pylkkanen
et al. (2002)’s behavioral results are somewhat surprising in the light of an extensive
line of research that investigates the effect of neighborhoods for written words. For
instance, unlike phonological neighborhood size, orthographic neighborhood size has
either been found to systematically fail to cause inhibition (Coltheart et al., 1977)
or has been found to elicit the exact opposite effect, i.e., facilitation for items with
more neighbors (Andrews, 1989, 1992; Snodgrass & Minzer, 1993; Sears et al., 1995;
Forster & Shen, 1996; Sears, Lupker, & Hino, 1999; Siakaluk, Sears, & Lupker, 2002;
Huntsman & Lima, 2002; Sears et al., 2006).
Inhibitory effects of orthographic neighborhood frequency, on the other hand,
are only occasionaly found in English (Huntsman & Lima, 1996; Perea & Pollat-
sek, 1998), and has also been found to elicit null or facilitatory effects (Sears et al.,
1995; Sears, Lupker, & Hino, 1999; Huntsman & Lima, 2002; Sears et al., 2006).
In fact, most of the evidence supporting the existence of inhibitory orthographic
neighborhood frequency comes from other languages, such as French, Spanish and
Dutch (see Andrews, 1997; Sears, Hino, & Lupker, 1999; Perea & Rosa, 2000 for
reviews). Finally, Balota et al. (2004), using an innovative approach to word recog-
113

nition, performed a large scale hierarchical regression analysis on reaction time and
naming latencies on 2,428 words, directly comparing a large number of variables that
have been shown to influence reading and naming times. They reported facilitatory
effects of orthographic neighborhood size for low frequency words, but no reliable
effect of facilitation nor inhibition for high frequency words3.
One possible and potentially interesting interpretation for this pattern of re-
sults is that, by virtue of simply adapting Vitevitch and Luce (1998); Vitevitch et al.
(1999) materials, Pylkkanen et al. (2002) actually performed the first experiment in
which written words had their phonological neighborhood frequency controlled. Re-
search of neighborhood effects in reading has practically entirely ignored the issue of
whether or not phonological neighborhoods might actually play a role in visual word
recognition. This might stem from the fact that, given the extremely complicated
way English orthography maps into phonetics, many researchers do not believe that
reading (at least in English) involves a mandatory phonological recoding stage (see
summary of arguments in Balota, 1994), and can therefore be autonomously studied
without reference to phonology.
A unifying argument could be made then that the reason why one consis-
tently fails to find reliable inhibitory orthographic neighborhood frequency effects
in English is due to the fact that phonology is indeed accessed in reading. Given
that English orthography does not map straightfowardly to phonology, there could
3Westbury and Buchanan (2002, p. 1) note, this unpervasivenss of high frequency words in
displaying different kinds of effects while low frequency words do is entirely compatible with the
rest of the literature for written word recognition in English.
114

be considerable mismatch between orthographic neighborhoods of English words
and their phonological neighborhoods. In other languages where phonology is more
transparently represented in the orthography, phonological and orthographic neigh-
borhoods of words will mostly overlap. Incidentally, it is precisely in these languages
that effects of neighborhood inhibition are found for written words. If one claims
that the source of all those effects is in the phonological neighborhoods, one is then
able to unify all the discrepant inhibitory effects found across languages and modal-
ities: one finds reliable inhibitory neighborhood effects in spoken word recognition
because phonological neighborhoods are always at play in the auditory modality.
One finds reliable inhibitory neighborhood frequency effects in languages with trans-
parent orthographies because orthographic neighborhoods in these languages mirror
phonological neighborhoods, and since phonological forms are accessed in reading,
phonological neighborhoods exert their inhibitory effect. Finally, the mixed pat-
tern of orthographic neighborhood effects in English is found because orthographic
neighborhoods of English words do not necessarily match their phonological neigh-
borhoods. Pylkkanen et al. (2002)’s behavioral results then are entirely compatible
with a direct prediction of this hypothesis: once phonological neighborhood fre-
quency is controlled, English should start behaving like other languages.
Furthermore, this proposal would also be compatible with the tacit assumption
upon which Pylkkanen et al. (2002)’s phonotactic facilitation results rests: that
reading activates phonological units. Without positing this, there is no clear way
in which to understand their phonotactic probability facilitation effect. There is to
my knowledge no evidence for facilitatory orthotactic effects in reading available in
115

the literature (but see Westbury & Buchanan, 2002).
Unfortunately, the little evidence on the relationship between orthographic
and phonological neighborhoods in reading that is available in the literature goes en-
tirely against this hypothesis. Yates (2005; Yates et al., 2004) has found facilitatory
phonological neighborhood effects in English for written words. Moreover, Ziegler
and Perry (1998), Peereman and Content (1997) and Grainger, Muneaux, Farioli,
and Ziegler (2005) found that when orthographic neighborhoods included phonolog-
ical neighbors in French, facilitatory neighborhood effects were found for visually
presented words. On that note, it is interesting to notice that Stockall et al. (2004)
themselves failed to find phonological neighborhood size inhibition effects on reac-
tion time latencies for their visually presented words. Instead, they reported a null
neighborhood size effect for high frequency words and a facilitatory effect for low
frequency words.
Therefore, the fact that Pylkkanen et al. (2002) did find inhibitory effects of
phonological neighborhood frequency in reading is surprising and goes against most
of the reported results in the field. Given the importance of their findings, this issue
merits further investigation.
Another potential problem that was introduced by Pylkkanen et al. (2002)’s
translation of (Vitevitch & Luce, 1998; Vitevitch et al., 1999) materials from au-
ditory form to visual representation is that stimuli length ceased to be controlled:
Low probability/density items were significantly longer in their visual form than high
probability/density items. Although Pylkkanen et al. (2002) do acknowledge this
fact, they assume that this is actually biasing the materials against their hypothesis
116

of longer reaction times for high probability/density words. This logic assumes that
length has inhibitory effects in visual word recognition and works as follows: all else
being equal, low probability/density items should be responded to faster than high
probability/density items. However, if the low probability/density items are longer
than high probability/density items, and length is inhibitory, then the predicted
difference in reaction times due to phonotactics might disappear purely due to the
effect of length.
This reasoning is problematic for three reasons. First, it assumes that length
is inhibitory. Although several inhibitory results have indeed been found, there is
great discrepancy in results reported in the literature (see New, Ferrand, Pallier, &
Brysbaert, 2006 for a review), and null effects and even facilitatory effects have also
been found. For instance, New et al. (2006) report facilitatory effects of length for
short words (3 to 5 letters), null effects for middle sized words (5 to 8 letters), and
inhibitory effects only for long words (8 to 11 letters). In a similar fashion, Balota et
al. (2004) report facilitatory effects for high frequency words in university students
(as opposed to elders) performing lexical decision tasks. They also report null effects
for middle range frequency words. Balota et al. (2004)’s results are particularly
important because only monosyllabic words were used in their experiment, and
therefore the length effect is entirely independent from the effect of syllabic length,
much like (Vitevitch & Luce, 1998; Vitevitch et al., 1999) materials in their written
form.
The second reason to think that length being biased in Pylkkanen et al.
(2002)’s materials is a problem is that, even though the authors do not make the di-
117

rect connection, the main effect of length is entirely confounded with their reported
main effect of probability. In other words, it is impossible to rule out based on their
data alone the interpretation that the effect they find on the M350 is due to phono-
tactic probability rather than orthographic length. This is a serious concern for the
interpretation of their data, since recent electrophysiological studies have shown how
word length has surprisingly early effects (60–100ms) that can persist for quite some
time (from 200 to 600ms), and interact with other lexical level variables, such as fre-
quency (Assadollahi & Pulvermuller, 2003; Wydell, Vuorinen, Helenius, & Salmelin,
2003; Hauk & Pulvermuller, 2004). A possible counter argument to that concern,
however, is that Stockall et al. (2004) did report a phonotactic probability main
effect on the M350, and orthographic length was controlled in their materials.
Finally, the last issue with Pylkkanen et al. (2002)’s study has to do with their
conclusion and whether or not it is consistent with their results. They concluded
that the M350 tracks lexical activation but not lexical competition. However, they
did report that lexicality interacted with probability, but the effect was marginal.
However, they only tested 10 people, and the effect was marginal at p = 0.05. It is
very likely that, had more subjects been tested, the interaction would turn out to
have been significant. If this is true, then it seems that Pylkkanen et al. (2002) have
to account for why lexicality would be interacting with probability in pre-decisional,
lexical activation stages, where only potential candidates are being generated.
In summary, both studies that reported M350 modulation due to phonotactic
probability (Pylkkanen et al., 2002; Stockall et al., 2004) present very interesting
results, but also challenging problems that raises questions about the interpretation
118
of their results. On the one hand, the fact that they used a different modality for
their stimuli rather than the one used by the original studies they based their work
on (Vitevitch & Luce, 1998; Vitevitch et al., 1999) complicates the interpretation
of the results in two ways. First, competition effects in the visual modality are not
routinely found, especially in English. Second, it is not yet clear that (a) accessing
phonology from reading is a mandatory step in visual word recognition, (b) that
the effects of phonology on reading, which are mostly facilitatory, are similar to the
effects of phonology in spoken word recognition, which seem to be mostly inhibitory.
In the absence of a clear phonological activation, one could claim that the effect
found by Pylkkanen et al. (2002) was due not necessarily to phonotactic probability,
but to orthotactic probability. However, such effects have not been reported in the
literature about visual word recognition. Moreover, one of the studies (Pylkkanen
et al., 2002) has a potentially damaging visual word length confound.
Given the theoretical interest that a pre-decisional measure of lexical activation
has for models of written and spoken word recognition, and in the light of all these
considerations, we decided to replicate the design of Vitevitch and Luce (1998);
Vitevitch et al. (1999) and Pylkkanen et al. (2002) and extend the results to the
auditory modality, while addressing the issues raised for the confounds for the visual
modality.
119

2.4 Modality of presentation and the effects of Neighborhood Density
and Phonotactic Probability
The first problem identified in the studies by Pylkkanen et al. (2002) and Stockall
et al. (2004) is that when it comes to neighborhood effects, phonological units unex-
pectedly seem to have largely opposite influences according to the modality of stim-
ulus presentation. For spoken words, inhibitory effects for larger and more frequent
neighborhoods are found, whereas for written words, facilitatory effects are found
for larger number of neighbors, and conflicting results are found for neighborhood
frequency. By choosing to change the modality of the presentation of their stimuli,
the interpretation of their results became muddled by these conflicting effects that
modality of stimulus presentation seem to have on lexical competition. The only
way to address this issue is to try to replicate Pylkkanen et al. (2002)’s findings in
both modalities at the same time and see how convergent or divergent they are for
the same set of materials. This problem is further complicated by recent studies
(eg. Ziegler et al., 2003) showing that orthography actually plays a modulatory role
in the recognition of auditorily presented words. Therefore, if one wishes to attempt
a direct comparison between auditory and visual word recognition, great attention
should be given in the construction of the materials. For instance, one should choose
visual words with very transparent pronunciations and straightforward mapping to
phonology.
The second issue we wanted to address relates to the confounding effect of
length in Pylkkanen et al. (2002). Although one could in principle argue this issue
120

was settled since Stockall et al. (2004) controlled their materials for orthographic
length and still found the same M350 modulation that Pylkkanen et al. (2002)
did, there are good reasons to think otherwise. Orthographic length in Stockall
et al. (2004) was only controlled in their conditionwise average. In other words,
while Stockall et al. (2004)’s materials were all strictly matched for phonetic length
(they were all CVC words and nonwords), they were allowed to vary in orthographic
length (3 to 5 characters), and only the averaged length was controlled across lists.
However, given the nature of electrophysiological experiments, which require artifact
rejection on top of error rejections, up to 30% of trials for any given condition could
be thrown out for each subject. The data that is averaged across participants then
could end up being, in the worst case scenario, 60% different. This fact, together
with the observation that means are very non–robust measures of location of any
distribution of values (see for instance Wilcox, 1997, chapter 1 for a particularly
dramatic illustration) makes it very possible that real differences might simply not be
detected if one relies on simple null hypothesis testing in order to assess whether the
differences between two populations of values is statistically significant4. Therefore,
variables such as orthographic length, that were only matched on their average over
complete lists, could very well turn out to be uncontrolled and biased in unkonwn
ways in the data that actually ends up being averaged. In order to sidestep this
issue, one should control orthographic length in the same way that phonetic length
was.
4In fact, it is a statistical fallacy to assume that a lack of a statistically significant result between
two populations implies equality of the populations. See (Tryon, 2001) for details.
121

Finally, in order to increase our chances of replicating the Pylkkanen et al.
(2002) and Stockall et al. (2004) results in both visual and auditory modality simul-
taneously, we need to make sure that both orthotactic and phonotactic probability
are indeed very distinct in our materials. Due to all these constraints, we were
unable to find enough CVC words per condition such as to obtain an adequate
signal–to–noise ratio required by an MEG experiment. Therefore, we chose to use
slightly longer words (CV.CVC).
With such materials, we expected to be able to replicate Pylkkanen et al.
(2002) and Stockall et al. (2004)’s results, and extend their findings to the auditory
modality, which still has not been extensivley done in MEG (see Bowles & Poeppel,
2005 for the only other attempt to investigate spoken word recognition using MEG).
2.4.1 Methods
Participants
20 native English speakers (8 women) participated in the experiment (Mean
age: 21, age range: 18-28). All were right-handed (Oldfield, 1971), had normal or
corrected to normal vision, and reported no history of hearing problems, language
disorders or mental illness. All participants gave their written informed consent to
take part in the study, which was approved by the University of Maryland Institu-
tional Review Board. Subjects were paid for their participation.
Design
A 2x2 design with Lexicality (levels: word vs non–word) and Phonotactic/Orthotactic
122

Probability / Neighborhood Density (Probability/Density) (levels: High/Dense vs
Low/Sparse) as factors was used, yielding the following four experimental condi-
tions: (1) High Probability / Dense Neighborhood words, (2) Low Probability /
Sparse Neighborhood words, (3) High Probability/ Dense Neighborhood non–words,
(4) Low Probability / Sparse Neighborhood non–words.
Materials
Forty-two items in each condition were used. All were five letters long in
their visual form and five segments long in their phonetic form (as transcribed by
the Carnegie Mellon Pronouncing Dictionary v0.6, 1998). The frequency counts
used were from the CELEX database (Baayen et al., 1995). The CELEX database
(Baayen et al., 1995) was used for two main reasons. First, it has been shown that its
frequency counts are more predictive of RT latencies in the lexical decision task than
the frequency counts from the older Kucera and Francis (1967) counts (Balota et
al., 2004). Second, the CELEX database (Baayen et al., 1995) collected frequencies
over written and spoken corpora, and our experiment has both written and spoken
word recognition sections. All experimental items were of CV.CVC syllabic struc-
ture, with first syllable stress. Word items were all primarily nouns and adjectives,
according to their frequency count in the CELEX database (Baayen et al., 1995).
Nonword items, due to their syllabic structure, could have other pronunciations in
their visual form rather than the one intended by the experimenters and therefore
three native speakers were asked to read them aloud; all used the pronunciation that
matched the string of segments intended by the experimenters.
123

Auditory stimuli were recorded in a sound attenuated room by a female native
English speaker into a digital recorder at a sampling rate of 44.1 kHz, and saved as
16-bit mono WAV format. The stimuli were low-pass filtered at 10 kHz, subsequently
edited into individual sound files, whose duration and RMS amplitude were equated
across conditions, and then gated on and off using 10 ms cosine-squared ramps.
Lexical frequency: Lexical frequency (in log) was controlled for words across
the Probability/Density bin. Equality of the frequency means of the High/Dense
condition (x = 7.8, SE = 0.2) with those of the Low/Sparse condition (x = 7.8,
SE = 0.2) was assessed by generating a 95% Confidence Interval for each condition
via the bias corrected and accelerated bootstrap (BCa) method (Efron & Tibshirani,
1993) based on 10000 bootstrap samples. There was almost perfect overlap in their
confidence intervals (see figure 2.1), and therefore we considered the two means
statistically equal (Tryon, 2001).
Phonotactic and Orthotactic Probability: One of our goals was to directly
compare the recognition process of the same set of stimuli varying only on their
modality of presentation. Therefore, we had to manipulate both the orthotactic
and the phonotactic probabilities of our materials. Orthotactic probability refers to
the co–occurence frequency of subsets of characters that comprise the word in its
orthographic form. Phonotactic probability refers to the co-occurence frequency of
subset of segments (or phones) that comprise the word in its phonetic form. We
used three subset sizes (also know as n–grams): unigrams, bigrams and trigrams,
124

Mean Word Frequency per Condition in
Materials
High / Dense Low / Sparse
7
7.5
8
8.5
9
Me
an
lo
g(F
req
ue
nc
y)
Figure 2.1: Materials: Mean lexical frequency of High/Dense and Low/Sparse words.The bars denote 95% Confidence Intervals derived by BCa bootstrap (10000 sam-ples). Since their overlap is almost perfect, we can consider the two mean lexicalfrequency of the two conditions statistically equivalent, and therefore claim thatlexical frequency was controlled in our materials.
125

referring respectively to a subset of size one (one character or segment), two (a
sequence of two characters or segments) and three (a sequence of three characters
or segments).
Moreover, there are a number of dimensions along which one could compute
phonotactic and orthotactic probabilities. We chose to use both type and token
counts, both in position–independent and position–dependent contexts. Type count-
ing consists in determining how many other words in the corpus share a specific set
of characters / segments. Token counting consists in adding the log–frequency of
the other words in the corpus that share a specific set of characters / segments5.
Position–dependent counts take into consideration not only the set of characters
/ segments, but also their position in the word. Position–independent counts take
into consideration only the set of characters / segments, independent on the position
they occur in the word.
For instance, consider the word cat. Suppose we are calculating the overall
orthotactic probability of this word, and we are analyzing its bigrams. This word
has two bigrams ca and at. Consider the first bigram, ca. If we are establishing
how frequent this bigram is by type counting, we would look for other words that
share the same bigram. For each word we find, like cap and can, we would add 1
to our count. By the end of the count, we will have the number of words that share
the bigram ca with the word cat. If we are establishing how frequent this bigram is
by token counting, we do the same thing, but instead of adding 1 to our count, we
add the corpus frequency of the words (log–frequency) that share the bigram under
5This serves as a surrogate to counting every instance of the word in a corpus
126

consideration (for instance, we would add 6.4 for cap and 8.5 for can). Furthermore,
if we are limiting ourselves to Position–Dependent counting, we would only consider
matches for the bigram ca of cat other words that have the same bigram in the
same position. In our example the words cap and can would count as matches, but
not the words Jamaica or local. If we are counting in a Position–Independent way,
however, all of the aforementioned words would count as matches for the bigram ca
in cat.
Therefore, for each n–gram size we used, we had four different ways of com-
puting orthotactic and phonotactic probability, and all were explicitely manipulated
across the Probability conditions. Thus, items in the High Probability bin had both
significantly higher phonotactic and orthotactic probabilities than their counterparts
in the low probability bin according to type and token unigram, bigram and trigram
counts, both in their position–dependent and position–independent variety, total-
ing 12 different dimensions of phonotactic probability and Neighborhood Density
(see tables 2.1 and 2.2 for more details). Statistical significance was established
by multiple one–tailed t–tests for each relevant contrast (High vs Low words and
High vs Low nonwords). P–values were adjusted by Holm’s method for multiple
comparisons (Holm, 1979).
Moreover, effort was put into matching these same parameters for items in the
same phonotactic and orthotactic probability bin. Therefore, words and non–words
in each probability bin were highly similar in their phonotactic and orthotactic
composition.
127

Tab
le2.
1:M
ater
ials
:P
hon
otac
tic
Pro
bab
ility
for
WO
RD
S.E
ach
scor
ere
pre
sents
the
mea
ndiff
eren
cebet
wee
nth
eP
robab
ility
leve
ls,
and
isob
tain
edby
subtr
acti
ng
the
Low
Pro
bab
ility
mea
nfr
omits
corr
espon
din
gH
igh
Pro
bab
ility
mea
n,
for
each
par
ticu
larn–g
ram
.T
hus,
each
scor
ein
the
table
quan
tify
the
diff
eren
cebet
wee
nP
robab
ility
conditio
ns.
Val
ues
larg
erth
anze
roin
dic
ate
that
the
Hig
hP
robab
ility
mea
nis
larg
erth
anth
eLow
Pro
bab
ility
mea
n.
The
larg
erth
eva
lue,
the
larg
erth
ediff
eren
ce.
Sta
tist
ical
sign
ifica
nce
for
each
diff
eren
cesc
ore
was
veri
fied
by
mult
iple
one–
tailed
t–te
sts
for
the
appro
priat
eco
ntr
asts
(Hig
hvs
Low
wor
ds)
.T
he
p–v
alues
for
each
com
par
ison
are
dis
pla
yed
inpar
enth
eses
.A
llp–v
alues
are
adju
sted
for
mult
iple
com
par
ison
sby
Hol
m’s
met
hod
(Hol
m,19
79).
All
p–v
alues
wer
esi
gnifi
cant
atth
eα
=0.
05le
vel,
exce
pt
thos
em
arke
dby
anas
teri
sk(*
).Leg
end:
Pos
itio
n–I
ndep
enden
tT
ype
counts
refe
rsto
the
sum
med
amou
nt
ofot
her
wor
ds
that
shar
en-g
ram
sw
ith
apar
ticu
lar
wor
d.
Pos
itio
n–D
epen
den
tT
ype
counts
refe
rsto
the
sum
med
amou
nt
ofot
her
wor
ds
that
shar
en-g
ram
sin
the
sam
epos
itio
nw
ith
apar
ticu
lar
wor
d.
Pos
itio
n–I
ndep
enden
tTok
enco
unts
refe
rsth
esu
mm
edfr
equen
cyof
allto
kens
that
shar
en-g
ram
sw
ith
apar
ticu
lar
wor
d.
Pos
itio
n–D
epen
den
tTok
enco
unts
refe
rto
the
sum
med
freq
uen
cyof
all
toke
ns
that
shar
en-g
ram
sin
the
sam
epos
itio
nw
ith
apar
ticu
lar
wor
d.
Unig
ram
s
PI-
Type
counts
PD
-Type
counts
PI-
Tok
enco
unts
PD
-Tok
enco
unts
Ort
hog
raphic
2432
0(p
<0.
001)
7061
(p<
0.00
1)11
9813
(p<
0.00
1)36
825
(p<
0.00
1)P
hon
etic
1810
5(p
<0.
001)
6206
(p<
0.00
1)11
1768
(p<
0.00
1)38
549
(p<
0.00
1)
Big
ram
s
PI-
Type
counts
PD
-Type
counts
PI-
Tok
enco
unts
PD
-Tok
enco
unts
Ort
hog
raphic
4956
(p<
0.00
1)83
8(p
=0.
002)
2533
3(p
<0.
001)
4509
(p=
0.00
3)P
hon
etic
3294
(p<
0.00
1)11
09(p
<0.
001)
2044
6(p
<0.
001)
6926
(p<
0.00
1)
Trigr
ams
PI-
Type
counts
PD
-Type
counts
PI-
Tok
enco
unts
PD
-Tok
enco
unts
Ort
hog
raphic
364
(p=
0.03
1)69
(p=
0.03
1)18
52(p
=0.
031)
354
(p=
0.03
1)P
hon
etic
221
(p=
0.00
1)88
(p=
0.00
2)13
50(p
=0.
001)
531
(p=
0.00
2)
128

Tab
le2.
2:M
ater
ials
:P
hon
otac
tic
Pro
bab
ility
for
NO
NW
OR
DS.E
ach
scor
ere
pre
sents
the
mea
ndiff
eren
cebet
wee
nth
eP
rob-
ability
leve
ls,
and
isob
tain
edby
subtr
acti
ng
the
Low
Pro
bab
ility
mea
nfr
omits
corr
espon
din
gH
igh
Pro
bab
ility
mea
n,
for
each
par
ticu
lar
n–g
ram
.T
hus,
each
scor
ein
the
table
quan
tify
the
diff
eren
cebet
wee
nP
robab
ility
conditio
ns.
Val
ues
larg
erth
anze
roin
dic
ate
that
the
Hig
hP
robab
ility
mea
nis
larg
erth
anth
eLow
Pro
bab
ility
mea
n.
The
larg
erth
eva
lue,
the
larg
erth
ediff
eren
ce.
Sta
tist
ical
sign
ifica
nce
for
each
diff
eren
cesc
ore
was
veri
fied
by
mult
iple
one–
tailed
t–te
sts
for
the
appro
pri
ate
contr
asts
(Hig
hvsLow
non
wor
ds)
.T
hep–v
alues
forea
chco
mpar
ison
are
dis
pla
yed
inpar
enth
eses
.A
llp–v
alues
are
adju
sted
for
mult
iple
com
par
ison
sby
Hol
m’s
met
hod
(Hol
m,19
79).
All
p–v
alues
wer
esi
gnifi
cant
atth
eα
=0.
05le
vel,
exce
pt
thos
em
arke
dby
anas
teri
sk(*
).Leg
end:
Pos
itio
n–I
ndep
enden
tT
ype
counts
refe
rsto
the
sum
med
amou
nt
ofot
her
wor
ds
that
shar
en-g
ram
sw
ith
apar
ticu
lar
wor
d.
Pos
itio
n–D
epen
den
tT
ype
counts
refe
rsto
the
sum
med
amou
nt
ofot
her
wor
ds
that
shar
en-g
ram
sin
the
sam
epos
itio
nw
ith
apar
ticu
lar
wor
d.
Pos
itio
n–I
ndep
enden
tTok
enco
unts
refe
rsth
esu
mm
edfr
equen
cyof
allto
kens
that
shar
en-g
ram
sw
ith
apar
ticu
lar
wor
d.
Pos
itio
n–D
epen
den
tTok
enco
unts
refe
rto
the
sum
med
freq
uen
cyof
allto
kens
that
shar
en-g
ram
sin
the
sam
epos
itio
nw
ith
apar
ticu
lar
wor
d.
Unig
ram
s
PI-
Type
counts
PD
-Type
counts
PI-
Tok
enco
unts
PD
-Tok
enco
unts
Ort
hog
raphic
2737
9(p
<0.
001)
7315
(p<
0.00
1)13
5336
(p<
0.00
1)35
921
(p<
0.00
1)P
hon
etic
1773
3(p
<0.
001)
5292
(p<
0.00
1)10
9128
(p<
0.00
1)32
758
(p<
0.00
1)
Big
ram
s
PI-
Type
counts
PD
-Type
counts
PI-
Tok
enco
unts
PD
-Tok
enco
unts
Ort
hog
raphic
5188
(p<
0.00
1)11
24(p
=0.
001)
2658
0(p
<0.
001)
6001
(p=
0.00
1)P
hon
etic
3217
(p<
0.00
1)12
47(p
<0.
001)
1986
8(p
<0.
001)
7803
(p<
0.00
1)
Trigr
ams
PI-
Type
counts
PD
-Type
counts
PI-
Tok
enco
unts
PD
-Tok
enco
unts
Ort
hog
raphic
244
(p=
0.06
5*)
114
(p=
0.00
1)11
79(p
=0.
065*
)58
3(p
=0.
001)
Phon
etic
190
(p=
0.00
1)69
(p=
0.00
1)11
60(p
=0.
001)
415
(p=
0.00
1)
129

Neighborhood Density: Similarity neighborhoods were also manipulated in
both their orthographic and phonetic dimensions. Two measures of neighborhood
density were estimated for each modality: the number of words in the corpus that
could be found by either adding, deleting or substituting one character or segment
from a given word (Coltheart et al., 1977; Vitevitch et al., 1999), and the summed
log–frequency of these same words. We refer to the first measure as the neighborhood
size, and to the second measure as the neighborhood frequency6 of a word. Thus,
items in the dense neighborhood (DN) bin had a significantly larger number of
orthographic and phonetic neighbors which were also significantly more frequent
than their counterparts in the sparse neighborhood (SN) bin (see table 2.3 for more
details). Statistical significance was established by multiple one–tailed t–tests for
each contrast (Dense vs Sparse words and Dense vs Sparse nonwords). P–values were
adjusted by Holm’s method for multiple comparisons (Holm, 1979)7. Moreover, the
size and frequency of the neighborhoods was kept constant across words and non–
words within each neighborhood bin.
6Technically, this measure is called the frequency weighted neighborhood density, and it incor-
porates both information about neighborhood density and neighborhood frequency.7The neighborhoods and phonotactic and orthotactic comparisons were all carried out simul-
taneously, and all the p–values were adjusted accordingly
130

Tab
le2.
3:M
ater
ials
:N
eigh
bor
hood
Den
siti
es.
Eac
hsc
ore
repre
sents
the
mea
ndiff
eren
cebet
wee
nth
eD
ensi
tyle
vels
.In
other
wor
ds,
each
scor
eis
obta
ined
by
subtr
acti
ng
the
Spar
seN
eigh
bor
hood
mea
nfr
omit
sco
rres
pon
din
gD
ense
Nei
ghbor
hood
mea
n,
for
each
par
ticu
lar
esti
mat
eof
nei
ghbor
hood
size
.T
her
efor
e,ea
chsc
ore
inth
eta
ble
counts
asa
diff
eren
cesc
ore
bet
wee
nD
ensi
tyco
ndit
ions.
Val
ues
larg
erth
anze
roin
dic
ate
that
the
Den
sem
ean
isla
rger
than
the
Spar
sem
ean.
The
larg
erth
eva
lue,
the
larg
erth
ediff
eren
ce.
Sta
tist
ical
sign
ifica
nce
for
each
diff
eren
cesc
ore
was
veri
fied
by
multip
leon
e–ta
iled
t–te
sts
for
the
appro
priat
eco
ntr
asts
(Den
sevs
Spar
sew
ords
and
Den
sevs
Spar
senon
wor
ds)
.T
he
p–v
alues
for
each
com
par
ison
are
dis
pla
yed
inpar
enth
eses
.A
llp–v
alues
are
adju
sted
for
multip
leco
mpar
ison
sby
Hol
m’s
met
hod
(Hol
m,
1979
).A
llp–v
alues
wer
esi
gnifi
cant
atth
eα
=0.
05le
vel,
exce
pt
thos
em
arke
dby
anas
teri
sk(*
).
WO
RD
S–
Nei
ghbor
hoods:
Mea
nD
iffer
ence
s(D
ense−
Spa
rse)
Diff
eren
ces
inLex
ical
Nei
ghbor
hoods
Num
ber
ofN
eigh
bor
sSum
med
Fre
quen
cyof
Nei
ghbor
sO
rthog
raphic
3(p
=0.
001)
18(p
=0.
001)
Phon
etic
3(p
<0.
001)
21(p
<0.
001)
NO
NW
ORD
S–
Nei
ghbor
hoods:
Mea
nD
iffer
ence
s(D
ense−
Spa
rse)
Diff
eren
ces
inLex
ical
Nei
ghbor
hoods
Num
ber
ofN
eigh
bor
sSum
med
Fre
quen
cyof
Nei
ghbor
sO
rthog
raphic
3(p
=0.
001)
15(p
=0.
001)
Phon
etic
4(p
<0.
001)
20(p
<0.
001)
131

Uniqueness Point: Uniqueness point refers to the point where a given string of
characters or phonemes becomes unambiguous, i.e., compatible with only one entry
in the mental lexicon. We tried to make the Uniquenss Point of our materials always
be at the end of the word. The mean Uniqueness Point was always controlled across
conditions in both their orthographic and their phonetic form (see table 2.4 for de-
tails). Statistical equivalence of the means was assessed by deriving 95% Confidence
Intervals for each condition via the bias corrected and accelerated bootstrap (BCa)
method (Efron & Tibshirani, 1993), based on 10000 bootstrap samples. There was
almost perfect overlap in their confidence intervals (see figures 2.2), and therefore
we considered the two means statistically equal (Tryon, 2001). However, a word of
caution is warranted about the relevance and interpretation of the Uniqueness Point.
The Uniqueness Point is not the same thing as the Recognition Point. It has been
known for a long time that speakers can reliably recognize spoken words with only
partial information (Marslen-Wilson, 1973; Marslen-Wilson & Tyler, 1975, 1980), so
the Uniqueness Point should be taken as an index of how much possible ambiguity
there is in the signal, not as an index of how much ambiguity there actually is.
Moreover, the way we computed Uniqueness Points was very coarse. For instance,
according to our metric, virtually all singular nouns would have their Uniqueness
Point at the end of the word due to the simple fact that most nouns have plural
forms. Whether or not this is a problem or a feature of our way of quantifying
Uniqueness Points depends on how plurals and singular nouns are represented. If
plurals and singulars are independently represented in the lexicon, then one should
expect competition between the two entries, and therefore considering plurals in our
132

Table 2.4: Materials: Mean Uniqueness Points.
Mean Orthographic UP Mean Phonetic UP
Word Nonword Word NonwordHigh/Dense 5 5 4.9 4.9Low/Sparse 4.9 4.9 4.9 4.9
Orthographic Uniqueness Point
High / DenseWord Low / Sparse
Word
High / DenseNonword
Low / SparseNonword
4.6
4.7
4.8
4.9
5
5.1
Me
an
Un
iqu
en
es
s P
oin
t
Phonetic Uniqueness Point
High / DenseWord
Low / SparseWord
High / DenseNonword
Low / SparseNonword
4.6
4.7
4.8
4.9
5
5.1
Me
an
Un
iqu
en
es
s P
oin
t
Figure 2.2: Materials: Orthographic Mean Uniqueness Point for each experimentalcondition. The bars denote 95% Confidence Intervals derived by BCa bootstrap(10000 samples). Since their overlap is almost perfect, we can consider all conditionmeans to be statistically equivalent, and therefore claim that Uniqueness Point wascontrolled in our materials.
way of quantifying Uniqueness Points is warranted. If plurals and singulars are rep-
resented under one entry alone, then we might expect that competition between the
forms would not arise, and therefore our way of computing Uniqueness Points might
be biased. On this issue, there is a lot of cross–linguistic discrepant results reported
in the literature (Baayen et al., 1997; Domınguez et al., 1999; New et al., 2004), but
there is evidence that singulars and plurals are indeed independently represented in
the lexicon at least for English (Sereno & Jongman, 1997, but see Alegre & Gordon,
1999 for some qualifications about this claim).
133

Procedure
Subjects were placed horizontally in a dimly lit magnetically shielded room
(Yokogawa Corporation, Tokyo, Japan) and were screened for MEG artifacts due
to dental work, and excessive eye-blinking. A scout scan was performed with the
purposes of verifying the presence of identifiable MEG responses to 1 kHz and 250 Hz
pure tones (M100) and determining adequate head positioning inside the machine.
Stimulus presentation and experiment control was carried out by the DMDX
program (Forster & Forster, 2003). In both sections of the experiment (visual and
auditory), each presentation of a word or non-word was preceded by the display of
a fixation point projected onto the center of a rear-projection screen for 1s. In the
auditory section, subjects were asked to keep their eyes closed to reduce the like-
lihood of eye-blinking artifacts. The interstimulus interval pseudorandomly varied
between 400 and 1500ms in both sections.
Subjects were instructed to decide whether each stimulus item was a real word
or not (lexical decision), and to respond as quickly and accurately as possible using
a button box placed in their right hand. Visual stimuli remained on the screen for
3000ms or until subjects responded. Auditory stimuli were always played in their
entirety, and subjects were given 3500ms from the onset of presentation to respond.
Accuracy and reaction times from the onset of stimulus presentation were recorded.
Auditory stimuli were presented binaurally at 60–70dB SPL over E-A-RTONE® 3A
(Aearo Company Auditory Systems, Indianapolis, IN) earphones attached to E-A-
RLINK® foam plugs inserted into the ear canal. Visual stimuli were presented
134

using the Courier New font (size 12), in yellow over a black background.
Subjects were first given a practice session of 8 items to help familiarize them
with the task. Each section of the experiment was administered in two blocks, in
between which participants could take a break. The order of presentation of sections
was counter-balanced across subjects. Stimuli presentation was randomized within
each section. A distractor face viewing task was inserted between sections, and
lasted approximately 25 minutes.
MEG data acquisition and analysis
MEG recordings were conducted using a 160–channel axial gradiometer whole-
head system (Kanazawa Institute of Technology, Kanazawa, Japan). Data were
sampled at 500 Hz and acquired continuously with a bandwidth between DC to
200 Hz. In order to remove external sources of noise artifacts a time–shift PCA
filter (de Cheveigne & Simon, 2007) was used. Epochs with artifacts exceeding ±2
pT in amplitude were removed before averaging. Incorrect behavioral responses
and trials where subjects failed to respond were also excluded from both behavioral
and MEG data analysis. Subjects with behavioral error rates larger than 10% were
excluded from any further analysis. Data from one subject was eliminated based on
this criterion. Subjects whose data had less than 30 trials (70%) in any condition
surviving error and artifact rejection were also excluded from further analysis. Data
from three other subjects were eliminated based on this criterion. Data from 16
subjects remained, with 9.5% of the data from the visual modality section and 10%
from the auditory modality section being discarded. Following averaging, data were
135

baseline corrected using a 100ms prestimulus interval and were lowpass filtered at
20 Hz.
For each subject, five sensors in the source (outgoing magnetic field) and five
sensors in the sink (ingoing magnetic field) were chosen to represent the M350 com-
ponent based on which sensors best captured the dipolar fields on the left hemisphere
when all trials of each condition for the subject were averaged together. For the vi-
sual section, we followed the literature, and only the first root mean square (RMS)
peak across the chosen 10 channels for each stimulus condition was analyzed. The
latency, amplitude, rise time (time from valley to peak) and overall peak duration
(time from the valley preceding the first peak to the valley following the peak) were
recorded and used in the data analysis.
For the auditory section, a similar procedure was attempted. However, the
auditory evoked response displayed several peaks starting from around 250ms and
persisting until around 800ms, with mostly the same dipole distribution. Moreover,
the number of peaks was not necessarily consistent across conditions for individual
subjects. Therefore, selecting only the first peak in the 300-420ms window with the
right dipolar field, as was done for the visual section, would not yield consistent
results. Instead, we visually inspected the RMS wave of all the four conditions for
each subject, identified the M100 response for each condition, and then proceeded
from there, inspecting for each condition each subsequent peak and its distribu-
tion, looking for analogues in the other conditions. Peaks that (i) were very salient
in all four conditions, (ii) were optimally spatially selected in terms of the dipolar
distributions of the 10 selected channels, and (iii) were considered to be analogues
136

Table 2.5: Mean reaction time latencies (in ms) for each experimental section. Stan-dard Errors are presented betweeen parentheses.
Behavioral Results (N = 16)
Visual Auditory
Word Nonword Word NonwordHigh / Dense 647 (22) 687 (19) 1007 (17) 1082 (23)Low / Sparse 670 (21) 671 (16) 1012 (20) 1039 (20)
of each other based on their comparative temporal morphology since the M100 re-
sponse were selected for analysis. Like in the visual section, their latency, amplitude,
rise time and overall duration were recorded and used in the data analysis.
2.4.2 Results
2.4.2.1 Behavioral
Separate Lexicality X Probability repeated–measures ANOVAs were performed
on subjects’ mean reaction times for each modality section (visual and auditory).
Table 2.5 shows the mean results for both sections.
Visual section
The main effects of Lexicality (F(1,15)= 2.3414; ns) and Probability/Density
(F (1, 15) = 0.3098; ns) did not reach statistical significance, but the interaction
between them did (F (1, 15) = 12.662; p = 0.003). Two post-hoc comparisons (two–
tailed paired t–tests, Bonferroni corrected p–values) revealed that reaction times for
words in the High/Dense bin (x = 647ms) was statistically different from the mean
reaction time for words in the Low/Sparse bin (x = 670ms; mean difference= 16ms;
137

Word Non−Word
High Probability / DensityLow Probability / Density
Visual section
RT
(in
ms)
500
550
600
650
700
750
800
850
Word Non−Word
High Probability / DensityLow Probability / Density
Auditory section
RT
(in
ms)
900
950
1000
1050
1100
1150
Figure 2.3: Mean reaction times (in ms) for each modality of presentation. Errorbars show Standard Errors.
t(15) = 2.5442, p = 0.044), the same being true for non–words as well, but in the
opposite direction, with High/Dense nonwords (x = 687ms) being responded to
slower than nonwords in the Low/Sparse condition (x = 671ms, mean difference=
22ms; t(15) = 2.5575, p = 0.045). A summary of the results is presented in figure 2.3.
Auditory section
The effects of Lexicality (F (1, 15) = 11.671; p = 0.004) and Probability/Density
(F (1, 15) = 15.511; p = 0.001) were statistically significant, as well as their inter-
action (F (1, 15) = 10.873; p = 0.004). Two post-hoc comparisons (two–tailed
paired t–tests, Bonferroni corrected p–values) revealed that reaction times for non–
words in the High/Dense condition (x = 1082ms) were statistically different from
reaction times for non–words in the Low/Sparse condition (x = 1039ms; mean
difference= 43ms; t(15) = 3.8378, p = 0.0032), which was not the case in for words
138

in the two Probability conditions (mean difference= 5ms; t(15) = 0.9728, ns), as
can be seen in figure 2.3.
2.4.2.2 MEG: M350
Separate Lexicality X Probability repeated–measures ANOVAs were performed
on subjects’ M350 peak latencies, amplitudes, rise times and overall durations, for
each modality section (visual and auditory).
Visual section
The data for the M350 peak analysis of the visual section is summarized in
table 2.6. None of the main effects or interactions turned out significant, as can be
seen below:
Peak Latency: Main effects of Lexicality (F (1, 15) = 2.7611, ns) and Proba-
bility (F (1, 15) = 2.1429, ns) were not significant, and neither was their interaction
(Lexicality x Probability, F (1, 15) < 0.0001, ns). See figure 2.4 for a comparison
between reaction time latencies and the M350 latencies.
Peak Amplitude: Main effects of Lexicality (F (1, 15) = 0.3999, ns) and Prob-
ability (F (1, 15) = 0.1277, ns) were not significant, and neither was their interaction
(Lexicality x Probability, F (1, 15) = 1.294, ns).
Peak Rise Time: Main effects of Lexicality (F (1, 15) = 0.1271, ns) and Prob-
ability (F (1, 15) = 0.2667, ns) were not significant, and neither was their interaction
139
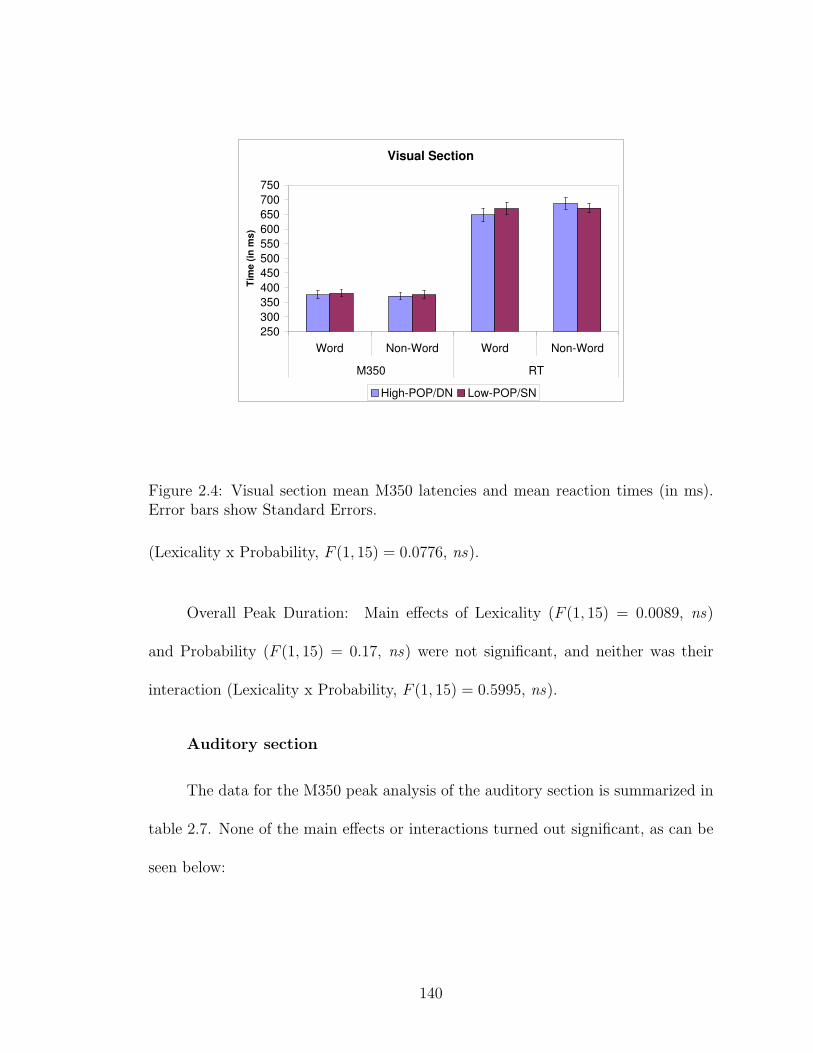
Visual Section
250
300
350
400
450
500
550
600
650
700
750
Word Non-Word Word Non-Word
M350 RT
Tim
e (
in m
s)
High-POP/DN Low-POP/SN
Figure 2.4: Visual section mean M350 latencies and mean reaction times (in ms).Error bars show Standard Errors.
(Lexicality x Probability, F (1, 15) = 0.0776, ns).
Overall Peak Duration: Main effects of Lexicality (F (1, 15) = 0.0089, ns)
and Probability (F (1, 15) = 0.17, ns) were not significant, and neither was their
interaction (Lexicality x Probability, F (1, 15) = 0.5995, ns).
Auditory section
The data for the M350 peak analysis of the auditory section is summarized in
table 2.7. None of the main effects or interactions turned out significant, as can be
seen below:
140

Table 2.6: Visual section M350 peak analysis. Standard Errors are presented inparentheses. Legend: H/D=High Probability / Dense Neighborhood, L/S=LowProbability / Sparse Neighborhood, Lat.=Peak Latency, Ampl.=Peak Amplitude,Rise=Peak rise time, Dur.=Overall Peak Duration.
Visual M350 Peak analysis – Different parameters
Lat. (in ms) Ampl. (in pT) Rise (in ms) Dur. (in ms)
Word N-Word Word N-Word Word N-Word Word N-WordH/D 375 (14) 371 (12) 136 (11) 145 (13) 68 (6) 71 (7) 122 (8) 128 (13)L/S 381 (12) 376 (14) 139 (10) 137 (14) 66 (7) 67 (8) 125 (16) 117 (10)
Auditory Section
250
350
450
550
650
750
850
950
1050
1150
Word Non-Word Word Non-Word
M350 RT
Tim
e (
in m
s)
High-POP/DN Low-POP/SN
Figure 2.5: Auditory section mean M350 latencies and mean reaction times (in ms).Error bars show Standard Errors.
Peak Latency: Main effects of Lexicality (F (1, 15) = 2.1799, ns) and Proba-
bility (F (1, 15) = 1.0299, ns) were not significant, and neither was their interaction
(Lexicality x Probability, F (1, 15) = 0.2297, ns). See figure 2.5 for a comparison
between reaction time latencies and the M350 latencies.
141

Table 2.7: Auditory section M350 peak analysis. Standard Errors are presentedin parentheses. Legend: H/D=High Probability / Dense Neighborhood, L/S=LowProbability / Sparse Neighborhood, Lat.=Peak Latency, Ampl.=Peak Amplitude,Rise=Peak rise time, Dur.=Overall Peak Duration.
Auditory M350 Peak analysis – Different parameters
Lat. (in ms) Ampl. (in pT) Rise (in ms) Dur. (in ms)
Word N-Word Word N-Word Word N-Word Word N-WordH/D 428 (14) 436 (11) 132 (15) 136 (12) 60 (6) 64 (9) 99 (9) 101 (8)L/S 433 (14) 447 (10) 133 (15) 136 (12) 54 (5) 74 (12) 102 (8) 113 (12)
Peak Amplitude: Main effects of Lexicality (F (1, 15) = 0.382, ns) and Prob-
ability (F (1, 15) = 0.006, ns) were not significant, and neither was their interaction
(Lexicality x Probability, F (1, 15) = 0.032, ns).
Peak Rise Time: Main effects of Lexicality (F (1, 15) = 1.7572, ns) and Prob-
ability (F (1, 15) = 0.0589, ns) were not significant, and neither was their interaction
(Lexicality x Probability, F (1, 15) = 1.7447, ns).
Overall Peak Duration: Main effects of Lexicality (F (1, 15) = 0.3953, ns)
and Probability (F (1, 15) = 0.5088, ns) were not significant, and neither was their
interaction (Lexicality x Probability, F (1, 15) = 0.4149, ns).
2.4.3 Discussion
Behavioral results – Visual section
In the visual modality, our results replicated the standard neighborhood size
facilitatory effect that is commonly found in the literature on English visual word
142

recognition (see Andrews, 1997 and Perea & Rosa, 2000 for reviews). Moreover, since
in our materials neighborhood size and neighborhood frequency were correlated, and
neighborhood frequency is reported to have inhibitory effect on recognition (at least
in other languages), we would not have been surprised to find a null or inhibitory
effect of neighborhood frequency, since the inhibition would offset the facilitation
boost given by neighborhood size. That is however not what we find for words in
our data. Therefore this experiment adds to the long list of studies that fail to find
inhibitory effects of neighborhood frequency for written words in English (Sears et
al., 1995; Sears, Lupker, & Hino, 1999; Sears, Hino, & Lupker, 1999; Huntsman &
Lima, 2002; Sears et al., 2006).
Moreover, since phonological and orthographical neighborhoods were corre-
lated as well in our materials, we can compare them to the results reported by Yates
(2005, Yates et al., 2004) for English. Yates (2005, Yates et al., 2004) controlled
orthographic neighborhood and manipulated only the phonological neighborhood
size of his written words, and did report a facilitatory effect of neighborhood size.
Our results are compatible with these, since we also found facilitatory neighborhood
size results. However, orthographic neighborhood size was confounded with phono-
logical neighborhood size in our materials, so any claims that our effect is a direct
result of phonological neighborhood size are definitely not warranted.
On the other hand, Peereman and Content (1997), Ziegler and Perry (1998),
and Grainger et al. (2005) found that when orthographic neighborhoods included
phonological neighbors in French, facilitatory neighborhood effects were found for
visually presented words. It is unclear whether this effect is due to the overlap con-
143

sistency between the two kinds of neighborhoods (are both neighborhoods inhabited
by the same words, or different words?), or whether the phonological neighborhood
size alone is driving the effect in these languages, like Yates, (2005 Yates et al.,
2004) reported for English. Our data cannot answer this question without a thor-
ough evaluation of the phonological–orthographic consistency of our neighborhoods.
However, we found the same pattern of results they report.
Furthermore, our results are also partially compatible with Stockall et al.
(2004)’s, who reported a facilitatory effect of phonological neighborhood in the
recognition of visually presented words in the low frequency range.
The picture that emerges from the result of all these studies is that, at least
in English, phonological neighborhood size and frequency do not seem to compete
with the effects of orthographic neighborhood size and frequency. Pylkkanen et al.
(2002)’s behavioral result remains to my knowledge the only study to have found
inhibitory phonological neighborhood frequency effects in visually presented words.
We did however find the exact opposite effect for our nonwords. This does
replicate Pylkkanen et al. (2002)’s behavioral findings for nonwords, and indicate
that perhaps there is a yet unknown asymmetry in the way phonological neighbor-
hoods influence recognition of visual words and nonwords.
Behavioral results – Auditory section
Although our nonword data does replicate the inhibitory effect of neighborhood
size and frequency in auditory word recognition (eg. Goldinger et al., 1989, 1992;
P. A. Luce & Pisoni, 1998), we failed, much to our surprise, to replicate it in our
144

word data, finding instead a null effect.
After careful analysis of some of the results in the literature, however, we
came under the impression that even in the auditory domain, the inhibitory neigh-
borhood size and frequency effects are not so well established, especially when it
comes to reaction time latencies in auditory lexical decision task. Many of the stud-
ies that report inhibitory effects of phonological neighborhood size and frequency
use disparate dependent measures, and there are often discrepancy and inconsis-
tencies between them. Some studies find effects of inhibition only in error rates,
but not in reaction time latencies (Cluff & Luce, 1990). Vitevitch et al. (1999), for
example, finds inhibition effects for words in naming latencies, but not in speeded
same–different judgment tasks, which P. A. Luce and Large (2001) do find. Even
more puzzling, Vitevitch et al. (1999, experiment 3) report a main inhibitory effect
of neighborhood frequency for reaction time latencies in the recognition of words
and nonwords, much like we did. However, they do not report the planned compar-
isons within each lexicality bin, as they do for all their other experiments. Given
their graphs, there is a possibility that this main inhibition effect might be like
ours, driven exclusively (or mainly) by the nonword results. Finally, in a recent
study Vitevitch and Rodrıguez (2005) found facilitatory effects of neighborhood
size and family in spoken word recognition in Spanish. This suggests that to the
extent that the neighborhood inhibition effect for spoken words is real, it is weaker
and less reliable than what has been previously suggested (e.g. P. A. Luce & Pisoni,
1998).
145

M350 data
We were expecting to replicate Pylkkanen et al. (2002)’s and Stockall et al.
(2004)’s studies and find reliable phonotactic and orthotactic probability effects in
our electrophysiological data in both modalities. Regardless of how the behavioral
data turned out, we anticipated large probability effects, due to the magnitude
of the manipulation of this variable in our materials, and simultaneous control of
possible interefering factors. However, instead of finding a robust facilitatory effect
on the M350 latency, we failed to find in either modality of presentation any effect of
phonotactic and orthotactic probability in any of the four different M350 parameters
we analyzed. In fact, the M350 latency looks exactly the same across conditions in
our experiment. This strongly suggests that contrary to Pylkkanen et al. (2002)’s
interpretation, the M350 is indeed not tracking phonotactic probability.
It is somewhat surprising that no effect of lexicality has been observed in the
M350 latency, since effects of lexical frequency have been reported to modulate the
peak of the response (Embick et al., 2001). However, Stockall et al. (2004) has also
failed to observe a lexical frequency–induced modulation of the M350 latency.
Our results do not replicate Pylkkanen et al. (2002) and Stockall et al. (2004),
and we have at least two reasons to favor our results over theirs. First, their results
could be due either to uncontrolled variables (such as Orthographic Length, that
is confounded with Phonotactic Probability in Pylkkanen et al. (2002)), or to a
condition–wise averaged controlled variable ended up uncontrolled and biased due
to the fact that artifact and error rejection procedures can discard large portions of
146

the materials. The second (and perhaps most important) reason is that it is very
hard to accomodate the central assumption that phonotactic probability will play
an effect in reading in the exact same way that it does in auditory word recognition
with the findings reported in the literature that phonology affects reading in the
opposite way it affects spoken word recognition. We believe our study had less
possible sources of interference and more power to detect a phonotactic probability
effect (if there was one), due to both our attempt to use auditorily presented words,
and our careful manipulation of sublexical probability in our materials.
2.5 General Discussion and Future Directions
This work has focused on a very specific topic, a putative neural correlate of
word recognition. Given the potentially central role that such a dependent measure
could have in current research in lexical access, and the possibilities that it would
offer to researchers interested in the nature of lexical representations and how they
are retrieved and put to use, we felt justified in trying to replicate and extend
to the auditory modality the exciting results reported by Pylkkanen et al. (2002)
and Stockall et al. (2004), and while doing so, we tried to solve some problems
and inconsistencies we observed in their results and other current findings in the
behavioral literature.
However, the final result was complicated. First, our word data was entirely
compatible and in line with previous findings in the visual word recognition liter-
ature, whereas our auditory data added more ambiguity to a series of conflicting
147

findings previously reported about the effect of neighborhood density and frequency
in the recognition time of spoken words. Our nonword data in both modalities
seemed to pattern with the standard claims that neighborhood size and frequency
inhibit recognition. At present we do not have any explanation for this, but we
do note that several studies have identified variables that interact with lexical fre-
quency (eg. Westbury & Buchanan, 2002; Andrews, 1997) in both linear and non-
linear ways (New et al., 2006), and this could be a source of some of the discrepancy
between our word and nonword data (and perhaps in fact of much of the discrepancy
in the literature).
However, if that is the case, then it becomes extremely difficult to perform
any kind of factorial parametric investigation of lexical properties, especially in
electrophysiological experiments where artifact and error rejection can exclude large
portions of materials, thereby greatly increasing the risk of eliminating conditionwise
averaging controls over materials that are scant to begin with. This concern is not
new (Cutler, 1981), and perhaps it is time that approaches such as the ones proposed
by Baayen (2004) and Balota et al. (2004) of using more sophisticated modeling in
multiple regression designs become more widespread (see Max & Onghena, 1999;
Baayen, 2004 for reviews, and Hauk et al., 2006, Hauk, Pulvermuller, Ford, Marslen-
Wilson, & Davis, 2009, and Solomyak & Marantz, 2009 for similar proposals for
analysis of electrophysiological data)8.
8Indeed, most of the experiments about lexical properties such as neighborhood frequency rely
on different lists of materials for each condition. Each word has inherently different and unique
characteristics, and for any arbitrary grouping of words, differences are to be expected. Therefore,
148

Moreover, our MEG data found absolutely no effect of phonotactic and or-
thotactic probability in the M350. We propose that this response does not track
phonotactic probability at all. On a more positive note, we were able to identify
and study an auditory correlate of the M350 response, which strongly suggests that
this response is independent of the modality of input. Moreover, the auditory M350
is very reliably elicited, which is encouraging for future studies.
it is not surprising at all that differences between conditions will be found in this kind of experiment.
The crux of the matter is that any such difference is only interpretable to the extent that all other
possibly confounding variables have been controlled. However, in the case of word recognition, the
list of variables that has been shown to influence performance is huge, but only a handful are ever
controlled in any single experiment. Perhaps that is why results are so discrepant across languages
and manipulations. If we can sidestep this kind of design, perhaps we will get data that is more
easily interpretable.
149

Chapter 3
Memory representations in word recognition: Experiment 2
3.1 Introduction
It has long been known that repeated presentations of words in a lexical de-
cision task improve performance for repeated items when compared to their first
occurrence (eg. Forbach, Stanners, & Hochaus, 1974; Scarborough et al., 1977).
This phenomenon is normally referred to as the repetition priming effect. A classic
assumption in psycholinguistic theories of word recognition is that repetition prim-
ing reflects facilitation in retrieving information from long–term memory (i.e., the
lexicon). It is often assumed that this facilitation is a direct byproduct of small
structural changes in the access of the orthographic codes supporting visual word
recognition. For instance, in Morton, 1979’s classic logogen theory, when a word
is retrieved from the lexicon, its activation level is modified; when a word is later
repeated, this subsequent presentation benefits from the modified activation level
brought about by the previous one.
Repetition effects are also investigated in electrophysiological studies. Repe-
tition effects for written words are standardly reported in the 250ms–650ms post-
stimulus onset window in the ERP literature (e.g. Rugg, 1987; Van Petten, Kutas,
Kluender, Mitchiner, & McIsaac, 1991; Besson & Kutas, 1993, 1993; Rugg, Cox, et
al., 1995). The ERP repetition effect consists of more positive going waveforms for
150

repeated words than those observed for their first presentation. Its magnitude is
undiminished for lags zero to as many as 19 between the first and second presenta-
tion (Bentin, 1989; Nagy & Rugg, 1989), but it dissipates under 15 minutes (Rugg,
1990), similar to what has been reported in behavioral studies (Forbach et al., 1974).
However, it is also known that not only words, but legal nonwords (pseu-
dowords) and, in some circumstances, even illegal nonwords (nonwords) elicit be-
havioral repetition effects (Feustel, Shiffrin, & Salasoo, 1983; Salasoo, Shiffrin, &
Feustel, 1985; Logan, 1988; Bowers, 1994). By definition, these strings do not have
long–term memory representations. Therefore, the repetition effect for nonwords
cannot have its locus in the modification of long–term memory representations, as
is commonly proposed for words. Several models accommodate repetition effects of
nonwords by proposing that the facilitation for their repeated presentation is due
to the retrieval of the episodic memory trace formed in the first encounter with
the item (Feustel et al., 1983; Salasoo et al., 1985; Logan, 1988; Wagenmakers,
Zeelenberg, Steyvers, Shiffrin, & Raaijmakers, 2004).
The fact that repetition effects of nonwords can be accounted by appealing
to retrieval of episodic memory traces rather than change in some aspect of long–
term memory representations (such as the words’ resting activation levels) raises the
possibility that episodic encoding could also be at play in the case of repetition of
words. Indeed, some researchers do propose that repetition effects of words can and
should be explained in terms of episodic memory trace retrieval, and that there is
little evidence or theoretical necessity for positing that modification of access condi-
tions for long–term memory representations have anything to do with the repetition
151

effect for words (see Tenpenny, 1995 for review).
Other researchers claim that there are indeed different mechanisms underly-
ing the repetition effects found for words and pseudowords (Morton, 1979; Bowers,
1996; Wagenmakers et al., 2004), and that these mechanisms are dissociable exper-
imentally by varying tasks or task demands (see Bowers, 2000 for review).
One such dissociation was demonstrated by Pallier, Colome, and Sebastian-
Galles (2001), who reported behavioral repetition effects for words, but not pseu-
dowords. Pallier et al. (2001) investigated highly fluent early Spanish and Catalan
bilinguals who had nonetheless either Spanish or Catalan as their dominant lan-
guage. Catalan has phonological contrasts that Spanish lack, like the distinction
between /e/ and /E/, and this difference in the phonological inventory of the two
languages has been demonstrated to have perceptual consequences: Highly fluent
early bilinguals whose dominant language was Spanish failed to show, across a wide
range of tasks, the ability to distinguish Catalan–specific contrasts, despite exten-
sive exposure to and highly proficient command of the language (Bosch, Costa, &
Sebastian-Galles, 2000; Pallier, Bosch, & Sebastian-Galles, 1997; Sebastian-Galles &
Soto-Faraco, 1999). Pallier et al. (2001) used an auditory lexical decision task where
Catalan words and pseudowords were sometimes repeated within 8 to 20 intervening
presentations to two groups of highly proficient early Catalan–Spanish bilinguals,
all born and raised in Barcelona or its metropolitan region. The first group had
been raised in a Catalan speaking household until they were sent to kindergarten,
at which time they started receiving a bilingual Catalan and Spanish education.
The second group had been raised in a Spanish speaking household prior kinder-
152

garten, at which time they started receiving the same bilingual education delivered
to the first group. The Catalan words and pseudowords used in the experiment
could be either part of a Catalan–specific minimal pair (like /neta/ ‘granddaughter’
vs /nEta/ ‘clean, feminine’) or a part of a minimal pair based on a phonological
contrast common to both Catalan and Spanish (like /tia/ ‘aunt’ vs. /dia/ ‘day’).
Within 8 to 20 intervening presentations from a critical item, subjects encountered
either a minimal pair of that item (that could be Catalan–specific or shared with
Spanish) or a second presentation of the same item. Pallier et al. (2001) reported
that the two groups exhibited repetition effects only to Catalan words, but not
pseudowords, suggesting that the task was indeed tapping lexical level representa-
tions. Moreover, speakers in the group that had Spanish as their dominant language
showed a similar reaction time reduction to what had been found for repeated words
in the Catalan–specific minimal pairs (eg. neta/ . . . /nEta/), but not for minimal
pairs based on phonological contrasts present in both Catalan and Spanish (eg.
/tia/ . . . /dia/). Catalan speakers on the other hand, only showed repetition ef-
fects for the repeated–word condition, and never for the minimal pair condition.
The fact that the repetition effect in the lexical decision task was specific to words
and and was not observed for pseudowords is compatible with the view that repeti-
tion effects of words and pseudowords might be subserved by different mechanisms.
Moreover, the fact that facilitation effects of the same magnitude of repetition ef-
fects were found for Catalan–specific minimal pairs only in the Spanish–dominant
group suggests that the mechanisms underlying medium term repetition priming tap
into long term phonological memory representations rather than episodic acoustic
153

memory traces.
The repetition effect of nonwords has also been observed in ERP research, both
in immediate priming paradigms (Deacon, Dynowska, Ritter, & Grose-Fifer, 2004)
and short–term priming contexts (Rugg, Cox, et al., 1995 used a sporadic lag of 6),
and it shows very similar neural signatures to the repetition of words, although with
slightly later onsets in short-term priming contexts (e.g., Rugg, Cox, et al., 1995);
within immediate priming contexts, repetition of words and pseudowords alike elicit
smaller evoked potentials within the 300-500ms window (Deacon, Grose-Fifer, et al.,
2004). The similarity in the immediate repetition effects of words and pseudowords
has also been replicated in MEG for the same time window (Pylkkanen, Stringfellow,
Flagg, & Marantz, 2000).
However, Sekiguchi, Koyama, and Kakigi (2001), using a lag of 8 interven-
ing presentations in a short-to-medium term repetition priming paradigm, reported
word–specific reduction in the amplitude of the MEG evoked response over left
hemisphere sensors in the 300-500ms post-stimulus onset window for the second
presentation when compared to the first. Given the way the evoked response frac-
tionated the lexical status of the stimuli, Sekiguchi et al. (2001) concluded that its
neural sources subserve the mental lexicon (i.e, long term memory storage of words),
but not general visual episodic memory traces.
Moreover, the fact that the lag used by Sekiguchi et al. (2001) is very similar
to the low range of lags used by Pallier et al. (2001) and that Pallier et al. (2001) also
reported behavioral word-specific repetition priming effects suggests that medium-
term priming seems to be a paradigm that offers selective sensitivity to lexical status
154

in long–term memory as opposed to sensitivity to recent trace formation in episodic
memory. Here, however, a caveat is warranted: Pallier et al. (2001)’s experiment
was done auditorily and collected only lexical decision data, whereas Sekiguchi et al.
(2001)’s used visual word presentation and did not collect behavioral lexical decision
data. Therefore, their results are not directly comparable.
In order to ascertain whether or not medium–term repetition priming is indeed
selective to word stimuli (as opposed to pseudowords), we designed an MEG exper-
iment very similar to the behavioral one reported by Pallier et al. (2001), in which
subjects made lexical decisions to every item. However, instead of using auditory
stimuli, words were presented visually, as in the experiment reported by Sekiguchi
et al. (2001). This design allows us to directly test the prediction that medium–
term priming is selectively sensitive to word repetition as opposed to pseudoword
repetition, both at the behavioral and electrophysiological levels.
3.1.1 Methods
Participants
22 native English speakers (11 women) participated in the experiment (Mean
age: 20, age range: 18-24). All were right-handed (Oldfield, 1971), had normal or
corrected–to–normal vision, and reported no history of hearing problems, language
disorders or mental illness. All participants gave their written informed consent to
take part in the study, which was approved by the University of Maryland Institu-
tional Review Board. Subjects were paid for their participation.
155

Design and Materials
A list of 108 high–frequency words (all predominantly noun) and 108 pseu-
dowords was created. A medium–lag repetition paradigm was implemented in which
each word and pseudoword was presented twice in a standard lexical decision task.
The lag between the first and second presentations for each item varied pseudoran-
domly between 9 and 25 items. The first presentation of each item was considered
to be the Prime condition and the second presentation the Target condition.
Procedure
Subjects were placed horizontally in a dimly lit magnetically shielded room
(Yokogawa Corporation, Tokyo, Japan) and were screened for MEG artifacts due
to dental work and excessive eye blinking. A scout scan was performed with the
purposes of verifying the presence of identifiable MEG responses to 1 kHz and 250 Hz
pure tones (M100) and determining adequate head positioning inside the machine.
Stimulus presentation and experiment control was carried out by Presenta-
tion® software (Version 10.3, www.neurobs.com). Subjects were instructed to de-
cide whether each stimulus was a real word or not, and to respond as quickly and
accurately as possible using a button box placed in their right hand. Each pre-
sentation of a word or pseudoword was preceded by the display of a fixation point
projected onto the center of a rear-projection screen, which was then substituted
by a blank screen, and subsequently by the stimulus presentation. Fixation point
duration was randomly varied between 500 and 600 milliseconds. The duration of
the blank screen between the fixation point and the presentation of the stimulus
156

varied randomly between 250 and 350 milliseconds. Items remained on the screen
for 3000ms or until subjects responded, and accuracy and reaction times from the
onset of stimulus presentation were recorded. The intertrial interval was randomly
varied between 300 and 750 milliseconds.
Subjects were first given a practice session of 12 items (half words and half
pseudowords, neither of which were included in the experimental list) to help fa-
miliarize them with the task. The experiment was administered in four blocks,
in between which participants could take a break. The order of presentation of
blocks was counter-balanced across subjects. The experiment lasted approximately
35 minutes.
MEG data acquisition and analysis
MEG recordings were conducted using a 160–channel axial gradiometer whole-
head system (Kanazawa Institute of Technology, Kanazawa, Japan). Data were
sampled at 1000 Hz and acquired continuously with a bandwidth between DC to
200 Hz. In order to remove external sources of noise artifacts, a time–shift PCA filter
was used (de Cheveigne & Simon, 2007). Furthermore, epochs in which amplitudes
exceeded ±2pT were further excluded from both behavioral and MEG data analysis.
Three subjects were excluded due excessive artifacts, and one subject was excluded
due to technical problems during data acquisition.
Incorrect behavioral responses and trials where subjects failed to respond were
also excluded from both behavioral and MEG data analysis. Data from three sub-
jects were excluded from any further analysis due to an error rate larger than 15%.
157

Only items for which both Prime and Trial level presentations survived the
exclusion criteria reported above were selected for further analysis. 85% of epochs of
the remaining 15 subjects survived this procedure. Following averaging, data were
baseline corrected using a 100 ms prestimulus interval. No digital filter was applied
to the data that underwent analysis.
3.1.2 Results
3.1.2.1 Behavioral
A factorial two–way repeated–measures ANOVA was computed for partici-
pants’ reaction times, with Lexicality (levels: Word vs. Pseudoword) and Order of
Presentation (levels: 1st (or prime) vs. 2nd (or target)) as factors. A main effect of
Lexicality was observed (F (1, 14) = 23.295; p < 0.001), with Words being responded
to faster than Pseudowords (MeanWords = 656 ms, MeanPseudowords = 708 ms). A
main effect of Order of Presentation was also observed (F (1, 14) = 17.596; p <
0.001), with second presentations being responded to faster than first presentations
(Mean1st = 703 ms, Mean2nd = 661 ms). The interaction between Lexicality and
Order of Presentation was not significant (F (1, 14) = 0.3952; ns).
Two planned comparisons were performed, in order to ascertain whether or
not the repetition effect was observed for both Words and Pseudowords. We defined
a repetition effect as the reaction-time decrease between the first and the second oc-
currences of an item. For each item, we subtracted from the reaction time to the first
occurrence the reaction time to the second. Therefore, a positive value indicates fa-
158
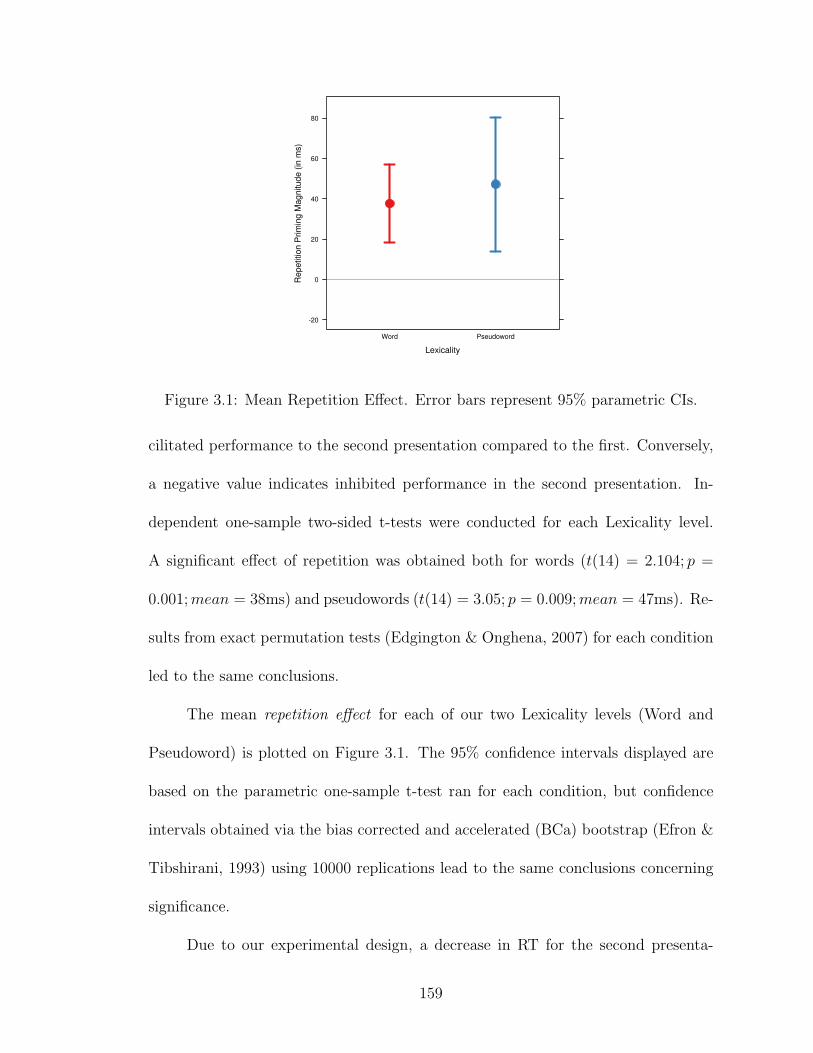
Lexicality
Repetit
ion P
rim
ing M
agnitude (
in m
s)
-20
0
20
40
60
80
Word Pseudoword
Figure 3.1: Mean Repetition Effect. Error bars represent 95% parametric CIs.
cilitated performance to the second presentation compared to the first. Conversely,
a negative value indicates inhibited performance in the second presentation. In-
dependent one-sample two-sided t-tests were conducted for each Lexicality level.
A significant effect of repetition was obtained both for words (t(14) = 2.104; p =
0.001; mean = 38ms) and pseudowords (t(14) = 3.05; p = 0.009; mean = 47ms). Re-
sults from exact permutation tests (Edgington & Onghena, 2007) for each condition
led to the same conclusions.
The mean repetition effect for each of our two Lexicality levels (Word and
Pseudoword) is plotted on Figure 3.1. The 95% confidence intervals displayed are
based on the parametric one-sample t-test ran for each condition, but confidence
intervals obtained via the bias corrected and accelerated (BCa) bootstrap (Efron &
Tibshirani, 1993) using 10000 replications lead to the same conclusions concerning
significance.
Due to our experimental design, a decrease in RT for the second presenta-
159

Trial Number
RT
(in
ms)
50010001500200025003000
WS002
0 200 400
PS002
WS005
0 200 400
PS005
WS006
0 200 400
PS006
WS007
0 200 400
PS007
WS008
0 200 400
PS008
WS010
PS010
WS011
PS011
WS012
PS012
WS014
PS014
WS015
50010001500200025003000
PS015
50010001500200025003000
0 200 400
WS016
PS016
0 200 400
WS018
PS018
0 200 400
WS019
PS019
0 200 400
WS020
PS020
0 200 400
WS021
PS021
W = Word P = Pseudoword
Figure 3.2: RT over the course of the experiment for individual subjects. Linesrepresent best fit linear trend.
tion could in principle be due to an overall effect of practice with the task (see
Wagenmakers et al., 2004, p. 1194, Logan, 1988, exp. 3, Smith & Oscar-Berman,
1990, Baayen, 2004, p. 13). Therefore, what at first inspection looks like a repeti-
tion priming effect might be due to factors independent of repetition. If, however,
practice or accommodation to the task was the source of the significant decrease in
RT from the first presentation to the second, we would expect to see subjects’ RT
trending down during the course of the experiment. As shown in figure 3.2, only
6 subjects (S008, S011, S014, S016, S019, S020) out of 15 showed such trend, the
remaining 9 subjects showing a flat RT profile or a linear increase in RT during the
experiment. A new factorial two–way repeated–measures ANOVA was computed for
only those 9 participants who showed no evidence of a linear RT decrease throughout
the experiment. The main effect of Lexicality was significant (F (1, 8) = 19.64; p =
0.002), with Words being responded to faster than Pseudowords (MeanWords = 660
160

ms, Meanpseudowords = 712 ms). Crucially, the main effect of Order of Presentation
was also significant (F (1, 8) = 7.6; p = 0.02), with second presentations being re-
sponded to faster than first presentations (Mean1st = 702 ms, Mean2nd = 670 ms).
The interaction between Lexicality and Order of Presentation was not significant
(F (1, 8) = 0.09; ns). Exact permutation tests1 (Edgington & Onghena, 2007) focus-
ing on the effect of repetition within each Lexicality level (Word vs Pseudowords)
showed a significant repetition effect for Words (t(8) = 2.61; p = 0.014), but only a
marginal effect for Nonwords (t(8) = 1.7; p = 0.07).
Finally, in order to establish more clearly how much of a confound this puta-
tive longitudinal practice or accommodation effect actually is, a mixed effect model
having Subjects and Items as random variables and Lexicality, Order of Presenta-
tion and their interaction as fixed effects was fit to the data of the fifteen subjects,
coding the linear order in which each item was presented in the experiment as a
covariate (Baayen, 2004; Baayen, Davidson, & Bates, 2008; Baayen, 2008). Markov
chain Monte Carlo sampling2 (10000 replications) of the parameters of the fitted
model revealed that the effects of Lexicality (t = 5.914, p < 0.001) and Order
1When the sample size is as small as is the case with this subset of the data, parametric tests
are not guaranteed to be valid, whereas exact permutation tests are (See Edgington & Onghena,
2007; Ludbrook, 1994; Ludbrook & Dudley, 1998; Ludbrook, 2008; Berger, 2000; Hunter & May,
2003, for extensive arguments)2This resampling procedure derives what is called the posterior distributions of the parameters
of the model. The posterior distributions can then be used to estimate p values and confidence
intervals for the different parameters in the model. The results reported here were based on the
resampling of the t statistics of the fixed effect variables
161

of Presentation (t = −4.821, p < 0.001) were significant, but their interaction
(t = −0.694, p = 0.49) was not. Words were responded to on average 55 ms faster
than pseudowords, and 2nd presentations were responded to on average 37 ms faster
than 1st presentations. Crucially, the effect of linear order of items in the experiment
was significant (t = −3.186, p = 0.015). However, the effect of linear order was only
0.07 ms (70 microseconds). This means that, on average, subjects were, for each
presentation, 0.07 ms faster when compared to the previous one. The maximum
lag between repetitions in this experiment was 25 presentations, which means that
the worst average contamination on the legitimate repetition effect due to longitu-
dinal practice effects would be 1.75 ms, which is barely above the sensitivity of the
equipment responsible for recording subjects’ RT data.
Discussion
A reliable repetition effect was found for both Words and Pseudowords in our
experiment. Different analytical methods showed that subjects display repetition
effects independent of a linear decrease in their reaction times through the course
of the experiment, and therefore our results cannot be solely attributed to accom-
modation to the task. Nonetheless, a statistically significant decrease in response
latencies through the experiment was detected, but its actual contributions to the
experimental results was negligible.
162

Figure 3.3: Different partitions of the sensor space.
3.1.2.2 MEG: Hemisphere Analysis
In the first set of analysis, following Sekiguchi et al. (2001), we selectively
computed the RMS of all the channels in the left (total = 76 channels) and in the
right hemispheres (total = 74 channels), as shown in figure 3.3. Unlike in the findings
of Sekiguchi et al. (2001), however, visual inspection of the resulting grand averages,
shown in figure 3.4 does not indicate any effect of repetition for the Word condition
in the left hemisphere, but does reveal a bilateral trend for repeated instances of
Pseudowords having lower RMS amplitude than their first presentations; in the left
hemisphere, this is observed in a long window from around 250ms until 600ms,
whereas in the right it is only observed in the 400-500ms window.
Statistical analysis were carried out in two temporal windows of interest: 150–
250ms and 300–500ms. These windows correspond to the latency ranges of classic
evoked potentials N/M170 and N400(m), for which some functional interpretation
exist: The former is associated with lower-level visual processing, whereas the lat-
ter is associated with semantic processing. A three-way factorial repeated-measures
ANOVA was conducted with Lexicality (Words vs. Pseudowords), Order of Presen-
163

Figure 3.4: Results of the RMS analysis of each hemisphere, for Word and Pseu-doword conditions.
tation (1st vs. 2nd) and Hemisphere (Left vs. Right) as repeated factors for each
temporal window of interest .
Hemisphere Analysis: 150–250ms window
For the 150–250ms window, the only statistically significant factor was the
main effect of Order of Presentation (F (1, 14) = 6.1385; p = 0.027), with second pre-
sentations eliciting higher amplitudes than their corresponding first presentations
(Mean1st = 55.067 pT, Mean2nd = 57.144 pT). Two two–way repeated–measures
ANOVAs were then carried out, one for each hemisphere, with Lexicality (Words
vs. Pseudowords) and Order of Presentation (1st vs. 2nd) as factors. In the left
hemisphere, the main effect of Order of Presentation (1st vs. 2nd) was marginally
significant (F (1, 14) = 2.9869; p = 0.1), with the second presentations eliciting
164
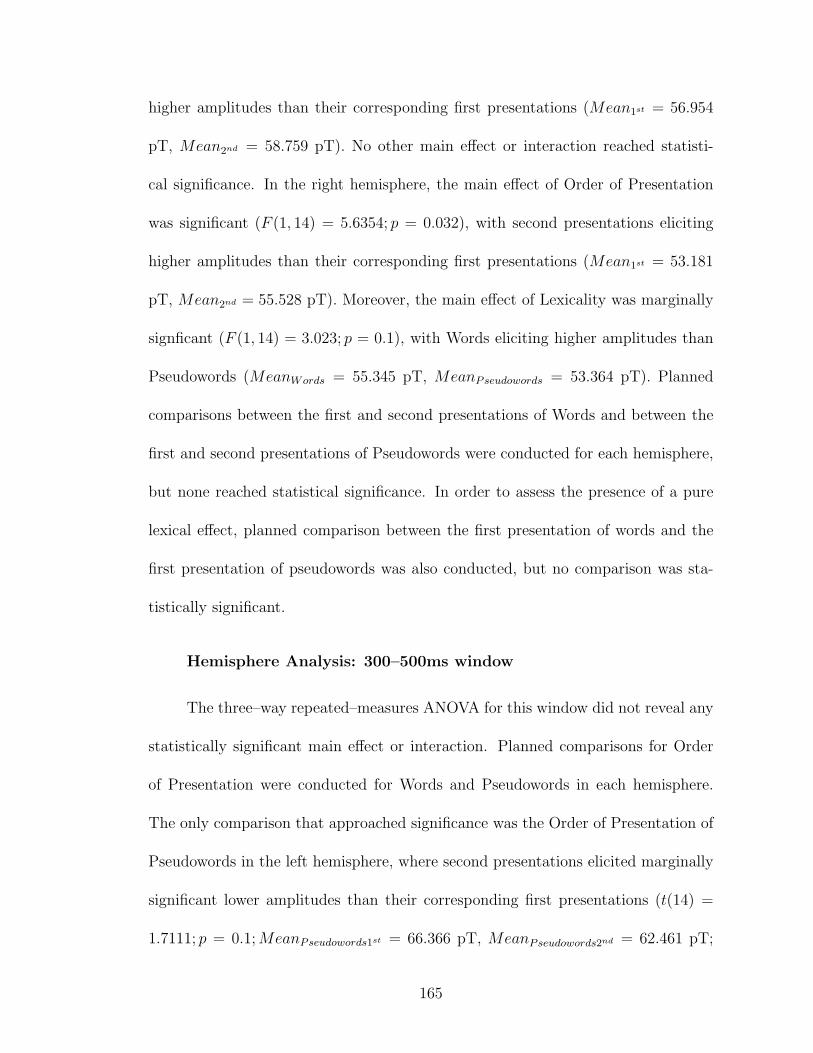
higher amplitudes than their corresponding first presentations (Mean1st = 56.954
pT, Mean2nd = 58.759 pT). No other main effect or interaction reached statisti-
cal significance. In the right hemisphere, the main effect of Order of Presentation
was significant (F (1, 14) = 5.6354; p = 0.032), with second presentations eliciting
higher amplitudes than their corresponding first presentations (Mean1st = 53.181
pT, Mean2nd = 55.528 pT). Moreover, the main effect of Lexicality was marginally
signficant (F (1, 14) = 3.023; p = 0.1), with Words eliciting higher amplitudes than
Pseudowords (MeanWords = 55.345 pT, MeanPseudowords = 53.364 pT). Planned
comparisons between the first and second presentations of Words and between the
first and second presentations of Pseudowords were conducted for each hemisphere,
but none reached statistical significance. In order to assess the presence of a pure
lexical effect, planned comparison between the first presentation of words and the
first presentation of pseudowords was also conducted, but no comparison was sta-
tistically significant.
Hemisphere Analysis: 300–500ms window
The three–way repeated–measures ANOVA for this window did not reveal any
statistically significant main effect or interaction. Planned comparisons for Order
of Presentation were conducted for Words and Pseudowords in each hemisphere.
The only comparison that approached significance was the Order of Presentation of
Pseudowords in the left hemisphere, where second presentations elicited marginally
significant lower amplitudes than their corresponding first presentations (t(14) =
1.7111; p = 0.1; MeanPseudowords1st = 66.366 pT, MeanPseudowords2nd = 62.461 pT;
165

Mean difference = 3.905 pT). The planned comparisons between the first presenta-
tion of Words and the first presentation of Pseudowords did not reveal any significant
difference in neither hemisphere.
Discussion
Repetition of words and pseudowords modulated the RMS of all channels from
the left and the RMS of all channels from the right hemisphere. In our first tem-
poral window of interest, the modulation by stimulus repetition (an increase in
amplitude for the second presentation when compared to the first) was observed in
the three–way omnibus ANOVA and in the two-way within–hemisphere ANOVAs.
However, the fact that the effect was not observed in the relevant planned com-
parisons (Word 1st vs. Word 2nd; Pseudoword 1st vs. Pseudoword 2nd) in neither
hemisphere strongly suggests that the effect itself is very small. In our second tem-
poral window of interest (300–500 ms), the modulation of the RMS amplitude by
stimulus repetition was only observed marginally in the left hemisphere for nonword
items.
The lexical status of the stimuli had a small impact on the RMS amplitudes
in the 150–250 ms window in the right hemisphere alone, being detected in the
within–hemisphere ANOVA, but not on the planned comparison.
These results stand in contrast with Sekiguchi et al. (2001)’s, who reported
significant left-hemisphere amplitude reduction associated with repetition of words,
but not pseudowords, in both the 200–300 ms window and the 300–500 ms window.
Our results reveal only small bilateral effects of repetition of words and pseudowords
166

in the 150–250 ms window, and left hemisphere pseudoword–specific effects of repe-
tition in the 300–500 ms. However, a number of differences must be noted between
our experiment and Sekiguchi et al. (2001)’s. In Sekiguchi et al. (2001), the lag
between presentations was fixed at 8, whereas in ours, the lag varied between 9 and
25. Moreover, in Sekiguchi et al. (2001), subjects were instructed to passively read
the stimuli for a later recall task, whereas in ours they were instructed to perform
a lexical decision for each item. And finally, Sekiguchi et al. (2001)’s left and right
hemisphere analysis involved only 36–37 channels, whereas in ours it involved 74–76
channels. If the repetition and lexicality effects are small or very localized, it is then
entirely plausible that they fail to be detected when so many channels are being
taken into account. In order to explore this issue, we performed a second set of
analysis, this time dividing the sensor space into quadrants.
3.1.2.3 MEG: Quadrant Analysis
In this set of analysis, the sensor space was divided as equally as possible
into four quadrants, as show in figure 3.3. The Left and Right Anterior quadrants
included 38 channels each, and the Left and Right Posterior ones included 36 each.
Separate repeated–measures ANOVAs were conducted for each temporal window of
interest in the Anterior and Posterior sites, with Lexicality (Word vs. Nonword),
Order of Presentation (1st vs. 2nd) and Hemisphere (Left vs. Right) as within–
subjects factors.
Quadrant Analysis: 150–250ms window
167

In the Anterior region, a significant main effect of Order of Presentation was
observed (F (1, 14) = 8.573; p = 0.01), with second presentations eliciting higher
amplitudes than their corresponding first presentations (Mean1st = 39.099 pT;
Mean2nd = 42.476 pT). No other significant main effect or interaction was observed.
Individual repeated–measures ANOVAs with Lexicality (Word vs. Pseudoword) and
Order of Presentation (1st vs. 2nd) conducted in the Anterior region split by hemi-
sphere revealed that the main effect of Order of Presentation was reliable both in
the left (F (1, 14) = 5.2749; p = 0.037; Mean1st = 40.840 pT, Mean2nd = 44.859
pT) and in the right hemispheres (F (1, 14) = 7.2522; p = 0.017; Mean1st = 37.357
pT, Mean2nd = 40.094 pT). Moreover, a marginally significant main effect of Lex-
icality was observed in the right hemisphere only (F (1, 14) = 4.0405; p = 0.064),
with Words eliciting higher amplitudes than Pseudowords (MeanWords = 40.250
pT, MeanPseudowords = 37.201 pT). No other significant main effect or interac-
tion was observed. Post–hoc analysis revealed that Order of Presentation was
significant for Words in the Left Anterior region (t(14) = −2.3403; p = 0.035),
with second presentations eliciting higher amplitudes than first presentations (Mean
difference= 4.950 pT), and was marginally significant in the Right Anterior region
(t(14) = −1.9719; p = 0.069), with the difference between presentations going in the
same direction as in the left hemisphere (Mean difference = 4.436 pT). No significant
effect was found for Pseudowords in either hemisphere.
In the Posterior region, only a marginally significant interaction between Order
of Presentation and Hemisphere was found (F (1, 14) = 3.3109; p = 0.09). Separate
repeated–measures ANOVAs with Lexicality (Word vs. Pseudoword) and Order
168
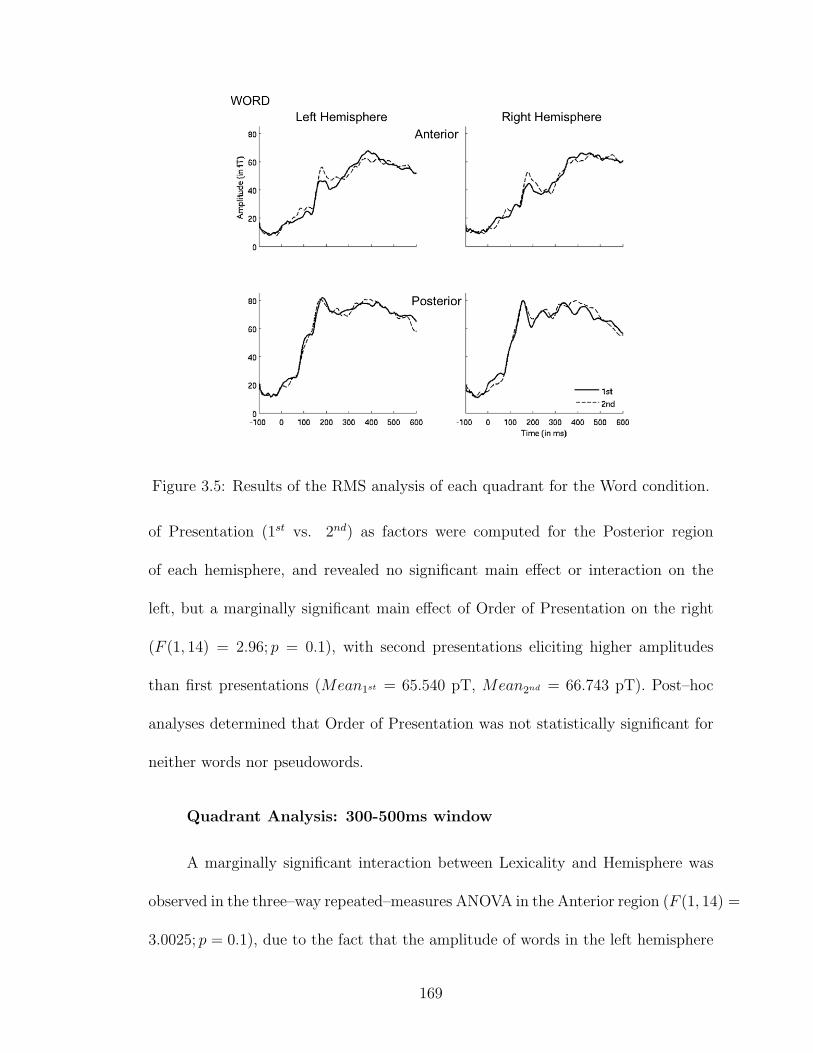
Figure 3.5: Results of the RMS analysis of each quadrant for the Word condition.
of Presentation (1st vs. 2nd) as factors were computed for the Posterior region
of each hemisphere, and revealed no significant main effect or interaction on the
left, but a marginally significant main effect of Order of Presentation on the right
(F (1, 14) = 2.96; p = 0.1), with second presentations eliciting higher amplitudes
than first presentations (Mean1st = 65.540 pT, Mean2nd = 66.743 pT). Post–hoc
analyses determined that Order of Presentation was not statistically significant for
neither words nor pseudowords.
Quadrant Analysis: 300-500ms window
A marginally significant interaction between Lexicality and Hemisphere was
observed in the three–way repeated–measures ANOVA in the Anterior region (F (1, 14) =
3.0025; p = 0.1), due to the fact that the amplitude of words in the left hemisphere
169

Figure 3.6: Results of the RMS analysis of each quadrant for the Pseudoword con-dition.
was larger than in the right, which was similar to the amplitudes of pseudowords
elicited in both hemispheres. No main effect was significant. No significant main
effect or interaction was found in the Posterior region.
Discussion
Once the sensor space is divided into sections that are of similar size to the
ones used by Sekiguchi et al. (2001), we see clear bilateral repetition effects in the
150-250ms window, as seen in the within–hemisphere ANOVAs, and these seem to
be the contribution of the Anterior channels only. Moreover, the repetition effect is
word–specific, as determined by the post–hoc tests, and seem to be more reliable in
the left hemisphere.
This is an interesting finding, for three reasons. First, this temporal window
170

was chosen because it encompasses the peak latency of the M170. However, the
M170 is normally observed in posterior areas (e.g. Tarkiainen, Helenius, Hansen,
Cornelissen, & Salmelin, 1999; Tarkiainen, Cornelissen, & Salmelin, 2002; Liu,
Higuchi, Marantz, & Kanwisher, 2000; Liu, Harris, & Kanwisher, 2002), whereas our
effect is primarily due to activity recorded by anterior channels. Second, stimulus
repetition is normally associated with amplitude reduction for repeated presenta-
tions, but we observe a repetition–related amplitude increase instead. Finally, the
temporal window where repetition effects are normally observed in both EEG and
MEG is the 300–500 ms one, instead of the 150–250 ms one. Sekiguchi et al. (2001)
did report a significant effect in the 200–300 ms window, however, and this is close
to our window of interest, but they nonetheless also reported repetition effects in
the 300-500 window, which we fail to observe in our data.
There is also a notable discrepancy between the results of this quadrant analy-
sis and the previous hemisphere analysis: whereas the latter established the presence
of a left–lateralized nonword–specific repetition effect in the 300–500 ms window,
the former did not detect such an effect.
In order to explore the issue further, and also to probe in more detail the
nature of the early anterior repetition effects, we further divided the sensor space
into six sextants.
171

Figure 3.7: Results of the RMS analysis of each sextant for Word condition.
3.1.2.4 MEG: Sextant Analysis
In this set of analysis, the sensor space was divided as equally as possible into
six parts (sextants). The Left and Right Anterior sextants included 26 channels
each, the Left and Right Medial sextants included 25 channels each, and the Left and
Right Posterior ones included 25 channels each (see figure 3.3). Separate repeated-
measures ANOVAs were conducted for each temporal window of interest in the
Anterior, Medial and Posterior sites, with Lexicality (Word vs. Pseudoword), Order
of Presentation (1st vs. 2nd) and Hemisphere (Left vs. Right) as within-subjects
factors. The grand–average results for each sextant is shown in figure 3.7 (for Words)
and 3.8 (for PseudoWords).
Sextant Analysis: 150–250ms window
172

In the Anterior region, only a significant main effect of Order of Presenta-
tion was found (F (1, 14) = 5.7416; p = 0.031), with second presentations eliciting
higher amplitudes than first presentations (Mean1st = 33.005 pT, Mean2nd = 35.996
pT). Separate two-way ANOVAs performed for the Anterior region within only the
left and only the right hemispheres determined that the Order of Presentation ef-
fect was reliable in the left hemisphere (F (1, 14) = 5.0295; p = 0.042), but only
marginally significant in the right (F (1, 14) = 3.2557; p = 0.093), with second
presentation amplitudes being higher than first presentation in both hemispheres
(Mean1stLeftAnterior = 32.873 pT, Mean2ndLeftAnterior = 36.906 pT, Mean1stRightAnterior =
33.137 pT, Mean2ndRightAnterior = 35.085 pT). Post-hoc tests determined the Order
of Presentation was specific to Words (tLeft(14) = −2.1312; p = 0.05; tRight(14) =
−1.9791; p = 0.07), with Order of Presentation comparisons for Nonwords failing
to reach significance in both hemispheres. Moreover, a marginal main effect of
Lexicality was also found in the right hemisphere ANOVA in the Anterior region
(F (1, 14) = 3.0942; p = 0.1), with Words eliciting higher amplitudes than Nonwords
(MeanWordsRightAnterior = 35.843 pT, MeanPseudowordsRightAnterior = 33.936 pT), but
post-hoc tests determined this was due to second presentations of words having
higher amplitudes than second presentations of nonwords (t(14) = 2.0056; p =
0.065).
In the Medial region, a significant main effect of Order of Presentation was
found (F (1, 14) = 13.968, p = 0.002), with second presentations eliciting higher am-
plitudes than first presentations (Mean1st = 52.021 pT, Mean2nd = 55.772 pT).
A marginal main effect of Hemisphere was also observed (F (1, 14) = 3.9331, p =
173

Figure 3.8: Results of the RMS analysis of each sextant for Pseudoword condition.
0.07), with left hemisphere displaying overall higher amplitudes than the right
(MeanLeft = 58.594 pT, MeanRight = 49.199 pT). Within–hemisphere two–way
repeated–measures ANOVAs having Lexicality (Word vs. Pseudoword) and Order
of Presentation (1st vs. 2nd) as factors revealed that the Order of Presentation effect
was reliable in both hemispheres, as it approached significance in the left (F (1, 14) =
4.5035; p = 0.05), and was significant in the right (F (1, 14) = 14.827; p = 0.002),
with second presentation amplitudes being higher than first presentation amplitudes
in both hemispheres (Mean1stLeftAnterior = 56.914 pT, Mean2ndLeftAnterior = 60.274
pT, Mean1stRightAnterior = 47.129 pT, Mean2ndRightAnterior = 51.270 pT). A signifi-
cant main effect of Lexicality was also observed in the right hemisphere (F (1, 14) =
4.8617; p = 0.045), with Words displaying overall higher amplitudes than Pseu-
174

dowords (MeanWords = 50.721 pT, MeanPseudowords = 47.678 pT). Post–hoc analy-
sis revealed that the Order of Presentation comparison was word–specific in the left
hemisphere (t(14) = −2.6493, p = 0.02), but not in the right, where Order of Pre-
sentation was statistically significant for Pseudowords (t(14) = −2.8336; p = 0.01)
and approached significance for Words (t(14) = −2.1052; p = 0.06).
In the Posterior region, only the interaction between Order of Presentation
and Hemisphere approached significance (F (1, 14) = 3.1914; p = 0.096), and this
was due to the left hemisphere eliciting overall higher amplitudes than the right.
Repeated–measures ANOVAs within each hemisphere having Lexicality (Word vs.
Pseudoword) and Order of Presentation (1st vs. 2nd) as factors did not reveal any
significant effect or interaction in neither hemisphere.
Sextant Analysis: 300-500ms window
In the Anterior region, only the interaction between Lexicality and Hemisphere
was revealed to be significant (F (1, 14) = 4.8646; p = 0.045), but this was due to
the left hemisphere eliciting overall lower amplitudes than the right hemisphere.
Repeated–measures ANOVAs within each hemisphere having Lexicality (Word vs.
Pseudoword) and Order of Presentation (1st vs. 2nd) as factors did not reveal any
significant effect or interaction in neither hemisphere.
In the Medial region, a main effect of hemisphere was found (F (1, 14) =
7.5561; p = 0.016), with the left hemisphere registering higher amplitudes than the
right one (MeanLeft = 68.997 pT, MeanRight = 58.043 pT). Repeated–measures
ANOVAs within each hemisphere having Lexicality (Word vs. Pseudoword) and
175

Order of Presentation (1st vs. 2nd) as factors did not reveal any significant effect
or interaction in the left hemisphere, but a significant main effect of Lexicality
was observed (F (1, 14) = 4.8617; p = 0.045), with Words eliciting higher ampli-
tudes than Pseudowords (MeanWords = 50.721 pT, MeanPseudowords = 47.678 pT).
A main effect of Order of Presentation was also found (F (1, 14) = 14.827; p =
0.002), with second presentations eliciting overall higher amplitudes than first pre-
sentations (Mean1st = 47.129 pT, Mean2nd = 51.270 pT). Post–hoc analyses re-
vealed that the Order of Presentation effect was marginally significant for Words
(t(14) = −1.7293; p = 0.1), but was not statistically significant for Pseudowords
(t(14) = −0.0776; p = 0.94).
In the Posterior region, no main effect or interaction was shown to be signif-
icant. Within–hemisphere ANOVAs with Lexicality (Word vs. Pseudoword) and
Order of Presentation (1st vs. 2nd) as factors did not reveal any significant main
effect or interaction.
Discussion
The sextant analysis confirmed the early bilateral lexically–specific repetition
effects in the 150–250ms window in anterior sites found in the quadrant analysis,
and it also extended it by showing that a bilateral repetition effect is found in medial
sites as well. However, the repetition effect in the medial region was word–specific
only in the left hemisphere. Moreover, small word–specific repetition effects were
also observed in the 300–500 ms time window in the medial region, but only on the
right hemisphere.
176

3.1.3 General Discussion and conclusions
At the behavioral level, true repetition effects were found for both words
and pseudowords. Although this does not replicate the word–specific repetition
effect found by Pallier et al. (2001), it does replicate data obtained in other writ-
ten word recognition studies using the repetition priming paradigm with variable
lags. Scarborough et al. (1977) reported an experiment using the lexical decision
task in which both words and pseudowords were repeated within 0, 1, 3, 7, or 15
intervening trials. In this experiment, both words and pseudowords exhibited a rep-
etition effect. Even though (i) the design used in the present experiment was much
closer to the one used by Pallier et al. (2001) and (ii) the lags in our experiments
were much larger and more variable than the ones used in Scarborough et al. (1977),
our results are more similar to the latter than to the former. It is not presently clear
why Pallier et al. (2001) was able to show word–specific repetition effects at the
behavioral level but we did not. Two plausible alternatives come to mind in order
to explain this apparent disparity in the outcomes of the two experiments. The first
is that the difference lies in the modality of presentation: Pallier et al. (2001) used
auditory presentation, whereas we used visual presentation in our experiment. The
other alternative would be that the difference in outcome is due not necessarily to
the modality of presentation, but to the temporal structure of the stimuli: Speech
unfolds in time in a highly transient manner, whereas a printed word on a screen is
presented in its full form from the outset, in a static and temporally stable manner
for generally over 500 ms in a lexical decision task.
177

There are three ways in which these two hypothesis could be further explored.
The first one would be to try to replicate the current study auditorily. Although
this might provide a closer comparison to Pallier et al. (2001)’s study, it does not
in itself distinguish between the two possible hypothesis. The second possibility
would be to try to make the visual presentation of written words approximate the
temporal dynamics of speech by presenting stimuli only briefly on the screen. The
third alternative would be to actually make use of linguistic materials that have
naturally very similar temporal dynamics to speech but is transmitted through the
visual modality. Sign Languages are the obvious candidates, given how they are the
closest analogue to speech in the visual modality there is. If the current experiment
is adapted to American Sign Language and still finds repetition effects for both
words and pseudowords, then this would lend more credence to the idea that the
difference between the results obtained by Pallier et al. (2001) and by us is indeed
about the specific modality of presentation. If, however, such an experiment finds a
pattern of results similar to the one reported by Pallier et al. (2001), then this would
be evidence that it is something about the temporal structure in the presentation of
the stimuli that underlies the difference between our current results and those found
by Pallier et al. (2001). This experiment will be carried out in the next chapter of
this dissertation.
At the electrophysiological level, there are two main findings in this experi-
ment. The first one is that, like Sekiguchi et al. (2001), a true lexical repetition
effect is indexed by brain activity recorded by MEG. However, the word–specific
repetition effects found in our experiment are slightly earlier than the ones reported
178

by Sekiguchi et al. (2001): Our results are found 150–250 ms post–stimulus onset,
whereas the earliest effects found by Sekiguchi et al. (2001) were in the 200-300 ms
post–stimulus onset window. Moreover, the word–specific repetition effect reported
by Sekiguchi et al. (2001) consists in reduced amplitudes for 2nd when compared to
1st presentations, whereas our repetition effects are in the exact opposite direction.
The second major finding in the present experiment is the lack of repetition effects
in the 300–500ms post–stimulus onset time window, which is the time window where
repetition effects are most commonly found in ERP and MEG research (N400 or
N400m effects).
This set of findings begs the question of whether our results can be reconciled
with previous reports from the MEG and ERP literature. First, let’s consider the
early bilateral anterior repetition effect. Although it is not often reported in the
literature, a similar response seems to exist in ERP as well. In a study also dealing
with the effects of word repetition, Van Petten et al. (1991) reported, somewhat
surprised, “an earlier [than the N400] effect of repetition. In the region of 180 to
300 msec, repeated words elicited a more positive peak than did new words.” (Van
Petten et al., 1991, p. 136). The scalp distribution of the effect is also consistent
with our and Sekiguchi et al. (2001)’s findings: “the difference wave clearly shows
the early peak to have more of an anterior scalp distribution than the negativity
which follows [which normally has a centro–parietal distribution].” (Van Petten et
al., 1991, p. 136). Finally, when characterizing the response in light of previous
findings, Van Petten et al. (1991, p. 140) notes that “the early (peaking at 200msec)
enhanced positivity” due to word repetition has been reported before, but has been
179

“rather elusive and not subject to experimental control”. However, they note that
in all the earlier cases that they could find (eg. Rugg, 1987; Nagy & Rugg, 1989)
the earlier effect was found for immediate repetition and that “the initial reports
described an early repetition effect that was of opposite polarity to that reported
here, an apparent diminution of the P2 with repetition rather than an enhancement.”
Therefore, the ERP response described by Van Petten et al. (1991) indexing
word repetition seems to be the exact ERP analogue of the response we found in
our experiment: It responds to the same experimental manipulation (repetition),
it occurs in the same time window (peak at 200 ms) and it has the same scalp
distribution (frontal or anterior). Moreover, the direction of the effect deviates in
the exact same way from previous reports. In the case of Van Petten et al. (1991), the
early reponse was characterized as a P2 enhancement for the repeated presentation,
whereas previous reports described a P2 decrease for the repeated presentation. In
the same vein, assuming that the early response found by Sekiguchi et al. (2001) was
akin to the one we found in our experiment, we were puzzled by the fact that the
direction of the repetition effect found in our experiment was exactly the opposite
of what had been described by Sekiguchi et al. (2001): We found an increased early
response for the repeated words, whereas Sekiguchi et al. (2001) reported a decrease
of activity for repetition. The reason for this discrepancy, that remained mysterious
to Van Petten et al. (1991), seems to become clearer now with the addition of the
findings of the current experiment: Both Van Petten et al. (1991) and our study
used a variable lag between repetitions, whereas all the other experiments used some
sort of fixed lag, and it is not unreasonable to propose that this could be the cause
180
of the variation in the reported results.
Now that we have established that the early effect we found is in fact compat-
ible with previous findings in the ERP and MEG literature, what can one conclude
from it? The fact that it responds selectively to the repetition of words seems to
suggest that it is some sort of lexical level processing that is being indexed. This
idea receives support from an ERP study by Rugg, Doyle, and Wells (1995), in
which repetition of visually presented words elicited early frontal effects starting at
around 240 ms. Repetition of pseudowords, on the other hand, did not elicit such
effects: “evidence was found for early–acting repetition–sensitive processes specific
to words. The absence of such early repetition effects for nonwords, especially evi-
dent in the visual-visual condition, suggests that word and nonword repetitions do
indeed have different processing consequences.” (Rugg, Doyle, & Wells, 1995, p. 222;
see also the subtraction waveforms in figure 2, where a clear peak is found in frontal
electrodes for the repetition of visually presented words are around 200 ms, with the
subtraction waveforms in figure 5, where no such peak is found for the repetition
of visually presented pseudowords). Further evidence for this interpretation comes
from a masked priming experiment by Misra and Holcomb (2003), which reported
P2 enhancement effects for immediate word repetition, both in cases where the first
presentation was unmasked and in cases where the first presentation was very briefly
presented (33, 55, or 66 ms) under masked conditions. Given that the masking pa-
rameters were calibrated to elicit chance performance on conscious recognition from
subjects, Misra and Holcomb (2003) concluded that the P2 component reflects not
only controlled but automatic processes as well. Finally, in a sentence processing
181

experiment, Dambacher, Kliegl, Hofmann, and Jacobs (2006) reported strong effects
of lexical frequency, but not predictability, in the P2 component at fronto–central
electrodes (see also Barnea & Breznitz, 1998; Hepworth, Rovet, & Taylor, 2001, for
more ERP results linking P2 with lexical processing), leading the authors to link
P2 to word recognition procedures.
Given the results of the current experiments and the results of previous exper-
iments reviewed above, an interesting hypothesis can be advanced: The cognitive
processes indexed by this early component (P2 and its MEG counterpart,
call it P2m) are related to retrieving or manipulating lexical information
in long term memory, as opposed to episodic information in short term
memory. This would explain the lexical selectivity found in our experiment as well
as the ones reported by Sekiguchi et al. (2001) and Rugg, Doyle, and Wells (1995).
Moreover, the simultaneous sensitivity to frequency effects and imperviousness to
sentential predictability reported by Dambacher et al. (2006) combined with the au-
tomaticity of processing shown by the masked priming results reported by Misra and
Holcomb (2003) are all compatible with relatively automatic processes of retrieval /
selection of long term memory representations based on bottom up evidence. How-
ever, it is unclear whether this component indexes access to a modality independent
lexical entry, or to modality–specific representations such as an orthographic lex-
icon, but the data from cross–modal repetition priming reported by Rugg, Doyle,
and Wells (1995), suggests the latter.
It is very encouraging that the early anterior bilateral effect we found can be
linked so directly with access to long–term memory representations, but we still
182

have to discuss the second part of our findings, namely, the lack of repetition effects
in the 300–500 ms time window (ie. lack of an N400 effect). How can this null
effect be reconciled with the current evidence on repetition effects in ERP and
MEG? A proposal that seems promising is to link this to the variable lag used in
our experiment. All the other experiments dealing with word repetition used fixed
or short variable lags between the first and second presentations. It is a known
fact that the N400 is sensitive to predictability manipulations in sentences (Kutas,
1993; Kutas & Federmeier, 2000; Dambacher et al., 2006), with predictions that
are successfully fulfilled exhibiting a decrease of activity compared to baseline. The
same could be proposed here for the word repetition experiments: The use of fixed or
short variable lags in a repetition priming paradigm would create a high expectation
for word repetition and the right environment for these predictions to be successfully
fulfilled regularly and within a short period of time. Under this view, the N400 effects
normally reported for word repetition would not so much be due to repetition per se,
but to the high predictability that repetition of items would have in those paradigms.
When a longer and much more variable lag between presentations is used, as in our
experiment, this would reduce the possibility of predictions of specific repetitions
being fulfilled successfully with any regularity, and this would eliminate the chances
of eliciting the N400 effect3. Convergent evidence from fMRI that this is a plausible
3Do not confuse the suppression of the N400 effect with the suppression of the N400 component.
Under the variable lag conditions, the N400 component would still be elicited for each visual or
auditory stimulus presentation. The claim is simply that under large and unpredictable variable
lag conditions, the N400 components of no experimental condition would be differentially affected,
183

explanation for the lack of the N400 effect in our experiment comes from a study
by Summerfield, Trittschuh, Monti, Mesulam, and Egner (2008), in which it was
shown that repetition suppression was a function of how predictable the repeated
stimulus was. Nonetheless, a possible counter argument to this reasoning could be
offered in the following lines: Van Petten et al. (1991)’s study, like ours, dealt with
repetition of words under large and variable lags (in fact, much larger than ours:
the average lag in their “short lag” condition was 14 intermediate presentations,
which was close to average of 18 intermediate presentations in our experiment; the
average lag in their “long lag” condition was 228!), and yet still reported large N400
effects for repeated word presentations. However, a possible explanation for this
disparity is that Van Petten et al. (1991) used real natural texts, and not a simple
random list of words. Therefore, it is possible that the N400 effects found for the
repetition of words in Van Petten et al. (1991) is not due to stimulus repetition at
all, but to their higher predictability in their contexts of appearance. Natural texts
tend to be composed of sentences and discourse settings in which contextual support
commonly increases as the text progresses from beginning to the end. In the same
vein, the N400 has been reported to vary as a function of simple position in the
sentence, putatively due to later positions having higher contextual support than
early positions (see Kutas & Federmeier, 2000, for review); after all it is as a rule
easier to predict the end of an ongoing sentence than the beginning of a new one. If
that is the case, then the N400 results reported by Van Petten et al. (1991) would
be simply the same kind of N400 effects that one finds when comparing a word in an
thereby eliminating the N400 effect.
184

early position within a sentence with a word in a later position in the same sentence
or discourse setting; word repetition here is potentially purely incidental.
In summary, the results obtained in this experiment not only are compat-
ible with existing findings on word repetition and recognition in the MEG and
ERP literature, but they seem to suggest (i) that automatic contact with putative
modality–specific access representations of lexical items in long term memory hap-
pens around 200 ms post–stimulus onset in the case of reading, and (ii) that the
N400 effect is indeed related to fulfilled expectations at some post–lexical processing
level. It would be interesting to further investigate under what conditions the N400
effect can be made to appear and disappear as a function of predictability of word
presentations within different tasks. It remains to be investigated whether auditory
word recognition can also be shown to elicit lexically–specific responses in pre N400
time windows.
185

Chapter 4
Memory representations in word recognition: Experiment 3
4.1 Introduction
In the previous chapter of this dissertation (chapter 3), we reported an experi-
ment that used a medium–distance repetition priming paradigm due to its apparent
selective sensitivity to the repeated retrieval of words, as opposed to the retrieval
of other general memory representations. However, contrary to our expectations,
the behavioral results failed to show word–specificity: both words and pseudowords
displayed repetition effects. The MEG results, on the other hand, showed the pres-
ence of an early (pre–N400) component that was sensitive only to the repetition of
written words. Moreover, no N400 repetition effect was reported, contrary to what
is normally found in repetition priming paradigms. We hypothesized that this lack
of N400 effect is due to the use, in our experiment, of longer and more variable lags
between presentations of relevant items (primes and targets) than what is normally
reported.
The goal of the current study is to expand on the results of the experiment
reported in chapter 3. At the behavioral level, we are interested in why we were un-
able to replicate the word–specific repetition effect reported by Pallier et al. (2001).
One hypothesis would be that the change in the modality of presentation (from
auditory to visual) is the cause of the disparity between the results of the two ex-
186

periments. Another alternative would be that it is not necessarily the change in
modality, but the change in the temporal structure of the stimuli (unfolding in time
vs static) that is the cause of the different results across the experiments. In order
to further explore the issue, the current study will use the exact same design than
the one used in the experiment reported in chapter 3, but will be performed using
American Sign Language. Signs are visually presented by nature, but they have a
similar temporal structure to speech. This manipulation therefore will allow us to
answer whether it is the difference in the time structure of the stimuli that is the
cause of the discrepant results from Pallier et al. (2001) and our last experiment
(chapter 3).
At the electrophysiological level, we are interested in determining whether a
sign–specific repetition effect can be found when ASL stimuli are used instead of
written words. Namely, if word–specific effects can be found in both written and
sign language with a similar scalp / sensor space distribution, and perhaps in a pre–
N400 time window, then this strongly suggests that the effect found in experiment
3 is truly lexical, i.e. independent of the access representation used to retrieve
lexical content. However, if no such effect can be found, then this would suggest
that the effect found in experiment 3 is indicative of contact with specific access
representations, but not necessarily with the central lexicon.
Finally, we are interested in establishing whether the elimination of the N400
due to the variable lag can be replicated using a different kind of stimuli. Signers
have been show to display N400 effects to sign language presentation (eg. Kutas et
al., 1987; Tanaka & Nagashima, 2006), much like hearing people show N400 effects
187

to speech and written language. Therefore the initial assumption in our experiment
would be that the ASL stimuli we will use should elicit N400–like responses. How-
ever, if no N400 effect is found for repetition even when signs are used instead of
written words, then this strongly suggests that our tentative explanation for the
absence of the N400 effect in the experiment in chapter 3 is in the right track.
4.1.1 Methods
Deaf Participants
Thirteen deaf ASL signers (8 women) participated in the experiment (Mean
age: 28, age range: 21–39). Nine out of the thirteen subjects had learned sign
language from birth, either from parents or older siblings and relatives who were
themselves native users. Three out of the thirteen subjects were born hearing into
hearing families, and had acquired English as their first language. This subgroup
started learning and using ASL consistently only after losing their hearing, all before
age 6. This kind of population has been reported to attain near–native command
of the second language (Mayberry, Lock, & Kazmi, 2002; Mayberry & Lock, 2003);
and at least one study has reported that a second language can completely replace
a first language both in terms of linguistic performance and their known neural un-
derpinnings if the language transition occurs before 8 years of age (Pallier et al.,
2003). Only one out of the thirteen subjects in our study could be argued to have
had impoverished early language exposure. This participant lost their hearing at
10 months of age, learned cued speech first, and only started to learn and use ASL
188

consistently at age 6. Several studies have shown that this kind of population does
not attain native–level command of ASL in several performance metrics (e.g. May-
berry & Fischer, 1989; Newport, 1990; Mayberry & Eichen, 1991). All participants
were right-handed (Oldfield, 1971), had normal or corrected to normal vision, and
reported no history of language disorders or mental illness. All participants were
students, staff or alumni of Gallaudet University, and they all gave their written
informed consent to take part in the study, which was approved by both the Univer-
sity of Maryland and Gallaudet University Institutional Review Boards. Subjects
were paid for their participation and compensated for their travel time.
Hearing Participants
Sixteen hearing English speakers participated in the experiment (Mean age:
20, age range: 18–22). All were right–handed (Oldfield, 1971), had normal or cor-
rected to normal vision, and reported no history of language disorders or mental
illness. None knew any American Sign Language. All participants were students
at University of Maryland, College Park and gave their written informed consent
to take part in the study, which was approved by both the University of Maryland
and Gallaudet University Institutional Review Boards. Subjects were paid for their
participation.
Design and Materials
A 2x2 design with Lexicality (levels: sign/pseudosign) and Order of Presen-
tation (levels: 1st/2nd) as factors was used, yielding the following four experimental
conditions: (1) 1st Presentation of Signs, (2) 2nd Presentation of signs, (3) 1st Pre-
189
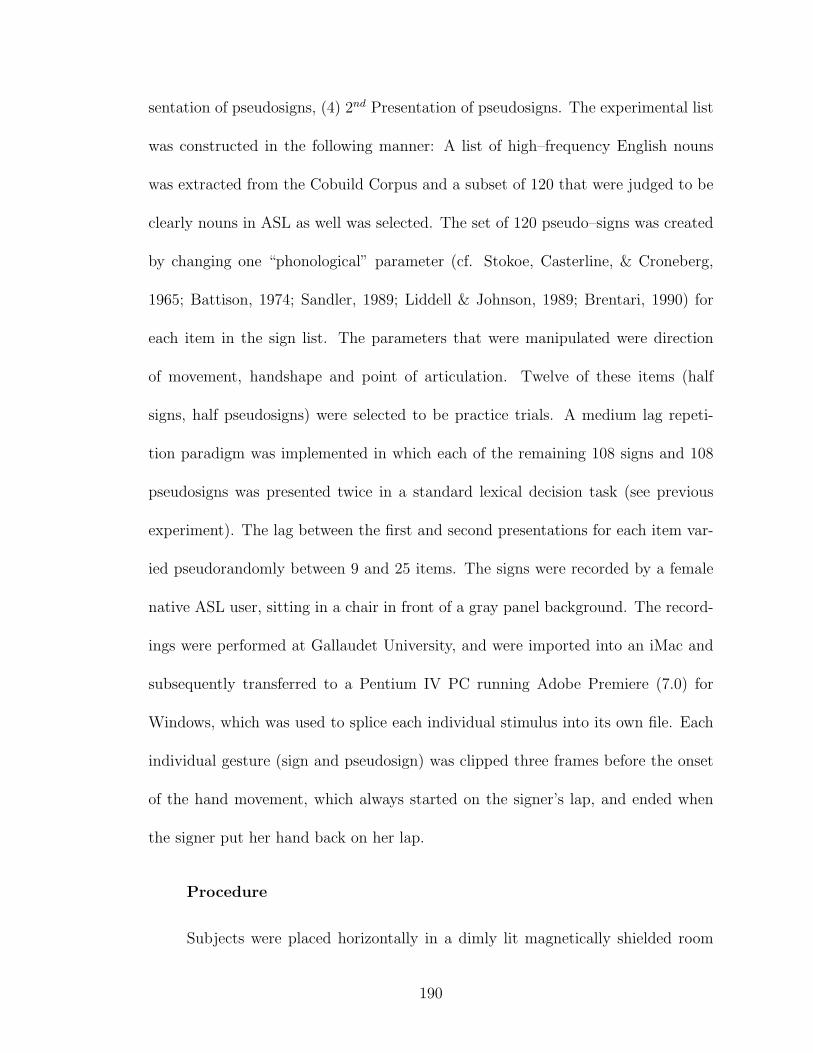
sentation of pseudosigns, (4) 2nd Presentation of pseudosigns. The experimental list
was constructed in the following manner: A list of high–frequency English nouns
was extracted from the Cobuild Corpus and a subset of 120 that were judged to be
clearly nouns in ASL as well was selected. The set of 120 pseudo–signs was created
by changing one “phonological” parameter (cf. Stokoe, Casterline, & Croneberg,
1965; Battison, 1974; Sandler, 1989; Liddell & Johnson, 1989; Brentari, 1990) for
each item in the sign list. The parameters that were manipulated were direction
of movement, handshape and point of articulation. Twelve of these items (half
signs, half pseudosigns) were selected to be practice trials. A medium lag repeti-
tion paradigm was implemented in which each of the remaining 108 signs and 108
pseudosigns was presented twice in a standard lexical decision task (see previous
experiment). The lag between the first and second presentations for each item var-
ied pseudorandomly between 9 and 25 items. The signs were recorded by a female
native ASL user, sitting in a chair in front of a gray panel background. The record-
ings were performed at Gallaudet University, and were imported into an iMac and
subsequently transferred to a Pentium IV PC running Adobe Premiere (7.0) for
Windows, which was used to splice each individual stimulus into its own file. Each
individual gesture (sign and pseudosign) was clipped three frames before the onset
of the hand movement, which always started on the signer’s lap, and ended when
the signer put her hand back on her lap.
Procedure
Subjects were placed horizontally in a dimly lit magnetically shielded room
190

(Yokogawa Corporation, Tokyo, Japan) and were screened for MEG artifacts due
to dental work, and excessive eye-blinking. For the hearing group, a scout scan was
performed with the purposes of verifying the presence of identifiable MEG responses
to 1 kHz and 250 Hz pure tones (M100) and determining adequate head positioning
inside the machine.
Stimulus presentation and experiment control was carried out by Presenta-
tion® software (Version 10.3, www.neurobs.com). Deaf participants were instructed
to decide whether each stimulus was a real sign or not (lexical decision), and to re-
spond as quickly and accurately as possible using a button box placed in their right
hand. The hearing group was instructed to guess to the best of their ability whether
each stimulus was a real sign or not in ASL. Each trial consisted in the presentation
of a a black fixation point over a gray background projected onto the center of a
rear-projection screen, followed by the presentation of a sign or pseudosign. The
gray background color was chosen to be as close as possible to the gray background
in the video files, to avoid a sudden change in overall contrast, which could induce
eye blinks. A black paperboard mask was placed over the screen where the stimuli
were presented to frame the area where the video of the signer appeared. Fixation
point duration was randomly varied between 250 and 750 miliseconds. The videos
were always presented in their entirety, and subjects were instructed to respond
before the offset of the presentation. Accuracy and reaction times from the onset
of stimulus presentation were recorded. Responses that occurred after the offset of
the video were not recorded, and were coded as time–outs. The intertrial interval
was randomly varied between 500 and 750 miliseconds. Subjects were first given
191

a practice session of 12 items to help familiarize them with the task. The experi-
ment was administered in four blocks, in between which participants could take a
break. The order of presentation of blocks was counter-balanced across subjects.
The experiment lasted approximately 40 minutes.
MEG data acquisition and analysis
MEG recordings were conducted using a 160-channel axial gradiometer whole-
head system (Kanazawa Institute of Technology, Kanazawa, Japan). Data were
sampled at 1000 Hz and acquired continuously with a bandwidth between DC to
200 Hz. In order to remove external sources of noise artifacts, a time–shift PCA
filter was used (de Cheveigne & Simon, 2007).
For deaf participants, incorrect behavioral responses and time–outs were ex-
cluded from both the behavioral and MEG data analyses, as were epochs in which
amplitudes exceeded ±2pT. Only items for which both 1st and 2nd presentations
survived the exclusion criteria reported above were selected for further analysis.
Data from one deaf participant was excluded because of equipment malfunction.
Data from three other deaf subjects were excluded from any further analysis due
to an overall error rate larger than 15%; 85% of the epochs of the remaining 9 deaf
subjects underwent data analysis.
For hearing participants, only time–outs were excluded from behavioral and
MEG data analyses, as were epochs in which amplitudes exceeded ±2pT. Only
items for which both 1st and 2nd presentations survived these exclusion criteria were
selected for further analysis. Data from three hearing participants was excluded
192

due to excessive time–outs (> 25%), and data from another four participants was
excluded because of excessive eye blink and moving artifacts. From the remaining
9 hearing participants, 83% of the data underwent analysis.
For both groups, the surviving epochs were selectively averaged. The averaged
data was baseline corrected using a 100 ms prestimulus interval. No digital filter
was applied to the averaged data.
4.1.2 Results
4.1.2.1 Behavioral Results
Sign vs Pseudosign discrimination
The performance of the two groups in the Lexical Decision Task was ana-
lyzed using Signal Detection methods in order to ascertain whether subjects ac-
curately and reliably discriminated between signs and pseudosigns. A′ scores (a
non–parametric sensitivity index that is independent of response bias, like d′) were
computed for each subject in each group. The results are plotted in figure (4.1).
The closer the A′ scores are to 1, the better the discrimination. Conversely, the
closer the A′ scores are to 0.5, the closer they approximate chance performance.
The difference in the discrimination performance between the two groups was as-
sessed by performing a two sample permutation test on the A′ scores, which yielded
a significant effect (t(8) = 30.556, p < 0.001), with subjects in the Deaf groups
exhibiting significantly higher A′ scores than subjects in the Hearing group.
Unsurprisingly, figure (4.1) strongly suggests that language experience plays
193

0.5
0.6
0.7
0.8
0.9
1.0
Group
A' sc
ore
s
Deaf Hearing
Figure 4.1: Discrimination between Signs and Pseudosigns (in A′ scores) for eachgroup.
a determinant role in the ability of subjects to correctly discriminate between real
ASL signs and pseudosigns. Deaf participants’ A′ scores are all very close to 1,
which indicate very good discrimination, whereas hearing participants have their A′
scores very close to 0.5, which indicates near chance performance. It is nonethe-
less important to note that, despite much worse discrimination performance when
compared to the deaf group, the hearing group does not perform at chance, even
though they were all ASL naıve, as determined by pre–experimental screening and
post–experimental debriefing. This suggests that there are perhaps some cues in the
way the pseudosigns are articulated that might have allowed some hearing subjects
to discriminate between the two classes of stimuli.
Reaction Time data
194

A repeated–measures ANOVA was computed for participants’ reaction times,
with Group (Deaf vs Hearing) being a between–subjects factor, and Lexicality
(levels: Word vs. Pseudoword) and Order of Presentation (levels: 1st (or prime)
vs. 2nd (or target)) as within–subjects factors. Figure (4.2) show the mean RT
per condition for each group. A main effect of Group was observed (F (1, 16) =
7.8732; p = 0.013), with the Deaf group being on average 162 ms faster than
the Hearing group (MeanDeaf = 1309 ms; MeanDeaf = 1471 ms). Group also
interacted significantly with Lexicality (F (2, 16) = 18.930, p < 0.001), but only
marginally significantly with Order of Presentation (F (2, 16) = 4.3476, p = 0.05).
The significant interaction between Group and Lexicality was due to the fact that
Deaf participants responded to signs faster than to pseudosigns (MeanDeafSigns =
1272 ms; MeanDeafPseudosigns = 1347 ms), whereas Hearing participants exhibited
the reverse pattern (MeanHearingSigns = 1486 ms; MeanHearingPseudosigns = 1456
ms). The marginally significant interaction between Group and Order of Presen-
tation was due to the fact that Deaf participants had a stronger decrease in RT
from the 1st to the 2nd presentation than did participants in the Hearing group
(DiffDeaf :1st−to−2nd = 131 ms; DiffHearing:1st−to−2nd = 83 ms). The three–way in-
teraction between Group, Lexicality and Order of Presentation was also significant
(F (2, 16) = 8.5177; p = 0.01), and was due to the fact that, in the Deaf group,
pseudosigns elicited a stronger RT decrease from 1st to 2nd presentation than did
signs (DiffSigns:1st−to−2nd = 115 ms; DiffPseudosigns:1st−to−2nd = 146 ms), with the
reverse pattern was observed in the Hearing group (DiffSigns:1st−to−2nd = 101 ms;
DiffPseudosigns:1st−to−2nd = 65 ms). The main effect of Lexicality was marginally
195
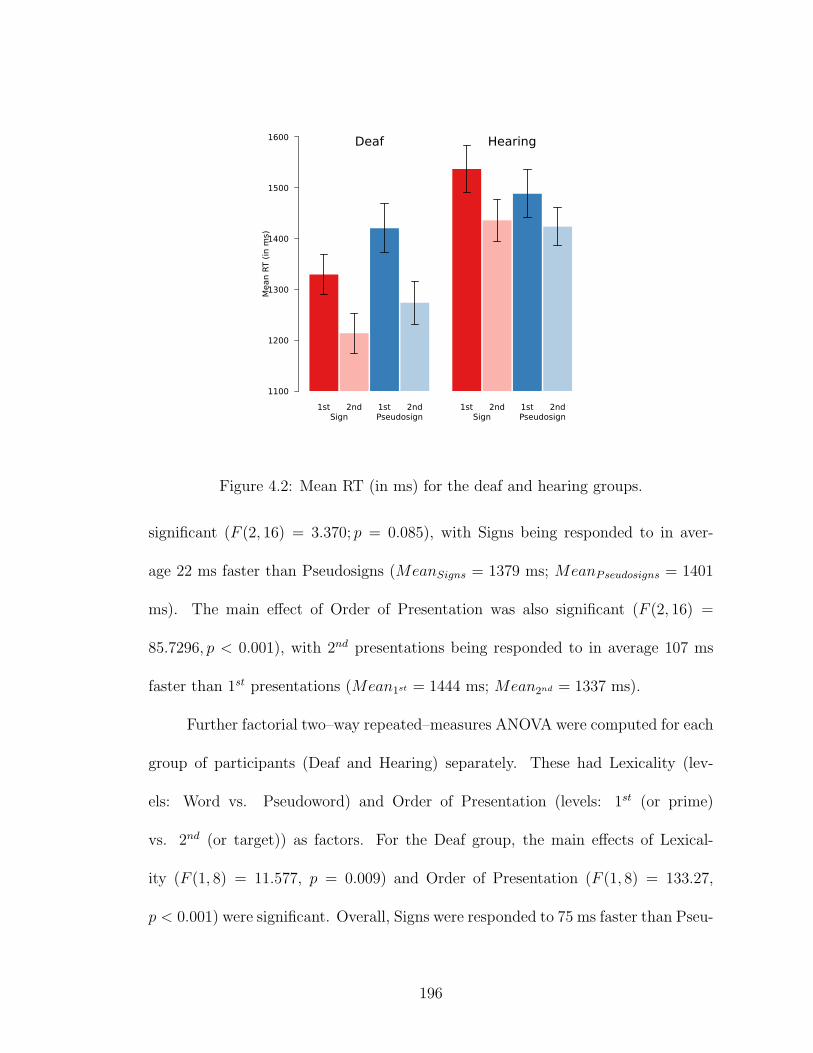
Mean R
T (
in m
s)
1100
1200
1300
1400
1500
1600
1st 2nd 1st 2nd 1st 2nd 1st 2ndSign Pseudosign Sign Pseudosign
Deaf Hearing
Figure 4.2: Mean RT (in ms) for the deaf and hearing groups.
significant (F (2, 16) = 3.370; p = 0.085), with Signs being responded to in aver-
age 22 ms faster than Pseudosigns (MeanSigns = 1379 ms; MeanPseudosigns = 1401
ms). The main effect of Order of Presentation was also significant (F (2, 16) =
85.7296, p < 0.001), with 2nd presentations being responded to in average 107 ms
faster than 1st presentations (Mean1st = 1444 ms; Mean2nd = 1337 ms).
Further factorial two–way repeated–measures ANOVA were computed for each
group of participants (Deaf and Hearing) separately. These had Lexicality (lev-
els: Word vs. Pseudoword) and Order of Presentation (levels: 1st (or prime)
vs. 2nd (or target)) as factors. For the Deaf group, the main effects of Lexical-
ity (F (1, 8) = 11.577, p = 0.009) and Order of Presentation (F (1, 8) = 133.27,
p < 0.001) were significant. Overall, Signs were responded to 75 ms faster than Pseu-
196

dosigns (MeanSigns = 1272 ms; MeanPseudosigns = 1347 ms), and 2nd presentations
were responded to in average 131 ms faster than 1st presentations (Mean1st = 1375
ms; Mean2nd = 1244 ms). The interaction between Lexicality and Order of Pre-
sentation was not significant for the Deaf group. Two planned comparisons were
further performed in order to ascertain whether the repetition effect was observed
for both Signs and Pseudosigns. We defined a repetition effect as the reaction-time
decrease between the first and the second occurrences of an item. For each item, we
subtracted from the reaction time to the first occurrence the reaction time to the
second. Therefore, a positive value indicates facilitated performance to the second
presentation compared to the first. Conversely, a negative value indicates inhibited
performance in the second presentation. Independent one–sample two–sided t–tests
were conducted for each Lexicality level. A significant effect of repetition was ob-
tained both for signs (t(8) = 7.061, p < 0.001, mean = 115 ms) and pseudosigns
(t(8) = 10.614, p < 0.001, mean = 147ms). Since the number of observations was
small (N = 9) and this could raise concerns about the appropriateness of parametric
t–tests (Wilcox, 1997, 2003), the planned comparisons were also performed as exact
permutation tests (Edgington & Onghena, 2007; Ludbrook & Dudley, 1998), which
do not depend on the many assumptions that need to be satisfied for the standard
parametric tests to be considered valid (eg. random sampling, normal distribution
of values, reasonably large sample size, etc)1. Under the null hypothesis of no treat-
1These tests used the same t statistic used in the parametric tests, but instead of deriving
the p value from existing significance tables, statistical significance was assessed directly from the
empirical distribution of t statistic under the null hypothesis
197

ment effect, the results obtained in the study are assumed to be purely incidental.
In the case of our planned comparisons, which are being computed over difference
scores; a null hypothesis of no treatment effects should predict that the mean of the
difference scores should be zero. Under this hypothesis, the arithmetic sign (+ or −)
of each difference score in the dataset is incidental (i. e., not related to experimental
manipulation), and could have been just as well reversed (this would equivalent to
swapping the RT from the first presentation with the RT from the second). There-
fore, if the null hypothesis is true, then the observed data set is just one amongst
the many possible sets that could have been obtained in which the arithmetic sign
of each observed difference score could have been different. More precisely, if the
sign of each observed difference score is reversible under the null hypothesis, and
the sample size N = 9, then there are 29 = 512 possible data sets that could have
been observed. By exhaustively enumerating them, we create what is called the
permutation set. By computing the t statistic for each one of the data sets in the
permutation set, we derive the empirical distribution of the t statistic under the null
hypothesis. Statistical significance was then assessed by calculating what proportion
of the 512 permuted data sets produces a t statistic as large or larger than the one
obtained in the observed data set. A low proportion implies that the probability of
obtaining the observed data set by pure chance is low. If that probability is < 0.05,
then we can state that the result is statistically significant. These permutation tests
led to the same conclusions regarding statistical significance than what was found
by using parametric tests (pSign = 0.02, pPseudosign < 0.001)2.
2It is important to notice that the p value obtained by this kind of procedure is exact, i. e. the
198
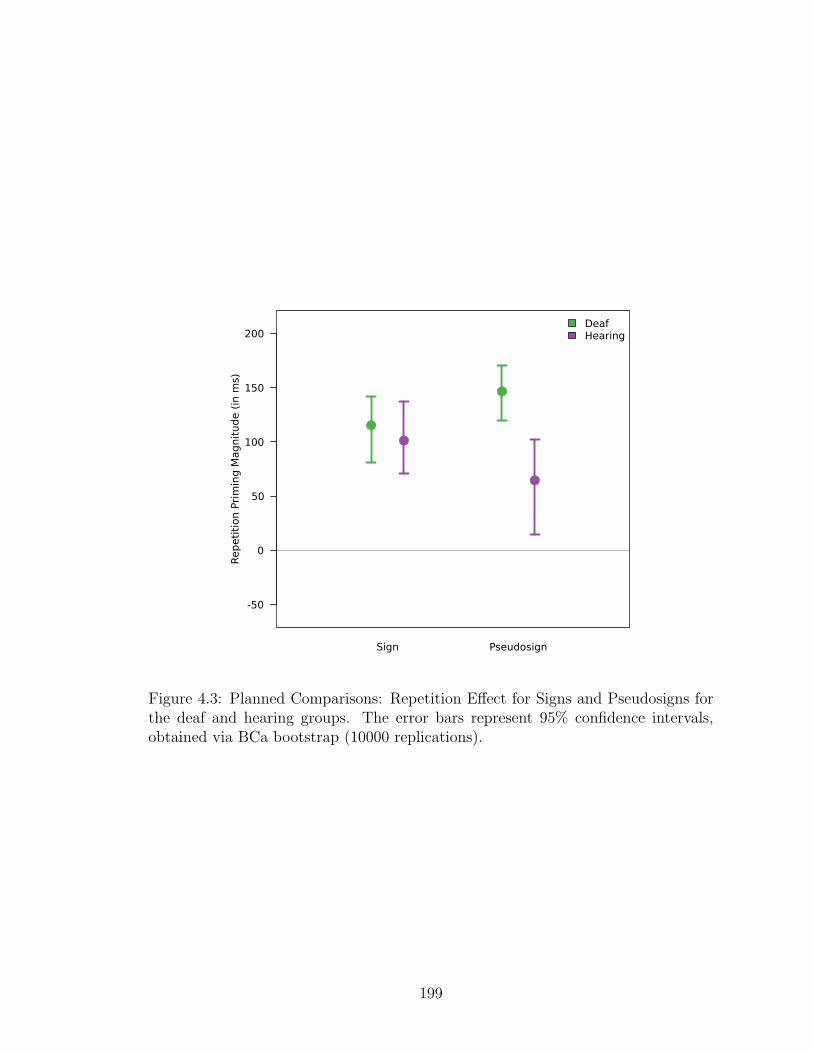
-50
0
50
100
150
200
Rep
eti
tion P
rim
ing
Mag
nit
ud
e (
in m
s)
Sign Pseudosign
DeafHearing
Figure 4.3: Planned Comparisons: Repetition Effect for Signs and Pseudosigns forthe deaf and hearing groups. The error bars represent 95% confidence intervals,obtained via BCa bootstrap (10000 replications).
199

For the Hearing group, the main effects of Lexicality (F (1, 8) = 9.1149,
p = 0.017) and Order of Presentation (F (1, 8) = 16.961, p = 0.003) were significant.
Overall, Signs were responded to 30 ms slower than Pseudosigns (MeanSigns =
1486 ms; MeanPseudosigns = 1456 ms), and 2nd presentations were responded to
in average 83 ms faster than 1st presentations. Furthermore, the interaction be-
tween Lexicality and Order of Presentation was significant for the Hearing group
(F (1, 8) = 9.7957, p = 0.01), and this was due to the fact that the RT reduc-
tion for 2nd presentations was stronger for Signs (DiffSigns:1st−to−2nd = 101 ms)
than for Pseudosigns (DiffPseudosigns:1st−to−2nd = 65 ms). The same two planned
comparisons performed for the Deaf group were performed for the Hearing group,
in order to ascertain whether the repetition effect was observed for both Signs and
Pseudosigns, and therefore two independent one–sample two–sided t–tests were con-
ducted for each Lexicality level. A significant effect of repetition was obtained both
for signs (t(8) = 5.6058, p < 0.001, mean = 101 ms) and pseudosigns (t(8) = 2.7498,
p = 0.026, mean = 65ms). Exact permutation tests (Edgington & Onghena, 2007;
Ludbrook & Dudley, 1998) led to the same conclusions regarding statistical sig-
nificance (pSign < 0.001, pPseudosigns = 0.014). Figure 4.3 displays the planned
p value is the true probability of the result under the null hypothesis, and not just an approxima-
tion based on theoretical distribution functions (eg. normal distribution) that require that some
assumptions about the distribution of the results and the size of the sample be met in order to be
valid. Therefore, even with a small sample size such as the one in this experiment, it is possible,
by using permutation methods, to make a statistically valid statement about the probability of
the results, even when parametric methods would have to be used very cautiously and would only
provide approximate results.
200

Figure 4.4: RT over the course of the experiment for individual subjects in the deafand hearing groups. Lines represent best fit linear trend.
comparisons for both the Deaf and Hearing group.
However, as in the experiment reported in Chapter 3, a decrease in RT for
the second presentation compared to the first could in principle be due to an overall
effect of practice with the task (see Wagenmakers et al., 2004, p. 1194, Logan, 1988,
exp. 3, Smith & Oscar-Berman, 1990, Baayen, 2004, p. 13). Therefore it is important
to ascertain whether or not factors independent of repetition, such as practice with
the task, can provide an alternative explanation for this pattern of results. In order
for practice or accommodation to the task to be the source of the significant decrease
in RT from the first presentation to the second, a downward trend in subjects’ RT
should be observed in the course of the experiment. The experiment–wise trends
for each individual subject is shown in figure 4.4.
In the Deaf group, four out of nine subjects exhibited a general downward
trend in their RT throughout the experiment (D007, D011, D012, D013) in one
or both of Lexicality conditions. Exact permutation tests were performed in the
201
data from the five subjects that did not exhibit a trend of decreasing RT in the
course of the experiment, and the results still point to a significant repetition effect
for signs (t(4) = 4.845, p < 0.001) and pseudosigns (t(4) = 9.148, p < 0.001).
Furthermore, a mixed effect model having Subjects and Items as random variables
and Lexicality and Order of Presentation as fixed effects was fit to the data of the
nine deaf subjects, coding the linear order in which each item was presented in
the experiment as a covariate (Baayen, 2004; Baayen et al., 2008; Baayen, 2008).
Markov chain Monte Carlo sampling (10000 replications) of the parameters of the
fitted model revealed that the effects of Lexicality (t = 4.05, p < 0.001) and Order of
Presentation (t = −18.21, p < 0.001) were still significant, but that effect of linear
order of items in the experiment was not (t = −0.66, p = 0.5357)3.
In the Hearing group, seven subjects out of nine exhibited the downward trend
in at least one condition (H002, H003, H008, H009, H010, H011, H013). Since there
are only two subjects in the Hearing group that do not display a linear decreasing
trend in their RT through the experiment, it is impossible to perform a planned
comparison targeting only them. The same mixed effect model fit for the Deaf
group was fit for the nine subjects in the Hearing group. Markov chain Monte Carlo
sampling (10000 replications) of the parameters of the fitted model revealed that
the effects of Lexicality (t = −2.2, p = 0.0325), Order of Presentation (t = −8.17,
3This resampling procedure derives what is called the posterior distributions of the parameters
of the model. The posterior distributions can then be used to estimate p values and confidence
intervals for the different parameters in the model. The results reported here were based on the
resampling of the t statistics of the fixed effect variables
202

p < 0.001) were significant. Moreover, contrary to what was observed in the Deaf
group, Linear Order (t = −4.45, p < 0.001) was also significant for the Hearing
group.
Discussion
Deaf participants showed nearly perfect discrimination between signs and non-
signs in this experiment. Hearing participants, on the other hand, showed near
chance level performance in the task. However, a reliable repetition effect was found
for both signs and pseudosigns in our experiment, for deaf and hearing participants.
This repetition effect was found to be independent of longitudinal practice effects
for both groups of participants. Deaf participants did not show any longitudinal
practice effect, whereas hearing participants did. This indicates that the facilitation
in performance for the second presentation of items in the deaf group has mainly
one source (repetition), whereas the facilitation found in the hearing group has two
different sources (repetition and practice). This implies a role of recent memory
representations in the performance of the task, at least for the hearing group.
4.1.2.2 MEG Data – Deaf Group
Given that reliable bilateral word–specific repetition effects were found in the
experiment described in chapter 3 when the sensor space was divided into quadrants,
the same analysis will be performed here. The time–windows from 150–250 ms, 300–
500 ms, 600–800 ms and 800–1000 ms will be chosen for amplitude analyses.
150–250ms
203

Figure 4.5: Results of the RMS analysis of each quadrant for the Word condition:Deaf group.
Figure 4.6: Results of the RMS analysis of each quadrant for the Pseudoword con-dition: Deaf group.
204

Separate three–way repeated measures ANOVAs were performed for the Ante-
rior and Posterior quadrants (defined as in the experiment described in chapter 3),
with Lexicality (Sign vs Pseudosign), Order of Presentation (1st vs 2nd) and Hemi-
sphere (Left vs Right) as factors (see Table 4.1 for results). For the Anterior Quad-
rant, the main effect of Lexicality was marginally significant, with Signs eliciting
lower amplitudes than Pseudosigns (F (1, 8) = 3.5916, p = 0.095, MeanSign = 40.8
fT, MeanPseudosign = 43.7 fT). The three–way interaction between Lexicality, Or-
der of Presentation and Hemisphere was significant (F (1, 8) = 7.0875, p = 0.029).
This was due to the fact that, in the right hemisphere, 1st presentations of Pseu-
dosigns elicited lower amplitudes than 2nd presentations, with the reverse being true
for Signs. In the left hemisphere, however, this pattern was not found, and 1st
presentations elicited lower amplitudes than 2nd presentations for both Signs and
Pseudosigns. Separate two–way repeated measures ANOVAs were calculated for
each Hemisphere with Lexicality and Order of Presentation as factors, but no sig-
nificant main effect or interaction was found. Post-hoc tests were run for condition
in the Order of Presentation factor, but no test turned out significant.
For the Posterior Quadrant, the interaction between Order of Presentation
and Hemisphere was marginally significant (F (1, 8) = 3.6789, p = 0.09), due to the
fact that the difference in amplitudes between the Left and Right hemispheres was
larger for 1st than 2nd presentations (1stLeft = 55.6 fT, 1st
Right = 49.1 fT, difference
= 6.5 fT; 2ndLeft = 52.2 fT, 2nd
Right = 49.2 fT, difference = 3 fT). No other main effect
or interaction was significant. Separate two–way repeated measures ANOVAs were
calculated for each Hemisphere with Lexicality and Order of Presentation as factors,
205
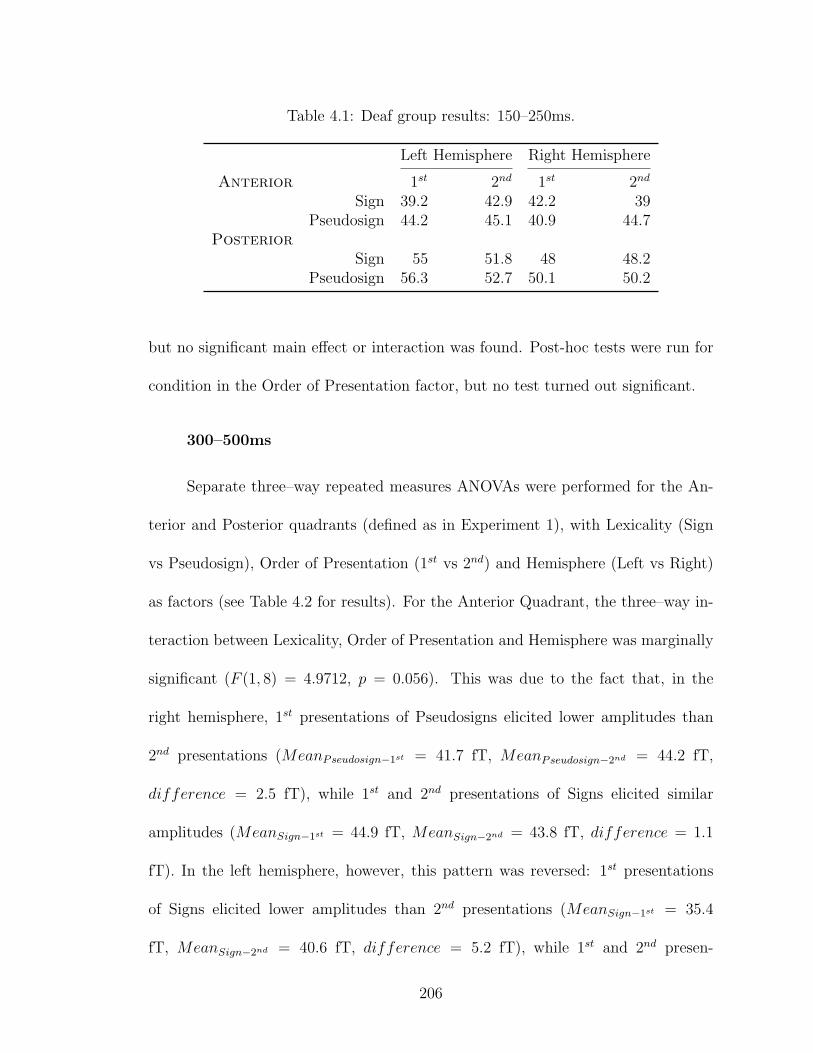
Table 4.1: Deaf group results: 150–250ms.
Left Hemisphere Right Hemisphere
Anterior 1st 2nd 1st 2nd
Sign 39.2 42.9 42.2 39Pseudosign 44.2 45.1 40.9 44.7
PosteriorSign 55 51.8 48 48.2
Pseudosign 56.3 52.7 50.1 50.2
but no significant main effect or interaction was found. Post-hoc tests were run for
condition in the Order of Presentation factor, but no test turned out significant.
300–500ms
Separate three–way repeated measures ANOVAs were performed for the An-
terior and Posterior quadrants (defined as in Experiment 1), with Lexicality (Sign
vs Pseudosign), Order of Presentation (1st vs 2nd) and Hemisphere (Left vs Right)
as factors (see Table 4.2 for results). For the Anterior Quadrant, the three–way in-
teraction between Lexicality, Order of Presentation and Hemisphere was marginally
significant (F (1, 8) = 4.9712, p = 0.056). This was due to the fact that, in the
right hemisphere, 1st presentations of Pseudosigns elicited lower amplitudes than
2nd presentations (MeanPseudosign−1st = 41.7 fT, MeanPseudosign−2nd = 44.2 fT,
difference = 2.5 fT), while 1st and 2nd presentations of Signs elicited similar
amplitudes (MeanSign−1st = 44.9 fT, MeanSign−2nd = 43.8 fT, difference = 1.1
fT). In the left hemisphere, however, this pattern was reversed: 1st presentations
of Signs elicited lower amplitudes than 2nd presentations (MeanSign−1st = 35.4
fT, MeanSign−2nd = 40.6 fT, difference = 5.2 fT), while 1st and 2nd presen-
206
tations of Pseudosigns elicited similar amplitudes (MeanPseudosign−1st = 37.2 fT,
MeanPseudosign−2nd = 37.6 fT, difference = 0.4 fT). Separate two–way repeated
measures ANOVAs were calculated for each Hemisphere with Lexicality and Order
of Presentation as factors, but no significant main effect or interaction was found.
Post-hoc tests were run for each condition in the Order of Presentation factor, but
no test turned out significant.
For the Posterior Quadrant, the main effect of Order of Presentation was
marginally significant (F (1, 8) = 4.7166, p = 0.06), with 1st presentations eliciting
lower amplitudes than 2nd presentations (Mean1st = 47.5 fT, Mean2nd = 50.4 fT,
difference = 2.9 fT). No other main effect or interaction was significant. In order to
ascertain whether the main effect of Order of Presentation was reliably elicited in the
two hemispheres, separate two–way repeated measures ANOVAs were calculated for
each Hemisphere with Lexicality and Order of Presentation as factors. No significant
main effect or interaction was found in the right hemisphere. However, the main
effect of Order of Presentation was marginally significant in the left hemisphere
(F (1, 8) = 4.0543, p = 0.08), with 1st presentations of eliciting lower amplitudes
than 2nd presentations (Mean1st = 49.9 fT, Mean2nd = 52.5 fT, difference = 2.6
fT). Post-hoc tests were run for each condition in the Order of Presentation factor,
but none turned out significant, even though there was a trend for 1st presentations of
Pseudosigns to elicit lower amplitudes than 2nd presentations in the right hemisphere
(MeanPseudosign−1st = 44.1 fT, MeanPseudosign−2nd = 50.4 fT, difference = 6.3
fT), and a trend for 1st presentations of Signs to elicit lower amplitudes than 2nd
presentations in the left hemisphere (MeanSign−1st = 49.3 fT, MeanSign−2nd = 55
207

Table 4.2: Deaf group results: 300–500ms.
Left Hemisphere Right Hemisphere
Anterior 1st 2nd 1st 2nd
Sign 35.4 40.6 44.9 43.8Pseudosign 37.2 37.6 41.7 44.2
PosteriorSign 49.3 55 46.2 46.2
Pseudosign 50.5 50 44.1 50.4
fT, difference = 5.7 fT)
600–800ms Separate three–way repeated measures ANOVAs were performed
for the Anterior and Posterior quadrants, with Lexicality (Sign vs Pseudosign),
Order of Presentation (1st vs 2nd) and Hemisphere (Left vs Right) as factors (see
Table 4.3 for results). For the Anterior Quadrant, no significant main effect or
interaction was found. Post-hoc tests were run for each condition in the Order of
Presentation factor, but no test turned out significant.
For the Posterior Quadrant, the main effect of Lexicality was marginally sig-
nificant (F (1, 8) = 4.4449, p = 0.07), with Signs eliciting lower amplitudes than
Pseudosigns (MeanSign = 48.8 fT, MeanPseudosign = 53.7 fT, difference = 4.9 fT).
The three–way interaction among Lexicality, Order of Presentation and Hemisphere
was significant (F (1, 8) = 7.2085, p = 0.03). This was due to the fact that the dif-
ference between 1st and 2nd presentations of Signs and Pseudosigns was reversed in
the two hemispheres, with a decrease for Signs (differenceSign:1st−to−2nd = −3.8 fT)
and an increase for Pseudosigns (differencePseudosign:1st−to−2nd = 8 fT) in the right
hemishere, but an increase in amplitude for Signs (differenceSign:1st−to−2nd = 2.1
208

fT), and a decrease for Pseudosigns (differencePseudosign:1st−to−2nd = −3.6 fT) in
the left hemisphere. No other main effect or interaction was significant. In order to
ascertain whether the main effect of Lexicality was reliably elicited in the two hemi-
spheres, separate two–way repeated measures ANOVAs were calculated for each
Hemisphere with Lexicality and Order of Presentation as factors. No significant
main effect or interaction was found in the right hemisphere. However, the main ef-
fect of Lexicality was marginally significant in the left hemisphere (F (1, 8) = 3.6659,
p = 0.09), with Signs eliciting lower amplitudes than Pseudosigns (MeanSigns = 52.1
fT, MeanPseudosigns = 56.1 fT, difference = 4 fT). Post-hoc tests were run to deter-
mine whether the effect of Lexicality was observed in both 1st and 2nd presentations
in both hemispheres. In the left hemisphere, there was a nonsignificant trend for 1st
presentations of Pseudosigns (Mean = 57.9 pT) to be higher in amplitude than 1st
presentations of Signs (Mean = 51.1 pT; t(8) = −1.6474, poriginal = 0.14, which,
when corrected for multiple comparisons using Holm’s method Holm (1979), gives
padjusted = 0.5). In the right hemisphere, there was a nonsignificant trend for 2nd
presentations of Pseudosigns (Mean = 55.3 pT) to be higher in amplitude than 2nd
presentations of Signs (Mean = 43.5 pT; t(8) = −2.0581, poriginal = 0.07, which,
when corrected for multiple comparisons using Holm’s method Holm (1979), gives
padjusted = 0.3) .
800–1000ms
Separate three–way repeated measures ANOVAs were performed for the An-
terior and Posterior quadrants, with Lexicality (Sign vs Pseudosign), Order of Pre-
209

Table 4.3: Deaf group results: 600–800ms.
Left Hemisphere Right Hemisphere
Anterior 1st 2nd 1st 2nd
Sign 38.7 38.8 55.6 46.4Pseudosign 43.6 40.2 45 46.4
PosteriorSign 51.1 53.2 47.3 43.5
Pseudosign 57.9 54.3 47.3 55.3
sentation (1st vs 2nd) and Hemisphere (Left vs Right) as factors (see Table 4.4 for
results). For the Anterior Quadrant, the three–way interaction between Lexicality,
Order of Presentation and Hemisphere was marginally significant (F (1, 8) = 3.7791,
p = 0.09). This was due to the fact that both 1st and 2nd presentations Signs elicited
lower amplitudes than Pseudosigns in the left hemisphere (MeanSign:1st = 44.4
pT, MeanPseudosign:1st = 46.1 pT, MeanSign:2nd = 43.2 pT, MeanPseudosign:2nd =
49 pT), whereas in the right hemisphere, the 1st presentation of Signs elicited
higher amplitudes than the 1st presentation of Pseudosigns (MeanSign:1st = 62.4
pT, MeanPseudosign:1st = 41.5 pT), but the 2nd presentation of Signs elicited lower
amplitudes than the 2nd presentation of Pseudosigns (MeanSign:1st = 40.1 pT,
MeanPseudosign:2nd = 52.6 pT). Separate two–way repeated measures ANOVAs were
calculated for each Hemisphere with Lexicality and Order of Presentation as fac-
tors, but no significant main effect or interaction was found. Post-hoc tests were
run for each condition in the Order of Presentation factor, but no test turned out
significant. Post-hoc tests were run for each condition in the Order of Presentation
factor, but no test turned out significant.
210

Table 4.4: Deaf group results: 800–1000ms.
Left Hemisphere Right Hemisphere
Anterior 1st 2nd 1st 2nd
Sign 44.4 43.2 62.4 40.1Pseudosign 46.1 49 41.5 52.6
PosteriorSign 38 43.8 39.4 38.9
Pseudosign 46.8 51.7 44.7 55.8
Discussion
When the data is divided in quadrants, as in the experiment described in
chapter 3, no lexical–specific effect of repetition was found in either posterior or
anterior sites. Moreover, no time–window of interest showed a reliable repetition
effect, neither for signs or pseudosigns. Finally, no reliable effect of lexicality was
found in any of the quadrants or time–windows of interest.
The lack of any effect of lexicality and repetition in the MEG data is in stark
contrast with the behavioral data, where reliable effects of repetition were found.
There are a number of reasons for this null results to have occurred. First, the
sample size was small (N = 9), which might have undermined our statistical power
to reveal any existing effects. Second, the MEG data is very noisy across subjects,
with huge variability in different time–windows. For instance, visual inspection of
the data reveals that a steady and pronounced divergence between first and second
presentations of signs in the right hemisphere starting at around 600 ms and lasting
until 1400 ms post–stimulus onset. However, what looks like a potential effect of
repetition is due to the contribution of a single subject, who, for one condition in
211

that time window, has amplitudes that are almost four times higher than the other
subjects. Once his data is excluded, the big divergence between first and second
presentation of words disappears. The accentuated inter–subject variability in the
MEG data, summed to the low sample size might have left us with a severely un-
derpowered design. Third, there are potential issues with the timing of the video
presentation. Evoked potentials assume that the component of interest can be un-
covered because it is time–locked with the presentation of the stimuli. In the case of
our ASL stimuli, we made sure that all our videos had three frames before the onset
of movement. However, it might be the case that the onset of movement is not the
relevant event with which to time–lock data epoching. Some signs and pseudosigns
might take longer to articulate simply because the point of articulation is higher, or
because it requires a wide movement. It is plausible that there is some varying time
interval between onset of movement and when the gesture becomes linguistically
relevant, and that this time is not controlled in our materials, therefore jittering the
actual onset of lexical processing in our dataset. If that is the case, potential effects
might have been averaged out of the grand–averaged data. Finally, it might be the
case that the subdivision of the sensor space in quadrants is still too coarse of a
procedure for any effect to be uncovered, especially with a small sample size and a
complicated input signal as the one used in this experiment.
4.1.2.3 MEG Data – Hearing Group
150–250ms
212

Figure 4.7: Results of the RMS analysis of each quadrant for the Word condition:Hearing group.
Figure 4.8: Results of the RMS analysis of each quadrant for the Pseudoword con-dition: Hearing group.
213

Table 4.5: Hearing group results: 150–250ms.
Left Hemisphere Right Hemisphere
Anterior 1st 2nd 1st 2nd
Sign 42.8 43.2 40.9 38.1Pseudosign 43.3 45.5 41 43.6
PosteriorSign 62.7 57.2 62.3 58.4
Pseudosign 57.8 67.5 59.5 66.1
Separate three–way repeated measures ANOVAs were performed for the An-
terior and Posterior quadrants (defined as in the experiment described in chapter
3), with Lexicality (Sign vs Pseudosign), Order of Presentation (1st vs 2nd) and
Hemisphere (Left vs Right) as factors (see Table 4.5 for results). For the Anterior
Quadrant, no main effect nor interaction turned out significant.
For the Posterior Quadrant, the interaction between Lexicality and Order
of Presentation was significant (F (1, 8) = 7.9936, p = 0.02), with Pseudosigns
increasing in amplitude from 1st presentation to 2nd (Meanincrease = +8.1 fT),
while the reverse was true for Signs (Meandecrease = −5.3 fT). Separate two–way
repeated measures ANOVAs were calculated for each Hemisphere with Lexicality
and Order of Presentation as factors, and the interaction between the two factors
was significant in both hemispheres (left hemisphere: F (1, 8) = 6.7176, p = 0.03;
right hemisphere: F (1, 8) = 7.6486, p = 0.02). Post-hoc tests were run for each
condition in the Order of Presentation factor, but no test turned out significant.
300–500ms
Separate three–way repeated measures ANOVAs were performed for the An-
214

Table 4.6: Hearing group results: 300–500ms.
Left Hemisphere Right Hemisphere
Anterior 1st 2nd 1st 2nd
Sign 38.4 39.5 38.9 38Pseudosign 43.8 41.7 41.8 42.3
PosteriorSign 53.9 49.6 56.3 52.9
Pseudosign 51.6 51.3 58.6 54.2
terior and Posterior quadrants (defined as in the experiment described in chapter
3), with Lexicality (Sign vs Pseudosign), Order of Presentation (1st vs 2nd) and
Hemisphere (Left vs Right) as factors (see Table 4.6 for results). For the Anterior
Quadrant, the main effect of Lexicality was marginally significant (F (1, 8) = 5.5266,
p = 0.05), with Pseudosigns (Mean = 42.4 fT) eliciting on average higher ampli-
tudes than Signs (Mean = 38.7 fT). Separate two–way repeated measures ANOVAs
were calculated for each Hemisphere with Lexicality and Order of Presentation
as factors in order to ascertain whether the effect of Lexicality was reliable in
the two hemispheres. No main effect or interaction was significant in the left
hemisphere. The main effect of Lexicality was significant in the right hemisphere
(F (1, 8) = 6.5002, p = 0.03), with Pseudosigns (Mean = 42 fT) eliciting higher
amplitudes than Signs (Mean = 38.4 fT). No other main effect or interaction was
significant.
For the Posterior Quadrant, no main effect or interaction was found to be
significant.
600–800ms
215

Separate three–way repeated measures ANOVAs were performed for the An-
terior and Posterior quadrants (defined as in the experiment described in chapter
3), with Lexicality (Sign vs Pseudosign), Order of Presentation (1st vs 2nd) and
Hemisphere (Left vs Right) as factors (see Table 4.7 for results). For the Anterior
Quadrant, no main effect or interaction was significant.
For the Posterior Quadrant, the main effect of Order of Presentation was
marginally significant (F (1, 8) = 3.694, p = 0.09), with 2nd presentations (Mean =
61.7 fT) eliciting higher amplitudes than 1st presentations (Mean = 58.8 fT).
The main effect of Hemisphere was also marginally significant (F (1, 8) = 4.708,
p = 0.06), with the left hemisphere (Mean = 63.4 fT) eliciting overall higher am-
plitudes than the right hemisphere (Mean = 57.1 fT). Separate two–way repeated
measures ANOVAs were calculated for each Hemisphere with Lexicality and Order
of Presentation as factors in order to ascertain whether the effect of Order of Pre-
sentation was reliable in the two hemispheres. No main effect or interaction was
significant in the left hemisphere. In the right hemisphere, the main effect of Order
of Presentation was significant (F (1, 8) = 8.861, p = 0.02), with 2nd presentations
(Mean = 59.8 fT) eliciting higher amplitudes than 1st presentations (Mean = 54.5
fT). No other main effect or interaction was significant. Post-hoc tests determined
that the main effect of Order of Presentation in the right hemisphere was only
significant for Pseudosigns (t(8) = 4.2916, p = 0.003).
800–1000ms
Separate three–way repeated measures ANOVAs were performed for the An-
216

Table 4.7: Hearing group results: 600–800ms.
Left Hemisphere Right Hemisphere
Anterior 1st 2nd 1st 2nd
Sign 47.8 43.2 43.9 42.7Pseudosign 51.7 47.9 44.5 44.9
PosteriorSign 64.1 63.5 57.8 54.5
Pseudosign 63.2 62.7 61.7 54.5
terior and Posterior quadrants (defined as in the experiment described in chapter
3), with Lexicality (Sign vs Pseudosign), Order of Presentation (1st vs 2nd) and
Hemisphere (Left vs Right) as factors (see Table 4.8 for results). For the An-
terior Quadrant, the main effect of Lexicality was significant (F (1, 8) = 5.847,
p = 0.04), with Pseudosigns (Mean = 54 fT) eliciting higher amplitudes than
Signs (Mean = 48.6 fT). The main effect of Order of Presentation was marginally
significant (F (1, 8) = 4.4847, p = 0.07), 1st presentations (Mean = 53.3 fT) elic-
iting higher amplitudes than 2nd presentations (Mean = 49.2 fT). The interac-
tion between Order of Presentation and Hemisphere was also marginally significant
(F (1, 8) = 4.2751, p = 0.07), due to the difference in amplitude between the 1st pre-
sentation and 2nd presentation in the left hemisphere (Meandecrease = −7.3 fT) being
much larger than in the right hemisphere (Meandecrease = 0.9 fT). No other main
effect or interaction turned out significant. Separate two–way repeated measures
ANOVAs were calculated for each Hemisphere with Lexicality and Order of Presen-
tation as factors in order to ascertain whether the effects of Lexicality and of Order
of Presentation were reliable in the two hemispheres. In the left hemisphere, both
217
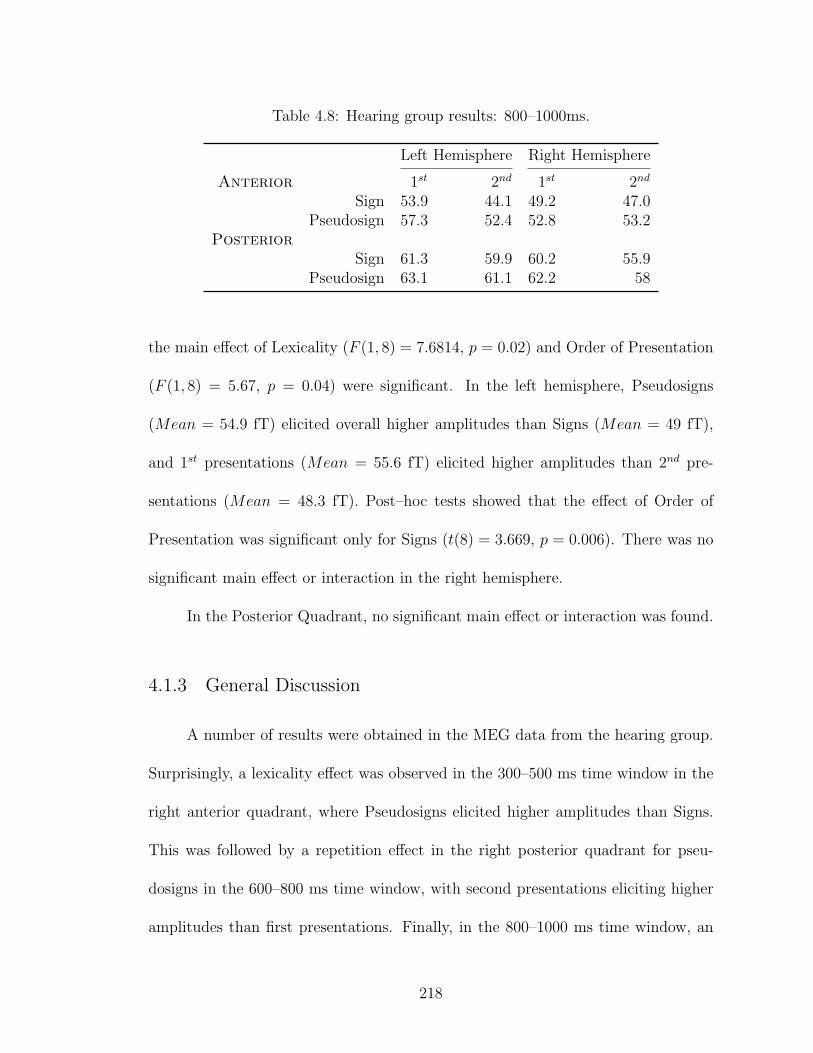
Table 4.8: Hearing group results: 800–1000ms.
Left Hemisphere Right Hemisphere
Anterior 1st 2nd 1st 2nd
Sign 53.9 44.1 49.2 47.0Pseudosign 57.3 52.4 52.8 53.2
PosteriorSign 61.3 59.9 60.2 55.9
Pseudosign 63.1 61.1 62.2 58
the main effect of Lexicality (F (1, 8) = 7.6814, p = 0.02) and Order of Presentation
(F (1, 8) = 5.67, p = 0.04) were significant. In the left hemisphere, Pseudosigns
(Mean = 54.9 fT) elicited overall higher amplitudes than Signs (Mean = 49 fT),
and 1st presentations (Mean = 55.6 fT) elicited higher amplitudes than 2nd pre-
sentations (Mean = 48.3 fT). Post–hoc tests showed that the effect of Order of
Presentation was significant only for Signs (t(8) = 3.669, p = 0.006). There was no
significant main effect or interaction in the right hemisphere.
In the Posterior Quadrant, no significant main effect or interaction was found.
4.1.3 General Discussion
A number of results were obtained in the MEG data from the hearing group.
Surprisingly, a lexicality effect was observed in the 300–500 ms time window in the
right anterior quadrant, where Pseudosigns elicited higher amplitudes than Signs.
This was followed by a repetition effect in the right posterior quadrant for pseu-
dosigns in the 600–800 ms time window, with second presentations eliciting higher
amplitudes than first presentations. Finally, in the 800–1000 ms time window, an
218

effect of Lexicality was found in the left anterior quadrant, with Pseudosigns elicit-
ing higher amplitude than Signs, and a repetition effect for signs in the left anterior
quadrant, with lower amplitudes for the second presentations compared to the first.
Interestingly, the effects of lexicality occurred only in the anterior quadrants,
early in the right hemisphere and later in the left, in both cases with Pseudosigns
having higher amplitudes. The effects of repetition, however, occurred in different
time windows and locations according to whether the effect was selective to pseu-
dosigns or signs. The repetition of pseudosigns elicited an earlier, right lateralized
and posterior effect, whereas the repetition of signs elicited a slightly later, left
lateralized and anterior effect.
It is unclear how to interpret what effects of lexicality mean for the hearing
group, given that they do not possess lexical representations for ASL signs, and
therefore should process Signs and Pseudosigns as the same kind of stimuli. However,
the two classes of stimuli apparently are treated differently by the subjects. This
might be due to some low–level property that is not controlled across lists, and that
subjects might be attending to. It is interesting to note that the hearing group’s
discrimination score, although bad, was not necessarily at chance level. This could
perhaps be the explanation for both the discrimination data and the the effects of
lexicality in the MEG data from this group. The effects of repetition are also hard
to interpret when they are selective for either Pseudosigns or Signs. Again, this
might be the consequence of some low level property of the stimuli that correlates
with its belonging to the Sign or Pseudosign list that is being selective attended,
and results in different processing profiles for the two kinds of stimuli.
219

However, the deaf group did not show such effects, which could suggest that
they engage the task and the stimuli differently. The fact that participants in the
hearing group were much more susceptible to overall longitudinal effects of practice
with the task than the hearing group lends support to this idea. Moreover, the
difference between the two groups is not what we were expecting, but at least a
difference has been shown.
4.2 Summary and conclusion
This experiment had two main goals. The first was to try to investigate
whether the medium–distance repetition priming paradigm is selective to repetition
of lexical representations as opposed to more generic kinds of memory representa-
tions, as suggested by the results of Pallier et al. (2003) (see chapter 3 for discussion).
In chapter 3, written English words were presented in a medium–distance repeti-
tion priming paradigm, but the behavioral results showed repetition effects both for
words and pseudowords. However, Pallier et al. (2001)’s study was done auditorily,
and therefore there are two obvious possible reasons for the disparity between the
behavioral results from the two studies. The first is the difference in modality of
presentation. The second possible reason is the change in temporal structure of
the stimuli. Our study attempted to test one of these possibilities by using sign–
language stimuli (ASL). Signs have a similar temporal structure to speech, but they
are visually transmitted. Therefore, by using signs we wanted to test whether it
was the temporal structure difference between the stimuli used in the two studies
220

that caused the difference in results. The behavioral results from this study, how-
ever, replicated those from the study reported in chapter 3: Repetition effects were
found both for words (signs) and pseudowords (pseudosigns). Moreover, in both
studies the repetition effects were not due to practice with the task (longitudinal
accommodation): In the study reported in chapter 3, practice effects were found,
but they were negligible (1.75s ms for the longest lags), and in this study, no sig-
nificant effect was found in the data from the deaf group. The hearing group, in
contrast, showed very strong effects of practice with the task beyond the effects of
stimulus repetition. This strongly suggests that the selective sensitivity to repetition
of words reported by Pallier et al. (2001) might be a consequence of the modality
of presentation. If true, this would be an interesting result, because it would argue
for the modality–specificity of access representations in the lexicon.
The second goal of this experiment was to try to replicate and extend the MEG
results found in the experiment reported in chapter 3 to a different kind of language
stimulus. Namely, in chapter 3 we reported a word–specific repetition effect that
was (i) substantially earlier and (ii) had a different distribution in the scalp / sensor
space than the standard component that generally responds to lexical stimuli (the
N400 and its MEG correlate, the N400m). Moreover, we also reported a lack of
N400 effect, contrary to what is normally reported. We attributed this lack of N400
effect to the use of longer and more variable lags between presentations of relevant
items (primes and targets) than what is normally used, suggesting that the N400
repetition effect is not a lexically induced response (it responds also to repetition of
nonwords and non–linguistic material), but is rather an index of a fulfilled percep-
221
tual / conceptual expectations. By varying the lag between the first presentation of
a stimulus and its repetition, and making the repetition virtually unpredictable, the
opportunity for fulfilled expectations of repeated presentations would be drastically
reduced, and therefore the N400 effect was eliminated. The present study intended
to investigate (i) whether a pre–N400 word–specific repetition effect should be ob-
served, as suggested by the previous experiment, and (ii) whether the variable lag
would eliminate the N400 repetition effect for ASL stimuli as well (see Kutas et al.,
1987; Tanaka & Nagashima, 2006, for evidence that signs also elicit N400 effects).
Unfortunately, the MEG results were very problematic. No statistically signif-
icant effect was found in the deaf group, in any time–window. Several reasons (or a
combination thereof) might explain this. The first consideration is whether or not
we had enough power to detect an effect if there were one to be found. Our sample
was small (9 people after problematic participants’ data were discarded), and we
observed a lot of individual variability in the MEG data. This alone could obscure
any effect. Moreover, there might be issues with the time–locking of the epoch. Our
criterion was to use a fixed time frame until the onset of the movement, but this
might not be capturing the true onset of linguistic processing, potentially adding
temporal jitter to where the component would appear relative to the stimulus onset.
This has the potential of washing out a real evoked response when the average of
all the subject’s trials is taken. A possible way of investigating this would be to
collect the uniqueness points of the signs and pseudosigns, i.e. the frame in which
subjects can correctly identify the stimulus, or reject it as an existing sign, in case
it is a pseudosign. This information can then be used to re–epoch the trials and see
222

whether there is an improvement in the MEG results for the deaf group4. Finally,
the division of the sensor space into quadrants might be obscuring real patterns
in the data. It might be the case, for instance, that the sources of the repetition
effects of written words and signs could be different, in which case the division of
the sensor–space into quadrants might not be the optimal arrangement to observe
the effect. Therefore, more exploratory data analysis could prove to be beneficial.
Nonetheless, the hearing group showed not only some lexically–specific results,
but also some repetition effects. However, given that these subjects do not have an
ASL lexicon, the MEG results cannot be attributed to access of lexical represen-
tations, and should probably be attributed to some superficial characteristic of the
stimuli. Interestingly, despite the lack of a statistically significant MEG result for
the deaf group, the MEG results from the two groups were still very different from
each other, which suggests that the way they are processing the stimuli is differ-
ent. For instance, if it is the case that the lexicality effects and the sign–specific
and pseudosign–specific can be attributed to some low–level physical properties that
grossly correlate with the distinction between the two classes of stimuli, then the
fact that the hearing group showed such effects but the deaf group did not is po-
tentially informative, suggesting a fundamental difference in the kind of processing
that the two groups engage in with the same set of stimuli.
4Dr. David Corina, from UC Davis, has generously collected the isolation points for the stimuli
used in this experiment, but the re-analysis of the materials has not been undertaken yet, due
to the time–consuming nature of re–epoching every subject’s data based on custom trigger values
that will need to be added to the data.
223

In summary, the behavioral results from this study replicate the results ob-
tained in the previous experiment, and therefore suggest that the word–specific
repetition effects found by (Pallier et al., 2001) might be due to either specific prop-
erties of auditory presentation or to the specific properties of the representations
that auditory stimuli tap into. The lack of an any significant effect in the MEG
data of the deaf group certainly warrants further investigation and exploratory data
analysis, but the fact that the MEG data from the deaf group and the hearing
group was very different strongly suggests that the ASL stimuli was processed in
fundamentally different ways between the two groups.
224

Chapter 5
Concluding remarks
Taken together, the studies presented in the previous chapters show that con-
tact with the lexicon via reading occurs at around 200 ms post stimulus onset.
The argument supporting this conclusion can be summarized as follows: The ERP
component linked most often to lexical access routines, the N400 (and its MEG
counterpart), does not index solely lexical activation. A promising MEG compo-
nent that had been linked to lexical activation by previous research, the M350, was
shown in chapter 2 to not track the kind of information (phonotactic or orthotactic
probability) it had been previously claimed to do. This fact raises some concerns
about the interpretation of the M350 as an index of lexical activation.
Moreover, previous research has shown that this very component fails to show
the distinction between the repetition of words and repetition of nonwords, with
both sorts of stimuli showing repetition effects, much like what is reported for the
N400 in the ERP literature. Thus, there are good reasons to believe that these two
event-related components do not index solely lexical access routines. In fact, there
are good reasons to believe that the N400 indexes predictive processing that can
incorporate some lexico–semantic information rather than semantic processing per
se.
This point was underscored in the study reported in chapter 3. This study
225

used a medium–term priming paradigm, which previous research had suggested to
be more sensitive to the retrieval of long term memory (lexical) information. The
results showed an earlier MEG component peaking around 200 ms post–stimulus
onset that was selectively sensitive to the repetition of words, and failed to show
repetition effects for nonwords, replicating relevant research in MEG. Moreover,
the use of a variable lag between presentations seems to have eliminated the MEG
counterpart of the N400 effect. Previous MEG research has reported standard MEG
correlates of the N400 effect when the lag between presentations was fixed. This
was interpreted as evidence that in previous repetition priming paradigms using
ERP and MEG, the modulation of the N400 effect and its MEG counterpart was
due to the predictability of the lag between presentations, and not to lexical access
routines. This set of results suggests that:
1. Lexical access in reading occurs at around 200 ms (as suggested by other
methodologies such as eye–tracking)
2. Lexical access seems to be impervious to manipulations of predictability based
on non–linguistic information (in the case of the experiment reported in chap-
ter 3, the lag manipulation did not wipe out the effect, as it did with the
N400m)
3. The N400 reflects predictive processing
4. The predictive processes reflected by the N400 can incorporate both linguistic
and non–linguistic information (for instance, how predictable a repetition of
a word would be in an experiment)
226
5. The M350 does not track sublexical frequency, in either the auditory and visual
modality. Therefore, there is no particular reason to think that the response
indexes sublexical activation.
In chapter 4, we attempted to extend the findings of the experiment reported
in chapter 3 to the domain of sign language. The rationale was that sign language
permits a less confounded comparison with reading than speech would. Like reading,
sign language is conveyed visually, but, like speech, it has a temporal structure and
it unfolds in time in a transient manner. Therefore, sign language is an important
piece of the puzzle in understanding how words are accessed.
At the behavioral level, the results from the deaf group in the sign language
study reveal a very similar pattern to the one found in the experiment reported in
chapter 3, in the sense that both signs and pseudosigns show true repetition effects.
On the other hand, the results from the hearing group show repetition effects that
are in part or in whole explainable by accommodation to the task. Unfortunately,
the MEG results of the experiment reported in chapter 4 were not significant and
the ERF patterns were difficult to interpret.
At this point, more research is needed in order to understand the MEG results
from the experiment reported in chapter 4. We suggest two courses of action: First,
we could use the frame where identification of the stimulus is possible (generously
collected by Dr. David Corina) as the true start of the presentation, instead of onset
of movement. Second, we might need to use different and more sophisticated data
analytical methods in order to uncover the structure of the results in more detail,
227

like PCA or ICA or dipole modeling.
In summary, the experiments reported in this dissertation helped in the clarifi-
cation of the functional interpretation of two important ERP/ERF components nor-
mally linked to lexical processing (the N400 and the M350), and provided evidence
that an earlier anterior evoked response (referred to in this dissertation as the P2m)
is in fact related to the initial stages of lexical access in reading, which is in principle
consistent with data from other methodologies and experimental paradigms.
228

ReferencesAbramson, M., & Goldinger, S. D. (1997, Oct). What the reader’s eye tells the
mind’s ear: silent reading activates inner speech. Percept Psychophys , 59 (7),1059–1068.
Alegre, M., & Gordon, P. (1999). Frequency Effects and the Representational Statusof Regular Inflections. Journal of Memory and Language, 40 (1), 41-61.
Allen, P. A., Smith, A. F., Lien, M.-C., Grabbe, J., & Murphy, M. D. (2005,Aug). Evidence for an activation locus of the word-frequency effect in lexicaldecision. J Exp Psychol Hum Percept Perform, 31 (4), 713–721. Availablefrom http://dx.doi.org/10.1037/0096-1523.31.4.713
Allen, P. A., Smith, A. F., Lien, M. C., Weber, T. A., & Madden, D. J. (1997,Dec). Word frequency effects at brief exposure durations: comment on paapand johansen (1994). J Exp Psychol Hum Percept Perform, 23 (6), 1792–1797.
Almeida, D. (2005). LING646 Final paper Experiment Proposal. (Unpublishedmanuscript)
Amano, S., & Kondo, T. (1999). Neighborhood effects in spoken word recognitionin japanese. In Proceedings of eurospeech 1999 (Vol. 4, pp. 1663–1666).
Amano, S., & Kondo, T. (2000). Neighborhood and cohort in lexical processings ofjapanese spoken words. In Swap-2000 (p. 91-94).
Andrews, S. (1989). Frequency and neighborhood effects on lexical access: Activa-tion or search? Journal of Experimental Psychology: Learning, Memory, andCognition, 15 (5), 802-814.
Andrews, S. (1992). Frequency and neighborhood effects on lexical access: Lexicalsimilarity or orthographic redundancy? Journal of Experimental Psychology:Learning, Memory & Cognition, 18 , 234-254.
Andrews, S. (1997). The effect of orthographic similarity on lexical retrieval: Resolv-ing neighborhood conflicts. Psychonomic Bulletin & Review , 4 (4), 439-461.
Assadollahi, R., & Pulvermuller, F. (2003). Early influences of word length and fre-quency: a group study using MEG. Neuroreport , 14 (8), 1183–1187. Availablefrom http://dx.doi.org/10.1097/01.wnr.0000075305.76650.60
Baayen, R. H. (2004). Statistics in Psycholinguistics: A critique of some currentgold standards. In G. Libben & K. Nault (Eds.), Mental lexicon working papers(Vol. 1, p. 1-45). Edmonton.
Baayen, R. H. (2008). Analyzing linguistic data: A practical introduction to statisticsusing r. Cambridge University Press.
Baayen, R. H., Davidson, D. J., & Bates, D. M. (2008). Mixed-effects modelingwith crossed random effects for subjects and items. Journal of Memory andLanguage, 59 (4), 390-412.
Baayen, R. H., Dijkstra, T., & Schreuder, R. (1997). Singulars and Plurals in Dutch:Evidence for a Parallel Dual-Route Model. Journal of Memory and Language,37 (1), 94-117.
Baayen, R. H., Piepenbrock, R., & Gulikers, L. (1995). The CELEX lexical database.CD–ROM. Philadelphia.
Bailey, T. M., & Hahn, U. (2001). Determinants of wordlikeness: Phonotactics orlexical neighborhoods? Journal of Memory and Language, 44 , 568591.
229

Balota, D. A. (1994). Visual word recognition: The journey from features tomeaning. In M. A. Gernsbacher (Ed.), Handbook of psycholinguistics (p. 303-358). New York: Academic Press.
Balota, D. A., & Abrams, R. A. (1995). Mental chronometry: beyond onset latenciesin the lexical decision task. J Exp Psychol Learn Mem Cogn, 21 (5), 1289–1302.
Balota, D. A., & Chumbley, J. I. (1984). Are lexical decisions a good measure oflexical access? The role of word frequency in the neglected decision stage. JExp Psychol Hum Percept Perform, 10 (3), 340–357.
Balota, D. A., & Chumbley, J. I. (1985). The locus of word–frequency efects in thepronunciation task: Lexical access and/or production? Journal of Memoryand Language, 24 , 89–106.
Balota, D. A., & Chumbley, J. I. (1990). Where are the effects of frequency invisual word recognition tasks? Right where we said they were! Comment onMonsell, Doyle, and Haggard (1989). J Exp Psychol Gen, 119 (2), 231–237.
Balota, D. A., Cortese, M. J., Sergent-Marshall, S. D., Spieler, D. H.,& Yap, M. (2004). Visual word recognition of single-syllablewords. J Exp Psychol Gen, 133 (2), 283–316. Available fromhttp://dx.doi.org/10.1037/0096-3445.133.2.283
Balota, D. A., & Spieler, D. H. (1999, Mar). Word frequency, repetition, and lexi-cality effects in word recognition tasks: beyond measures of central tendency.J Exp Psychol Gen, 128 (1), 32–55.
Balota, D. A., Yap, M. J., & Cortese, M. J. (2006). Visual word recognition:the journey from features to meaning (A travel update). In M. J. Traxler &M. A. Gernsbacher (Eds.), Handbook of psycholinguistics (2nd ed., p. 285-375).San Diego, CA: Academic Press.
Barnea, A., & Breznitz, Z. (1998, Dec). Phonological and orthographic processingof hebrew words: Electrophysiological aspects. Journal of Genetic Psychology ,159 (4), 492–504.
Barrett, S. E., & Rugg, M. D. (1989). Event-related potentials and the semanticmatching of faces. Neuropsychologia, 27 (7), 913–922.
Barrett, S. E., & Rugg, M. D. (1990). Event-related potentials and the semanticmatching of pictures. Brain Cogn, 14 (2), 201–212.
Barrett, S. E., Rugg, M. D., & Perrett, D. I. (1988). Event-related potentials and thematching of familiar and unfamiliar faces. Neuropsychologia, 26 (1), 105-117.
Battison, R. (1974). Phonological deletion in american sign language. Sign LanguageStudies , 3 (5), 1-19.
Baumgaertner, A., & Tompkins, C. A. (1998). Beyond frequency: predicting audi-tory word recognition in normal elderly adults. Aphasiology , 12 (7/8), 601-617.
Bavelier, D., & Potter, M. C. (1992, Feb). Visual and phonological codes in repeti-tion blindness. J Exp Psychol Hum Percept Perform, 18 (1), 134–147.
Bavelier, D., Prasada, S., & Segui, J. (1994). Repetition blindness between words:Nature of the orthographic and phonological representations involved. Journalof Experimental Psychology: Learning, Memory & Cognition, 20 (6), 1437-1455.
230

Becker, C. A. (1976, Nov). Allocation of attention during visual word recognition.J Exp Psychol Hum Percept Perform, 2 (4), 556–566.
Becker, C. A. (1979, May). Semantic context and word frequency effects in visualword recognition. J Exp Psychol Hum Percept Perform, 5 (2), 252–259.
Becker, C. A., & Killion, T. H. (1977). Interaction of visual and cognitive effects inword recognition. J Exp Psychol Hum Percept Perform, 3 (3), 389–401.
Beltran, D., Carreiras, M., Alvarez, M., & Santamarıa, C. (2006). Verificationof quantified sentences: An ERP study. In Poster presented at the cognitiveneuroscience society annual meeting (p. 233). San Francisco. (Poster G105 –Presented at the Cognitive Neuroscience Society annual meeting)
Bentin, S. (1989). Electrophysiological studies of visual word perception, lexicalorganization, and semantic processing: a tutorial review. Lang Speech, 32 (Pt 3), 205–220.
Bentin, S., Kutas, M., & Hillyard, S. A. (1995). Semantic processing and mem-ory for attended and unattended words in dichotic listening: behavioral andelectrophysiological evidence. J Exp Psychol Hum Percept Perform, 21 (1),54–67.
Bentin, S., McCarthy, G., & Wood, C. C. (1985). Event-related potentials, lexicaldecision and semantic priming. Electroencephalogr Clin Neurophysiol , 60 (4),343–355.
Beretta, A., Fiorentino, R., & Poeppel, D. (2005). The effectsof homonymy and polysemy on lexical access: an MEG study.Brain Res Cogn Brain Res , 24 (1), 57–65. Available fromhttp://dx.doi.org/10.1016/j.cogbrainres.2004.12.006
Berger, V. W. (2000, May). Pros and cons of permutation tests in clinical trials.Stat Med , 19 (10), 1319–1328.
Besson, M., & Kutas, M. (1993). The many facets of repetition: a cued-recall andevent-related potential analysis of repeating words in same versus differentsentence contexts. J Exp Psychol Learn Mem Cogn, 19 (5), 1115–1133.
Biederman, G. B. (1966). The recognition of tachistoscopically presented five-letterwords as a function of digram frequency. Journal of Verbal Learning and VerbalBehavior , 5 , 208-209.
Bobes, M. A., Valdes-Sosa, M., & Olivares, E. (1994). An ERP Study of ExpectancyViolation in Face Perception. Brain and Cognition, 26 , 1-22.
Bosch, L., Costa, A., & Sebastian-Galles, N. (2000). First and second language vowelperception in early bilinguals. European Journal of Cognitive Psychology , 12 ,189-222.
Bowers, J. S. (1994, May). Does implicit memory extend to legal and illegal non-words? J Exp Psychol Learn Mem Cogn, 20 (3), 534–549.
Bowers, J. S. (1996, Nov). Different perceptual codes support priming for wordsand pseudowords: was morton right all along? J Exp Psychol Learn MemCogn, 22 (6), 1336–1353.
Bowers, J. S. (2000, Mar). In defense of abstractionist theories of repetition primingand word identification. Psychon Bull Rev , 7 (1), 83–99.
Bowles, A., & Poeppel, D. (2005). Modality-independent and modality-specific
231

aspects of the MEG response during lexical decision. In Poster presented athuman brain mapping.
Brentari, D. (1990). Theoretical foundations of american sign language phonology.Unpublished doctoral dissertation, University of Chicago.
Broadbent, D. E., & Gregory, M. (1968). Visual perception of words differingin letter digram frequency. Journal of Verbal Learning and Verbal Behavior ,7 (56), 569-571.
Brown, C., & Hagoort, P. (1993). The processing nature of the N400: Evidencefrom masked priming. Journal of Cognitive Neuroscience, 5 , 34-44.
Brown, G. D. A. (1984). A frequency count of 190,000 words in the london-lundcorpus of english conversation. Journal of Behavior Research Methods, Instru-ments, & Computer , 16 , 502-532.
Brown, G. D. A., & Watson, F. L. (1987, May). First in, first out: Word learningage and spoken word frequency as predictors of word familiarity and wordnaming latency. Mem Cognit , 15 (3), 208-216.
Brysbaert, M. (2001, Jul). Prelexical phonological coding of visual words in dutch:automatic after all. Mem Cognit , 29 (5), 765–773.
Carreiras, M., Perea, M., & Grainger, J. (1997). Effects of orthographic neighbor-hood in visual word recognition: cross-task comparisons. J Exp Psychol LearnMem Cogn, 23 (4), 857–871.
Chomsky, N. (1957). Syntactic structures. Mouton.Chomsky, N. (1981). Lectures on government and binding. Dordrecht, The Nether-
lands: Foris Publications.Chomsky, N. (1995). The minimalist program. Cambridge, Massachusetts: MIT
Press.Cluff, M. S., & Luce, P. A. (1990). Similarity neighborhoods of spoken two-syllable
words: retroactive effects on multiple activation. J Exp Psychol Hum PerceptPerform, 16 (3), 551–563.
Cole, P., Beauvillain, C., & Segui, J. (1989). On the representation and processingof prefixed and suffixed derived words: A differential frequency effect. Journalof Memory & Language, 28 (1), 1-13.
Coltheart, M., Davelaar, E., Jonasson, J. T., & Besner, D. (1977). Access to theinternal lexicon. In S. Dornic (Ed.), Attention and performance VI (p. 535-555). Hillsdale, NJ: Erlbaum.
Connine, C. M., Mullennix, J., Shernoff, E., & Yelen, J. (1990, Nov). Word famil-iarity and frequency in visual and auditory word recognition. J Exp PsycholLearn Mem Cogn, 16 (6), 1084–1096.
Connine, C. M., Titone, D., & Wang, J. (1993, Jan). Auditory word recognition:extrinsic and intrinsic effects of word frequency. J Exp Psychol Learn MemCogn, 19 (1), 81–94.
Correa, L. M. S., Almeida, D., & Porto, R. S. (2004). Onthe representation of Portuguese gender-inflected words in the men-tal lexicon. Brain and Language, 90 (1-3), 63–73. Available fromhttp://dx.doi.org/10.1016/S0093-934X(03)00420-6
Coulson, S., Federmeier, K. D., Van Petten, C., & Kutas, M. (2005). Right hemi-
232

sphere sensitivity to word- and sentence-level context: evidence from event-related brain potentials. J Exp Psychol Learn Mem Cogn, 31 (1), 129–147.Available from http://dx.doi.org/10.1037/0278-7393.31.1.129
Coulson, S., & Wu, Y. C. (2005). Right hemisphere activation of joke-relatedinformation: an event-related brain potential study. J Cogn Neurosci , 17 (3),494–506. Available from http://dx.doi.org/10.1162/0898929053279568
Cuetos, F., Alvarez, B., Gonzlez-Nosti, M., Mot, A., & Bonin, P. (2006). Determi-nants of lexical access in speech production: role of word frequency and ageof acquisition. Mem Cognit , 34 (5), 999–1010.
Cutler, A. (1981). Making up materials is a confounded nuisance: or Will we beable to run any psycholinguistic experiments at all in 1990? Cognition, 10 ,6570.
Dambacher, M., Kliegl, R., Hofmann, M., & Jacobs, A. M. (2006,Apr). Frequency and predictability effects on event-related poten-tials during reading. Brain Res , 1084 (1), 89–103. Available fromhttp://dx.doi.org/10.1016/j.brainres.2006.02.010
Davis, C. J., & Taft, M. (2005). More words in the neighborhood : Interferencein lexical decision due to deletion neighbors. Psychonomic bulletin & review ,12 (5).
de Cheveigne, A., & Simon, J. Z. (2007, Sep). Denoising based ontime-shift pca. J Neurosci Methods , 165 (2), 297–305. Available fromhttp://dx.doi.org/10.1016/j.jneumeth.2007.06.003
Deacon, D., Dynowska, A., Ritter, W., & Grose-Fifer, J. (2004, Jan). Repeti-tion and semantic priming of nonwords: Implications for theories of N400and word recognition. Psychophysiology , 41 (1), 60–74. Available fromhttp://dx.doi.org/10.1111/1469-8986.00120
Deacon, D., Grose-Fifer, J., Yang, C.-M., Stanick, V., Hewitt, S., & Dynowska, A.(2004, Jun). Evidence for a new conceptualization of semantic representationin the left and right cerebral hemispheres. Cortex , 40 (3), 467–478.
Deacon, D., Hewitt, S., Yang, C., & Nagata, M. (2000). Event-related potentialindices of semantic priming using masked and unmasked words: evidence thatthe N400 does not reflect a post-lexical process. Brain Res Cogn Brain Res ,9 (2), 137–146.
Dehaene, S., Cohen, L., Sigman, M., & Vinckier, F. (2005). The neural code forwritten words: a proposal. Trends Cogn Sci , 9 (7), 335–341. Available fromhttp://dx.doi.org/10.1016/j.tics.2005.05.004
Dhond, R. P., Buckner, R. L., Dale, A. M., Marinkovic, K., & Halgren, E. (2001).Spatiotemporal maps of brain activity underlying word generation and theirmodification during repetition priming. J Neurosci , 21 (10), 3564–3571.
Dhond, R. P., Marinkovic, K., Dale, A. M., Witzel, T., & Halgren, E. (2003).Spatiotemporal maps of past-tense verb inflection. Neuroimage, 19 (1), 91–100.
Dhond, R. P., Witzel, T., Dale, A. M., & Halgren, E. (2005). Spatiotemporal brainmaps of delayed word repetition and recognition. Neuroimage, 28 (2), 293–304.Available from http://dx.doi.org/10.1016/j.neuroimage.2005.06.027
233

Dhond, R. P., Witzel, T., Dale, A. M., & Halgren, E. (2006). Spatiotemporalcortical dynamics underlying abstract and concrete word reading. Hum BrainMapp. Available from http://dx.doi.org/10.1002/hbm.20282
Domınguez, A., Cuetos, F., & Segui, J. (1999). The processing of grammaticalgender and number in spanish. Journal of Psycholinguistic Research, 28 (5),485-498.
Drenhaus, H., Graben, P. beim, & Frisch, S. (2006). Not all but some ERP resultson the scalar expressions ‘some’ and ‘all’. In Poster presented at the cognitiveneuroscience society annual meeting (p. 219). San Francisco. (Poster G37 –Presented at the Cognitive Neuroscience Society annual meeting)
Dunabeitia, J. A., Perea, M., & Carreiras, M. (2007, Dec). The role of the frequencyof constituents in compound words: evidence from basque and spanish. Psy-chon Bull Rev , 14 (6), 1171–1176.
Dufour, S., & Frauenfelder, U. H. (2007). Neighborhood density and neighbor-hood frequency effects in french spoken word recognition. In Proceedings ofinterspeech (p. 374-377).
Edgington, E. S., & Onghena, P. (2007). Randomization tests (4th ed.). Chapman& Hall/CRC.
Efron, B., & Tibshirani, R. (1993). An introduction to the bootstrap. New York:Chapman & Hall.
Embick, D., Hackl, M., Schaeffer, J., Kelepir, M., & Marantz, A. (2001). A magne-toencephalographic component whose latency reflects lexical frequency. Cog-nitive Brain Research, 10 , 345-348.
Fais, L., Kajikawa, S., Werker, J., & Amano, S. (2005). Japanese listeners’ percep-tions of phonotactic violations. Lang Speech, 48 (Pt 2), 185–201.
Feustel, T. C., Shiffrin, R. M., & Salasoo, A. (1983, Sep). Episodic and lexicalcontributions to the repetition effect in word identification. J Exp PsycholGen, 112 (3), 309–346.
Fiorentino, R., & Poeppel, D. (2007). Compound words and structure in the lexicon.Language and Cognitive Processes , 12 , 953-1000.
Fischler, I., Bloom, P. A., Childers, D. G., Roucos, S. E., & Perry, N. W. (1983).Brain potentials related to stages of sentence verification. Psychophysiology ,20 (4), 400–409.
Fischler, I., & Raney, G. E. (1989). Language by eye: Behavioral, autonomicand cortical approaches to reading. In J. R. Jennings & M. G. H. Coles(Eds.), Handbook of cognitive psychology: Central and autonomic nervous sys-tem (p. 511-574). New York: Wiley.
Fitch, W. T., Hauser, M. D., & Chomsky, N. (2005, Sep). Theevolution of the language faculty: clarifications and implications.Cognition, 97 (2), 179–210; discussion 211-25. Available fromhttp://dx.doi.org/10.1016/j.cognition.2005.02.005
Forbach, G., Stanners, R., & Hochaus, L. (1974). Repetition and practice effects ina lexical decision task. Mem Cognit , 2 , 337–339.
Forster, K. I. (1976). Accessing the mental lexicon. In R. Wales & E. Walker (Eds.),New approaches to language mechanisms (p. 257-287). North–Holland.
234

Forster, K. I. (1992). Memory-addressing mechanisms and lexical access. In R. Frost& L. Katz (Eds.), Orthography, phonology, morphology, and meaning (pp.413–434). Amsterdam: North-Holland.
Forster, K. I. (2000, Oct). The potential for experimenter bias effects in wordrecognition experiments. Mem Cognit , 28 (7), 1109–1115.
Forster, K. I., & Forster, J. (2003). DMDX: a Windows display program withmillisecond accuracy. Behavior research methods, instruments, & computers ,35 (1), 116-124.
Forster, K. I., & Shen, D. (1996). No enemies in the neighborhood: Absence ofinhibitory neighborhood effects in lexical decision and semantic categorization.Journal of Experimental Psychology: Learning, Memory, & Cognition, 22 (3),696-713.
Frederiksen, J. R., & Kroll, J. F. (1976). Spelling and sound: Approaches to theinternal lexicon. Journal of Experimental Psychology: Human Perception andPerformance, 2 , 361-379.
Frisch, S. A., Large, N. R., & Pisoni, D. B. (2000). Perception of wordlikeness: Ef-fects of segment probability and length on the processing of nonwords. Journalof Memory and Language, 42 , 481-496.
Garlock, V. M., Walley, A. C., & Metsala, J. L. (2001). Age–of–acquisition, wordfrequency, and neighborhood density effects on spoken word recognition bychildren and adults. Journal of Memory and Language, 45 , 468492.
Gaygen, D. E., & Luce, P. A. (1998). Effects of modality on subjective frequencyestimates and processing of spoken and printed words. Percept Psychophys ,60 (3), 465–483.
Gernsbacher, M. A. (1984, Jun). Resolving 20 years of inconsistent interactionsbetween lexical familiarity and orthography, concreteness, and polysemy. JExp Psychol Gen, 113 (2), 256–281.
Goldberg, A. (1995). Constructions: A construction grammar approach to argumentstructure. University of Chicago Press.
Goldberg, A. (2003, May). Constructions: a new theoretical approach to language.Trends Cogn Sci , 7 (5), 219–224.
Goldberg, A. (2006). Constructions at work: The nature of generalization in lan-guage. Oxford University Press.
Goldinger, S. D., Luce, P. A., & Pisoni, D. B. (1989). Priming lexical neighbors ofspoken words: Effects of competition and inhibition. Journal of Memory andLanguage, 28 , 501-518.
Goldinger, S. D., Luce, P. A., Pisoni, D. B., & Marcario, J. K. (1992). Form–basedpriming in spoken word recognition: the roles of competition and bias. J ExpPsychol Learn Mem Cogn, 18 (6), 1211–1238.
Gordon, P., & Alegre, M. (1999). Is there a dual system for reg-ular inflections? Brain Lang , 68 (1-2), 212–217. Available fromhttp://dx.doi.org/10.1006/brln.1999.2082
Grainger, J. (1990). Word frequency and neighborhood frequency effects in lexicaldecision and naming. Journal of Memory and Language, 29 , 228-244.
Grainger, J., Carreiras, M., & Perea, M. (2000). A new technique for visual word
235

recognition research: The luminance increment paradigm. Current PsychologyLetters , 1 , 107–116.
Grainger, J., & Jacobs, A. M. (1996). Orthographic processing in visual wordrecognition: a multiple read-out model. Psychol Rev , 103 (3), 518–565.
Grainger, J., Muneaux, M., Farioli, F., & Ziegler, J. C. (2005). Effectsof phonological and orthographic neighbourhood density interact in visualword recognition. Q J Exp Psychol A, 58 (6), 981–998. Available fromhttp://dx.doi.org/10.1080/02724980443000386
Grainger, J., O’Regan, J. K., Jacobs, A. M., & Segui, J. (1989). On the role ofcompeting word units in visual word recognition: the neighborhood frequencyeffect. Percept Psychophys , 45 (3), 189–195.
Greenberg, J. H., & Jenkins, J. J. (1964). Studies in the psychological correlates ofthe sound system of american english. Word , 20 , 157-177.
Grossberg, S., Boardman, I., & Cohen, M. (1997, Apr). Neural dynamics of variable-rate speech categorization. J Exp Psychol Hum Percept Perform, 23 (2), 481–503.
Halgren, E., Dhond, R. P., Christensen, N., Van Petten, C., Marinkovic, K., Lewine,J. D., et al. (2002). N400-like magnetoencephalography responses modulatedby semantic context, word frequency, and lexical class in sentences. Neuroim-age, 17 (3), 1101–1116.
Halgren, E., Wang, C., Schomer, D. L., Knake, S., Marinkovic, K., Wu, J.,et al. (2006). Processing stages underlying word recognition in the an-teroventral temporal lobe. Neuroimage, 30 (4), 1401–1413. Available fromhttp://dx.doi.org/10.1016/j.neuroimage.2005.10.053
Hauk, O., Patterson, K., Woollams, A., Watling, L., Pulvermuller, F., & Rogers,T. T. (2006). [Q:] When would you prefer a SOSSAGE to a SAUSAGE? [A:]At about 100 msec. ERP correlates of orthographic typicality and lexicality inwritten word recognition. J Cogn Neurosci , 18 (5), 818–832. Available fromhttp://dx.doi.org/10.1162/jocn.2006.18.5.818
Hauk, O., & Pulvermuller, F. (2004). Effects of word length and frequency onthe human event-related potential. Clin Neurophysiol , 115 (5), 1090–1103.Available from http://dx.doi.org/10.1016/j.clinph.2003.12.020
Hauk, O., Pulvermuller, F., Ford, M., Marslen-Wilson, W. D., & Davis, M. H.(2009, Jan). Can i have a quick word? early electrophysiological man-ifestations of psycholinguistic processes revealed by event-related regres-sion analysis of the eeg. Biol Psychol , 80 (1), 64–74. Available fromhttp://dx.doi.org/10.1016/j.biopsycho.2008.04.015
Hauser, M. D., Chomsky, N., & Fitch, W. T. (2002, Nov). The faculty of language:what is it, who has it, and how did it evolve? Science, 298 (5598), 1569–1579.Available from http://dx.doi.org/10.1126/science.298.5598.1569
Helenius, P., Salmelin, R., Service, E., & Connolly, J. F. (1998). Distinct timecourses of word and context comprehension in the left temporal cortex. Brain,121 ( Pt 6), 1133–1142.
Hepworth, S. L., Rovet, J. F., & Taylor, M. J. (2001, May). Neurophysiologicalcorrelates of verbal and nonverbal short-term memory in children: repetition
236

of words and faces. Psychophysiology , 38 (3), 594–600.Hoen, M., Meunier, F., & Segui, J. (in press). Leffet de la frequence des mots en
modalite auditive : Approche experimentale. Parole.Holcomb, P. J. (1988). Automatic and attentional processing: an event-related
brain potential analysis of semantic priming. Brain Lang , 35 (1), 66–85.Holcomb, P. J. (1993). Semantic priming and stimulus degradation: implications for
the role of the N400 in language processing. Psychophysiology , 30 (1), 47–61.Holcomb, P. J., & McPherson, W. B. (1994). Event-related brain potentials reflect
semantic priming in an object decision task. Brain Cogn, 24 (2), 259–276.Available from http://dx.doi.org/10.1006/brcg.1994.1014
Holcomb, P. J., & Neville, H. J. (1990). Auditory and visual semantic priming inlexical decision: A comparison using event-related brain potentials. Languageand Cognitive Processes , 5 (4), 281-312.
Holcomb, P. J., & Neville, H. J. (1991). Natural speech processing: An analysisusing event–related brain potentials. Psychobiology , 19 (4), 286-300.
Holm, S. (1979). A simple sequentially rejective multiple test procedure. Scandina-vian Journal of Statistics , 6 , 6570.
Holyk, G. G., & Pexman, P. M. (2004). The elusive nature of early phonologicalpriming effects: are there individual differences? Brain Lang , 90 (1-3), 353–367. Available from http://dx.doi.org/10.1016/S0093-934X(03)00447-4
Howes, D. H. (1957). On the relation between the intelligibility and frequency ofoccurrence of english words. The Journal of the Acoustical Society of America,29 (2), 296 – 305.
Howes, D. H., & Solomon, R. L. (1951, Jun). Visual duration threshold as a functionof word-probability. J Exp Psychol , 41 (6), 401–410.
Hunter, M. A., & May, R. B. (2003, Sep). Statistical testing and null distributions:what to do when samples are not random. Can J Exp Psychol , 57 (3), 176–188.
Huntsman, L. A., & Lima, S. D. (1996). Orthographic neighborhood structure andlexical access. Journal of Psycholinguistic Research, 25 , 417-429.
Huntsman, L. A., & Lima, S. D. (2002). Orthographic neighbors and visual wordrecognition. J Psycholinguist Res , 31 (3), 289–306.
Imai, S., Walley, A. C., & Flege, J. E. (2005, Feb). Lexical frequency and neighbor-hood density effects on the recognition of native and spanish-accented wordsby native english and spanish listeners. J Acoust Soc Am, 117 (2), 896–907.
Jusczyk, P. W., Frederici, A. D., Wessels, J., Svenkerud, V. Y., & Jusczyk, A. M.(1993). Infant’s sensitivity to the sound pattern of native language words.Journal of Memory and Language, 32 , 402-420.
Jusczyk, P. W., Luce, P. A., & Charles-Luce, J. (1994). Infants’ sensitivity tophonotactic patterns in native language. Journal of Memory and Language,33 , 630–645.
Kajikawa, S., Fais, L., Mugitani, R., Werker, J. F., & Amano, S. (2006, Oct).Cross-language sensitivity to phonotactic patterns in infants. J Acoust SocAm, 120 (4), 2278–2284.
Kay, P., & Fillmore, C. J. (1999). Grammatical constructions and linguistic gener-alizations. the ‘what’s X doing Y’? construction. Language, 75 (1), 1–33.
237

Kiefer, M. (2002). The N400 is modulated by unconsciously perceived maskedwords: further evidence for an automatic spreading activation account of N400priming effects. Cognitive Brain Research, 13 (1), 27–39.
Kiefer, M., & Brendel, D. (2006). Attentional modulation of unconscious ”au-tomatic” processes: evidence from event-related potentials in a maskedpriming paradigm. J Cogn Neurosci , 18 (2), 184–198. Available fromhttp://dx.doi.org/10.1162/089892906775783688
Kounios, J., & Holcomb, P. J. (1992). Structure and process in semantic memory:evidence from event-related brain potentials and reaction times. J Exp PsycholGen, 121 (4), 459–479.
Kreher, D. A., Holcomb, P. J., & Kuperberg, G. R. (2006). An electrophysiologicalinvestigation of indirect semantic priming. Psychophysiology , 43 (6), 550–563.Available from http://dx.doi.org/10.1111/j.1469-8986.2006.00460.x
Kutas, M. (1993). In the Company of Other Words: Electrophysiological Evi-dence for Single-word and Sentence Context Effects. Language and CognitiveProcesses , 8 (4), 533-572.
Kutas, M., & Federmeier, K. D. (2000). Electrophysiology reveals semantic memoryuse in language comprehension. Trends Cogn Sci , 4 (12), 463–470.
Kutas, M., & Hillyard, S. A. (1980). Reading senseless sentences: brain potentialsreflect semantic incongruity. Science, 207 (4427), 203–205.
Kutas, M., & Hillyard, S. A. (1984). Brain potentials during reading reflect wordexpectancy and semantic association. Nature, 307 (5947), 161–163.
Kutas, M., Lindamood, T. E., & Hillyard, S. A. (1984). Word expectancy andevent-related brain potentials during sentence processing. In S. Kornblum &J. Requin (Eds.), Preparatory states and processes (p. 217-237). Hillsdale, NJ:Erlbaum.
Kutas, M., Neville, H. J., & Holcomb, P. J. (1987). A preliminary comparison ofthe N400 response to semantic anomalies during reading, listening and signing.Electroencephalogr Clin Neurophysiol Suppl , 39 , 325–330.
Kucera, H., & Francis, W. (1967). Computational analysis of present-day americanenglish. Providence: Brown University Press.
Langacker, R. W. (1987). Foundations of cognitive grammar: Theoretical prerequi-sites (Vol. 1). Stanford University Press. (Volume 1: Theoretical Prerequisites(1987 hardcover))
Lau, E. F., Phillips, C., & Poeppel, D. (2008, Dec). A cortical network for semantics:(de)constructing the n400. Nat Rev Neurosci , 9 (12), 920–933. Available fromhttp://dx.doi.org/10.1038/nrn2532
Ledoux, K., Camblin, C. C., Swaab, T. Y., & Gordon, P. C. (2006). Readingwords in discourse: the modulation of lexical priming effects by message-level context. Behav Cogn Neurosci Rev , 5 (3), 107–127. Available fromhttp://dx.doi.org/10.1177/1534582306289573
Lewis, R. L., & Vasishth, S. (2005). An activation-based model of sentence process-ing as skilled memory retrieval. Cognitive Science, 29 , 375–419.
Lewis, R. L., Vasishth, S., & Dyke, J. A. V. (2006, Oct). Computational principles
238

of working memory in sentence comprehension. Trends Cogn Sci , 10 (10), 447–454. Available from http://dx.doi.org/10.1016/j.tics.2006.08.007
Liddell, S., & Johnson, R. (1989). American sign language: The phonological base.Sign Language Studies , 64 , 197-277.
Lipinski, J., & Gupta, P. (2005). Does neighborhood density influence repetitionlatency for nonwords? separating the effects of density and duration. Journalof Memory and Language, 52 , 171-192.
Liu, J., Harris, A., & Kanwisher, N. (2002, Sep). Stages of processing in faceperception: an meg study. Nat Neurosci , 5 (9), 910–916. Available fromhttp://dx.doi.org/10.1038/nn909
Liu, J., Higuchi, M., Marantz, A., & Kanwisher, N. (2000, Feb). The selectivity ofthe occipitotemporal m170 for faces. Neuroreport , 11 (2), 337–341.
Logan, G. D. (1988). Toward an instance theory of automatization. PsychologicalReview , 95 (4), 492-527.
Luce, P. A. (1986). Neighborhoods of words in the mental lexicon. Unpublisheddoctoral dissertation, Indiana University, Bloomington.
Luce, P. A., Goldinger, S. D., Auer, E. T., & Vitevitch, M. S. (2000). Phoneticpriming, neighborhood activation, and PARSYN. Percept Psychophys , 62 (3),615–625.
Luce, P. A., & Large, N. (2001). Phonotactics, density, and entropy in spoken wordrecognition. Language and Cognitive Processes , 16 , 565-581.
Luce, P. A., & Pisoni, D. B. (1998). Recognizing spoken words: the neighborhoodactivation model. Ear Hear , 19 (1), 1–36.
Luce, R. (1986). Response times. Oxford, UK: Oxford University Press.Luck, S. J., Vogel, E. K., & Shapiro, K. L. (1996). Word meanings can be accessed
but not reported during the attentional blink. Nature, 383 (6601), 616–618.Available from http://dx.doi.org/10.1038/383616a0
Ludbrook, J. (1994, Sep). Advantages of permutation (randomization) tests inclinical and experimental pharmacology and physiology. Clin Exp PharmacolPhysiol , 21 (9), 673–686.
Ludbrook, J. (2008). Statistics in biomedical laboratory and clinical science: ap-plications, issues and pitfalls. Med Princ Pract , 17 (1), 1–13. Available fromhttp://dx.doi.org/10.1159/000109583
Ludbrook, J., & Dudley, H. (1998). Why permutation tests are superior to t and Ftests in biomedical research. The American Statistician, 52 (2), 127-132.
Lukatela, G., Eaton, T., Lee, C., & Turvey, M. T. (2001, Mar). Does visual wordidentification involve a sub-phonemic level? Cognition, 78 (3), B41–B52.
Lukatela, G., Eaton, T., Sabadini, L., & Turvey, M. T. (2004, Feb). Vowel durationaffects visual word identification: evidence that the mediating phonology isphonetically informed. J Exp Psychol Hum Percept Perform, 30 (1), 151–162.Available from http://dx.doi.org/10.1037/0096-1523.30.1.151
Lukatela, G., Frost, S. J., & Turvey, M. T. (1998). Phonological priming by maskednonword primes in the lexical decision task. Journal of Memory and Language,39 (4), 666-683.
Lukatela, G., Frost, S. J., & Turvey, M. T. (1999, Jun). Identity priming in english is
239

compromised by phonological ambiguity. J Exp Psychol Hum Percept Perform,25 (3), 775–790.
Lukatela, G., Lukatela, K., & Turvey, M. T. (1993, May). Further evidence forphonological constraints on visual lexical access: Towed primes frog. PerceptPsychophys , 53 (5), 461–466.
Lukatela, G., & Turvey, M. T. (1990). Automatic and pre-lexical computationof phonology in visual word identification. European Journal of CognitivePsychology , 2 (4), 325 - 343.
Lukatela, G., & Turvey, M. T. (1991, Nov). Phonological access of the lexicon:evidence from associative priming with pseudohomophones. J Exp PsycholHum Percept Perform, 17 (4), 951–966.
Lukatela, G., & Turvey, M. T. (1993, Feb). Similar attentional, frequency, andassociative effects for pseudohomophones and words. J Exp Psychol HumPercept Perform, 19 (1), 166–178.
Lukatela, G., & Turvey, M. T. (1994a, Jun). Visual lexical access is initially phono-logical: 1. evidence from associative priming by words, homophones, and pseu-dohomophones. J Exp Psychol Gen, 123 (2), 107–128.
Lukatela, G., & Turvey, M. T. (1994b, Dec). Visual lexical access is initially phono-logical: 2. evidence from phonological priming by homophones and pseudoho-mophones. J Exp Psychol Gen, 123 (4), 331–353.
Marantz, A. (2005). Generative linguistics within the cognitive neuroscience oflanguage. The Linguistics Review , 22 , 429-445.
Marinkovic, K., Dhond, R. P., Dale, A. M., Glessner, M., Carr, V., & Halgren, E.(2003). Spatiotemporal dynamics of modality-specific and supramodal wordprocessing. Neuron, 38 (3), 487–497.
Marslen-Wilson, W. D. (1973). Linguistic structure and speech shadowing at veryshort latencies. Nature, 244 (5417), 522–523.
Marslen-Wilson, W. D. (1987a). Functional parallelism in spoken word-recognition.Cognition, 25 (1-2), 71–102.
Marslen-Wilson, W. D. (1987b, Mar). Functional parallelism in spoken word-recognition. Cognition, 25 (1-2), 71–102.
Marslen-Wilson, W. D. (1989). Lexical representation and process. InW. D. Marslen-Wilson (Ed.), Access and integration: Projecting sounds ontomeaning (p. 3-24). Cambridge, MA: MIT press.
Marslen-Wilson, W. D., & Tyler, L. K. (1975). Processing structure of sentenceperception. Nature, 257 (5529), 784–786.
Marslen-Wilson, W. D., & Tyler, L. K. (1980). The temporal structure of spokenlanguage understanding. Cognition, 8 (1), 1–71.
Marslen-Wilson, W. D., & Welsh, A. (1978). Processing interactions and lexicalaccess during word recognition in continuous speech. Cognitive Psychology ,10 (1), 29-63.
Massaro, D. W., Taylor, G. A., Venezky, R. L., Jastrzembski, J. E., & Lucas, P. A.(1980). Letter and word perception: Orthographic structure and visual process-ing in reading. New York: North-Holland.
Max, L., & Onghena, P. (1999). Some issues in the statistical analysis of completely
240
randomized and repeated measures designs for speech, language, and hearingresearch. Journal of Speech, Language, and Hearing Research, 42 , 261-270.
Mayberry, R. I., & Eichen, E. (1991). The long–lasting advantage of learningsign language in childhood: Another look at the critical period for languageacquisition. Journal of Memory and Language, 30 , 486-512.
Mayberry, R. I., & Fischer, S. D. (1989). Looking through phonological shapeto lexical meaning: The bottleneck of non-native sign language processing.Memory & Cognition, 17 , 740754.
Mayberry, R. I., & Lock, E. (2003, Dec). Age constraints on first versus secondlanguage acquisition: evidence for linguistic plasticity and epigenesis. BrainLang , 87 (3), 369–384.
Mayberry, R. I., Lock, E., & Kazmi, H. (2002, May). Linguistic abilityand early language exposure. Nature, 417 (6884), 38. Available fromhttp://dx.doi.org/10.1038/417038a
McClelland, J. L., & Johnston, J. C. (1977). The role of familiar units in perceptionof words and nonwords. Perception & Psychophysics , 22 , 249-261.
McPherson, W. B., & Holcomb, P. J. (1999). An electrophysiological investigationof semantic priming with pictures of real objects. Psychophysiology , 36 (1),53–65.
Meunier, F., & Segui, J. (1999a). Frequency effects in auditory word recognition:The case of suffixed words. Journal of Memory and Language, 41 , 327344.
Meunier, F., & Segui, J. (1999b). Morphological priming effect: the roleof surface frequency. Brain Lang , 68 (1-2), 54–60. Available fromhttp://dx.doi.org/10.1006/brln.1999.2098
Misra, M., & Holcomb, P. J. (2003). Event-related potential indices of maskedrepetition priming. Psychophysiology , 40 (1), 115–130.
Monsell, S., Doyle, M. C., & Haggard, P. N. (1989). Effects of frequency on visualword recognition tasks: where are they? J Exp Psychol Gen, 118 (1), 43–71.
Morrison, C. M., & Ellis, A. W. (2000, May). Real age of acquisition effects in wordnaming and lexical decision. Br J Psychol , 91 ( Pt 2), 167–180.
Morton, J. (1969). The interaction of information in word recognition. PsychologicalReview , 76 , 165-178.
Morton, J. (1979). Facilitation in word recognition: Experiments causing change inthe logogen model. In P. Kohlers, M. Wrolstad, & M. Bouma (Eds.), Processingof visible language. New York: Plenum.
Mousty, P., Radeau, M., Peereman, R., & Bertelson, P. (1996). The role of neigh-borhood relative frequency in spoken word recognition. In Proceedings of theicslp-1996 (p. 2498-2501).
Murray, W. S., & Forster, K. I. (2004, Jul). Serial mechanisms in lexical ac-cess: the rank hypothesis. Psychol Rev , 111 (3), 721–756. Available fromhttp://dx.doi.org/10.1037/0033-295X.111.3.721
Nagy, M. E., & Rugg, M. D. (1989, Jul). Modulation of event-related potentialsby word repetition: the effects of inter-item lag. Psychophysiology , 26 (4),431–436.
New, B., Brysbaert, M., Segui, J., Ferrand, L., & Rastle, K. (2004). The processing
241

of singular and plural nouns in French and English. Journal of Memory andLanguage, 51 (4), 568-585.
New, B., Ferrand, L., Pallier, C., & Brysbaert, M. (2006). Reexamining the wordlength effect in visual word recognition: new evidence from the English LexiconProject. Psychon Bull Rev , 13 (1), 45–52.
Newman, R. S., Sawusch, J. R., & Luce, P. A. (2005, Sep). Do postonset segmentsdefine a lexical neighborhood? Mem Cognit , 33 (6), 941–960.
Newport, E. (1990). Maturational constraints on language learning. CognitiveScience, 14 , 11-28.
Nieuwland, M. S., & van Berkum, J. J. A. (2006). When peanuts fall in love:N400 evidence for the power of discourse. J Cogn Neurosci , 18 (7), 1098–1111.Available from http://dx.doi.org/10.1162/jocn.2006.18.7.1098
Norris, D. (1984). The effects of frequency, repetition and stimulus quality in visualword recognition. Q J Exp Psychol A, 36 (3), 507 - 518.
Noveck, I. A., & Posada, A. (2003). Characterizing the time course of an implicature:an evoked potentials study. Brain Lang , 85 (2), 203–210.
Nusbaum, H. C., Pisoni, D. B., & Davis, C. K. (1984). Sizing up the hoosier mentallexicon: Measuring the familiarity of 20,000 words (Research on Speech Per-ception Progress Report No. 10). Bloomington: Speech Research Laboratory,Psychology Department, Indiana University.
Oldfield, R. C. (1971, Mar). The assessment and analysis of handedness: theedinburgh inventory. Neuropsychologia, 9 (1), 97–113.
Owsowitz, S. E. (1963). The effects of word familiarity and let-ter structure familiarity on the perception of words. Available fromhttp://www.rand.org/pubs/papers/P2820/ (Unpublished RAND paper)
Paap, K. R., & Johansen, L. S. (1994). The case of the vanishing frequency effect: Aretest of the verification model. J Exp Psychol Hum Percept Perform, 20 (6),1129–1157.
Paap, K. R., Johansen, L. S., Chun, E., & Vonnahme, P. (2000, Dec). Neighborhoodfrequency does affect performance in the reicher task: encoding or decision?J Exp Psychol Hum Percept Perform, 26 (6), 1691–1720.
Paap, K. R., Newsome, S. L., McDonald, J. E., & Schvaneveldt, R. W. (1982,Sep). An activation–verification model for letter and word recognition: theword-superiority effect. Psychol Rev , 89 (5), 573–594.
Pallier, C., Bosch, L., & Sebastian-Galles, N. (1997, Sep). A limit on behavioralplasticity in speech perception. Cognition, 64 (3), B9–17.
Pallier, C., Colome, A., & Sebastian-Galles, N. (2001). The influence of native–language phonology on lexical access: Exemplar–based versus abstract lexicalentries. Psychological Science, 12 (6), 445–449.
Pallier, C., Dehaene, S., Poline, J.-B., LeBihan, D., Argenti, A.-M., Dupoux, E., etal. (2003, Feb). Brain imaging of language plasticity in adopted adults: can asecond language replace the first? Cereb Cortex , 13 (2), 155–161.
Peereman, R., & Content, A. (1995). Neighborhood size effect in naming: Lexicalactivation or sublexical correspondences? Journal of Experimental Psychology:Learning, Memory and Cognition, 21 (2), 409-421.
242

Peereman, R., & Content, A. (1997). Orthographic and phonological neighborhoodsin naming: Not all neighbors are equally influential in orthographic space.Journal of Memory and Language, 37 , 382-410.
Perea, M., & Pollatsek, A. (1998). The effects of neighborhood frequency in readingand lexical decision. J Exp Psychol Hum Percept Perform, 24 (3), 767–779.
Perea, M., & Rosa, E. (2000). The effects of orthographic neighborhood in readingand laboratory word identification tasks: A review. Psicologica, 21 , 327-340.
Pexman, P. M., Lupker, S. J., & Reggin, L. D. (2002, May). Phonological effectsin visual word recognition: investigating the impact of feedback activation. JExp Psychol Learn Mem Cogn, 28 (3), 572–584.
Pisoni, D. B., & Levi, S. V. (2007). Some observations on representations andrepresentational specificity in speech perception and spoken word recognition.In M. Gaskell (Ed.), The oxford handbook of psycholinguistics. Oxford: OxfordUniversity Press.
Pitt, M. A., Myung, J. I., & Altieri, N. (2007, Jun). Modeling the word recognitiondata of vitevitch and luce (1998): is it artful? Psychon Bull Rev , 14 (3),442–448.
Plaut, D. C. (1997). Structure and function in the lexical system: Insights from dis-tributed models of word reading and lexical decision. Language and CognitiveProcesses , 12 (5–6), 765–806.
Plourde, C. E., & Besner, D. (1997). On the locus of the word–frequency effect invisual word recogntion. Canadian Journal of Experimental Psychology , 51 (3),181–194.
Poeppel, D., & Embick, D. (2005). Defining the relation between linguistics andneuroscience. In A. Cutler (Ed.), Twenty–first century psycholinguistics: Fourcornerstones. Lawrence Erlbaum.
Poeppel, D., Idsardi, W. J., & van Wassenhove, V. (2008). Speech perception at theinterface of neurobiology and linguistics. Phil. Trans. R. Soc. B , 363 (1493),1071-1086.
Pollatsek, A., Perea, M., & Binder, K. S. (1999). The effects of “neighborhood size”in reading and lexical decision. J Exp Psychol Hum Percept Perform, 25 (4),1142–1158.
Postman, L., & Conger, B. (1954, May). Verbal habits and the visual recognitionof words. Science, 119 (3098), 671–673.
Postman, L., & Schneider, B. H. (1951, Jul). Personal values, visual recognition,and recall. Psychol Rev , 58 (4), 271–284.
Pylkkanen, L., Llinas, R., & Murphy, G. L. (2006, Jan). The representation ofpolysemy: MEG evidence. J Cogn Neurosci , 18 (1), 97–109. Available fromhttp://dx.doi.org/10.1162/089892906775250003
Pylkkanen, L., & Marantz, A. (2003). Tracking the time course of word recognitionwith MEG. Trends Cogn Sci , 7 (5), 187–189.
Pylkkanen, L., Stringfellow, A., Flagg, E., & Marantz, A. (2000). A neural responsesensitive to repetition and phonotactic probability: MEG investigations oflexical access. In Proceedings of Biomeg 2000 (pp. 363–367). Helsinki, Finland.
Pylkkanen, L., Stringfellow, A., Flagg, E., & Marantz, A. (2001). A neural response
243

sensitive to repetition and phonotactic probability: MEG investigations oflexical access. In Proceedings of biomag 2000 (p. 363-367).
Pylkkanen, L., Stringfellow, A., & Marantz, A. (2002). Neuromagnetic evidence forthe timing of lexical activation: an MEG component sensitive to phonotacticprobability but not to neighborhood density. Brain Lang , 81 (1-3), 666–678.
Rastle, K., & Davis, M. H. (2002). On the complexities of measuring naming. JExp Psychol Hum Percept Perform, 28 (2), 307–314.
Rastle, K., Davis, M. H., & New, B. (2004). The broth in my brother’s brothel:morpho-orthographic segmentation in visual word recognition. Psychon BullRev , 11 (6), 1090–1098.
Ratcliff, R. (1979, May). Group reaction time distributions and an analysis ofdistribution statistics. Psychol Bull , 86 (3), 446–461.
Rhodes, S., & Donaldson, D. (2006). Meaning is first accessed through associ-ation and not shared semantic features: Electrophysiological evidence fromthe N400. In Poster presented at the cognitive neuroscience society annualmeeting (p. 219). San Francisco. (Poster G38 – Presented at the CognitiveNeuroscience Society annual meeting)
Rice, G. A., & Robinson, D. O. (1975). The role of bigram frequency in theperception of words and nonwords. Mem Cognit , 3 (5), 513-518.
Rolke, B., Heil, M., Streb, J., & Hennighausen, E. (2001). Missed prime words withinthe attentional blink evoke an N400 semantic priming effect. Psychophysiology ,38 (2), 165–174.
Rosenzweig, M. R., & Postman, L. (1957, Dec). Intelligibility as a function offrequency of usage. J Exp Psychol , 54 (6), 412–422.
Rosenzweig, M. R., & Postman, L. (1958, Feb). Frequency of usage and the pre-ception of words. Science, 127 (3293), 263–266.
Rugg, M. D. (1983). Further study of the electrophysiological correlates of lexicaldecision. Brain and Language, 19 , 142152.
Rugg, M. D. (1987). Dissociation of semantic priming, word and nonword repetitioneffects by event-related potentials. The Quarterly Journal of ExperimentalPsychology , 39A, 123148.
Rugg, M. D. (1990). Event-related brain potentials dissociate repetition effects ofhigh- and low-frequency words. Mem Cognit , 18 (4), 367–379.
Rugg, M. D., Brovedani, P., & Doyle, M. C. (1992). Modulation of event-relatedpotentials (ERPs) by word repetition in a task with inconsistent mappingbetween repetition and response. Electroencephalogr Clin Neurophysiol , 84 (6),521–531.
Rugg, M. D., Cox, C. J. C., Doyle, M. C., & Wells, T. (1995). Event-related poten-tials and the recollection of low and high frequency words. Neuropsychologia,33 (4), 471-484.
Rugg, M. D., Doyle, M. C., & Wells, T. (1995). Word and nonword repetitionwithin– and across-modality: An event–related potential study. Journal ofCognitive Neuroscience, 7 (2), 209-227.
Rugg, M. D., & Nagy, M. E. (1987, Nov). Lexical contribution to nonword-repetitioneffects: evidence from event-related potentials. Mem Cognit , 15 (6), 473–481.
244
Rumelhart, D. E., & McClelland, J. L. (1981). An interactive activation modelof context effects in letter perception: Part 1. An account of basic findings.Psychol Rev , 88 , 375-407.
Rumelhart, D. E., & McClelland, J. L. (1982). An interactive activation model ofcontext effects in letter perception: Part 2. The contextual enhancement effectand some tests and extensions of the model. Psychol Rev , 89 (1), 60–94.
Rumelhart, D. E., & Siple, P. (1974, Mar). Process of recognizing tachistoscopicallypresented words. Psychol Rev , 81 (2), 99–118.
Saffran, J. R., Aslin, R. N., & Newport, E. L. (1996, Dec). Statistical learning by8-month-old infants. Science, 274 (5294), 1926–1928.
Salasoo, A., Shiffrin, R. M., & Feustel, T. C. (1985, Mar). Building permanentmemory codes: codification and repetition effects in word identification. JExp Psychol Gen, 114 (1), 50–77.
Sandler, W. (1989). Phonological representation of the sign: linearity and non-linearity in american sign language (Vol. 32). Dodrecht, Netherlands: ForisPublications.
Savin, H. B. (1963). Word–frequency effect and errors in the perception of speech.The Journal of the Acoustical Society of America, 35 (2), 200 – 206.
Scarborough, D. L., Cortese, C., & Scarborough, H. S. (1977). Frequency and rep-etition effects in lexical memory. Journal of Experimental Psychology. HumanPerception and Performance, 3 (1), 1–17.
Schreuder, R., & Baayen, R. H. (1997). How complex simplex words can be. Journalof Memory and Language, 37 , 118-139.
Sears, C. R., Campbell, C. R., & Lupker, S. J. (2006, Aug). Is there a neigh-borhood frequency effect in english? evidence from reading and lexical deci-sion. J Exp Psychol Hum Percept Perform, 32 (4), 1040–1062. Available fromhttp://dx.doi.org/10.1037/0096-1523.32.4.1040
Sears, C. R., Hino, Y., & Lupker, S. J. (1995). Neighborhood size and neighborhoodfrequency effects in word recognition. Journal of Experimental Psychology:Human Perception & Performance, 21 (4).
Sears, C. R., Hino, Y., & Lupker, S. J. (1999). Orthographic neighborhood effectsin parallel distributed processing models. Canadian Journal of ExperimentalPsychology , 53 (3), 220-229.
Sears, C. R., Lupker, S. J., & Hino, Y. (1999). Orthographic neighborhood effectsin perceptual identification and semantic categorization tasks: a test of themultiple read-out model. Percept Psychophys , 61 (8), 1537–1554.
Sebastian-Galles, N., & Soto-Faraco, S. (1999, Sep). Online processing of native andnon-native phonemic contrasts in early bilinguals. Cognition, 72 (2), 111–123.
Seidenberg, M. S., & McClelland, J. L. (1989). A distributed, developmental modelof word recognition and naming. Psychol Rev , 96 (4), 523–568.
Seidenberg, M. S., & McClelland, J. L. (1990). More words but still no lexicon:Reply to Besner et al 1990. Psychological Review , 97 , 447-452.
Sekiguchi, T., Koyama, S., & Kakigi, R. (2000). The effect of word repetitionon evoked magnetic responses in the human brain. Japanese PsychologicalResearch, 42 (1), 3-14.
245

Sekiguchi, T., Koyama, S., & Kakigi, R. (2001, Jul). The effectof stimulus repetition on cortical magnetic responses evoked by wordsand nonwords. Neuroimage, 14 (1 Pt 1), 118–128. Available fromhttp://dx.doi.org/10.1006/nimg.2001.0774
Sereno, J. A., & Jongman, A. (1997). Processing of English inflectional morphology.Mem Cognit , 25 (4), 425–437.
Siakaluk, P. D., Sears, C. R., & Lupker, S. J. (2002). Orthographic neighborhoodeffects in lexical decision: the effects of nonword orthographic neighborhoodsize. J Exp Psychol Hum Percept Perform, 28 (3), 661–681.
Smith, M. E., & Halgren, E. (1987). Event-related potentials during lexical deci-sion: effects of repetition, word frequency, pronounceability, and concreteness.Electroencephalogr Clin Neurophysiol Suppl , 40 , 417–421.
Smith, M. E., & Oscar-Berman, M. (1990, Nov). Repetition priming of words andpseudowords in divided attention and in amnesia. J Exp Psychol Learn MemCogn, 16 (6), 1033–1042.
Snodgrass, J. G., & Minzer, M. (1993). Neighborhood effects in visual word recog-nition: Facilitatory or inhibitory? Memory and Cognition, 21 , 247-266.
Solomon, R. L., & Howes, D. H. (1951, Jul). Word frequency, personal values, andvisual duration thresholds. Psychol Rev , 58 (4), 256–270.
Solomyak, O., & Marantz, A. (2009, Mar). Lexical access in early stagesof visual word processing: a single-trial correlational meg study of het-eronym recognition. Brain Lang , 108 (3), 191–196. Available fromhttp://dx.doi.org/10.1016/j.bandl.2008.09.004
St. George, M., Mannes, S., & Hoffman, J. E. (1994). Global semantic expectancyand language comprehension. Journal of cognitive neuroscience, 6 (1), 70-83.
Stadthagen-Gonzalez, H., & Davis, C. J. (2006, Nov). The Bristol norms for age ofacquisition, imageability, and familiarity. Behav Res Methods , 38 (4), 598–605.
Stanners, R. F., Jastrzembski, J. E., & Westbrook, A. (1975). Frequency and visualquality in a word-nonword classification task. Journal of Verbal Learning &Verbal Behavior , 14 (3), 259-264.
Sternberg, S. (1969). The discovery of processing stages: Extensions of donders’method. Acta Psychologica, 30 , 276-315.
Stockall, L., Stringfellow, A., & Marantz, A. (2004). The precise time course oflexical activation: MEG measurements of the effects of frequency, probability,and density in lexical decision. Brain Lang , 90 (1-3), 88–94. Available fromhttp://dx.doi.org/10.1016/S0093-934X(03)00422-X
Stokoe, W., Casterline, D., & Croneberg, C. (1965). A dictionary of americansign language on linguistic principles. Washi ngton, DC: Gallaudet UniversityPress.
Summerfield, C., Trittschuh, E. H., Monti, J. M., Mesulam, M.-M., & Egner, T.(2008, Aug). Neural repetition suppression reflects fulfilled perceptual expecta-tions. Nat Neurosci . Available from http://dx.doi.org/10.1038/nn.2163
Swaab, T. Y., Camblin, C. C., & Gordon, P. C. (2004). Elec-trophysiological evidence for reversed lexical repetition effects in lan-
246

guage processing. J Cogn Neurosci , 16 (5), 715–726. Available fromhttp://dx.doi.org/10.1162/089892904970744
Taft, M. (1979, Jul). Recognition of affixed words and the word frequency effect.Mem Cognit , 7 (4), 263–272.
Taft, M., & Forster, K. I. (1976). Lexical storage and retrieval of polymorphemicand polysyllabic words. Journal of Verbal Learning and Verbal Behavior., 15 ,607-620.
Tanaka, H., & Nagashima, Y. (2006, 8–11 Oct.). Study of japanese sign languagesemantic process based on n400 analysis. In Proc. ieee international conferenceon systems, man and cybernetics smc ’06 (Vol. 1, pp. 353–357).
Tarkiainen, A., Cornelissen, P. L., & Salmelin, R. (2002). Dynamics of visual fea-ture analysis and object-level processing in face versus letter-string perception.Brain, 125 (Pt 5), 1125–1136.
Tarkiainen, A., Helenius, P., Hansen, P. C., Cornelissen, P. L., & Salmelin, R.(1999). Dynamics of letter string perception in the human occipitotemporalcortex. Brain, 122 ( Pt 11), 2119–2132.
Tenpenny, P. L. (1995). Abstractionist versus episodic theories of repetition primingand word identification. Psychon Bull Rev , 2 (3), 339–363.
Thorndike, E., & Lorge, I. (1944). The teacher’s word book of 30,000 words. NewYork: Columbia University, Teacher’s College Press.
Treiman, R., Mullennix, J., Bijeljac-Babic, R., & Richmond-Welty, E. D. (1995,Jun). The special role of rimes in the description, use, and acquisition ofenglish orthography. J Exp Psychol Gen, 124 (2), 107–136.
Tryon, W. W. (2001). Evaluating statistical difference, equivalence, and indetermi-nacy using inferential confidence intervals: an integrated alternative method ofconducting null hypothesis statistical tests. Psychol Methods , 6 (4), 371–386.
Turner, J. E., Valentine, T., & Ellis, A. W. (1998, Nov). Contrasting effects ofage of acquisition and word frequency on auditory and visual lexical decision.Mem Cognit , 26 (6), 1282–1291.
van Berkum, J. J. A., Hagoort, P., & Brown, C. M. (1999). Semantic integrationin sentences and discourse: evidence from the N400. J Cogn Neurosci , 11 (6),657–671.
van Berkum, J. J. A., Zwitserlood, P., Hagoort, P., & Brown, C. M. (2003). Whenand how do listeners relate a sentence to the wider discourse? Evidence fromthe N400 effect. Brain Res Cogn Brain Res , 17 (3), 701–718.
Van Orden, G. C. (1987, May). A rows is a rose: spelling, sound, and reading. MemCognit , 15 (3), 181–198.
Van Orden, G. C., Johnston, J. C., & Hale, B. L. (1988, Jul). Word identificationin reading proceeds from spelling to sound to meaning. J Exp Psychol LearnMem Cogn, 14 (3), 371–386.
Van Petten, C., & Kutas, M. (1990). Interactions between sentence context and wordfrequency in event-related brain potentials. Mem Cognit , 18 (4), 380–393.
Van Petten, C., Kutas, M., Kluender, R., Mitchiner, M., & McIsaac, H. (1991).Fractionating the word repetition effect with event-related potentials. Journalof Cognitive Neuroscience, 3 (2), 131-150.
247

Van Petten, C., & Luka, B. J. (2006). Neural localization of semantic contexteffects in electromagnetic and hemodynamic studies. Brain Lang , 97 (3), 279–293. Available from http://dx.doi.org/10.1016/j.bandl.2005.11.003
Vitevitch, M. S. (2003). The influence of sublexical and lexical representationson the processing of spoken words in English. Clin Linguist Phon, 17 (6),487–499.
Vitevitch, M. S., & Luce, P. A. (1998). When words compete: Levels of processingin perception of spoken words. Psychological Science, 9 , 325-329.
Vitevitch, M. S., & Luce, P. A. (1999). Probabilistic phontactics and neighborhoodactivation in spoken word recognition. Journal of Memory and Language, 40 ,374-408.
Vitevitch, M. S., & Luce, P. A. (2005). Increases in phonotactic probability facilitatespoken nonword repetition. Journal of Memory and Language, 52 , 193204.
Vitevitch, M. S., Luce, P. A., Charles-Luce, J., & Kemmerer, D. (1997). Phono-tactics and syllable stress: implications for the processing of spoken nonsensewords. Lang Speech, 40 ( Pt 1), 47–62.
Vitevitch, M. S., Luce, P. A., Pisoni, D. B., & Auer, E. T. (1999).Phonotactics, neighborhood activation, and lexical access for spo-ken words. Brain Lang , 68 (1-2), 306–311. Available fromhttp://dx.doi.org/10.1006/brln.1999.2116
Vitevitch, M. S., & Rodrıguez, E. (2005). Neighborhood density effects in spokenword recognition in Spanish. Journal of Multilingual Communication Disor-ders , 3 (1), 64 - 73.
Vogel, E. K., Luck, S. J., & Shapiro, K. L. (1998). Electrophysiological evidencefor a postperceptual locus of suppression during the attentional blink. J ExpPsychol Hum Percept Perform, 24 (6), 1656–1674.
Wagenmakers, E.-J., Zeelenberg, R., Steyvers, M., Shiffrin, R., & Raaijmakers, J.(2004, Oct). Nonword repetition in lexical decision: support for two op-posing processes. Q J Exp Psychol A, 57 (7), 1191–1210. Available fromhttp://dx.doi.org/10.1080/02724980343000729
Westbury, C., & Buchanan, L. (1999). Whats in a word? a sublexical effect ina lexical decision task. In M. Hahn & S. C. Stoness (Eds.), The proceedingsof the twenty-first annual conference of the cognitive science society (p. 824).Mahwah, NJ: Erlbaum.
Westbury, C., & Buchanan, L. (2002). The probability of the least likely non-length-controlled bigram affects lexical decision reaction times. Brain Lang , 81 (1-3),66–78.
Whaley, C. P. (1978). Word-nonword classification time. Journal of Verbal Learningand Verbal Behavior , 17 , 143–154.
Wilcox, R. R. (1997). Introduction to robust estimation and hypothesis testing. SanDiego: Academic Press.
Wilcox, R. R. (2003). Applying contemporary statistical techniques. AcademicPress.
Wilding, E. L. (2000). In what way does the parietal ERP old/new effect indexrecollection? Int J Psychophysiol , 35 (1), 81–87.
248

Wydell, T. N., Vuorinen, T., Helenius, P., & Salmelin, R. (2003). Neu-ral correlates of letter-string length and lexicality during reading in a reg-ular orthography. J Cogn Neurosci , 15 (7), 1052–1062. Available fromhttp://dx.doi.org/10.1162/089892903770007434
Yap, M. J., & Balota, D. A. (2007, Mar). Additive and interac-tive effects on response time distributions in visual word recognition.J Exp Psychol Learn Mem Cogn, 33 (2), 274–296. Available fromhttp://dx.doi.org/10.1037/0278-7393.33.2.274
Yap, M. J., Balota, D. A., Tse, C.-S., & Besner, D. (2008, May). On the addi-tive effects of stimulus quality and word frequency in lexical decision: evi-dence for opposing interactive influences revealed by rt distributional anal-yses. J Exp Psychol Learn Mem Cogn, 34 (3), 495–513. Available fromhttp://dx.doi.org/10.1037/0278-7393.34.3.495
Yates, M. (2005, Nov). Phonological neighbors speed visual word processing: evi-dence from multiple tasks. J Exp Psychol Learn Mem Cogn, 31 (6), 1385–1397.Available from http://dx.doi.org/10.1037/0278-7393.31.6.1385
Yates, M., Locker, L., & Simpson, G. B. (2004). The influence of phonologicalneighborhood on visual word perception. Psychon Bull Rev , 11 (3), 452–457.
Yoneyama, K., & Johnson, K. (2001). Neighborhood effects in japanese wordrecognition. J. Acoust. Soc. Am., 109 (5), 2314-2315.
Young, M. P., & Rugg, M. D. (1992). Word frequency and multiple repetitionas determinants of the modulation of event-related potentials in a semanticclassification task. Psychophysiology , 29 (6), 664–676.
Ziegler, J. C., Muneaux, M., & Grainger, J. (2003). Neighborhood effects in audi-tory word recognition: Phonological competition and orthographic facilitation.Journal of Memory and Language, 2003 , 779-793.
Ziegler, J. C., & Perry, C. (1998). No more problems in Coltheart’s neighborhood:resolving neighborhood conflicts in the lexical decision task. Cognition, 68 (2),B53–B62.
Zweig, E., & Pylkkanen, L. (2009). A visual m170 effect of morphological complexity.Language and Cognitive Processes , 24 (3), 412 439.
249