abstract— effects of experimental harvest on red sea urchins
TRANSCRIPT
662
Abstract—Commercial harvest of red sea urchins began in Washington state in 1971. Harvests peaked in the late 1980s and have since declined substantially in Washington and other areas of the U.S. west coast. We studied effects of experimental harvest on red sea urchins in San Juan Channel (SJC), a marine reserve in northern Washing-ton. We recorded changes in density and size distribution of sea urchin populations resulting from three levels of experimental harvest: 1) annual size-selective harvest (simulating cur-rent commercial urchin harvest regulations), 2) monthly complete (non–sizeselective) harvest, and 3) no harvest (control) sites. We also examined re-colonization rates of harvested sites. The red sea urchin population in SJC is composed of an accumulation of large, old individuals. Juvenile urchins represent less than 1% of the population. Lower and upper size limits for commercial harvest protect 5% and 45% of the population, respectively. Complete harvest reduced sea urchin densities by 95%. Annual size-selective harvest significantly decreased sea urchin densities by 67% in the first year and by 47% in the second year. Two years of size-selective harvest significantly altered the size distribution of urchins, decreasing the density of legal-size urchins. Recolonization of harvested sites varied seasonally and occurred primarily through immigration of adults. Selective harvest sites were recolonized to 51% and 38% of original densities, respectively, six months after the first and second annual harvests. Yields declined substantially in the second year of size-selective harvest because of the fishing down of the population and because of low recolonization rates of harvested sites. We recommend that managers consider the potential efficacy of marine harvest refuges and reevaluate the existing upper and lower size limits for commercial harvest to improve long-term management of the sea urchin fishery in Washington.
Manuscript accepted 28 March 2002. Fish. Bull. 100:662–673 (2002).
Effects of experimental harvest on red sea urchins (Strongylocentrotus franciscanus) in northern Washington
Sarah K. Carter Glenn R. VanBlaricom Washington Cooperative Fish and Wildlife Research UnitSchool of Aquatic and Fishery SciencesBox 355020University of WashingtonSeattle, Washington 98195-5020 Present address (for S. K. Carter): Wisconsin Department of Natural Resources
Bureau of Endangered Resources101 South Webster St.Madison, Wisconsin 53707-7921
E-mail address (for S. K. Carter): [email protected]
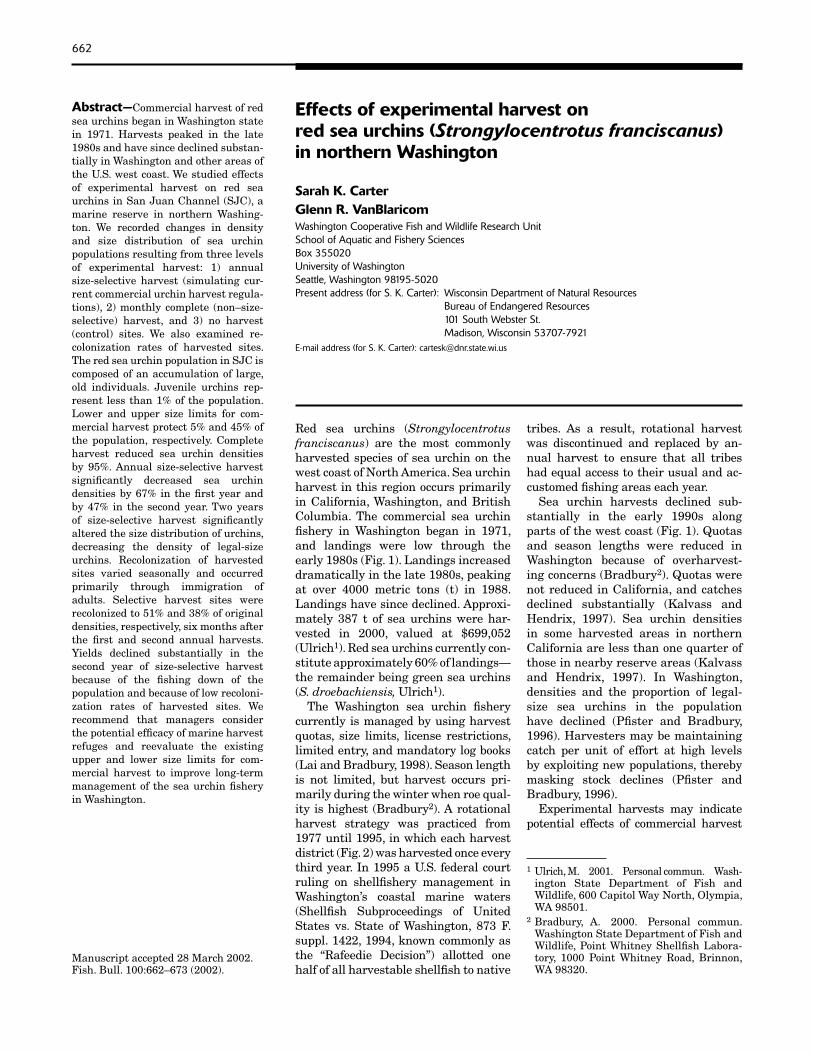
Red sea urchins (Strongylocentrotus tribes. As a result, rotational harvest franciscanus) are the most commonly was discontinued and replaced by an-harvested species of sea urchin on the nual harvest to ensure that all tribes west coast of North America. Sea urchin had equal access to their usual and acharvest in this region occurs primarily customed fishing areas each year. in California, Washington, and British Sea urchin harvests declined sub-Columbia. The commercial sea urchin stantially in the early 1990s along fishery in Washington began in 1971, parts of the west coast (Fig. 1). Quotas and landings were low through the and season lengths were reduced in early 1980s (Fig. 1). Landings increased Washington because of overharvest-dramatically in the late 1980s, peaking ing concerns (Bradbury2). Quotas were at over 4000 metric tons (t) in 1988. not reduced in California, and catches Landings have since declined. Approxi- declined substantially (Kalvass and mately 387 t of sea urchins were har- Hendrix, 1997). Sea urchin densities vested in 2000, valued at $699,052 in some harvested areas in northern (Ulrich1). Red sea urchins currently con- California are less than one quarter of stitute approximately 60% of landings— those in nearby reserve areas (Kalvass the remainder being green sea urchins and Hendrix, 1997). In Washington, (S. droebachiensis, Ulrich1). densities and the proportion of legal-
The Washington sea urchin fishery size sea urchins in the population currently is managed by using harvest have declined (Pfister and Bradbury, quotas, size limits, license restrictions, 1996). Harvesters may be maintaining limited entry, and mandatory log books catch per unit of effort at high levels (Lai and Bradbury, 1998). Season length by exploiting new populations, thereby is not limited, but harvest occurs pri- masking stock declines (Pfister and marily during the winter when roe qual- Bradbury, 1996). ity is highest (Bradbury2). A rotational Experimental harvests may indicate harvest strategy was practiced from potential effects of commercial harvest 1977 until 1995, in which each harvest district (Fig. 2) was harvested once every third year. In 1995 a U.S. federal court 1 Ulrich, M. 2001. Personal commun. Wash-ruling on shellfishery management in ington State Department of Fish and Washington’s coastal marine waters Wildlife, 600 Capitol Way North, Olympia,
(Shellfish Subproceedings of United WA 98501.
States vs. State of Washington, 873 F. 2 Bradbury, A. 2000. Personal commun.
Washington State Department of Fish andsuppl. 1422, 1994, known commonly as Wildlife, Point Whitney Shellfish Laborathe “Rafeedie Decision”) allotted one tory, 1000 Point Whitney Road, Brinnon, half of all harvestable shellfish to native WA 98320.
Carter and VanBlaricom: Effects of experimental harverst on Strongylocentrotus franciscanus in northern Washington 663
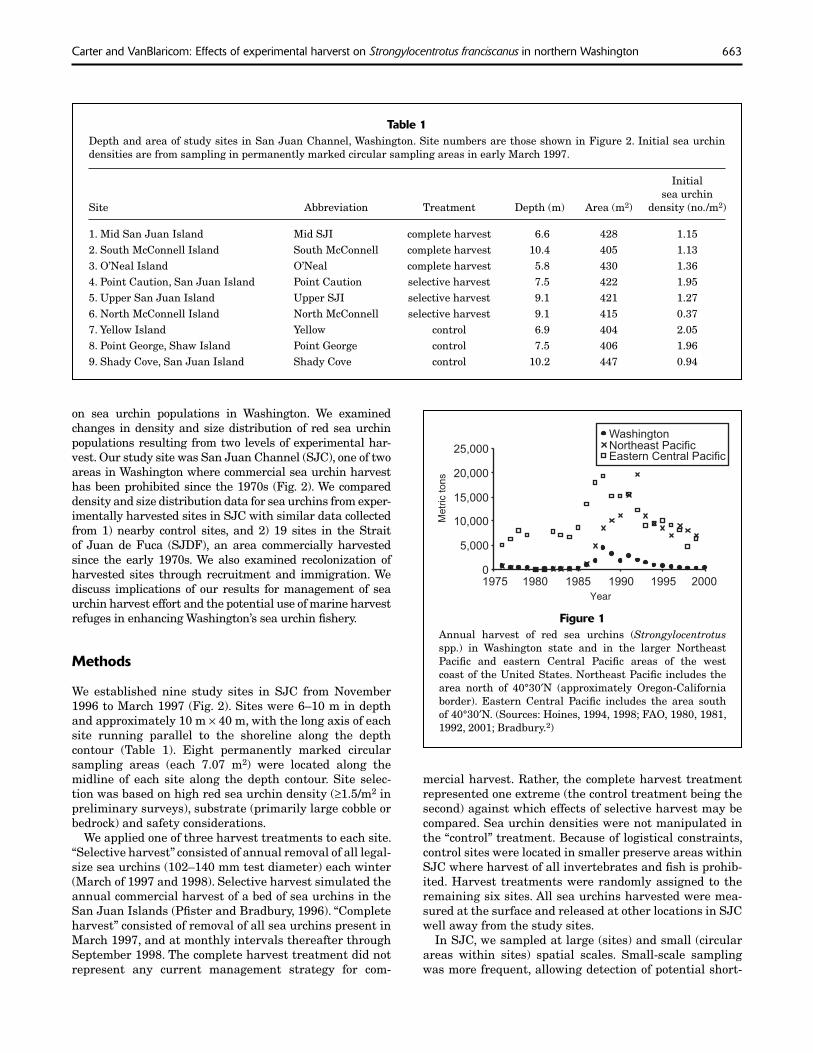
Table 1 Depth and area of study sites in San Juan Channel, Washington. Site numbers are those shown in Figure 2. Initial sea urchin densities are from sampling in permanently marked circular sampling areas in early March 1997.
Initial sea urchin
Site Abbreviation Treatment Depth (m) Area (m2) (no./m2)
1. Mid San Juan Island Mid SJI complete harvest 6.6 428 1.15 2. South McConnell Island South McConnell complete harvest 10.4 405 1.13 3. O’Neal Island O’Neal complete harvest 5.8 430 1.36 4. Point Caution, San Juan Island Point Caution selective harvest 7.5 422 1.95 5. Upper San Juan Island Upper SJI selective harvest 9.1 421 1.27 6. North McConnell Island North McConnell selective harvest 9.1 415 0.37 7. Yellow Island Yellow control 6.9 404 2.05 8. Point George, Shaw Island Point George control 7.5 406 1.96 9. Shady Cove, San Juan Island Shady Cove control 10.2 447 0.94
density
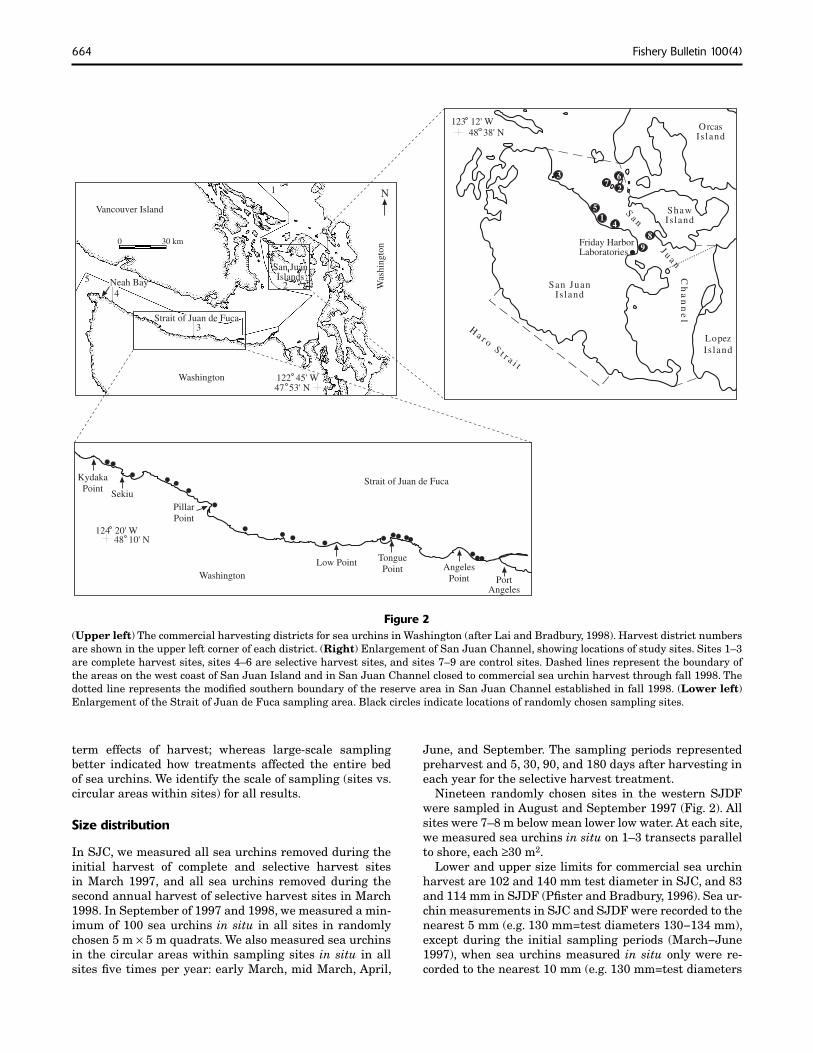
on sea urchin populations in Washington. We examined changes in density and size distribution of red sea urchin populations resulting from two levels of experimental harvest. Our study site was San Juan Channel (SJC), one of two areas in Washington where commercial sea urchin harvest has been prohibited since the 1970s (Fig. 2). We compared density and size distribution data for sea urchins from experimentally harvested sites in SJC with similar data collected from 1) nearby control sites, and 2) 19 sites in the Strait of Juan de Fuca (SJDF), an area commercially harvested since the early 1970s. We also examined recolonization of harvested sites through recruitment and immigration. We discuss implications of our results for management of sea urchin harvest effort and the potential use of marine harvest refuges in enhancing Washington’s sea urchin fishery.
Methods
We established nine study sites in SJC from November 1996 to March 1997 (Fig. 2). Sites were 6–10 m in depth and approximately 10 m × 40 m, with the long axis of each site running parallel to the shoreline along the depth contour (Table 1). Eight permanently marked circular sampling areas (each 7.07 m2) were located along the midline of each site along the depth contour. Site selection was based on high red sea urchin density (≥1.5/m2 in preliminary surveys), substrate (primarily large cobble or bedrock) and safety considerations.
We applied one of three harvest treatments to each site. “Selective harvest” consisted of annual removal of all legal-size sea urchins (102–140 mm test diameter) each winter (March of 1997 and 1998). Selective harvest simulated the annual commercial harvest of a bed of sea urchins in the San Juan Islands (Pfister and Bradbury, 1996). “Complete harvest” consisted of removal of all sea urchins present in March 1997, and at monthly intervals thereafter through September 1998. The complete harvest treatment did not represent any current management strategy for com-
0
5,000
10,000
15,000
20,000
25,000
1975 1980 1985 1990 1995 2000 Year
Washington Northeast Pacific Eastern Central Pacific
Met
ric to
ns
Figure 1 Annual harvest of red sea urchins (Strongylocentrotus spp.) in Washington state and in the larger Northeast Pacific and eastern Central Pacific areas of the west coast of the United States. Northeast Pacific includes the area north of 40°30′N (approximately Oregon-California border). Eastern Central Pacific includes the area south of 40°30′N. (Sources: Hoines, 1994, 1998; FAO, 1980, 1981, 1992, 2001; Bradbury.2)
mercial harvest. Rather, the complete harvest treatment represented one extreme (the control treatment being the second) against which effects of selective harvest may be compared. Sea urchin densities were not manipulated in the “control” treatment. Because of logistical constraints, control sites were located in smaller preserve areas within SJC where harvest of all invertebrates and fish is prohibited. Harvest treatments were randomly assigned to the remaining six sites. All sea urchins harvested were measured at the surface and released at other locations in SJC well away from the study sites.
In SJC, we sampled at large (sites) and small (circular areas within sites) spatial scales. Small-scale sampling was more frequent, allowing detection of potential short-
664 Fishery Bulletin 100(4)
Vancouver Island
0 30 km
Was
hing
ton
Washington
5
Neah Bay
San Juan Islands
Strait of Juan de Fuca
Strait of Juan de Fuca
Washington
48
8 9
1
Friday Harbor Laboratories
San Juan Is land
Lo pez Is land
Shaw Is land
O rcas Is land
Ha r o S t r a i t
C h a n n e l
J u a n
S a n4
27
3 6
48 123 W
Port Angeles
Sekiu
Kydaka Point
Pillar Point
Low Point Tongue Point Angeles
Point
124 W
5
4
3
2
1
47 122 W
N
10' N
38' N 12'
20'
53' N 45'
Figure 2 (Upper left) The commercial harvesting districts for sea urchins in Washington (after Lai and Bradbury, 1998). Harvest district numbers are shown in the upper left corner of each district. (Right) Enlargement of San Juan Channel, showing locations of study sites. Sites 1–3 are complete harvest sites, sites 4–6 are selective harvest sites, and sites 7–9 are control sites. Dashed lines represent the boundary of the areas on the west coast of San Juan Island and in San Juan Channel closed to commercial sea urchin harvest through fall 1998. The dotted line represents the modified southern boundary of the reserve area in San Juan Channel established in fall 1998. (Lower left) Enlargement of the Strait of Juan de Fuca sampling area. Black circles indicate locations of randomly chosen sampling sites.
term effects of harvest; whereas large-scale sampling better indicated how treatments affected the entire bed of sea urchins. We identify the scale of sampling (sites vs. circular areas within sites) for all results.
Size distribution
In SJC, we measured all sea urchins removed during the initial harvest of complete and selective harvest sites in March 1997, and all sea urchins removed during the second annual harvest of selective harvest sites in March 1998. In September of 1997 and 1998, we measured a minimum of 100 sea urchins in situ in all sites in randomly chosen 5 m × 5 m quadrats. We also measured sea urchins in the circular areas within sampling sites in situ in all sites five times per year: early March, mid March, April,
June, and September. The sampling periods represented preharvest and 5, 30, 90, and 180 days after harvesting in each year for the selective harvest treatment.
Nineteen randomly chosen sites in the western SJDF were sampled in August and September 1997 (Fig. 2). All sites were 7–8 m below mean lower low water. At each site, we measured sea urchins in situ on 1–3 transects parallel to shore, each ≥30 m2.
Lower and upper size limits for commercial sea urchin harvest are 102 and 140 mm test diameter in SJC, and 83 and 114 mm in SJDF (Pfister and Bradbury, 1996). Sea urchin measurements in SJC and SJDF were recorded to the nearest 5 mm (e.g. 130 mm=test diameters 130−134 mm), except during the initial sampling periods (March−June 1997), when sea urchins measured in situ only were re-corded to the nearest 10 mm (e.g. 130 mm=test diameters
Carter and VanBlaricom: Effects of experimental harverst on Strongylocentrotus franciscanus in northern Washington 665
130–139 mm). Because of the measurement increment used, we could only estimate proportions of under-, legal-, and over-size sea urchins in SJC and SJDF. Asterisks (*) indicate estimated size classes. Estimated size classes are as follows: SJC—under*-size: 0–95 mm, legal*-size: 100– 135 mm, and over*-size: 140–175 mm; SJDF—under*size: 0–80 mm, legal*-size: 85–110 mm, and over*-size: 115–175 mm. Sea urchins less than 50 mm are less than two years old and were classified as juveniles (see Pfister and Bradbury, 1996).
Harvest and recolonization
Recolonization was determined for three periods: summer 1997 (March 1997 [postharvest]−September 1997), winter 1997 (September 1997−March 1998 [preharvest]), and summer 1998 (March 1998 [postharvest]−September 1998). In complete harvest sites, monthly recolonization for each time period was calculated as the sum of the number of sea urchins removed each month from each site during the time period divided by the number of months in the time period. A few sea urchins that divers did not harvest in March 1997 because they could not safely be removed from the substrate were excluded from the calculation of recolonization for the first time period. Size of recolonizers was based on sea urchins harvested from May 1997 to September 1998. In selective harvest sites where sea urchins were removed only once each year, we calculated monthly recolonization for each time period as the difference between the number of sea urchins counted in each site at the beginning and end of the time period, divided by the number of months in the time period.
At the end of the study (September 1998), divers sampled destructively for juvenile sea urchins in one 0.80-m2
wedge within each circular area within a sampling site. Prior to this time, divers may not have seen very small sea urchins concealed underneath rocks or large sea urchins because sampling was not destructive to avoid disturbing other experiments. We include results on both red and green juvenile sea urchins sampled because of the very low number of red sea urchins sampled and to provide an indication of the microhabitats inhabited by juvenile sea urchins in general in SJC.
Data analysis
Size-frequency data were grouped into discrete size classes and compared by using chi-square analysis. Sea urchin data collected at each site were correlated over time. Therefore, we used a paired t-test to analyze the effect of harvest on the total number of sea urchins in sites and on the density of sea urchins in each size class. Similarly, we analyzed sea urchin densities in permanent circular areas over time by using repeated measures analysis of variance. In the analysis, site was treated as a random factor and was nested within treatment, which was treated as a fixed factor. Densities of juvenile sea urchins in September 1998 were analyzed by using analysis of variance. Sea urchin densities were log-transformed to improve the variance structure for analysis (Zar, 1984). Mean values
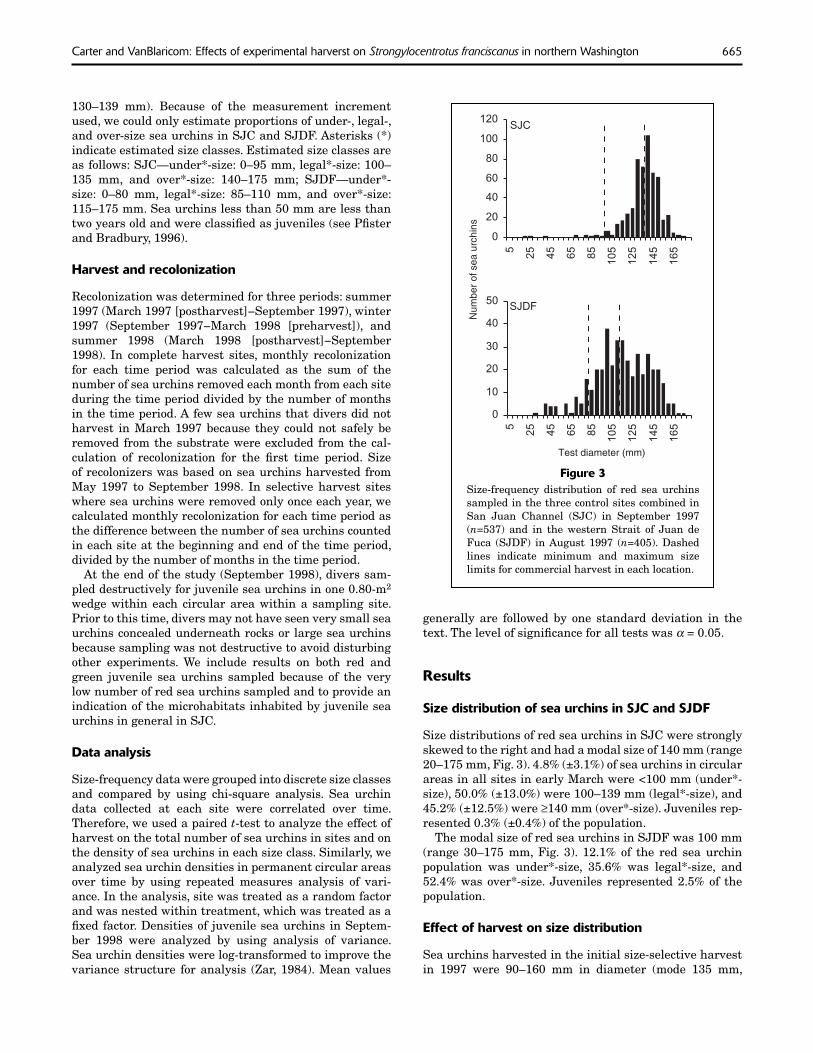
Figure 3 Size-frequency distribution of red sea urchins sampled in the three control sites combined in San Juan Channel (SJC) in September 1997 (n=537) and in the western Strait of Juan de Fuca (SJDF) in August 1997 (n=405). Dashed lines indicate minimum and maximum size limits for commercial harvest in each location.
0
20
40
60
80
100
120
5 25
45
65
85
105
125
145
165
0
10
20
30
40
50
5 25
45
65
85
105
125
145
165
Test diameter (mm)
Num
ber
of s
ea u
rchi
ns
SJC
SJDF
generally are followed by one standard deviation in the text. The level of significance for all tests was α = 0.05.
Results
Size distribution of sea urchins in SJC and SJDF
Size distributions of red sea urchins in SJC were strongly skewed to the right and had a modal size of 140 mm (range 20–175 mm, Fig. 3). 4.8% (±3.1%) of sea urchins in circular areas in all sites in early March were <100 mm (under*size), 50.0% (±13.0%) were 100–139 mm (legal*-size), and 45.2% (±12.5%) were ≥140 mm (over*-size). Juveniles represented 0.3% (±0.4%) of the population.
The modal size of red sea urchins in SJDF was 100 mm (range 30–175 mm, Fig. 3). 12.1% of the red sea urchin population was under*-size, 35.6% was legal*-size, and 52.4% was over*-size. Juveniles represented 2.5% of the population.
Effect of harvest on size distribution
Sea urchins harvested in the initial size-selective harvest in 1997 were 90–160 mm in diameter (mode 135 mm,
666 Fishery Bulletin 100(4)
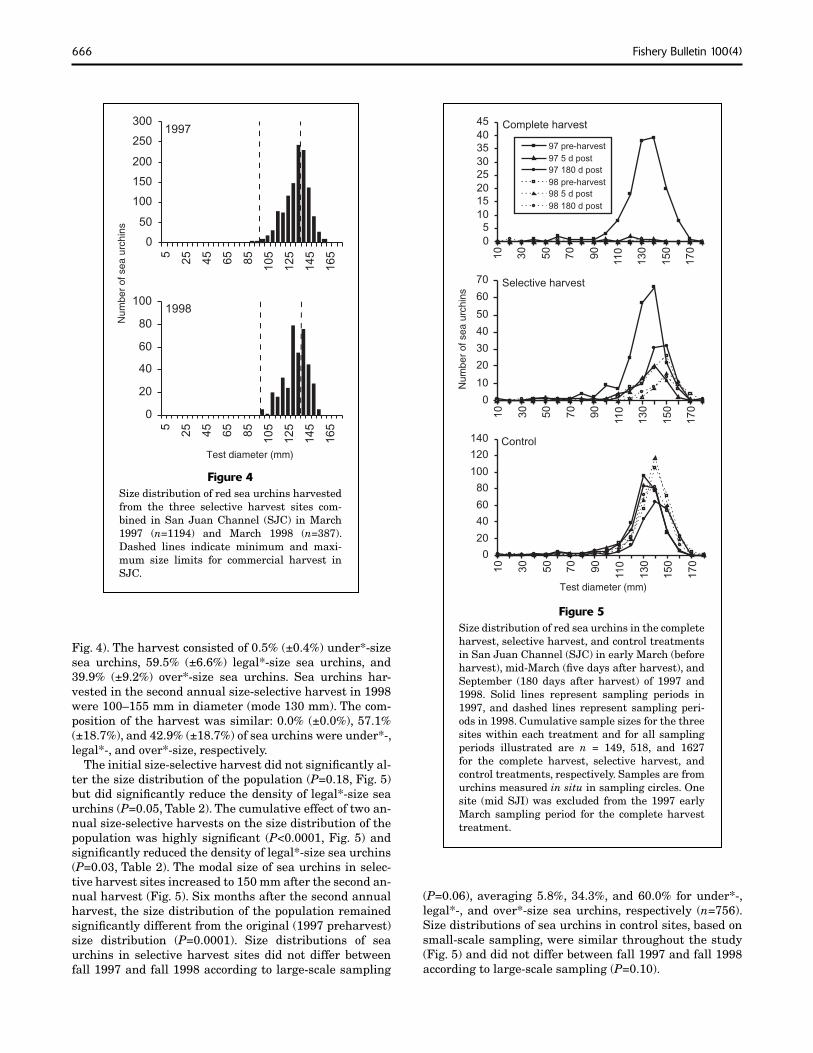
Figure 4Size distribution of red sea urchins harvested from the three selective harvest sites com-bined in San Juan Channel (SJC) in March 1997 (n=1194) and March 1998 (n=387). Dashed lines indicate minimum and maxi-mum size limits for commercial harvest in SJC.
0
50
100
150
200
250
300
5 25 45 65 85 105
125
145
165
1997
0
20
40
60
80
100
5 25 45 65 85 105
125
145
165
Test diameter (mm)
Num
ber
of s
ea u
rchi
ns
1998
Fig. 4). The harvest consisted of 0.5% (±0.4%) under*-size sea urchins, 59.5% (±6.6%) legal*-size sea urchins, and 39.9% (±9.2%) over*-size sea urchins. Sea urchins har-vested in the second annual size-selective harvest in 1998 were 100–155 mm in diameter (mode 130 mm). The com-position of the harvest was similar: 0.0% (±0.0%), 57.1% (±18.7%), and 42.9% (±18.7%) of sea urchins were under*-, legal*-, and over*-size, respectively.
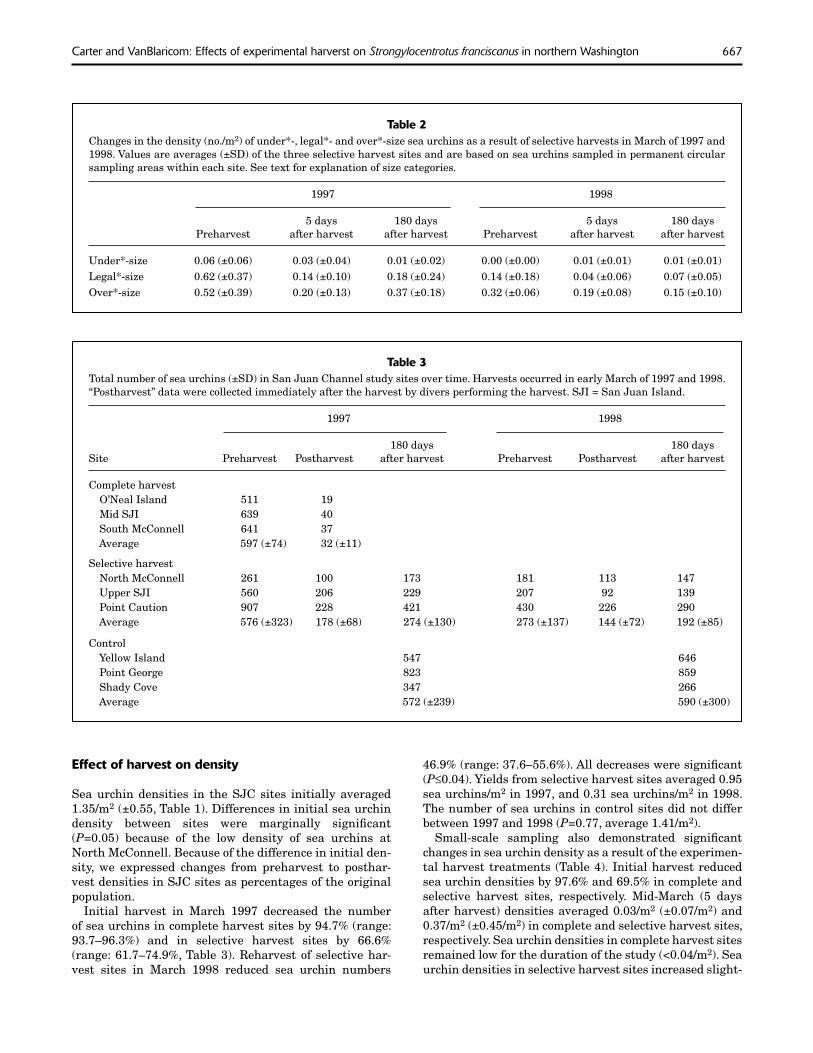
The initial size-selective harvest did not signifi cantly al-ter the size distribution of the population (P=0.18, Fig. 5) but did signifi cantly reduce the density of legal*-size sea urchins (P=0.05, Table 2). The cumulative effect of two an-nual size-selective harvests on the size distribution of the population was highly signifi cant (P<0.0001, Fig. 5) and signifi cantly reduced the density of legal*-size sea urchins (P=0.03, Table 2). The modal size of sea urchins in selec-tive harvest sites increased to 150 mm after the second an-nual harvest (Fig. 5). Six months after the second annual harvest, the size distribution of the population remained signifi cantly different from the original (1997 preharvest) size distribution (P=0.0001). Size distributions of sea urchins in selective harvest sites did not differ between fall 1997 and fall 1998 according to large-scale sampling
(P=0.06), averaging 5.8%, 34.3%, and 60.0% for under*-, legal*-, and over*-size sea urchins, respectively (n=756). Size distributions of sea urchins in control sites, based on small-scale sampling, were similar throughout the study (Fig. 5) and did not differ between fall 1997 and fall 1998 according to large-scale sampling (P=0.10).
05
1015202530354045
10 30 50 70 90 110
130
150
170
97 pre-harvest97 5 d post97 180 d post98 pre-harvest98 5 d post98 180 d post
Complete harvest
0
10
20
30
40
50
60
70
10 30 50 70 90 110
130
150
170
Num
ber
of s
ea u
rchi
ns
Selective harvest
Test diameter (mm)
0
20
40
60
80
100
120
140
10 30 50 70 90 110
130
150
170
Control
Figure 5Size distribution of red sea urchins in the complete harvest, selective harvest, and control treatments in San Juan Channel (SJC) in early March (before harvest), mid-March (fi ve days after harvest), and September (180 days after harvest) of 1997 and 1998. Solid lines represent sampling periods in 1997, and dashed lines represent sampling peri-ods in 1998. Cumulative sample sizes for the three sites within each treatment and for all sampling periods illustrated are n = 149, 518, and 1627 for the complete harvest, selective harvest, and control treatments, respectively. Samples are from urchins measured in situ in sampling circles. One site (mid SJI) was excluded from the 1997 early March sampling period for the complete harvest treatment.
Carter and VanBlaricom: Effects of experimental harverst on Strongylocentrotus franciscanus in northern Washington 667
Table 2 Changes in the density (no./m2) of under*-, legal*- and over*-size sea urchins as a result of selective harvests in March of 1997 and 1998. Values are averages (±SD) of the three selective harvest sites and are based on sea urchins sampled in permanent circular sampling areas within each site. See text for explanation of size categories.
1997
5 days 180 days 5 days 180 days Preharvest after harvest after harvest Preharvest after harvest after harvest
Under*-size 0.06 (±0.06) 0.03 (±0.04) 0.01 (±0.02) 0.00 (±0.00) 0.01 (±0.01) 0.01 (±0.01) Legal*-size 0.62 (±0.37) 0.14 (±0.10) 0.18 (±0.24) 0.14 (±0.18) 0.04 (±0.06) 0.07 (±0.05) Over*-size 0.52 (±0.39) 0.20 (±0.13) 0.37 (±0.18) 0.32 (±0.06) 0.19 (±0.08) 0.15 (±0.10)
Table 3 Total number of sea urchins (±SD) in San Juan Channel study sites over time. Harvests occurred in early March of 1997 and 1998. “Postharvest” data were collected immediately after the harvest by divers performing the harvest. SJI = San Juan Island.
1997
180 days 180 days Site Preharvest Postharvest after harvest Preharvest Postharvest after harvest
Complete harvest O’Neal Island 511 19 Mid SJI 639 40 South McConnell 641 37 Average 597 (±74) 32 (±11)
Selective harvest North McConnell 261 100 173 181 113 147 Upper SJI 560 206 229 207 92 139 Point Caution 907 228 421 430 226 290 Average 576 (±323) 178 (±68) 274 (±130) 273 (±137) 144 (±72) 192 (±85)
Control Yellow Island 547 646 Point George 823 859 Shady Cove 347 266 Average 572 (±239) 590 (±300)
1998
1998
Effect of harvest on density
Sea urchin densities in the SJC sites initially averaged 1.35/m2 (±0.55, Table 1). Differences in initial sea urchin density between sites were marginally significant (P=0.05) because of the low density of sea urchins at North McConnell. Because of the difference in initial density, we expressed changes from preharvest to postharvest densities in SJC sites as percentages of the original population.
Initial harvest in March 1997 decreased the number of sea urchins in complete harvest sites by 94.7% (range: 93.7–96.3%) and in selective harvest sites by 66.6% (range: 61.7–74.9%, Table 3). Reharvest of selective harvest sites in March 1998 reduced sea urchin numbers
46.9% (range: 37.6–55.6%). All decreases were significant (P≤0.04). Yields from selective harvest sites averaged 0.95 sea urchins/m2 in 1997, and 0.31 sea urchins/m2 in 1998. The number of sea urchins in control sites did not differ between 1997 and 1998 (P=0.77, average 1.41/m2).
Small-scale sampling also demonstrated significant changes in sea urchin density as a result of the experimental harvest treatments (Table 4). Initial harvest reduced sea urchin densities by 97.6% and 69.5% in complete and selective harvest sites, respectively. Mid-March (5 days after harvest) densities averaged 0.03/m2 (±0.07/m2) and 0.37/m2 (±0.45/m2) in complete and selective harvest sites, respectively. Sea urchin densities in complete harvest sites remained low for the duration of the study (<0.04/m2). Sea urchin densities in selective harvest sites increased slight-

668 Fishery Bulletin 100(4)
Table 4 Summary of repeated measure analysis of variance results for red sea urchin density. In cases where the degrees of freedom for the tests of significance for the within-subjects effects were adjusted by the Huynh-Feldt epsilon, the unadjusted degrees of freedom are given in parentheses. Asterisks in column five indicate factors significant at the 0.05 level. Power was estimated by using graphs in Zar (1984). (—) indicates that power was very low for the effect but could not be computed exactly (Sokal and Rohlf, 1995).
Degrees of Mean Observed Source square F-ratio P-value
Within-subjects effects Year 0.24 1.88 0.22 <0.20 Year × treatment 2 0.11 0.88 0.46 — Year × site (treatment) 6 0.13 Season 3.56 (4) 0.28 14.34 * 0.000 >0.99 Season × treatment 7.11 (8) 0.055 2.78 * 0.033 0.44 Season × site (treatment) 21.34 (24) 0.020 Year × season 3.72 (4) 0.12 9.42 * 0.000 0.98 Year × season × treatment 7.45 (8) 0.070 5.32 * 0.001 0.86 Year × season × site (treatment) 22.34 (24) 0.013
Between-subjects effects Intercept 22.11 214.92 0.000 1.00 Treatment 6.79 14.99 * 0.005 0.95 Site (treatment) 6 0.45
freedom power
1
1 2
Table 5 Monthly recolonization (no. of sea urchins/site) for complete and selective harvest sites from April 1997 through September 1998. The summer and winter time periods are April–September and October–March, respectively. SJI = San Juan Island.
Treatment Site Summer 1997 Winter 1997 Summer 1998
Complete harvest O’Neal Island 22.7 11.7 16.0 Mid SJI 29.5 13.8 34.2 South McConnell 16.3 4.7 6.3 Average 10.1 18.8
Selective harvest North McConnell 12.2 1.3 5.7 Upper SJI 3.8 3.7 7.8 Point Caution 32.2 1.5 10.7 Average 0.3 8.1
22.8
16.1
ly in the summer following each harvest (see next section). Sea urchin densities in control sites changed little over time, averaging 1.61/m2 (±1.4/m2) over the study period.
Recolonization of harvested sites
Recolonization of complete harvest sites averaged 17.2 sea urchins per month (range: 0–68), or 0.04/m2.month. The average size of sea urchins recolonizing complete harvest sites was 129 mm (±19 mm, range: 35–175 mm, n=824). Recolonization of complete harvest sites was higher during the summer of each year than during the winter and decreased slightly but not significantly over time (P=0.31, Table 5).
Recolonization of selective harvest sites was lower than observed in complete harvest sites (average 7.9 sea urchins/month or 0.02/m2.month, Table 5). Recolonization was highest during summer 1997, followed by summer 1998. There was no net recolonization during winter 1997. Sites were recolonized to 51.2% of original densities by September 1997 (range: 40.9−66.3%, Table 3). In September 1998, after two annual harvests, sites averaged 37.7% of original densities (range: 24.8−56.3%).
Juvenile recruitment
Juvenile sea urchins were rare in all SJC study sites in March 1997 (0.4% (±0.6%) of sea urchins sampled in

Carter and VanBlaricom: Effects of experimental harverst on Strongylocentrotus franciscanus in northern Washington 669
Table 6 Modal size and proportion of juveniles in red sea urchin populations along the west coast of North America.
Location Modal size (mm) % of juveniles Source
Southeast Alaska, shallow habitats 100−120 ~35% <60 mm Carney, 1991
Southeast Alaska, deep habitats 140−160 ~8% <60 mm Carney, 1991
Vancouver Island, BC 100−120 <5% <30 mm, ~50% <100 mm Watson, 1993
Vancouver Island, BC 100−150* ~7% <50 mm* Breen et al., 1978
Vancouver Island, BC 80−150* 0−11% <50 mm* Breen et al., 1976
Strait of Georgia, BC 100−139* 9.5% <50 mm* Sloan et al., 1987
San Juan Channel, Washington 140−144 0.3% <50 mm, 4.8% < 100 mm This study
Strait of Juan de Fuca, Washington 100−104 2.5% <50 mm, 24.7% <100 mm This study
Northern California ~107 ~8−12% <50 mm Rogers-Bennett et al., 1995; Smith et al., 1998
San Nicolas Island, Southern California 100−120 ~7% < 50 mm Cowen, 1983
Southern California 25 and 110 39% < 30 mm Tegner and Dayton, 1981
* Commercially harvested populations.
circular areas). Over the entire study period, juvenile red sea urchin densities in circular areas averaged 0.005/m2
in control sites (0.6% of the population), 0.001/m2 in selective harvest sites (0.9% of the population), and 0.0006/m2
in complete harvest sites. Sampling at the larger spatial scale revealed similar results. Juvenile sea urchin density averaged 0.002/m2 in control sites in September of both 1997 and 1998. Juvenile sea urchin density averaged 0.001/m2 and 0.005/m2 in selective harvest sites in September of 1997 and 1998, respectively.
Invasive sampling in September 1998 confirmed that juvenile sea urchins were rare in SJC sites during the study. One juvenile (13 mm) red sea urchin and 45 juvenile (2–12 mm) green sea urchins were found in a search of 6.4 m2 of substrate in each site (57.6 m2 total). Density of juvenile green sea urchins sampled did not differ between treatments (P=0.79; average 0.79/m2 [±0.86]). Only 4.3% of the juvenile green sea urchins were associated with (found within 8 cm of) an adult red sea urchin. 26.7% of juvenile green sea urchins were found in cryptic microhabitats (algal holdfasts), and the remainder were found on algal blades or on top of cobble, boulders, or bedrock.
Discussion
Size distribution of sea urchins in SJC and SJDF
The modal size of sea urchins in SJC is larger than observed in most other locations on the west coast (Table 6). The size distribution of red sea urchins in SJC sites is strongly skewed toward large individuals. The slow growth rate of sea urchins in Washington (Lai and Brad-bury, 1998), combined with the fact that SJC was, at the time of our study, a reserve area that has never been subject to significant harvest, indicates that the sea urchin
population in SJC is composed primarily of older individuals. Fewer juveniles are present in SJC and SJDF than in most other areas on the west coast (Table 6). Large recruitment events appear to be rare for red sea urchins in SJC, evidenced by the lack of peaks in the size distribution at small test diameters.
Effect of harvest on size distribution
The first annual size-selective harvest only slightly affected the size distribution of sea urchins in SJC. The cumulative effect of two annual size-selective harvests was significant, however, significantly reducing the density of legal*-size sea urchins in the population and in-creasing the modal size of the population. Commercial fisheries elsewhere along the west coast have also affected the size distribution of sea urchin populations. Three commercial harvests in the San Juan Islands (outside the SJC reserve) over a nine-year period decreased the proportion of legal-size sea urchins by about 73% (Pfister and Brad-bury, 1996). In southern California, two years of harvest reduced the proportion of legal-size sea urchins in shallow waters by 15% (Tegner and Dayton, 1981). In northern California, the modal size of sea urchins in unharvested reserve sites was 108 mm, whereas the modal size of sea urchins in nearby heavily harvested sites with a 76-mm minimum size limit was 73 mm (Smith et al., 1998). On the east coast of Vancouver Island, however, the modal size of sea urchins remained above the legal size limit after 3+ years of significant harvest (Sloan et al., 1987).
The modal size of the sea urchin population and the upper size limit for legal harvest coincided in SJC. Small errors in the measurement of sea urchins by divers led to an incomplete harvest of legal-size sea urchins and inadvertent “poaching” of many over-size sea urchins (41% of the catch, likely a slight overestimate because sea urchins
670 Fishery Bulletin 100(4)
140 mm in diameter were incorrectly classified as over-size). Both actions would tend to minimize effects of our experimental size-selective harvest. Commercial harvesters take a much smaller proportion of over-size sea urchins (11.2% of catch) and harvest a higher proportion of legal-size sea urchins (Pfister and Bradbury, 1996). Thus commercial harvest should produce larger differences in size distribution than observed in our study.
Effect of harvest on sea urchin density
Commercial harvest in nonreserve habitats of the San Juan Islands for over two decades has significantly de-creased sea urchin densities (Pfister and Bradbury, 1996). Both harvest treatments in our study reduced sea urchin densities dramatically and immediately, as expected. The accumulation of older larger individuals in the SJC population led to high yields in selective harvest sites in 1997. Yields in selective harvest sites declined by more than two thirds in 1998 owing to the fishing down of the population (Hilborn and Walters, 1992), low immigration of legal-size sea urchins, and the presence of few under-size sea urchins in the population with a potential of growing to legal size.
Recolonization of harvested sites
Recolonization of harvested sites occurred primarily by immigration of adult red sea urchins. Recolonization began within one month of harvest and continued for the next 18 months. In northern California sites at 11 m in depth, red sea urchins also immigrated into harvested sites within a short time period (Rogers-Bennett et al., 1998). Complete and selective harvest sites in California were recolonized to 32% and 86% of their original densities, respectively, within nine days. These recolonization rates are much higher than those observed in SJC, possibly because of high sea urchin movement (up to 10 m/h, Rogers-Bennett et al., 1995, 1998) and smaller study plots (64 m2 per site) in the northern California location. Sea urchins move less (~1 m/day) in areas with abundant food, such as in SJC, than in areas with little food (Mattison et al., 1977; Carney, 1991).
Seasonally high recolonization rates observed each spring in both harvest treatments may be related to feeding activity. Spring and summer are seasons when sea urchins feed more frequently (Vadas, 1968) and densities of algae preferred by sea urchins in SJC (e.g. Laminaria, Nereocystis, Alaria, and Costaria; Vadas, 1968, 1977) are highest (Carter, 1999). Both factors may have stimulated movement of sea urchins from deeper waters (with lower algal densities) into our sites.
On a monthly basis, selective harvest sites were re-colonized at about half the rate at which complete harvest sites were recolonized. Sea urchins recolonizing complete harvest sites were removed monthly, whereas those recolonizing selective harvest sites were not. The presence of sea urchins, however, did not inhibit immigration in another study (Watson, 1993). Differences in sea urchin densities in adjacent habitats or food availability may have contrib
uted to the observed differences in recolonization rates both within and between treatments.
Recolonization of selective harvest sites was insufficient to maintain sea urchin populations at the densities and size distributions observed prior to harvest under an annual harvest scenario. A site in Washington was recolonized to preharvest density and size distribution after 2.5 years (Bradbury, 1991). Recolonization of SJC sites varied substantially in the first year following harvest (range 1−202 sea urchins per site). One year, after harvest, sites varied between 37% and 69% of their original densities. Such variability in recolonization between sites may be common and should be considered when estimating re-colonization rates for commercially harvested areas.
Recolonization rates observed in this study should be considered maximum estimates for recolonization of commercially harvested areas. SJC study sites were small, and sea urchins were relatively abundant adjacent to sites. Commercial fishermen harvest entire beds of sea urchins before moving on to the next bed and prefer to harvest at shallow depths (Pfister and Bradbury, 1996; Kalvass and Hendrix, 1997; Bradbury2). Thus sea urchins in adjoining habitats at the same depth would likely be harvested, and only sea urchins inhabiting deeper waters would be available for recolonization.
Juvenile recruitment
The unimodal size distribution of red sea urchins and the rarity of juvenile red sea urchins in SJC suggest variable and infrequent red sea urchin recruitment in northern Washing-ton. In central California, red sea urchin recruitment was also rare; no major recruitment events occurred during a ten-year period (Pearse and Hines, 1987). Size structures of other sea urchin populations north of Point Conception also suggest low red sea urchin recruitment (Table 6).
Commercial harvest may negatively affect juvenile recruitment in several ways. Commercial harvest decreases sea urchin densities in northern Washington (Pfister and Bradbury, 1996; our study), potentially decreasing fertilization rates and larval supply (Levitan et al., 1992). A reduction in adult sea urchin density might also negatively affect juveniles in benthic habitats because adult sea urchins may provide associated juveniles with protection from predators (Duggins, 1981; Breen et al., 1985) and provide an increased food source (Tegner and Dayton, 1977, but see Andrew and Choat, 1985). In southern and northern California, 81% and 73%, respectively, of juvenile red sea urchins were found under the spine canopy of adults (Tegner and Dayton, 1977; Rogers-Bennett et al., 1995). In southern California, juvenile sea urchins were less abundant in harvested sites than in control sites (Tegner and Dayton, 1977). In northern California, juvenile red sea urchins were rare or absent in completely harvested sites but were present in similar numbers in selectively harvested and control sites (Rogers-Bennett et al., 1998). In British Columbia, 69% of juvenile red sea urchins were associated with adults (Breen et al., 1985). Adults may be less important to juveniles in SJC than in other west coast areas because few (4.3%) juvenile green
Carter and VanBlaricom: Effects of experimental harverst on Strongylocentrotus franciscanus in northern Washington 671
sea urchins were found to be associated with adult red sea urchins (our study), juvenile abundance did not differ by harvest treatment (our study), refuge habitats (cobble, crevices, kelp holdfasts) are abundant, and fast moving sea urchin predators (e.g. fish, lobster) are rare or absent (Breen et al., 1985; Sloan et al., 1987).
Management implications
The current harvest strategy in Washington, applied to sea urchin beds in SJC, results in low yields in the second year of harvest owing to the fishing down of the population and slow recolonization of harvested areas. Annual commercial harvest of a single location is probably not economically viable. Commercial harvests in Washington and other areas of the west coast are well below levels observed in the late 1980s, and biomass estimates are not available to evaluate the status of stocks in Washington (Bradbury2). In such circumstances, options for managing the fishery to conserve, and possibly increase, stocks over the long term include artificially enhancing stocks, redirecting or reducing harvest, and establishing marine harvest refuges (Tegner, 1989; Quinn et al., 1993; Rogers-Bennett et al., 1995). Stock enhancement efforts often confer limited success (e.g. Tegner, 1989) and may negatively impact behavioral and genetic diversity of wild populations (Rogers-Bennett, 1997).
Sea urchin harvest in Washington is currently controlled by using harvest quotas, limited entry, and size limits; seasonal closures and rotational harvests were also employed until relatively recently (Pfister and Bradbury, 1996; Lai and Bradbury, 1998). Washington also has two marine harvest refuges (Fig. 2). Both rotational harvests and marine harvest refuges increase the probability of long-term survivorship of populations, particularly when recruitment is low and variable, as it appears to be in SJC (Botsford et al., 1993; Quinn et al., 1993; Pfister and Bradbury, 1996). Rotational harvests were discontinued in Washington in 1995, and the size of one of the two marine harvest refuges was reduced substantially in 1998 (Fig. 2). Additional marine harvest refuges in Washington might be established in areas difficult for harvesters to access (e.g. areas hazardous to navigation and far from port) with little decrease in the actual size of harvested areas (Starr, 1998). Critical to the effectiveness of marine harvest refuges in enhancing recruitment and fishery yields outside of refuge areas is the ability of larvae produced in refuges to recruit to areas outside of the refuge (Carr and Reed, 1992). The extended period that sea urchin larvae spend in the plankton (9−19 weeks, Strathmann, 1978) and the short residence time of water in SJC (Thomson, 1981; Hickey et al., 1991) suggest that larval dispersal from this and other refuge areas to areas outside of the refuge is highly likely, probably occurring on a scale of tens to hundreds of kilometers. Research on sea urchin recruitment patterns (including larval dispersal, settlement, and juvenile survival) in this region is needed to assess the potential for marine harvest refuges in Washington to con-tribute to recruitment of fished stocks in Washington.
The current size limits in SJC protect a substantially smaller proportion of the population than in SJDF (50%
vs. 63%, respectively). Because there are very few small sea urchins in SJC, the lower size limit protects less than 5% of the population. The upper size limit, established to protect larger “broodstock,” currently protects 45% of the population. Size limits in Washington were originally established to protect the lower and upper 20% of the population and to allow some individuals to grow through the legal-size “window” under a three-year rotational harvest policy (Pfister and Bradbury, 1996). Considering the small number of juveniles in the population and the return to an annual harvest in 1995, the existing size limits should be reevaluated for their efficacy at protecting local stocks in the context of other harvest control techniques.
Acknowledgments
This work was conducted as part of the requirements for a Master of Science degree for S. K. Carter in the School of Fisheries (now the School of Aquatic and Fishery Sciences) at the University of Washington. David Duggins, Terrie Klinger, Chris Foote, and Ken Chew provided helpful suggestions and guidance on many aspects of the project. Brian Allen cheerfully provided many hours of expert assistance with diving work. Sam Sublett, Martin Grassley, and many others also assisted with data collection. Dennis Willows and the staff and faculty at Friday Harbor Laboratories provided logistical support and use of the facilities and equipment. David Duggins and Terrie Klinger provided helpful comments on earlier versions of the manuscript. Funding for the project was provided by the U.S. Geological Survey-Biological Resources Division, the Washington Department of Fish and Wildlife, the North Pacific Universities Marine Mammal Research Consortium, the Washington Cooperative Fish and Wildlife Research Unit, the H. Mason Keeler Endowment for Excellence, the Egtvedt Endowment Scholarship, the John N. Cobb Scholarship, and the School of Fisheries, University of Washington. We offer sincere thanks to all.
Literature cited
Andrew, N. L., and J. H. Choat. 1985. Habitat related differences in the survivorship and
growth of juvenile sea urchins. Mar. Ecol. Prog. Ser. 27: 155–161.
Botsford, L. W., J. F. Quinn, S. R. Wing and J. G. Brittnacher. 1993. Rotating spatial harvest of a benthic invertebrate,
the red sea urchin, Strongylocentrotus franciscanus. In Proceedings of the international symposium on management strategies for exploited fish populations, p. 409−428. Alaska Sea Grant College Program AK-SC-93-02.
Bradbury, A. 1991. Management and stock assessment of the red sea
urchin (Strongylocentrotus franciscanus) in Washington state: periodic rotation of the fishing grounds. J. Shellfish Res. 10(1):233.
Breen, P. A., B. E. Adkins, and D. C. Miller. 1978. Recovery rate in three exploited sea urchin popula-
672 Fishery Bulletin 100(4)
tions from 1972 to 1977. Fish. Mar. Serv. Manuscr. Rep. 1446:1–27.
Breen, P. A., W. Carolsfeld, and K. L. Yamanaka. 1985. Social behaviour of juvenile red sea urchins, Strongy
locentrotus franciscanus (Agassiz). J. Exp. Mar. Biol. Ecol. 92:45–61.
Breen, P. A., D. C. Miller and B. E. Adkins. 1976. An examination of harvested sea urchin populations
in the Tofino area. Fish. Res. Board Can. Manuscr. Rep. Ser. 1401:1–23.
Carney, D. 1991. A comparison of densities, size distribution, gonad
and total-gut indices, and relative movements, of red sea urchins (Strongylocentrotus franciscanus), in two depth regimes. M.S. thesis, 37 p. Univ. California, Santa Cruz, CA.
Carr, M. H., and D. C. Reed. 1992. Conceptual issues relevant to marine harvest ref
uges: examples from temperate reef fishes. Can. J. Fish. Aquat. Sci. 50:2019–2028.
Carter, S. K. 1999. Ecosystem effects of simulated sea otter predation
and commercial sea urchin harvest on nearshore benthic communities in northern Washington. M.S. thesis, 302 p. Univ. Washington, Seattle, WA,
Cowen, R. K. 1983. The effect of sheephead (Semicossyphus pulcher)
predation on red sea urchin (Strongylocentrotus franciscanus) populations: an experimental analysis. Oecologia 58:249–255.
Duggins, D. O. 1981. Interspecific facilitation in a guild of benthic marine
herbivores. Oecologia 48:157–163. FAO (Food and Agriculture Organization of the United Nations).
1980. Yearbook of fishery statistics, catches and landings. 1979. Vol. 48. FAO Fish. Ser. 13, 384 p. FAO, Rome.
1981. Yearbook of fishery statistics, catches and landings. 1978. Vol. 50. FAO Fish. Ser. 16, 386 p. FAO, Rome.
1992. FAO yearbook, fishery statistics, catches and landings. 1990. Vol. 70. FAO Fish. Ser. 38, 646 p. FAO, Rome.
2001. FAO yearbook, fishery statistics, capture production. 1999. Vol. 88/1. FAO Fish. Ser. 57, 752 p. FAO, Rome.
Hickey, B. M., R. E. Thomson, H. Yih, and P. H. LeBlond. 1991. Velocity and temperature fluctuations in a buoyancy-
driven current off Vancouver Island. J. Geophys. Res. 96(C6):10507–10538.
Hilborn, R., and C .J. Walters. 1992. Quantitative fisheries stock assessment: choice,
dynamics and uncertainty, 570 p. Chapman and Hall, New York, NY.
Hoines, L. 1994. 1991 fisheries statistical report, 80 p. Washington
State Department of Fish and Wildlife, Olympia, WA. 1998. 1995 fisheries statistical report, 80 p. Washington
State Department of Fish and Wildlife, Olympia, WA. Kalvass, P. E., and J. M. Hendrix.
1997. The California red sea urchin, Strongylocentrotus franciscanus, fishery: catch, effort, and management trends. Mar. Fish. Rev. 59(2):1–17.
Lai, H. L., and A. Bradbury. 1998. A modified catch-at-size analysis model for a red sea
urchin (Strongylocentrotus franciscanus) population. In Proceedings of the North Pacific symposium on invertebrate stock assessment and management (G. S. Jamieson and A. Campbell, eds.), p. 85–96. Can. Spec. Publ. Fish. Aquat. Sci. 125.
Levitan, D. R., M. A. Sewell and F. S. Chia. 1992. How distribution and abundance influence fertili
zation success in the sea urchin Strongylocentrotus franciscanus. Ecology 73:248–254.
Mattison, J. E., J. D. Trent, A. L. Shanks, T. B. Akin, and J. S. Pearse.
1977. Movement and feeding activity of red sea urchins (Strongylocentrotus franciscanus) adjacent to a kelp forest. Mar. Biol. 39:25–30.
Pearse, J. S., and A. H. Hines. 1987. Long-term population dynamics of sea urchins in a
central California kelp forest: rare recruitment and rapid decline. Mar. Ecol. Prog. Ser. 39:275–283.
Pfister, C. A., and A. Bradbury. 1996. Harvesting red sea urchins: recent effects and future
predictions. Ecol. Appl. 6:298–310. Quinn, J. F., S. R. Wing, and L. W. Botsford.
1993. Harvest refugia in marine invertebrate fisheries: models and applications to the red sea urchin, Strongylocentrotus franciscanus. Am. Zool. 33:537–550.
Rogers-Bennett, L. 1997. Marine protected areas and the red sea urchin fishery.
In California and the world ocean ’97, proceedings of the conference; March 24–27, 1997, p. 412–423. American Society of Civil Engineers, San Diego, CA.
Rogers-Bennett, L., W. A. Bennett, H. C. Fastenau, and C. M. Dewees.
1995. Spatial variation in red sea urchin reproduction and morphology: implications for harvest refugia. Ecol. Appl. 5:1171–1180.
Rogers-Bennett, L., H. C. Fastenau, and C. M. Dewees. 1998. Recovery of red sea urchin beds following experimen
tal harvest. In Echinoderms: San Francisco, Proceedings of the ninth international echinoderm conference, San Francisco, CA, August 5–9, 1996 (R. Mooi and M. Telford, eds.), p. 805–809. A.A. Balkema, Rotterdam, and Brook-field, VE.
Sloan, N. A., C. P. Lauridsen, and R. M. Harbo. 1987. Recruitment characteristics of the commercially har
vested red sea urchin Strongylocentrotus franciscanus in southern British Columbia, Canada. Fish. Res. 5:55–69.
Smith, B. D., L. W. Botsford and S. R. Wing. 1998. Estimation of growth and mortality parameters
from size frequency distributions lacking age patterns: the red sea urchin (Strongylocentrotus franciscanus) as an example. Can. J. Fish. Aquat. Sci. 55:1236–1247.
Sokal, R. R., and F. J. Rohlf. 1995. Biometry: the principles and practice of statistics in
biological research, 887 p. W.H. Freeman and Company, New York, NY.
Starr, R. M. 1998. Design principles for rockfish reserves on the U.S.
west coast. In Marine harvest refugia for west coast rock-fish: a workshop (M. Yoklavich, ed.), p. 50–63. U.S. Dep. Commer., NOAA-TM-NMFS-SWFSC 255.
Strathmann, R. 1978. Length of pelagic period in echinoderms with feeding
larvae from the northeast Pacific. J. Exp. Mar. Biol. Ecol. 34:23–27.
Tegner, M. J. 1989. The feasibility of enhancing red sea urchin, Strongy
locentrotus franciscanus, stocks in California: an analysis of the options. Mar. Fish. Rev. 51(2):1–22.
Tegner, M. J., and P. K. Dayton. 1977. Sea urchin recruitment patterns and implications of
commercial fishing. Science 196:324–326.
Carter and VanBlaricom: Effects of experimental harverst on Strongylocentrotus franciscanus in northern Washington 673
1981. Population structure, recruitment and mortality of two sea urchins (Strongylocentrotus franciscanus and S. purpuratus) in a kelp forest. Mar. Ecol. Prog. Ser. 5: 255–268.
Thomson, R. E. 1981. Oceanography of the British Columbia coast. Can.
Spec. Publ. Fish. Aquat. Sci. 56, 291 p. Vadas, R. L.
1968. The ecology of Agarum and the kelp bed community. Ph.D. diss., 280 p. Univ. Washington, Seattle, WA.
1977. Preferential feeding: an optimization strategy in sea urchins. Ecol. Monogr. 47:337–371.
Watson, J. C. 1993. The effects of sea otter (Enhydra lutris) foraging on
shallow rocky communities off northwestern Vancouver Island, British Columbia. Ph.D. diss., 169 p. Univ. California, Santa Cruz, CA.
Zar, J. H. 1984. Biostatistical analysis, second edition, 718 p. Pren
tice Hall, Englewood Cliffs, NJ.