abstract document: noninvasive optical imaging techniques as a
TRANSCRIPT


ii
Acknowledgements
I am extremely grateful to both of my advisors, Yang Tao at the University of
Maryland (UMD) and Amir Gandjbakhche at the National Institutes of Health (NIH),
for seeing my research potential and pushing me to attempt and complete my PhD
degree. Without their motivation and guidance, I would never have earned my
master’s or PhD degrees. Working at the NIH to conduct my research allowed me to
collaborate on this project with many intelligent scientists, including Robert
Yarchoan of the National Cancer Institute, Randall Pursley of the Center for
Information Technology, Stavros Demos of the Lawrence Livermore National
Laboratory, and Tiziano Binzoni of the University of Geneva in Switzerland. I would
also like to thank Karen Aleman and Kathleen Wyvill, who scheduled the weekly
patient visits and collected the clinical examination data.
I want to express my appreciation to all of the members of my laboratory at
the NIH for their constant suggestions and contributions to this work, including
Franck Amyot, Victor Chernomordik, Israel Gannot, Moinuddin Hassan, David
Hattery, Jason Riley, and Alex Small. I also want to thank the other members of my
laboratory at UMD, including Xin Chen, Lu Jiang, Fenghua Jin, Hansong Jing, Lei
Qin, Angela Vargas, and Bin Zhu, for their endless advice and friendship. I would
also like to thank my other committee members, Adel Shirmohammadi, Nam Sun
Wang, and Fredrick Wheaton, who have known me for several years now (Dr.
Shirmohammadi and Dr. Wheaton since I joined the Department of Biological
Resources Engineering after the fall of 1998 as an undergraduate) and have never
wavered in their support of me.

iii
Finally, I would like to extend my deepest gratitude to my parents, who have
always believed in me and knew I could accomplish the goal of being the first PhD in
my family. And to Jeff, who started dating me just one week after I decided to pursue
my PhD, thanks for understanding how important earning this PhD was to me and for
supporting me, even when the light at the end of the tunnel was dim and I thought I’d
never graduate.

iv
Table of Contents Acknowledgements ....................................................................................................... ii Table of Contents ......................................................................................................... iv List of Tables ............................................................................................................... vi List of Figures ............................................................................................................. vii List of Symbols ............................................................................................................ xi List of Abbreviations ................................................................................................. xiii Chapter 1: Overall Introduction .................................................................................... 1 Chapter 2: Overall Objectives ....................................................................................... 3 Chapter 3: Review of Literature ................................................................................... 5
3.1 Skin Structure...................................................................................................... 5 3.1.1 Epidermis ..................................................................................................... 6 3.1.2 Dermis .......................................................................................................... 9
3.2 Kaposi’s Sarcoma ............................................................................................ 11 3.3 Thermography ................................................................................................... 12
3.3.1 Thermal Energy ......................................................................................... 12 3.3.2 Thermal Camera ......................................................................................... 13 3.3.3 Thermal Images ......................................................................................... 14
3.4 Laser Doppler Imaging ..................................................................................... 15 3.5 Reflectance Spectroscopy ................................................................................. 16
3.5.1 Measuring Tissue Oxygenation ................................................................. 18 3.5.2 Measuring Tissue Blood Volume .............................................................. 20 3.5.3 Measuring Tissue Moisture ........................................................................ 21
3.6 Mathematical Optical Skin Models .................................................................. 22 3.7 Absorption and Scattering................................................................................. 24 3.8 Modeling the Epidermis .................................................................................... 28
3.8.1 Melanin ...................................................................................................... 28 3.8.2 Baseline Skin ............................................................................................. 32
3.9 Modeling the Dermis ........................................................................................ 33 Chapter 4: Quantitative Assessment of Tumor Vasculature and Response to Therapy in Kaposi’s Sarcoma Using Functional Noninvasive Imaging ................................... 36
4.1 Introduction ....................................................................................................... 36 4.2 Materials and Methods ...................................................................................... 37
4.2.1 Individuals With Kaposi’s Sarcoma .......................................................... 37 4.2.2 Experimental Therapy and Clinical Assessment ....................................... 37 4.2.3 Thermography and Laser Doppler Imaging ............................................... 38
4.3 Results and Discussion ..................................................................................... 41 4.3.1 Results ........................................................................................................ 41 4.3.2 Discussion .................................................................................................. 46
4.4 Conclusions ....................................................................................................... 50 Chapter 5: Using Noninvasive Multi-Spectral Imaging to Quantitatively Assess Tissue Vasculature ...................................................................................................... 51
5.1 Introduction ....................................................................................................... 51

v
5.2 Materials and Methods ...................................................................................... 51 5.2.1 Instrumentation .......................................................................................... 51 5.2.2 Calibration and Curvature Correction ........................................................ 54 5.2.3 Mathematical Optical Skin Model ............................................................. 57
5.2.3.1 Epidermis Layer .................................................................................. 58 5.2.3.2 Dermis Layer ...................................................................................... 59 5.2.3.3 Analysis............................................................................................... 61
5.2.4 Laser Doppler Imaging .............................................................................. 63 5.3 Results and Discussion ..................................................................................... 64
5.3.1 Healthy Volunteers .................................................................................... 64 5.3.2 Individuals With Kaposi’s Sarcoma .......................................................... 68
5.4 Conclusions ....................................................................................................... 72 Chapter 6: Detection Limits of Multi-Spectral Optical Imaging Under the Skin Surface ........................................................................................................................ 75
6.1 Introduction ....................................................................................................... 75 6.2 Materials and Methods ...................................................................................... 77
6.2.1 Optical Skin Phantom ................................................................................ 77 6.2.2 The Monte Carlo Method........................................................................... 81 6.2.3 Simulation of a Spectral Imager ................................................................ 82
6.3 Simulation Descriptions .................................................................................... 84 6.3.1 Skin Reflectance Spectrum and Color ....................................................... 84 6.3.2 3D Information Contained in One Detection Pixel .................................... 85 6.3.3 Detection of Pathological Inclusion ........................................................... 86
6.4 Results and Discussion ..................................................................................... 87 6.4.1 Skin Reflectance Spectrum and Color ....................................................... 87 6.4.2 3D Information Contained in One Detection Pixel .................................... 90 6.4.3 Detection of Pathological Inclusion ........................................................... 95 6.4.4 Optical Skin Phantom ................................................................................ 99
6.5 Conclusions ..................................................................................................... 102 Chapter 7: Conclusions ............................................................................................. 105 Chapter 8: Suggestions for Further Study ................................................................. 106 Bibliography ............................................................................................................. 108
vi
List of Tables Table 1. Kaposi’s sarcoma patient information……………………………………. 43 Table 2. Patient response to therapy………..……….…………………………...…
45
Table 3. Source and camera calibration factors by wavelength………………...…. 55
Table 4. Optical properties used in the mathematical skin model………………… 58 Table 5. Quantitative oxygenated hemoglobin and blood volume results from
reconstructed NIR spectroscopy images of a KS subject with progressive disease………………………………………………………. 72
Table 6. Physiological parameters defining the tissue layers utilized in the model.. 80

xii
corneumaμ Absorption coefficient of stratum corneum deoxyaμ Absorption coefficient of deoxygenated hemoglobin dermisaμ Absorption coefficient of the dermis layer epilaμ Absorption coefficient of the epidermis layer fat
aμ Absorption coefficient of fat wateraμ Absorption coefficient of water melaμ Absorption coefficient of melanin oxyaμ Absorption coefficient of oxygenated hemoglobin skinaμ Absorption coefficient of baseline skin
µs Scattering coefficient µs’ Reduced scattering coefficient
shypodermmisμ′ Hypodermis scattering coefficient
miesμ′ Mie scattering coefficient
rayleighsμ′ Rayleigh scattering coefficient

xiii
List of Abbreviations
ACTG AIDS Clinical Treatment Group AIDS Acquired immunodeficiency syndrome AU Arbitrary units bFGF Basic fibroblast growth factor C Celsius CCD Charge-coupled device CIE Commission Internationale de l’Eclairage cm Centimeter CPU Central processing unit CT Computed tomography FPA Focal plane array FWHM Full width at half maximum g Gram GHz Gigahertz HAART Highly active anti-retroviral therapy Hb Deoxygenated hemoglobin HbO2 Oxygenated hemoglobin Hct Hematocrit He-Ne Helium-neon HHV-8 Human herpesvirus-8 HIF Hypoxia inducible factor HIV Human immunodeficiency virus IL-12 Interleukin-12 in Inch IR Infrared K Kelvin kg Kilogram KS Kaposi’s sarcoma KSHV Kaposi’s sarcoma associated herpesvirus L Liter LDI Laser Doppler imaging m Meter MC Monte-Carlo mg Milligram min Minutes mm Millimeter MR Magnetic resonance MRI Magnetic resonance imaging NCI National Cancer Institute Nd:YAG Neodymium-doped yttrium aluminium garnet (Nd:Y3Al5O12) ng Nanogram NICHD National Institute of Child Health and Human Development NIH National Institutes of Health

xiv
NIR Near-infrared NIRS Near-infrared spectroscopy nm Nanometer OCT Optical coherence tomography p Probability PET Positron emission tomography ROI Region of interest SD Standard deviation SO2 Oxygen saturation UMD University of Maryland µm Micrometer US Ultrasound VEGF Vascular endothelial growth factor W Watts W Weight

1
Chapter 1: Overall Introduction
An impressive array of imaging techniques, such as X-ray imaging, computed
tomography, magnetic resonance imaging, ultrasound, and radioisotope imaging yield
useful information, but there are important limitations on safety, resolution, cost, and
lack or limited specificity to key chemicals necessary for functional tissue
monitoring. The objectives of this research were to develop a means of optically and
noninvasively quantifying the progress and/or change in Kaposi’s sarcoma (KS)
lesions while the clinical subjects underwent experimental therapies. Clinical progress
of the lesions according to clinician assessment was documented, but was decided
mainly from qualitative measurements. The clinical studies in this dissertation have
shown therapy-induced changes in temperature, vasculature, tissue oxygenation, and
tissue blood volume of individuals with KS lesions (Hassan, et al., 2004; Vogel, et al.,
2007).
The goal of this collaboration between the University of Maryland
(Bioimaging and Machine Vision Laboratory) and the National Institutes of Health,
both the National Institute of Child Health and Human Development (NICHD)
(Laboratory of Integrative and Medical Biophysics, Section on Biomedical Stochastic
Physics) and the National Cancer Institute (NCI) (HIV and AIDS Malignancy
Branch), was to quantitatively assess KS lesions before, during and after experimental
drug therapies. The quantitative assessments were made using three noninvasive
techniques: thermography, laser Doppler imaging (LDI), and near-infrared (NIR)
multi-spectral imaging. Clinical trials were approved by the NIH and UMD. With
these three imaging techniques, temperature, vasculature, oxygenated hemoglobin

2
(HbO2), and blood volume could be quantified inside the lesion and in the
surrounding tissue and tracked during treatment.
This dissertation is organized into the following chapters. Chapter 2 details the
overall objectives of this dissertation research and Chapter 3 provides a detailed
introduction and literature review. Three journal articles are presented in Chapters 4,
5, and 6. The first paper describes the use of thermography and LDI to study KS
lesions undergoing experimental therapy. The second paper describes the design of a
NIR multi-spectral imaging system and a reconstruction algorithm used to study
functional characteristics of KS lesions. The third paper describes Monte-Carlo
simulations of tissue conducted to determine the detection limits of the multi-spectral
imaging system. Chapter 7 follows with overall conclusions and Chapter 8 describes
suggestions for future studies.

3
Chapter 2: Overall Objectives
The major goal of this research was to quantitatively analyze the changes in
tissue vasculature of individuals with KS using noninvasive imaging techniques. This
research utilized three noninvasive imaging techniques: thermography, LDI, and NIR
multi-spectral imaging. Each imaging technique monitored a different functional
aspect of the skin and vasculature. Thermography measured the temperature, LDI
monitored the blood flow, and multi-spectral imaging monitored changes in HbO2
and blood volume in the lesion and normal skin while the patient received
experimental therapy. The specific objectives of Chapters 4, 5, and 6 were to:
1. Determine with thermography and LDI if the temperature and blood flux
differences between the lesion and surrounding skin changed during
experimental therapy.
2. Determine if multi-spectral imaging could be used to quantitatively
analyze the functional characteristics of tissue during experimental drug
therapy and investigate progression of disease.
3. Investigate the use of the Monte Carlo method to simulate a virtual
spectral imager and study the behavior of the photons at different
wavelengths traveling inside human skin tissue and the possible influence
of this behavior on the resulting spectral images.
Thermography, LDI, and multi-spectral imaging techniques have the potential to
establish quantitative methods to assess KS lesions undergoing therapy and to teach
clinicians about the effects of such therapy on the vascularity of the lesions.
Moreover, such approaches can be used to provide early markers for tumor responses

4
and to learn about the pathophysiology of the disease and its changes in response to
treatment. Ultimately, quantitative imaging methods can be applied to other tumors or
lesions involving the skin or other easily accessible tissues.

5
Chapter 3: Review of Literature
This chapter first provides background information on the structure of skin,
including the epidermis and dermis layers, followed by a description of KS.
Sections 3.3 and 3.4 describe thermography and LDI imaging, respectively.
Since the major portion of this dissertation is focused on the multi-spectral imaging
technique, details describing this technique are broken down into several subtopics in
Sections 3.5-3.9.
First, Section 3.5 describes applications of NIR spectroscopy in medicine.
Then, since analyzing a set of multi-spectral images requires a mathematical skin
model, Section 3.6 describes previously developed models and Section 3.7 discusses
the absorption and scattering properties necessary for the models. Sections 3.8 and
3.9 describe how light travels through the epidermis and dermis layers of skin,
respectively. These sections also detail what analytes are present in each layer and
what factors must be taken into consideration in the model.
3.1 Skin Structure
Skin is the flexible tissue enclosing the body of vertebrate animals while
providing vital protective and metabolic functions. The skin provides a barrier against
invasion by outside organisms, protects underlying tissues and organs from abrasion
and other injury, and shields the body from the dangerous ultraviolet rays in sunlight.
It also waterproofs the body, preventing excessive loss or gain of bodily moisture.
At the human/environment interface, heat is carried away from the body by
conduction, convection, radiation, and evaporation. The human thermoregulatory

6
system maintains a reasonably constant body temperature against a wide range of
environmental conditions. This is possible because the body’s numerous sweat glands
excrete waste products along with salty moisture; its fat cells act as insulation against
cold; and when the body overheats, its extensive small blood vessels carry warm
blood near the surface to be cooled.
The skin is lubricated by its own oil glands, which keep both the outside layer
of the epidermis and the hair from drying to brittleness. The body uses several
physiological processes to increase or decrease heat transfer with the environment.
The mechanism controlling thermal emission and dermal microcirculation is driven
by the sympathetic nervous system. In the presence of a disease affecting the local
thermoregulatory system, there may be an altered sympathetic function and a change
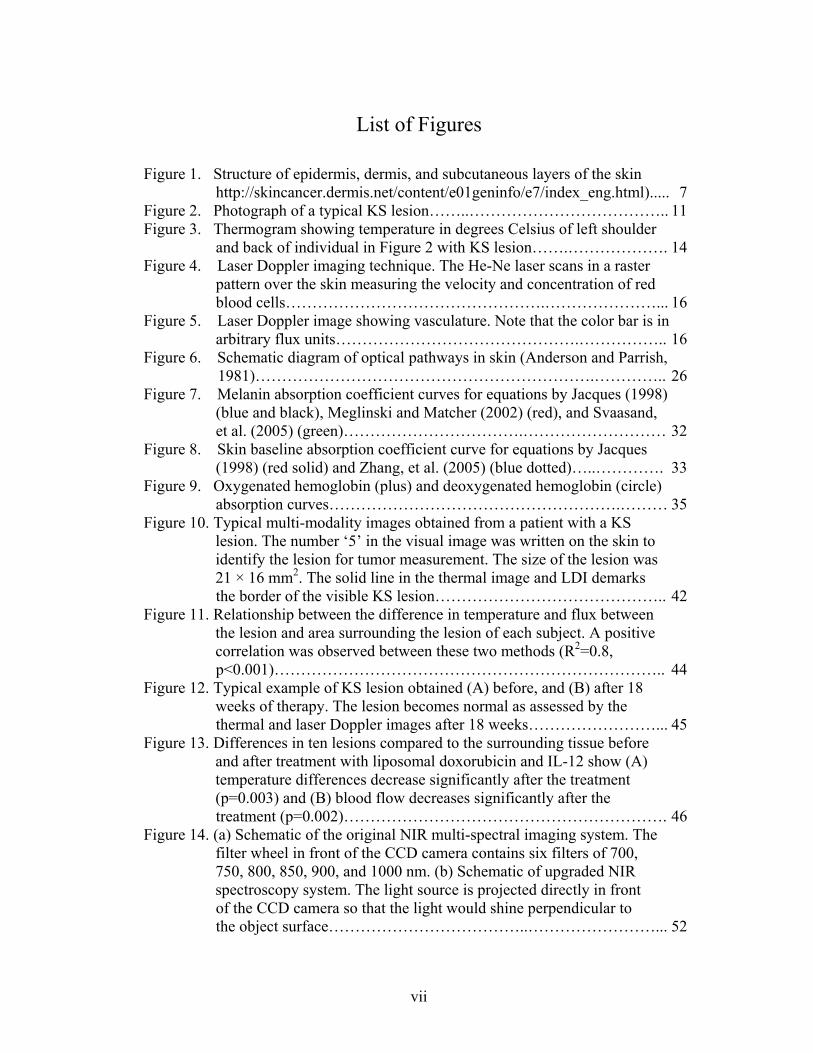
in the local metabolic rate (Merla, 2002). The structure of skin, shown in Figure 1,
contains two main layers of cells: a thin outer layer, the epidermis; and a thicker inner
layer, the dermis. The dermis is bonded to a subcutaneous fat layer which may be
several centimeters thick (Archambeau, et al., 1995). Optically, the human skin is
simply described in terms of two different absorbing and scattering layers on top of a
nearly totally reflecting collagen layer in the dermis (Anderson and Parrish, 1981;
Dawson, et al., 1980; Wan, et al., 1981).
3.1.1 Epidermis
The epidermis ranges from 27-300 microns thick (Anderson and Parrish,
1981; Archambeau, et al., 1995; Meglinsky and Matcher, 2001) and is composed of
five layers: stratum corneum, stratum basale, stratum spinosum, stratum granulosum,
and stratum lucidum. The epidermis is shown in Figure 1 on the surface of the skin.

7
The outermost epidermis skin layer, the stratum corneum, is about 10-20 microns
thick (Anderson and Parrish, 1981; Meglinsky and Matcher, 2001). It’s composed
mainly of dead cells, called corneocytes, embedded in a particular lipid matrix.
Figure 1. Structure of epidermis, dermis, and subcutaneous layers of the skin
(http://skincancer.dermis.net/content/e01geninfo/e7/index_eng.html).
The outer stratum corneum, which mainly induces diffuse forward scattering,
influences total skin reflectance approximately 8%, which for all practical purposes is
negligible (Anderson and Parrish, 1981; Wan, et al., 1981). All light penetrating the
stratum corneum is heavily absorbed by the epidermal melanin. The stratum corneum
is equally thick in African and European skin (Freeman, et al., 1962; Thomson,
1955). However, Weigand et al. demonstrated that the stratum corneum in African
skin contains more cell layers, but weighs the same as European skin (Weigand, et al.,
1974). This may be because the lipid content of the stratum corneum is higher for
black persons (Reinertson and Wheatley, 1959). Despite structural differences in the
stratum corneum, the total reflectance of light is between 4-7% for both blacks and
whites (Anderson and Parrish, 1981). The stratum corneum plays an important role as

8
a barrier between the environment and the body because it retains moisture in skin.
The water content in the stratum corneum is not uniform; however, skin becomes
more hydrated at deeper sites.
The epidermis has no blood vessels, but does contain blood cells,
keratinocytes, melanocytes, dendritic cells, and basal cells. Circulating blood cells
appear as either numerous small disks of diameter 5-9 microns or occasional large
ovals of size 9-18 microns (Rajadhyaksha, et al., 1995). From their relative shapes,
sizes, and concentrations, cells are erythrocytes or leukocytes. Other features include
bright spiral- or crescent-shaped substructures inside nuclei, collagen fibers
surrounding the capillaries, sweat ducts spiraling down into the dermis, and hair
follicles.
Along the internal surface of the epidermis, keratinocytes are stacked on top
of each other, forming sublayers. The keratinocytes develop at the bottom and rise to
the top, where they flatten and overlap to form a tough membrane, and gradually shed
as calluses or collections of dead skin. Melanocytes, located in the lower basal cell
layer of the epidermis, produce a dark pigment called melanin which contributes to
skin color and provides ultraviolet protection. Dendritic (Langerhans) cells are
involved in the epidermal immune system. They engulf foreign material that invades
the epidermis and migrate out of the skin to stimulate an immune response. Basal
cells are found at the bottom of the epidermis.
Cell proliferation occurs in the basal cell monolayer with a generation time of
2.6 days. About 4% of the cells move into and out of the layer daily, maintaining
constant population densities (Archambeau, et al., 1995). The layers of the epidermis

9
work together to continually rebuild the surface of the skin from within while
maintaining the skin’s epidermal strength.
The epidermis propagates and absorbs light. The absorption property comes
mostly from a natural chromophore called melanin. Melanin is produced by cells
called melanocytes occurring in the stratum basale and found in membranous
particles called melanosomes. Melanosomes are secreted by melanocytes and into
adjacent keratiepidermis nocytes via dendritic processes. The keratinocytes
containing the melanin-carrying melanosomes move up through the epidermal layers
as part of the constant regeneration process. Thus, melanin is formed in the lower
layers of the skin, attaches to the keratinocytes in the form of melanosomes, and
slowly moves to the outer layers of skin until it reaches the stratum corneum
(Angelopoulou, 2001). Melanosomes have relatively high refractive indices (1.55–
1.65) compared to the surrounding skin tissue (1.35–1.4) and are therefore important
epidermal scatterers.
3.1.2 Dermis
The underlying dermis, much thicker than the epidermis, consists of
connective tissues that contain embedded blood vessels, nerve endings, sebaceous
glands, collagen, hair follicles, sweat glands, and fat cells (Figure 1). The dermis is
0.6-3 mm thick where the upper 350 micron portion is the papillary layer, which
contains microvessels that supply the epidermis, and the lower layer is the reticular
dermis (Anderson and Parrish, 1981; Meglinsky and Matcher, 2001). These layers are
primarily composed of dense, irregular connective tissue with nerves and blood
vessels (smaller ones in the papillary and larger ones in the reticular dermis).

10
The vascular supply to the dermis is largely from segmental arteries, each of
which supplies a relatively small area of the epidermis with nutrients. The volume
fraction of blood in tissue can vary, but typically range from 0.2-7% (Jacques, 1996).
The fluence rate of blood decreases with depth, following an almost linear pattern in
the dermis (Van Gemert, et al., 1989). The dermal vasculature includes arteries and
veins from the subcutaneous layer that pass through the dermis with minimal
branching. Tufts containing arterioles, venules, and capillaries extend through the
papillary dermis up to the epidermal basal lamina. These vessels are contained in a
loose connective tissue (Archambeau, et al., 1985). They exist as separate folded and
coiled geographically isolated tufts, or bunches, with no interconnection to adjacent
tufts except by arteries and veins (Archambeau, et al., 1995). Since the human skin
has a rich blood supply, it has remarkable self-healing properties, particularly when
only the epidermis is damaged. Deeper wounds, penetrating to the underlying tissue,
heal by scar formation.
Nerve endings respond to various stimuli, including contact, heat, and cold.
Meissner’s corpuscle is effective in detecting light touch and soft, fleeting
movements. Pacinian corpuscles function as receptors for deep pressure and
vibration. Response to cold activates the erector muscles, causing hair or fur to stand
erect. From the outer surface of the dermis extend numerous projections (papillae)
that fit into pits on the inner surface of the epidermis so that the two layers are firmly
locked together.
Sebaceous (oil) glands are small, sacculated organs that secrete sebum. This
oily substance is a natural moisturizer that conditions the hair and skin. Sebaceous
11
glands are found all over the body, but they are more numerous in the scalp area and
around the forehead, chin, cheeks, and nose.
The dermis tissues are composed largely of collagen fibers, approximately
75% by dry weight (Hopewell, 1990). Collagen is responsible for the skin’s pliability
and mechanical resistance and is also involved in the regulation of the body
temperature.
3.2 Kaposi’s Sarcoma
KS represents a useful model to study anti-angiogenesis approaches and the
imaging of such therapies (Little, et al., 2000; Yarchoan, 1999a). KS is a frequent
cause of morbidity and mortality among individuals infected with human
immunodeficiency virus (HIV) (Beral, et al., 1990). Figure 2 shows a photograph of a
typical KS lesion. KS lesions may be red, purple, brown, or black, and are usually
raised above the skin. Growth can range from very slow to explosively fast, and be
associated with significant mortality and morbidity.
Figure 2. Photograph of a typical KS lesion.
KS lesions are characterized pathologically by spindle cells and vascular slits
(Antman and Chang, 2000). KS is caused in part by a gammaherpesvirus called
12
Kaposi’s sarcoma associated herpesvirus (KSHV) or human herpesvirus-8 (HHV-8)
(Chang, et al., 1994). This virus encodes for several factors with angiogenic activity,
and KS spindle cells have been shown to produce and respond to a number of
proangiogenic factors including basic fibroblast growth factor (bFGF) and vascular
endothelial growth factor (VEGF) (Boshoff, et al., 1997; Ensoli, et al., 1992; Moore,
et al., 1996). Also, KSHV induces a proangiogenic state and upregulates VEGF
production in part through activating hypoxia inducible factor (HIF) (Bais, et al.,
1998; Sodhi, et al., 2000). Cutaneous KS lesions are easily accessible for noninvasive
techniques that involve imaging of tumor vasculature, and they may thus represent a
model tumor in which to assess certain parameters of angiogenesis.
3.3 Thermography
3.3.1 Thermal Energy
Thermography is the use of an infrared camera to visualize and measure
thermal energy emitted from an object. Thermal, or infrared (IR) energy, is light that
is not visible because its wavelength is too long to be detected by the human eye.
Under infrared light, everything with a temperature above absolute zero emits heat.
The higher the object’s temperature, the greater the IR radiation emitted (FLIR,
2002).
The amount of radiated power is proportional to the body’s temperature,
raised to the fourth power and determined by the following equation (Kelch, 1998):
4** TBER = (1)
where R is the spectral radiant excitance [Watt * cm-2], E is the emissivity, B is the
Stefan Boltzmann constant (5.67x10⁻¹² Watt cm-2 K-4), and T is the temperature in

13
Kelvin. Many scanners and cameras have been designed and produced to visualize
light in the IR range.
3.3.2 Thermal Camera
A thermal camera is a noninvasive device that detects IR energy and converts
it to an electronic signal, which is then processed to produce a thermal image on a
video monitor where temperature calculations can be performed (FLIR, 2002). Heat
sensed by an IR camera can be very precisely quantified. IR thermal imagers capture
a portion of the radiated energy and are calibrated to indicate specific temperatures.
Thermal cameras are popular because they are completely non-contact, quantify
temperature precisely, acquire images quickly (resolution and speed independent),
and allow for a large imaging area.
There are currently two types of focal plane array (FPA) imagers: cooled and
uncooled. Cooled FPA systems operate in the 3-5 micron or NIR range and generally
provide excellent sensitivity. The newest FPA imaging systems use uncooled
detectors. Unlike previous IR systems that sensed photons, these microbolometer
systems operate by sensing changes in electrical resistance across the detector,
produce high-resolution images, but do not require cryogenic cooling systems.
Currently, all microbolometers operate in the 8-12 micron or mid-IR range. The
increased resolution found on FPA microbolometer systems enables users to discern
minute temperature variations and provides highly accurate temperature readings
(FLIR, 2002). Commercial infrared imagers are not manufactured in the 5-8 micron
range due to atmospheric absorption of infrared energy at these wavelengths.

14
3.3.3 Thermal Images
Thermography graphically depicts temperature gradients over a given body
surface area at a given time. It has the ability to study biological thermoregulatory
abnormalities that directly or indirectly influence skin temperature (Anbar, 1998;
Head and Elliott, 2002; Maxwell-Cade, 1968; Usuki, et al., 1998). A spatial map of
temperatures called a thermograph or thermogram is created, as shown in Figure 3.
Regions of higher temperature are seen as dark red and white shades, while regions of
cooler temperatures appear as blue and black.
Figure 3. Thermogram showing temperature in degrees Celsius of left shoulder and back of individual in Figure 2 with KS lesion.
Thermography provides an integrated thermal signature that combines deep
and surface sources and in general can be related to increased blood flow associated
with increased metabolic activity (Bornmyr, et al., 1997; Draper and Boag, 1971;
Love, 1980; Stoner, et al., 1991). Skin temperature is only an indirect measure of skin
blood flow (Love, 1980). In fact, the superficial thermal signature of skin is related to
metabolism and vascularization within the underlying tissues. It may therefore change

15
significantly as a result of pathological processes. Temperature measurement is the
most widely used technique for the evaluation of skin circulation (Usuki, et al., 1998).
Thus, this approach is best used in conjunction with other imaging techniques. Since
radiation has been shown to cause vascular changes in the skin, thermography should
be evaluated as a noninvasive analysis tool.
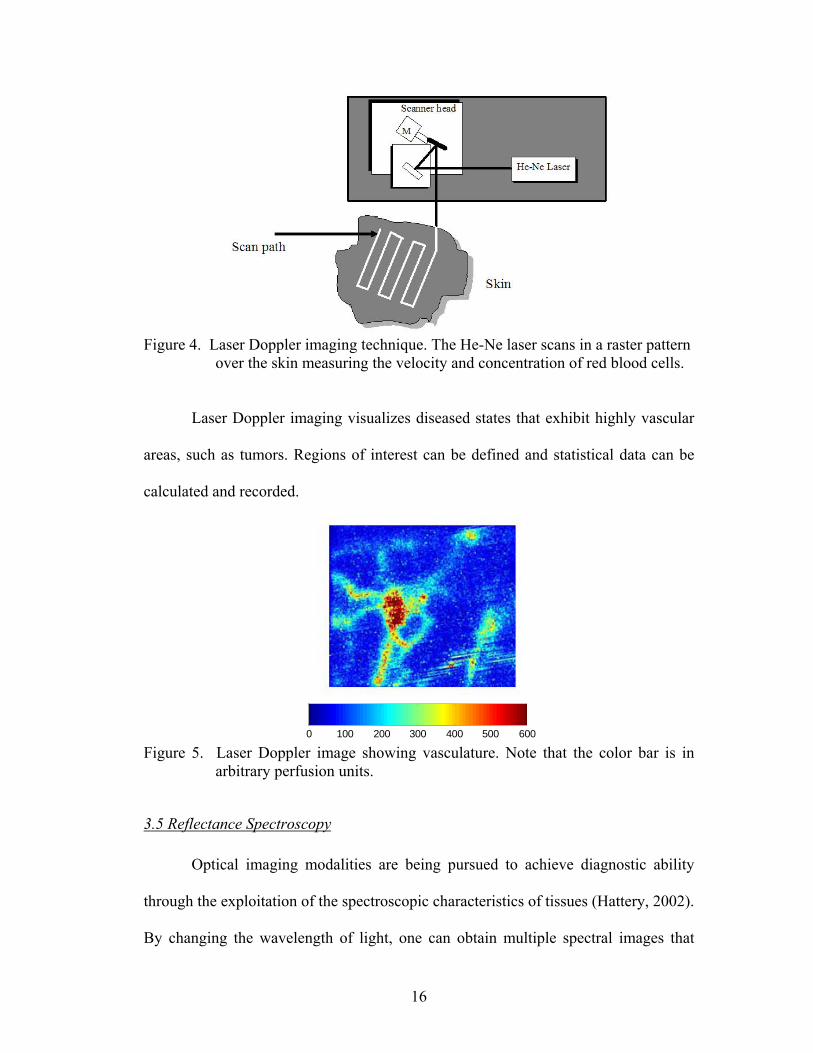
3.4 Laser Doppler Imaging
LDI can more directly measure the blood perfusion of small blood vessels in
tissue, which generally increases as the blood supply increases during angiogenesis
(Rivard, et al., 1999; Sorensen, et al., 1996). By combining thermography with LDI,
it may be possible to differentiate the near surface sources from the deeper infrared
sources, thus providing a useful means to assess local changes in tissue
vascularization. The tissue sampled is typically 1 mm thick, capillary diameters are
10 microns, and the velocity spectrum measurement is typically 0.01 to 10 mm/s. The
theory of the Doppler technique, shown in Figure 4, begins when low power light
from a monochromatic stable laser, such as a 5-mW Helium-Neon (He-Ne) laser,
incident on tissue, is scattered by moving red blood cells. LDI measures the Doppler
shift due to the movement of red blood cells and produces a 2D image of tissue blood
perfusion (Figure 5). The term commonly used to describe blood flow measured by
the laser Doppler technique is flux. Flux is expressed in arbitrary perfusion units and
is a quantity proportional to the product of the average speed of the blood cells and
their number concentration, often referred to as blood volume. Figure 5 shows that
highly vascular areas can be detected from the surroundings. It can register flow in a
variety of vessels including arterioles, capillaries, and venules.

16
Figure 4. Laser Doppler imaging technique. The He-Ne laser scans in a raster pattern
over the skin measuring the velocity and concentration of red blood cells.
Laser Doppler imaging visualizes diseased states that exhibit highly vascular
areas, such as tumors. Regions of interest can be defined and statistical data can be
calculated and recorded.
0 100 200 300 400 500 600 Figure 5. Laser Doppler image showing vasculature. Note that the color bar is in
arbitrary perfusion units.
3.5 Reflectance Spectroscopy
Optical imaging modalities are being pursued to achieve diagnostic ability
through the exploitation of the spectroscopic characteristics of tissues (Hattery, 2002).
By changing the wavelength of light, one can obtain multiple spectral images that

17
highlight various molecular components. In addition, light interacts with biological
tissues in a number of different ways providing different means to probe the body.
However, because of scattering and absorption, quantification has been limited to
surface imaging. Optical reflectance imaging of tissues, a novel concept in diagnostic
medicine and the basis of Chapters 5 and 6, can be used to determine the variation in
tissue physiology.
NIR spectroscopy (NIRS) tells what’s going on at the body’s surface and
below, since light penetrates tissue to a certain extent. In vivo spectral reflectance
measurements of human skin have been performed since 1939, but the early data
were not analyzed in terms of chromophore content until 1951 (Andersen and
Bjerring, 1990; Goldzieher, et al., 1951). In contrast to in vitro absorbance
measurements in chemistry, in vivo reflectance spectroscopic data analysis is very
complex (Anderson and Parrish, 1981). NIRS interrogates blood in the capillaries,
arterioles, and venules of tissue and enables direct and noninvasive measurements of
the tissue oxygen saturation by examining absorption differences in the spectra of
oxygen carriers, such as oxygenated hemoglobin (HbO2), deoxygenated hemoglobin
(Hb), myoglobin, and cytochrome aa3 (Taylor and Simonson, 1996). The
concentrations of these analytes in tissue may be used to diagnose disease and to
monitor changes in various conditions (Kollias, et al., 1995; Shah, et al., 2001;
Wagnieres, et al., 1997). Assessing these analytes is complicated by other pigments in
the skin, i.e. melanin and hemosiderin, but it is possible to correct for such pigments
with NIRS. Several researchers have used NIRS to study physiological changes in
tissue.

18
3.5.1 Measuring Tissue Oxygenation
For years, light has been used as an indicator of oxygenation. The ear
oximeter, devised by Millikan in 1942, was the first successful clinical device to
determine oxygenation. The differential absorption of light by HbO2 and Hb forms
the basis of pulse oximetry and has been exploited clinically for some time. However,
pulse oximetry has been primarily concerned with systemic blood oxygenation and
not with local oxygenation in cutaneous tissues. Reports on a variety of human and
animal tissues, both in vivo and in vitro, have been published (Zonios, et al., 1999).
The NIRS method is not limited to measurements of blood oxygenation in
arteries (e.g. pulse oximetry) or in veins, but interrogates blood in the entire vascular
compartment, including capillaries, arterioles, and venules, i.e. the vascular bed.
NIRS was introduced as a technique to determine the degree of tissue oxygenation
several decades ago (Jobsis, 1977). NIRS is also being more aggressively investigated
and now marketed clinically as a noninvasive means to assess tissue oxygenation in
trauma patients at the end organ level (Ward, et al., 2006).
New and advanced methods, including pulsed reflectance spectroscopy, have
made it possible to estimate oxygen saturation of hemoglobin transcutaneously in
specific body areas (Feather, et al., 1988). HbO2 saturation in subcutaneous rat
mammary tumors was measured using NIRS in vivo and in rapidly frozen sections
from the same tumors using cryospectrophotometry, which reported oxygen
saturation in individual blood vessels to depths of 4 mm from the tissue surface.
Sensitivity and specificity analysis suggested that NIRS may identify clinically

19
relevant hypoxia, even when its spatial extent was below the resolution limit of the
NIRS technique (Conover, et al., 2000).
Laufer et al. used pulsed photoacoustic spectroscopy to measure blood oxygen
saturation in vitro (Laufer, et al., 2005). An optical parametric oscillator laser system
provided nanosecond excitation pulses over the wavelength range 740–1040 nm that
were used to generate photoacoustic signals in a cuvette through which a saline
suspension of red blood cells was circulated. The signal amplitude and effective
attenuation coefficient were extracted from the photoacoustic signals as a function of
wavelength to provide photoacoustic spectra of the blood. From these, the relative
concentrations of HbO2 and Hb, and therefore blood oxygen saturation (SO2), were
determined using forward models of the absorbed energy distribution based on
diffusion theory. A standard linear model of the dependence of absorbance on the
concentration of chromophores was also used to calculate SO2 from the signal
amplitude spectra. The diffusion approximation model was shown to produce the
highest accuracy in blood SO2. Payette et al. used NIRS and laser Doppler imaging to
study the oxygenation of skin flaps (Payette, et al., 2005).
Semi-empirical models have been used to measure blood content and HbO2
saturation in rat gastric mucosa (Sato, et al., 1979) and rat pancreas (Knoefel, et al.,
1996). Differences in the diffuse reflectance of rat brain were characterized
empirically (Ikeda and Matsushita, 1980), and empirical analysis was also employed
to study human tissues in vivo, such as skin (Marchesini, et al., 1991), bladder
(Mourant, et al., 1995), and colon (Ge, et al., 1998; Mourant, et al., 1996). The results
20
confirm that tissue reflectance provides valuable information, but the qualitative
nature of the analyses limits the information obtained.
Quantitative results have been obtained in blood oximetry (Schmitt, 1991;
Takatani and Ling, 1994) and in the study of the optical properties of various animal
tissues such as rat prostrate (Arnfield, et al., 1988), chicken breast (Kienle, et al.,
1996), and canine gut (Zonios, et al., 1996). However, these models are
mathematically complicated, making difficult the inversion of the measured spectra,
which is needed to obtain the tissue optical parameters (Zonios, et al., 1999).
3.5.2 Measuring Tissue Blood Volume
Port-wine stains, a congenital birthmark consisting of an abnormal density of
blood vessels in the upper dermis, have also been studied with NIR spectroscopy
(Svaasand, et al., 1995). The enlarged blood volume gives the lesion a red to purple
color. The aim of treatments is to destroy the vessels to the extent necessary for
obtaining normal skin coloration. NIRS can follow port-wine stains through laser
treatment.
NIRS has also been applied to study the pathophysiology of skeletal muscle
metabolism during exercise (Colier, et al., 1995; Comerota, et al., 2003), in patients
with diabetes or compartmental syndrome (Giannotti, et al., 2000; Scheuermann-
Freestone, et al., 2003), and to monitor perfusion during carotid endarterectomy
(Kragsterman, et al., 2004; Mille, et al., 2004; Williams, et al., 1996).
Ryatt et al. (1983) used reflectance spectrophotometry to obtain indices of
hemoglobin and melanin content of psoriatic lesions and adjacent clinically normal

21
skin. Results showed that hemoglobin in the lesion was 2.8 times greater than that of
adjacent uninvolved skin (Ryatt, et al., 1983).
3.5.3 Measuring Tissue Moisture
Although the condition of skin can be felt to some extent, it is somewhat
difficult to measure the moisture content quantitatively. A quantitative measurement
of skin tissue water content is required in a wide variety of fields such as evaluating
the effects of cosmetic products and medical diagnostics. Many researchers have
developed instrumentation and techniques for infrared spectroscopic imaging to
visualize skin hemodynamics and tissue water content to test tissue viability of skin
flaps (Attas, et al., 2001; Stranc, et al., 1998). Attas et al. (2001) mounted a liquid-
crystal tunable filter on the front of the objective lens of an IR-sensitive charge-
coupled device digital camera. Sets of narrow-band images of skin were acquired in
vivo at wavelength intervals of 10 nm from 650 to 1050 nm.
Mansfield et al. used NIRS to diagnose acute maxillary rhinosinusitis
(Mansfield, et al., 2005) and Canvin et al. used NIRS to characterize the synovium of
the small finger joints in both early and late rheumatoid arthritis. The study
demonstrated relationships between the specific sources of spectral variation and joint
tenderness or swelling as well as radiographic damage. Further use of multivariate
analysis allowed recognition of the spectral patterns seen in early disease versus late
rheumatoid arthritis and correct classification of over 74% of the joints (Canvin, et
al., 2003).

22
3.6 Mathematical Optical Skin Models
The rosy glow of someone’s cheeks and the tan on someone’s arms reflect the
presence of colored chemicals in the skin (hemoglobin and melanin, respectively).
Light spectroscopic methods are critical to advances in molecular characterization of
disease processes. Chapters 5 and 6 in this dissertation require a mathematical optical
skin model to analyze the NIR spectroscopic images. Researchers have created
multiple layer models that include different chromophores in each layer allowing for
a reconstructed spatial map of those constituents. The construction of a simplified
optical model allows the introduction of pigment indexes as a measure for pigment
content in the skin (Dawson, et al., 1980), resulting in widespread use of spectral
reflectance for in vivo measurements (Ryatt, et al., 1983). Studies of skin
inflammation, effects of dermatological treatment modalities, and skin physiology
have now become objective because of modern methods, but the intriguing optical
properties of human skin make data analysis very complicated (Ryatt, et al., 1983).
Models range from simple ones with two layers (i.e. epidermis and dermis layers) to
complex ones with up to seven layers.
A three-layer model of epidermis, papillary upper dermis, and reticular dermis
was used to study the independent effects of 13 parameters’ independent effects on
the reflectance spectra (Zhang, et al., 2005). A three-layer optical skin model was
proposed to perform computerized multiple regression analysis of in vivo skin
reflectance measurements (Andersen and Bjerring, 1990).
More complicated models include multiple layers, each layer containing
different concentrations of blood and pigments. One example is a five-layer skin

23
model: epidermis, capillary blood plexus, dermis, deep blood plexus, and hypodermis
(Douven and Lucassen, 2000). The dermis layer consisted of three distinct layers that
could contain different concentrations of blood. The first layer of the dermis
accounted for the superficial blood plexus and the capillary loops located in the upper
dermis, and the third layer of the dermis accounted for the deep blood plexus in the
lower dermis. To account for the irregular shape of the epidermal-dermal interface, a
small concentration of blood was taken into account for the bloodless epidermis.
Other researchers introduced calibration factors to simplify homogeneously
distributed blood (Douven and Lucassen, 2000). Since blood is discretely distributed
in vessels, there are consequences for the effective absorption of light. The effective
absorption of blood is reduced when the penetration depth of light in blood becomes
small compared to the vessel radius, when blood in the center of the vessel does not
contribute to absorption. Douven and Lucassen (2000) used Verkruysse’s correction
factor that depended on the product of the blood absorption coefficient and vessel
radius to characterize chromophore concentrations in port-wine stains and highly
pigmented human skin.
A five-layer model of the skin was used for numerical simulations (Sinichkin,
et al., 1996). The layers included the epidermis, papillary derma, upper vessel plexus,
reticular derma, and deep vessel plexus. Other researchers extended the simple
epidermis and dermis model by adding a layer of oil on the outside of the skin (Ng
and Li, 2001). Another researcher extended previous work (Stamnes and Conklin,
1984) to model a skin layer bounded by rough surfaces (Stam, 2001).

24
A new seven-layer bio-optical skin model was developed and computations
were carried out with rigorous radiative transfer theory (Nielsen, et al., 2004). It was
found that the observed reflectance could be simulated if the scattering from
melanosomes was included in the bio-optical skin model and the different size
distributions of melanosomes of lightly and darkly pigmented skin were taken into
account. To focus on the importance of the melanosome depth distribution, Nielson et
al. (2004) have simulated the light distribution in and above the skin. In these
simulations, the size and depth distribution of melanosomes varied, but the volume
concentration of melanosomes in the epidermis and all other input parameters were
fixed.
A tissue model of complexity sufficient to approximate mammalian skin
tissue with pulsatile blood flow requires multiple layers with unique optical
properties, reflecting the heterogeneous distribution of blood in tissue. A four-layer
tissue model was used to study laser dosimetry incorporated a layer representing a
blood plexus (van Gemert and Henning, 1981), but an analytical solution was not
published. Another researcher employed Monte Carlo simulations of light traveling
through a homogeneous, single-layer tissue model to demonstrate the importance of
light scattering in understanding reflectance pulse oximetry (Graaff, et al., 1996).
3.7 Absorption and Scattering
In any optical skin model, each layer contains major chromophores that
determine absorption in the corresponding layer and the layers together determine the
total reflectance of the skin. When light interacts with a medium such as tissue, some
of it is reflected from the surface, some absorbed, some scattered within the tissue,

25
and some transmitted through to the other side (Figure 6). All of these interactions
can provide information about the medium. The sum of the light intensities reflected,
absorbed, scattered, and transmitted equals the total light intensity impinging on the
medium. What is seen and measured is the light returning from the surface of the
tissue back to a detector (Firbank, et al., 1995).
The extent to which light energy is absorbed by each of the chromophores in
the tissue, in particular by HbO2, Hb, and water, is described by the Beer-Lambert
law:
∑=
=N
iii dcaA
1)()( λλ (2)
where the overall absorbance at wavelength λ, A(λ), is the sum of the absorbances of
each of the N chromophores present. For each chromophore i, the absorbance is the
product of its absorptivity at wavelength λ, a(λi), times the path length, or the distance
the light travels, d, times the concentration, ci, of the chromophore.
Since some of the light penetrates the tissue, information about its absorption
and scattering by the tissue at different wavelengths is also obtained as part of what is
normally considered reflected light. In other words, the reflectance measured from the
surface has contributions from singly scattered (reflected) photons at or near the
surface of the tissue, as well as from photons that have traveled through a significant
volume of the tissue via a series of scattering events. This spectral information can be
obtained for each location in the tissue.
Within any skin layer, 93-96% of the incident radiation not returned by
regular reflectance may be absorbed or scattered (Anderson and Parrish, 1981).
Scattering is the form of interaction of light with a medium where only the light’s

26
direction of travel is changed. Lucas demonstrated the presence of epidermal
scattering in skin in 1931 by placing a sample of epidermis in front of the entrance slit
of a monochromator, thereby creating a detector with a very limited aperture, and in
this way measured direct transmission (Lucas, 1931).
Figure 6. Schematic diagram of optical pathways in skin (Anderson and Parrish, 1981).
The degree of scattering is wavelength dependent and is also dependent on the
size distribution and refractive indices of the scattering particles constituting the
medium (Arnfield, et al., 1988). Candidates for scattering centers in mammalian cells
are the cell itself, the nucleus, other organelles, and structures within organelles.
Mammalian cells are typically of the order of 10–30 µm in diameter, with nuclei on
the order of 3–10 µm in diameter (Mourant, et al., 1998). Mitochondria are
approximately 1–4 µm in length and approximately 0.3–0.7 µm in diameter.
Lysosomes and peroxisomes are roughly spherical in shape and approximately 0.2–
0.5 µm in diameter. Other organelles from which light may scatter are the Golgi
apparatus and the endoplasmic reticulum, both of which have complicated shapes

27
containing a large proportion of lipid membranes. To address the issue of what cell
features are responsible for light scattering, the wavelength dependence of the
reduced scattering coefficient, µs’, must be measured.
For molecules or small particles with dimensions less than roughly 1/10 of the
light wavelength, scattering is generally weak, nearly isotropic (equally distributed
spatially) and polarized, and varies inversely with the fourth power of wavelength –
this is called Rayleigh scattering (Anderson and Parrish, 1981; Jacques, 1998). For
particles with dimensions on the same order as the wavelength, scattering is much
stronger, more forward-directed, and, while varying inversely with wavelength, is not
such a strong inverse function. When the particle size greatly exceeds the wavelength,
scattering is again diminished and becomes highly forward-directed – known as Mie
scattering (Kerker, 1969). Within the skin, all of these general types of scattering
occur, but quantitatively, scattering by structures with dimensions on the order of
optical wavelengths or somewhat larger (Mie) must dominate over Rayleigh
scattering.
In tissue, the probability of a given photon being scattered varies gradually as
a function of wavelength, so a linear scattering approximation is valid over limited
ranges in the NIR region (Schmitt and Kumar, 1998). Multiple scattering events result
in a complex pattern of photon flux in tissue. It is believed that the difference in the
scattering coefficient between the epidermis and dermis layers of skin is not large,
although there actually is some (Jacques, 1996; Van Gemert, et al., 1989).
Experimental evidence supports the hypothesis that light scattering in tissue is
anisotropic with significant forward scattering. Bruls and van der Leun (Bruls and

28
van der Leun, 1984) demonstrated forward-peaked scattering functions for human
stratum corneum and epidermis at ultraviolet and visible wavelengths.
The reduced scattering coefficient depends on the wavelength of light. In the
NIR region, the absorption mean free path is much longer (on the order of 10-100
microns) than the scattering mean free path. Thus, the scattering coefficient of the
tissue is always larger than the absorption coefficient of the tissue. It is difficult to
determine the path length with accuracy to correctly apply the Lambert–Beer law,
which relates absorbance to concentration (van der Zee, et al., 1992; Wyatt, et al.,
1990). This allows NIR light to noninvasively detect physiological changes in tissues.
3.8 Modeling the Epidermis
In order to determine the properties of the epidermis, the absorption
coefficients of its common constituents: melanin, baseline skin, and water must be
considered. Researchers have used different methods to calculate these absorption
coefficients.
3.8.1 Melanin
Melanin absorption in the epidermis depends on how many melanosomes per
unit volume are in the epidermis. In untanned skin, melanin pigments are found only
in the basal layer of the epidermis, while in tanned skin they are distributed
throughout the epidermis. Melanin gives skin a brown color, since more green than
blue light and more red than green light is backscattered from it.
In Caucasian skin, the melanosomes are smaller and dispersed in groups
inside keratinocytes, whereas in darker skin, melanosomes are larger and dispersed

29
individually inside the keratinocytes. Dark black skin has the greatest density of
pigment and the largest melanosomes, but the number of melanocytes is the same
compared to Caucasian skin. The size of melanosomes determines the distribution
pattern, but this pattern alone does not correlate with the intensity of pigmentation
(Andersen and Bjerring, 1990).
According to Jacques (1996), it is estimated that in light-skinned adults, 1.6-
6.3% of the epidermis volume is occupied by melanosomes; in moderately pigmented
adults, 11-16% of the epidermis volume is occupied by melanosomes; and in darkly
pigmented adults, 18-43% of the epidermis volume is occupied by melanosomes
(Jacques, 1996). Researchers concluded through experiments with different race
populations that melanin must be accounted for, especially if darker skinned people
are being used (Matas, et al., 2002). The most common method of accounting for the
absorbance of melanin has been to develop a melanin index (Dawson, et al., 1980;
Kollias, 1986; Ryatt, et al., 1983).
Many groups have proposed using the difference (slope) in mean absorption
between 650 and 700 nm as a melanin index even though the absorption between
650-660 nm is affected by blood oxygenation because the influence of HbO2 on the
absorption spectrum is relatively small at wavelengths greater than 620 nm (Dawson,
et al., 1980; Hajizadeh-Saffar, et al., 1990). A melanin index based on the slope of the
absorption spectrum between 620 and 720 nm has also been developed (Kollias and
Baqer, 1988). A melanin index of (1/slope365-395nm)*100 was proposed as a because
melanin is a major absorbing component in the range of wavelengths at 365-395 nm
(Andersen and Bjerring, 1990).

30
Another approach has been to develop a melanin index from the “bloodless”
absorption spectra. A three step process was used to adjust for the effects of melanin
on the skin absorption spectrum (Ferguson-Pell and Hagisawa, 1995). These
“bloodless” spectra were obtained by exerting pressure on the skin until all blood was
displaced from that region. The resulting spectra were then assumed to result
primarily from the absorbance of melanin. The first step determined the bloodless
absorption spectrum and subtracted it from the measured spectrum. Then a melanin
index for the skin was determined for each individual measured. The third step
adjusted for the attenuation in the absorption spectrum produced by melanin, using a
multiplication factor to normalize the spectrum to an amplitude that was independent
of the melanin index. Linear regression was performed on the spectrum in the region
of 500-600 nm to produce a melanin index. Clinically there exist situations in which
it was not feasible to exert the pressure on patients required to obtain a “bloodless”
spectrum. These techniques required that a separate melanin index had to be
developed for each individual. An additional issue with having a single index of
epidermal melanin content was that pigmentation was not constant over the entire
surface of an individual’s skin. Birthmarks, freckles, and accumulated sun exposure
could make a difference and the skin over certain body parts was generally much
lighter or darker in color than the rest of the body.
Although epidermal melanin content has been quantified noninvasively using
visible reflectance spectroscopy, there are currently not many methods to determine
melanin distribution in the epidermis. A photoacoustic probe was developed using a
Nd:YAG laser operating at 532 nm to generate acoustic pulses in skin in vivo (Viator,

31
et al., 2004). The probe contained a piezoelectric element that detected photoacoustic
waves that were then analyzed for epidermal melanin content using a photoacoustic
melanin index.
Instead of a melanin index, other researchers have published wavelength-
dependent equations on the absorption coefficient of melanin in the epidermis.
Jacques published the following equations for the melanin absorption coefficient
[mm-1] (Jacques, 1998):
33.310 *10*6.6)( −= λλμ mela (3)
48.311 *10*7.1)( −= λλμ mela (4)
where λ was the wavelength [nm]. These equations yield the blue and black curves in
Figure 7, respectively. The red melanin absorption coefficient [mm-1] curve in Figure
7 is (Meglinski and Matcher, 2002):
33.39 *10*5)( −= λλμ mela (5)
The average absorption coefficient at λ=694 nm was used by another
researcher and multiplied it by the ratio of the wavelength used to 694 nm (Svaasand,
et al., 1995). In addition, the melanin absorption coefficient was different for different
races (colors of skin). For example, mela 694,μ = 0.3 mm-1 corresponded to very fair North
European skin, mela 694,μ = 0.8 mm-1 corresponded to Middle East and moderately
pigmented Asian skin, and mela 694,μ = 2.0 mm-1 corresponded to African skin. The curve
for fair North European skin is shown in Figure 7 as the green curve using:
)/694()( 694, λμλμ mela
mela = (6)

32
700 750 800 850 900 950 10000
5
10
15
20
25
Wavelength (nm)
Abs
orpt
ion
coef
ficen
t (1/
mm
)
Melanin Absorption Coefficient
Jacques1Jacques2MeglinskiSvaasand
Figure 7. Melanin absorption coefficient curves for equations by Jacques (1998) (blue and black), Meglinski and Matcher (2002) (red), and Svaasand, et al. (2005) (green).
3.8.2 Baseline Skin
In addition to the melanin absorption, the skin baseline absorption coefficient
must be taken into account. Researchers have also studied different approaches for
determining this wavelength-dependent value. The following equation was used for
the baseline skin absorption coefficient [mm-1] (Jacques, 1998):
2.66)154(
53.80244.)(−−
+=λ
λμ eskina (7)
where λ was the wavelength [nm]. The absorption curve for this equation can be seen
below in Figure 8 as the solid curve. The following equation was proposed (Saidi,
1992) and used to calculate the skin baseline absorption coefficient as seen as the
dotted curve in Figure 8 (Meglinski and Matcher, 2002; Zhang, et al., 2005) [mm-1]:
255.37 *10*84.7)( −= λλμ skina (8)

33
Skin absorption coefficient values of 0.0158 and 0.0134 mm-1 were previously
reported (Douven and Lucassen, 2000). A value of 0.025 mm-1 was reported for the
wavelength range of 600 to 900 nm (Svaasand, et al., 1995).
Figure 8. Skin baseline absorption coefficient curve for equations by Jacques (1998)
(red solid) and Zhang, et al. (2005) (blue dotted).
3.9 Modeling the Dermis
The major component of the dermis that must be considered for the optical
skin model is blood. Blood vessels in the dermis contain hemoglobin, a protein
contained in red blood cells (95% of the dry mass of red cells is hemoglobin) that
absorbs light and gives blood its reddish color (Anderson and Parrish, 1981).
Normally, the hemoglobin concentration in whole blood is between 134 and 173 g/L
and from 299 to 357 g/L for red blood cells (Roggan, et al., 1999). Hemoglobin binds
very easily to oxygen, making it the ideal vehicle for transporting oxygen from the
lungs to the tissue.
The majority of hemoglobin in the human blood vessels is oxygenated. More
specifically, in the arteries, 90-95% of the hemoglobin is oxygenated; while 5-10% of

34
the hemoglobin is deoxygenated. In the veins, more than 47% of the hemoglobin is
oxygenated (Angelopoulou, 2001). Skin color might vary from pink to almost bluish
depending on the degree of blood oxygenation. This phenomenon occurs when
oxygen-rich blood absorbs less red light and more blue light than deoxygenated
blood.
Unlike the hemoglobin spectrum in the visible wavelengths, Figure 9 shows
that the NIR spectrum is fairly broad and lacks sharply defined peaks, depending on
whether the heme group is carrying an oxygen molecule or not (Rendell, et al., 2003).
The difference in the NIR absorption spectra of HbO2 and Hb constitutes the basis for
the noninvasive determination of the relative concentrations of HbO2 and Hb using
spectroscopic measurements of the NIR reflectance of skin. The point of equal light
absorbance, the isobestic point of hemoglobin, is at approximately 810 nm. At
wavelengths above this point, HbO2 has greater light absorption. Therefore, by
selecting wavelengths within the NIR range, one can determine the relative
contribution of HbO2 and Hb to total light absorbance. In vivo NIR spectroscopic
imaging provides an opportunity to examine spatial and temporal variability in
cutaneous oxygenation.
Single wavelengths have been used to determine the oxygen saturation of
hemoglobin in tissue (Dawson, et al., 1980; Egley, et al., 1987; Ono, et al., 1991;
Takatani and Ling, 1994). Light at the wavelengths 805 and 660 nm was used by
other researchers to take optimum advantage of differences in the absorption
characteristics of HbO2 and Hb. The oxygen saturation level was related to a ratio of
the reflectance at the two wavelengths (Polanyi and Hehir, 1962). The fact that HbO2

35
and Hb absorbed light equally at 800 nm, whereas at 760 nm absorption was
primarily from Hb has also been used (Mancini, et al., 1994). Therefore, monitoring
these two wavelengths provided an index of deoxygenation.
Figure 9. Oxygenated hemoglobin (red plus) and deoxygenated hemoglobin (blue circle) absorption curves.

36
Chapter 4: Quantitative Assessment of Tumor Vasculature and Response to Therapy in Kaposi’s Sarcoma Using Functional Noninvasive Imaging
4.1 Introduction
It is now well recognized that new vessel formation is an essential component
in tumorigenesis, and there is currently a substantial interest in developing therapies
to treat cancer through inhibition of this process (Carmeliet and Jain, 2000; Folkman,
2002). To monitor such therapy, it is desirable to establish techniques to assess tumor
vasculature and changes with therapy (McDonald and Choyke, 2003). Several
imaging techniques such as dynamic contrast-enhanced magnetic resonance (MR)
imaging (Taylor, et al., 1999; Verstraete, et al., 1994), positron emission tomography
(PET) (Fredriksson and Stone-Elander, 2003; Jerusalem, et al., 2002), computed
tomography (CT) (Hopper, et al., 2000; Rockoff, 1977), color Doppler ultrasound
(US) (Ferrara, et al., 2000; Goertz, et al., 2000), and fluorescence imaging (Gill, et al.,
2003; Svanberg, et al., 1998) have been used in angiogenesis-related research.
However, techniques that measure such phenomena can be invasive, expensive,
and/or require the application of the probe directly onto the tissue being studied.
There are currently no standard noninvasive techniques to assess parameters of
angiogenesis in lesions of interest or monitor changes in these parameters with
therapy. This chapter describes the use of thermography and LDI to monitor KS
patients undergoing an experimental anti-KS therapy.

37
4.2 Materials and Methods
4.2.1 Individuals With Kaposi’s Sarcoma
The patients in this study all had biopsy-proven acquired immunodeficiency
syndrome (AIDS)-associated KS with easily accessible cutaneous lesions. Sixteen
male patients, 21 to 45 years of age, who had not received a specific KS therapy
during the previous three weeks were studied. Ten patients had imaging studies done
at entry and week 18 as part of a treatment protocol for the study of liposomal
doxorubicin and interleukin-12 (IL-12) (Little, et al., 2003). All of the patients were
receiving highly active anti-retroviral therapy (HAART) at the time of the study.
Protocols for the study of these patients were approved by the Institutional Review
Boards of the National Cancer Institute (NCI) and the University of Maryland and
written informed consent was obtained from all patients. Relevant clinical
information including the therapeutic regimens, overall response to therapy, and
lesion measurements were extracted from the clinical and treatment protocol records.
4.2.2 Experimental Therapy and Clinical Assessment
Ten patients were studied at entry onto a treatment protocol of IL-12 and
liposomal doxorubicin and after 18 weeks of therapy (Little, et al., 2003). The
treatment regimen and preliminary clinical data for this experimental regimen have
been previously described (Little, et al., 2000). Patients entered onto this study all had
advanced KS, and during the first 18 weeks of therapy, they were administered
liposomal doxorubicin, 20 mg/m2 by intravenous bolus every three weeks plus IL-12,
300 ng/kg by subcutaneous injection twice weekly. After this induction phase, the

88
)()()(700
400λλλ
λ
PzRkZ c∑=
= (30)
where
)()(
100700
400
λλλ
Pyk
∑=
= (31)
and x(λ), y(λ), and z(λ) are the color-matching functions for the CIE 1931 2o standard
observer. The function P(λ) describes the CIE D50 standard illuminant. The XYZ
values were then transformed in the sRGB (standard computer monitor RGB values,
IEC 61966-2-1) using the MATLAB OptProp toolbox (by Wagberg Jerker, More
Research & DPC, Sweden).
Figure 25. Reflectance spectra (Rc(λ)) for the numerical skin phantom (upper panel) and typical human skin (lower panel). The two sets of data (black and red dots) for real human skin were obtained from the literature (Lualdi, et al., 2001; Marchesini and Carrara, 2007). Bars represent the standard deviation. The two boxes to the right represent the skin color obtained by computing the tristimulus values from the reflectance spectra (black dot data) over the standard 400-700 nm range. The computer cluster time utilized to obtain the skin phantom Rc(λ) data was 649 hours.

89
It is common to compare Rc(λ) values and skin color for the phantom and real
human skin (Urso, et al., 2007). Figure 25 shows a typical in vivo reflectance spectra
on the bottom left. The variation of Rc(λ) may be large for humans (Edwards and
Duntley, 1939), but for this study it was enough that the numerical phantom
represented the average of that curve. To check the results, two mean spectra of
Caucasian subjects were obtained from previous work (Lualdi, et al., 2001;
Marchesini and Carrara, 2007; Tomatis, et al., 2005) (black data is 260 measurements
and red data is 1391 measurements). Both datasets were obtained during typical
clinical pigmented skin lesion detection. Figure 25 shows that the skin color of the
previous work and our phantom are very similar and the phantom Rc(λ) values
reasonably represent the previous work. Only the first set of data was used to
calculate skin color. It is interesting to observe that even though the Rc(λ)
measurement techniques weren’t the same, the two sets of data were quite similar.
For both sets, the female/male ratio was nearly 3:2 and Rc(λ) data were obtained 60%
at trunk level, 35% on the legs, and 5% on head and neck, taking into account the
extreme large inter- and intra-subject variability found in humans even if they belong
to the same race (Edwards and Duntley, 1939).
It is interesting to note that the Vmel values (2%) and the )(λμ mela spectrum
utilized in the present phantom were roughly estimated by Jacques
(http://omlc.ogi.edu/, Jacques and McAuliffe 1991) to represent a light-skinned adult.
It appears from the estimated color that this value reproduces as a more moderately
pigmented adult, but considering the large variability of Vmel values (up to one order

90
of magnitude difference) and the difficulty to measure )(λμ mela , the estimation made
by Jacques was not far from reality and gives very reasonable results.
Even if the present phantom appears to be a suitable tool allowing one to
study photon propagation in skin and the process of multi-spectral image generation,
it must be noted that for more sophisticated simulations, more precise optical
parameters should be used. For example, n values for biological tissue have a
tendency to decrease with increasing wavelength (Bolin, et al., 1989; Friebel and
Meinke, 2005). Taking into account this property would certainly improve the quality
of the simulated Rc(λ); but unfortunately, to our knowledge, these values have not yet
been measured for the investigated human tissues.
6.4.2 3D Information Contained in One Detection Pixel
Figure 26 represents the number of photon packets (weights) that visited a
given pixel before reaching the detector (expressed as a percentage of the number
(weights) of packets reaching the detector):
ectzyx
zyx NiiiN
iiiN det% ),,(
100),,(λ
λλ = (32)
The values ),,(%zyx iiiNλ represent a 3D matrix and Figure 26 shows a mean of three
(x,z)-slices (i.e. three consecutive iy values; see equation 26 for the conversion from ix,
iy, and iz to x, y, and z) giving a total slice thickness of 750 µm centered at y=25 mm
(i.e. (x,z)-plane passing at the center of the detection pixel). Because a photon packet
may visit the same voxel many times before reaching the detector, ),,(%zyx iiiNλ may
have values larger than 100%. The different panels appearing in Figure 26 correspond
to the different wavelengths investigated in the simulations. For increased clarity, the

91
),,(%zyx iiiNλ values were plotted on a logarithmic scale to allow simultaneous
viewing of the few pixels that have very high percentage values (near the detector)
and the majority of the pixels that have low values. Pixels with zero or very low
),,(%zyx iiiNλ <0.1% values (threshold) are shown in black. The two horizontal white
lines define the upper and lower limits of the dermis (all dermal layers were
included). From Figure 26, it appears that the volume visited by the photons doesn’t
seem to strongly depend on wavelength.
Figure 26. Percentage of photons that visit a given pixel at position (x,z) and that reach the detection pixel centered at x=0. The image represents an (x,z) cut of the phantom for y=0. The computer cluster time utilized to obtain the data appearing in the figure was 288 hours.
Moreover, 2 mm seems to be the limit of photon penetration for this
theoretical instrumental setup – the photons mainly remain in the epidermis and
dermis. It is interesting to notice that the voxels visited by the majority of the photons

92
appear to be situated vertically and symmetrically under the detection pixel. In
practice, this means that an image formed at the skin surface should mainly carry
information about the tissue situated directly under each pixel. Knowing that the
information contained in the detection pixel mainly comes from tissue situated under
its position, it is interesting to investigate the extension covered by the photons in the
(x,y)-plane (at a fixed depth z).
Figure 27 shows an (x,y)-plane representing the ),,(%zyx iiiNλ data for z≈375
µm (i.e. 375 µm under the skin surface), for the different λ values (position (x,y) =
(25,25) mm is the center of the detector pixel). In this case the plane is a mean of
three slices giving a total slice thickness of 60 µm. Similar figures are found if the
depth is varied (only the disk size changes).
Figure 27. Percentage of photons that visit a given pixel at position (x,y) and z≈375 µm and that reach the detection pixel centered at (x,y)=(0,0). The image represents a (x,y) cut of the volume visited by the photons.

93
To better quantify the previous observations, two facts must be realized: the
problem has a clear cylindrical symmetry and it appears that the highest ),,(%zyx iiiNλ
values are at the center (along the z axis) and they decrease when moving away from
this position for any fixed z value. This means that if one chooses on an (x,y)-plane a
set of ),,(%zyx iiiNλ smaller than a given max value, one theoretically defines a disk
(surface). This disk is obviously noisy; however, it is easy to estimate its surface and
its mean radius. This radius defines the region (rotation of the radius around the
axis) where the ),,(%zyx iiiNλ <max values are situated, for a given z depth, under the
skin surface. If we repeat the operation for all possible slices, an idea of the volume
(rotation volume) visited by a percent of photon packets ),,(%zyx iiiNλ <max can be
obtained. In practice, the mean surface at a given depth, z, (and a given λ) is obtained
by:
∑<
ΔΔ=max),,(
0max
%
)(zyx iiiN
yxzsλ
λ (33)
and the mean radius is expressed as:
2/1max )()( ⎟⎟
⎠
⎞⎜⎜⎝
⎛=
πλ zs
zrmean (34)
These equations allow Figure 28 to be obtained from the ),,(%zyx iiiNλ data. It
clearly appears that the skin region visited by the highest percentage of photon
packets is situated near the surface (black color). At a depth lower than 1 mm, the
),,(%zyx iiiNλ values drastically decrease less than 5%. It is also interesting to note
that the dermis/hypodermis interface (green line situated at ~2 mm) appears to be a
photon barrier. In other words, if a pathological inclusion is located in the fat layer, it

94
will probably not be seen by the spectral imager. The differences due to wavelength
are not very large. By rotating the different figures around the z axis, the mean
volume visited by the photon could be obtained (i.e. the volume seen by the detection
pixel).
Figure 28. Percentage of photons that visit a given pixel at position (x,z) and that reach the detection pixel centered at x=0. The difference from Figure 26 is that in this case the regions defining the percentages are mean values obtained by exploiting the cylindrical symmetry of the problem. The interface created by the dermis and fat layers seems to act as a kind of firewall and causes a sudden decrease in the detected photons having visited the tissue beyond this depth.
The most exciting result in this simulated experiment is the fact that the
information collected by a general pixel, positioned at the skin surface (i.e. detected
by a CCD in a real spectral imager), mainly comes from a tissue region of interest
that is situated just vertically under the pixel itself. In fact, this is not a trivial result,
because as it is well known, in the case of a unique pair (point source, detection

95
pixel), the information comes from a banana-shaped region joining the source and
detector and going to a depth that is approximately half the distance between the two
points (Gandjbakhche and Weiss, 2000). In the present case, one has the equivalent of
one detection pixel and an infinite number of point-like sources distributed over a
disk centered on this pixel (configuration of Figures 24A and C). This means that one
expects the detector to collect the information of an infinite number of banana-shaped
trajectories where the origins (light sources) may also be situated very far from the
detector (i.e. the borders of the disk, Figure 24A) and thus outside the vertical (z axis)
of this pixel. In practice, this would create completely useless images. Fortunately,
the present results show that the information coming far from the detection pixel is
completely negligible and that the majority of the photons visit a region situated
vertically just under the pixel.
6.4.3 Detection of Pathological Inclusion
Figure 29 reproduces the images of the phantom obtained with the virtual
spectral imager with a 10x10x0.5 mm inclusion located 20 µm under the skin surface.
The inclusion is perfectly visible at all wavelengths and appears to be the correct size.
However, it must be noted that even if the hemoglobin content is higher in the
inclusion compared to the background tissue, its intensity on the image is not
decreased (i.e. higher light absorption), but is instead increased. The different
contrasts between the background tissue and the inclusion show wavelength
dependence in the images. This may be explained by the fact that the increased
volume fraction of hemoglobin is compensated by an equal decrease in volume of
melanosomes. In fact, the inclusion is situated just under the stratum corneum and its
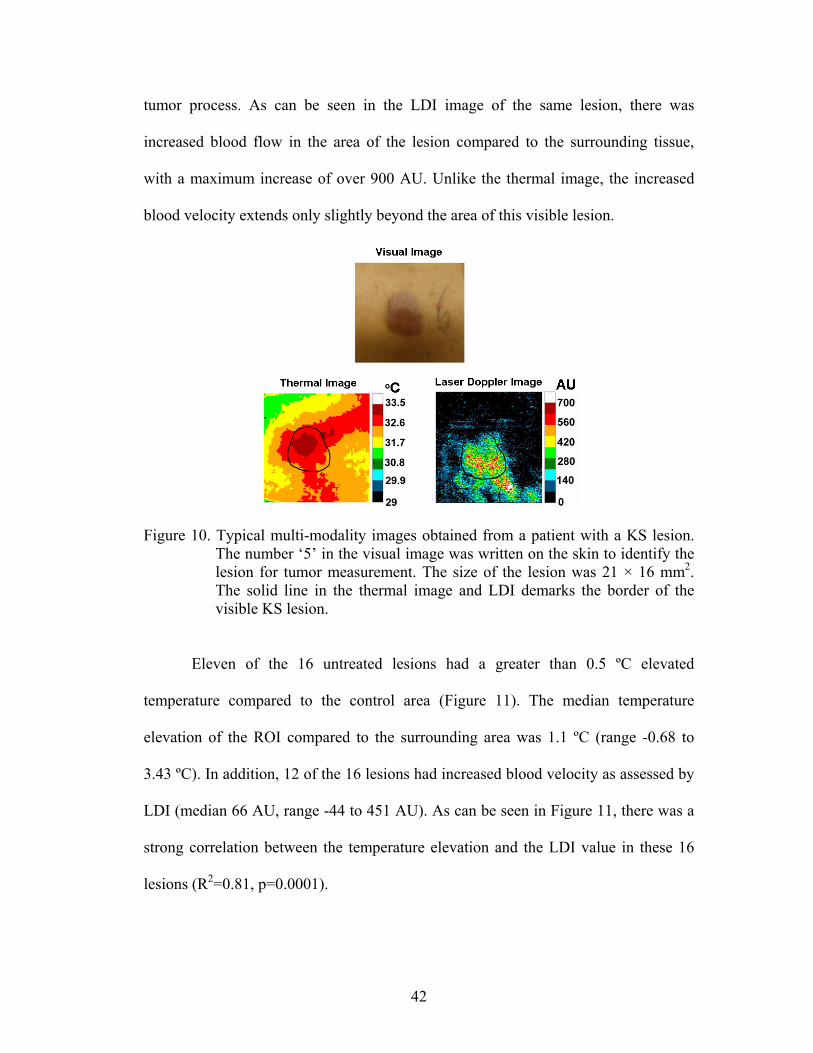
96
thickness of 0.5 mm on top of the epidermis where the melanin is present.
Hemoglobin has µa values lower than melanosomes and thus fewer photons are
absorbed. As a consequence, more photons can reach the detector and increase the
intensity of the image.
Figure 29. Images obtained at different wavelengths (λ) for a skin phantom containing an inclusion of 10x10x0.5 mm situated 20 µm under the skin surface (just under the stratum corneum). The computer cluster time utilized to obtain these data was 181 hours.
It is clear from Figure 30 that the contrast is lower (inclusion is less visible)
for the inclusion at a depth of 520 µm. The two curves appearing on the same graph
(circles and squares symbols) show that the image contrast (i.e. the percent of red
surface compared to the brown on the bar graph) decreases for increasing wavelength
for the 20 µm depth inclusion; however, it slightly increases for the inclusion at a
depth of 520 µm. The 20 µm depth case may be explained because )(λμ mela is larger
for short wavelengths and monotonically decreases with increasing wavelength and

97
thus also the effect of the contrast is lower at longer wavelengths. At the 520 µm
depth, the inclusion cannot replace melanin because it is outside the epidermal region,
and thus the effect may be due to the combined increase in hemoglobin and decrease
in water, but in this case the intuitive interpretation is more difficult. The important
conclusion here, is that one must be careful when interpreting spectral images
because the same change in chromophore content may generate a completely
different behavior on the image contrast depending on the type of tissue (layer) and
where the change is situated (this is added to the influence of the depth).
To evaluate the change in image contrast occurring between the inclusion and
the skin when varying wavelength and inclusion depth, the mean pixel intensities,
ectN detλ , of these two regions were calculated. These values were obtained for the two
phantom configurations (inclusions at depths of 20 and 520 µm). Figure 30 shows the
computed ectN detλ values as a function of wavelength and depth. The pixels were
obviously chosen in the inclusion/skin zones where the values were constant. Note
that the skin ectN detλ value does not change when varying the inclusion depth. To
facilitate the analysis in Figure 30, the percent difference in intensity between the skin
background and the inclusion, ectN detλΔ , was calculated with the skin utilized as a
reference (100%):
)()()(
100 det
detdetdet
skinNinclusionNskinN
N ect
ectectect
λ
λλλ Δ
Δ−Δ=Δ (35)
In the case of the phantom with an inclusion at a depth of 20 µm, ectN detλΔ decreased
with increasing wavelength, while it slightly increased in the case of the inclusion at a
depth of 520 µm. The constraints imposed by the definition of the model must still be

98
considered. In fact, it is easy to deduce that the parameters Vblood, Vwater, and γ must
satisfy the following inequality:
blood
bloodwaterwater V
VVV
γγ
−−
=≥1
)1(min (36)
The chosen Vblood values utilized for this experiment were compatible with this
equation.
Figure 30. The stacked bars at 20 μm (and at different wavelengths) are derived from the data appearing in Figure 29 and correspond to the mean number of photons packets, ectN det
λ , reaching a pixel situated in the region where the inclusion is visible (red) and to the same quantity but for a pixel over the skin (brown, lower values). The same representation is made for the same inclusion located at a depth of 520 μm. The circles and the squares represent percentage differences between the intensities, ectN det
λΔ , of the skin and of the inclusion, for the 20 and 520 μm configurations (percent derived from the bar plots data). This gives an idea of the change in the image contrast of the inclusion compared to the skin when changing wavelength and inclusion depth.
The findings remain true in general for ]1000,600[∈λ , but in the case of real
skin tissue it is probably necessary to take into account other phenomena. In fact, in

99
the present model the µs’ values of the different layers remained fixed, with or
without an inclusion (with the exception of )(λμ hypodermiss′ ). However, a change in
hemoglobin content will also probably vary µs’ (Friebel, et al., 2006), but this is a
very difficult measurement to assess experimentally and further studies are necessary.
6.4.4 Optical Skin Phantom
The optical phantom representing human skin allowed us to perform the
necessary simulations, but a few things should be considered for future finer analyses.
First, it was sufficient in the present work to consider a simple layered structure (with
and without an inclusion). However, to be more realistic or personalize the phantom
for a given subject, 3D images obtained by noninvasive techniques such as optical
coherence tomography (OCT), microscopy, magnetic resonance imaging (MRI), or
by invasive, but more precise, direct morphological analyses of biopsies (Pfefer, et
al., 1999) could improve the results. Some researchers have also tried to take into
account the influence of rough surfaces on photon propagation (e.g. epidermal ridges)
(Meglinsky and Matcher, 2001). However, in this case it becomes very difficult to
describe this geometry by a simple 3D matrix representation because computational
artifacts due to boundary voxelization may occur. In some extreme cases, where the
reflectance must be evaluated with precision, the presence of hair should also be
considered (Poirier, 2003). From the above considerations, it appears that combining
these morphological, physiological, and optical constraints into one unique code
becomes a real technical undertaking that could be tremendously demanding on CPU
time. However, this may certainly prove to be interesting future work.

100
Taking into account even the small morphological features certainly improves
the model, but in this case it becomes necessary to know the related optical
parameters of each defined tissue structure. Unfortunately, g, n, µa, and µs’ values for
human skin are scarcely reported and often only reported as mean values of mixed
morphological structures. This is one reason why the epidermis has been reported as a
unique mean layer in the Meglinski and Matcher model, whereas the real
morphological substructure does not appear this way.
In this same context, one must also note that g and n should depend on
wavelength but they are usually inserted in the biological human models as constant
parameters due to the poor knowledge of their in vivo values (see Table 6). The same
problem may be mentioned for µs’; however, in the present work, it was possible to
consider the wavelength dependence in the case of the hypodermis because of the
work completed by Bashkatov, et al. (2005).
More information is available regarding the absorption parameters, µa,
because they represent pure chromophores that can be more easily studied in vitro.
However, among the µa utilized for the skin phantom, one of them still remains
problematic to determine, )(λμ mela . There are many reasons why, but two in
particular. The most obvious is due to the very large range of skin melanin
concentrations found in humans (up to one order of magnitude differences). This is
not only due to obvious racial differences, but also to inter-individual variations such
as anatomical position (Edwards and Duntley, 1939), use of drugs, chemicals, the
hormonal status of the subject (Costin and Hearing, 2007), aging (Ünver, et al.,
2006), etc. The second reason is the fact that melanin is not freely distributed in the
101
tissue cells, but is instead tightly packed inside small vesicles called melanosomes
(Hach, et al., 1993) and their quantification is difficult. Thus, from the physiological
point of view, the skin melanin content (related to )(λμ mela ), depends on two
intimately interconnected factors: skin concentration of melanosomes and the melanin
content of the melanosomes. The melanin/melanosome couple form an interconnected
system regulated by complex biochemical mechanisms (Hearing, 2005). To take that
into account, even in a very simplified manner and to create a more realistic and
flexible phantom, the melanosome tissue fraction, Vmel, was introduced as a
parameter. The problem was then to define )(λμ mela because it was not clear if the
free melanin had the same optical properties as the packet molecules inside the
melanosomes. For this reason, )(λμ mela was considered a single melanosome instead
of a melanin molecule. This approach was originally proposed in experiments by
Jacques and McAuliffe (1991) and given a )(λμ mela value that holds for a typical
melanosome and thus does not take into account the possible physiological changes
of melanin content inside the melanosome (Borovansky, et al., 1991). The advantage
is that it expresses )(λμ mela of the packed melanin and thus, theoretically, it directly
takes into account the possible optical changes due to the influence of the spatially
confined nature of the molecule. The use of a typical )(λμ mela parameter is also
compatible with the fact that one tries to define a mean optical skin phantom. In this
case it would be completely useless to use a different )(λμ mela for every subject.
However, the use of the )(λμ mela melanosome value (Jacques and McAuliffe, 1991)
has the drawback that it does not allow one to make the distinction between

102
eumelanins and phaeomelanins. Thus, for the present work, melanosome distribution
was considered to be only uniformly distributed in the living epidermis and no finer
representations were attempted, but could be (for example the case of senile lentigo
where some melanin is observed also in the dermis (Ünver, et al., 2006)). Other
chromophores present in the skin, such as β-carotene or bilirubin, were not
considered, but should be for other applications such as the simulation of skin color in
the case of jaundice, etc. (Krishnaswamy and Baranosky, 2004).
6.5 Conclusions
The present work has shown that the optical/biological information contained
in a typical spectral image mainly reflects the properties of a small (conic like)
volume of tissue situated vertically under each individual pixel. The consequence of
this observation is that the objects appearing on the spectral images reasonably
reproduce the correct geometrical shapes and size (like a non-deformed shadow) of
underlying inclusions of pathological tissue. The negative consequence of this light
propagation behavior is that the photons reaching the detectors (pixels) do not go very
deep and thus the information contained in the spectral images comes from a depth
that does not exceed ~2-3 mm. The number of photons that visit a given tissue voxel
situated at a depth larger than approximately 2 mm represent less than the 1% of the
total number of photons reaching the corresponding detection pixel (forming the
image). The situation is even worse if one thinks that a photon can visit a voxel many
times and thus some voxels may have a percent of visits that is higher than 100%.
This means that in practice the 1% value just given above is certainly smaller in terms
of the contribution to the electrical signal generated by the detector of a real spectral

103
imager. This way to represent the percentages has not been reported in the figures
because it’s more complex to understand. The interface defined by the
dermis/hypodermis layers seems to behave as a partial firewall for the photons,
making their access to deep skin regions difficult.
It has also been shown that a pathological inclusion (increased blood pool)
situated at a depth of 520 µm with a thickness of 0.5 mm produces an image intensity
contrast of ~5% (for λ=600 nm) when compared to the normal skin background
(100%). Considering that the contrast for the same inclusion situated at a depth of 20
µm is ~55% (for λ=600 nm), this means that at a depth of 1 mm, this inclusion will be
very difficult to detect with the imager at least for λ ∈ [600,1000].
This highlights the fact that the image contrast strongly depends on the type of
chromophore contained in the inclusion and that an increase of the concentration of a
given molecule may produce different contrasts depending on the skin layer where
this change occurs. This observation demonstrates that a simple interpretation of the
images is very difficult. However, the relatively similar region spanned by the
photons at different λ (not absolute intensity values but percentages, e.g. Figure 28)
should permit others to develop suitable algorithms that allow them to mathematically
extract the desired biological information.
The present study also shows that it is absolutely necessary to improve our
knowledge of human tissue optical parameters by means of experimental
measurements in order to realize reliable and more precise phantoms allowing
researchers to test and develop new instrumentation and algorithms. With the present
knowledge, the phantom proposed in the present work is unfortunately not too far

104
from their maximum capabilities (in terms of optical parameters) and better models
are needed.
It may also be interesting to note that the results found for the spectral imager
model may also be useful for other domains. In fact, recent developments in laser
Doppler flowmetry for human skin use very similar illumination and detection
techniques (Briers, 2001). The present results may also give some useful information
concerning the interpretation of the laser Doppler signals.

105
Chapter 7: Conclusions
The overall objectives of this research described in Chapter 2 have been achieved.
The following conclusions were drawn from the research:
1. Thermography showed statistically significant changes in the temperature
difference between the lesion and surrounding skin before and after
experimental therapy. LDI analysis showed there was a statistically
significant change in blood flow in the lesion and surrounding skin after
experimental therapy.
2. NIR multi-spectral imaging was able to show changes in HbO2 and blood
volume between the lesion and surrounding areas. The results after
experimental therapy correlated well with the clinical assessment, but
added quantitative information.
3. Monte-Carlo simulations showed that the optical/biological information
contained in a typical spectral image mainly reflects the properties of a
small (conic like) volume of tissue situated vertically under each
individual pixel. The photons reaching the detectors (pixels) do not go
very deep and thus the information contained in the spectral images comes
from a depth that does not exceed ~2-3 mm.
Thermography, LDI, and multi-spectral imaging techniques can be used as
quantitative methods to assess the response of skin to experimental therapies.
Ultimately, these quantitative imaging methods can be applied to other tumors or
lesions involving the skin or other easily accessible tissues.
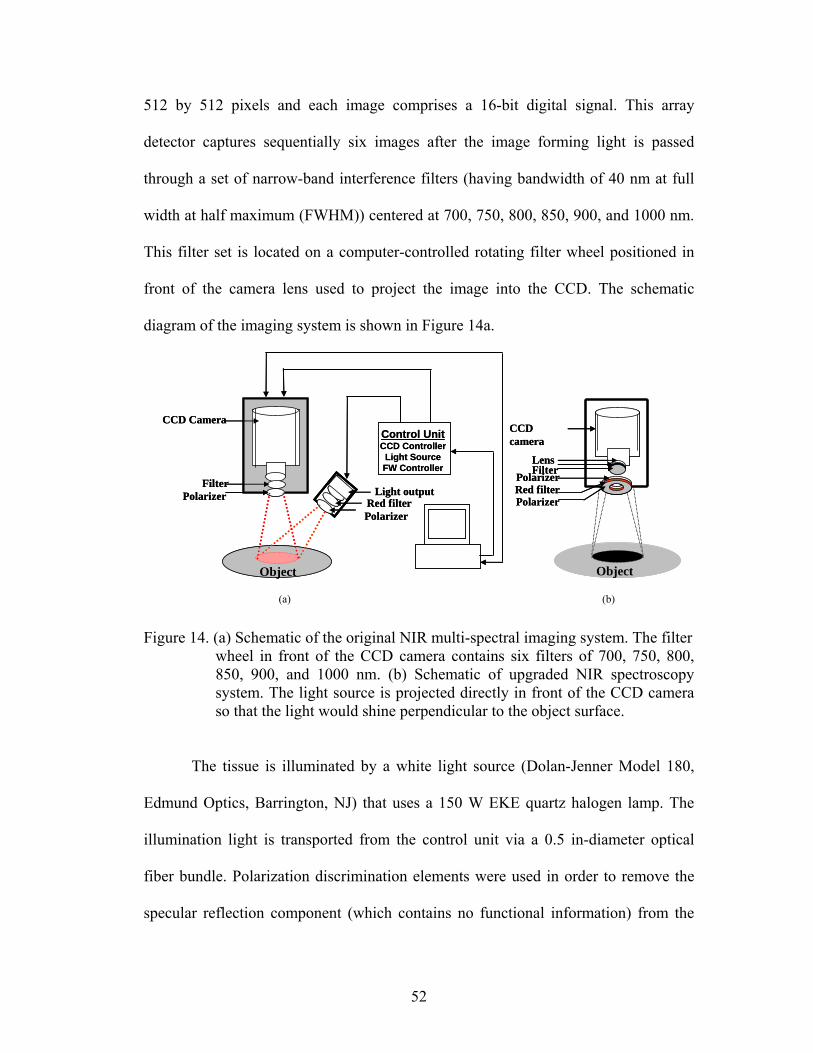
106
Chapter 8: Suggestions for Further Study
Images from thermography, LDI, and NIR multi-spectral imaging are
quantitative, easy to collect, and appear to be very sensitive in assessing progress of
KS lesions upon administration of therapy. Based on the data in this dissertation, one
or more of these techniques (probably a combination of them) will have utility in
monitoring the vascular abnormalities in KS lesions and the changes with therapies.
However, there are improvements that can be made to move these promising
techniques to the bedside. Suggestions for further study include:
1. Continuing to collect images from the NIH clinical protocols using the three
imaging techniques. Collecting additional images will allow analyses of
response to treatment to be conducted for later dates (such as 46 week follow-
ups).
2. Improving knowledge of human tissue optical parameters by conducting
experimental measurements that will help create reliable and more precise
phantoms allowing researchers to test and develop new instrumentation and
algorithms.
3. Developing an additional algorithm to remove the hair from the multi-
spectral images and improving the curvature removal algorithm.
4. Expanding the multi-spectral mathematical optical skin model to include the
contributions from water and lipids (fat), thus allowing the longer
wavelengths to be utilized and additional parameters to be solved for.
5. Utilizing a digital wavelength tuner so that any wavelength can be
considered, not just the six pre-selected filters.

107
6. Designing and constructing an integrated system with all three imaging
modalities in one portable system to assess tumor vascularity quantitatively at
the patient’s bedside. Currently, each imager requires floor space and a
computer and takes images separately. The angle of image capture is different
for each system; however, in the new system, image registration can be
included in the system hardware so that time will not be needed to do image
registration. Moreover, patients do not want to sit still while we take images
with the thermography system, move it away, take images with the LDI,
move it away, and then take images with the multi-spectral imager. The time
to take these measurements can be much shorter if the images can be captured
at the same time; this should be possible if all three imagers are on the same
cart and are controlled by the same computer.
7. Exploring angiogenic parameters in other tumors and conditions using the
three imaging techniques.

108
Bibliography
Anbar, M. 1998. Clinical thermal imaging today. IEEE Eng Med Biol Mag, 17:25-33. Andersen, P. and P. Bjerring. 1990. Noninvasive computerized analysis of skin chromophores in vivo by reflectance spectroscopy. Photodermatol Photoimmunol Photomed, 7:249-257. Anderson, R. R. and J. Parrish. 1981. The Optics of Human Skin. J Investigative Dermatology, 77:13-19. Angelopoulou, E. 2001. Understanding the Color of Human Skin. In Proceedings of the SPIE Conference on Human Vision and Electronic Imaging VI, 243-251. Antman, K. and Y. Chang. 2000. Kaposi's sarcoma. New Engl J Med, 342:1027-1038. Archambeau, J. O., A. Ines, and L. F. Fajardo. 1985. Correlation of the Dermal Microvasculature Morphology with the Epidermal and the Endothelial Population Changes Produced by Single X Ray Fractions of 1649, 2231 and 2619 rad in Swine. Int J Radiat Oncology Biol Phys, 11:1639-1646. Archambeau, J. O., R. Pezner, and T. Wasserman. 1995. Pathophysiology of Irradiated Skin and Breast. Int J Radiat Oncology Biol Phys, 31:1171-1185. Arnfield, M. R., J. Tulip, and M. S. McPhee. 1988. Optical propogation in tissue with anisotropic scattering. IEEE Trans Biomed Eng, 35:372-381. Attas, M., M. Hewko, J. Payette, T. Posthumus, M. Sowa, and H. Mantsch. 2001. Visualization of cutaneous hemoglobin oxygenation and skin hydration using near-infrared spectroscopic imaging. Skin Research and Technology, 7:238-245. Bais, C., B. Santomasso, O. Coso, L. Arvanitakis, E. G. Raaka, J. S. Gutkind, A. S. Asch, E. Cesarman, M. C. Gershengorn, E. A. Mesri, and M. C. Gerhengorn. 1998. G-protein-coupled receptor of Kaposi's sarcoma-associated herpesvirus is a viral oncogene and angiogenesis activator. Nature, 391:86-89. Bashkatov, A., E. Genina, V. Kochubey, and V. Tuchin. 2005. Optical properties of human skin, subcutaneous and mucous tissues in the wavelength range from 400 to 2000 nm. J Phys D: Appl Phys, 38 2543-2555. Beral, V., T. A. Peterman, R. L. Berkelman, and H. W. Jaffe. 1990. Kaposi's sarcoma among persons with AIDS: a sexually transmitted infection? Lancet, 335:123-128.

109
Bolin, F., L. Preuss, R. Taylor, and R. Ference. 1989. Refractive index of some mammalian tissues using a fiber optic cladding method J Appl Opt, 28:2297-2303. Bornmyr, S., H. Svensson, B. Lilja, and G. Sundkvist. 1997. Skin temperature changes and changes in skin blood flow monitored with laser Doppler flowmetry and imaging: a methodological study in normal humans. Clin Physiol, 17:71-81. Borovansky, J., E. Vedralova, and P. Hach. 1991. An estimate of melanosome concentration in pigment tissues Pigment Cell Res, 4:222-224. Boshoff, C., Y. Endo, P. D. Collins, Y. Takeuchi, J. D. Reeves, V. L. Schweickart, M. A. Siani, T. Sasaki, T. J. Williams, P. W. Gray, P. S. Moore, Y. Chang, and R. A. Weiss. 1997. Angiogenic and HIV-inhibitory functions of KSHV-encoded chemokines. Science, 278:290-294. Briers, D. 2001. Laser Doppler, speckle and related techniques for blood perfusion mapping and imaging Physiol Meas, 22 R35-R66. Bruls, W. A. and J. C. van der Leun. 1984. Forward Scattering Properties of Human Epidermal Layers. Photochem Photobiol, 40:231-242. Canvin, J. M. G., S. Bernatsky, C. A. Hitchon, M. Jackson, M. G. Sowa, J. R. Mansfield, H. H. Eysel, H. H. Mantsch, and H. S. El-Gabalawy. 2003. Infrared spectroscopy: shedding light on synovitis in patients with rheumatoid arthritis. Rheumatology, 42:76-82. Carmeliet, P. and R. K. Jain. 2000. Angiogenesis in cancer and other diseases. Nature, 407:249-257. Chang, Y., E. Cesarman, M. S. Pessin, F. Lee, J. Culpepper, D. M. Knowles, and P. S. Moore. 1994. Identification of herpesvirus-like DNA sequences in AIDS-associated Kaposi's sarcoma. Science, 266:1865-1869. Colier, W., I. Meeuwsen, H. Degens, and B. Oeseburg. 1995. Determination of oxygen consumption in muscle during exercise using near infrared spectroscopy. Acta Anaesthesiol Scand, 1995:151-155. Comerota, A., R. Throm, P. Kelly, and M. Jaff. 2003. Tissue (muscle) oxygen saturation (StO2): a new measure of symptomatic lower-extremity aterial disease. J Vasc Surg, 38:724-729. Conover, D. L., B. M. Fenton, T. H. Foster, and E. L. Hull. 2000. An evaluation of near infrared spectroscopy and cryospectrophotometry estimates of haemoglobin oxygen saturation in a rodent mammary tumour model. Physics in Medicine & Biology, 45:2685-2700.

110
Costin, G. and V. Hearing. 2007. Human skin pigmentation: melanocytes modulate skin color in response to stress. FASEB J, 21:976-994. Dawson, J., D. Barker, D. Ellis, E. Grassam, J. Cotterill, G. Fisher, and J. Feather. 1980. A theoretical and experimental study of light absorption and scattering by in vivo skin. Phys Med Biol, 25:695-709. Delpy, D. T., M. Cope, P. Vanderzee, S. Arridge, S. Wray, and J. Wyatt. 1988. Estimation of Optical Pathlength through Tissue from Direct Time of Flight Measurement. Physics in Medicine and Biology, 33:1433-1442. Demos, S. and R. Alfano. 1997. Optical Polarization Imaging. Applied Optics, 36:150-155. Douven, L. F. A. and G. W. Lucassen. 2000. Retrieval of optical properties of skin from measurement and modelling the diffuse reflectance. In Laser-Tissue Interaction XI: Photochemical, Photothermal, and Photomechanical, 312-323. Draper, J. and J. Boag. 1971. Skin Temperature Distributions Over Veins and Tumours. Phys Med Biol, 16:645-654. Duck, F. 1990. Physical properties of tissue: a comprehensive reference book. London: Academic Press. Edwards, E. and Q. Duntley. 1939. The pigments and color of living human skin Am J Anat, 65:1-33. Egley, C. C., J. W. Seeds, and R. C. Cefalo. 1987. Single-Probe Spectrophotometry in the Assessment of Fetal Oxygenation. Obstet Gynecol, 70:726-728. Ensoli, B., G. Barillari, and R. C. Gallo. 1992. Cytokines and growth factors in the pathogenesis of AIDS-associated Kaposi's sarcoma. Immunol Rev, 127:147-155. Feather, J., D. Ellis, and G. Leslie. 1988. A portable reflectometer for the rapid quantification of cutaneous haemoglobin and melanin. Phys Med Biol, 33:711-722. Ferguson-Pell, M. and S. Hagisawa. 1995. An empirical technique to compensate for melanin when monitoring skin microcirculation using reflectance spectrophotometry. Med Eng Phys, 17:104-110. Ferrara, K., C. Merritt, and P. Burns. 2000. Evaluation of Tumor Angiogenesis with US: Imaging, Doppler, and Contrast Agents. Acad Radiol, 7:824-839. Firbank, M., M. Oda, and D. T. Delpy. 1995. An improved design for a stable and reproducible material for use in near-infrared spectroscopy and imaging. Phys Med Biol, 40:955-961.

111
FLIR (2002). Thermography. [Online]. Available WWW:http://www.flirthermography.com. Folkman, J. 2002. Role of angiogenesis in tumor growth and metastasis. Semin Oncol, 29:15-18. Fredriksson, A. and S. Stone-Elander. 2003. PET Screening of Anticancer Drugs. A Faster Route to Drug/Target Evaluations In Vivo. Methods Mol Med, 85:279-294. Freeman, R. G., E. G. Cockerell, J. Armstrong, and J. M. Knox. 1962. Sunlight as a factor influencing the thickness of epidermis. J Investigative Dermatology, 39:295-298. Friebel, M. and M. Meinke. 2005. Determination of the complex refractive index of highly concentrated hemoglobin solutions using transmittance and reflectance measurements. J Biomed Opt, 10:064019. Friebel, M., A. Roggan, G. Muller, and M. Meinke. 2006. Determination of optical properties of human blood in the spectral range 250 to 1100 nm using Monte Carlo simulations with hematocrit-dependent effective scattering phase functions. J Biomed Opt, 11:34021. Gandjbakhche, A. H., Weiss, G. H. 1995. Random walk and diffusion-like models of photon migration in turbid media. Progress in Optics, XXXIV:335-402. Gandjbakhche, A. and G. Weiss. 2000. Descriptive parameter for photon trajectories in a turbid medium. Phys Rev, E61:6958-6962. Ge, Z., K. T. Schomacker, and N. S. Nishioka. 1998. Identification of colonic dysplasia and neoplasia by diffuse reflectance spectroscopy and pattern recognition techniques. Appl Spectrosc, 52:833-839. Giannotti, G., S. Cohn, M. Brown, J. Varela, M. McKenny, and J. Wiseberg. 2000. Utility of near-infrared spectroscopy in the diagnosis of lower extremity compartment syndrome. J Trauma, 48:396-401. Gill, E., G. Palmer, and N. Ramanujam. 2003. Steady-state fluorescence imaging of neoplasia. Methods Enzymol, 361:452-481. Goertz, D., D. Christopher, and J. Yu. 2000. High-frequency Color Flow Imaging of the Microcirculation. Ultrasound Med Biol, 26:63-71. Goldzieher, J., I. Roberts, W. Rawls, and M. Goldzieher. 1951. "Chemical" Analysis of the Intact Skin by Reflectance Spectrophotometry. AMA Archives of Dermatology and Syphilology, 64:533-548.

112
Graaff, R., A. C. M. Dassel, W. G. Zijlstra, F. F. M. de Mul, and J. G. Aarnoudse. 1996. How Tissue Optics Influences Reflectance Pulse Oximetry. Oxygen Transport to Tissue XVII. New York: Plenum Press. Hach, P., J. Borovansky, and E. Vedralova. 1993. Melanosome - a sophisticated organelle Sborník Lekarsky, 94:113-123. Hajizadeh-Saffar, M., J. Feather, and J. Dawson. 1990. An investigation of factors affecting the accuracy of in vivo measurements of skin pigments by reflectance spectroscopy. Phys Med Biol, 35:1301-1315. Hassan, M., R. F. Little, A. Vogel, K. Aleman, K. Wyvill, R. Yarchoan, and A. Gandjbakhche. 2004. Quantitative Assessment of Tumor Vasculature and Response to Therapy in Kaposi's Sarcoma Using Functional Noninvasive Imaging. Technology in Cancer Research & Treatment, 3:451-457. Hattery, D., M. Hassan, S. Demos, and A. Gandjbakhche. 2002. Hyperspectral Imaging of Kaposi's Sarcoma for Disease Assessment and Treatment Monitoring. 31st Applied Imagery Pattern Recognition Workshop. Head, J. F. and R. L. Elliott. 2002. Infrared imaging: making progress in fulfilling its medical promise. IEEE Eng Med Biol Mag, 21:80-85. Hearing, V. 2005. Biogenesis of pigment granules: a sensitive way to regulate melanocyte function. J Dermatol Sci, 37:3-14. Henyey, L. and J. Greenstein. 1941. Diffuse radiation in the galaxy. Astrophys J, 93:70-83. Hopewell, J. W. 1990. The skin: its structure and response to ionizing radiation. Int J Radiat Biol, 57:751-773. Hopper, K., K. Singapuri, and A. Finkel. 2000. Body CT and Oncologic Imaging. Radiology, 215:27-40. Ikeda, M. and A. Matsushita. 1980. Reflectance of rat brain structures mapped by an optical fiber technique. J Neurosci Methods, 2:9-17. Jacques, S. and D. McAuliffe. 1991. The melanosome: threshold temperature for explosive vaporization and internal absorption coefficient during pulsed laser irradiation. Photochem Photobiol, 53:769-775. Jacques, S., J. Roman, and K. Lee. 2000. Imaging superficial tissues with polarized light. Lasers in Surgery and Medicine, 26:119-129.

113
Jacques, S. L. 1996. Origins of Tissue Optical Properties in the UVA, Visible, and NIR Regions. In OSA TOPS on Advances in Optical Imaging and Photon Migration, 364-371. Jacques, S. L. (1998). Skin Optics. [Online]. Available WWW:http://omlc.ogi.edu/news/jan98/skinoptics.html. Jain, R. K. 1988. Determinants of tumor blood flow: a review. Cancer Res, 48:2641-2658. Jerusalem, G., R. Hustinx, and Y. Beguin. 2002. The Value of Postron Emission Tomography (PET) Imaging in Disease Staging and Therapy Assessment. Ann Oncol, 13:227-234. Jobsis, F. F. 1977. Noninvasive infrared monitoring of cerebral and myocardial oxygen sufficiency and circulatory parameters. Science, 198:1264. Kelch, C. a. R. J. S. (1998). Infrared Thermography for PPM. [Online]. Available WWW:http://www.mt-online.com/current/05-99amt01.html. Kerker, M. 1969. The Scattering of Light and Other Electromagnetic Radiation. New York: Academic. Kienle, A., L. Lilge, M. S. Patterson, R. Hibst, R. Steiner, and B. C. Wilson. 1996. Spatially resolved absolute diffuse reflectance measurements for noninvasive determination of the optical scattering and absorption coefficients of biological tissue. Appl Opt, 35:2304-2341. Kirkby, D. and D. Delpy. 1997. Parallel operation of Monte Carlo simulations on a diverse network of computers. Phys Med Biol, 42:1203-1208. Knoefel, W. T., N. Kollias, D. W. Rattner, N. S. Nishioka, and A. L. Warshaw. 1996. Reflectance spectroscopy of pancreatic microcirculation. J Appl Physiol, 80:116-123. Kollias, N. 1986. On the assessment of melanin in human skin in vivo. Photochem Photobiol, 43:49-54. Kollias, N. and A. Baqer. 1988. Quantitative assessment of UV-induced pigmentation and erythema. Photodermatol, 5:53-60. Kollias, N., R. Gillies, J. A. Muccini, R. Uyeyama, S. Phillips, and L. Drake. 1995. A single parameter, oxygenated hemoglobin, can be used to quantify experimental irritant-induced inflammation. Journal of Investigative Dermatology, 104:421-424.

114
Kooijman, H. M., M. T. E. Hopman, W. N. J. M. C. colier, J. A. van der Vliet, and B. Oeseburg. 1997. Near Infrared Spectroscopy for Noninvasive Assessment of Claudication. Journal of Surgical Research, 72:1-7. Kragelj, R., T. Jarm, T. Erjavec, M. Presern-Strukelj, and D. Miklavcic. 2001. Parameters of Postocclusive Reactive Hyperemia Measured by Near Infrared Spectroscopy in Patients with Peripheral Vascular Disease and in Healthy Volunteers. Annals of Biomedical Engineering, 29:311-320. Kragelj, R., T. Jarm, and D. Miklavcic. 2000. Reproducibility of Parameters of Postocclusive Reactive Hyperemia Measured by Near Infrared Spectroscopy and Transcutaneous Oximetry. Annals of Biomedical Engineering, 28:168-173. Kragsterman, B., H. Parsson, and D. Bergquist. 2004. Local haemodynamic changes during carotid endarterectomy--the influence on cerebral oxygenation. Eur J Vasc Endovasc Surg, 2004:4. Krishnaswamy, A. and G. Baranosky. 2004. A biophysical-based spectral model of light interaction with human skin. Eurographics, 23:331-340. Krown, S. E., M. A. Testa, and J. Huang. 1997. AIDS-related Kaposi's sarcoma: prospective validation of the AIDS Clinical Trials Group staging classification. AIDS Clinical Trials Group Oncology Committee. J Clin Oncol, 15:3085-3092. Laufer, J., C. Elwell, D. Delpy, and P. Beard. 2005. In vitro measurements of absolute blood oxygen saturation using pulsed near-infrared photoacoustic spectroscopy: accuracy and resolution. Phys Med Biol, 50:4409-4428. Leu, A. J., A. Yanar, J. Jost, U. Hoffmann, U. K. Franzeck, and A. Bollinger. 1994. Microvascular dynamics in normal skin versus skin overlying Kaposi's sarcoma. Microvasc Res, 47:140-144. Levenberg, K. 1944. A Method for the Solution of Certain Non-Linear Problems in Least Squares. Quart Appl Math, 2:164-168. Little, R. F., K. Aleman, F. Merced, K. Wyvill, A. Catanzaro, F. Maldarelli, S. M. Steinberg, and R. Yarchoan. 2003. Doxorubicin and interleukin-12 followed by interleukin-12 maintenance therapy in advanced AIDS-related Kaposi's sarcoma. In 10th Conference on Retroiviruses and Opportunistic Infections, Abstract 816. Boston. Little, R. F., K. M. Wyvill, J. M. Pluda, L. Welles, V. Marshall, W. D. Figg, F. M. Newcomb, G. Tosato, E. Feigal, S. M. Steinberg, D. Whitby, J. J. Goedert, and R. Yarchoan. 2000. Activity of thalidomide in AIDS-related Kaposi's sarcoma. J Clin Oncol, 18:2593-2602.

115
Love, T. J. 1980. Thermography as an indicator of blood perfusion. Ann N Y Acad Sci, 335:429-437. Lualdi, M., A. Colombo, B. Farina, S. Tomatis, and R. Marchesini. 2001. A phantom with tissue-like optical properties in the visible and near infrared for use in photomedicine. Lasers Surg Med, 28:237-243. Lucas, N. S. 1931. The permeability of human epidermis to ultra-violet irradiation. Biochem J, 25:57-70. Mancini, D. M., L. Bolinger, H. Li, K. Kendrick, B. Chance, and J. R. Wilson. 1994. Validation of near-infrared spectroscopy in humans. J Appl Physiol, 77:2740-2747. Mansfield, C., E. Attas, and R. Gall. 2005. Evaluation of static thermal and near-infrared hyperspectral imaging for the diagnosis of acute maxillary rhinosinusitis. J Otolaryngol, 34:99-108. Marchesini, R., M. Brambilla, C. Clemente, M. Maniezzo, A. E. Sichirollo, A. Testori, D. R. Venturoli, and N. Cascinelli. 1991. In vivo spectrophotometric evaluation of neoplastic and non-neoplastic skin pigmented lesions. I. Reflectance measurements. Photochem Photobiol, 53:77-84. Marchesini, R. and M. Carrara. 2007. L’maging spettrofotometrico de lesioni cutanee pigmentate. Alla ricerca non invasiva delle caratteristiche biofisiche di una lesione. hitech dermo, 3:43-50. Marquardt, D. 1963. An Algorithm for Least-Squares Estimation of Nonlinear Parameters. SIAM J Appl Math, 11:431-441. Marsaglia, C. and A. Zaman. 1991. A new class of ramdom number generators. Ann Appl Prob, 4:462-480. Matas, A., M. Sowa, G. Taylor, and H. H. Mantsch. 2002. Melanin as a confounding factor in near infrared spectroscopy of skin. Vibrational Spectroscopy, 28:45-52. Maxwell-Cade, C. 1968. Principles and practice of clinical thermography. Radiography, 34:23-34. McDonald, D. M. and P. L. Choyke. 2003. Imaging of angiogenesis: from microscope to clinic. Nat Med, 9:713-725. Meglinski, I. and S. Matcher. 2002. Quantitative assessment of skin layers absorption and skin reflectance spectra simulation in the visible and near-infrared spectral regions. Physiol Meas, 23:741-753.

116
Meglinski, I. and S. Matcher. 2003. Computer simulation of the skin reflectance spectra. Comput Methods Programs Biomed, 70:179-186. Meglinsky, I. and S. J. Matcher. 2001. Modelling the sampling volume for skin blood oxygenation. Medical & Biological Engineering & Computing, 39:44-49. Mercie, P., I. Devianne, J. F. Viallard, I. Faure, I. Pellegrin, B. Leng, M. Dupon, P. Barbeau, H. Fleury, and J. L. Pellegrin. 1999. Vascular endothelial growth factor (VEGF165) plasma level increase with immunodepression in AIDS patients with Kaposi's sarcoma. Microvasc Res, 57:208-210. Merla, A., L. Di Donato, S. Di Luzio, and G.L. Romani. 2002. Quantifying the Relevance and Stage of Disease with the Tau Image Technique: A Complimentary Diagnostic Imaging Technique Based on Infrared Functional Imaging. IEEE Engineering in Medicine and Biology, 21:86-91. Mille, T., M. Tachimiri, C. Klersy, G. Ticozzelli, G. Bellinzona, and I. Blangetti. 2004. Near infrared spectroscopy monitoring during carotid endarterectomy: which threshold value is critical? Eur J Vasc Endovasc Surg, 27:646-650. Moore, P. S., C. Boshoff, R. A. Weiss, and Y. Chang. 1996. Molecular mimicry of human cytokine and cytokine response pathway genes by KSHV. Science, 274:1739-1744. Mourant, J. R., I. J. Bigio, J. Boyer, R. L. Conn, T. Johnson, and T. Shimada. 1995. Spectroscopic diagnosis of bladder cancer with elastic light scattering. Lasers Surg Med, 17:350-357. Mourant, J. R., I. J. Bigio, J. Boyer, R. L. Conn, T. M. Johnson, and J. Lacey. 1996. Elastic scattering spectroscopy as a diagnostic for differentiating pathologies in the gastrointestinal tract: preliminary testing. J Biomed Opt, 1:192-199. Mourant, J. R., J. P. Freyer, A. H. Hielscher, A. A. Eick, D. Shen, and T. M. Johnson. 1998. Mechanisms of light scattering from biological cells relevant to noninvasive optical-tissue diagnostics. Appl Opt, 37:3586-3593. Ng, C. S.-L. and L. Li. 2001. A Multi-Layered Reflection Model of Natural Human Skin. Computer Graphics International 2001, 249-256. Nielsen, K. P., L. Zhao, P. Juzenas, J. Stamnes, K. Stamnes, and J. Moan. 2004. Reflectance Spectra of Pigmented and Nonpigmented Skin in the UV Spectral Region. Photochem Photobiol, 80 450-455. Nishidate, I., Y. Aizu, and H. Mishina. 2003. Estimation of Absorbing Components in a Local Layer Embedded in the Turbid Media on the Basis of Visible and Near-Infrared (VIS-NIR) Reflectance Spectra. Optical Review, 10:427-435.

117
Odland, G. 1991. Chapter 1 Structure of the skin. In Physiology, biochemistry, and molecular biology of the skin. New York: Oxford Universiy Press. Ono, K., M. Kanda, J. Hiramoto, K. Yotsuya, and N. Sato. 1991. Fiber optic reflectance spectrophotometry system for in vivo tissue diagnosis. Applied Optics, 30:98-105. Payette, J., E. Kohlenberg, L. Leonardi, A. Pabbies, P. Kerr, K.-Z. Liu, and M. G. Sowa. 2005. Assessment of Skin Flaps Using Optically Based Methods for Measuring Blood Flow and Oxygenation. Plastic and Reconstructive Surgery, 115:539-546. Pfefer, T., J. Barton, D. Smithies, T. Milner, J. Nelson, M. van Gemert, and A. Welch. 1999. Modeling laser treatment of port wine stains with a computer-reconstructed biopsy. Lasers Surg Med, 24:151-166. Poirier, G. 2003. Human skin modelling and rendering. PhD. University of Waterloo. Polanyi, M. L. and R. M. Hehir. 1962. In Vivo Oximeter with Fast Dynamic Response. The Review of Scientific Instruments, 33:1050-1054. Prahl, S., M. Keijzer, S. Jacques, and A. Welch. 1989. A Monte Carlo code of light propagation in tissue. Proc SPIE IS, 5:102-111. Rajadhyaksha, M., M. Grossman, D. Esterowitz, R. H. Webb, and R. R. Anderson. 1995. In Vivo Confocal Scanning Laser Microscopy of Human Skin: Melanin Provides Strong Contrast. J Investigative Dermatology, 104:946-952. Reinertson, R. P. and V. R. Wheatley. 1959. Studies on the chemical composition of human epidermal lipids. J Investigative Dermatology, 32:49-59. Rendell, M., E. Anderson, W. Schleuter, J. Mailliard, D. Honigs, and R. Rosenthal. 2003. Determination of hemoglobin levels in the finger using near infrared spectroscopy. Clin Lab Haem, 25:93-97. Rivard, A., J. E. Fabre, M. Silver, D. Chen, T. Murohara, M. Kearney, M. Magner, T. Asahara, and J. M. Isner. 1999. Age-dependent impairment of angiogenesis. Circulation, 99:111-120. Rockoff, S. 1977. The Evolving Role of Computerized Tomography in Radiation Oncology. Cancer, 39:694-696. Roggan, A., M. Friebel, K. Dorschel, A. Hahn, and G. Muller. 1999. Optical properties of circulating human blood in the wavelength range 400-2500 nm. J Biomed Opt, 4:36-46.

118
Ryatt, K., J. Feather, J. Dawson, and J. Cotterill. 1983. The usefulness of reflectance spectrophotometric measurements during psoralens and ultraviolet A therapy for psoriasis. J Amer Acad Derm, 9:558-562. Saidi, I. S. 1992. Transcutaneous optical measurement of hyperbilirubinemia in neonates. PhD. Rice University. Sato, N., T. Kamada, S. Motoaki, K. Sunao, A. Hiroshi, and B. Hagihara. 1979. Measurement of hemoperfusion and oxygen sufficiency in gastric mucosa in vivo. Evidence of mucosal hypoxia as the cause of hemorrhagic shock-induced gastric mucosal lesion in rats. Gastroenterology, 76:814-819. Scheuermann-Freestone, M., P. Madsen, D. Manners, A. Blamire, R. Buckingham, and P. Styles. 2003. Abnormal cardiac and skeletal muscle energy metabolism in patients with type 2 diabetes. Circulation, 107:3040-3046. Schmitt, J. and G. Kumar. 1998. Optical scattering properties of soft tissue: a discrte particle model. Appl Opt, 37:2788-2797. Schmitt, J. M. 1991. Simple photon diffusion analysis of the effects of multiple scattering on pulse oximetry. IEEE Trans Biomed Eng, 38:1194-1203. Shah, N., A. Cerussi, C. Eker, J. Espinoza, J. Butler, J. Fishkin, R. Hornung, and B. Tromberg. 2001. Noninvasive functional optical spectroscopy of human breast tissue. Proc Natl Acad Sci USA, 98:4420-4425. Sinichkin, Y. P., S. P. Uts, and E. Pilipenko. 1996. Spectroscopy of Human Skin in vivo: 1. Reflection Spectra. Optics and Spectroscopy, 80:228-234. Sobol, I. 1975. The Monte Carlo method Moscow: Mir Publishers. Sodhi, A., S. Montaner, V. Patel, M. Zohar, C. Bais, E. A. Mesri, and J. S. Gutkind. 2000. The Kaposi's sarcoma-associated herpes virus G protein-coupled receptor up-regulates vascular endothelial growth factor expression and secretion through mitogen-activated protein kinase and p38 pathways acting on hypoxia-inducible factor 1alpha. Cancer Res, 60:4873-4880. Sorensen, J., M. Bengtsson, E. L. Malmqvist, G. Nilsson, and F. Sjoberg. 1996. Laser Doppler perfusion imager (LDPI)--for the assessment of skin blood flow changes following sympathetic blocks. Acta Anaesthesiol Scand, 40:1145-1148. Spearman, C. 1904. The proof and measurement of association between two things. American Journal of Psychology, 15:72-101.

119
Stam, J. 2001. An illumination model for a skin layer bounded by rough surfaces. In 12th Eurographics Rendering Workshop, 39-52. Stamatas, G., M. Southall, and N. Kollias. 2006. In vivo monitoring of cutaneous edema using spectral imaging in the visible and near infrared. J Invest Dermatol, 126:1753-1760. Stamnes, K. and P. Conklin. 1984. A new multi-layer discrete ordinate approach to radiative transfer in vertically inhomogeneous atmospheres. J Quant Spectrosc Radiat Transfer, 31:273-282. Stoner, H. B., P. Barker, G. S. Riding, D. E. Hazlehurst, L. Taylor, and R. W. Marcuson. 1991. Relationships between skin temperature and perfusion in the arm and leg. Clin Physiol, 11:27-40. Stranc, M. F., M. G. Sowa, B. Abdulrauf, and H. H. Mantsch. 1998. Assessment of tissue viability using near-infrared spectroscopy. British Journal of Plastic Surgery, 51:210-217. Svaasand, L. O., L. T. Norvang, E. J. Fiskerstrand, E. K. S. Stopps, M. W. Berns, and J. S. Nelson. 1995. Tissue Parameters Determining the Visual Appearance of Normal Skin and Port-wine Stains. Lasers in Medical Science, 10:55-65. Svanberg, K., I. Wang, S. Colleen, I. Idvall, C. Ingvar, R. Rydell, D. Jocham, H. Diddens, S. Bown, G. Gregory, S. Montán, S. Andersson-Engels, and S. Svanberg. 1998. Clinical multi-colour fluorescence imaging of malignant tumours--initial experience. Acta Radiol, 39:2-9. Takatani, S. and J. Ling. 1994. Optical oximetry sensors for whole blood and tissue. IEEE Eng Med Biol Mag, 3:347-357. Taylor, D. and S. Simonson. 1996. Use of near-infrared spectroscopy to monitor tissue oxygenation. New Horiz, 4:420-425. Taylor, J., P. Tofts, and R. Port. 1999. MR Imaging of Tumor Microcirculation: Promise for the New Millenium. J Magn Reson Imaging, 10:903-907. Thomson, M. L. 1955. Relative efficiency of pigment and horny layer thickness in protecting the skin of Europeans and Africans against solar ultraviolet radiation. J Physiol, 127:236-246. Tomatis, S., M. Carrara, A. Bono, C. Bartoli, M. Lualdi, G. Tragni, A. Colombo, and R. Marchesini. 2005. Automated melanoma detection with a novel multispectral imaging system: results of a prospective study. Phys Med Biol, 50:1675-1687.
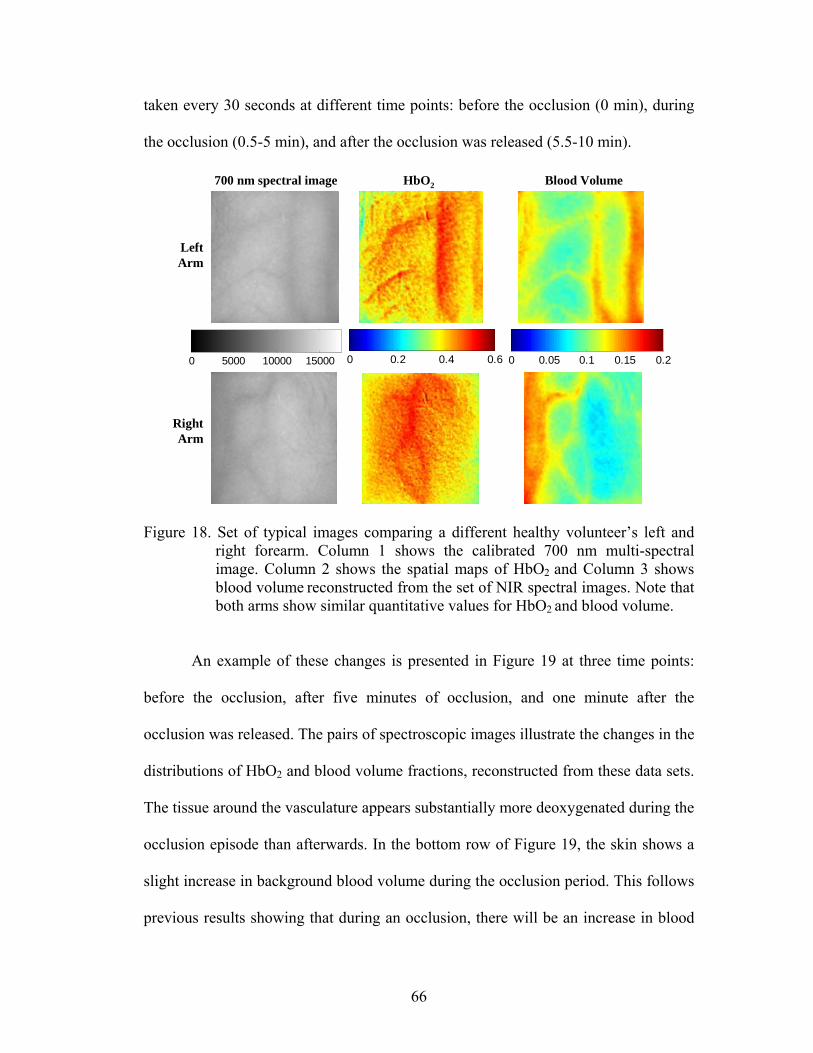
120
Ünver, N., P. Freyschmidt-Paul, S. Hörster, H. Wenck, F. Stäb, T. Blatt, and H. Elsässer. 2006. Alterations in the epidermal-dermal melanin axis and factor XIIIa melanophages in senile lentigo and ageing skin Br J Dermatol, 155:119-128. Urso, P., M. Lualdi, A. Colombo, M. Carrara, S. Tomatis, and R. Marchesini. 2007. Skin and cutaneous melanocytic lesion simulation in biomedical optics with multilayered phantoms Phys Med Biol, 52:N229-239. Usuki, K., T. Kanekura, K. Aradono, and T. Kanzaki. 1998. Effects of nicotine on peripheral cutaneous blood flow and skin temperature. J Dermatol Sci, 16:173-181. van der Zee, P., M. Cope, S. R. Arridge, M. Essenpreis, L. A. Potter, A. D. Edwards, J. S. Wyatt, D. C. McCormick, S. C. Roth, E. O. R. Reynolds, and D. T. Delpy. 1992. Experimentally measured optical pathlengths for the adult head, calf and forearm and the head of the newborn infant as a function of inter optode spacing. New York: Plenum Press. van Gemert, M. J. C. and J. P. H. Henning. 1981. A Model Approach to Laser Coagulation of Dermal Vascular Lesions. Arch Dermatol Res, 270:429-439. Van Gemert, M. J. C., S. L. Jacques, H. J. C. M. Sterenberg, and W. M. Star. 1989. Skin Optics. IEEE Trans, 36:1146. Verstraete, K., Y. De Deene, and H. Roels. 1994. Benign and Malignant Musculoskeletal Lesions: Dynamic Contrast-enhanced MR Imaging - Parametric "First-pass" Imaging Depict Tissue Vascularization and Perfusion. Radiology, 192:835-843. Viator, J., J. Komadina, L. Svaasand, G. Aguilar, B. Choi, and J. S. Nelson. 2004. A Comparative Study of Photoacoustic and Reflectance Methods for Determination of Epidermal Melanin Content. J Investigative Dermatology, 122:1432-1439. Vogel, A., V. Chernomordik, J. Riley, M. Hassan, F. Amyot, B. Dasgeb, S. Demos, R. Pursley, R. Little, R. Yarchoan, Y. Tao, and A. Gandjbakhche. 2007. Using Non-Invasive Multi-Spectral Imaging to Quantitatively Assess Tissue Vasculature. Journal of Biomedical Optics, 12:051604. Wagnieres, G., S. Cheng, M. Zellweger, N. Utke, D. Braichotte, J. P. Ballini, and H. van den Bergh. 1997. An optical phantom with tissue-like properties in the visible for use in PDT and fluorescence spectroscopy. Phy Med Biol, 42:1415-1426. Wan, S., R. R. Anderson, and J. Parrish. 1981. Analytical Modeling for the Optical Properties of the Skin with In Vitro and In Vivo Applications. Photochem Photobiol, 34:493-499.

121
Wang, L., S. Jacques, and L. Zheng. 1995. MCML--Monte Carlo modeling of light transport in multi-layered tissues. Comput Methods Programs Biomed, 47:131-146. Ward, K., R. Ivatury, R. Barbee, J. Terner, R. Pittman, I. Fioho, and B. Spiess. 2006. Near infrared spectroscopy for evaluation of the trauma patient: a technology review. Resuscitation, 68:27-44. Wardell, K., A. Jakobsson, and G. E. Nilsson. 1993. Laser Doppler perfusion imaging by dynamic light scattering. IEEE Trans Biomed Eng, 40:309-316. Weigand, D. A., C. Haygood, and J. R. Gaylor. 1974. Cell layers and density of negro and caucasian stratum corneum. J Investigative Dermatology, 62:563-568. Westland, S. and C. Ripamonti. 2004. Computational colour science using MATLAB West Sussex: John Wiley & Sons. Wilcoxon, F. 1945. Individual comparisons by ranking methods. Biometrics, 1:80-83. Williams, I., A. Mortimer, and C. McCollum. 1996. Recent developments in cerebral monitoring--near-infrared light spectroscopy. Eur J Vasc Endovasc Surg, 12:263-271. Witt, A. 1977. Multiple scattering in reflection nebulae: I A Monte Carlo approach Astrophys J, 35:S1-S6. Wyatt, J. S., M. Cope, D. T. Delpy, P. van der Zee, S. Arridge, A. D. Edwards, and E. O. R. Reynolds. 1990. Measurement of Optical Path Length for Cerebral Near-Infrared Spectroscopy in Newborn Infants. Dev Neurosci, 12:140-144. Wyszecki, G. and W. Stiles. 1967. Color science: concepts and methods, quantitative data and formulas. New York: John Wiley & Sons. Yarchoan, R. 1999a. Therapy for Kaposi's sarcoma: recent advances and experimental approaches. J Acquir Immune Defic Syndr, 21:S66-73. Yarchoan, R. 1999b. Therapy for Kaposi's sarcoma: recent advances and experimental approaches. J Acquir Immune Defic Syndr, 21 Suppl 1:S66-73. Zhang, R., W. Verkruysse, B. Choi, J. Viator, B. Jung, L. O. Svaasand, G. Aguilar, and J. S. Nelson. 2005. Determination of human skin optical properties from spectrophotometric measurements based on optimization by genetic algorithms. J Biomed Opt, 10:024030. Zonios, G., L. T. Perelman, V. Backman, R. Mancharan, M. Fitzmaurice, J. Van Dam, and M. S. Feld. 1999. Diffuse reflectance spectroscopy of human adenomatous colon polyps in vivo. Appl Opt, 38:6628-6637.

122
Zonios, G. I., R. M. Cothren, J. T. Arendt, J. Wu, J. Van Dam, J. M. Crawford, R. Manoharan, and M. S. Feld. 1996. Morphological model of human colon tissue fluorescence. IEEE Trans Biomed Eng, 43:113-122.