abstract - diva portaloru.diva-portal.org/smash/get/diva2:570456/fulltext01.pdf · abstract this...
TRANSCRIPT

1
The Determinants of Tax Revenue in Sub-Saharan Africa
Tony Addison and Jörgen Levin
Abstract
This paper identifies the determinants of tax revenue in sub-Saharan Africa using an
unbalanced panel dataset of 39 countries over the period 1980-2005. A set of factors
that can potentially influence tax revenues such as the tax base, structural factors,
foreign aid and conflict, is considered in the econometric analysis. Our contribution is
that besides the analysis of the determinants of the overall tax revenue, we further
conduct the analysis about how these determinants affect the tax structure by
including mainly three tax types including the international trade taxes, domestic
indirect taxes, and domestic direct taxes. Firstly, our results significantly suggest that
the overall tax to GDP ratio is higher in more open and less agricultural dependent
economies, less populous and peaceful countries. The introduction of VAT also has a
significant positive impact on the total tax-GDP ratio. We find evidence of
relationships between the effect of openness and per-capita GDP on the trade-tax GDP
ratio. The size of the agricultural sector and foreign aid affects the direct-tax GDP
ratio negatively. VAT and a peaceful environment have a significant positive impact.
Keywords: tax revenue, tax structure, determinants, sub-Saharan Africa
2
1. Introduction
Tax revenue is of vital importance for the sustainability of both developed and
developing countries. Firstly, taxation is the main source of central government
revenue, since tax collection is mandatory and regular, which can guarantee the
stability of income. Secondly, taxation aims to meet the social and public needs by
providing public goods and services. Thirdly, government need tax revenue to
establish armed forces and judicial systems to ensure the secure and justice of the
society. In many poor developing countries, a low tax-revenue/GDP ratio prevents
these nations from undertaking ambitious expenditure programs. Thus a rapid
increase in domestic revenue and a corresponding increase in public services is a
policy priority. However, one needs to be cautious about increased public spending
and increased taxation, as distortionary taxes begin to reduce growth when pushed
beyond certain levels: tax bases are not simply ‘given’ to governments: they can be
grown or destroyed (Bird, 2008).1
What the optimum level of the tax-GDP ratio is as much an ideological as a
technical question. Governments of different political perspectives will have different
goals in terms of public expenditure, which imply different levels o taxation. Indeed,
tax revenue/GDP ratios various widely across regions. Table 1 indicates how the
tax-GDP ratio has changed between 1990 and 2005 across regions. In Western
Europe, the tax-GDP ratio increased from 38 percent to about 41 percent during the
period. Although low income countries have a lower average tax-GDP ratio there is
quite large variation within the group. However, there was little change in Middle
East/North Africa and South Asia, collections stayed relatively constant around 14
and 11-12 percent, respectively. East Asia and Pacific increased the tax-GDP ratio
from 21 percent to close to 30 percent. Performance in sub-Saharan Africa (SSA) and
1 With regard to public spending, empirical evidence suggests that complementary effects between public and
private investments are important to achieve higher growth rates. While expansion of both social and economic
infrastructure is important in order to achieve higher growth rates, it should be noted that increased public
spending can in one country be growth-enhancing, growth-impeding in another, due to the varying relative
importance of both distortionary taxation and the externality being internalized (Devarajan, Easterly and Pack,
2002).

3
Latin America has improved slightly, overall tax collection has increased from 16-17
percent in 1990 to 19 percent in 2005. What is worth to point out is that the average
tax-GDP ratio in SSA is, on average, higher than Middle East/North Africa, and South
Asia.
Table 1: Tax-GDP ratios across regions
1990 1995 2000 2001 2002 2003 2004 2005
East Asia and Pacific 21.5 19.9 19.9 20.6 22.2 22.7 26.1 29.9
Latin America and the
Caribbean 16.3 17.1 17.3 17.9 18.3 18.7 18.8 19.6
Middle East and North
Africa 13.8 14.3 13.0 13.4 14.2 14.3 14.5 14.3
South Asia 11.0 11.5 10.4 10.7 10.8 10.7 11.4 12.0
Sub-Saharan Africa 17.0 15.8 17.0 17.2 17.5 18.7 19.7 19.1
Western Europé 37.5 38.2 40.4 39.8 39.4 39.2 39.4 40.7
United States and Canada 31.6 31.7 32.8 31.8 30.1 29.6 29.5 30.2
Source: IMF (2008)
East Asia and Pacific is the only region with a substantial increase in the tax-GDP
ratio. Average performance in other developing regions, including SSA, is still
relatively poor.
Whereas the trend in tax-revenue shares in Africa is disappointing, resource rich
economies have had a significant increase in domestic revenue since 2004 (OECD
2010). On average revenue from resource taxes was close to 10% of GDP in 2005,
which is almost equivalent to the total amount of aid disbursed to sub-Saharan Africa.
Revenue mobilization in resource-rich economies has been increasing, on average, by
around 3 percent per year. This has mostly been driven by resource-related tax
revenues that typically distract governments from generating revenue from more
politically demanding forms of taxation.
Non-resource rich economies managed to increase revenue by 1.4 percent a year.
Compared to the resource rich countries they have been more successful in improving
the quality and balance of their tax mix. Non-resource related tax revenues have
become less important while indirect, direct and trade taxes have increased its share.
Thus, oil producing countries are primarily driving the remarkable quantitative rise in

4
average tax shares across the continent, while non-oil producers have made the most
progress in broadening the tax base.
This paper focuses on exploring the determinants of tax revenue by using a
dataset which includes an unbalanced panel data of 39 SSA countries over a time
period covering the years from 1980 to 2005. In this paper, the factors that influence
the tax revenue performance are divided into five aspects including the tax base,
economic policies, external environment, structural factors, and the political
environment including conflict. While a number of studies have analyzed some
principal determinants of tax revenue, this paper extend the literature by providing a
more well-rounded consideration of the determinants of the total tax revenue by using
two-step efficient GMM regression method. Our contribution is that besides the
analysis of the determinants of the overall tax revenue, we further conduct the
analysis about how these determinants affect the tax structure. We carry on the
regressions on mainly three tax types including the trade taxes, domestic indirect
taxes and direct taxes.
The rest of the paper is organized as follows. Section 2 reviews the literatures on
both the tax revenue performance and the empirical analysis. Section 3 presents the
empirical model and discussed the testable hypotheses. Section 4 shows the data and
methodology. Section 5 draws the empirical analysis and discusses the results, and the
last section gives the conclusions and some possible recommendations.
2. Literature Review
2.1 Determinants of taxation
The observation that revenue performance in some developing countries is poor
naturally seems to imply that the revenue effort should be increased, but how far and
how fast the revenue-to-GDP ratio can be raised is sometimes unclear. The idea of a
potential source of tax revenue has influenced the philosophy of taxable capacity or
5
tax effort.2 A crude means of assessing taxable capacity is to relate tax revenue to
GDP across countries, by using a regression model with explanatory variables that
represent different elements of taxable capacity.3 A tax effort larger than one implies
that the country utilizes its tax base well. However, a country with low tax effort
(below one) is likely to have the potential to raise substantial additional revenue.
Bird et al. (2008) found that Latin American countries show consistently lower
tax effort compared to other developing or transition countries. Performance in
African countries shows a mixed performance. Some countries collect as little as half
while others collect up to 2 to 3 times what they would be expected to (OECD, 2010).
The latter group include to a large degree those countries with a high share of
resource-related tax revenue. Thus, estimates of tax effort for some resource-rich
countries turn out to be quite sensitive to whether resource-related tax revenues are
considered or not. Using a tax effort measure that excludes resource-related tax
revenues is revealing: more than half of the African countries (22 out of 42) collect
more or what is expected. This suggests that in quite a number of countries domestic
revenue mobilization is not constrained by the tax system but more by GDP growth
and broader development.
From a policy perspective there is an important distinction between countries
with a substantial share of resource-related tax revenues and those without. Resource
revenue provides an opportunity for reducing distortionary taxation that may have a
negative impact on economic activity, but it also provides the opportunity for
maintaining highly inefficient subsidy programme (Collier, et. al (2009). Bornhorst et.
al (2009) found that countries that receive large revenues from the exploitation of
natural resource endowments are likely to reduce their domestic tax effort
considerably.4 This is not necessarily worrying as reduced domestic tax burden could
2 Lotz and Morss (1970) were the first to use the difference between actual and predicted tax ratios for conducting
inter-country tax effort comparisons. 3 The actual tax ratio of an individual country can then be compared with the tax ratio predicted from the
regression equation for that country. The ratio between the actual collection and the predicted capacity is used as a
measure of tax effort. 4 Bornhorst et. al (2009) found a statistically significant negative relation, with a typical result being that a 1
percentage point increase in hydrocarbon revenue (in relation to GDP) lowers non-hydrocarbon revenues by about
0.2 percentage points

6
foster private sector activities consistent with an improvement in development
prospects.
Accelerated development is in itself an important determinant of tax revenue.
Structural factors exert the strongest influence on the tax revenue/GDP in low-income
countries. Growing levels of per capita income, a shift from agricultural to industrial
production, a change in consumer demand from basic necessities to manufactured
goods and services, falling age-dependency ratios, and increasing urbanization all lead
to rising shares of tax revenue in national income.5 This implies that policies which
emphasize structural changes will aid countries in the development process.
More recent studies have found that not only do supply factors matter but that
demand factors such as institutional quality has a significant impact in determination
of tax effort (Bird et al. (2008). As they conclude, a legitimate and responsive state one
that secures the rule of law and keeps corruption under control appears to be an
essential pre-condition for a more adequate tax collection effort. Chand and Moene
(1997) argue that fiscal corruption is a key factor behind the poor revenue
performance in a number of developing countries. There is also strong evidence to
suggest that measures taken to reduce corruption could be expected to enhance tax
revenue significantly (Gupta, 2007). As suggested by Bird et al. (2008) improving
institutions such as enhancing voice or accountability and reducing corruption may
not take longer nor be necessarily more difficult than changing supply-side factors.
How to manage tax revenue effectively, and in particular in countries with weak
institutions, is an active area of research itself and deserves more attention.6
Earlier literature reviewed tax revenue performance in SSA and found that
tax revenue performance varies across SSA countries and revenue trends are not
uniform; some countries have enjoyed sustained increase in tax revenue shares while
5 For example, Le et al. (2008) found that a country with higher income, lower population growth rate, more trade,
lower agriculture share in GDP and higher institutional quality is likely to have a higher tax capacity. Gupta (2007)
found that structural factors such as per capita GDP, share of agriculture in GDP, and trade openness are strong
determinants of revenue performance. Ghura (1998) estimates tax equations for SSA and notes that a number of
factors, such as macroeconomic and structural policies and the provision of public services by the government
influence tax revenue effort.
6 Recent work by Persson and Besley (2010) introduce the capacity to tax as an important factor in the
development process.

7
others have seen tax revenue shares weaken (Stotsky et al., 1997). More recently,
Agbeyegbe et al. (2006) showed that import duties are still a significant source of
revenues in SSA countries, though trade liberalization in the region has led to a
reduced reliance on these taxes. And taxes on goods and services are a growing share
of revenues, especially with the introduction of VAT in many of the countries in the
past few decades, and a reform of excise taxes in many countries as well. Moreover,
in countries with relatively well-functioning tax-systems income tax revenues
constitute a significant share of revenues. Moreover, Keen et al. (2009) have showed
the development in tax revenues of 40 SSA countries during the period from 1980 to
2005. They have found that there had clearly been an increase in the average tax
shares in GDP since the late 1990s, but this was very largely due to a marked increase
in revenue from natural resources. For non-resource related tax revenues, in contrast,
there has been almost no change over the sample period. Finally, with regard to tax
structures Keen et al. (2009) showed that there has been a downward trend in trade
taxes and an upward trend in indirect taxes. Income taxes almost remained constant.
2.2 Literature Review on Empirical Analysis
Most of previous literatures have found that the income level, agriculture share, and
other economic structure variables, and the degree of openness, among others, are
often statistically significant in explaining the cross-country variation in the revenue
ratio. Ghura (1998) analyzed determinants representing macroeconomic and structural
policies and the level of corruption based on a panel data for 39 countries in SSA
during 1985-1996. Using instrumental variables generalized least squares (IV-GLS)
he found that an increase of the level of corruption lowers the tax-revenue. Mahdavi
(2008) used a modified model with a number of explanatory variables based on 43
developing countries over the time period 1973-2002, using the GMM method with
cross-section fixed effects. Total tax revenue was positively related to the degree of
international trade, relative size of the urban population, adult literacy rate, and the
level of development approximated by per capita income. However, an increase in

8
foreign aid, relative share of old-age population, population density, the degree of
monetization, and the rate of inflation lead to lower tax revenue.
Agbeyegbe et al. (2006) used a panel data set covering 22 countries in SSA, over
1980–1996 using the System GMM method. They study focused on the relationship
between trade liberalization, exchange rates, and tax revenue variables. The writers
conformed that trade liberalization is not strongly linked to total tax revenue. They
found some evidence that exchange rate appreciation and higher inflation had a
negative impact on tax revenues.
Khattry and Mohan Rao (2002) estimated determinants of total tax revenue using
a fixed-effects regression framework based on a sample of 80 countries over a period
covering 1970-98. The study found that structural characteristics, like per capita
income and urbanization, have been significant in explaining the decline of income
tax and trade tax revenues in low-income countries. Gupta (2007) contributes to the
empirical literature on the determinants of tax revenue using data from 105
developing countries over 25 years with different estimation techniques, including
both fixed and random effects, panel-corrected standard error estimation using
Prais-Winsten regression as well as difference-GMM and system-GMM estimation.
3. Methodology and data
3.1 Methodology
The earlier literature used OLS or GLS approaches to do the empirical regressions.
More recently, since a lot of the explanatory variables are likely to be endogenous, it
is argued that GMM is a better method rather than OLS or GLS (Hayashi, 2000). This
is also the approach used in this study. A two-step GMM regression is undertaken
with four dependent variables, that is, the share of total tax revenue (TR_GDP),
international trade tax revenue (TT_GDP), the domestic indirect tax revenue
(IDT_GDP) and the domestic direct tax revenue (DT_GDP), respectively. We control
for the unobserved fixed country-specific effects by including a full set of country
9
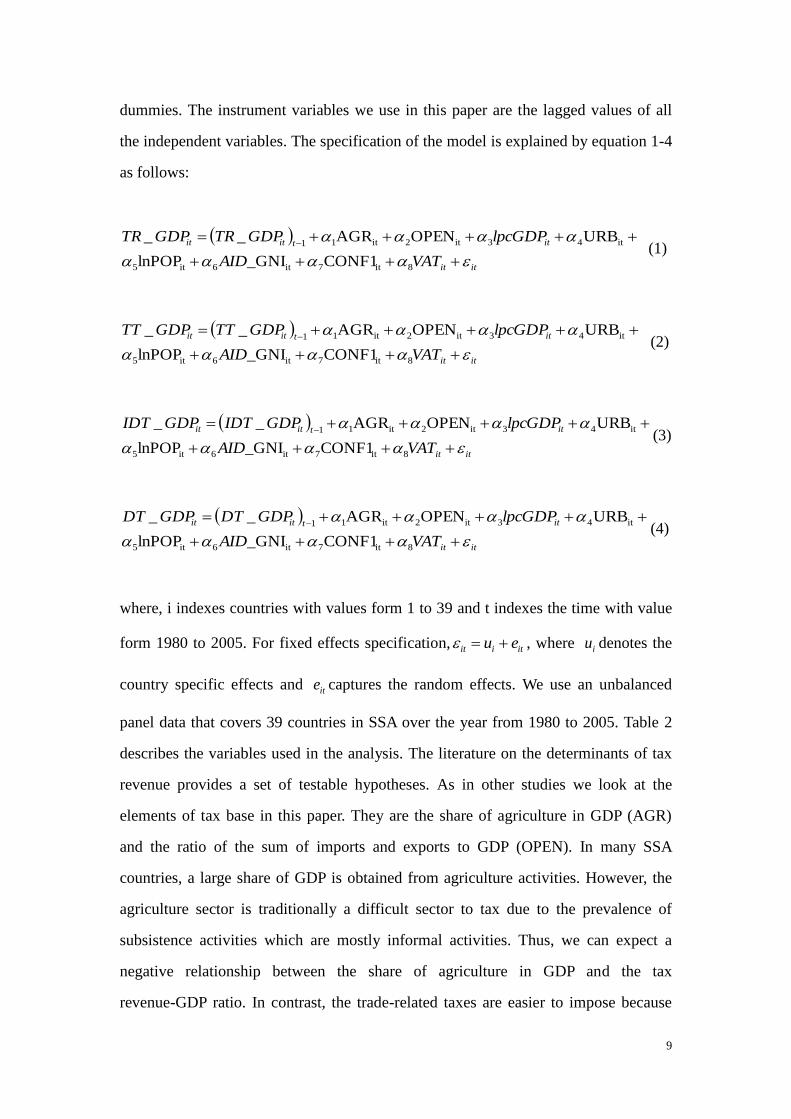
dummies. The instrument variables we use in this paper are the lagged values of all
the independent variables. The specification of the model is explained by equation 1-4
as follows:
itit
ittitit
VATAID
lpcGDPGDPTRGDPTR
8it7it6it5
it43it2it11
CONF1_GNIlnPOP
URBOPENAGR__ (1)
itit
ittitit
VATAID
lpcGDPGDPTTGDPTT
8it7it6it5
it43it2it11
CONF1_GNIlnPOP
URBOPENAGR__ (2)
itit
ittitit
VATAID
lpcGDPGDPIDTGDPIDT
8it7it6it5
it43it2it11
CONF1_GNIlnPOP
URBOPENAGR__(3)
itit
ittitit
VATAID
lpcGDPGDPDTGDPDT
8it7it6it5
it43it2it11
CONF1_GNIlnPOP
URBOPENAGR__ (4)
where, i indexes countries with values form 1 to 39 and t indexes the time with value
form 1980 to 2005. For fixed effects specification, itiit eu , where iu denotes the
country specific effects and ite captures the random effects. We use an unbalanced
panel data that covers 39 countries in SSA over the year from 1980 to 2005. Table 2
describes the variables used in the analysis. The literature on the determinants of tax
revenue provides a set of testable hypotheses. As in other studies we look at the
elements of tax base in this paper. They are the share of agriculture in GDP (AGR)
and the ratio of the sum of imports and exports to GDP (OPEN). In many SSA
countries, a large share of GDP is obtained from agriculture activities. However, the
agriculture sector is traditionally a difficult sector to tax due to the prevalence of
subsistence activities which are mostly informal activities. Thus, we can expect a
negative relationship between the share of agriculture in GDP and the tax
revenue-GDP ratio. In contrast, the trade-related taxes are easier to impose because

10
the goods enter and leave the country at specified locations. Thus it reflects a positive
correlation between OPEN and the tax revenue-GDP ratio.
Table 2: Description of data
Variable Observations Mean Std. Dev. Min Max
Tax-GDP 1008 16.0 8.0 1.2 43.4
Trade-tax-GDP 1007 5.2 4.3 0.2 26.8
Indirect-tax-GDP 1002 4.0 2.4 0.0 11.5
Direct-tax-GDP 1008 3.7 2.5 0.2 18.7
Agriculture/GDP 984 30.1 15.3 2.0 72.0
Openness/GDP 1010 52.6 32.1 3.4 203.3
Per capita GDP (log) 1014 -7.2 0.8 -9.9 -5.7
Population (log) 1014 3.6 1.3 0.2 6.4
Aid/GDP 983 14.8 16.9 -0.3 210.2
Urbanisation 1014 30.6 14.5 4.3 83.6
Conflict dummy 952 0.8 0.4 0.0 1.0
VAT dummy 1014 0.3 0.5 0.0 1.0
Structural factors in this paper include per capita GDP ( lpcGDP ), the population size
( POPln ), and the degree of urbanization in a country (URB). Population size and per
capita income are entered in logarithms since the tax revenue is assumed to be
nonlinear in the scale of the economy. Per capita GDP is a proxy for the development
of a country and is expected to be positively related to the tax share since the tax
revenue-GDP ratio increases with the development of the economy (i.e., lpcDGP
would be negatively related to tax share). Population size and the tax revenue-GDP
ratio are predicted to be positively correlated due to the economies of scale in tax
collection. The tax collection becomes more efficient in urban areas, since the general
public is more likely to be well-educated and do better in understanding and
complying with tax codes. We expect a positive relationship between urbanization
(URB) and the tax revenue share.
The relationship between aid and tax revenue is essentially an empirical question.
Gupta et al. (2003) point out that net foreign aid has a negative impact on the total tax
revenue, which seems to be driven by a negative impact of grants on tax revenue,

11
whereas loans are associated with increased domestic tax revenue. One potential
explanation they offer for why this might be the case is that loans may imply the need
of a repayment, which serves as an incentive to increase the domestic tax effort. More
recently Morrissey et al. (2010) showed that the effect of foreign aid on tax revenue is
positive since a break point in the mid 1980s in developing countries.
We also include two dummy variables. The first is whether a country has had
peace here defined as not experienced minor conflict or war. Addison et al (2002)
argue that conflict affects the ability of states to raise revenues, it causes major
reallocations of expenditure and, depending upon how the wartime fiscal deficit is
handled, it affects macro-economic stability. Public revenues usually fall to very low
levels in conflict-affected countries. Revenues from indirect taxes fall as economic
activity shrinks, the quality of tax institutions declines, and governments become ever
more dependent on import duties and other trade taxes (but the latter also tend to decline
as external trade shrinks and as the quality, and honesty, of customs services deteriorates).
Poor governance also reduces the legitimacy of taxation, and encourages tax evasion. The
fall in revenues accordingly reduces the ability of governments to fund development
expenditures.
The second dummy variable is whether the country has introduced VAT as an
indirect tax. The spread of value-added tax (VAT) in developing countries has been
dramatic over the decade of 1990s. Adopted by more than 130 countries, including
many of the poorest, around three-quarters of all countries in sub-Saharan Africa, for
example, the VAT has been, and remains, the key of tax reform in many developing
countries. With the passing of time the importance of VAT in the revenue structure of
many countries has increased significantly.
Before we turn to the empirical analysis, we firstly do some simple graphical
analysis which briefly shows the relationship between the tax revenue and some of the
explanatory variables. According to the simple graphical analysis results we get that
per capital GDP, urbanization rate and the open index appear to have a strong positive
relationship with the total tax revenue (Figure x-Figure x in appendix). There seems to
be no apparent correlation between the xxx variables. It also appears that the some

12
variables such as ….have negative relationships with the total tax revenue.
4. Results
The results in Table 4.1 suggest that the share of agriculture sector (AGR) has
statistically negative significant effects on the total tax revenue GDP ratio. This
negative effect is mainly through its negative effect on both direct and indirect tax
revenue. Several factors contribute to this result. Firstly, a large part of the agricultural
sector is small-scale with limited number of taxpayers paying tax on income or profits.
Secondly, a substantial part of the output is consumed and not marketed. Thirdly,
marketed agricultural products are to a large degree exempted from indirect taxation.
Finally, the cost of verification of actual income is very high. A large share of
agricultural products is also exempted from indirect taxes.
Table 1: GMM estimates of determinants of tax-GDP ratios
Variables Tax-GDP ratio Trade-tax GDP
ratio
Direct-tax GDP
ratio
Indirect-tax GDP
ratio
Lagged tax/GDP -0.280** 0.276 -0.0693 -0.268
(0.116) (0.202) (0.0777) (0.187)
Agriculture/GDP -0.170*** -0.0214 -0.0275*** -0.0326*
(0.0647) (0.0212) (0.0106) (0.0171)
Openness/GDP 0.0616*** 0.0216** 0.00974 0.00353
(0.0157) (0.00911) (0.00667) (0.00581)
Per capita GDP (log) -2.628 2.330*** 0.0861 -0.243
(1.615) (0.706) (0.305) (1.004)
Population (log) -5.727** -2.573** -1.261 2.364
(2.669) (1.020) (1.025) (1.740)
Urbanization (%) 0.0541 0.0228 0.0183 0.0437
(0.141) (0.0483) (0.0211) (0.0493)
Aid /GDP -0.0279 -0.00675 -0.0213*** -0.0142
(0.0229) (0.00918) (0.00648) (0.0139)
Conflict dummy 0.476* 0.242 0.204*** 0.0588
(0.260) (0.202) (0.0786) (0.0840)
VAT dummy 2.322** 0.290 0.693*** 0.529*
(0.980) (0.369) (0.168) (0.278)
Observations 847 847 847 840
Number of country 37 37 37 37
Robust standard errors in parentheses: *** p<0.01, ** p<0.05, * p<0.1

13
Openness (OPEN) has a positive significant effect on the total tax revenue-GDP ratio.
The significantly positive relationship between openness and the trade-tax GDP ratio
is obvious since trade tax revenue is obtained from taxes on the exports and imports
of country. SSA countries rely heavily on the trade tax revenues because they are
relatively easier to assess and enforce than domestic taxes, as monitoring the entry
and exit of goods into and from the country is generally straightforward. Openness is
positively related to the domestic indirect taxes and positively related to the direct
taxes, but the effects are not significant and consistent with Khattry and Rao’s (2002)
findings.
Per capita GDP is positively related to the total tax revenue ratio and insignificant.
However, per capita GDP has a significantly negative relationship with trade taxes.
These findings are quite consistent with Ghura’s (1998) hypotheses. In the early
stages of economic development, trade taxes are the major sources of government
revenues since they are easier to collect and enforce than domestic taxes as we
mentioned above. Yet, as countries develop, they will improve their public
administrations, judicial systems and promote structural and institutional reforms, so
that, the costs of the tax system will be gradually reduced. Thus, the dependence on
the domestic taxes will increase and the dependence on the trade taxes will fall with
the economic development of a country.
We find that population density is significantly negatively related to the total tax
revenue and trade taxes, while the correlation is insignificant when it comes to
indirect taxes. Population is an exogenous variable in our model, which means that it
does not affect the tax revenues directly but through its effect on other endogenous
variables like per capita income and agriculture output. In poor, mainly agricultural
countries with limited physical and human capital and rudimentary technology, higher
population density tends to reduce per capita income (Becker et al., 1999). Thus,
higher population density related to lower per capita income, and hence reduces the
tax-base. Moreover, higher population density has a significant negative impact on
trade-tax GDP ratio. Moreover, the growth in the population density raises the
demand of consumption, so that the consumption taxes increase which raises the

14
domestic indirect taxes. This is consistent with the result that population density is
positively (but insignificant) related to indirect taxes.
Earlier studies have found that total tax revenue increases when a society
becomes more urbanized but here the correlation is statistically insignificant. It is
argued that urbanization increases both the need for tax revenues and the capacity to
tax. On the demand side, greater urbanization leads to a greater need for public
services. On the supply side, urbanization leads to larger taxable bases as economic
activity tends to be concentrated in urban areas (Khattry et al., 2002). However, our
results also show that urbanization is insignificant related to all tax-GDP ratios.
On the overall tax-GDP ratio we do not found any significant results. We find that
foreign aid (AID_GNI) is significant and negatively related to the direct-tax GDP
ratio. This could be explained by policy makers’ decisions to use foreign aid as a
substitute for domestic taxes and thus to try to free more resources for the private
sector and increase investment by lowering income and capital taxes. The
developmental reasoning behind such a policy could also be political economy
reasons. Lowering income tax rates, or keep them at a low level, could be part of an
election strategy.
The effect of peace on the level of total taxation is positive and significant. The
effect is comparable large compared to other variables in our analysis and stress the
strong link between tax-revenue and peace/conflict discussed above. Our results
reveal that there is no significant effect on the trade-tax GDP ratio. However, there is
a weak significant positive effect of peace on the direct-tax GDP ratio. A more
democratic and peaceful political regime enjoys more legitimacy and loyalty among
taxpayers which leads to a higher degree of voluntary compliance, compliance with
taxation increases as the risk of conflict is reduced.
The dummy variable VAT we use in this paper is an indicator of whether a
country has adopted the value-added tax or not. We show that the adoption of VAT has
a significant positive impact on the total tax revenues and the effects on other tax
types, except trade-taxes, are also positive and significant. This is consistent with
claims made by proponents of the VAT, especially for developing countries, that it
15
would enhance efforts to mobilize much-needed tax revenue, not only directly but
through wider improvements in tax administration and compliance which is
mentioned by Keen et al. (2010).
5. Conclusion
This paper analyzes the determinants of tax revenue performance in sub-Saharan
Africa by using a dataset which includes 39 countries in SSA over a time period
covering the years from 1980 to 2005. A set of factors that can potentially influence
tax revenues, dividing into five aspects including the tax base, structural factors, and
foreign aid and conflict, is considered in the econometric analysis. Our main findings
can be summarized as follows.
Firstly, our results significantly suggest that the overall tax to GDP ratio is higher
in more open economies, a relatively smaller size of agriculture sector, less populous
and peaceful countries. The introduction of VAT also has a significant positive impact
on the total tax-GDP ratio. However, several of these variables affect the different
components of total tax revenue in a statistically significant way. We find evidence of
fairly strong relationships between some variables and the components of tax revenue.
These include the positive effect of openness, per-capita GDP and a negative impact
on the trade-tax GDP ratio. The size of the agricultural sector and foreign aid affects
the direct-tax GDP ratio negatively. VAT and a peaceful environment have a
significant positive impact. With regard to the indirect-tax GDP ratio it is only the size
of the agricultural sector and whether a country has introduced VAT that has a
significant positive impact.
Our results suggest several policy recommendations. Countries in SSA will
benefit in terms of higher tax-revenue if formal activities, such as the manufacturing
sector, is growing faster than the agricultural sector. Although our results did not
show any significant relationship between foreign aid and the overall tax-GDP ratio,
we found a significant effect between foreign aid and the direct-tax GDP ratio. This
would suggest that reforming direct taxes would be a priority in donor-supported tax

16
reforms. The cost of conflict was found to be high in tax-revenue terms. We found a
significant positive impact on peace on both the overall tax-GDP ratio and the
direct-tax GDP ratio. Finally, the adoption of VAT in SSA these years has contributed
positively to revenue performance.
References
Adam, C. S. and O’Connell, S. A. (1998). Aid, taxation, and development: Analytical
perspectives on aid effectiveness in Sub-Saharan Africa. World Bank Policy
Research Working Paper 1885.
Adam, C., Bevan, D., and Chambas, G. (2001). Exchange rate regimes and revenue
performance in sub-Saharan Africa. Journal of Development Economics, 64,
173–213.
Agbeyegbe, T.D., Stotsky J., WoldeMariam A. (2006). Trade liberalization, exchange
rate changes, and tax revenue in sub-Saharan Africa. Journal of Asian Economics,
17, 261-284
Arellano, M., & Bond, S. (1991). Some tests of specification for panel data: Monte
Carlo evidence and an application to employment equations. Review of Economic
Studies, 58, 277–297.
Arellano, M., & Bover, O. (1995). Another look at the instrumental variable
estimation of error-components models. Journal of Econometrics, 68, 29–51.
Arellano, M., & Honore´ B. (2000). Panel Data Models: Some Recent Developments,
CEMFI Working Paper 0016.
Baunsgaard, T. and Keen, M. (2005). Tax Revenue and (or?) Trade Liberalization.
IMF Working Paper 05/112. Washington: International Monetary Fund.
Becker G. S., Glaeser E. L., Murphy K. M.(1999). Population and Economic Growth.
The American Economic Review, 89, 145-149.
Begum, L. (2007). A Panel Study on Tax Effort and Tax Buoyancy with Special
Reference to Bangladesh. IMF Working Paper 07/15. Washington: International
Monetary Fund.
Cashin, P., McDermott,C.J. and Pattillo,C.(2004).Terms of trade shocks in Africa: are
they short-lived or long-lived? Journal of Development Economics, 73 , 727– 744.
Cheibub, J.A. (1998). Political Regimes and the Extractive Capacity of Governments:
Taxation in Democracies and Dictatorships. World Politics, 50, 349-376.
Ghura, D. (1998). Tax Revenue in Sub-Saharan Africa: Effects of Economic Policies
and Corruption. IMF Working Paper 98/135. Washington: International Monetary
Fund.
Gupta, S., B. Clements, A. Pivovarsky and E. Tiongson (2003). Foreign Aid
andRevenue Response: Does the Composition of Aid Matter? IMF Working Paper
03/176. Washington: International Monetary Fund.

17
Gupta, S. (2007). Determinants of Tax Revenue Efforts in Developing Countries. IMF
Working Paper 07/184. Washington: International Monetary Fund.
Hamada, K. (1994). Broadening the Tax Base: The Economics Behind It. Asia
Development Review, 12, 51-84.
Herrmann, M. and Khan, H. (2008). Rapid urbanization, employment crisis and
poverty in African LDCs:A new development strategy and aid policy. Munich
Personal RePEc Archive.
Keen, M. and A. Simone, (2004). Tax Policy in Developing Countries: Some Lessons
from the 1990s, and Some Challenges Ahead. in Gupta, S., Clements B. and G.
Inchauste (Eds.), Helping countries develop: the role of fiscal policy, Washington,
D.C.: International Monetary Fund.
Keen, M. and Mansour, M. (2009). Revenue Mobilization in Sub-Saharan Africa:
Challenges from Globalization. IMF Working Paper 09/XX. Washington:
International Monetary Fund.
Keen, M. and Lockwood, B. (2010). The value added tax: Its causes and
consequences. Journal of Development Economics, 92, 138-151.
Keiser J, Utzinger J, de Castro MC, Smith TA, Tanner M, Singer BH.(2004).
Urbanization in sub-saharan Africa and implication for malaria control. Am J
Trop Med Hyg 71, 2004, 118-127.
Khan, M. H. (2001). Agricultural taxation in developing countries: a survey of issues
and policy. Agricultural Economics, 24, 315-328.
Khattry B., Rao J. M. (2002). Fiscal Faux Pas?: An Analysis of the Revenue
Implications of Trade Liberalization. World Development, 30, 1431−1444.
Leuthold, J. H. (1991). Tax shares in developing economies: A panel study. Journal of
Development Economics, 35, 173−185.
Mahdavi, S. (2008). The level and composition of tax revenue in developing
countries:Evidence from unbalanced panel data. International Review of
Economics & Finance, 17, 607-617.
Morrissey, O., Gomanee, K. and Girma, S. and (2005). Aid and Growth in
sub-Saharan Africa: Accounting for Transmission Mechanisms. Journal of
International Development, 17, 1055–1075.
Morrissey, O. and Clist, P. (2010). Aid and Tax Revenue: Signs of a Positive Effect
Since the 1980s. Journal of International Development, forthcoming, DOI:
10.1002/jid.1656.
Nashashibi, Karim, Bazzoni, Stefania (1994). Exchage rate strategies and fiscal
performance in sub-Saharan Africa. IMF Staff Papers 94/76. Washington:
International Monetary Fund.
Nsiah-Gyabaah, K. (2004) Urbanization Processes – Environmental and Health
effects in Africa. Panel Contribution to the PERN Cyberseminar.
Roodman, D. (2006). How to Do xtabond2: An Introduction to “Difference” and
“System” GMM in Stata. Center for Global Development Working Paper NO.103.
Stotsky, J.G. and WoldeMariam, A. (1997). Tax Effort in Sub-Saharan Africa. IMF
Working Paper 97/107. Washington: International Monetary Fund.
Tanzi, V. (1989). The impact of macroeconomic policies on the level of taxation and

18
fiscal balance in developing countries. IMF Staff Papers, 36, 633−656.
Tanzi, V. (1998).Corruption Around the World: Causes, Consequences, Scope, and
Cures. IMF Working Paper 98/63. Washington: International Monetary Fund.
Hayashi, F. (2000). Econometrics. Prentice Hall: Princeton University Press

19
Appendix B: Countries by Income Level and Resource Status
Low-income countries Lower-middle-countries Upper-middle-income
countries
Benin Cameroon* Botswana*
Burkina Faso Cape Verde* Equatorial Guinea*
Burundi Lesotho Gabon*
Central African Republic Namibia* Mauritius
Chad* Swaziland Seychelles
Comoros
Congo, Republic of*
Côte d'Ivoire*
Ethiopia
Gambia
Ghana
Guinea*
Guinea-Bissau
Kenya
Madagascar
Malawi
Mali
Mozambique
Niger
Nigeria*
Rwanda
Sâo Tomé and Principe
Senegal
Sierra Leone
Tanzania
Togo*
Uganda
Zambia
Zimbabwe
29 countries 5 countries 5 countries
Notes:
Countries with * are classified as resource countries.
Income classification follows the World Bank 2006 country classification according to 2005 incomes.