abstract degree of rock mechanics involvement
TRANSCRIPT
102
Rock Mechanics and the Economics of Cut-and-Fill Mining
by
Professor Gunnar Almgren, University of Lulei, S -9 5 1 8 7 LuleS, Sweden
ABSTRACT
The.application of rock mechanics'-to. mining has great economic potential. Factors such as loss of ore, rock-dilution, possibilities of mechanization and rock support are all influenced by the degree of rock mechanics involvement.
In particular loss of ore is limited by the correct dimensioning of pillars and remnants. Rock-dilution, depending upon caving, can in the same way be mastered by the right dimensions of stopes and pillars and of rock supporting. Possibilities of mechanization depend upon sizes of drifts and stopes,- stope availabilities and access to the stopes, all depending upon a considered rock mechanic investigation< Also shut-downs in the stopes owing to caving can be affected in the same way.
Consequences on the mining economy for cut-and-fill mining are illustrated concerning loss of ore, rock-dilution, mechanization levels and rock support. The biggest influence can be made on rock-dilution and mechanization. Under special circumstances loss of ore can be of the same magnitude, namely if the ore production per year is directly influenced by the loss of ore and can not be compensated by other mining activities. Rock support is of less economic importance compared with rock-dilution and mechanization * presupposed no loss of ore-production.
103
INTRODUCTION
Cut-and-fill has many technical advantages for overcoming a wide variety of problems presented in mining. It is economic in ore recovery, of particular value in the anticipated future shortage of minerals. Rock dilution can be kept low. The method is well suited for selective stoping where it is desirable to keep the ore qualities separate. The working environment is on a par with other methods, while the effect on the general surface environment is definitely positive, because the method invites to underground disposal of the tailings instead of keeping them in large ponds above-ground. Further, the method provides for stable surface conditions without risk of collapsing ground and slides, which of course is of particular value when there are buildings close to the ore body.
The positive features of cut-and-fill are well suited to a world that is getting increasingly concerned with the environment. Finally, the method enables mining to reach greater depths and offers the means to overcome a multitude of mining problems.
The many technical, possibilities of cut-and-f ill have however often disadvantages of limited productivity and higher costs than other mining methods.
Methods
Cut-and-fill can be divided into four different methods.The procedures are outlined in Fig 1. The choice of each variant depends on the strength of the rock (ore resp side walls). The "vertical stoping" method requires good ore and sidewall strength, while the"horizontal stoping" method can be used under conditions where there is lower sidewall strength and even lower ore(roof) strength. "Drift-and-fill" and "undercut-and-fill" can be used under conditions of poor ore strength, the last one under extreme conditions, as the ore itself is replaced by an artificial roof.

104
Figure 1. Cut-and-Fill Methods for varying rock conditions. (Janelid 1973).
In Sweden, the horizontal stoping method is most used, being that employed at the N&sliden Mine among other places. Drift-and-fill and undercut-and-fill are used in Sweden at the Falu Mine, Kristineberg Mine and Garpenberg Mine.The paper is concerned with the method of horizontal stoping for the purposes of this conference. Beginning with a description of development trends in cut-and-fill technology, the paper goes on to consider certain aspects of economic significance. In this way a basis is laid for the discussion of topics such as mining mechanization.
DEVELOPMENTS IN MINING TECHNIQUE
Some general development tendencies in the world of cut-and-fill mining can hitherto be described as- Change-over from dry waste-rock filling to hydraulic
filling, mostly with tailings.- Increased use of cemented hydraulic fill.- Change-over from trackbound to trackless loading and
transport.- Increased use of ramps instead of raises and orepasses
for communication and transport.
In Sweden the development of cut-and-fill mining for "horizontal stoping" can hitherto be described as the "three generations" of mining technique with changes concerning number of stopes in the mine (towards "concentrated mining"), access to the stopes (tdwards ramps), type of ore passes and mechanization level. The development can be seen in table 1 .
105
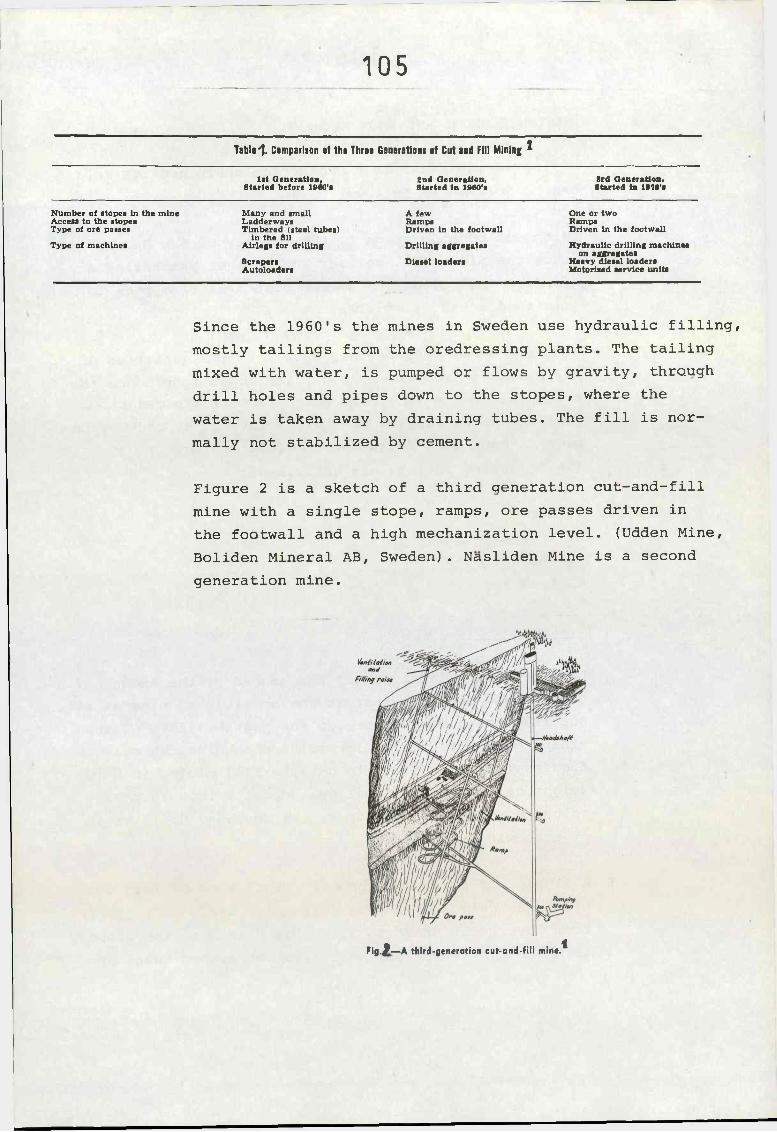
Table 1. Comparison of the Three Generations of Cut and Fill Mining *
1st Generation, Started before 1060’s
2nd Generation, S tarted In 1960’s
8rd G eneration, S tarted In 1070’s
N um ber o f stopes In the m ine Access to the stopes Type o f ore passes
Type o f machines
M any and sm all Ladderways T im bered (steel tubes)
in the f i l l A lr le g s fo r d r il l in g
ScrapersA uto loaders
A few RampsD rive n In the fo o tw a ll
D r il l in g aggregates
D iesel loaders
One o r tw o RampsD riven In the fo o tw a ll
H yd ra u lic d r il l in g m achines on aggregates
H eavy diesel loaders M otorised service u n its
Since the 1960's the mines in Sweden use hydraulic filling, mostly tailings from the oredressing plants. The tailing mixed with water, is pumped or flows by gravity, through drill holes and pipes down to the stopes, where the water is taken away by draining tubes. The fill is normally not stabilized by cement.
Figure 2 is a sketch of a third generation cut-and-fill mine with a single stope, ramps, ore passes driven in the footwall and a high mechanization level. (Udden Mine, Boliden Mineral AB, Sweden). Nasliden Mine is a second generation mine.
Z*n{i(ahon and
F illin g r a ise
•foadshoft
) / W ® j
Pumpi/tf
ft 1F lg .jr— A third-generation cut-and-fill mine.

106
MINING ECONOMY AND ROCK MECHANICS
Mining is one stage in a production chain and its role can be defined as follows:
With due consideration to the quality of ore and country rock the mine shall deliver for further processing a product that gives the lowest cost from firm rock to finished metal. (Ingler) .
Mining economy depends thus upon both the qualities of the products from the mine and the costs to produce the products. In the following these factors are described from the point of view of their relevance to rock mechanics applications in cut-and-fill mining.The following factors are described.
1. Loss of ore2. Rock dilution3. Mechanization4. Rock support.
1. Loss of ore
Loss of ore is first of all influenced by the amount of pillars and remnants that are not possible to mine at all. Rut it is also dependent upon the possibilities of the mining method to follow irregular orebodies. Normal figures for loss of ore in cut-and-fill mining is 5-10 weightpercent of the total ore deposit. That is small values compared with other mining methods. Still it is of economic importance.
A simple way to study economic influence of loss of ore is to calculate a mine during its whole life history from investment start to its close down when the orebody is mined out. We choose an evaluation method based on

107
net present value (NPV), that is the present value of all the yearly cash flows from a project from its start to its end. We divide the lifetime of the mines into two stages, namely investment stage and production stage with the following economic elements.
^nvestment_stac[e_(pre-production stage)
Investment costs per year for getting the mine inproduction, say during three investment years(year 1 , 2 , 3 ) I1, I2, I3 .
Production_sta2 e_
Hoisted production per year during the mine's production stage, say 20 years, from year 4 Jto year 23 H 2 2
Part of ore products in the hoisted material (concentrates) N^, Nj.-- N 2 2
Selling price of ore products (concentrates)at the mine P4 , P^-- P ^
Production costs per ton hoisted material , R,.-- R2 2
Contribution margin C2 2
Make a cash flow analysis.
Year 1 2 3 4 5 --- 23InvestmentIncomeCosts
- T 1 ~ Z 2 ■J3+H4 * V P4 ~H4 * R4
+H5*N5*P5-h5 -r5
+H23 N23 P23 -H23 R23
Cash flow (CF^) - I 2 -I3 +C4 +C5 --- +C23
108
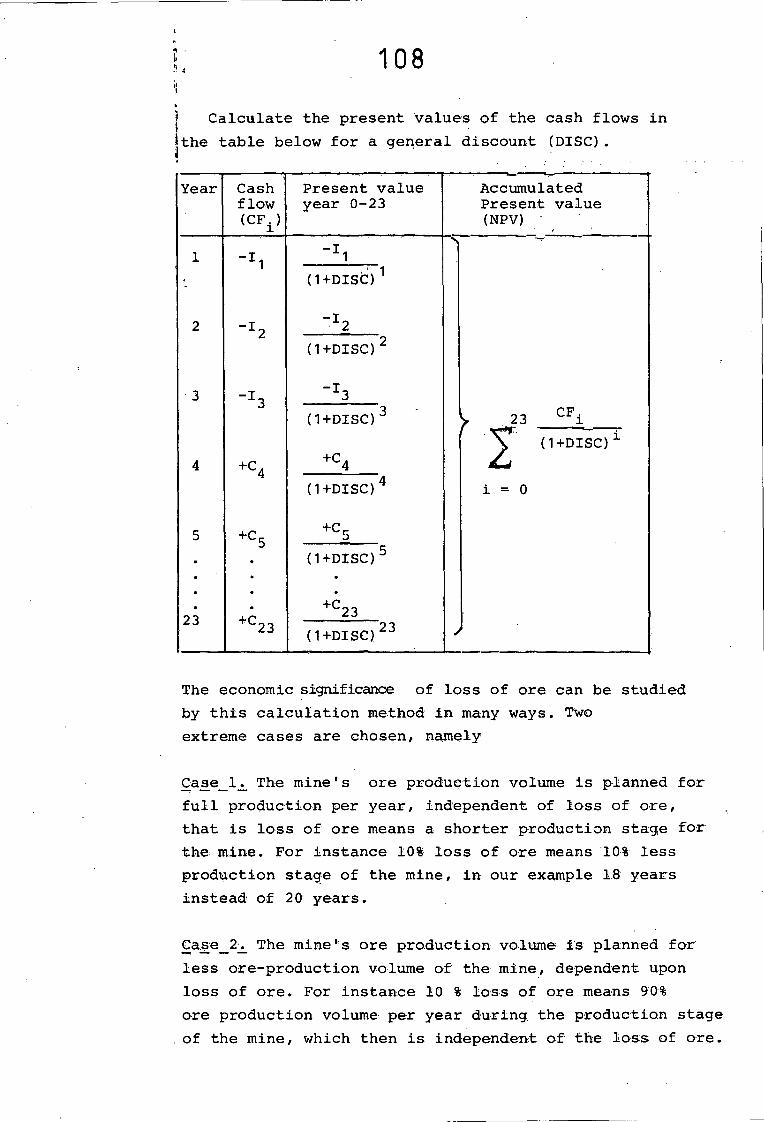
] Calculate the present values of the cash flows int|the table below for a general discount (DISC).
Year Cash Present value Accumulatedflow year 0-23 Present value(CF±) (NPV) /
1 -1!(1+Disd) 1
s.
2 - Z 2- * 2
(1+DISC) 2
3 -I3(1+DISC) 3 y 23 CFi
^ (1+DISC) 1
4 +C4 +C4 (1+DISC) 4
zi = 0
5 +C5 +C5 (1+DISC) 5
23 +C23+<223
(1+DISC) 2 3 /
The economic significance of loss of ore can be studied by this calculation method in many ways. Two extreme cases are chosen, namely
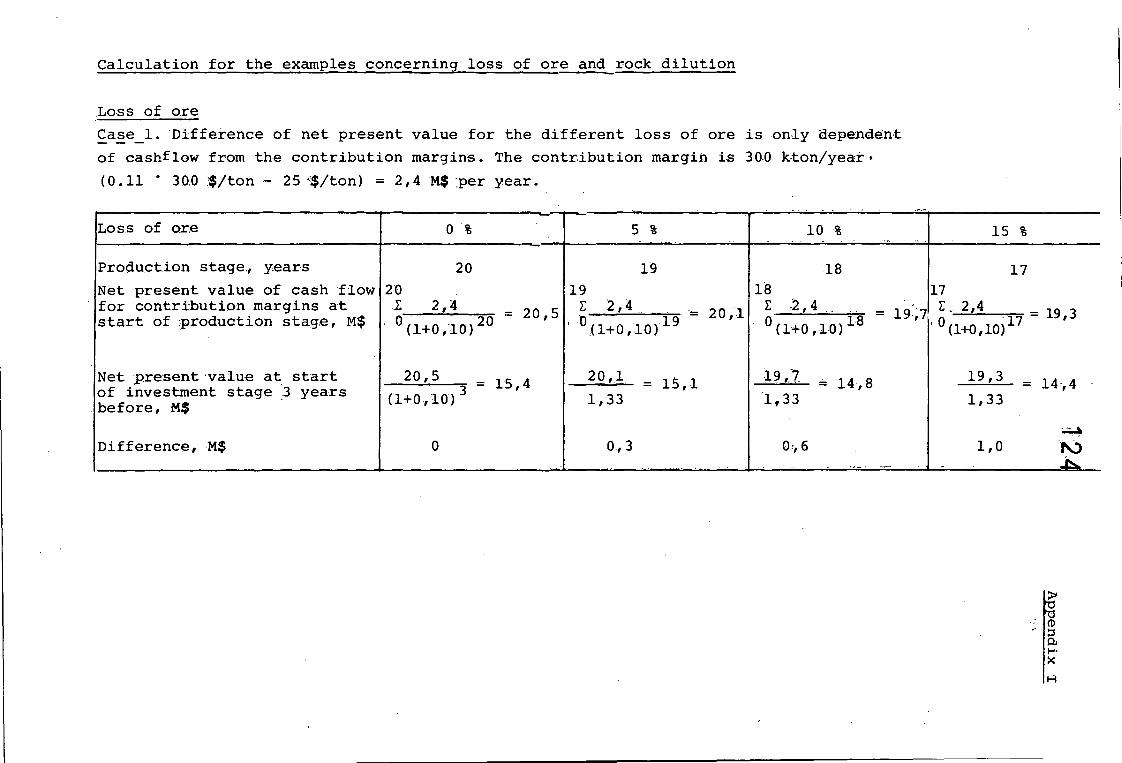
Ca^e_lJL The mine' s ore production volume is planned for full production per year, independent of loss of ore, that is loss of ore means a shorter production stage for the mine. For instance 10% loss of ore means 10% less production stage of the mine, in our example 18 years instead of 2 0 years.
Ca£e_2_L The mine's ore production volume is planned for less ore-production volume of the mine, dependent upon loss of ore. For instance 10 % loss of ore means 90% ore production volume per year during the production stage of the mine, which then is independent of the loss, of ore.

109
Examples for a cut-and-fill mine, 1.2% Cu, 3% Zn and some gold and silver.
I.j = I2 = I3 = 1 0 M$ ; = . . .N2 2 = 0 , 1 1 ton concentrateper ton ore.
P 4 = ...P2 3 = 300 $ per ton concentrate
= ...Rg = 25 $/ton ; Discount = 10 %t
In these examples the same values are calculated for all years,that can of course easily be varied if wanted.
Loss of ore. percentage5 10 15
Case_1Ore H 4=.-H 22-20 Kton/year 300 300 300
Production stage-years 19 18 17Less income compared with no loss of ore, NPV z O_l3M$_ :_-ixog$_
Case_2Ore H4=.*H22 Kton/year 285 270 255
Production stage-years 2 0 2 0 2 0
Less income compared with no loss of ore, NPV -2^2^|= ___z6x4M$. :=-|x|^|=
The calculation is described in appendix I.
The total net present value for the mine's investment and production stages is + 7M$ with no loss of ore or rock dilution.
*
110
Comments. Rock mechanic activities can influence loss of ore to a high degree,by more advanced planning of pillars, remnants, mining sequence and rock support.An influence of loss of ore by 5% is quite realistic tfShich means for the example above a net present value between 0,3-3 M $ . In case 2 it means a smaller income of 0,5 M$ per year during the whole production stage, no discounting made. In reality the actual situations for a mine is somewhere between case one and two. Rock mechanic is thus mostly of clear economic importance.
2. Rock dilution
Dilution of rock in the ore consists of country rock and major areas of rock within the ore boundaries.Rock dilution is defined as weight percentage of rock in hoisted material.
Economic influence of rock dilution is of two kinds!
1. Loss of income depending upon ore being replaced . by country rock in the hoisted material.
2. Costs of the process. In the mine for loading and transport of the country rock and in the oredressing plant for processing country rock and getting weaker results of the flotation.
The economic significance can, as in the case for loss Of ore be studied by calculating a mine during its whole production life. Also here two cases can be studied.
Case 1. The mine1s ore-production volume is planned for full ore-production per year which means more investment for production systems that is planned to process rock waste dilution on top of the ore-production. The hoisted material will then be full ore-production plus waste. Income per year and the mine production-stage are here independent of dilution but production costs are higher. (Costs for processing rock dilution),.
111
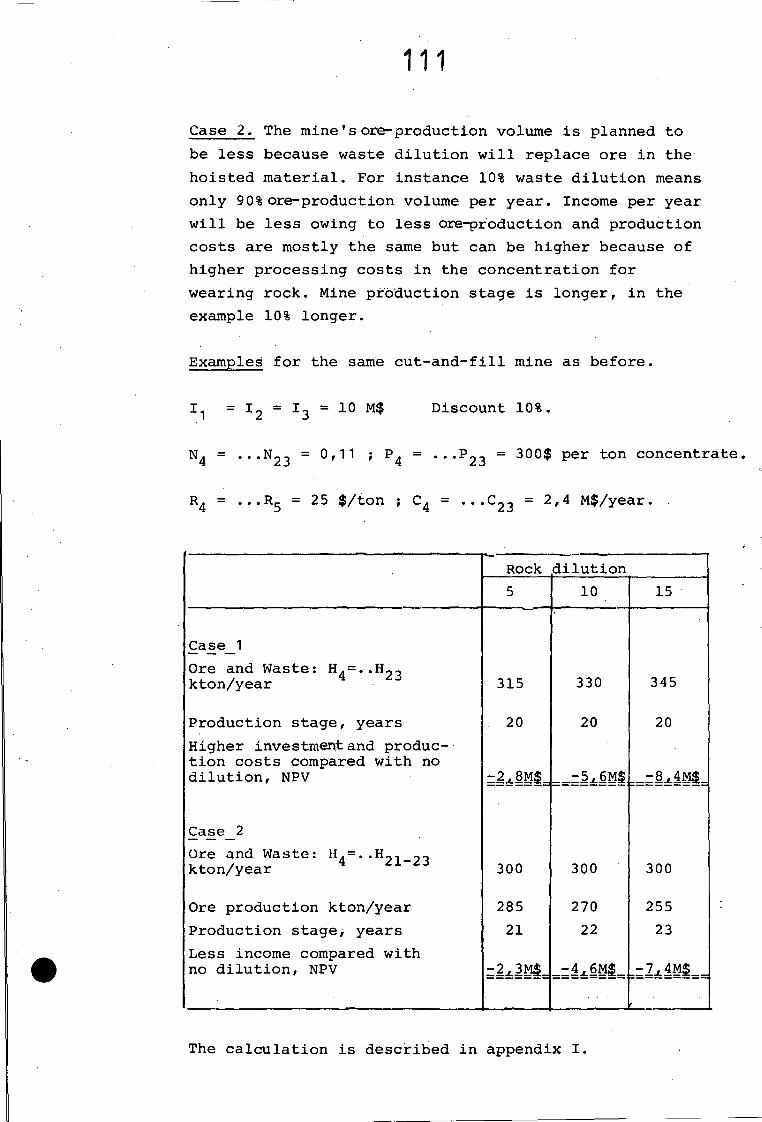
Case 2. The mine's ore-production volume is planned to be less because waste dilution will replace ore in the hoisted material. For instance 10% waste dilution means only 90% ore-production volume per year. Income per year will be less owing to less ore-production and production costs are mostly the same but can be higher because of higher processing costs in the concentration for wearing rock. Mine production stage is longer, in the example 1 0 % longer.
Examples for the same cut-and-fill mine as before.
I 1 = 1 2 = 1 3 = 10 M$ Discount 10%.
= ...N2 3 = 0,11 ; = ...P2 3 = 300$ per ton concentrate
R4 = . . .R5 = 25 $/ton ; C4 = . . ̂ 2 3 = 2,4 M$/year.
Rock dilution5 1 0 15
Case 1Ore and Waste: H 4 =..H2 3 kton/year 315 330 345
Production stage, years 2 0 2 0 2 0
Higher investment and production costs compared with no dilution, NPV =I±Iii= _=-5i|M|
Cas3e_2Ore and Waste: H.=..H-. kton/year 300 300 300
Ore production kton/year 285 270 255Production stage, years 2 1 2 2 23Less income compared with no dilution, NPV =2x 3M$_ .=2jl4^|_=
The calculation is described in appendix I.
Comments. Rock mechanics activities can influence the rock dilution by more advanced planning of stopes, pillars, remnants and rock support. A figure of 10% less ’dilution is realistic, that means for the example above higher costs or less income representing roughly a net present value of 5M$. With no discount that means higher costs or less income of 0,7-lM$ per year during the production stage.
The NPV-value for 10% dilution is near the total net present value for the mine, which underlines the importance of controlling rock dilution as margins often are low.
3. Higher mechanization levels
In a previous section mechanization levels have been described for the three generations of mining technique. The possibilities of mechanization depend upon the sizes of the drifts and stopes, upon stope availabilities and easy access to the stopes.
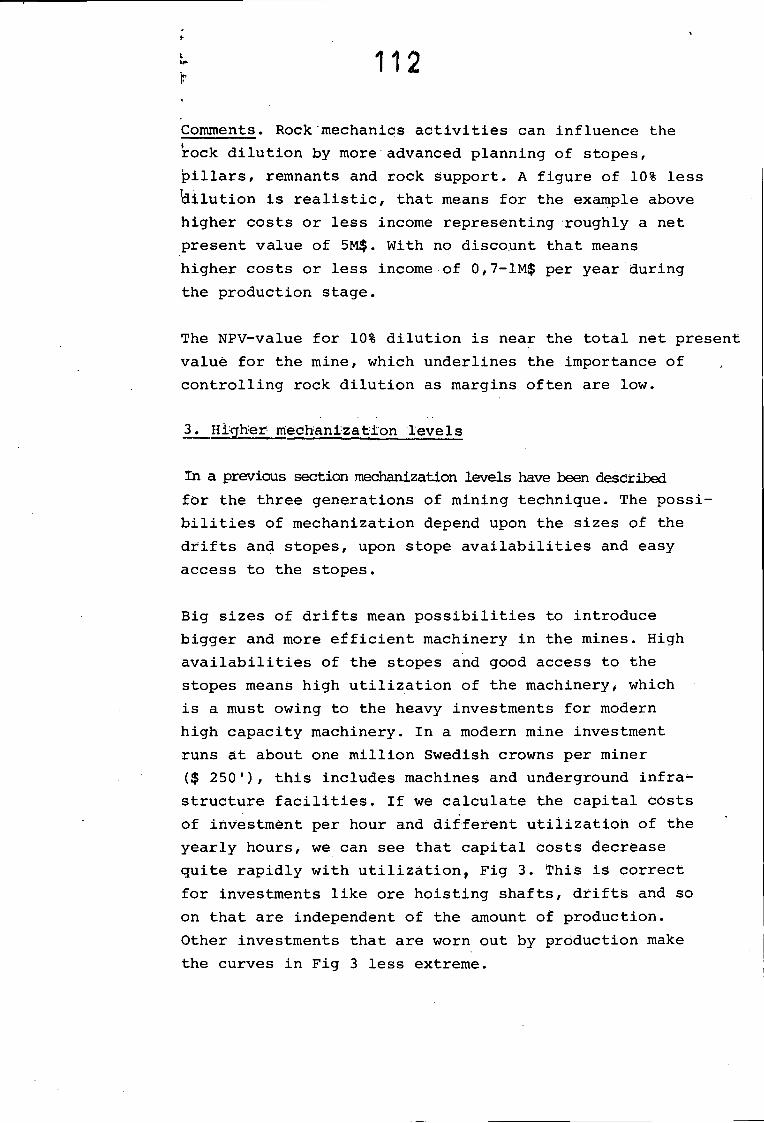
Big sizes of drifts mean possibilities to introduce bigger and more efficient machinery in the mines. High availabilities of the stopes and good access to the stopes means high utilization of the machinery, which is a must owing to the heavy investments for modern high capacity machinery. In a modern mine investment runs at about one million Swedish crowns per miner ($ 250'), this includes machines and underground infrastructure facilities. If we calculate the capital costs of investment per hour and different utilization of the yearly hours, we can see that capital costs decrease quite rapidly with utilization, Fig 3. This is correct for investments like ore hoisting shafts, drifts and so on that are independent of the amount of production.Other investments that are worn out by production make the curves in Fig 3 less extreme.
113
CAPITAL COST PER HOUR AS FU N C TIO N OF U T IL IZ A T IO N OF IN V E S T M E N T
CAPITAL C O S T ,____'HOUR
SWCr
150 t
MILL SWCr
MILL SWCr
It 0.25 MILL]
2500 5000 8 7 6 0 HOURS/ _1 6 % IN T E R E S T T tA "10 YEARS DE PR EC IA T IO N
Figure 3. Capital costs per hour as function of utilization4of investment (Hedberg) .
The development of cut-and-fill mines has considerable productivity potential, as exemplified in Fig 4, which shows the results from some Swedish mines. The productivity is given for every mine in terms of the number of working hours required per 1 0 0 0 t of ore mined for all activities underground, excluding investigations and preparation.The hours are given for the production volume in tons of ore mined per annum for each mine. There are obviously considerable differences between the three generations of mining methods.
Similar values and trends are shown for costs. In the figure, the investment costs for mechanization are compared.
The environment conditions have become better with physically less demanding and safer work. However certain mechanization measures have intensified the demands for diesel exhaust control by ventilation and cleaner equipment.

Man requirement (all personal) underground Machinerequirement ug.
I nvestment costs, SwCr/ton
Work i nghours/1000 ton oreTon/manshift
C u t-a n d -F ill. 1st generation ( 50 's
8 --10003 mines
C u t-a n d -F ill, 2nd generation (6 0 's ) 2 mines
16 --5 0 0• Cut-and-F ill, 3rd generation (70* s ) 2 mines
80--100
0.1 0.2 0.5 1.0Mineproduction Mton ore
Figure 4. Man- and Machines requirement for the three technique-generations in cut-and-fill (1973)
It can be stated that the change-over to highly mechanized mines is to some extent the result of rock mechanics involvement. Rock mechanic investigations could however have been even more utilized. For example the sizes of drifts and stopes, their form and localization and the amount of rock support are all of relevance here. Rock mechanic means can to a higher degree give recommendations about form and localization of the drifts and the stopes and also about the amount and type of the rock support, and thus make it easier to introduce bigger and more efficient machinery to the mines.

115
Stope availabilities depend upon uncontrollable rock- falls in the cut-and-fill stopes, that can also be diminished by rock mechanic means with less rock-falls as result. Accesses to the stopes depend on mining lay-outs, namely proper localization of ramps for stability and proximity to the stopes, so the equipment can easily be moved between stopes. In this way the utilization of the equipment can be better and modern high capacity machinery of high investment costs can be more fully introduced in the mines.
The economy of rock mechanic activities in these areas can be evaluated from figures of productivities and investment costs as in Figure 4. The figures are very promising and indicate possibilities for cut-and-fill to compete with the low cost underground mining methods, especially in areas demanding refilling, mining of irregular orebodies or selective mining.
Rock mechanic activities are more essential in cut-and- fill than other mining methods depending upon the many technical parameters, being able to optimize, namely both in stoping and filling. For a cut-and-fill mine in the examples mentioned for loss of ore and rock dilution, rock mechanics activities can influence costs considerably. Cost reduction in stoping of 20% means in our example 0 , 6 M$ per year (no discount).
4V Rock support
The mechanization of the mines requires more effective measures to be taken for the support of the rock because of the larger stopes as well as the reduced possibilities of the operator for observation and control of the area. However, mechanization has also facilitated the development of techniques for rock support.
In cut-and-fill mining, bolting is the most common method. Shot-creting was introduced in Swedish mines in the middle sixties and is used now as a complement to

bolting.
Rock bolting is nowadays highly mechanized, involving the drilling of bolt holes by mobile hydraulic boom equipment. The mechanization of the mounting is under development. Most of the bolts are of 3/4"-7/8" iron bars cemented into the holes and not pre-stressed.
Costs for bolting can be seen from figures below, both for single bolts (fig 5) and systematic bolting (fig 6 ). Costs are from the late seventies and are representative . for cut-and-fill. (Original figures from the construction technique^.
otal costs forompleted bolt
ls$ SvtCr
50--2Q0
30--120
2 0 -- 80
10-- 40
1 5 Length of bolt, m
U s $ /ft SwCr/m3m bolt/m 2 0.9 ft bolt/sq.ft
2m bo lt/m 2
75-- 9001 m bolt/m 2 0 3 ft bolt/sq.ft50- - 600
25 - 300
0 2 6 8 10 Width of stope.m
Fig 5. Total costs (drilling and mounting) for complete bolt.
Fig 6 . Total costs for systematic bolting per stope length.
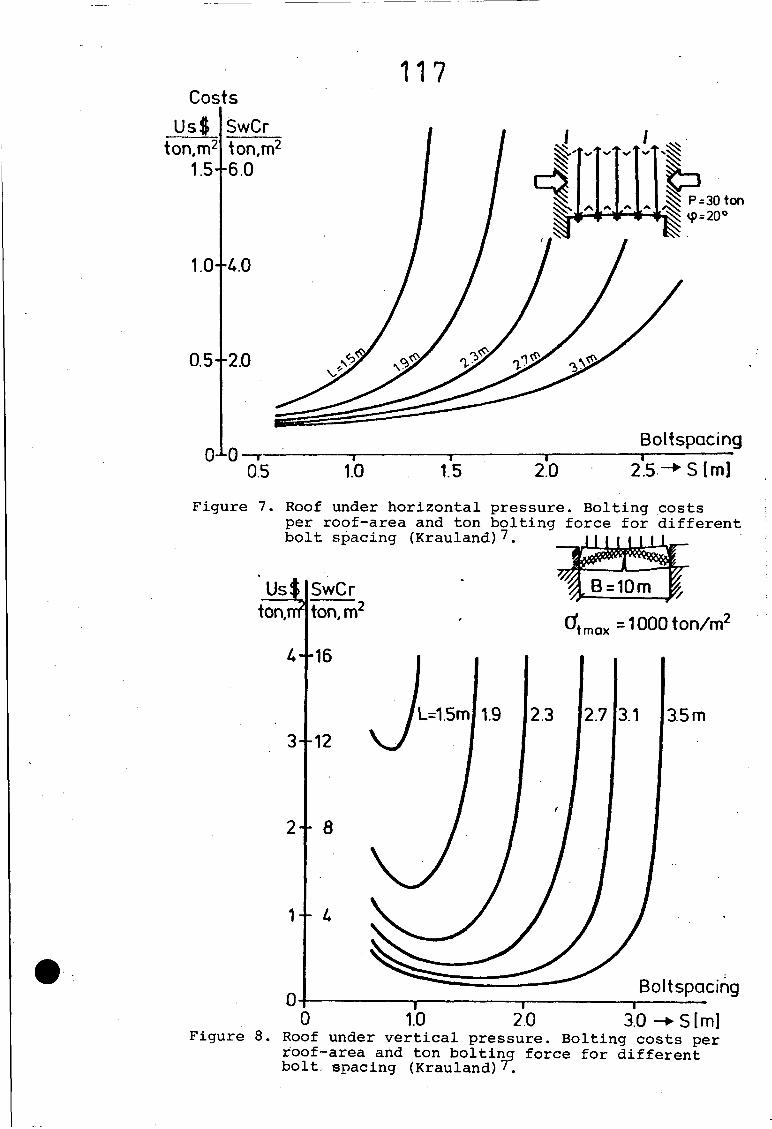
7Krauland gives interesting figures for rock bolting costs where two most probable cases are studied, namelybolting of cut-and-fill roofs under horizontal and vertical loadings respectively. Most probable is a combination of these two states of Stresses* Costs are calculated per bolted area and ton bolting force, see figures 7 and 8 .
117Costs
SwCrUs
<p=2o
1.0 -< 0
0.5--2.0
Boltspacing
2 .5 -► S im ]2.00.5
Figure 7. Roof under horizontal pressure. Bolting costsper roof-area and ton bolting force for different bolt spacing (Krauland) 7 . 111(11 l_L
B = 10mSwCrton, m
CX = 1000 ton/mtm ax
L=15ml 1.9 2.3 2.7 3.1 3.5m3--
2 - -
BoltspacingT T
0 3.0 -► Sim ]1.0 2.0Figure 8 . Roof under vertical pressure. Bolting costs per
roof-area and ton bolting force for different bolt, spacing (Krauland) 7.

118
In figure 7 the reinforcement effect is to apply a compression against the free rock surface. In this way the rock can not so easily deform arid the. bearing capacity rises. Cost diminishes fast with less spacing and longer bolts, which is recommended for technical applications.
In figure 8 the reinforcement effect such as to create an arch bearing the bolted rock's own weight and body forces fran the overlying rock. Also here cost diminishes with less spacing and longer bolts, which fact is to be recommended.
Shotcreting
Shotcreting normally uses equipment of two-chamber type which is normally designed for dry material. Guniting is normally done by a two man crew, one operates the machine while the other directs the nozzle. The operator is responsible for loading, sluicing and pressure control at the machine, while the man at the nozzle adjusts the water flow and sprays the concrete in the stope.
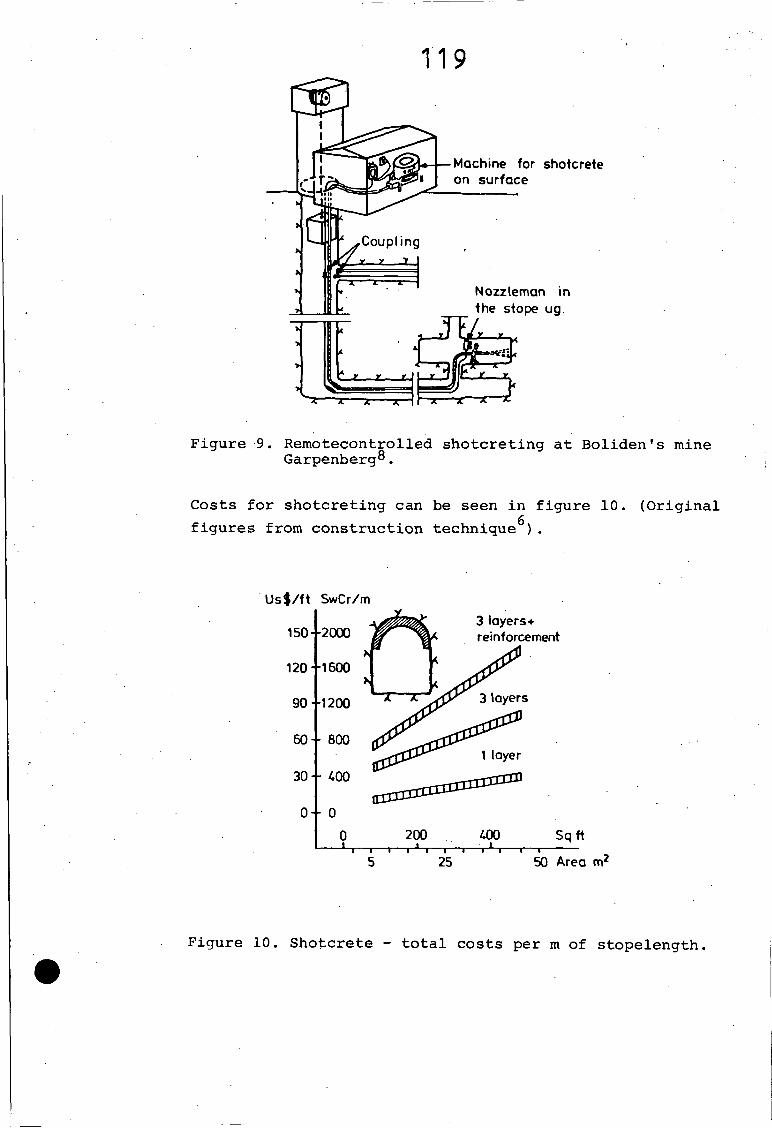
An advanced form of shotcreting is practised in Garpen- berg Mine, central Sweden. The machine is situated on the surface and connected to the underground workings by a pipeline. The shotcrete is remotely controlled by the nozzleman underground in the stope,. Shotcreting has been used vertically up to a distance of 300 m and horizontally up to 500 m with acceptable limits of concrete strength and waste, see figure 9.
119
Si Machine for shotcrete on surface
Coupling
Nozzleman in the stope ug.
Figure 9. Remotecontrolled shotcreting at Boliden's mine Garpenberg®.
Costs for shotcreting can be seen in figure 10. (Originalgfigures from construction technique ).
U s $ /f t SwCr/m
3 layers* reinforcement150--2000
3 layers90--1200
6 0 -- 8001 layer
0 - -
200 100 Sq ft
50 Area rrv5 25
Figure 10. Shotcrete - total costs per m of stopelength.
120
Comparison of different reinforcement methods
The amount of rock support is to a high degree dependant on the over all stabilization situation of the mine and can be modified by other technical activities, for example smooth blasting.
A cost comparison of three different mining operations to stabilize a cut-and-fill stope can be seen in figure 1 1
Cautious blasting (smooth blasting and presplitting), bolting and shotcreting are compared for all activities at the same cost levels. The costs include all operations underground and material transport frbrn surface to stope underground and consist of wages, materials,energy, repair and machine investments. In Figure 11 is
2shown that one bolt per m is ’ cost-.comparablewith smooth blasting at 3 cm hole-spacing or Shotcretingwith one layer (= 3 cm thickness).
The cost comparison is made in 1964 but correlated forinflation to the late seventies; The equipment was adapted to .first generation cut-and̂ -fill techniques, so the figures can differ for highly mechanized equipment. However, such costs comparisons can be used for optimizing different reinforcement methods.
The most common method of bolting in cut-and-fill miningdiffers in volume a lot from mine to mine. Values between
20 , 1 and 1 , 0 bolt/m are not unusual, considering both sidewalls and roofs in the cut-and-fill stopes; This means 1-10 Sw cr/ton (0,2-2,5 US $ per ton) Or 2-20% of mining costs. For a mine in the example fearlier thiis means 0 1-0 > 7 M$ per year.
Rock mechanic activities can influence costs for bolting a lot when more research results appear concerning the

121Costs
SwCr2m
BOLTINGBLASTING SHOTCRETING
-150
' Presplitting30--120
- 90200 m Roof-area
20 m _Roof-area,15-- 60
Smooth blasting
30
Bolt density, [ij)0 lts /m § Thickness of concrete layer,|cmj
Figure 11. Comparable costs for cautious blasting,^bolting and shotcreeting in cut-and-fill stopes .Costs per m2 roof area.
dimensions of the bolting bolt types, length and spacing of bolts Now bolting is mostly based on the miner's own experience and he decides where and when bolts should be mounted.A more "scientific" approach to bolting can result in more safe mining or/and lesser bolting costs. Safe mining can hardly be evaluated in money but apparently the economic aspects for bolting are not of the same magnitude as ore-losses, rock dilution and mechanization.
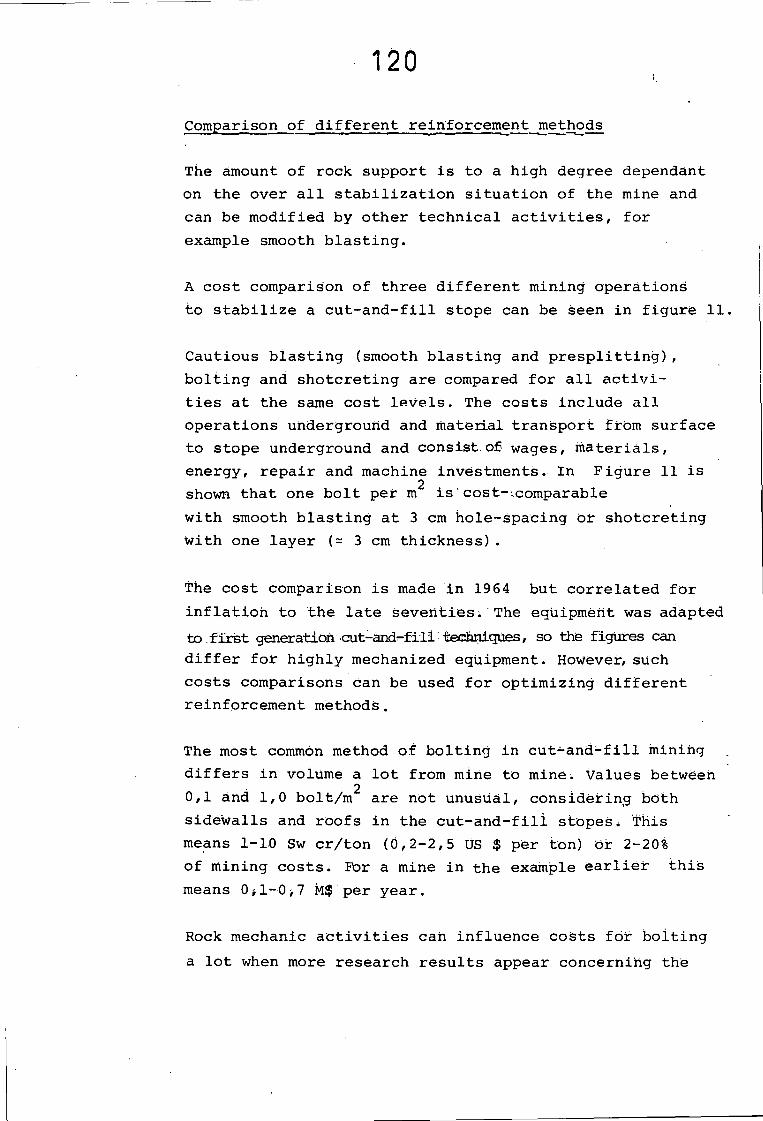
However, if insufficient bolting causes disturbances in the production the economic influence can be greater.The disturbances can create loss of production and adding costs for instance to start mining in new stopes or making complementary bolting or scaling. A qualitative description of this complex can be described as in figure 1 2 .
Less i ncome orHighercosts
Loss of Production
to new stopes
Complementary Rock support
Complementary Scaling
►Volume of Rock support
Figure 12. Description of economic influence by rock support volumes (Krauland)7.
Thus,rock support volumes is coupled to economic risks caused by disturbances. It can thus sometimes be most economic to introduce systematic bolting in a mine. Although the bolting ..costs increase, the overall economy can benefit.
Summary
Rock mechanic activities have been analyzed owing to economic influence. The biggest influence can be made on rock dilution and mechanization. Under special circumstances, loss of ore can be of the same magnitude, namely if the ore production per year is directly influenced by the loss of oire and can not be compensated by other mining activities. Rock support is of less economic importance compared with rock dilution and mechanization, assuming no loss in ore-production.
123
References
1. Almgren, G. "Cut-and-Fill Mining in Sweden - develop ment trends and applications". AIME Transactions,March 1976.
2. Ingler, D. "Rock dilution in underground stopes". World Mining, Aug 1975.
3. Westlund, C. "Speculations about cost structure and total economy in mechanized underground mining". Atlas Copco symposium on sublevel caving, Sept 1972.
4. Hedberg, B. "Influence of Capital Costs on Modern Underground Mining". IX World Mining Congress, 1976.
5. Almgren, G. "Ways of development for Swedish Mining" Swedish Mining Association, Annual Meeting 1978 (in Swedish).
6 . Jansson, B. "City Planning and the Urban Underground Underground Space Nov/Dec 1978.
7. Krauland, N. "Rpek bolting and economy" Univ of Lulea Report 1979:77T (in Swedish).
8 . Almgren, G. "Moderne Bergbautechnik in den Boliden- Gruben". Erzmetall 27 (1974).
9. Almgren, G. "Concrete Guniting Practices at Boliden" Canadian Mining Journal, Aug 1965.
Calculation for the examples concerning loss of ore and rock dilution
Loss of oreCase_l. Difference of net present value for the different loss of ore is only dependent of cashflow from the contribution margins. The contribution margin is 300 kton/year • (0.11 * 300 :$/ton - 25 $/ton) = 2 , 4 M$ per year.
Loss of ore 0 % 5 % 1 0 % 15 %
Production stage., years 2 0 19 18 17Net present value of cash flow for contribution margins at
2 0 y 2 4 19
£ 2,4 _ iq I18
Z 2,4 .... = 19-,717y 2 4 ̂ - in -3start of production stage, M$ , 0 2 0 ~ u • D (1 + 0 /1 0 ) ̂ , 0 19 “ ' u (1 + 0 ,1 0 ) y °(1 +0 ,1 0 ) 1 8 .0 17 ' U(1+0 ,1 0)
Net present value at start 20,5 _ , - . 2 0 , 1 _ 1 5 , ■II,r̂(T\tH' 19,3 _ H . 4
of investment stage 3 years before, M$ (1 + 0 ,1 0 )
ij, J-1,33 1,33 1,33
Difference, M$ 0 0,3 Or, 6 1 , 0 K d„■ ... . -fc,
I>yyro- 3QiH-X

Case_2. Difference of present value is only dependent of less income for loss of ore production.
Loss of ore, percentage 5 % 1 0 % 15 %
" " Kton per yearNet present value of loss of income at start of production stage, M$
NPV at start of investment stage, M$
15
2° 15” 3 3 ! = 4 25u on H r *30 (l+0 ,1 0 )zu
4 -f.2 5 . - 3 2 (1 +0 ,1 0 )J
302 0v 30'- 33 ,
2 0 '0 (1 +0 ,1 0 )
® ' 5 - 6 4 1,33
452 ® 4 5 i• 3 3 E = 12,8 0 (1 +0 ,1 0 ) u
1 2 , 8 _1,33 9 , 6
K>cn
to9OjH-X
H

Rock dilutionCase_l^_ Higher investment and higher production costs owing to higher dilution.
Rock dilution, percentage 10 15A. Net present value for higher
investment costs above originally 3,3 M$ per year during 3 years, M$
B. Net present value of higher production costs at start of production stage, M$Same value at start of investment stage, M$
C. Sum of A and B
3,33Zo (1+0,10)20
3 * 0;.05 = -0,42
z300"25$ . 0 # Q 5 = _ 3 2
0(1+0,10)-3,21,10' = -2,4
- 2,8
Z — ^ =• * 0,10 = -0,830 (140,10)
203001*25 Z---- * 0,10 = -6,40 1,10
Z M _ = -4 81,33 '
-5,6
Z -J-<- .... ̂ •• 0,15 = -1,25 0 (1+0,10)20 3001’25 Z - - ’ 0,150 1,10-9,61,33
20 = -9,6
= -7,2
-8,4
Case 2. Less income owing to lower ore production.
Rock dilution, percentage 0 5 1 0 15Ore production, Kton per yearProduction stage, yearsNet present value of income at start of the production stage, M$The same value at start of the investment stage, M$
Difference from no rock dilution, NPV M$
3002 0
2? 300' * 33$ _ oc
2852 1
2 l 285’ ’ 33
2702 2
22; 270’ ’ 33
25523
23' i 255’ ’ 33OA 0*3o (1+0 ,1 0 ) u
— --T = 63,51 ,1 0 J
0 (1+0 ,1 0 ) 2 1 61,2
-2,3
0 (1+0 ,1 0 ) 22 58,9
-4,6
0 (1+0 ,1 0 ) 23 56,1
-7,4
roOx
>tot)(D3OjH-X