abstract bailey, tiffani nicole. tailored surfaces
TRANSCRIPT

ABSTRACT
BAILEY, TIFFANI NICOLE. Tailored Surfaces: Modifying Chemical and Physical Properties at the Liquid/Solid Interface to Address Optimizing Surface Chemistry
Applications. (Under the guidance of Dr. Chris Gorman and Dr. Jan Genzer.)
The research presented in this PhD thesis focuses on surface modification techniques to
enhance potentially useful behavior of materials on surfaces. The principal objectives of this
work include (1) investigating the physico-chemical phenomena at the liquid/substrate
interface to enhance current methods of moving meso- scale liquid droplets (2) developing a
polymer brush gradient on silicon to enhance the efficiency in binding and detection of probe
molecules and (3) tailoring a poled substrate by electrostatically binding polar molecules to
form a molecular assembly. Research was conducted by varying the physical properties of a
liquid in motion (including, surface tension, viscosity) and the characteristics of the substrate
upon which the liquid moves. The latter will include both physical and “chemical” roughness
(i.e., variation of chemical functionalities present at the surface unit) of the substrate.
We also identified an efficient method of increasing DNA immobilization and hybridization.
A polymer brush molecular weight gradient was used as a platform for DNA attachment.
Fluorescence microscopy was used to obtain relative fluorescence intensity values indicating
DNA hybridization and attachment to the polymer backbone. The microscopy technique
provided evidence indicating an increase in DNA attachment to the polymer backbone as the
polymer chain length increased.
A method of using self-assembly to develop interactions between a polarized ferroelectric
domain and polar molecules was also studied. We demonstrated selective binding of

bromoacetic acid to a single faced poled lithium niobate surface using XPS. Thus, a poled
substrate was tailored by electrostatically binding polar molecules to form a molecular
assembly.


ii
DEDICATION
This thesis is dedicated to my parents, Professor Ronnie and Mrs. Terry Bailey.
Thank you for always making me feel like there was no limit to anything I ever wanted to
achieve. I could not have done this without you.

iii
BIOGRAPHY
Tiffani Nicole Bailey was born in Portsmouth, VA on May 16, 1980 to Ronnie and Terry
Bailey. At the age of 1, she and her family moved to the place she considers home in
Greensboro, NC. Tiffani has one younger brother, Ronnie Terence Bailey. Tiffani graduated
from Dudley Math, Science and Technology Academy in 1998. She attended Hampton
University in Hampton, VA to pursue a degree in Chemistry. As an undergraduate, Tiffani
was a member of the American Chemical Society, American Society for Pharmacology and
Experimental Therapeutics, Beta Kappa Chi National Scientific Honor Society, Delta Sigma
Theta Sorority, Inc and the Student Government Association. She was also the recipient of
awards from the Office of Naval Research, Virginia Air and Space Grant Consortium,
National Science Foundation, and the National Organization for the Advancement of Black
Chemists and Chemical Engineers. The author studied abroad in places such as: Oxford
University in Oxford, England at the Edgerton University in Kenya, Africa. In 1998, she
graduated with honors from Hampton University with a Bachelors of Science in Chemistry.
In the fall of 2002, Tiffani started her graduate career in Chemistry at North Carolina State
University located in Raleigh, North Carolina. Under the guidance of Dr. Chris Gorman and
Dr. Jan Genzer, Tiffani conducted inter-disciplinary research focused on tailoring surfaces by
modifying their chemical and physical properties for novel surface chemistry applications.

iv
ACKNOWLEDGMENTS
First and foremost in the words of K.K. Wong “ I would like to thank God for giving the
scientific community such wonderful insights into His creation.” I am grateful for having the
opportunity to be used as a vessel.
I would like to thank my advisors Dr. Chris Gorman and Dr. Jan Genzer (Dr.G). Dr.
Gorman, I am pleased to have had the chance to work under your leadership. I have learned
how to conduct research, analyze the data, and most of all “make my research tell a story”.
Your words of wisdom have helped me become a better chemist. Thank you for your support
and guidance. Dr.G, even though I am not a chemical engineer you welcomed me into your
group 4 years ago without any hesitation. You have been more than just a boss but a person
whom I truly admire as a scientist, professor, and mentor. Thank you for the leadership and
the laughs. In addition to my advisors, I would also like to thank all of the past and present
members of the Gorman and Genzer groups for your support and assistance.
To my committee members Dr. Ed Bowden and Dr. Christine Grant, I thank you for
your assistance and for challenging my abilities to become a better scientist. Dr. Grant words
cannot express how thankful I am to have come across your path. Thank you for everything. I
would also like to acknowledge the encouragement and support from Dr. Dave Shafer the
Assistant Dean of the Graduate School.
Throughout the years, several programs and mentors have exposed me to the
wonderful world of science. I am overly grateful to Dr. Patricia Legrand, Mrs. Toni

v
Lamberth, Dr. Henry Collins, and Dr. Valarie Guthrie, who have supported and encouraged
me to pursue a degree in Chemistry because of their own love for the field. Programs such as
the NC A&T Saturday Academy, Greensboro Area Math and Science & Education Center
Programs, NC A&T Engineers Starter Program, Bennett College Pre-College Program,
Florida A & M University Actuarial Science Program and the Ronald E. McNair Program
were very instrumental in exposing me to the S.T.E.M. (Science, Technology, Engineering,
and Mathematics) disciplines and keeping me in the “pipeline” since the age of 7 years old.
While at Hampton University, I had the pleasure of crossing paths of the following
instrumental chemistry professors, Dr. Isai Urasa, Dr. Willie Darby, and Drs. Edmond and
Grace Ndip, Dr. Ward Mavura and Dr. Joseph Williams.
A special thanks to Tashni-Ann Coote and Ibrahim Bori, friends and colleagues who
kept me motivated and determined that we would all would see the finish line in the end.
Thank you Shani Smith, Michelle Bowman, and Courtney Hinson for your support during
my years as a graduate student.
Finally, I would like to thank my family for believing in me. I have always remembered the
saying “Every river has its source”. Thank you for being my source as I traveled this journey.
Congratulations little brother, it looks like we will be graduating together, I am proud of you.
To my future husband, William G. Lash your words of encouragement, patience and flowers
made me feel that I was never alone. You are everything that I dreamed of in a partner for
life. Thank you.

vi
TABLE OF CONTENTS
List of Tables…………………………………………………………………………….. viii List of Figures……………………………………………………………………………. xii List of Schemes……………………………………………………………………………. xiii Chapter 1: General Introduction and Project Objectives……………………………... 1
1.1 Meso-scale Liquid Transport via Surface Tension Gradient 1.1.1: Surface Wettability and Modifications……………………… 1
1.1.2: Motion of Liquid on a Chemical gradient ………………….. 7 1.2 Surface Modifications: Surface Tethered Polymers 1.2.1 Polymer Thin Films………………………………………….. 9
1.2.2 Surface Based Polymerization……………………………….. 10 1.3 Surface Modification: Charge Modification 1.3.1 Polled Lithium Niobate………………………………………. 11 1.4 References………………………………………………………………….. 13
Chapter 2: Liquid Transport: Modification of Surface Topography to Reduce Friction
at the Liquid/Substrate Interface
2.1 Project Goals and Motivation……………………………………………... 15 2.2 Introduction……………………………………………………………….. 15
2.3 Results and Discussion……………………………………………………. 19 2.4 Conclusions………………………………………………………………... 24 2.5 Implementation / Experimental
2.5.1 Preparation of Porous Silicon……………………………….. 25 2.5.2 Preparation of F8H2 Gradient on Porous and Flat Surface…. 26 2.5.3 Characterization of the Porous Silicon Surface……………… 27 2.5.4 Measurement of Contact Angles and Drop Velocity………… 27 2.6 References………………………………………………………………….. 29 Chapter 3: Liquid Transport: Effects of Surface Tension and Viscosity on a Viscous Droplet in Motion 3.1 Project Goals and Motivation……………………………………………… 31
3.2 Introduction 3.2.1 Mechanisms to Induce Droplet Motion……………………… 32
3.2.2 Droplet Contact Line Dynamics and Composition………….. 34 3.3 Results and Discussion
3.3.1 Viscous Drop Motion on a Tilted Non-Wettable Solid and Chemical Gradient………………………………………….. 36
3.4 Conclusions………………………………………………………………. 48 3.5 Implementation / Experimental

vii
3.5.1 Surface Preparation………………………………………… 49 3.5.2 Contact Angle Measurements……………………………… 49 3.5.3 Measurements of Drop Velocities and Sizes………………… 50 3.5.4 Equipment……………………………………………………. 51
3.6 References……………………………………………..…………………… 52
Chapter 4: Tailored Surfaces: Polymer Brush Gradients Synthesized via ATRP as a Platform for DNA Immobilization
4.1 Project Goals and Motivation…………………………………………….. 54 4.2 Introduction……………………………………………………………….. 56
4.3 Results and Discussion 4.3.1 Surface Modification and Characterization………………….. 58
4.4 Conclusions…………………………………………………………………71 4.5 Implementation / Experimental
4.5.1 Materials……………………………………………………... 72 4.5.2 ATRP Synthesis of a Surface Initiated Polymerization Gradient………………………………………………………..72
4.5.3 Covalent coupling via 1,1’-carbonyldiimidazole (CDI) reaction……………………………………………………….. 74
4.5.4 Capture Probe Immobilization and DNA Hybridization…….. 74 4.5.5 Instrumentation………………………………………………. 75 4.6 References………………………………………………………………….. 77
Chapter 5: Controllable Nano Patterned Polar Surfaces for Molecular Pattern Formation and Transfer
5.1 Project Goals and Motivation……………………………………………… 79 5.2 Introduction 5.2.1 Ferroelectric Materials……………………………………….. 80 5.2.2 Self Assembly of Polar Materials……………………………. 82 5.3 Results and Discussion 5.3.1 Single Faced Poled Lithium Niobate………………………… 83 5.3.2 Periodic Poled Lithium Niobate ……………………………... 88 5.4 Conclusions……………………………………………………………….. 92 5.5 Experimental 5.5.1 Materials……………………………………………………... 93 5.5.2 Surface Passivation…………………………………………... 93 5.5.3 Instrumentation………………………………………………. 94
5.6 References………………………………………………………………….. 95
Chapter 6: Summary and Outlook 6.1 Systematic Study of Pore Size for Water Motion on Wettability Gradients. 97 6.2 Movement of liquids containing suspended particles……………………… 98 6.3 Systematic study on the Weight Capacity of DNA in a Polymer Brush…... 99 6.4 Polarization Driven Self Assembly using Polar Silanes…………………… 99

viii
LIST OF FIGURES
Figure 1.1 Illustration of a droplet in contact with air and a solid substrate……………..2 Figure 1.2 Simplified schematic showing general formation of a
self-assembled monolayer…………………………………………………… 4 Figure 1.3 Illustration of the diffision source molecules to the silica/silicon wafer
from a molecular gradient…………………………………………………..5
Figure 1.4 Illustration of two types of polymer flm formation: grafting onto, and
grafting from………………………………………………………………… 9 Figure 2.1 (a) Cross sectional scanning electron microscopy image of porous
silicon. The diagram depicts the outline of the porous region after etching. (b) Relative fluorine concentration on the porous substrate decorated with the gradient in F8H2 self-assembled monolayer as determined from the combinatorial near-edge x-ray absorption fine structure spectroscopy experiments………………………………………….20
Figure 2.2 Advancing (solid symbols) and receding (open symbols) contact
angles of deionized water as a function of the position on the F8H2 molecular gradient created on top of a flat (a) and porous (b) silicon substrate. The volume of the probing liquid was 4 ( ), 6 ( ), 8 ( ), 10 ( ), and 12 ( ) µl……………………………………………… 21
Figure 2.3 Capillary number (Ca=v/v*) as a function of the normalized
drop radius (R*=R.∂cos(θ)/∂x) associated with motion of a droplet of deionized water along the F8H2 molecular gradient created on top of a flat (open symbols) and porous (solid symbols) silicon substrate. During the course of the experiment the drop velocity was collected at multiple positions on the sample. The data presented in Figure 3 have been compiled from the drop velocity data collected at the constant contact angle of water equal to: 70º ( ), 65º ( ), 60º ( ), 100º ( ), and 80º ( ). The lines are meant to guide the eye……..23
Figure 3.1 Diagram represents competing forces acting on a drop: weight or
gravitational forces(A) and capillary forces (B).The weight of the drop is responsible for a downward pull of the droplet, while the capillary forces affect the internal flow within the droplet…………………..35

ix
Figure 3.2 Image depicts a 30µL ethylene glycol droplet moving across a
fluorinated gradient on Si. A trail is left behind as the droplet traverses the gradient substrate………………………………………………………...37
Figure 3.3 Graph depicting variations in surface tension (▲) and viscosity (■) for
aqueous solutions containing various weight percentages of sucrose at 25oC. Both an increase in surface tension and viscosity are shown as the sucrose concentration is increased…………………………………………...38
Figure 3.4 A graph depicting the relationship between the volume of H2O droplets
(3, 5, 10, 15, and 30µL) and the tilt angle of a fluorinated homogeneous monolayer on Si substrate required to move them. The graph shows the tilt angle required to induce motion was achieved at 15µL and 30 µL……………………………………………………………...40
Figure 3.5: The advancing (• ) and receding ( ■ ) positions of droplets containing varying sucrose concentrations plotted as a function of time. The sucrose concentrations are (A) 0 %, (B) 10 wt %, (C) 20 wt % and (D) 60 wt %, respectively……………………………………………………42
Figure 3.6: Graph of droplet velocity vs. time for droplets in motion on a
60o tilted substrate. The insert shows a photograph of a 20-wt % sucrose droplet in motion. Droplets contained (♦) 0 wt %, (■) 10 wt %, (▲) 20 wt % and (×) 60 wt % sucrose in water. Lines are drawn through the symbols merely as a guide to the eye. Velocity is measured immediately at the onsite of motion during liquid/ substrate interaction……43
Figure 3.7: Graph of droplet velocity vs. time graph for droplets in motion on an F8H2 gradient. Droplets contained (♦) 0 wt %, (■) 10 wt %, (×) 22wt %, (●) 36 wt % and (▲) 42 wt % sucrose in water. Faster motion for the 22 wt% solution resulted in collection of fewer points. Lines are drawn through the symbols merely as a guide to the eye…………44
Figure 3.8: Graph of velocity vs viscosity on a 60o tilted substrate. 30uL droplets
of 0, 10, 22, 36, 42, 50, 58 and 60wt% of sucrose were used……………….45 Figure 3.9: Depicts Ca vs Boα of 30uL droplets moving on varying inclination
angles (20,40and 60o )………………………………………………………..47 Figure 3.10: Depicts an angle tilt apparatus. The figures include dimensions and set up…51 Figure 4.1: Provides the dry thickness polymer brush profile using ellipsometry
across a silicon substrate corresponding to position and time…………….…60

x
Figure 4.2: FT-IR spectra of hydroxy stretching region plotted as a function of time. Hydroxyl groups were monitored for pHEMA (a), pHEMA/CDI 2hrs (b), pHEMA/CDI 6hrs (c) and pHEMA/CDI 27hrs (d)…62
Figure 4.4: FTIR spectra of a pHEMA brush attached to a Si substrate before
and after reaction with fluoresceinamine…………………………………….64 Figure 4.5: Graph showing fluorescence intensity vs dry pHEMA thickness plot
for fluoresceinamine attachment to a functionalized pHEMA gradient……..65 Figure 4.6: Fluorescence micrographs (top) and corresponding intensity
depicts a.unreacted pHEMA and b-d pHEMA after grafting with DNA probe and complimentary strand via CDI coupling for 63.5 (nm), 37.0 (nm), 21.3 (nm)……………………………………………..68
Figure 4.7: Graph shows fluorescence intensity vs polymer thickness
data for hybridization of complimentary ( ) and non-complimentary ( ) DNA on target DNA modified polymer gradient. The single data point at zero. Dry pHEMA thickness indicates the Background for both samples………………………………….69
Figure 4.8: Atomic force microscopy images DNA coated Gold nanoparticles in a low (22-38nm) and high molecular weight polymer brush (62-74nm). In the low molecular weight regime the density of particles is 18.205 µm3 vs that of the high molecular weight regime of 7.843µm3………………………………………………………….71
Figure 4.9: Illustrates the apparatus designed to systematically vary molecular weight and or grafting density on a substrate…………………………………………….73
Figure 5.1: Illustration is shown of the domain directions of a periodically poled
lithium niobate. The Eapp arrow indicates the direction in which the electric field is applied……………………………………………………….81
Figure 5.2: X-ray photoelectron spectra at a takeoff angle of 90o of poled lithium niobate positively and negatively charged surfaces after vapor phase exposure to bromo acetic acid (Br2CH2CO2H). Representative peaks of Nb and Br are indicated. The Br2CH2CO2H self assembled monolayer was formed under the following conditions (temperature 120oC, vapor pressure 60 torr for 1hr). The Br/Nb (+) / Br/Nb (-) intensity ratio was 3.9 to 1………………………………………85
Figure 5.3: X-ray photoelectron spectra at a takeoff angle of 90o of poled lithium
niobate positively and negatively charged surfaces after vapor phase exposure to bromo acetic acid (Br2CH2CO2H). Representative peaks

xi
of Nb and Br are indicated. The Br/Nb (+) / Br/Nb (-) intensity ratio was .749/.45…………………………………………………………………86
Figure 5.4: X-ray photoelectron spectra at a takeoff angle of 90o of poled lithium niobate positively and negatively charged surfaces after vapor phase exposure to bromo acetic acid (Br2CH2CO2H). Representative peaks of Nb and Br are indicated. The Br2CH2CO2H self assembled monolayer was formed under the following conditions(temperature 100oC, vapor pressure 105 torr for 1 hr). The Br/Nb (+) / Br/Nb (-) intensity ratio was .295/.137……………………………………………………………….87
Figure 5.5: Diagram of periodic poled LiNbO3 as purchased. Illustration (left) indicates the spacing and charge between each periodically poled domain. The right illustration provides the aerial view of the entire periodically poled sample on a single lithium niobate surface……………………………88
Figure 5.6: TOF-SIMS images of a. Br, b. CH, c. H, d. OH (negative)………………....90 Figure 5.7: TOF-SIMS images of a. H, b. Br, c. OH, d. C (negative)…………………..91 Figure 5.8: TOF-SIMS images of a. Br, b. total scan (positive)………………………..92

xii
LIST OF TABLES Table 3.5.1: Contact angle measurements (o) of deionized water, sucrose and glucose…..50 Table 4.1. List of DNA sequences………………………………………………………66
xiii
LIST OF SCHEMES
Scheme 4.1: Schematic illustration of oligonucleotide attachment via carbonyldiimidazole coupling to surface anchored polymer. DP represents DNA capture probe. DC represents the complimentary strand to DP with a fluorophore attachment………………………………………...55
Scheme 4.2: Depicts the synthetic route to forming
poly(hydroxyethylmethylmethacrylate)……………………………………...59 Scheme 4.3: Schematic formation of carbonyldiimidizaole attachment to the
polymer brush backbone……………………………………………………..63
Scheme 5.1: Illustration of the process used to create electrostatic interaction between bromoacetic acid and lithium niobate………………………………83

Chapter 1: General Introduction and Project Objective:
The work presented in this PhD dissertation is centered on surface modification
techniques used to enhance potentially useful behavior of material on surfaces. The topics
discussed include liquid transport on a surface and surface tethered polymers used for DNA
binding. This dissertation will also explore the possibility of selective binding of polar
molecules to polarized, ferroelectric surfaces as a new motif for self-assembly. These three
areas of research are each unified by a simple concept: tailoring the surface to optimize
behaviors in surface chemistry applications.
1.1: Meso-scale Droplet Motion Via Surface Tension Gradient
1.1.1: Surface Wettability and Modifications
Wetting is among the many properties of a surface that can be tailored for a specific
application1 The wettability of a surface by a liquid is defined by the point of contact
between a droplet on a horizontal surface. The spreading parameter of a liquid on a substrate
(S) relates to the wettability of the substrate and the wettability of the substrate by the liquid
is related to the interfacial energies (γ ) at the interfaces between the solid(s), liquid (l) and air
(v) interface (1) as given by equation 1 below. 1
S = γsv - (γ sl + γ lv ) (1)
When S>0, the liquid completely wets the surface. For S<0, partial wetting occurs, during
which the liquid forms a spherical cap on the surface.2 In addition, upon partial wetting a
1

distinct droplet shape is produced which can be defined by the contact angle that the droplet
makes at three-phase boundary between the solid, liquid and vapor (Figure 1.1)
Liquid
Solid/ Vapor ( γ SV )
Solid/ Liquid ( γ SL)
Liquid/ Vapor ( γ LV)
θ
Figure 1.1: Illustration of a droplet in contact with an air and a solid substrate. Θ represents a
static contact angle.
Young’s equation correlates the surface tensions at the solid –liquid (γ sl), solid-vapor (γ
sv), and liquid-vapor (γ lv) phase to the equilibrium contact angle (θe) (2).
cosθγ γ
γesv sl
lv=
− (2)
This equilibrium contact angle assumes a flat, defect-free, non-reconstructing surface. Most
“real” surfaces have chemical or physical defects or a combination of both. In order to assess
the defects in terms of contact angle, the difference between the advancing and receding
contact angles is considered .3,4 The advancing contact angle (θa) is measured by inflating the
droplet until its contact angle stops changing as more volume is dispensed upon the surface.
2

Conversely, removing liquid from the droplet and measuring the contact angle provides the
receding value (θr). The difference between the advancing and receding contact angles is
called the contact angle hysteresis (CAH). CAH is thus a measure of the “ideality” of the
surface. “Perfect surfaces” have CAH≈0. In contrast, large positive CAH values (the
advancing CA is always higher than the receding (CA) indicate that the surface contains
some physical or/and chemical heterogeneity.4
There have been several demonstrations that illustrate how surface wettability can be
modified by changing the chemical and/or physical composition of the surface .5,6 One
commonly used method of tailoring the surface properties is based on deposition of self-
assembled monolayers (SAMs). SAMs are composed of molecules that spontaneously
chemisorb and organize into an organized close-packed assembly on a substrate. Common
substrates and reactants for the preparation of SAMs are noble metals (for attaching
alkanethiols), hydrogen terminated surfaces (for attaching alkenes), and surfaces containing a
metal oxide (for attaching organosilanes and alkylphosphonates). 10 Figure 1.2 illustrates a
self-assembling molecule, which includes an anchoring group with a strong preferential
adsorption to the substrate, an alkyl chain and a terminal functionality (head group).
3

Substrate
Head Groups
Carbon Chain Backbone
Tail Groups
Substrate
Head Groups
Carbon Chain Backbone
Tail Groups
Figure 1.2: Simplified schematic showing the general formation of a self-assembled
monolayer
The organization of the self-assembling molecules in SAMs is governed by the interplay
between the packing of the molecules on the substrate, the interaction of the molecular head
groups with the substrate and any interactions between the molecular terminal groups both
with each other and with any liquids of vapors in contact with the SAM-modified surface.
Alkanethiol molecules are commonly used in the fabrication of a self-assembled
monolayer. These molecules are comprised of an alkyl chain with a sulfur end group. Sulfur
chemically bonds to gold and silver surfaces. Therefore when the alkanethiol comes in
contact with either surface, the molecules self assemble to form a monolayer.
The two most widely used methods of depositing SAMs on a substrate are (1)
immersion of the substrate into a reactant solution of the molecules and (2) vapor-phase
deposition of the molecules onto the substrate. In each method, the exposure time and flux of
the molecules are the key parameters that govern the coverage. The immersion technique
4

produces a monolayer by simply placing the substrate into the reactant solution for a
controlled period of time. The vapor deposition technique consists of a substrate strategically
positioned near the reactant solution. The substrate can be placed either upside-down (thus
facing the source of the diffusing molecules) or along side of the source. In the work
described in this thesis, the latter method will primarily be used to make an in-plane
homogeneous SAM layer. Further, the vapor deposition approach can be modified to vary
the molecular coverage across the surface of the substrate (Figure 1.3). In this technique, the
substrate will be placed horizontally next to a diffusing source comprising the SAM
precursors. As the molecules leave the diffusing source, they form a concentration gradient
in the vapor phase, which subsequently “imprinted” onto the substrate thus forming a
monolayer with position-dependent concentration of molecule in the SAM.
Figure 1.3: Illustrates the diffusion of source molecules to a silica/silicon wafer form a
molecular gradient. Image courtesy of J. Genzer.
5

Molecular gradients are of interest because of the wide variety of applications which
can be used such as selective adsorption, 11,12 gradient templating, 13-16 controlled motion of
liquid droplets, 9,17 particle sorting, 18 and many others. Thus developing techniques that lead
to the formation of molecular gradients have been extensively reported.11, 19-21 These include
vapor deposition, soft lithography techniques and mechanical distribution techniques 7,8 Choi
and Newby developed a contact printing technique that produced a micrometer-scale gradient
surface using an elastomeric stamp.6 Creation of a “double molecular gradient” has also been
shown by Genzer et al.7 Double molecular gradients are formed using two sources of
reactants, which diffuse across a single substrate.
The chemical composition of surface gradients can be characterized by numerous
analytical techniques, including infrared spectroscopy, ellipsometry, scanning force
microscopy and using a quartz crystal microbalance.3, 1 These techniques provide information
about the position-dependent chemistry, molecular orientation, and coverage. With the use of
a contact angle goniometer, contact angle measurements can also measure wettability as a
function of position, which is indicative of surface composition. Contact angle measurements
along the surface of a substrate can indicate areas of differing hydrophobicity / hydrophilicty
indicated by higher / lower contact angles on a chemically modified surface. As a gradient
progresses from hydrophobic to hydrophilic, the contact angle of water with the surface
progresses from higher to lower.
6

1.1.2 Motion of Liquid on Gradients
Wettability gradients can facilitate the motion of liquids across a substrate as the
result of the variability in the interfacial energy between the substrate and the liquid.8 If the
droplet of liquid is large enough to experience a sufficient variability across it, an imbalance
of surface tension forces on opposite sides of a droplet will promote its movement to the
region of lower interfacial energy.1 For droplet motion to occur, it is not only imperative to
design a proper wettability gradient but also to have a low contact angle hysteresis. Droplet
motion should occur when “the minimum receding contact angle at one edge of the drop is
greater than the maximum advancing contact angle at the other edge”. 8 A large hysteresis
increases the difference between the advancing and receding edge of the drop, which, in turn,
slows down or completely inhibits the movement of the droplet.
In 1992 Chaudhurry and Whitesides were able to create an imbalance of surface
tension forces on a droplet9 by producing a wettability gradient that propelled the water
droplet up an inclined plane. The gradient was prepared using a silicon substrate and n-
octyldecyl trichlorosilane (OTS) SAM with the vapor deposition technique. Bain and
Ondarcuhu reported that rapid motion of liquids over longer distances was achievable if a
wettability gradient was created dynamically by a chemical reaction at the liquid/solid
interface. 10,11
In a gradient, the droplet cannot reverse its path along the chemical gradient. To
overcome this limitation, electrical and photochemical approaches were designed to alter
dynamically the chemical functionality presented at the surface and thus to create
reversibility in the wettability along the surface. For example, Abbott and coworkers
7

developed an electrochemical method using a redox-active surfactant based on ferrocene. A
reduction of ferrocinium to ferrocene lowered the hydrophilicity of the surface, thus
generating a surface tension gradient. The surface tension gradient then could be used to
pump liquids reversibly along a channel. 12 In a second example of a dynamically adjustable
gradient, Ichimura and coworkers used a photoresponsive molecular gradient and ultraviolet
(UV) light to develop a reversible method for droplet motion.13 Both the direction and
velocity of the droplet in motion were controlled by varying the direction and steepness of
the gradient in light intensity. A surfactant containing a light sensitive azobenzene moiety
was physisorbed to a substrate. Exposure to UV light caused the azobenzene moiety to
isomerize between its cis and trans forms. Azobenzene has one of two isomeric states (cis or
trans) depending on the wavelength of light used to illuminate the surface. When UV
radiation of 365nm was shined on the monolayer, the trans isomer absorbed this light and
was transformed to the cis isomer. This process could be reversed. The cis isomer could be
transformed to the trans isomer by applying a wavelength of 436 nm.
In another example, Daniels, et al reported an increase in the velocity of a drop on a
surface due to a wettability gradient in the presence of condensation.13 More specifically, the
coalescence of droplets in conjunction with the fast removal of heat from steam condensing
on a gradient surface resulted in droplet speeds ranging from 20 to 40 µm/s. These
demonstrations rely on both the presence of additional energy and gradient surface tension
imbalance to create a driving force that enhances the velocity of the drop.
8

1.2: Surface Modifications: Surface Tethered Polymers
1.2.1: Polymer Thin Films
In the discussion above, small molecules of discrete size were used as the components
of a thin film. An alternative for the modification of a surface is to alter its physico-chemical
properties is the application of a thin polymer film. These tailored surfaces are used, for
examples, for corrosion resistance, responsive materials, and photolithographic masks.25
Polymer thin films can be physisorbed or chemisorbed to a material surface. Polymer films
from solution can be obtained by using spin casting or dip-coating methods. Another
approach is growth of the polymer film off of the surface using a surface-bound
polymerization initiator that can react with monomer molecules exposed to it (See Figure
1.4) Both techniques are widely used and have different capabilities and attributes.
Figure 1.4: Illustration of two types of polymer film formation: grafting onto, and grafting
from. (Illustration courtesy of J. Genzer)
9
1.2.2: Surface Based Polymerization
Surface tethered polymers consist of polymers with reactive end groups being grafted
onto or from surfaces, resulting in a “polymer brush”. Polymer brushes formed by grafting
“onto” a substrate are generally prepared via chemical bond formation between reactive
groups on the surface and reactive end groups on the polymer chain. This technique has the
advantage of a well-characterized chain length of the grafted polymer. However, due to steric
hindrance of the reactive surface sites, this technique provides low grafting density of the
polymer chains to the surface. Polymer brushes grafting “from” or surface- initiated
polymerizations are used to overcome the low grafting density. In order to form high surface
density tethered polymer chains, surface-bound polymerization initiators formed via self-
assembled monolayers are exposed to a monomer solution, resulting in a high surface density
of tethered polymer chains.
To achieve maximum control over brush density and composition, a controlled
polymerization is highly desirable. Several controlled polymerization techniques have been
used to grow polymer brushes including living ring opening polymerization, living cationic
polymerization, reversible addition- fragmentation chain transfer polymerization and atom
transfer radical polymerization.26 Of these, controlled living radical polymerizations have
become the most favored route due to less stringent experimental conditions as well as the
compatibility with a wide range of functional monomers. Section 4.2.1 discusses atom
transfer radical polymerization in detail.
.
10

The conformation of the surface tethered polymers can be very important in
governing the behavior of the polymer coating in a given application and depends upon the
environment around the polymer brush. Good solvent conditions (favorable interaction
between the monomer and solvent molecules) form an expanded coil. The favorable
interactions between the molecules supercede that of the loss of entropy due to chain
stretching. Inversely, polymer brushes in poor solvents form a collapsed globule. There is an
intermediate between good and poor solvent environments, which takes the shape of a
mushroom conformation. However, in applications it is not always useful or possible to
control polymer conformation with environmental variables. Thus, it is desirable to design a
system that dictates the conformation by controlling the molecular weight and the grafting
density of the polymer chains to the surface. To this end, Tomlinson et al designed a
gradient substrate to vary the properties of the polymer surface continuously across the
substrate between two extreme values.27 They used a solution draining method of exposing
the initiated surface to the monomer solution, thus forming a gradient of initiator density. The
steepness of the gradient was determined by the reaction time of the polymerization. The
system can be used to vary molecular weight and grafting density on a single sample. In
Chapter 4, this system will be used to vary the polymer brush thickness in preparation for
DNA attachment.
1.3: Surface Modifications: Charge Modification
1.3.1: Polled Lithium Niobate
Ferroelectric and other polar materials have been used in a number of applications including
piezoelectric sensors, imaging devices and capacitors. Furthermore, ferroelectrics have
11

nonlinear optical properties, which are of increasing interest as the area of integrated optics
continues to expand. Lithium niobate is already being recognized as a metal oxide of choice
for several industries because high quality single crystals can be grown reproducibly. Single
crystals of LiNBO3 are uniaxal crystals, with a polarization vector that can align in two
directions. The direction of this alignment can be controlled by application of an external
electric field (a process known as poling). This results in a bulk dipole at the surface.
However, experimental data exists that indicates that electrical polarization can be detected.
Could this electrical dipole be used as a stimulus for self-assembly? Chapter 5 will discuss
some preliminary experiments to determine if molecules will assemble on a polarized,
patterned ferroelectric substrate. Self-assembled molecules will be used throughout each area
of the following chapters with regards to liquid transport, tethered polymers and polar
substrates.
12

1.4: References
1. DeGennes, P.; Brochard-Wyart, F.; Quere, D. Capillarty and Wetting
Phenomena; Springer Press: NY, 2002.
2 Brochard, F. Langmuir 1989, 5, 432.
3. Ulman, A. An Introduction to Ultrathin Organic Films; Academic Press: CA,
1991.
4. Dertinger, S.; Jiang, X.; Li , Z.; Murthy, V.; Whitesides, G. M. Proc Natl Acad
Sci 2002, 99, 12542-12547.
5. Chaudhurry, M. K.; Whitesides, G. M. Science 1992, 256, 1539.
6. Bain, C. D.; Burnett-Hall, R.; Montgomerie Nature 1994, 372, 414.
7. Ruardy, T. G.; Schakenraad, J. M.;van der Mei, H. C.; Busschner. H. J. Surf. Sci.
Rep. 1997, 29, 3.
8. Clare, B. H.; Efimenko, K.; Fischer, D. A.; Genzer, J.; Abbott, N.L. Chem. Mater.
2006, 18, 2357
9. Bhat, R. R.; Fischer, D.A.; Genzer, J. Langmuir 2002, 18, 4142
10. Plummer, S. T.; Bohn, P. W. Langmuir 2002, 18, 4142
11. Bhat, R. R.; Chaney, B. N.; Rowley, J.; Liebmann-Vinson, A.; Genzer, J. Adv
Mat., 2005, 17, 2802
12. Bhat, R.R.; Tomlinson, M. R.; Genzer, J. Macromol. Rapid Commun. 2004,
25,270
13. Daniel, S.; Chaudhury, M.K.; Chen, J.C. Sience 2001,291 633
14. Petrie, R.; Bailey, T.; Gorman, C.; Genzer, J. Langmuir, 2004,20 9893-9896
15. Ionov, L.; Stamm, M.; Diez, S. Nano Lett. 2005, 5, 1910
13

16. Genzer, J. Molecular gradients: Formation and applications in soft condensed
matter science. In Encyclopedia of Materials Science; Buschow, K. H. J., Cahn,
R.W., Flemings, M.C., Ilschner, B., Kramer, E. J., Mahajan, S., Eds,; Elsvevier:
Oxford, 2002
17. Genzer, J. ; Bhat, R.R.; Wu, T.; Efimenko, K. In Molecular gradient
nanoassemblies; Nalwa, H. S., Ed.; American Scientific Publishers: Stevenson
Ranch, CA, 2004.
18. Genzer, J. J. Adhe. 2005, 81 ,417
19. Genzer, J.; Fischer, K.; Efimenko, K. Applied Physics and Letters 2003, 82, 266.
20. Bain, C. ChemPhysChem 2001, 2, 580.
21. Choi, S.; Newby, B. Langmuir 2003, 19, 7427.
22. Ondarcuhu, T.; Domingues Dos Santos, F. Phys.Rev.Lett. 1995, 75, 2972.
23. Shin, J. Y.; Abbott, N. L. Langmuir 1999, 15.
24. Ichimura, K.; Oh, S. K.; Nakagwa, M. Science 2000, 288, 1624.
25. Garbassi, F., Morra, N., Occhiello, E., Polymer Surfaces: From Physics to
Technology, ( J. Wiley & Sons, New York)
26. General Reference of polymerization techniques
27. Tomlinson, M., Bhat, R., Genzer, J. , Polymer Preprints 2005, 26 (2), 44
14
Chapter 2: Liquid Transport: Modification of Surface Topography to Reduce Friction
at the Liquid/Substrate Interface
This chapter has appeared in publication form
Petrie, R.; Bailey, T.; Gorman, C.; Genzer, J. Langmuir, 2004,20 9893-9896
2.1 Project Goals and Motivation
In this chapter, the motion of water droplets on surfaces decorated with molecular gradients
comprising semi fluorinated (SF) organosilanes is described. SF molecular gradients
deposited on flat silica substrates facilitate faster motion of water droplets relative to the
specimens covered with an analogous hydrocarbon gradient. Further increase in the drop
speed is achieved by advancing it along porous substrates coated with the SF wettability
gradients. The results of our experiments are in quantitative agreement with a simple scaling
theory that describes the faster liquid motion in terms of reduced friction at the liquid/
substrate interface.
2.2 Introduction
Practical studies of liquid movement across substrates have enhanced our
understanding of several academic and industrial fields such as microfluidics, biosensors and
drug delivery. Controlling wetting properties and topography of surfaces can facilitate faster
and more efficient ways of moving liquids. Specifically, altering these parameters can affect
the speed and mechanism by which the droplet travels on a substrate.1-13 A liquid droplet
placed on a surface bearing a spatial chemical heterogeneity can traverse in the direction of
15

the lower contact angle because of the imbalance of surface energies acting on various parts
of the droplet and the tendency of the droplet to establish a new equilibrium. Chaudhury and
Whitesides demonstrated this concept of controlled drop motion driven by variable
wettability originating from the substrate. They showed that a liquid drop can move along a
wettability gradient and in some circumstances can even climb up an inclined plane.1 In their
seminal paper, Chaudhury and Whitesides also recognized the importance of contact angle
hysteresis, i.e., the difference between the advancing and receding contact angles, on the drop
motion. Specifically, they identified that liquid movement occurs when the receding contact
angle of the back (receding) edge of the drop is larger than the advancing contact angle of the
front (advancing) edge of the drop. However, contact angle hysteresis will serve to reduce
the difference between the advancing and receding edge of the drop, therefore possibly
slowing or halting drop motion. To overcome the latter problem, Daniel and Chaudhury used
an external force by supplementing the chemical gradient driving force with an in-plane
vibration of the drop.2 They demonstrated that substrate vibration helped to overcome the
relatively large contact angle hysteresis (≈20°) thus increasing the drop velocity up to ≈5
times.
Recently, Daniel and coworkers provided more insight about the various molecular
parameters that influence the motion of liquid drops on chemically heterogeneous surfaces.3
They argued that the drop velocity (v) is related to the surface tension of the liquid (γ), the
radius of the droplet on the surface (R), and the position-dependent change of wettability: 2,3,4
( )dx
dRvs
θηγ cos
≅ . (1)
In Equation (1) θ is the contact angle of the liquid with the substrate and ηs represents a
viscosity parameter that denotes the friction at the liquid/solid interface.4 Defining the
16

capillary number as Ca=v/v*=vη/γ, where v* equals the surface tension (γ) divided by the
liquid bulk viscosity (η), Equation (1) can be rewritten as:
( ) *RKdx
cosdRKCa ⋅=θ
⋅= , (2)
where the coefficient K accounts for the corrections to η due to the frictional forces at the
liquid/solid interface, and ( )dx
cosdRR * θ= . Daniel and coworkers demonstrated the general
validity of Equation (2) by studying the motion of droplets of various liquids on surfaces
covered with a molecular gradient made of self-assembled monolayer of H3C (CH2) 9SiCl3
(H10-SAM) prepared on flat silica-covered substrates. Data of Ca vs. R* from 4 different
liquids had approximately identical slopes, indicating that K was very similar in all cases
studied and was presumably dictated primarily by the surface energy of the substrate. They
also established the effect of the contact angle hysteresis on the droplet motion. Daniel and
coworkers showed that in the Ca vs. R* plot the hysteresis appeared to cause only a change in
the intercept in the data but not the slope. By utilizing this approach, the researchers were
able to visually separate the effect of friction and contact angle hysteresis on drop motion.
Specifically, the findings of Daniel and coworkers indicate that, regardless of the hysteresis,
the velocity of the droplet will increase (hence the slope in the Ca vs. R* plot increases) when
the friction at the liquid/solid interface decreases.
From this perspective, one can reason that higher drop velocities can be achieved by
lowering the frictional forces experienced by the drop as it traverses the gradient. This
concept contrasts with the earlier focus2 on overcoming hysteresis to maximize the velocity
of the drop. Because of low surface energy and low friction of fluorine moieties, liquid
droplets moving along surfaces comprising variable density of fluorinated groups should
17

move faster, relative to the motion of a droplet moving on an analogous hydrocarbon surface.
Moreover, the friction may be further decreased at the liquid/solid interface by utilizing
substrates with small pores that cannot be wet by a moving liquid. Quéré and Bico have
shown that wettability at the liquid/solid interface can be lowered if air is trapped below the
liquid in the holes of the rough surface. In such a situation, the liquid positions itself on the
surface in a similar fashion as an Indian “fakir” lying on the points of a bed of sharp nails.16,
17, 18 The contact angle (θ*) of a “fakir” droplet residing on such physically rough substrates
is given by: 16
( ) ( )( 1cos1cos * ++−= θφθ s ) , (3)
where φs is the fraction of the liquid/solid interface below the drop. Such a situation should
facilitate a decrease in the friction and a corresponding increase in velocity of the droplet
because of the decreased contact area at the liquid/solid interface.
In the work described in this chapter, we utilize the above two concepts in facilitating
fast motion of water droplets across a surface-bound wettability gradient. First, we measure
the velocity of water droplets on molecular gradients made of semifluorinated SAMs on flat
silica substrates and show that these are higher than the velocities observed by Daniel and
coworkers on H10-SAM substrates. Next we demonstrate that further increase in drop
velocity can be achieved by advancing water droplets along substrates comprising wettability
gradients of semifluorinated SAMs that reside on top of porous substrates. Using a simple
scaling model we demonstrate that the significant increase in the drop velocity on the porous
substrates, relative to the motion on flat silica, correlates with the substrate porosity and
hence reduced contact area at the solid/liquid interface.
18

2.3 Results and Discussion
Wettability gradients of semifluorinated molecules of heptadecafluoro-1, 1,2,2-
Tetrahydrodecyl trichlorosilane (F8H2) were prepared on flat and porous silica substrates
using the procedure outlined in the experimental section. Porous silica substrates were
prepared by an electrochemical etch (for details see the experimental section) and imaged
using scanning electron microscopy. Figure 2.1a highlights the cross-sectional morphology
of the porous silica substrate. The spatial variation of fluorine concentration in the porous
silicon specimen was established using combinatorial near-edge X-ray absorption fine
structure (NEXAFS) spectroscopy.19 The results of the combinatorial NEXAFS experiments
confirm that the surface is decorated with F8H2 molecules whose grafting density varies
gradually across the sample. Moreover, the NEXAFS data reveal that the relative density of
fluorine is higher in the porous region indicated by the elevated circle in the specimen. In
contrast, the unetched area surrounding the porous medium reveals a lower concentration of
F8H2. This result reflects the greater surface area within the porous region and indicates that
the surfaces of the pores are (at least partially) filled with the F8H2 molecules.
19

PSi
PSiSi
Si
25
2015
105
0-10
-8-6
-4-2
02
46
810
x (mm) y (mm)
a. b.
Figure 2.1: (a) Cross sectional scanning electron microscopy image of porous
silicon. The diagram depicts the outline of the porous region after etching. (b) Relative
fluorine concentration on the porous substrate decorated with the gradient in F8H2 self-
assembled monolayer as determined from the combinatorial near-edge x-ray absorption fine
structure spectroscopy experiments.
Given the previous emphasis on contact angle hysteresis, a comparison of the
wettability of both the flat and porous surface was established using contact angle
measurements. In Figure 2.2 we plot the advancing (θa) and receding (θr) contact angles of
deionized water on both the flat and porous gradient surface. These angles were determined
with the aid of imaging software from dynamic water contact angles measured at various
positions along the substrate during droplet motion. These values were utilized to quantify
20

contact angle hysteresis (CAH). In this work, CAH is defined as (cos θa – cos θr). The
experimental values for CAH averaged across the substrate are 0.44 (±0.025) and 0.58
(±0.023) for the flat and porous substrates, respectively. Thus, the CAH is slightly higher on
the porous substrate than on the flat substrate. This fortuitous behavior allows us to
determine whether friction or CAH is most important in governing drop velocity across the
gradient.
0 2 4 6 8 10 1220
30
40
50
60
70
80
90
100
110
120
130
0 2 4 6 8 10 12
a) Unetched Si b) Porous Si
θ DIW
(d
eg)
Position on substrate (mm)
Figure 2.2: Advancing (solid symbols) and receding (open symbols) contact
angles of deionized water as a function of the position on the F8H2 molecular gradient
created on top of a flat (a) and porous (b) silicon substrate. The volume of the probing liquid
was 4 ( ), 6 ( ), 8 ( ), 10 ( ), and 12 ( ) µl.
\
21

Because v* (=γ/η) is the same in all our experiments, the slope of the Ca (=v/v*) vs.
R* plot provides a direct measure of the drop velocity. These slopes can be assessed from
Figure 2.3, which shows the dependence of the capillary number on R* for water droplets of
various volumes (4 -12 µL) moving across flat (open symbols) and porous (solid symbols)
substrates covered with the F8H2-SAM gradient. First, we compare the velocities of water
droplets moving on flat substrates decorated with F8H2 gradients to those of the analogous
hydrocarbon gradient.3 The slopes in the Ca vs. R* plots are ≈0.015 and ≈0.007 for the F8H2
specimen and the hydrocarbon gradient, respectively, revealing the velocity of water drop is
approximately twice as high as the F8H2 substrate relative to that on the H10 gradient. Next,
we use the same analysis to determine how incorporating porosity into the substrate affects
the drop velocity. The data in Figure 2.3 reveals that water droplets move faster along the
F8H2 gradient created on the porous substrate relative to the F8H2 gradient on flat silica.
The graph of Ca vs. R* shows that the slope corresponding to the motion on the porous
substrate is ≈0.035. This is ≈2.3 times faster than the motion on the flat substrate covered
with the same F8H2 molecular gradient.
22

0.18 0.20 0.22 0.24 0.26 0.28 0.300.0000
0.0005
0.0010
0.0015
0.0020
0.0025
0.0030
0.0035
0.0040
Ca
R*
Figure 2.3: Capillary number (Ca=v/v*) as a function of the normalized drop radius
(R*=R.∂cos(θ)/∂x) associated with motion of a droplet of deionized water along the F8H2
molecular gradient created on top of a flat (open symbols) and porous (solid symbols) silicon
substrate. During the course of the experiment the drop velocity was collected at multiple
positions on the sample. The data presented in Figure 2.3 have been compiled from the drop
velocity data collected at the constant contact angle of water equal to: 70º ( ), 65º ( ), 60º
( ), 100º ( ), and 80º ( ). The lines are meant to guide the eye.
If lower CAH were the primary force responsible for faster drop motion, one would
expect that the CAH of the porous substrate were lower than that of the flat substrate. As
discussed earlier, Daniel and coworkers infer the effect of CAH on the drop motion from the
R* intercept in the Ca. vs. R* plot. From Figure 2.3, the close proximity of the R* intercept
23

for the data collected on porous and flat substrates reveals that the CAH is approximately the
same in both cases. This observation is in accord with our earlier conclusion, namely that the
CAH on the porous substrate is similar to or slightly larger than that on the flat substrate (cf.
Figure 2.3). Hence, the rapid increase of the drop velocity on the porous substrate relative to
that on the flat surface must originate from a different effect, namely the reduced frictional
forces at the liquid/substrate interface (cf. Equation 2).
2.4 Conclusions
Although there are some controversies regarding the friction of fluorinated surfaces,
14,15 self-assembled monolayers made of fluorine-containing species are believed to provide
surfaces with lower surface energy and lower friction. Our results seem to confirm the
notion that the F8H2 surfaces possess lower friction and thus facilitate higher speeds of water
droplets. Reduced friction at the liquid/substrate interface is also responsible for the
observed faster motion of water droplets on porous substrates, relative to flat surfaces. Using
the water contact angle on a homogeneous F8H2-SAM on the flat substrate (θ = 102o) and
the corresponding contact angle of an F8H2-SAM on the rough substrate (θ* = 125o), the
fraction of the liquid/substrate interface below the drop (φs) is ≈0.5 (cf. Equation 3). Based
on the work of Beake and Leggett, who established that the frictional forces on substrates
made of mixed self-assembled monolayers scaled approximately linearly with the cosine of
the contact angle, 20 we expect that the frictional forces between the drop and the textured
substrate will reduce ≈1/φs times.21 Hence, the slope in the Ca vs. R* plot for motion on the
rough substrate should be about twice of that on the flat substrate. From the data in Figure
24

2.3, the slopes are 0.035 and 0.015 for the rough and flat substrates, respectively, which gives
a ratio of ≈2.3, in reasonable agreement with the predicted value of ≈2 (1/φs).
In spite of the simplicity of this scaling model (for convenience, we have neglected
any additional contributions to the friction, such as the line tension at the air/liquid/solid
interface), our analysis strongly suggests that the decreased contact area between the liquid
and the porous substrate leads to the decreased frictional forces between the droplet and the
substrate and results in the faster motion of droplets on the rough substrates relative to that on
flat specimens. Combining chemical gradients with surface roughness offers a powerful
method for controlling the movement of liquids on surfaces. For example, applications of
rough surfaces for liquid movement may facilitate enhanced liquid removal capabilities.
Advancements have been made in applying a thin non-wettable coating on windshields to
remove rain droplets on vehicles, aircrafts, and virtually any glass surface. By tailoring the
porosity of the glass this could in turn remove moisture droplets and contaminants at a faster
pace and with greater efficiency. More in depth studies are underway to better understand
the mechanism of motion for rough substrates.
2.5 Implementation / Experimental
2.5.1 Preparation of Porous Silicon
The porous silicon substrate was created by electrochemical etching a n-type silicon
wafer (Sb-doped, 0.01-0.02 ohm.cm) in a Teflon cell, whose configuration was similar to the
cell used by Siuzdak et al.22 The etching solution was a 1:1 (by volume) mixture of
concentrated HF (49% Reagent Grade from Fisher) and absolute ethanol (100%, Fisher).
25

The cell compartment that contains the silicon and the etching solution is illuminated with
50mW/cm2 of white light from a fiber optic light source (Model I-150, Coherent, Inc.).
While illuminated, about 4.6 mA/cm2 of constant current is passed through the cell chamber
for one minute. After the etching process, the porous silicon sample is washed with absolute
ethanol and dried under a nitrogen stream.
2.5.2 Preparation of F8H2 Gradient on Porous and Flat Surface
Our method closely follows that suggested by Chaudhury and Whitesides.1 First, the
substrate (porous or flat) was treated in an ultraviolet/ozone (UVO) chamber (Model 42,
Jelight Company, Inc) for 20 minutes in order to generate a large number of the surface-
bound hydroxyl groups necessary for the attachment of the semifluorinated organosilane
molecules. A mixture of heptadecafluoro-1, 1,2,2-Tetrahydrodecyl trichlorosilane (95%,
F8H2, Gelest, Inc.) and paraffin oil (1:3 w/w) was placed in a small container, which was
positioned near the edge of the UVO-treated silicon substrate. During the gradient
formation, the system was maintained in an enclosed chamber with controlled temperature
(22-24°C) and humidity (40-50%). As the F8H2 molecules evaporated, they diffused in the
vapor and generated a concentration gradient, which was then imprinted onto the substrate.
After 2-3 minutes, the sample was removed from the chamber, thoroughly washed with
ethanol and dried with a stream of with nitrogen.
26

2.5.3 Characterization of the porous silicon surface
Combinatorial near-edge x-ray absorption fine structure (NEXAFS) spectroscopy
measurements provided information about the spatial concentration of fluorine on the porous
substrate.18 The experiments were performed at the National Synchrotron Light Source at
Brookhaven National Laboratory. The samples were placed onto a four-degree of freedom
goniometer, which allowed X-Y in-plane scanning of the sample in the soft x-ray beam. The
partial electron yield (PEY) signal originating from the specimen was collected as a function
the X and Y coordinates at the fixed angle between the sample surface and the electric vector
of the x-ray beam (=55°) at the three different energies of the x-rays: 680 eV (K pre-edge of
fluorine), 692 eV (1s → σ*C-F), and 720 eV (K post-edge of fluorine). The plot in Figure 1b
was generated by standard normalization of the PEY data using the pre-, post-edge, and the
1s → σ*C-F data.19
The morphology of the porous silicon specimens was probed using a scanning
electron microscope (SEM, model Hitachi S-3200). Prior to the SEM experiment, the sample
was sputter-coated with gold.
2.5.4 Measurement of contact angles and drop velocity
Drop movement was recorded using a CCD camera interfaced with a PC mounted
perpendicular to a Rame-Hart 1000 goniometer stand. This CCD allowed for the recording
of the drop motion in situ as the liquid was placed by a microsyringe on the gradient
substrate. Measurements were then taken for the dynamic contact angle of the droplet on the
substrate surface via Scion image software. The drawback of the aforementioned CCD
27

camera is that is was relatively slow speed and only had the ability to capture about 15
frames per second. The slow speed of the CCD camera resulted in the estimation of the
position of the drop and thus created relatively wide scatter of the velocity data in the v/v* vs.
R* plot.
Acknowledgments
The authors thank Dr. Dale Batchelor in the NCSU Analytical Instrumentation Facility for
his contributions in field emission SEM. We also thank Dr. Kirill Efimenko (NCSU) and Dr.
Daniel A. Fischer (NIST) for their assistance during the course of the NEXAFS experiments.
NEXAFS experiments were carried out at the National Synchrotron Light Source,
Brookhaven National Laboratory, which is supported by the U. S. Department of Energy,
Division of Materials Sciences and Division of Chemical Sciences.
28

2.6 References
1) Chaudhury, M.K.; Whitesides, G.M. Science 1992, 256, 1539.
2) Daniel, S.; Chaudhury, M.K. Langmuir 2002, 18, 3404.
3) Daniel, S.; Sircar, S.; Gliem, J.; Chaudhury, M.K. Langmuir 2004, 20, 4085.
4) Greenspan, H.P. J. Fluid Mech. 1978, 84, 125.
5) Ondarcuhu, T.; Veyssie, M. J. Phys. (Paris) II 1988, 1, 75.
6) Brochard, F. Langmuir 1989, 5, 432.
7) Domingues Dos Santos, F.; Ondarcuhu, T. Phys. Rev. Lett. 1995, 75, 2972.
8) Ichimura, K.; Oh, S.-K.; Nakagawa, M. Science 2000, 288, 1624.
9) Daniel, S.; Chaudhury, M.K.; Chen, J.C. Science 2001, 291, 633.
10) Lee, S.-W.; Laibinis, P.E.; J. Am. Chem. Soc. 2000, 122, 5395.
11) Suda, H.; Yamada, S. Langmuir 2003, 19, 529.
12) Choi, S.-H.; Zhang-Newby, B-m. Langmuir 2003, 19, 7427.
13) Bain, C. ChemPhysChem 2001, 2, 580.
14) Perry, S.S.; Lee, T.R. Langmuir 1999, 15, 3179.
15) DePalma, V.; Tillman, N. Langmuir 1989, 5, 868.
16) Bico, J.; Thiele, U.; Quéré, D. Coll. Surf. A 2002, 206, 41.
17) Quéré, D.; Lafuma, A.; Bico, J. Nanotechnology 2003, 14, 1109.
18) Quéré, D. Nature Materials 2002, 1, 14.
29

19) Genzer J.; Fischer D. A.; Efimenko K. App. Phys. Lett. 2003 82, 266
20) Beake, B.D.; Leggett, G.J. Phys. Chem. Chem. Phys. 1990, 1, 3345.
21) Here we neglect any additional contributions to the friction arising from the line tension.
22) Shen, Z.; Thomas, J. J.; Averbuj, C.; Broo, K. M.; Engelhard, M.; Crowell, J. E.; Finn,
M.G.; Siuzdak, G. Anal. Chem. 2001, 73, 612.
30

Chapter 3: Liquid Transport: Effects of Surface Tension and Viscosity on a Viscous
Droplet in Motion
3.1 Project Goals and Motivation
In today’s society, there is growing interest in fundamental information on the
physical parameters such as wetting and transport behavior of fluids that are made of two or
more components. Physical properties such as surface tension and viscosity influence
engineering and product design in many industrial applications such as food engineering,
cosmetics, detergents, and coatings. Surface tension and viscosity are of importance because
they affect the shape and hydrodynamic behavior of liquid droplets on surfaces. A low
surface tension droplet on a substrate is indicative of strong molecular attractions at the
liquid/solid interface and weak intermolecular forces within the liquid, which induce drop
spreading. Viscosity describes a fluid’s internal resistance as a result of interactions between
liquid molecules. As stated previously, viscosity is a force that impedes droplet motion.
Thus, the motion of a droplet on a hydrophobic surface is expected to increase as surface
tension increases but decrease with increasing viscous force. Because liquid motion is
important in a variety of processes, many research efforts have been centered on modifying
the surface tension and viscosity of a solution with the intent of controlling this behavior.
Droplet motion of a high surface tension liquid with varying viscosities on a flat
substrate was investigated. Chemical additives were used in order to maintain both a high
surface tension and the ability to tailor the viscosity of droplets. Understanding how additives
affect surface tension and viscosity and how these parameters affect the velocity of a moving
droplet could lead to a way of controlling that velocity. These relationships can then be used
31

to control the motion of the droplet by adding an appropriate amount of an additive to the
liquid.
Although chemical additives are commonly used to modify both the surface tension
and viscosity of a solution, they also alter the composition of a homogeneous liquid.
Introducing a chemical additive to a solution creates new molecular interactions within the
combine solution, which can lead to changes in the molecular behavior at the liquid solid
interface. This chapter will detail results on the effects of surface tension and viscosity of
droplets in motion and provide insight on how homogeneity within a droplet affects its
motion.
3.2 Introduction 3.2.1 Mechanisms to Induce Droplet Motion
The effect of both viscous and surface tension forces on the hydrodynamic droplet
velocity has been predicted theoretically. Huethrost and Mara derived expressions for
viscous and surface tension forces that oppose droplet movement down an inclined surface.2
Their theoretical models provided a basis for experimental studies on drop motion on an
incline. Subramanian et al. also provided a theoretical analysis of hydrodynamic resistance
using the wedge approximation and lubrication theory.3 They concluded that the
approximations for hydrodynamic force could be used to predict the quasi-steady state speed,
independent of the driving force used to initiate the motion of the droplet.
The driving force of a droplet in motion can be generated mechanically or chemically.
The substrate or liquid can be physically coaxed to induce droplet motion or chemical
32

modifications can be made on the substrate. In order to evaluate the effects of surface
tension and viscosity on a droplet in motion, we address both mechanisms of induced motion.
Within the scope of this paper, two general approaches to droplet motion will be pursued
using a chemical gradient and tilted plane.
A common driving force for droplet motion involves creating a wettability gradient
by chemically modifying a substrate. This phenomenon was first identified by Greenspan
and Brochard4,5 and demonstrated experimentally by Chaudhury and Whitesides.6
Subsequently, several experiments have been reported using thermal, electrochemical,
mechanical and photochemical methods to affect speed by which the droplet travels on a
static wettability gradient.7-13 Recently, Yamada and Tada developed a method for reversible
droplet motion by dynamically controlling the wetting gradient on a thin film electrode by
applying an in-plane bias voltage to the substrate.14 This work illustrated an electrochemical
driving force for liquids of varying viscosities.
Several methods of mechanically inducing droplet motion involve the use of an
applied force. Daniel and co workers used vibration as a periodic force to drive the motion of
a droplet across a substrate. They also provided insight about the various parameters such as
viscosity, drop size and surface tension that influence the motion of liquid drops on
heterogeneous surfaces.15 Their data revealed a linear correlation between the velocity and
radius of the drop. They also noted that resistance of the moving contact line due to friction
scales with the bulk viscosity of the droplet. Later, Petrie et al. demonstrated that the motion
of a droplet could be increased by increasing the roughness of the substrate and thus reducing
the frictional resistance at the liquid solid interface.1
33

In this chapter, both a tilted plane and a chemical gradient will be used to induce the
motion of droplets on a substrate so that the impact of both surface tension and viscosity on
velocity can be correlated. By varying the concentration of sucrose in water, we have the
ability to increase both the drop viscosity and the surface tension. Using droplet motion, it is
documented here how the interplay between surface tension and viscosity influences the
velocity of a multi-component viscous drop.
3.2.2 Contact Line Dynamics and Drop Composition of a Moving Droplet
Droplet motion can be coaxed as well as pinned by several factors affecting contact
line dynamics.16-19 Natural processes such as raindrop motion on a hydrophobic glass
windowpane exhibit droplet motion, which occurs by overcoming surface energy boundaries.
Several types of droplet motion can often be seen simultaneously on the same window.
These regimes include deformed drops of various shapes as well as drops that break up into
lines of much smaller isolated drops. Observation of sliding droplets is a good indicator of a
clean (e.g. defect free) windowpane surface. Contamination or marring on the windowpane
results in a spatial variation in the equilibrium contact angle θe.
The Contact angle θe is formed within the liquid at the contact line, where the solid
substrate, the liquid and the gaseous phase meet.16 A simple two-dimensional force balance
is shown in (Figure 3.1). Figure 3.2 demonstrates that it is possible for the weight of the
droplet to be balanced by the difference in the vertical component of the surface tension, if
the upper contact angle is smaller than the lower one. It is possible therefore, for a drop to
remain on the vertical plane, i.e. pinned to the surface.
34

Figure 3.1: Diagram represents competing forces acting on a drop: weight or gravitational
forces (A) and capillary forces (B). The weight of the drop is responsible for a downward
pull of the droplet, while the capillary forces affect the internal flow within the droplet.
θA B
The shape and size of the droplet also dictate droplet motion. Capillary (πrγ (cos θr-
cos θa) and gravity forces (g) dictate the shape and area of contact with the solid of a
stationary droplet on a horizontal substrate and inclined plane. In order for the droplet to
retain a spherical shape, its radius must be smaller than the millimetric capillary length (k-
1).17 If not gravity will flatten the droplet. Second, smaller droplets often exhibit pinning on
the solid due to contact angle hysteresis (∆θ= θa-θr), with θa and θr the advancing and
receding contact angles. Pinning occurs when the capillary force is larger than the
gravitational force action on the drop (4/3πR3ρgsinα), where R is the radius of the deposited
drop and α is the tilting angle of the solid.
Marmur et.al concluded as the drop volume increases the “slip angle” or “roll-off
angle” decreases.20 Large drops with a radius greater than the capillary length (R >k-1) tend to
35

maintain a constant velocity. However, due to the size and hysteretic effects of smaller
droplets, large fluctuations in velocity are often observed.17
Controlling the degree of incline of the substrate with respect to the size of the droplet
can be used to transition from a pinned droplet to a moving droplet. A low inclination angle
can cause the droplet to remain pinned because of a dynamic critical phenomenon that occurs
when the energy barrier due to a defect is not overcome.17 High angles of inclination cause
the droplet to move beyond hysteric effects that cause pinning.
Our approach is to determine the optimal angle to incline a plane so that, when
droplets rolled down it, gravitational forces overcome pinning. Systematic experiments were
conducted to determine the optimal angle incline. In this chapter varying droplets are used
down such an incline that the droplets reach a steady velocity determined by the balance
between the rate of energy dissipation due to internal forces and the rate of change in
gravitational potential energy.
3.3 Results and Discussion 3.3.1 Viscous Drop Motion on a Tilted Non-Wettable Solid and Chemical Gradient
Our goal was to study the motion of a liquid on a substrate in which the viscosity and
surface tension of droplet could be varied systematically. Previously, we identified a need
for fundamental studies on the effects of surface tension and viscosity on moving droplets.
The quantitative results presented in our earlier paper 1 suggest that water droplets trap air
pockets in porous silicon during their motion across a chemical gradient. Initially, we
decided to further investigate this phenomenon by observing the behavior of a droplet with
36

varying viscosities as they travel across the chemical gradient on porous Si. Ethylene glycol
was used because it is a homogeneous low surface tension liquid that is commercially
available in varying viscosities. In a preliminary experiment conducted with droplets of
ethylene glycol on a molecular gradient prepared on porous silicon, we noticed that these
drops left material behind as they traveled across the gradient (Figure 3.2). It thus appeared
that this liquid wetted the pores as it moved. This wetting is attributed to the lower surface
tension of ethylene glycol compared to water. When water drops were studied the trail was
not observed.
Figure 3.2: Image depicts a 30µL ethylene glycol droplet moving across a fluorinated
gradient on Si. A trail is left behind as the droplet traverses the gradient substrate.
This wetting increased the interfacial area between the liquid and substrate, resulting in
increased friction and reduced velocity. These results lead to the following question: How
can this pore wetting be avoided? It is hypothesized that by increasing the viscosity of liquid
droplet, the degree of pore wetting might be attenuated. Viscosity can affect both the
velocity of the droplet across the substrate and wetting of the liquid into the pores in the
surface. This then led to the question: If viscosity impedes droplet motion and an increase in
surface tension reduces the friction of the droplet in motion how do these forces compete
with each other? We realized these fundamental questions could be addressed by
37

determining the relationship between viscosity and surface tension in droplet motion and how
they affect velocity.
Maintaining a high surface tension is important because it minimizes spreading on a
surface. Aqueous sucrose solutions were used because of the ability to modify their viscosity
while maintaining a high surface tension. The physical properties of sucrose/water solutions
containing varying weight percentages of sucrose have been reported. Figure 3.3 shows the
variation in the viscosity and surface tension of aqueous sucrose solutions as the
concentration of sucrose increases. The viscosity of these solutions can be varied
substantially, from 1.03 cS at 1 wt% sucrose to 45.5 cS at 60 wt% sucrose. Increasing the
weight percentage of sucrose also increases the surface tension of the solution. However,
this increase is comparably small (a change of 5.2 %).
A considerable number of computations have been reported on the physical properties
of binary sugar-water solutions.22 Most of the studies deal with the dilute cases of only a few
wt % of sugar in water. Investigations of concentrated mixtures are much fewer. Ekdawi-
Sever et al. and Conrad et al have investigated sucrose aqueous solutions from 6-80wt% and
higher.23 Molinero et al were the first to identify a percolation threshold for the sucrose
hydrogen-bonding network (HBN) between 33% and 40% w/w water.24 They determined the
resistance to shear deformation and mechanical stability of the mixture would increase upon
formation of the sucrose network. This theory is significant to this work because the presence
of the sucrose hydrogen-bonding network will alter the droplet in motion. We believe viscous
forces will be a dominant force impeding droplet motion.
38

10 20 30 40 50 600
72
74
76
78
80
01020304050607080
γ ( d
ynes
/cm
)
Sucrose Wt%
η (cS)
Figure 3.3: Graph depictng variation in surface tension ( γ , ▲) and viscosity ( η ,■)
for aqueous solutions containing various weight percentages of sucrose at 25oC. Both an
increase in surface tension and viscosity are shown as the sucrose concentration is increased.
Values are taken from a published book of tables.21
To induce droplet motion, two types of substrates were used. In each case, these
substrates were functionalized with semi fluorinated molecules of heptadecafluoro-1,1,2,2,-
tetrahydrodecyl trichlorosilane (F8H2) that were vapor deposited on silica substrates to
create a hydrophobic surface. From our previous work we have found self-assembled
monolayers made of fluorine-containing species provide surfaces with low friction.15 A
hydrophobic surface is needed to sustain a spherical cap drop conformation during droplet
motion. In one set of experiments, these molecules were self-assembled to form a single
39

component homogenous monolayer. In a second set of experiments, a gradient in which the
number of molecules varied in a given area was formed.
0 5 10 15 20 25 30
50
100
150
200
250
300
350
400
60o70o
360o360o
An
gle
Tilit
(deg
)
Volume of Droplet (µL)
360o
Figure 3.4: A graph depicting the relationship between the volume of H2O droplets
(3, 5, 10, 15, and 30 µL) and the tilt angle of a fluorinated homogeneous monolayer on Si
substrate required to move them. The graph shows the tilt angle required to induce motion
was achieved at 15 µL and 30 µL.
Before droplet motion experiments were conducted on the inclined homogeneous
surface, initial experiments were done to determine the optimal volume and inclination angle
for the chemically modified surface. This was done by placing a droplet of varying sizes on a
40

homogeneous F8H2 homogeneous monolayer and tilting the substrate until the droplet rolled
off of the substrate. Results from Figure 3.4 indicate for the particular conditions used, the
threshold volume required for droplet motion was not reached below 15uL. Droplets with
volumes of 15 and 20uL showed movement at 70 and 60o angle tilts. This data shows the
physical parameters for the droplet motion on incline experiments. The tilt angle indicates the
“slip” angle at which the droplet began to move. A value of 360o indicates the drop on the
substrate could be completely rotated without motion.
A 60o inclined plane was used to create a gravitational potential and provide an
impetus for droplet motion of 30µL droplets across the homogenous self-assembled
monolayer. The motion of droplets was analyzed using images obtained from a CCD
Camera. Figure 3.5 illustrates the advancing and receding positions of droplets as they
moved down a 60-degree inclined plane. From these data, the effects of surface tension and
viscosity on velocity as the drop can be ascertained. The droplets used for analysis included
water and aqueous sucrose solutions containing 10, 20, and 60-wt% sucrose (respectively,
1.00, 1.29, 1.80, and 45.5 cS). Little variation in the difference between the advancing and
receding edge positions as the drop moved indicates little spreading of the droplet as it
traverses the substrate. However the droplets clearly have different velocities.
41

0.1 0.2 0.3 0.4 0.50.0 0.1 0.2 0.3 0.4 0.5
12345678
Pos
ition
(mm
)
0.1 0.2 0.3 0.4 0.5
Time (s)0.1 0.2 0.3 0.4 0.5
B C DA
Figure 3.5: The advancing ( •) and receding (■) positions of droplets containing varying
sucrose concentrations plotted as a function of time. The sucrose concentrations are (A) 0 %,
(B) 10 wt %, (C) 20 wt % and (D) 60 wt %, respectively
Figure 3.6 plots the velocity of 0, 10, 20, and 60 wt % aqueous sucrose droplets using
the data from Figure 3.5. The velocity of the droplet containing 60 wt % sucrose is notably
lower than the other sucrose solutions presented. Both droplets containing 10 and 20 wt %
sucrose travel faster than the droplet containing no sucrose even though their viscosity is
higher. This observation indicates that the increase in surface tension as sucrose is added to
the water must be relevant to this behavior. As can be seen in Figure 3.6, the droplets
composed of 10 and 20 wt % sucrose solutions show increases in velocity compared to the
water droplet. Viscous forces overwhelm the effects of surface tension resulting in a
decrease in velocity exemplified by a droplet of 60 wt % sucrose solution.
42

0
10
20
30
40
0 0.1 0.2 0.3Time (s)
Vel
ocity
(mm
/s)
Figure 3.6: Graph of droplet velocity vs. time for droplets in motion on a 60o tilted substrate.
The insert shows a photograph of a 20 wt % sucrose droplet in motion. Droplets contained
(♦) 0 wt %, (■) 10 wt %, (▲) 20 wt % and (×) 60 wt % sucrose in water. Lines are drawn
through the symbols merely as a guide to the eye. Velocity is measured immediately at the
onsite of motion during liquid/ substrate interaction.
A second set of experiments employed an alternate method for inducing the droplet to
move. A wettability gradient was prepared by time dependent vapor deposition of F8H2
molecules across a silica substrate (for details see Experimental Section). Contact angle
measurements of water droplets held at fixed points along the substrate were taken and
indicated the presence of a wettability gradient. The results of droplet motion on a gradient
(Figure 3.7) reflect a similar trend in velocity with increasing sucrose concentration.
Specifically, droplets containing up to 22 wt % sucrose moved faster than those containing
less sucrose. The tradeoff in drop speed at 36 wt % coincides with the reported data range of
43

the higher activation energy for viscous flow caused by the sucrose hydrogen bonding
network.22 As the sucrose concentration was raised further to 42 wt %, the velocity of the
droplet continued to decrease.
0
10
20
30
40
50
60
70
80
0 0.1 0.2 0.3
Time (s)
Vel
ocity
(mm
/s)
Figure 3.7: Graph of droplet velocity vs. time graph for droplets in motion on an F8H2
gradient. Droplets contained (♦) 0 wt %, (■) 10 wt %, (×) 22 wt %, (●) 36 wt % and (▲) 42
wt % sucrose in water. Faster motion for the 22 wt % solution resulted in collection of fewer
points. Lines are drawn through the symbols merely as a guide to the eye.
Figure 3.8 shows the velocity measured for different aqueous sucrose droplets
moving on a 60o tilted plane. Two regimes can be observed. For droplets containing lower
than 42 wt % sucrose (0 - 6.1 cS) a higher velocity range can be observed. As the sucrose
concentration is increased past 42 wt %, the range of velocity values decrease as well. These
data again illustrate a change in droplet velocity. This observation suggests an increase in
viscous force dominance after 42 wt % sucrose.
44

0 10 20 30 40 500
5
10
15
20
25
30
35
Vel
ocity
(mm
/s)
Viscosity (cS)
Figure 3.8: Graph of velocity vs. viscosity on a 60o tilted substrate. 30 µL droplets of 0, 10,
22, 36, 42, 50, 58 and 60 wt % of sucrose were used.
Intuitively because of Newton’s law of viscosity, for a Newtonian fluid one would
expect a linear decrease in the velocity as the viscous forces increase. Our results indicate a
deviation from that expected, leading to the possibility of additional factors contributing to
the observed, separate velocity regimes. Therefore we extended our studies to include an
analysis on sucrose droplets of varying viscosities, along with substrates at varying tilt angles
to determine trends in the data using a multi component liquid.
45
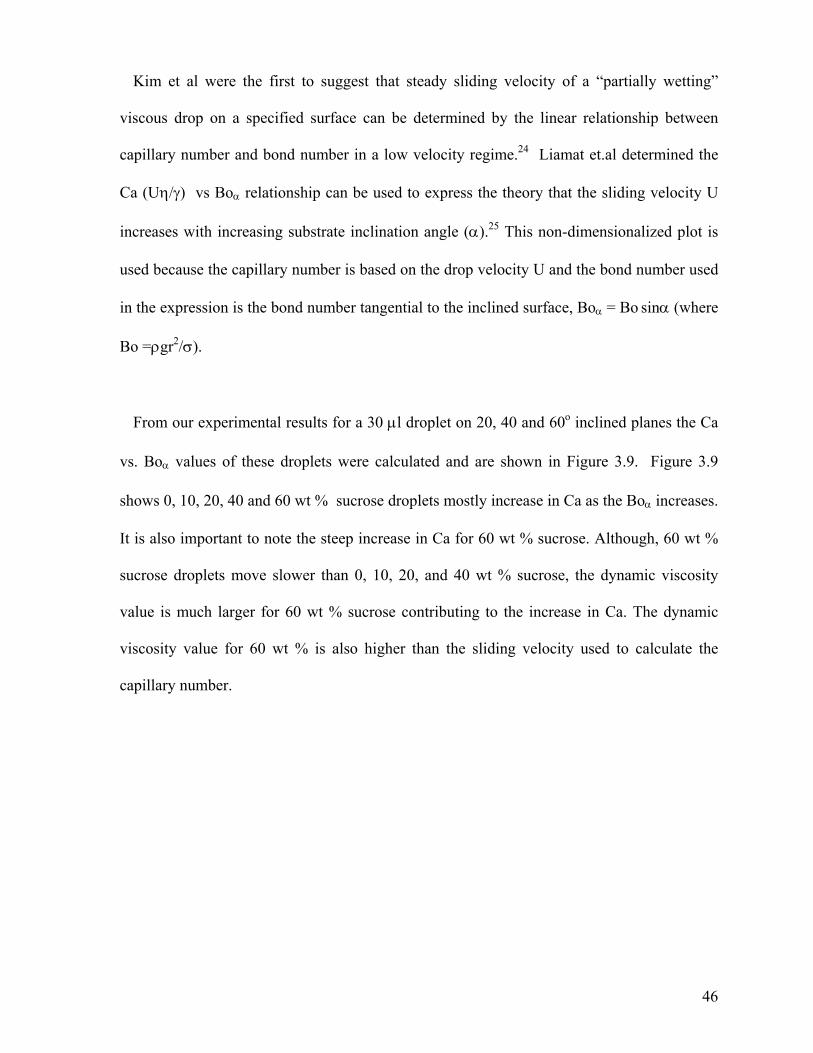
Kim et al were the first to suggest that steady sliding velocity of a “partially wetting”
viscous drop on a specified surface can be determined by the linear relationship between
capillary number and bond number in a low velocity regime.24 Liamat et.al determined the
Ca (Uη/γ) vs Boα relationship can be used to express the theory that the sliding velocity U
increases with increasing substrate inclination angle (α).25 This non-dimensionalized plot is
used because the capillary number is based on the drop velocity U and the bond number used
in the expression is the bond number tangential to the inclined surface, Boα = Bo sinα (where
Bo =ρgr2/σ).
From our experimental results for a 30 µl droplet on 20, 40 and 60o inclined planes the Ca
vs. Boα values of these droplets were calculated and are shown in Figure 3.9. Figure 3.9
shows 0, 10, 20, 40 and 60 wt % sucrose droplets mostly increase in Ca as the Boα increases.
It is also important to note the steep increase in Ca for 60 wt % sucrose. Although, 60 wt %
sucrose droplets move slower than 0, 10, 20, and 40 wt % sucrose, the dynamic viscosity
value is much larger for 60 wt % sucrose contributing to the increase in Ca. The dynamic
viscosity value for 60 wt % is also higher than the sliding velocity used to calculate the
capillary number.
46

0 .0 0 .5 1 .0 1 .50 .0
0 .5
1 .0
1 .5
2 .0
2 .5
3 .0
3 .5
4 .0
4 .5
5 .0
5 .5
6 .0
x 1 0 -3
B o n d N u m b e r , B o
Cap
illar
y N
umbe
r, C
a
Figure 3.9: Depicts Ca vs Bo of 30 µL droplets moving on varying inclination angles (20, 40 and 60o). The data is represented as followed: 0 wt % (■), 10 wt % ( ) 20 wt % ( ), 40 wt % ( ), and 60 wt % (♦).
47

3.4 Conclusions
This work presents a study on drop motion of a multicomponent liquid with
competing interfacial effects. The following trends were shown in this work:
(1) A decrease in the velocity of a moving drop (on an incline and gradient) was
observed at 36 wt % sucrose concentration.
(2) A high range of velocity was observed until viscous force dominance. This
observation could be due to the increase in surface tension with increasing percentage of
sucrose. This theory is difficult to address because the molecular behavior of the droplet on
the surface is different from that of the bulk solution. Sucrose molecules in general are
repelled by the water/ air interface, which leaves a thin periphery of water/ air molecules that
surrounds the bulk fluid. This concept explains why polysaccharides, such as sucrose and
glucose, can raise the apparent surface tension of water by a modest but non-negligible
amount, when dissolved at fairly elevated concentrations. How this behavior affects a
droplet in motion has not been reported.
An additional effect influencing the increase in drop motion can be attributed to
friction. It is also known, that the higher the concentration of sucrose the thinner the zone
depleted of sugar molecules. Therefore for lower concentrations of sucrose, the water / air
interfacial area is larger. The water air interfacial area would be beneficial to this study
because it has been reported that the addition of water molecules produces a decrease in
friction22, which thereby could produce faster droplet motion.
48

3.5 Implementation/ Experimental
3.5.1 Surface Preparation
Silicon wafers (Sb-doped, 0.01- 0.02ohm-cm) were obtained from Silicon Valley
Microelectronics. Strips of 35-40mm with no visible scratches were cut and cleaned from a
silicon wafer. The strip was rinsed thoroughly with acetone, methanol, and deionized water
(DI) and then placed in a sonic bath containing DI water for 10 minutes to ensure the
removal of any debris and particles on the strip surface. The strip was then placed under
ultraviolet ozone (Ultraviolet Ozone Chamber Model 42, Jelight Company, Inc) for 10
minutes to create hydroxyl groups on the Si surface. Finally the surface was dried with a jet
of nitrogen and immediately used in preparation for self assembled monolayer formation. A
3:1 mixture of mineral oil and (heptadecafluoro-1, 1,2,2, Tetrahydrodecyl) trichlorosilane
(F8H2) from Gelest was prepared. Silane vapor deposition was used to distribute diffusion
molecules to the hydroxlyated silicon surface. In preparation for the full coverage monolayer
the silicon sample was fully exposed to the silane for a diffusion time of 3 minutes. For the
gradient, only one region of the hydroxylated silicon wafer was exposed to the silane for 1.5
minutes. On the gradient substrate, locations on the surface that were closer to the silane
source became relatively more hydrophobic (less wettable).
3.5.2 Measurement of Contact Angles
To ensure the formation of a self assembled monolayer, static contact angle
measurements were taken before and after vapor diffusion of the silane. A Ramehart optical
goniometer was used to conduct the measurements. A study was also conducted to
49

empirically determine the behavior of the fluorinated substrate once it was exposed to a
polysaccharide liquid and removed. In this experiment contact angle measurements were
taken before and after immersion in the liquid for 45 minutes. The substrates were then
thoroughly rinsed with water and another set of contact angle measurements were taken. The
contact angle measurements (degrees) were then recorded and averaged in Table 3.5.1. The
data suggests within error (+/- 5 degrees) there is no appreciable change in the fluorinated
surface structure upon interaction with the liquids.
Table 3.5.1: Contact angle measurements (o) of deionized water, sucrose and glucose.
Liquid InitialAfter Immersion in
LiquidAfter rinsing with deionized water
Deionized water 112.4 110.97 111.740wt% Sucrose 112.6 112.13 107.8740wt% Glucose 110.57 108.83 110.27
3.5.3 Measurement of Drop Velocities and Sizes
Drops of DI water, sucrose of varying concentrations, and a range of nominal
volumes from 15-30uL were each introduced on a separate unused migration path on the strip
at the beginning of the substrate. Their motion was captured using an image acquisition
system. The video frames were acquired at a rate of 33 frames/s. The positions of both the
advancing and receding ends of the migrating drop were tracked from one frame to the next
using Scion Imaging software. The instantaneous velocity at a given position was calculated
as the local slope of a straight line fitted to a set of points chosen symmetrically to the center
of the drop’s footprint on the position versus time curve.
50

3.5.4 Equipment
The angle tilt apparatus was specifically designed (T.Bailey) and constructed by (NCSU
facilities) for the purpose of these experiments.
2.5’’
0. 5’’
0. 5’’
2.5’’
0. 5’’
3’’
2’’
0. 5’’
0. 5’’ 0. 5’’ 0. 25’’
Hinges
Hinges
Lab Bench
Figure 3.10: Depicts an angle tilt apparatus. The figures include dimensions and set up.
51

3.6 References
(1) Petrie, R.; Bailey, T.; Gorman, C.; Genzer, J. Langmuir 2004, 20,
9893-9896.
(2) Huethrost, J. M. Langmuir 1991, 7, 2756-2763.
(3) Subramanian, R. M., N.; McLaughlin, J. Langmuir 2005, 21, 11844-11849.
(4) Greenspan, H. P. J. Fluid Mech. 1978, 84, 125.
(5) Brochard, F. Langmuir 1989, 5, 432-438.
(6) Chaudhury, M. K. W., G. M. Science 1992, 256, 1539.
(7) Ichimura, K.; Oh, S. K.; Nakagwa, M. Science 2000, 288, 1624.
(8) Daniel, S. Science 2001, 291, 633.
(9) Suda, H.; Yamada, S. Langmuir 2003, 19, 529.
(10) Choi, S.; Newby, B. Langmuir 2003, 19, 7427.
(11) Bain, C. ChemPhysChem 2001, 2, 580.
(12) Cazabat, A. H.; Troian, S.; Carles, P. Nature 1990, 346, 824.
(13) Gallardo, B. S.; Eagerton, F.; Jong, L.; Craig, V.; Abbott, N. Science 1999,
283, 57.
(14) Yamada, S. Langmuir 2005, 21, 4254-4256.
(15) Daniel, S.; Sircar, S.; Gliem, J.; Chaudhurry, M. K. Langmuir 2004, 20,
4085.
(16) Schwartz, L.; Roux, D.; Cooper-White, J. J. Physica D 2005, 209,
236-244.
(17) Quere, D.; Richard, D. Europhysics Letters 1999, 48, 286-291.
(18) Mahadevan, L.; Pomeau, Y. Physics of Fluids 1999, 11, 24492453.
(19) Hodges, S.; Jensen, O.; Rallison, J. J. Fluid Mech. 2004, 512, 95-131.
52

(20) Marmur, A.; Krasovitski, B. Langmuir 2005, 21, 3881-3885.
(21) CRC Handbook of Chemistry and Physics (85th edition)
Taylor and Francis, Boca Raton, FL.
(22) Lerbret, A.; Bordart, P.; Affouard, M.; Dascamps, M.; Migliardo J. Phys.
Chem B 2005, 109, 11046-11057.
(23) Ekdawi-Sever, N.;Conrad, P.B.; de Pablo, J. J. J. Phys. Chem. A 1999, 103,
4049
(24) Molinero, V.; Cagin, T.; Goddard, W. Chemical Physics Letters 2003, 377,
469-474.
(25) Kim, H.; Lee, H.; Kang, B. Journal of Colloid and Interface Science 2002,
247, 372-380.
(26) Limat, L.; Grand, N.; Daerr, A. J.Fluid Mechanics 2005, 541, 293-315.
(27) Oss, C.; Giese, R.; Docolis, A. Colloids and Surfaces B: Biointerfaces 200,
19, 147-162.
53

Chapter 4: Tailored Surfaces: Polymer Brush Gradients Synthesized via ATRP as
a Platform for DNA Immobilization
4.1 Project Goals and Motivation
DNA microarray technology is an emerging field that has captured the keen interest
of chemists and biologists alike. Specifically, the development of biomolecular platforms for
oligonucleotide immobilization and detection has attracted great interest. Recently,
microarray substrates have been used for printing and storing nucleic acids and antibodies. 1
A DNA microarray is also known as a genome chip and is a collection of microscopic DNA
spots attached to a solid surface, forming an array for the purpose of monitoring expression
levels for thousands of genes simultaneously. Traditional genetic analysis methods were
limited to single gene expressions in each experiment, but this technology provides a mean to
analyze multiple genomes on a single chip.
Modifications have been made to the surface on which the microarray is constructed to
enhance the efficiency in binding and detection of probe molecules.1 The introduction of self-
assembled monolayers has been advantageous to DNA immobilization because it created a
uniform monolayer that increased the packing density of functional groups capable of
binding to the DNA probe molecules along the surface.1 However, despite this, there is still
interest in further increasing the density of DNA probe strands in a given region of the
surface. Detection of low concentrations of DNA might be improved with a greater density
of probe strands. In order to increase the number of functional sites per unit area, dendrimers
and polymers have been incorporated into the design of the microarray. Polymerization
54

techniques such as nitroxide-mediated and reversible addition fragmentation chain transfer
polymerization have been previously reported.2, 3 Here, surface initiated atom transfer radical
polymerization will be utilized to synthesize a polymer brush suitable for DNA
immobilization. The use of a polymer brush gradient to provide a systematic investigation on
the optimal chain length of a polymer brush at a given grafting density. A polymer brush
gradient on a substrate minimizes the polymeric materials and biological samples needed for
analysis.
Scheme 4.1 provides an overview of the synthetic route used to achieve the proposed
goals. The first step uses a coupling agent to functionalize the polymer brush, suitable for
DNA binding. The amine terminated DNA probe is then reacted with the modified polymer
brush. The final step involves the hybridization of a fluorescently labeled DNA target to the
DNA probe on the polymer brush.
DP
N
NNN
O
1,4 Dioxane
NH2-DP
OH
OH
OH ONN
O
ONN
O
ONN
O
O
H N
O
O H
N O
O H
N O
DP
DC O
H
N O
DP/DC O
H
N DP/DC
O
O
H
N
O
DP/DC
DP
Scheme 4.1: Schematic illustration of oligonucleotide attachment via
carbonyldiimidazole coupling to surface anchored polymer. DP represents DNA
capture probe. DC represents the complimentary strand to DP with a fluorophore
attachment.
55

4.2 Introduction
Nucleic acid analysis is a growing field because of the quest to map genomic sequences
faster, using less complicated techniques in more cost efficient ways.3-6 Swami, et al
demonstrated the ability to anchor thiol-terminated DNA SAMs directly to a gold surface.7
In addition they developed a two-potential electrochemical method to characterize the
capture DNA probe and the hybridization probe. On silicon oxide based surfaces, Vandelberg
et al used amino-propyltriethoxysilane (APTES) to create a single layer of functional sites
suitable for oligonucleotide hybridization.8 This method was advantageous because of the
mild conditions (solvents, room temperature, and reaction time) needed for SAM preparation.
Although SAMs offer a controlled method of functionalizing the substrate surface,
SAM forming molecules are limited to accessibility only on the surface area of the substrate.
To increase oligonucleotide density per unit area dendrimers were used as a platform of
functional sites. Benters et al used PAMAM dendrimers to link oligonucleotides to an
isothiocyanate functionalized glass surface.9 This immobilization technique displayed higher
uniformity and reproducibility in comparison to detection on amino-silane coated glass.
This chapter investigates the use of surface anchored polymers as a method of increasing
the density of immobilized biological molecules per surface unit area. Surface tethered
polymers otherwise known as “polymer brushes” are tailorable, with varying mechanical
properties and are amenable to functionalization along the polymer backbone.10-14 Polymer
56

brushes have also been used to alter surface properties such biocompatibility,15,16
wettability,17 and friction.18
Recently, different types of polymerization techniques have been utilized to prepare
polymer brush backbones for particle assembly. Wooley et al utilized controlled nitroxide
mediated radial polymerization (NMRP) to form a polymer brush for streptavidin
attachment.19 The final assembly was used for attaching biotinylated shell crosslinked (SCK)
nanoparticles. Pirri et al utilized block copolymer brushes to immobilize oligonucleotides via
radical addition- fragmentation transfer polymerization (RAFT). 3 They observed that the use
of a block copolymer assembly increased DNA hybridization efficiency compared to SAMs
on glass substrates.
Key parameters that are expected to influence the efficiency of non-covalent
attachment of molecules (here DNA) to sites in the polymer brush are the chain length
(molecular weight) and grafting density (σ). In this vein, Jonson and Johansson conducted
simulation studies indicating that an increase in molecular weight and grafting density would
in turn cause an increase in particle adsorption between favorable polymer/particle
interactions.20 Recently, Bhat et al reported the use of polymer –gradient assemblies to tune
the adhesion of cells.15 They were successful at designing a method of controlling and
varying both the molecular weight and grafting density. In this chapter this technique is used
to systematically evaluate the loading capacity of DNA in a polymer brush as a function of
chain length. Methods will also be discussed that: (a) provide a synthetic route for
oligonucleotide attachment to polymer brushes using less stringent conditions than
57

previously utilized and (b) reduce biological samples needed for evaluating polymer brush
parameters in oligonucleotide attachment.
4.3 Results and Discussion 4.3.1 Surface Modification and Characterization
Here we utilize, atom transfer radical polymerization (ATRP) to produce a polymer
backbone for DNA immobilization and hybridization. ATRP is an ideal technique because it
provides molecular weight control. Although, as stated above, other polymers have been
used to immobilize DNA, a systematic study of the effects of molecular weight has yet to be
explored. To probe this, a surface tethered polymer gradient was synthesized via ATRP in
which the molecular weight of the chains varied across the substrate. Poly (2-hydroxyethyl
methacrylate) (PHEMA) was the polymer of choice because molecular weight of the
polymer can be controlled using ATRP. In addition, the hydroxyl groups of PHEMA served
as binding sites to a variety of functional groups.21 Scheme 4.2 outlines the synthetic route
used to form a PHEMA brush as described by Tomlinson et al.22 The initiator (11-(2-bromo-
2-methylpropionyloxy) undecyltrichlorosilane (BMPUS) was attached to the silicon substrate
(the hydroxyl groups presented at the SiO2/air interface are shown) via known trichlorosilane
coupling chemistry. The tertiary bromide then acts as an ATRP initiation site when reacted
with copper salts as shown in step two to ultimately produce a surface-attached polymer as
shown in Step 2 of Scheme 4.2.
58

Cl
Si
Cl
Cl OBr
O
+
O
BrO
Cl
Si
Cl
OH
OOC
CH2C
+
H2C C
CO
Cl
Si
Cl
O
O
n
O
OH
CH3
CH3
OH
OO
Cu(I)Cl, Cu(II)Cl2
BiPy/MeOH/H2O
Scheme 4.2: Depicts the synthetic route to forming poly(hydroxyethyl methylmethacrylate)
The polymer brush gradient provides a systematic variation in the length of the polymer
chains across a single substrate. Moreover, an increase in the number of hydroxyl groups
(which will subsequently be used as functional sites upon which to attach the DNA probe
strands) will provide more sites for DNA immobilization.
To control the polymer chain length, a dipping apparatus (see experimental) was
used. The chain length was determined by the amount of time the initiated substrate was
exposed to the HEMA solution. Thus, the steepness of a gradient is dependent on the time of
exposure as well. Although previous work has also explored variations in the initiator density
and along a gradient, in the following experiments the density of initiator sites was kept
constant to observe only the chain length effects on DNA immobilization.
59

20 30 40 50 60 70 800
20
40
60
80
100
Dry
pH
EM
A T
hick
ness
(nm
)
Position on Substrate (mm)
Figure 4.1: Provides the dry thickness polymer brush profile using ellipsometry across a
silicon substrate corresponding to position and time.
Figure 4.1 shows the dry pHEMA thicknesses measured by ellipsometry at various
positions along the substrate. The substrate was withdrawn from the polymerization solution
at a rate of .04 mm/min. Thus, a relative position of zero indicates an exposure time of 0
minutes to the solution and a relative position of 70 mm indicates an exposure time of 1800
minutes to the solution. From the data, a systematic increase in thickness was observed as
the length of time that the monomer solution was exposed to the surface-bound initiating
60

sites was increased. This graph indicates a molecular weight gradient of pHEMA has been
formed along this substrate.
In order to modify the pHEMA brush gradient for DNA immobilization, the hydroxyl
groups were converted to functional groups that could react with the amine terminus of a
DNA oligomer. Various coupling agents have been described in the literature that have been
used in similar chemistry. 1-ethyl-3- (3-dimethylaminopropyl) carbodiimide (EDAC) 23 and
carbonyldiimidazole (CDI) 24 have both been utilized to “activate” the carboxyl and hydroxyl
groups of polymer chains. CDI was an attractive coupling agent because the resulting ligand-
polymer complex is stable and resists hydrolysis for extended periods of time. We utilized
the CDI coupling technique to form an imidazolyl carbamate complex with the hydroxyl
groups of the pHEMA brush gradient. The chemical steps showing the reaction of CDI with
free hydroxyl groups on the pHEMA and the subsequent reaction with an amine are shown in
Scheme 4.3.
N
NNN
O
1,4 Dioxane
ONN
O
ONN
O
OH OH
Scheme 4.3 Schematic formation of carbonyldiimidizaole attachment to the polymer brush
backbone.
61

Fourier transform Infrared Spectroscopy (FT-IR) was used to monitor the coupling of CDI
to pHEMA. IR spectra of the hydroxyl group stretching region (ca. 3400 cm-1) of a pHEMA
sample were obtained before (Figure 4.2a) and after two, six and twenty seven hours of
immersion in a 0.2M solution of CDI (Figures 4.2b-d, respectively). The hydroxyl group
stretching intensity decreased rapidly in the first two hours but no additional decrease was
observed at longer incubation times. From these data, it is concluded that a two-hour
incubation time was sufficient to maximize the conversion of the hydroxyl groups to
carbonate groups. Notably, however, the hydroxyl group signal does not completely
disappear. Water also absorbs in this region. Thus, these spectra might reflect the presence
of adventitious water. It is thus not possible to conclude unambiguously whether reaction of
the hydroxyl groups on the pHEMA was complete or only partial.
3000 3200 3400 3600
Abso
rban
ce (a
.u.)
Wavenumbers (cm-1)
a
bc
d
Figure 4.2: FT-IR spectra of hydroxy stretching region plotted as a function of time.
Hydroxyl groups were monitored for pHEMA (a), pHEMA/CDI 2hrs (b), pHEMA/CDI 6hrs
(c) and pHEMA/CDI 27hrs (d).
62

It was then of interest to investigate the reaction of an amine with the CDI-activated
hydroxyl groups. Rather than using amine-terminated DNA as the initial probe,
fluoresceinamine was employed first. Scheme 4.3 illustrates how fluoresceinamine was
envisioned to couple to the CDI-activated polymer. Fluoresceinamine is comparable in size
and fluorescence emission range to a fluorophore molecule that will tethered to the DNA
target probe in later experiments.
N
NNN
O
1,4 Dioxane
O
HO
OH
OO
NH2
ONN
O
ONN
O
O
HO
OH
OO
N
O N N
O
HO
OH
OO
N
O N NOH OH
Scheme 4.3 Schematic formation of fluoresceinamine attachment to the polymer brush
backbone.
In order to verify the presence of the immobilized fluoresceinamine probe FTIR was
used to identify the addition of the amine groups. Figure 4.4 shows the FTIR spectra of
pHEMA with the addition of fluoresceinamine for 6hrs. The presence of the amine group is
63

consistent with enhancement of the absorption peak in the 3500 - 3300 cm-1 range,
corresponding to the N-H stretch.
-0.01
0.00
0.01
0.02
0.03
4000 3750 3500 3250 3000 2750 2500 2250 2000 1750 1500 1250 1000 750-0.02
-0.01
0.00
0.01
0.02
0.03
Abs
orba
nce
(a.u
.)
pHEMA
Wavenumbers (cm-1)
F-pHEMA
Figure 4.4: FTIR spectra of a pHEMA brush attached to a Si substrate before and after
reaction with fluoresceinamine.
Next an “activated” polymer brush gradient was incubated in the fluorophore solution
(.02M fluoresceinamine isomer I in phosphate buffer pH 7.4) for 1 hr. To determine the
relative amount of fluoresceinamine that was incorporated at various positions along the
gradient the presence of the fluoresceinamine probes were also confirmed by fluorescence
microscopy. In Figure 4.5, the polymer thickness vs position profile is plotted along with
64

fluorescence intensity vs. position, for a single sample. The results indicate an increase in
fluorescence intensity corresponding to an increase in polymer brush thickness.
0 10 20 30 40 50 60 70 80 90 100
200
400
600
800
1000
1200
1400
Rel
ativ
e Fl
uore
scen
ce In
tens
ity (a
.u.)
Dry pHEMA Thickness (nm)
Figure 4.5: Graph showing fluorescence intensity vs. dry pHEMA thickness plot for
fluoresceinamine attachment to a functionalized pHEMA gradient.
After successfully coupling the amine-terminated fluorophore to the pHEMA brush, the
experiment was modified to incorporate single stranded DNA molecules containing amine
end groups. The DNA sequences used here are listed in Table 4.1.
65

Table 4.1. List of DNA sequences Name Sequence Amine Terminated Probe (DP) 5’ -H2N/TTG GAC TGT TAT CCG CTC ACA AT-3’ Complimentary (DC) 5’-FAM/ ATT GTG AGC GGA TAA CAG TCC AA-3’ Non Complimentary (DNC) 5’-FAM/ TTG GAC TGT TAT CCG CTC ACA AT-3’ Fluorophore: 5’-FAM*
-O
O
O
-OO
O
NH
OP
-o
O
O
3'
The amine terminated probe (DP) contains an amine linkage that is used to couple
with the imidazolyl carbamate complex sites along the polymer brush gradient. 50µL of
capture probe solution were incubated on the activated polymer brush gradient for 6 hours
(See experimental). This process was then followed by a 50 ml incubation of the detector
probe (either complimentary or non complimentary) for 6hrs. The complimentary strand was
a sequential match for hybridization of the amine terminated capture probe. In contrast, the
non-complimentary strand served as a complete sequential mismatch for the amine
terminated capture probe. Single strands of DNA that were alternatively complimentary and
* FAM- 6-carboxyfluorescein is a single isomer derivative of fluorescein
66

non complimentary to the immobilized single strand were used as detection probes to
determine the hybridization efficiency with the amine terminated probe. Both detection
probes contained the fluorophore 5-carboxyfluorescein (5-FAM) to identify their presence
after incubation with the substrate. In the case of the complementary strand, the presence of
this fluorophore could be taken as an indication of hybridization between the two strands. In
the case of the non-complementary strand, the presence of this fluorophore could be taken as
an indication of non-specific binding between the strand and the sample.
Figure 4.6 shows fluorescence images of unreacted pHEMA without any DNA
present, and three regions of DNA hybridization along the polymer brush gradient. Green
fluorescence emission was observed upon attachment of 5’FAM labeled complimentary
DNA to the pHEMA gradient surface with amine terminated DNA strands. There was no
detectable fluorescence emission observed in the case of a non-reacted pHEMA surface
(Figure 4.6a). The images indicate a decrease in fluorescence emission as the polymer brush
thickness decreases. The images show an increase in fluorescence intensity as the polymer
brush thickness increases.
67

a a b
c d
Figure 4.6: Fluorescence micrographs (top) and corresponding intensity depicts a.unreacted
pHEMA and b-d pHEMA after grafting with DNA probe and complimentary strand via CDI
coupling for 63.5 (nm), 37.0 (nm), 21.3 (nm). Images were collected using 20x
magnification.
In Figure 4.7, the relative fluorescence intensity is plotted versus the thickness of the
pHEMA polymer brush across the thickness gradient. When the complimentary DNA strand
was incubated with the polymer containing the capture strands, an increase in fluorescence
intensity was observed as the pHEMA brush thickness increases. This increase was similar to
that observed in the experiment conducted with fluoresceinamine. In contrast, the
fluorescence emission in the presence of the non-complementary DNA probe was
consistently lower than that observed with the complimentary DNA strand. Furthermore, the
magnitude of the fluorescence was not affected by change in the dry pHEMA brush
68

thickness. In Figure 4.7 the 0mm position indicates the background, thus the background is
similar to that measured in the presence of the non-complementary strand.
0 20 40 60 80 100 120200
300
400
500
600
700
800
900
1000
R
elat
ive
Fluo
resc
ence
Inte
nsity
(a.u
.)
Dr pHEMA Thickness (nm)
Figure 4.7: Graph shows fluorescence intensity vs. polymer thickness data for hybridization
of complimentary ( ) and non-complimentary ( ) DNA on target DNA modified polymer
gradient. The single data point at zero. Dry pHEMA thickness indicates the Background for
both samples.
In order to collect additional information on DNA immobilization within the polymer
brush particle based experiments were conducted. Gold nanoparticles (13nm) precoated with
23-mer amine-terminated single strand DNA (in deionized water) were synthesized (ref
X.Lou). The nanoparticle solution was spotted along the CDI functionalized pHEMA
69

gradient and allowed to sit for 6 hrs at room temperature. Glass cover slips were used for
even distribution. The substrates were then rinsed with deionized water and dried under a
nitrogen stream. Atomic force microscopy was then used to analyze the substrate (Figure
4.8). The results indicate a higher nanoparticle concentration in the polymer brush range (22-
38 nm) and a considerable decrease in nanoparticle concentration in the thicker polymer
brush range (60-74 nm). In correlation with the previous DNA hybridization data conducted
on a pHEMA gradient, it is reported that the fluorescence intensity increases with increasing
polymer brush thickness. Thus, it was expected that the particle-based experiments imply
fluorescence intensity would be higher in the thicker polymer brush region where fewer
nanoparticles were observed. Because the AFM images were measured using the tapping
mode on the surface of the substrate, this could possibly suggest that the nanoparticles were
embedded within the longer chain length polymer brush. This would also support the
hypothesis that as you increase the polymer brush thickness at a fixed grafting density, there
are more functional sites along the polymer brush that can be used for DNA immobilization.
However this data may reflect fewer nanoparticles were observed on the thicker polymer film
compared to those on thinner polymer film could be due to a steric effect. The reactive sites
underneath the surface may not have been accessible to the nanoparticles for the high
molecular weight surface that more densely packed compared to the low molecular surface.
For the case of ssDNA, the small size of ssDNA allows for accessibility to the area beneath
the surface. This was verified via fluorescence imaging.
70

a b
Figure 4.8: Atomic force microscopy images DNA coated Gold nanoparticles in a low (22-
38nm) and high molecular weight polymer brush (62-74nm). In the low molecular weight
regime the density of particles is 18.205 µm3 vs that of the high molecular weight regime of
7.843µm3.
4.4 Conclusions
An efficient method of systematically varying the chain length of a polymer brush on a single
substrate for DNA immobilization and hybridization has been reported in this chapter. We
concluded as the polymer brush increased, an increase in fluorescence intensity was
observed. Atom transfer radical polymerization provided a controlled synthetic route for the
polymer brush platform using milder conditions than previously reported. The polymer brush
gradient provided DNA immobilization data on a single substrate that indicated an increase
71

in chain length at a fixed grafting density, can provide an increase in access sites along the
polymer brush capable of DNA attachment and immobilization.
4.5 Implementation / Experimental 4.5.1 Materials
Silicon Wafers (Sb-doped, 0.01-0.02ohm-cm) were purchased from Silicon Valley
Microelectronics. 2-Hydroxyethyl methacrylate (HEMA), CuCl, CuCl2, 2,2’bypridine,
1’carbonyldiimidazole (CDI), N-hydroxysuccinimide (NHS), triethylamine (TEA) were
purchased (Sigma Aldrich, St.Luois, MO) and used as received without further purification.
Oligonucleotides were purchased from Integrated DNA Technologies (Coralveille, IA). DNA
sequences are listed in Table 4.1.
4.5.2 ATRP Synthesis of Surface- Initiated Polymerization Gradient
Polymer films were prepared via atom transfer radical polymerization. Hydrolyzed
silicon wafers were prepared by exposing the wafers to ultraviolet ozone light (Ultraviolet
Ozone Chamber Model 42, Jelight Company, Inc) for 10minutes. The Si wafer was then
immersed in 30mL of chilled toluene. 20µL of 11-(2-bromo-2-methylpropionyloxy)
undecyltrichlorosilane (BMPUS) was added to the immersed wafer and the solution then
chilled for 24 hours. The modified silicon wafer was then sonicated in fresh toluene for 20
minutes and dried with N2. This step was repeated 3 times to thoroughly remove physisorbed
initiator. The dipping apparatus developed by the Genzer Group (Tomlinson, M.) was used
under nitrogen purge (Figure 4.9). The apparatus was programmed to insert the initiator
72

covered silicon wafer into a mixture of HEMA, CuCl, CuCl2, bipy, methanol, and water
solution at a rate of 0.01mm per 15 seconds. The reaction time was dependent on the desired
thickness. The PHEMA-modified sample was then sonicated in methanol and water for 20
minutes. The dry PHEMA gradient was then characterized using ellipsometry (Rudolf Auto
el) to determine the PHEMA gradient thickness along the substrate. The results of the
position along the substrate vs. dry pHEMA thickness are shown in Figure 4.1.
Figure 4.9: Illustrates the apparatus designed to systematically vary molecular weight and or
grafting density on a substrate (Illustration courtesy of J. Genzer)
73

4.5.3 Covalent Coupling via 1, 1’ Carbonyldiimidazole (CDI) reaction
To functionalize the PHEMA gradient, the coated substrate was immersed in freshly
prepared 0.20 M 1,4 Carbonyldiimidazole in 1,4 Dioxane for 24 hrs at room temperature.
Carbonyldiimidazole activates hydroxyls present in the polymer film and enables subsequent
reaction with amine-containing species. The coated substrate was sonicated in 1,4 dioxane
three times and dried with a flow of nitrogen. Figure 2 shows the successful coupling of the
polymer solution upon the addition on CDI by monitoring the hydroxyl groups using FTIR.
4.5.4 Capture Probe Immobilization and DNA Hybridization
DNA capture probe (CP) solutions were coupled onto the polymer surface by
incubating 1µM CP in NaHCO3 / Na CO3 (0.1M, pH 9) buffer solution on the CDI-
functionalized polymeric substrate. Cover slip glass slides were used to evenly spread the
DNA solution along the functionalized polymeric substrate in a sandwich assembly. After 6
hours at room temperature, the samples were removed and followed by rinsing of a solution
of TE (Tris EDTA) buffer and dried with nitrogen.
For hybridization, the aforementioned procedure was again used to incubate the
fluorescent-labeled DNA complimentary (c) or noncomplimentary (nc) strand with the
capture probe coated polymer surface. 50µL of target oligonucleotides (c or nc) were
prepared with a 1M solution of NaCl TE (tris EDTA) buffer. During hybridization extra
74

caution was used to minimize the exposure to light. After hybridization, the completed
pHEMA gradient (with fluorophore hybridization) was then rinsed with the TE buffer and
deionized water.
4.5 Instrumentation
Film thickness measurements were obtained using the Rudolf Auto el instrument. An
incident angle of 70o was used to irradiate the substrate. A refractive index of 1.51 was used
to measure pHEMA thickness along the substrate.
Interfacial tension behavior data of the pHEMA vs DNA immobilized pHEMA was
detected using goniometry. A Ramehart optical goniometer was used to collect
measurements. Triplicates of each contact angle position were collected and individually fit
to the Young/ Laplace model. The changes in contact angle measurements reflect the
differences in surface chemistry during the sequential steps of DNA hybridization on
polymer surfaces. After polymerization on a single substrate (64nm) a measured contact
angle of (~47º) was observed. Upon CDI coupling, less polar functional groups were being
added to the surface, which caused an increase in the contact angle. This is reflected in the
increase in contact angle measurements collected after CDI coupling (~70º). DNA is
negatively charged and upon interaction with a surface this caused a significant decrease in
contact angle to (~34º). At the onset of DNA hybridization, the contact angle decreases at
varying polymer thickness.
75
Reflectance FT-IR was collected using the Bio Rad Model FTIR Spectrometer
equipped with a PIKE attachment. The reflectance mode provided a spectral resolution of
4cm-1 at 256 scans using a mercury cadmium telluride (MCT) detector. FTIR was used to
monitor the sequential steps: polymer formation, cdi coupling and DNA attachment.
A digitally enhanced fluorescent microscope was used to quantify the amount of
DNA bound to the pHEMA gradient. A Zeiss Axioplan 2 setup was used with the Sutter
Instrument Corp. It includes a Xe fiber optic arc lamp, a fluorescent filter set #38 HE from
Zeiss with bandpasses at 470nm +/- 40nm for excitation and 525nm +/- 50nm for emission,
a LEP LudL BioPoint 2 motorized stage and a Hamamatsu Orca-ER Digital Camera. The
software interface with the microscope was Andor iQ (Andor Technology). The two primary
reasons for using a fluorescent microscopy setup were 1) automation and precision control
using programmable scans with the LudL automated stage and 2) detection sensitivity and
image quality that are comparable to any fluorometer available to us. Images were taken
using a Zeiss 20X Plan-NEOFLUAR objective with NA = 0.50.
EN.REFLIST
76

4.6 References (1) Pirrung, M. Angew. Chem. Int. Ed. 2002, 41, 1276-1289.
(2) Devaux, C., Chapel, J.P..; Beyou, E.; Chaumont, P. Eur. Phys. J. E 2002, 7,
345-35.
(3) Pirri, G.; Chiari, M.; Damin, F.; Meo, A. Anal. Chem. 2006, 78, 3118-3124.
(4) Gong, P.; Grainger, D. Surface Science 2004, 570, 67-77.
(5) Steel, A.; Herne, T.; Tarlov, M. Anal. Chem. 1998, 70, 4670-4677.
(6) Hong, B.; Oh, S.; Youn, T.; Kwon, S.; Park, J. Langmuir 2005, 21, 4257-
4261.
(7) Swami, N.; C., C.-F.; Terberueggen, R. Langmuir 2005, 21, 1937-1941.
(8) Vandenberg, E.; Bertilsson, L.; Leidberg, B.; Uvdal, K.; Erlandson, R.;
Elwing, H.; Lundstrom, I. J. Colloid Interface Sci. 1991, 147, 103-118.
(9) Benters, R.; Niemeyer, C. M.; Drutschmann, D.; Blohm, D.; Wohrle, D.
Nucleic Acids Research, 2002, 30
(10) Edmondson, S.; Osborne, V.; Huck, W. Chem. Soc. Rev 2004, 33, 14-22.
(11) Lenigk, R.; Carles, M.; Ip, N.; Sucher, N. Langmuir, 2001, 17, 2497
(12) Smith, E.; Wanat, M.; Cheng, Y.; Barreira, S.; Fritos, A.; Corn, R. Langmuir,
2001,17, 2502
(13) Oh, S.; Cho, S.; Kim, C.; Park, J. Langmuir, 2002,18, 1764
(14) Strother, T.; Chai, W.; Zhao, X.; Hamers, R.; Smith, L. J.Am. Chem. Soc.,
2000, 122, 1205
(15) Bhat, R.; Chaney, B.; Rowley, C.; Liebmann-Vinson, A.; Genzer, J. Adv.
Mat. 2005, 17, 2802-2807
77

(16) Aksay, A; Trau, M.; Manne, S.; Honma, I.; Yao, N.;Zhou, L.; Fenter, P.;
Eisenberger, P.; Gruner, S. Science, 1996, 273, 892-894
(17) Mansky, P.; Liu, Y.; Huang, E.; Russell, T.; Hawker, C. Science 1997, 275,
1458
(18) Klein, J.; Kumacheva, E.; Mahalu, D.; Perahia, D.; Fetters, L. Nature 1994,
370, 634.
(19) Kai, Q.; Vhuanzhen, Z.; Walker, A.; Wooley, K.; Jhaveri, S.; Sogah, D.;
Malkoch, M.; Beinhoff, M.; Carter, K.; Hawker, C. Polymer Preprints 2005,
46, 363.
(20) Jonsson, M.; Johansson, O. Colloids Surf. B. 2004, 37.
(21) Huang, W.; Kim, J.; Bruening, M.; Baker, G. Macromolecules 2002, 35,
1175-1179.
(22) Tomlinson, M. Genzer, J. Macromolecules 2003, 36, 3449
(23) Staros, J.; Wright, R.; Swingle, D. Analy. Bio. 1986,156, 220-222
(24) McArthur, S.; Halter, M.; Vogel, V.; Castner, D. Langmuir, 2003, 19, 8316-
8324
78

Chapter 5: Controllable Nano Patterned Polar Surfaces for Molecular Pattern Formation and Transfer 5.1 Project Goals and Motivation
In recent years it has become possible to control the charge distribution of a surface at
the micron, or smaller length scales.1 The fabrication of periodically charged domains on a
substrate has sparked a demand in research areas across scientific disciplines such as physics,
chemistry, engineering and even nano-technology.2 Interdisciplinary collaborations have led
to technological advances in computer memory, infrared sensors and medical ultrasound
detectors.3,4
Ferroelectrics are a class of materials that have been used in switchable poling
applications that require sizes down to the nanometric range.3 Ferroelectric materials are
characterized by spontaneous polarization, which can be changed by applying an electrical
field. In order to fabricate nanosized domains using ferroelectric materials, creative methods
such as lithography-based patterning techniques, the use of nanoelectrodes, and even
microemulsoion techniques have been explored.3,5
In this chapter, self-assembly of polar molecules will be used as a paradigm for
nano-scale construction on a periodically poled substrate. Our goal is to show that
electrostatic interactions between a polarized ferroelectric domain and polar molecules can
be a new way to drive self-assembly that is amenable to patterning. To achieve this goal we
plan to establish the molecular features required to self-assemble on a polarized ferroelectric
domain. We will then assemble and characterize these molecules on polarized, patterned
79

ferroelectric substrates with well-controlled surfaces. We believe the electrostatic interaction
between a poled surface and polar molecule can lead to advancement in nano printing and
molecular dynamics.
5.2 Introduction: 5.2.1 Ferroelectric Materials:
Substantial research and development has been devoted to ferroelectric materials such
as single ionic crystals, piezoelectric polymers, composites and thin films.2,4 Ferroelectrics
can be used as capacitors, optoelectronic devices and actuators.3,6-8 These materials are
unique because they all exhibit a spontaneous dipole moment, which can be reversed by the
application of an electric field.
There are two main types of ferroelectric materials: order-disorder and displacive.9,10
In an order-disorder ferroelectrics, there is a dipole moment in each unit cell, but at high
temperatures the dipoles are pointing in random directions. Lowering the temperature
induces a phase transition that causes the dipoles to order and all point in the same direction
within a domain. Displacive behavior arises from an asymmetrical shift in the equilibrium
ion positions causing a permanent dipole moment.
Lithium Niobate is a widely used ferroelectric material because of its unique electro-
optical, photoelastic, piezoelectric and non-linear properties.11 LiNbO3 was used in our
studies because of its availability, reasonable price and its capability of domain reversal via
periodic poling.12 The attractiveness of periodic poled lithium niobate (PPLN) lies in the ease
80

with which the size, distribution, and periodicity of its ferroelectric domain can be
engineered to match the requirements of a given application.
Patterned domain reversal in lithium niobate has been extensively investigated using
a wide number of treatments involving heat, chemical, and electric field poling techniques.12
The most commonly used method of poling LiNbO3 was discovered by Yamada et al. in
1993.13 They discovered that lithium niobate could be poled by patterning electrodes onto the
surface of a substrate and applying a large electric field. In domains directly underneath the
electrodes, the internal electric field changed sign, and these domains propagated through the
crystal with minimal lateral spreading. The basic structure of a PPLN crystal is shown in Fig.
5.1, which illustrates the periodic variation of the internal electric field along its length.
+ - + - + - +
Eapp
Figure 5.1: Illustration is shown of the domain directions of a periodically poled lithium
niobate. The Eapp arrow indicates the direction in which the electric field is applied.
81

5.2.2 Self Assembly of Polar Molecules
Self-assembled monolayers of various organic molecules can be used to modify the
surface chemistry of complex metal oxides.3 The self-assembly of molecules onto a surface is
a flexible technique that can be used to specifically tailor molecule / substrate interactions.
The molecules used in self-assembly can create interfaces with desired structures and
properties on various substrates. Self-assembly of surface bound molecules can impact a
broad range of physical phenomena from a single molecular switch to functional opto-
electectronic materials. In this chapter the goal is to use electrostatic interactions between
oppositely charged molecules and poled substrates to form a two-dimensional ordered
molecular assembly.
5.3 Results and Discussion
In order to successfully achieve electrostatic interactions between charged molecules
and a periodically poled surface, we devised the three-step plan shown in Scheme 1. The
steps include 1) cleaning and passivation of the lithium niobate, 2) deposition of the charged
molecules onto the poled lithium niobate surface, and 3) characterization of the chemically
modified poled substrate. Each step will be discussed in detail in the following sections.
82

LiNbO3
+++ + + + + + + + + + + + + + +
- - - - - - - - - - - - - - - - - - - -+ + + + + + + + + + + + + + +
- - - - - - - - - - - - - - - - - - - -
- - - - - - - - - - - - - - - - - - - -
+ + + + + + + + + + + + + + +
C2H3BrO2
1.1000oC, 2. MeOH ,H2O
3.TMSCl
CH2
Br
CO2
CH2
Br
CO2
CH2
Br
CO2
1 2 3LiNbO3
+++ + + + + + + + + + + + + + +
- - - - - - - - - - - - - - - - - - - -+ + + + + + + + + + + + + + +
- - - - - - - - - - - - - - - - - - - -
- - - - - - - - - - - - - - - - - - - -
+ + + + + + + + + + + + + + +
C2H3BrO2
1.1000oC, 2. MeOH ,H2O
3.TMSCl
CH2
Br
CO2
CH2
Br
CO2
CH2
Br
CO2
CH2
Br
CO2
CH2
Br
CO2
CH2
Br
CO2
1 2 3
Scheme 5.1: Illustration of the process used to create electrostatic interaction between
bromoacetic acid and lithium niobate.
5.3.1 Single Faced Poled Lithium Niobate
Our first step was to preserve the charge of the poled substrate. The lithium niobate
substrates were purchased that were poled to have a net charge on each side (negative on one
side, positive on the other). Therefore a delicate cleaning procedure was used to pre-treat the
substrates (See experimental). The lithium niobate was annealed then coated with a layer of
protective molecules. Research conducted has shown that alkylchlorosilanes behave as
ultrathin resists and serve as a barrier to many oxidized substrates.14 Trimethylchlorosilane
(TMSCl) is a small molecule that should not shield the surface charge to a large degree.
TMSCl molecules were assembled on lithium niobate in an attempt to rid the surface of
chemically reactive groups.
The next step was to electrostatically bind polar molecules to the poled lithium
niobate sample. Two deposition techniques were attempted to distribute the charged
molecules to the poled surface, solution phase and vapor phase deposition. Solution phase
83

deposition was conducted by immersing the lithium niobate into a 13 mM solution of
bromoacetic acid in H2O for 30 seconds.
X-ray Photoelectron Spectroscopy (XPS) was then used for chemical analysis of the
modified lithium niobate. In the presence of bromine, XPS spectra should show a peak at ~70
eV.15 XPS measurements were taken before and after immersion of the poled lithium niobate
in bromoacetic acid. The XPS data did not reflect a significant distinction in peak intensity
between the bromine positive and negative binding energy of the charged surface of lithium
niobate.
It was hypothesized that the polar solvent used in conjunction with the bromoacetic
acid solution deposition screens the charge, lowering the impetus for electrostatic assembly.
To attempt to avoid this problem, a vapor deposition method was employed. The
bromoacetic acid was melted in a chamber at 100o C. The melted bromoacetic acid was
sealed in a vacuum chamber and vacuum was pulled. The vacuum chamber provided dry
conditions to minimize outside moisture.
XPS was then immediately used to detect change in the intensity of the bromine
adsorption to the poled lithium niobate surfaces. The results from vapor deposition of
bromoacetic acid on poled lithium niobate samples are shown in Figure 5.2-4. In Figure 5.2
the vapor chamber containing lithium niobate and bromoacetic acid was heated to 120oC at
60 torr vapor pressure. The bromoacetic acid vapors were allowed to chemisorb onto the
lithium niobate sample under vacuum for 1.5 hours. The Br to Nb signals indicate a ca. 10-
fold preference for the positive side of the sample compared to the negative side of the
sample.
84

80 78 76 74 72 70 68-40
-20
0
20
40
60
80
100
120
140
160
180
# of
Ele
ctro
ns
Binding Energy (eV)
Bromine Positivea = 146.8
80 78 76 74 72 70 68-40
-20
0
20
40
60
80
100
120
140
160
180
# of
Ele
ctro
ns
Binding Energy (EV)
Bromine Negativea=33.2
216 214 212 210 208
0
100
200
300
400
500
600
# of
Ele
ctro
ns
Binding Energy (eV)
Niobium Positivea=578.4341
216 214 212 210 208
0
200
400
600
800
1000
1200
1400
1600
# of
Ele
ctro
ns
Binding Energy (eV)
Niobium Negativea=1615.3
80 78 76 74 72 70 68-40
-20
0
20
40
60
80
100
120
140
160
180
# of
Ele
ctro
ns
Binding Energy (eV)
Bromine Positivea = 146.8
80 78 76 74 72 70 68-40
-20
0
20
40
60
80
100
120
140
160
180
# of
Ele
ctro
ns
Binding Energy (EV)
Bromine Negativea=33.2
216 214 212 210 208
0
100
200
300
400
500
600
# of
Ele
ctro
ns
Binding Energy (eV)
Niobium Positivea=578.4341
216 214 212 210 208
0
200
400
600
800
1000
1200
1400
1600
# of
Ele
ctro
ns
Binding Energy (eV)
Niobium Negativea=1615.3
Figure 5.2: X-ray photoelectron spectra at a takeoff angle of 90o of poled lithium niobate
positively and negatively charged surfaces after vapor phase exposure to bromo acetic acid
(Br2CH2CO2H). Representative peaks of Nb and Br are indicated. The Br2CH2CO2H self
assembled monolayer was formed under the following conditions (temperature 120oC, vapor
pressure 60 torr for 1hr). The Br/Nb (+) / Br/Nb (-) intensity ratio was 3.9 to 1.
Figure 5.3 shows the results of doubling the deposition time to 3 hours to observe the effects
of Br saturation on the lithium niobate. The results indicate an increase in bromine molecules
detected and a higher intensity of bromine binding to the positive side of the poled lithium
niobate.
85

80 78 76 74 72 70 68
0
100
200
300
400
500
600
700
800
# of
Ele
ctro
ns
Binding Energy (eV)
Bromine Positivea=715.44971
80 78 76 74 72 70 68
0
100
200
300
400
500
600
700
800
# of
Ele
ctro
ns
Binding Energy (eV)
Bromine Negativea=489.8
216 214 212 210 208
0
100
200
300
400
500
600
700
800
# of
Ele
ctro
ns
Binding Energy (eV)
Niobium Positivea=556.3
216 214 212 210 208
0
100
200
300
400
500
600
700
800
# of
Ele
ctro
ns
Binding Energy (eV)
Niobium Negativea=661.1
80 78 76 74 72 70 68
0
100
200
300
400
500
600
700
800
# of
Ele
ctro
ns
Binding Energy (eV)
Bromine Positivea=715.44971
80 78 76 74 72 70 68
0
100
200
300
400
500
600
700
800
# of
Ele
ctro
ns
Binding Energy (eV)
Bromine Negativea=489.8
216 214 212 210 208
0
100
200
300
400
500
600
700
800
# of
Ele
ctro
ns
Binding Energy (eV)
Niobium Positivea=556.3
216 214 212 210 208
0
100
200
300
400
500
600
700
800
# of
Ele
ctro
ns
Binding Energy (eV)
Niobium Negativea=661.1
Figure 5.3: X-ray photoelectron spectra at a takeoff angle of 90o of poled lithium niobate
positively and negatively charged surfaces after vapor phase exposure to bromo acetic acid
(Br2CH2CO2H). The Br2CH2CO2H self assembled monolayer was formed under the
following conditions (temperature 120oC, vapor pressure 54 torr for 1.5 hr). Representative
peaks of Nb and Br are indicated. The Br/Nb (+) / Br/Nb (-) intensity ratio was .749/. 45.
The deposition time was then lowered to 1 hr with an increase in vacuum pressure to 105 torr
and the results are provided in Figure 5.4. The results continued to demonstrate an increase in
relative bromine intensity to the lithium niobate.
86

216 214 212 210 208-100
0
100
200
300
400
500
600
700
800
# of
Ele
ctro
ns
Binding Energy (eV)
Niobium Positivea=648.8
216 214 212 210 208-100
0
100
200
300
400
500
600
700
800
# of
Ele
ctro
ns
Binding Energy (eV)
Niobium Negativea=1120.3
80 78 76 74 72 70 68-20
0
20
40
60
80
100
120
140
160
180
200
# of
Ele
ctro
ns
Binding Energy (eV)
Bromine Negativea=151.4
80 78 76 74 72 70 68-20
0
20
40
60
80
100
120
140
160
180
200
# of
Ele
ctro
ns
Binding Energy (eV)
Bromine Positivea=191.4
216 214 212 210 208-100
0
100
200
300
400
500
600
700
800
# of
Ele
ctro
ns
Binding Energy (eV)
Niobium Positivea=648.8
216 214 212 210 208-100
0
100
200
300
400
500
600
700
800
# of
Ele
ctro
ns
Binding Energy (eV)
Niobium Negativea=1120.3
80 78 76 74 72 70 68-20
0
20
40
60
80
100
120
140
160
180
200
# of
Ele
ctro
ns
Binding Energy (eV)
Bromine Negativea=151.4
80 78 76 74 72 70 68-20
0
20
40
60
80
100
120
140
160
180
200
# of
Ele
ctro
ns
Binding Energy (eV)
Bromine Positivea=191.4
Figure 5.4: X-ray photoelectron spectra at a takeoff angle of 90o of poled lithium niobate
positively and negatively charged surfaces after vapor phase exposure to bromo acetic acid
(Br2CH2CO2H). Representative peaks of Nb and Br are indicated. The Br2CH2CO2H self
assembled monolayer was formed under the following conditions (temperature 100oC, vapor
pressure 54 torr for .5 hr). The Br/Nb (+) / Br/Nb (-) intensity ratio was .295/. 137.
The results from each spectrum are consistent with electrostatic binding if the bromoacetic acid
reversibly protonating the surface hydroxyls of the lithium niobate, providing a negatively
charged carboxylate.
87

5.3.2 Periodic Poled Lithium Niobate (PPLN)
The next step was to determine if the selective binding behavior of bromine
molecules to the lithium niobate surface could be observed on periodically poled domains on
a single face of lithium niobate. Samples with micron-sized structures patterned on lithium
niobate were obtained from the Nemanich group (Figure 5.5). The diagram shows the
regions of periodic poling along the lithium niobate substrate.
~12µm ~12µm
+ + +- -90
–10
0µm~12µm ~12µm
+ + +- -90
–10
0µm
Figure 5.5: Diagram of periodic poled LiNbO3 as purchased. Illustration (left) indicates the
spacing and charge between each periodically poled domain. The right illustration provides
the aerial view of the entire periodically poled sample on a single lithium niobate surface.
The procedure for passivation using TMSCl and vapor deposition of bromoacetic acid
was carried out as previously described. An initial attempt was made to characterize the
brominated PPLN surface with elemental mapping using an EDS detector scanning electron
88

microscopy. The poor results from the images indicated the information depth of the
instrument was much larger than the deposit layer thickness.
Time of Flight Secondary Ion Mass Spectrometry (TOF-SIMS) was then used as a
characterization technique to give elemental composition maps with higher spectral
resolution and surface sensitivity in the nanometric size scale. Figures 5.6-8 represent the
images retrieved from the TOF-SIMS data. Figure 5.6 depicts negative ion scanning images
of the PPLN sample. A contoured pattern is noticed in the elemental mapping of Br, b. CH, c.
H, and d. OH. The contours are consistent in size with the patterned domains of the PPLN.
89

a. b.
c. d.
a. b.
c. d.
Figure 5.6: TOF-SIMS images of a. Br, b. CH, c. H, d. OH (negative). A 600 pA primary ion
current was used over a 200 mm x 200 mm detection area with a 7.2 kV extraction voltage.
Figure 5.7 provides negative ion scanning images of a different region of the PPLN sample.
TOF SIMS is a sensitive technique for elemental analysis, which allows the detection of trace
impurities. The defect captured shown in 5.7.a. OH and 5.7.d C and absent in the 5.7.b Br
image could be indicative of an organic impurity or contamination at the surface.
90

a. b.
c. d.
a. b.
c. d.
a. b.
c. d.
Figure 5.7: TOF-SIMS images of a. H, b. Br, c. OH, d. C (negative). A 600 pA primary ion
current was used over a 200 mm x 200 mm detection area with a 7.2 kV extraction voltage.
The embedded contours are still visibly present. We also collected images using positive
secondary ions shown in Figure 5.8. Bromine was seen in low yields because of low positive
secondary ions detected for the element. From the images in Figures 5.6-8, localization of
bromine is not observed.
91

Figure 5.8: TOF-SIMS images of a. Br, b. total scan (positive). A 600 pA primary ion
current was used over a 200 mm x 200 mm detection area with a 7.2 kV extraction voltage.
5.4 Conclusions
A method of using self-assembly to develop electrostatic interaction between
Bromoacetic acid and poled Lithium Niobate has been reported in this chapter. Here we
attempted to demonstrate this phenomenon on two types of poled lithium niobate substrates,
a single faced poled surface and periodically poled domains on the surface. We successfully
demonstrated selective binding of bromoacetic acid to the single faced poled lithium niobate
substrate using XPS. Our results show under specific conditions a 10- fold preference for the
positive side of the sample compared to the negative side of the sample could be observed.
Selective binding was not observed using periodically polled lithium niobate. The size scale
of the poled domain could attribute to the discrepancies in binding. The selective binding was
observed on a poled surface of 1 x 1 cm2 using XPS versus non-specific binding observed at
a 1µm poled region using TOF SIMS. Future work could include Auger Electron
92

Spectroscopy in addition to XPS. Auger Electron Spectroscopy (AES) provides mobility of
the incident electron beam to different regions of a single sample. When used in conjunction
with XPS, AES provides mapping of the surface elemental distribution. This spectroscopy
instrumentation should be able to detect elements within the µm scale, which would be
beneficial in collecting additional information on periodically poled lithium niobate.
5.5 Experimental 5.5.1 Materials
Poled LiNBO3 substrates were purchased from Crystal Technology, Inc. Single poled
LiNBO3 substrates were purchased .5mm thick, polished on both sides, and z-cut.
Chlorotrimethylysilane (TMSCl), dry hexane was obtained from Sigma Aldrich, (St.Luois,
MO) and used as received without further purification. All other solvents and chemicals used
were of reagent grade.
5.5.2 Surface Passivation
Lithium niobate samples (1 cm x 1cm) were annealed in an ambient furnace at 1000o
for two hours. After annealing the substrates cleaning was then followed by water, ethanol
rinsing and drying with nitrogen. Delicate handling of only the edge of the sample was very
important during the cleaning procedure to avoid compromising the surface charge by
contaminating the face of the LiNbO3 surface.
Silination reactions were then immediately carried out in an enclosed glass chamber.
A 30µL droplet of Chlorotrimethylsilane (TMSCl) was exposed to each side of the poled
93
lithium niobate for vapor deposition. Contact angle measurements using a Ramehart optical
goniometer were made to ensure even distribution of TMSCl molecules on the lithium
niobate surface.
5.5.3 Instrumentation
XPS characterization occurred at pressure of 2 x 10⁻⁹ Torr using the 1253.6 eV Mg
Kα line from a Fisons X3 dual anode source and a Fisons Clam II electron analyzer. The
resolution of the analyzer was determined from the full width half maximum of a gold 4f7/2
spectral peak to be aprox. 1.0eV, however, through curve fitting, the centroid of spectral
peaks can be resolved to +/- 0.1 eV. The observation parameters were set to Nb 3d and Br 3d
binding energies to record core level shifts.
Surface mapping was performed using time-of-flight (ToF) SIMS with a PHI TRIFT I
ToF mass spectrometer. Analysis conditions included 25 keV Ga+ primary ion
bombardment with detection of positive or negative secondary ions. A 600 pA primary ion
current was used over a 200 mm x 200 mm detection area with a 7.2 kV extraction voltage.
Charge neutralization was accomplished with a pulsed low energy electron beam (~24 eV).
Data acquisition time was set to 10min, resulting in a total ion fluency of ca. 5 x 10¹¹
ions/cm2 per analysis. Because this is below the so-called static limit, analysis was
constrained to the top monolayer (~ 1 nm) of the sample. Both secondary ions were collected
from three to four different spots of the sample, secondary ion image were subsequently
analyzed using WinCadence software.
94

95
5.6 References:
(1) Kalinin, S.; Alvarez, D.; Lei, T.; Hu, X.; Ferris, Z.; Zhang, Q.; Dunn, S. Nano
Lett. 2002, 2.
(2) Shrout, T.; Swartz, S. Processing of Ferroelectric and Related Materials: A
Review. pp 80-88 in Applications of Ferroelectrics, 1992. Proceedings of the
Eighth IEEE International Symposium.
(3) Alexe, M.; Hesse, D. Journal of Materials Science 2006, 41, 1-11.
(4) Purice, A.; Dinescu, G.; Scarisoreanu, N.; Verardi, P.; Craciun, F.; Galassi,
C.; Dinsecu, M. Journal of European Ceramic Society 2006, 26, 2937.
(5) Auciello, O. Physics Today 1998, 51, 22.
(6) Yanagida, H. Angew, Chem. 1988, 100, 1443.
(7) Fujimoto, K.; Cho, Y. Appl. Phys. Lett. 2003, 83, 5265.
(8) Rosenman, G.; Urenski, P.; Argonin, A.; Rosenaks, Y.; Molotoskii, M. Appl.
Phys. Lett. 2003, 82, 103.
(9) Bilz, H.; Benedek, G.; Bussmann-Holder, A. Physical Review B 1987, 35,
4840.
(10) Kozitskii, Y.; Levitskii, R.; Stasyuk, I. Translated from Teoreticheskaya;
Matematcheskaya Fizika, 1979, 39,106
(11) K. K. Wong, Properties of Lithium Niobate, Data Reviews Series, no. 28, The
Institute of Electrical Engineers (London, UK, 2002).
(12) Kuroda, A.; Kurimura, S.; Uesu, Y. Appl. Phys. Lett. 1996, 69, 9.
(13) Yamada, M.; Nada, N.; Sayito, M.; Watanabe, K. Appl. Phys. Lett. 1993, 62,
435.

96
(14) Vaidya, R.; Simonson, R.; Cesarano, J.; Dimos, D.; Lopez, G. Langmuir 1996,
12, 2830-2836.
(15) Moulder, J.; Stickle, W.; Sobol, P.; Bonben, K. Handbook of Xray
Photoelectron Spectroscopy; Perkin-Elmer Group: Eden Prairie, MN, 1992

97
Chapter 6: Summary and Outlook
The principal goal of this thesis was centered around surface modification
techniques used to enhance potentially useful behavior of material on surfaces. We reported
using porous and flat silicon decorated with molecular gradients compromising
semifluorinated organolsilanes cause an increase in droplet motion. An extension of the
droplet motion research was conducted providing a systematic study on the effects of surface
tension and viscosity on moving droplets. Modifications were also made to a surface by
constructing a polymer brush gradient on silicon to enhance the efficiency in binding and
detection of probe molecules. Continuing with the “building up” from the surface technique
a poled substrate was also tailored by electrostatically binding polar molecules to form a
molecular assembly.
6.1 Systematic Study of Pore Size for Water Motion on Wettability Gradients
In Chapter 2, theoretical analysis has shown that if a high surface tension liquid, such
as water, is placed on a porous substrate that is covered with a fluorinated monolayer, the
inability of the liquid to wet the pores causes the formation of air pockets inside the pores.
Air pockets in turn, lower the friction at the liquid/substrate interface thus increasing the drop
velocity. In order to cause friction at the liquid/ substrate interface, electrochemical etching
was used to create nanometric sized pores within a silicon substrate While the depth of the
pores can be controlled to some degree by the etching time, one typically does not have a
good control over the pore sizes and distribution. The difficulties associated with preparing

98
well-defined pSi substrates can be circumvented by utilizing anodic aluminum oxide (AAO)
substrates. AAO with various pore sizes and depths can either be prepared by
electrochemical etching of alumina or can be obtained from commercial sources. The use of
commercially available AAO is advantageous because it will reduce the sample preparation
time. AAO samples can be used as a platform for a systematic study of the of pore size
distribution with a controlled density used in droplet motion.
6.2 Movement of liquids containing suspended particles
In Chapters 2 and 3 droplet motion was studied using water and viscous liquids.
There are also benefits to conducting research on the movement of liquids containing
suspended particles. By successfully distributing particles onto a surface by a liquid medium,
new applications in separations can be developed. Research in the area can also lead to
distribution of particles in “nano beaker” or “ nano containers within the nanometric sized
pores of PSi. However, if the particles remain in the liquid during transport, a method for
transporting particles on a gradient surface would be developed. New methods of
transporting particle fluids show promise within the fields of nano-manufacturing and
directed material synthesis. An investigation of the use of polystyrene spheres as the
suspended particle would be beneficial because of the various sphere sizes that are readily
available from commercial sources. The novel particle transport procedures on the micro and
nano length scales offer reduced sample volumes, assay times, and also procedural costs.
Research in this area should address particle/ particle and particle /surface interactions upon
liquid movement.

99
6.3 Systematic study on the Weight Capacity of DNA in a Polymer Brush
In Chapter 4 we identified an efficient method of increasing DNA immobilization and
hybridization. A polymer brush molecular weight gradient was used as a platform for DNA
attachment. The polymer brush gradient provided chain lengths of various sizes to be studied
on a single substrate. Fluorescence microscopy was used to obtain relative fluorescence
intensity values indicating DNA hybridization and attachment to the polymer backbone. The
microscopy technique provided evidence indicating an increase in DNA attachment to the
polymer backbone as the polymer chain length increased. A sequential study of the DNA
loading capacity at varying chain lengths will be beneficial in identifying the amount of DNA
held within the polymer brush. Quartz Crystal Microscopy would be an ideal technique to
use because it involves a mass sensor with capabilities of determining molecular weight
changes in the nanogram range. Research detailing the change in weight of dna attached to
varying polymer brush chain length scales could lead to quantitative analysis indicating the
maximum loading capacity of DNA relative of the chain length.
6.4 Polarization Driven Self-Assembly using Polar Silanes
In Chapter 5 we studied electrostatic interactions between a polarized ferroelectric
domain and polar molecules. We successfully demonstrated selective binding of bromoacetic
acid to the single faced polled lithium niobate substrate using XPS. An investigation on
selective binding of polar silanes such as N- (2-aminoethyl) 3-aminopropyl-trimethoxysilane
(AEAPS), will lead to a new, monolayer-based self-assembly strategy on a poled surface. If

100
the use of polar silanes for selective binding is successful, this technique can be used as a
method for creating molecular gradients using SAMs. Molecular gradients using SAMs
provide a method of designing a surface with varying chemical interactions along the surface,
including wettability. Gradient surfaces are useful in biological and chemical applications, in
particular protein adsorption and cell attachment.