absorption efficiency assessment and uncertainty
TRANSCRIPT
TECHNICAL NOTE https://doi.org/10.4209/aaqr.200583
Aerosol and Air Quality Research | https://aaqr.org 1 of 12 Volume 21 | Issue 3 | 200583
Aerosol and Air Quality Research
OPEN ACCESS Received: October 3, 2020 Revised: November 22, 2020 Accepted: December 5, 2020 * Corresponding Author: [email protected]
Publisher: Taiwan Association for Aerosol Research ISSN: 1680-8584 print ISSN: 2071-1409 online
Copyright: The Author(s).
This is an open access article distributed under the terms of the Creative Commons Attribution License (CC BY 4.0), which permits unrestricted use, distribution, and reproduction in any medium, provided the original author and source are cited.
Absorption Efficiency Assessment and Uncertainty Measurement of the Sodium Arsenite Method for Ambient NO2 Determination Rishu Agarwal1,2, Shankar G. Aggarwal1,2* 1 Academy of Scientific and Innovative Research (AcSIR), CSIR-National Physical Laboratory Campus, New Delhi, 110012, India 2 Environmental Sciences and Biomedical Metrology Division, CSIR-National Physical Laboratory, New Delhi, 110012, India
ABSTRACT
The absorption efficiency and uncertainty involved in the sodium arsenite method (modified
Jacobs and Hochheiser method) of NO2 measurement were studied using two standard gas concentrations (4.86 ± 0.10 µmol mol–1 (ppm) and 1.95 ± 0.10 µmol mol–1 (ppm)). An average of 71 ± 3% and 71 ± 6% absorption efficiencies, respectively were observed against reported efficiency of 82% in the published standard (IS 5182 (Part 6): 2006, BIS, 2006a) in 1-impinger system at sampling flow rate of 1 L min–1 and absorbing solution temperature of 10–15°C during gas absorption in impinger. The difference is accounted for by the variation in flow rate used in present study (1 L min–1) and that in standard method (0.2 L min–1). Uncertainty involved in the method was calculated considering a range of factors directly or indirectly affecting the measurement and was found to be 15%. Based on the comparison study performed for NO2 ambient measurements using an equivalent method (chemiluminescence continuous method) and 1-impinger system reference method, the present study highlights the importance of accurate determination of absorption efficiency factor in the NO2 pollutant measurement at laboratory level. Variations observed in the absorption efficiency and the data from inter-comparison study between manual and real-time method warranted this study to be taken up to provide solutions for improvement of the method. The use of at least three absorbers/impingers (connected in series) instead of one to obtain absorption efficiency close to unity is proposed to make the reference method independent from the use of absorption efficiency factor thus ensuring the improved data quality and comparability. Keywords: Gaseous NO2 pollution, Sodium arsenite method, Absorption efficiency, Measurement uncertainty
1 INTRODUCTION
Nitrogen oxides (NOx = NO + NO2) are important air pollutants that have effect on regional as well global climates as they participate in formation of secondary pollutants and the ozone gas. The uses of fossil fuels such as diesel in automobiles, biomass burnings, high temperature combustion processes in various industries are the major sources of NOx emissions in the atmosphere (Bhanarkar et al., 2005; Degraeuwe et al., 2017). Higher concentrations of NO2 in ambient air can lead to several respiratory disorders in humans. Nitrogen dioxide is included in the National Ambient Air Quality Standards (NAAQS) as one of the regulatory parameters with defined reference and equivalent measurement techniques. The accuracy and precision of measurement techniques/methods and instruments hold great importance in reporting a regulatory pollutant data as per the NAAQS and International Organization for Standardization (ISO) standards. The uncertainty in the measurements should be reported along with the data as an ideal practice to

TECHNICAL NOTE https://doi.org/10.4209/aaqr.200583
Aerosol and Air Quality Research | https://aaqr.org 2 of 12 Volume 21 | Issue 3 | 200583
better evaluate the compliance of the measured concentration (Aggarwal et al., 2013). Uncertainty in a measurement depends on several factors, directly and indirectly. Careful investigation of these factors is necessary to obtain reliable results. Since, NO2 plays a vital role in the climatic processes and impacts health on regional and global scale, it is important to know the result with involved uncertainties in the measurement. Such results are vital to better simulate secondary particle concentration especially in urban atmosphere (Lin and Cheng, 2007; Mavroidis and Chaloulakou, 2011; Kuprov et al., 2014).
Ambient NO2 is measured mostly using two techniques, manual and continuous. For manual monitoring, sodium arsenite method (also known as modified Jacobs and Hochheiser method (Merryman et al., 1973)) and for continuous monitoring, chemiluminescence method is widely used. In several countries, both these methods are employed for regulatory monitoring whereas manual method is used as reference method. Besides the automatic continuous method (chemiluminescence based), the manual reference method is still of high relevance in metrological view as it realizes direct measurement of ambient NO2 in SI unit "mole", and is also used for intermediate check in quality assurance purposes. The robustness and simplicity of a reference method is of great significance for easy implementation and reliable results. Additionally, it should perform equally well in the varying ambient field sampling conditions. A continuous research thus is always needed for improvements in measurement method to minimize errors and bias in the data.
The degree of conversion of nitrogen dioxide gas to nitrite during the sampling process of reference method is important to be known to calculate the NO2 concentration levels in ambient air samples (Purdue et al., 1972). An absorption efficiency factor is introduced in calculations to account for the loss of unabsorbed NO2. Therefore, absorption efficiency is one of the important factors that may affect the data quality causing over/under estimation of ambient NO2 concentration levels using the reference method.
The absorption efficiency of the manual Jacobs and Hochheiser method has long been in question (Heuss et al., 1971; Hauser and Shy, 1972; Merryman et al., 1973) since its adoption as the reference method by U.S. EPA (1971) for NO2 monitoring. Subsequent investigations of the method led to improvement in its absorption efficiency by addition of 0.1% sodium arsenite (Christie et al., 1970; Beard and Margeson, 1974; Margeson et al., 1977, 1978). The modified Jacobs and Hochheiser method (also called sodium arsenite method) has been in use since then, however, limited information is available on sensitivity of the method towards the varied sampling conditions such as type of impinger system, sampling duration, sample flow rate, degree of gas solubility, operating temperature, etc. (Goyal and Chavhan, 2015). Filho et al. (2019) in a recent study have been able to develop a new low-cost device involving a micro-impinger bubbler employing similar method with a different reagent (Griess-Saltzman reagent) with a limit of detection of 14 µg m–3.
The current Indian reference standard for measurement of ambient NO2 (IS 5182 (Part 6): 2006) published in 2006 by Bureau of Indian Standards (BIS) is based on the investigations of Christie et al. (1970); Jacobs and Hochheiser (1958) and Margeson et al. (1977) and includes 0.82 as the absorption efficiency factor (at 0.2 L min–1 sample flow rate, 10–15°C temperature and 24 hours sampling duration).
Previous studies (Table 3) have shown a wide variation in absorption efficiency of the method due to different sampling conditions. The present study is aimed at finding a solution to reduce this variation where we have measured the absorption efficiency of the manual reference method using two standard gas concentrations (traceable to SI) and have proposed suggestions for its enhancement where the need of the absorption efficiency factor could be eliminated. Another objective of the study is to update the readers about the variation in efficiency if flow rate, temperature and other sampling conditions deviate from the standard method as observed in different studies previously. The uncertainty involved in the method is also calculated considering all the direct and indirect factors contributing to the measurement. The present study provides valuable inputs for improvement of the existing manual method of monitoring of gaseous NO2 pollutant in ambient air.

TECHNICAL NOTE https://doi.org/10.4209/aaqr.200583
Aerosol and Air Quality Research | https://aaqr.org 3 of 12 Volume 21 | Issue 3 | 200583
2 METHODOLOGY
2.1 Efficiency Estimation The standard NO2 gas cylinders of two different concentrations (traceable to SI), i.e., 1.95 ±
0.10 µmol mol–1 (or ppm) and 4.86 ± 0.10 µmol mol–1 were used. The NO2 gas was directly bubbled into a set of 4 impingers (nozzle type) connected in series containing 30 mL absorbing reagent (sodium arsenite) for a duration of 5 min at a flow rate of 1 L min–1 (Fig. 1). The temperature of the system was maintained at 10–15°C during the gas absorption in the impingers. Eight such 4-impinger sample sets were collected and analyzed for both the concentrations as per the standard guidelines of the sodium arsenite method (IS 5182 (Part 6): 2006, BIS, 2006a). The analysis includes reacting the NO2
– formed during sampling with sulphanilamide, phosphoric acid and N-(1-naphthyl)-ethylenediamine di-hydrochloride (NEDA) dye to form a colored azo-dye compound and measuring the absorbance of this azo-dye at 540 nm using spectrophotometer (Model: MS UV Plus, MOTRAS Scientific). A method calibration was performed as recommended in standard guidelines prior to analysis, wherein calibration standards (sodium nitrite solution prepared in laboratory) in the range of 1–20 µg mL–1 were used followed by the standard analysis procedure as mentioned above. An absorbance versus concentration graph was plotted and the slope was determined using the best fit line in regression analysis. The inverse of this slope is then used as the calibration or graph factor in the Eq. (1) for the calculation of NO2 concentration. The concentration in each impinger of each set was calculated using the Eq. (1) and absorption efficiencies were calculated as given in Eq. (2).
( )
0.82
s b s
air t
A A CF VC
V V
− =
(1)
where, C = NO2 concentration (µg m–3). As = sample absorbance. Ab = reagent blank absorbance. CF = calibration factor (inverse of slope of best fit line of calibration graph). Vs = volume of sample in the impinger (mL). Vair = volume of air sampled (m3). Vt = volume of aliquot taken for analysis (mL). 0.82 = absorption efficiency factor (this factor is taken into consideration when only one impinger is used for sampling).
Fig. 1. Schematic of sampling apparatus for efficiency estimation.
NO2
Vent
Silica gel dryer
RotameterPeltier cooling
ThermometerImpingers filled with absorbing solution
(30 mL) maintained at 10-15˚C
Standard gas
cylinder
By Pass for flow check/setting
TECHNICAL NOTE https://doi.org/10.4209/aaqr.200583
Aerosol and Air Quality Research | https://aaqr.org 4 of 12 Volume 21 | Issue 3 | 200583
The absorption efficiency (AE) for impinger system is calculated as:
( )
( )
( )
2
1
2
% 100
n
ii
Total
NO
AENO==
(2)
where, (NO2)i = NO2 concentration observed in ith impinger. (NO2)Total = NO2 concentration introduced in the system. N = number of impingers used in the system.
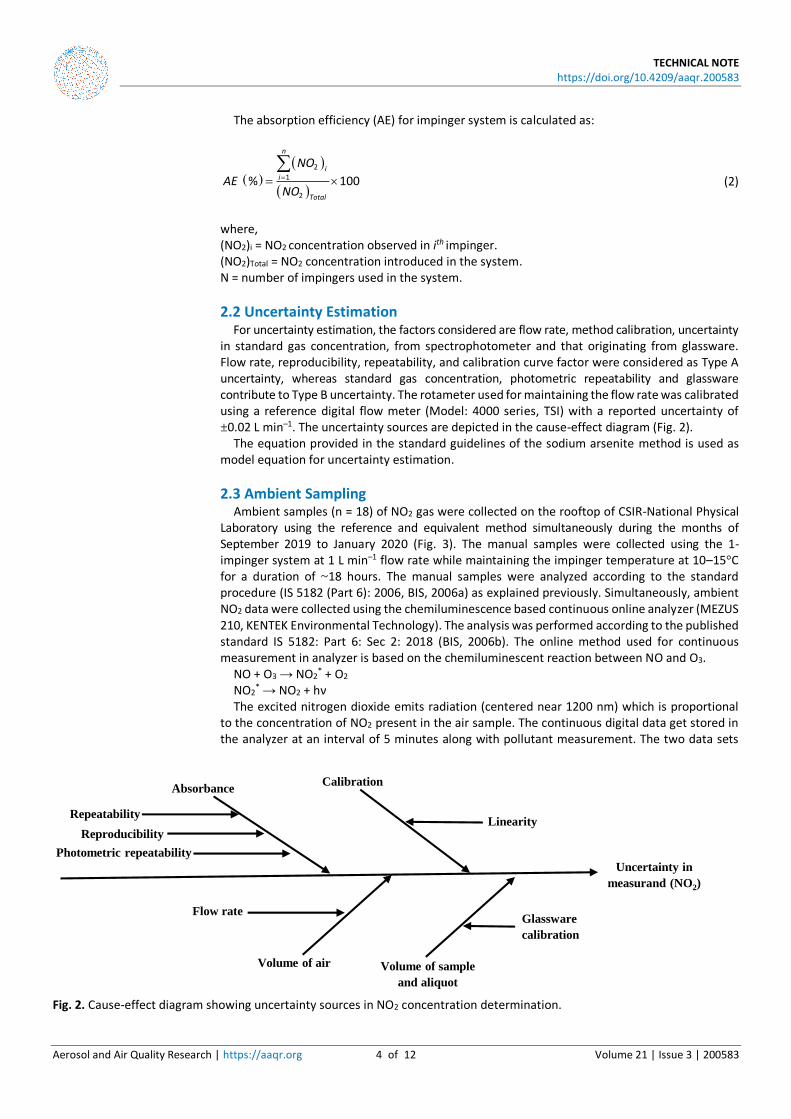
2.2 Uncertainty Estimation For uncertainty estimation, the factors considered are flow rate, method calibration, uncertainty
in standard gas concentration, from spectrophotometer and that originating from glassware. Flow rate, reproducibility, repeatability, and calibration curve factor were considered as Type A uncertainty, whereas standard gas concentration, photometric repeatability and glassware contribute to Type B uncertainty. The rotameter used for maintaining the flow rate was calibrated using a reference digital flow meter (Model: 4000 series, TSI) with a reported uncertainty of ±0.02 L min–1. The uncertainty sources are depicted in the cause-effect diagram (Fig. 2).
The equation provided in the standard guidelines of the sodium arsenite method is used as model equation for uncertainty estimation.
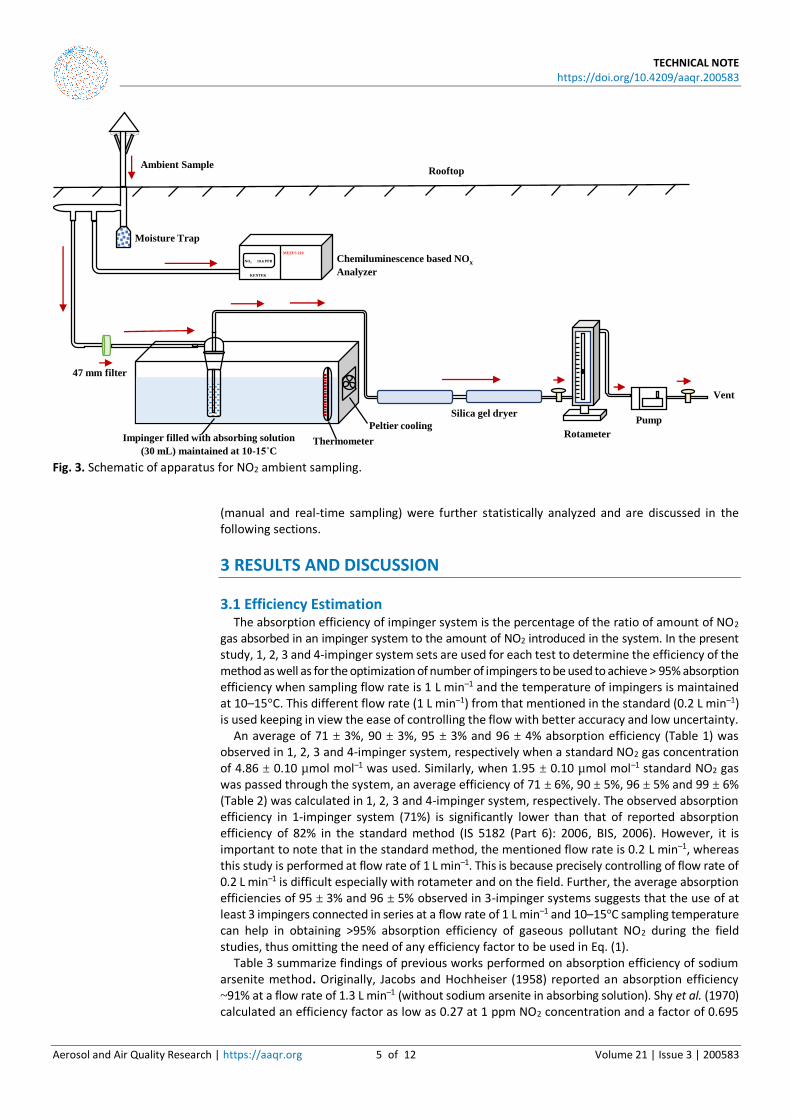
2.3 Ambient Sampling Ambient samples (n = 18) of NO2 gas were collected on the rooftop of CSIR-National Physical
Laboratory using the reference and equivalent method simultaneously during the months of September 2019 to January 2020 (Fig. 3). The manual samples were collected using the 1-impinger system at 1 L min–1 flow rate while maintaining the impinger temperature at 10–15°C for a duration of ~18 hours. The manual samples were analyzed according to the standard procedure (IS 5182 (Part 6): 2006, BIS, 2006a) as explained previously. Simultaneously, ambient NO2 data were collected using the chemiluminescence based continuous online analyzer (MEZUS 210, KENTEK Environmental Technology). The analysis was performed according to the published standard IS 5182: Part 6: Sec 2: 2018 (BIS, 2006b). The online method used for continuous measurement in analyzer is based on the chemiluminescent reaction between NO and O3.
NO + O3 → NO2* + O2
NO2* → NO2 + hν
The excited nitrogen dioxide emits radiation (centered near 1200 nm) which is proportional to the concentration of NO2 present in the air sample. The continuous digital data get stored in the analyzer at an interval of 5 minutes along with pollutant measurement. The two data sets
Fig. 2. Cause-effect diagram showing uncertainty sources in NO2 concentration determination.
Uncertainty in
measurand (NO2)
AbsorbanceCalibration
Volume of air Volume of sample
and aliquot
Repeatability
Reproducibility
Photometric repeatability
Flow rateGlassware
calibration
Linearity
TECHNICAL NOTE https://doi.org/10.4209/aaqr.200583
Aerosol and Air Quality Research | https://aaqr.org 5 of 12 Volume 21 | Issue 3 | 200583
Fig. 3. Schematic of apparatus for NO2 ambient sampling.
(manual and real-time sampling) were further statistically analyzed and are discussed in the following sections.
3 RESULTS AND DISCUSSION
3.1 Efficiency Estimation The absorption efficiency of impinger system is the percentage of the ratio of amount of NO2
gas absorbed in an impinger system to the amount of NO2 introduced in the system. In the present study, 1, 2, 3 and 4-impinger system sets are used for each test to determine the efficiency of the method as well as for the optimization of number of impingers to be used to achieve > 95% absorption efficiency when sampling flow rate is 1 L min–1 and the temperature of impingers is maintained at 10–15°C. This different flow rate (1 L min–1) from that mentioned in the standard (0.2 L min–1) is used keeping in view the ease of controlling the flow with better accuracy and low uncertainty.
An average of 71 ± 3%, 90 ± 3%, 95 ± 3% and 96 ± 4% absorption efficiency (Table 1) was observed in 1, 2, 3 and 4-impinger system, respectively when a standard NO2 gas concentration of 4.86 ± 0.10 µmol mol–1 was used. Similarly, when 1.95 ± 0.10 µmol mol–1 standard NO2 gas was passed through the system, an average efficiency of 71 ± 6%, 90 ± 5%, 96 ± 5% and 99 ± 6% (Table 2) was calculated in 1, 2, 3 and 4-impinger system, respectively. The observed absorption efficiency in 1-impinger system (71%) is significantly lower than that of reported absorption efficiency of 82% in the standard method (IS 5182 (Part 6): 2006, BIS, 2006). However, it is important to note that in the standard method, the mentioned flow rate is 0.2 L min–1, whereas this study is performed at flow rate of 1 L min–1. This is because precisely controlling of flow rate of 0.2 L min–1 is difficult especially with rotameter and on the field. Further, the average absorption efficiencies of 95 ± 3% and 96 ± 5% observed in 3-impinger systems suggests that the use of at least 3 impingers connected in series at a flow rate of 1 L min–1 and 10–15°C sampling temperature can help in obtaining >95% absorption efficiency of gaseous pollutant NO2 during the field studies, thus omitting the need of any efficiency factor to be used in Eq. (1).
Table 3 summarize findings of previous works performed on absorption efficiency of sodium arsenite method. Originally, Jacobs and Hochheiser (1958) reported an absorption efficiency ~91% at a flow rate of 1.3 L min–1 (without sodium arsenite in absorbing solution). Shy et al. (1970) calculated an efficiency factor as low as 0.27 at 1 ppm NO2 concentration and a factor of 0.695
Vent
Silica gel dryer
MEZUS 210
NO2 10.6 PPB
KENTEK
Chemiluminescence based NOx
Analyzer
Moisture Trap
ThermometerImpinger filled with absorbing solution
(30 mL) maintained at 10-15˚C
Peltier coolingRotameter
Pump
RooftopAmbient Sample
47 mm filter

TECHNICAL NOTE https://doi.org/10.4209/aaqr.200583
Aerosol and Air Quality Research | https://aaqr.org 6 of 12 Volume 21 | Issue 3 | 200583
Table 1. Observed concentration in individual impingers (connected in series) and efficiency percentage of impinger systems for NO2 standard gas (4.86 ± 0.10 ppm).
Set Observed NO2 concentration in
individual impingers (ppm) Observed total NO2 Conc. (ppm)
Efficiency of impinger system (%)
I II III IV 1 2 3 4
1 3.24 0.96 0.31 0.03 4.54 66.67 86.37 92.66 93.35 2 3.43 1.05 0.32 0.14 4.94 70.51 92.08 98.67 101.62 3 3.56 0.69 0.25 0.08 4.57 73.24 87.39 92.49 94.12 4 3.47 1.05 0.32 0.11 4.94 71.31 92.91 99.44 101.65 5 3.42 1.03 0.21 0.10 4.75 70.29 91.42 95.75 97.73 6 3.69 0.74 0.16 0.02 4.61 75.83 90.98 94.34 94.78 7 3.55 0.90 0.26 0.07 4.78 73.05 91.64 96.99 98.34 8 3.37 0.80 0.19 0.03 4.38 69.27 85.68 89.49 90.04 Average 3.46 0.90 0.25 0.07 4.69 71.27 89.81 94.98 96.46 Std Dev 0.14 0.14 0.06 0.04 0.20 2.79 2.85 3.39 4.11
Table 2. Observed concentration in individual impingers (connected in series) and efficiency percentage of impinger systems for NO2 standard gas (1.95 ± 0.10 ppm).
Set Observed NO2 concentration in
individual impingers (ppm) Observed total NO2 Conc. (ppm)
Efficiency of impinger system (%)
I II III IV 1 2 3 4
1 1.42 0.39 0.13 0.09 2.03 72.74 92.88 99.55 104.23 2 1.22 0.38 0.12 0.07 1.79 62.53 81.90 88.12 91.59 3 1.38 0.41 0.13 0.05 1.97 70.81 91.92 98.52 100.93 4 1.38 0.31 0.09 0.01 1.79 70.78 86.69 91.08 91.60 5 1.43 0.37 0.10 0.01 1.92 73.43 92.40 97.56 98.24 6 1.22 0.42 0.16 0.04 1.84 62.53 84.20 92.45 94.48 7 1.55 0.35 0.11 0.06 2.06 79.42 97.23 102.67 105.81 8 1.45 0.40 0.13 0.06 2.04 74.39 94.81 101.68 104.84 Average 1.38 0.38 0.12 0.05 1.93 70.83 90.26 96.45 98.97 Std Dev 0.11 0.04 0.02 0.03 0.11 5.79 5.38 5.28 5.88
Table 3. Parameters and findings reported in previous studies performed on sodium arsenite method.
Reference Impinger system
Flow rate (L min–1)
Impinger temperature (°C)
Sampling time (hours)
Absorption efficiency (%)
Christie et al. (1970) 1 0.125 - - 95 Merryman et al. (1973) 2 0.5 - 24 89.7 Margeson et al. (1977) 1 0.2 25 20 82.46 Goyal et al. (2000) 4 0.55 ± 0.05 16 1 84.4 ± 3 in first impinger
26 87.8 ± 4 in first impinger 36 77.4 ± 4 in first impinger
Goyal (2002) 1 0.2 25 24 63.5 Goyal (2003) 4 0.23 ± 0.08 29-30 24 64 in first impinger Goyal and Chavhan (2015) 4 and 3 0.5 - 8 69.4
1 - 8 45.6 0.5 - 16 59.2 1 - 16 35.2
Present study 4 1 10-15 5 min* 71 in 1-impinger system, > 95 in 3-impinger system
* With gas standards. It is important to note that this is the first study in which “traceable gas standards” for the determination of absorption efficiency are used and reported. Other studies have used gases but have not mentioned "traceability". The U.S. EPA studies have used "traceable permeation tube standards".

TECHNICAL NOTE https://doi.org/10.4209/aaqr.200583
Aerosol and Air Quality Research | https://aaqr.org 7 of 12 Volume 21 | Issue 3 | 200583
at much lower concentration (0.056 ppm) using the same method. Christie et al. (1970) found a high recovery of 94% while using 5.8 ppm of standard NO2 gas at 0.12 L min–1 sampling flow rate (with sodium arsenite in absorbing solution). Merryman et al. (1973) reported an average efficiency of 89.7% using 2-impinger system at 0.465 L min–1 which was similar to the work reported by Jacobs and Hochheiser but with the use of 0.1% sodium arsenite in absorbing solution. Goyal (2002) reported an efficiency of 33% and 63.5% at a flow rate of 1 L min–1 and 0.2 L min–1, respectively for a 24-hour sample in single impinger system maintained at 25°C temperature using the standard sodium arsenite method, suggesting a possible effect of varied flow rate on absorption efficiency. These laboratory tests show that the sodium arsenite method performs well on the grounds of efficiency in the higher concentrations of NO2 as well, subject to certain sampling conditions such as sample flow rate, number of impingers used in the impinger system, and temperature of the impinger system.
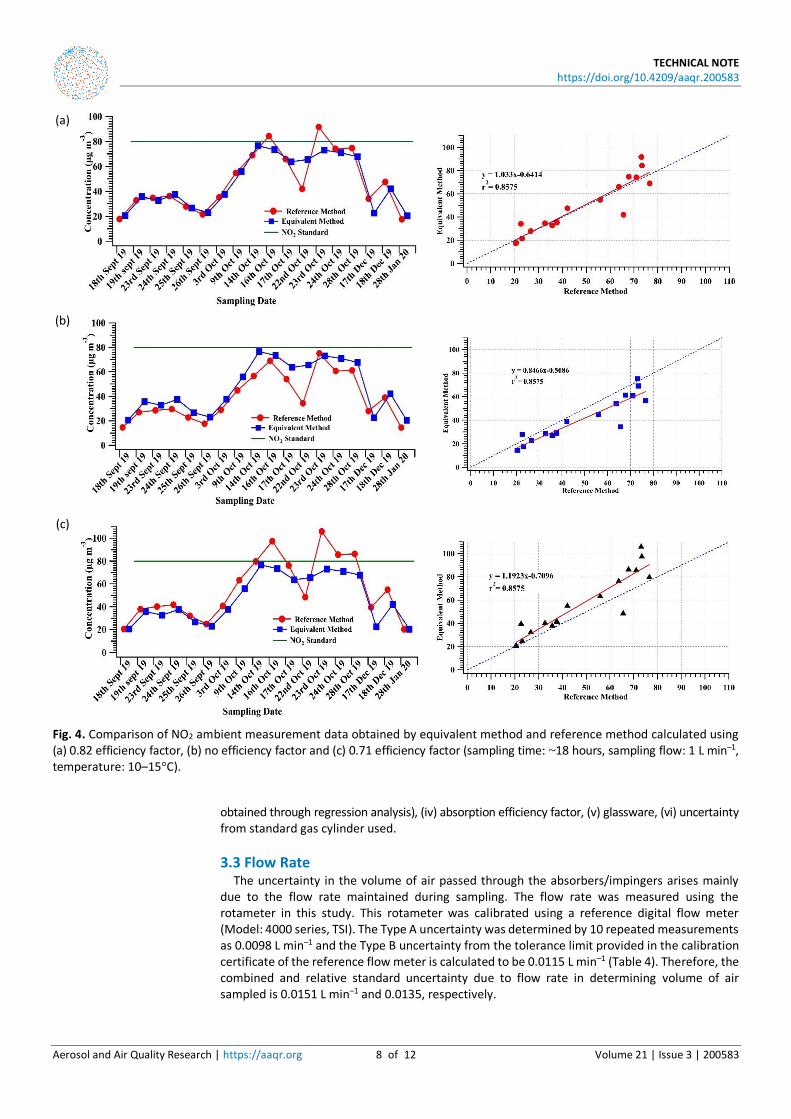
The absorption efficiency factor (0.82) in Eq. (1) depends on several factors as discussed above and thus may enhance uncertainty and ambiguity in the results if absorption efficiency is not close to 0.82 in 1-impinger system as mentioned in the standard. The ambiguity caused in the measurement data obtained using 1-impinger system due to variation in absorption efficiency factor is evident from the ambient sampling data (Fig. 4) wherein the manual method data is calculated for 1-impinger system using three variations of Eq. (1), i.e., (a) with 0.82 efficiency factor (as mentioned in standard); (b) with no efficiency factor; and (c) with 0.71 efficiency factor (from present study). The manual sampling data shows good and similar correlation (r2 = 0.86) with equivalent method (chemiluminescence) data in all three variations of efficiency factors. However, a distinct behavior is observed for each case where, with 0.82 factor (Fig. 4(a)) the data shows good consistency with equivalent method, but with no factor (Fig. 4(b)) in use it underestimates, and with 0.71 factor (Fig. 4(c)) it overestimates the ambient NO2 concentration levels. It is important to note here that at high concentrations, with use of 0.82 and 0.71 efficiency factor the NO2 concentration (91.7 µg m–3 and 105.9 µg m–3, respectively) from manual data crosses the regulatory standard limit (80 µg m–3) whereas with no factor in use (75.2 µg m–3), the NO2 level is well within regulatory standard limit.
The results from this inter-comparison study points out the importance of use of accurate absorption efficiency factor while monitoring the ambient NO2 levels, failing which the data may be misleading. These differences can also cause ambiguity in measurement data collected by different monitoring laboratories/institutes if careful investigation of efficiency factor is not performed prior to the ambient sampling. However, such experimental setups (for efficiency determination) may or may not be available with every monitoring laboratory.
Further, if the standard sampling conditions are maintained (especially flow rate and sampling temperature), then the ambient conditions will not make any impact on the absorption efficiency of the sampling method. The use of 3-impinger system is one simple and easy alternative solution to reach an efficiency factor near unity and eliminate the requirement of incorporation of efficiency factor altogether in measurements enhancing the manual method’s robustness, data quality and reliability. Improved data quality will help in providing better suited sustainable pollution control measures and policy formulations.
3.2 Uncertainty Estimation According to the International Organization for Standardization (ISO) Guide to the Expression
of Uncertainty in Measurement (GUM), the uncertainty of a measurement is “a parameter associated with the result of a measurement, that characterizes the dispersion of the values that could reasonably be attributed to the measurand”. The standard uncertainty is estimated as the positive square root of the estimated variance. The standard combined uncertainty is derived from combining the standard uncertainties of individual components according to the model equation. In the present study, uncertainty of the sodium arsenite method for determination of ambient NO2 is calculated using factors from both the sampling and the analysis procedures.
The factors or input variables considered for uncertainty analysis based on the model equation used for reporting final NO2 concentration after spectrophotometric analysis are: (i) flow rate during sampling, (ii) absorbance of sample/standard (repeatability, reproducibility and photometric repeatability), (iii) calibration factor (inverse of the slope of best fit line of calibration curve
TECHNICAL NOTE https://doi.org/10.4209/aaqr.200583
Aerosol and Air Quality Research | https://aaqr.org 8 of 12 Volume 21 | Issue 3 | 200583
(a)
(b)
(c)
Fig. 4. Comparison of NO2 ambient measurement data obtained by equivalent method and reference method calculated using (a) 0.82 efficiency factor, (b) no efficiency factor and (c) 0.71 efficiency factor (sampling time: ~18 hours, sampling flow: 1 L min–1, temperature: 10–15°C).
obtained through regression analysis), (iv) absorption efficiency factor, (v) glassware, (vi) uncertainty from standard gas cylinder used.
3.3 Flow Rate The uncertainty in the volume of air passed through the absorbers/impingers arises mainly
due to the flow rate maintained during sampling. The flow rate was measured using the rotameter in this study. This rotameter was calibrated using a reference digital flow meter (Model: 4000 series, TSI). The Type A uncertainty was determined by 10 repeated measurements as 0.0098 L min–1 and the Type B uncertainty from the tolerance limit provided in the calibration certificate of the reference flow meter is calculated to be 0.0115 L min–1 (Table 4). Therefore, the combined and relative standard uncertainty due to flow rate in determining volume of air sampled is 0.0151 L min–1 and 0.0135, respectively.

TECHNICAL NOTE https://doi.org/10.4209/aaqr.200583
Aerosol and Air Quality Research | https://aaqr.org 9 of 12 Volume 21 | Issue 3 | 200583
Table 4. Uncertainty budget of standard NO2 gas (1.95 ± 0.10 µmol mol–1) concentration measurement.
S. No. Parameter Type of Uncertainty Standard Uncertainty Relative standard Uncertainty (u(x)/x)
1 Flow rate:
• Rotameter
• Flow meter
• Type A (σ/√n)
• Type B (a/√3)
0.031/√10 = 0.0098 L min–1 0.02/√3 = 0.0115 L min–1 u(f) = √(0.0098)2 + (0.0115)2 = 0.0151 L min–1
(0.0151/1.12) = 0.0135
2 Sample Absorbance:
• Repeatability
• Reproducibility
• Photometric repeatability
• Type A (σ/√n)
• Type A (σ/√n)
• Type B (a/√3)
0.0375/√3 = 0.0216 Abs 0.0069/√8 = 0.0025 Abs 0.001/√3 = 0.0006 Abs u(As) = √(0.0216)2+(0.0025)2
+ (0.0006)2 = 0.0218 Abs
(0.0218/0.1491) = 0.1462
3 Calibration factor (standard error of slope from regression analysis)
Type A (from regression statistics)
u(cf) = 0.0004 Abs × mL µg–1 (0.0004/0.0239) = 0.0167
4 Absorption efficiency factor* Type A (σ/√n) u(ae) = 0.0579/√8 = 0.0204 (0.0204/0.7083) = 0.0289
5 Glassware (measuring cylinder/pipette)
Type B (a/√6) u(g) = 0.5/√6 = 0.2041 (0.2041/50) = 0.0041
6 Standard gas concentration Type B (a/√3) u(sg) = 0.10/√3 = 0.0577 µmol mol–1
(0.0057/1.95) = 0.0296
* The absorption efficiency factor is used to compensate for the loss of NO2 during sampling due to limitations of the absorbing solution and the sampling system. Since, in this study during uncertainty calculation, we are using the cumulative concentration obtained in the 4-impinger system, this factor reaches ~1 and thus is not taken into consideration for uncertainty calculation.
3.4 Spectrophotometric Measurement The uncertainty in absorbance measurements is determined through reproducibility and
repeatability study. Eight sets of repeated samplings were done for both the NO2 standard concentrations. The standard uncertainty of reproducibility was found to be 0.0025 Abs. For determining repeatability uncertainty, 3 replicate analyses were performed of the same set of a sample and it was calculated to be 0.0216 Abs. Also, the reported tolerance level of photometric repeatability (±0.001 Abs) of spectrophotometer in calibration certificate is taken into consideration here as Type B uncertainty and is calculated as 0.0006 Abs leading to a combined standard uncertainty of absorbance measurement to be 0.0218 Abs (Table 4).
3.5 Regression Fit The calibration factor used in the equation for NO2 concentration measurement is determined
from the calibration curve as the inverse of the slope of best fit regression curve based on least squares method. The standard uncertainty in this factor is determined from the regression statistics and is reported as 0.0004 Abs mL µg–1.
3.6 Standard Gas and Glassware Factor The reported tolerance levels of glassware and the standard NO2 gas are incorporated as Type
B uncertainty. The standard uncertainty of these two components is calculated to be 0.2041 ml and 0.0577 ppm, respectively.
3.7 Combined Uncertainty Based on the factors contributing to uncertainty and their relative standard uncertainties as

TECHNICAL NOTE https://doi.org/10.4209/aaqr.200583
Aerosol and Air Quality Research | https://aaqr.org 10 of 12 Volume 21 | Issue 3 | 200583
discussed above and illustrated in Table 4, the combined standard uncertainty in NO2 measurement can be calculated by equation below:
( )( ) ( ) ( ) ( ) ( )
2 2 2 22u f u cf u g u sgu As
CAs f cf g sg
= + + + +
u C (3)
where, u(C) = combined uncertainty. C = average concentration of NO2 determined experimentaly using 4-impinger system. As = sample absorbance. f = flow rate. cf = calibration factor. g = glassware. sg = standard NO2 gas concentration. g = laboratory glassware factor.
Therefore, using the above equation the combined standard uncertainty of the sodium arsenite method for NO2 measurement is found to be 0.29 ppm (15%) when a standard NO2 gas of 1.95 ppm concentration was used.
Another important point to note here is that in the present study, for uncertainty estimation we have used 4-impinger system to get the total concentration of NO2 absorbed whereas generally only one impinger is used during regular monitoring of ambient levels of NO2. As discussed earlier, Indian standard (IS 5182 (Part 6) :2006, BIS, 2006) reports an efficiency factor as high as 0.82. However, in the present study, an efficiency factor of 0.71 ± 0.03% and 0.71 ± 0.06% at 4.86 ppm and 1.95 ppm concentration, respectively is observed when 1-impinger system is used. The present study results suggest that the use of a single impinger is not enough during field studies as we can improve the absorption efficiency factor of 0.82 mentioned in Indian standard towards ~1 if at least a 3-impinger system is used. Since, currently during the field studies, as per standard procedure this factor needs to be incorporated, the uncertainty of this factor should also be included while reporting combined standard uncertainty of measurement performed using 1-impinger system. Thus, the Eq. (3) will become as following to calculate standard uncertainty of NO2 measurement in 1-impinger system:
( )( ) ( ) ( ) ( ) ( ) ( )
2 2 2 22 2u f u cf u g u sgu As u ae
CAs f cf g sg ae
= + + + + +
u C (4)
where, C = Average concentration of NO2 determined experimentaly using 1-impinger system. ae = absorption efficiency.
By using this equation and incorporating the absorption efficiency factor observed in this study, the combined standard uncertainty of the sodium arsenite method with 1-impinger system is calculated as 0.21 ppm (15%) when 1.95 ppm of standard NO2 gas was used. For ambient sampling, the standard gas is not used, hence this factor should not be included in Eq. (4) while reporting the uncertainty of the field sampling data.
4 CONCLUSION A continuous research is always needed to make a reference method more reliable and robust.
The absorption efficiency and the measurement uncertainty involved in the reference manual method (modified Jacobs and Hochheiser method) for determination of ambient NO2 levels were studied. The sample flow rate and temperature of absorbing solutions during sampling hold great importance for ambient NO2 gas absorption in the absorbing solution and thus can affect the overall efficiency of the method. The factor of 0.82 provided in the standard using 1-impinger system was found to be varying in different sampling conditions evident from several previous

TECHNICAL NOTE https://doi.org/10.4209/aaqr.200583
Aerosol and Air Quality Research | https://aaqr.org 11 of 12 Volume 21 | Issue 3 | 200583
and the present study. A high absorption efficiency factor (close to unity) is required to calculate accurately and precisely the ambient NO2 levels. This study suggests the use of at least 3-impinger system to achieve an efficiency factor of ~1 with 1 L min–1 sampling flow rate and 10–15°C temperature. The uncertainty involved in any measurement is equally important to be reported with a particular data set to better analyze and visualize the data in terms of further research and policy formulations. The uncertainty involved in the manual reference method for ambient NO2 determination was observed to be 15% considering the direct and indirect factors involved in the measurement. We further suggest the use of appropriate Certified Reference Materials (CRMs) for calibration purposes instead of fresh laboratory made nitrite standards as different batch of standards may affect the results and involved uncertainty. The use of CRMs will ensure a stable calibration factor during every analysis and improve the data quality.
ACKNOWLEDGEMENT RA acknowledges the University Grants Commission (UGC) for providing JRF fellowship (Ref
No. 23196/(NET-DEC. 2015)). Authors are thankful to the Director, CSIR-National Physical Laboratory for providing all support to carry out this work. All staff members and students of Gas Metrology section are also acknowledged for all their help and support. We also thank KENTEK Environmental Technology, Korea for providing instrumental help in this work.
REFERENCES Aggarwal, S.G., Kumar, S., Mandal, P., Sarangi, B., Singh, K., Pokhariyal, J., Mishra, S.K., Agarwal
S., Sinha D., Singh S., Sharma, C., Gupta, P.K. (2013). Traceability issue in PM2.5 and PM10 measurements. MAPAN 28, 153–166. https://doi.org/10.1007/s12647-013-0073-x
Beard, M., Margeson, J. (1974). An evaluation of arsenite procedure for determination of nitrogen dioxide in ambient air. EPA Report No. 650/4-74-048.
Bhanarkar, A.D., Goyal, S.K., Sivacoumar, R., Rao, C.C. (2005). Assessment of contribution of SO2 and NO2 from different sources in Jamshedpur region, India. Atmos. Environ. 39, 7745–7760. https://doi.org/10.1016/j.atmosenv.2005.07.070
Christie, A.A., Lidzey, R.G., Radford, D.W.F. (1970). Field methods for the determination of nitrogen dioxide in air. Analyst 95, 519–524. https://doi.org/10.1039/AN9709500519
Degraeuwe, B., Thunis, P., Clappier, A., Weiss, M., Lefebvre, W., Janssen, S., Vranckx, S. (2017). Impact of passenger car NOx emissions on urban NO2 pollution–Scenario analysis for 8 European cities. Atmos. Environ. 171, 330–337. https://doi.org/10.1016/j.atmosenv.2017.10.040
Goyal, S.K., Gavane, A.G., Aggarwal, A.L. (2000). Effect of temperature on absorption efficiency of NO2 in arsenite method. Environ. Monit. Assess. 61, 285–291. https://doi.org/10.1023/A:10 06131525148
Goyal, S.K. (2002). Effect of sample flow rate and sampling duration on the absorption of NO2 in the sodium arsenite monitoring method. J. Environ. Monit. 4, 579–582. https://doi.org/10.103 9/B202784B
Goyal, S.K. (2003). Comparison of two manual methods of nitrogen dioxide determination in ambient air. Environ. Monit. Assess. 89, 305–314. https://doi.org/10.1023/A:1026179030146
Goyal, S.K., Chavhan, C.D. (2015). Assessment of Uncertainty in Ambient NO2 concentration determination and its minimization through application of lab scale findings. J. Inst. Eng. India Ser. A 96, 131–137. https://doi.org/10.1007/s40030-015-0118-y
Hauser, T.R., Shy, C.M. (1972). Nitrogen oxides measurement. Environ. Sci. Technol. 6, 890–894. https://doi.org/10.1021/es60069a012
Heuss, J.M., Nebel, G.J., Colucci, J.M. (1971). National air quality standards for automotive pollutants–A critical review. J. Air Pollut. Control Assoc. 21, 535–548. https://doi.org/10.1080/ 00022470.1971.10469565
Bureau of Indian Standards (2006a). Method for measurement of air pollution: Part 6 oxides of nitrogen (First Revision). IS 5182 (Part 6): 2006.
Bureau of Indian Standards (2006b). Methods for measurement of air pollution: Part 6 oxides of nitrogen: Sec 2 chemiluminescence method. IS 5182: Part 6: Sec 2: 2018.
TECHNICAL NOTE https://doi.org/10.4209/aaqr.200583
Aerosol and Air Quality Research | https://aaqr.org 12 of 12 Volume 21 | Issue 3 | 200583
International Organization for Standard (2008). Guide to the Expression of Uncertainty in Measurement, ISO, Geneva.
Jacobs, M., Hochheiser, S. (1958). Continuous sampling and ultramicro determination of nitrogen dioxide in air. Anal. Chem. 30, 426–428. https://doi.org/10.1021/ac60135a032
Kuprov, R., Eatough, D.J., Cruickshank, T., Olson, N., Cropper, P.M., Hansen, J.C. (2014). Composition and secondary formation of fine particulate matter in the Salt Lake Valley: Winter 2009. J. Air Waste Manage. Assoc. 64, 957–969. https://doi.org/10.1080/10962247.2014.903 878
Lin, Y.C., Cheng, M.T. (2007). Evaluation of formation rates of NO2 to gaseous and particulate nitrate in the urban atmosphere. Atmos. Environ. 41, 1903–1910. https://doi.org/10.1016/j.at mosenv.2006.10.065
Margeson, J.H., Beard, M.E., Suggs, J.C. (1977). Evaluation of the sodium arsenite method for measurement of NO2 in ambient air. J. Air Pollut. Control Assoc. 27, 553–556. https://doi.org/1 0.1080/00022470.1977.10470455
Margeson, J.H., Suggs, J.C., Constant Jr, P.C., Sharp, M.C., Scheil, G.W. (1978). Collaborative testing of a manual sodium arsenite method for measurement of nitrogen dioxide in ambient air. Environ.l Sci. Technol. 12, 294–297. https://doi.org/10.1021/es60139a015
Mavroidis, I., Chaloulakou, A. (2011). Long-term trends of primary and secondary NO2 production in the Athens area. Variation of the NO2/NOx ratio. Atmos. Environ. 45, 6872–6879. https://doi.org/10.1016/j.atmosenv.2010.11.006
Merryman, E.L., Spicer, C.W., Levy, A. (1973). Evaluation of arsenite-modified Jacobs-Hochheiser procedure. Environ. Sci. Technol. 7, 1056–1059. https://doi.org/10.1021/es60083a003
Passaretti Filho, J., Costa, M.A., and Cardoso, A. A. (2019). A micro-impinger sampling device for determination of atmospheric nitrogen dioxide. Aerosol Air Qual. Res. 19, 2597–2603. https://doi.org/10.4209/aaqr.2019.06.0318
Purdue, L.J., Dudley, J.E., Clements, J.B., Thompson, R.J. (1972). Reinvestigation of the Jacobs-Hochheiser procedure for determining nitrogen dioxide in ambient air. Environ. Sci. Technol. 6, 152–154. https://doi.org/10.1021/es60061a002
Shy, C.M., Creason, J.P., Pearlman, M.E., McClain, K.E., Benson, F.B., Young, M.M. (1970). The chattanooga school children study: effects of community exposure to nitrogen dioxide: 1. methods, description of pollutant exposure, and results of ventilatory function testing. J. Air Pollut. Control Assoc. 20, 539–545. https://doi.org/10.1080/00022470.1970.10469439
United States Environmental Protection Agency (U.S. EPA) (1971). National primary and secondary ambient air quality standards. Federal Register 36: 8186–8201.