absorption, distribution, metabolism and excretion of...
TRANSCRIPT

General rights Copyright and moral rights for the publications made accessible in the public portal are retained by the authors and/or other copyright owners and it is a condition of accessing publications that users recognise and abide by the legal requirements associated with these rights.
• Users may download and print one copy of any publication from the public portal for the purpose of private study or research. • You may not further distribute the material or use it for any profit-making activity or commercial gain • You may freely distribute the URL identifying the publication in the public portal
If you believe that this document breaches copyright please contact us providing details, and we will remove access to the work immediately and investigate your claim.
Downloaded from orbit.dtu.dk on: Jun 03, 2018
Absorption, distribution, metabolism and excretion of selenium following oraladministration of elemental selenium nanoparticles or selenite in rats
Löschner, Katrin; Hadrup, Niels; Hansen, Marianne; Alves Pereira, Sónia Cristina; Gammelgaard, Bente;Møller, Laura Hyrup; Mortensen, Alicja; Lam, Henrik Rye; Larsen, Erik HuusfeldtPublished in:Metallomics
Link to article, DOI:10.1039/C3MT00309D
Publication date:2014
Document VersionPublisher's PDF, also known as Version of record
Link back to DTU Orbit
Citation (APA):Löschner, K., Hadrup, N., Hansen, M., Alves Pereira, S. C., Gammelgaard, B., Møller, L. H., ... Larsen, E. H.(2014). Absorption, distribution, metabolism and excretion of selenium following oral administration of elementalselenium nanoparticles or selenite in rats. Metallomics, (6), 330-337. DOI: 10.1039/C3MT00309D

330 | Metallomics, 2014, 6, 330--337 This journal is©The Royal Society of Chemistry 2014
Cite this:Metallomics, 2014,
6, 330
Absorption, distribution, metabolism andexcretion of selenium following oraladministration of elemental seleniumnanoparticles or selenite in rats†
Katrin Loeschner,a Niels Hadrup,a Marianne Hansen,a Sonia A. Pereira,a
Bente Gammelgaard,b Laura Hyrup Møller,b Alicja Mortensen,a Henrik Rye Lama
and Erik H. Larsen*a
A suspension of nanoparticles of BSA-stabilized red amorphous elemental selenium (Se) or an aqueous
solution of sodium selenite was repeatedly administered by oral gavage for 28 days at 0.05 mg kg�1 bw
per day (low dose) or at 0.5 mg kg�1 bw per day (high dose) as Se to female rats. Prior to administration,
the size distribution of the Se nanoparticles was characterized by dynamic light scattering and transmission
electron microscopy, which showed that the particles’ mean diameter was 19 nm and ranged in size from
10 to 80 nm. Following administration of the high dose of Se nanoparticles or selenite the concentration of
Se was determined by ICP-MS in the liver, kidney, urine, feces, stomach, lungs, and plasma at the mg g�1
level and in brain and muscle tissue at the sub-mg g�1 level. In order to test if any elemental Se was present
in the liver, kidney or feces, an in situ derivatization selective to elemental Se was performed by treatment
with sulfite, which resulted in formation of the selenosulfate anion. This Se species was selectively and
quantitatively determined by anion exchange HPLC and ICP-MS detection. The results showed that
elemental Se was present in the livers, kidneys and feces of animals exposed to low and high doses of
elemental Se nanoparticles or to selenite, and was also detected in the same samples from control animals.
The fraction of Se present as elemental Se in livers and kidneys from the high dose animals was
significantly larger than the similar fraction in samples from the low dose animals or from the controls.
This suggested that the natural metabolic pathways of Se were exhausted when given the high dose
of elemental Se or selenite resulting in a non-metabolized pool of elemental Se. Both dosage forms of
Se were bioavailable as demonstrated by the blood biomarker selenoprotein P, which was equally
up-regulated in the high-dose animals for both dosage forms of Se. Finally, the excretion of Se in urine and
its occurrence as Se-methylseleno-N-acetyl-galactosamine and the trimethylselenonium-ion demonstrated
that both dosage forms were metabolized and excreted. The results of the study showed that both forms
of Se were equally absorbed, distributed, metabolized and excreted, but the detailed mechanism of the fate
of the administered elemental Se or selenite in the gastro-intestinal tract of rats remains unclear.
Introduction
Selenium (Se) and its metabolites occur in organisms from arange of phyla including microorganisms, fungi, plants, animalsand humans and is incorporated into Se-proteins such as theantioxidant enzymes glutathione peroxidases or selenoprotein-P
(SelP), a transport protein for Se. Current reports on themetabolism of Se have proposed that the metabolic cycle andexcretion from humans include both inorganic and organicmolecular species of Se present at various oxidation statesincluding �2, +2, +4 and +6.1 The formation of elemental Se(oxidation state 0, Se0) has less often been studied as part ofmetabolic processes.2 Nevertheless, Se0 has been reported tooccur in soils where microbes drive the redox cycle between onone hand the oxidized species selenate (Se(VI)) and selenite(Se(IV)) and on the other hand the reduced Se0.3 Furthermore,Se(IV) can be reduced to nanometer-sized particles of Se0 byfungi, which expelled the nanostructures through their cellmembrane as a protective mechanism.4 Following enrichment
a National Food Institute, Technical University of Denmark, Mørkhøj Bygade 19,
DK-2860 Søborg, Denmark. E-mail: [email protected]; Fax: +45 3588 7448;
Tel: +45 35887631b Department of Pharmacy, University of Copenhagen, Universitetsparken 2,
DK-2100 Copenhagen, Denmark
† Electronic supplementary information (ESI) available. See DOI: 10.1039/c3mt00309d
Received 15th October 2013,Accepted 16th December 2013
DOI: 10.1039/c3mt00309d
www.rsc.org/metallomics
Metallomics
PAPER
Publ
ishe
d on
17
Dec
embe
r 20
13. D
ownl
oade
d by
DT
U L
ibra
ry o
n 26
/03/
2014
12:
21:3
3.
View Article OnlineView Journal | View Issue

This journal is©The Royal Society of Chemistry 2014 Metallomics, 2014, 6, 330--337 | 331
of a culture of Lactobacillus bulgaricus with Se(IV), amorphousSe0 nanoparticles (Se0NPs) were formed outside and inside theircytosol, and this Se0-enriched culture was suggested as a safedietary source of Se.5 Transmission electron microscopy (TEM)with element-selective energy-dispersive X-ray fluorescence(EDX) proved to be a convenient tool in these studies for imagingof the Se0NPs and to provide evidence of their identity.
The absorption rate of Se0 obtained from bacteria was testedand showed a modest availability in chickens at 2% of that ofSe(IV).6 Synthetically made Se0NPs have been selectively engineeredas novel Se supplements by derivatizing their surface with bio-inspired materials such as a polysaccharide to improve thestability of the NPs,7 or by using a catechin-derivative8 to allowpH-dependent stability against aggregation in liquid suspen-sion prior to biological experimentation. In the search for abioavailable and bioactive, yet non-toxic form of Se, red Se0NPs,which were synthesized in the presence of and stabilized bybovine serum albumin (BSA), were orally administered to rats.The results showed a high degree of bio-activity comparablewith that of Se(IV) as Se-dependent enzymes were up-regulated,yet the acute and short-term toxicities were lower than that ofSe(IV).9,10 In order to further investigate its potential as a chemo-preventive agent, the toxicity of Se0NPs was compared with that ofselenomethionine (SeMet)11 or methylselenocysteine (MeSeCys) ina short-term study with mice.12 The results showed less toxicity ofthe nanoform, and Se0NPs were as efficient as the two molecularSe forms in inducing the formation of Se-dependent enzymes.In a sub-chronic toxicity study with rats, the nano-Se sourcewas inferior in toxicity to that of Se(IV) or Se-rich protein usedas sources of Se.13 Combined these results demonstrated abeneficial, lower acute and sub-chronic toxicity of Se0. Whenused as a feed additive Se0NPs improved the intrinsic immune-defense system of sheep, rumen fermentation as well as utiliza-tion of the animals’ feed.14,15
Regarding the Se retention in blood and tissues of experimentalanimals, no significant difference in the selenium concentration inblood, liver and kidneys was observed after 7 days of repeatedadministration of Se0NPs or MeSeCys to mice at nutritional levels(0.035 and 0.070 mg kg�1 bw per day). However, when administeringa supra-nutritional dose (1 mg kg�1 bw per day) the Se concentrationwas higher in the MeSeCys exposed animals.12 Similar observationshave been made when comparing Se0NPs with SeMet.11
Methods for detection and quantitative determination of Se0
in liquid suspension included reaction of the Se0 analyte with asulfide followed by spectrophotometric absorbance measurementsof the reaction product.16 A method for determination of Se0 in liverhomogenates and in red blood cell lysates was based on thereduction of Se0 by sodium sulfite to form the selenosulfate-ion(SeSO3
2�). The concentration of Se0NPs was calculated from thedifference in Se concentration in the sample (no sulfite treatment)and that in the supernatant of the sulfite-treated sample.12 Theindirect nature of this analytical approach would benefit from amore direct method of analysis for the SeSO3
2� reaction product.The aim of the present study was to investigate the absorp-
tion, distribution, metabolism and excretion (ADME) of Se0NPsstabilized with BSA in rats that were repeatedly exposed via oral
gavage for 28 days. Two doses of Se, one close to physiologicaldose at 0.05 mg Se per kg bw per day or one supra-nutritionaldose at 0.5 mg Se per kg bw per day, were administered daily.For comparison Se(IV) was used as positive control. In order tomost accurately describe the ADME of Se, its concentrationswere determined in selected tissues, feces and urine usingstate-of-the-art mass spectrometric methods of analysis for Seand Se species analysis. Dynamic light scattering (DLS) or TEMwere used for characterization of the particle size in the Se0NPsuspension prior to dosage.
ExperimentalSelenium nanoparticles and chemicals
A suspension of red amorphous Se0NPs was synthesized byreduction of sodium selenite with glutathione in the presence ofBSA as described in detail elsewhere.9 A solution of 0.2 M sodiumsulfite (BRR, Prolabo, Leuven, Belgium) was prepared in ultra-purewater, which was obtained from a Millipore Element apparatus(Millipore, Milford, MA, USA). The pH of the freshly preparedsolution was 9.5. The solvents used for the high performance liquidchromatography (HPLC) analyses were freshly He-degassed ultra-pure water and methanol (Rathburn Chemicals Ltd., Walkerburn,Scotland). Solutions of selenocystine (SeCys2) (Sigma-Aldrich,Copenhagen, Denmark) and of selenodiglutathione (GSSeSG)(PharmaSe, Lubbock, TX, USA) were prepared in He-degassedultra-pure water. Aqueous solutions of selenite (Se(IV)), selenate(Se(VI)) and selenomethionine (SeMet) were prepared as describedpreviously.17
Characterization of the Se0 nanoparticle suspension
The concentration of Se in the suspension of Se0NPs wasdetermined following digestion by nitric acid (see the followingsection on Se analysis) by inductively coupled plasma massspectrometry (ICP-MS) (7500ce, Agilent Technologies, Japan) run inthe collision-reaction cell (CRC) mode with He as interference-reducing cell gas. The content of non-particulate Se in the suspen-sion was determined following filtration through a 12 kDa molecularweight cut-off cartridge (VectaSpin Micro Centrifuge Filter,Whatman, England) at 13 400 rpm (12 100 � g) for 10 minutesin a microcentrifuge (Eppendorf MiniSpin, Eppendorf AG,Hamburg, Germany). After digestion the acidic samples werediluted with a mixture of ultra-pure water and 3% methanol18
to approximately 2% nitric acid concentration. The concentrationof Se was quantified using external calibration with yttrium (Y) asthe internal standard (SCP Science, Quebec, Canada). The limitof detection (3s) was 17 and 2 mg Se per mL for the suspensionsand filtrates, respectively.
The size distribution of each produced batch was determinedby DLS and laser Doppler velocimetry was used for characteriza-tion of zeta-potential of the nanoparticles in suspension using aZetasizer Nano-ZS (Malvern Instruments, UK). After equilibrationof the sample to a temperature of 25 1C, five measurementswere performed with 12 runs of 10 seconds each. The laserpower (attenuator index) and the measurement position within
Paper Metallomics
Publ
ishe
d on
17
Dec
embe
r 20
13. D
ownl
oade
d by
DT
U L
ibra
ry o
n 26
/03/
2014
12:
21:3
3.
View Article Online

332 | Metallomics, 2014, 6, 330--337 This journal is©The Royal Society of Chemistry 2014
the cuvette were determined automatically by the instrument.For the calculation of the nanoparticle size distributionthe viscosity of water was used. The optical parameters forselenium’s index of refraction n = 3.37 and index of absorptionk = 0.52 at 633 nm were applied.19
The size and shape of the Se0NPs were imaged by TEMusing a TEM Philips CM100 instrument (FEI, Eindhoven, TheNetherlands) at 80 kV accelerating voltage. Prior to recording,the Se0NP suspension was diluted 10 times with deionizedwater. A drop of the suspension was applied to a formvar-coatedcopper grid.
Instrumentation
For the chromatographic separation of Se species, the HPLC flowwas delivered using a quaternary, metal-free HPLC pump and anautosampler. Details of the anion exchange chromatographicsystem used for SeSO3
2� separations, the heparin-affinity HPLCsystem used for SelP analysis and the reversed-phase or cationexchange HPLC systems used for urine metabolites20,21 are givenin ESI,† Table S1. Integration of chromatographic peaks wascarried out using Total Chrom software version 6.3. For the low-level Se determinations in tissues, and for Se detection followingHPLC separations, the ELAN 6100 ICP-DRC-MS instrument(Perkin Elmer SCIEX, Concord, Ont., Canada) was used in thedynamic reaction cell (DRC) mode for reduction of polyatomicinterferences on 77Se, 78Se and 80Se. For Se speciation in urine82Se was monitored using an ELAN 6000 ICP-MS instrument.Instrumental details for ICP-DRC-MS and for HPLC instrumen-tation were as described previously.22,23
Animal study
Four week old female Wistar Hannover Galas rats with a specificpathogen-free health status were purchased from M&B Taconic(Lille Skensved, Denmark). Upon arrival the rats were allowed toacclimatize for a week before the start of the experiment. Thebody weight of the animals at the beginning of the study was(mean � one s.d.) 132 � 15 g (N = 44). The rats were housedconventionally with two animals per cage (Macrolon, TechniplatsGazzada S. ar. L., Buguggiate, Italy) with a 12 : 12 h reversedlight–dark cycle from 7 p.m. to 7 a.m. The room temperature was22� 1 1C and the relative humidity was 55%� 5%. The rats weregiven ad libitum a standard diet (Altromin rat No.1324, Brogården,Gentofte, Denmark) and citric acid acidified (pH 3) tap water toavoid microbiological contamination of drinking water. Thecomposition of the standard feed provided the animals with allnecessary nutrients including an intake of vitamin E of5.7 mg kg�1 bw per day. The animal study was performedunder conditions approved by the Danish Animal ExperimentsInspectorate and the in-house Animal Welfare Committee.The rats were randomized into six groups, two of whichduring 28 consecutive days once daily orally by gavage received100 mL kg�1 bw of either deionized water (N = 8) or100 mL kg�1 bw of an aqueous solution of 4 g L�1 of bovineserum albumin (N = 8) as vehicle controls (St. Louis, MO, USA).The BSA-stabilized suspensions of Se0NPs were dosed at 0.05 or0.5 mg Se per kg bw per day (N = 6 per group), or aqueous
solutions of the Se(IV) sodium salt were dosed at the same twodoses (N = 8 per group). On day 15 of the study the rats wereplaced individually for 24 hours in metabolism cages forcollection of urine and feces on dry ice. During this time theanimals had access to water, but not to feed. On day 28 the ratswere fasted overnight before euthanization on day 29 wherethey were anaesthetized in CO2/O2 and decapitated. Blood fromthe neck wound was collected on heparin and plasma wasprepared by centrifugation (1000 � g at 0 to 4 1C for 10 min)and organs were removed. From six animals from each of thegroups exposed to 0.5 mg kg�1 bw per day of Se0NPs or Se(IV),the stomach (corpus ventriculi), muscle (right biceps femoris) andbrain, which were transferred to ice-cold 0.32 M sucrose andhomogenized by focused ultrasound, were reserved for chemicalanalysis. From the same animals, the liver (lowest part of theleft median lobe), left kidney and feces were sampled for totalSe and Se0 analysis, whereas blood plasma was subjected tototal Se and SelP analysis.
Sample preparation and analysis of Se, SelP and elemental Se
Sub-samples of animal organs were mixed with nine timesexcess of ultra-pure water in a 50 mL polyethylene tube andhomogenized using an Ultra Turrax homogenizer (DI 25 Basic,Ika-Werke, Staufen, Germany). The homogenates were frozenand stored at �18 1C until time of analysis. The complete feceswere collected and dried at 80 1C for 4 days. The dry sampleswere homogenized using a mortar and pestle and stored in adesiccator until time of analysis. The content of Se in the biologicalsamples, in the Se0NP-suspension and in the filtrates were deter-mined by ICP-DRC-MS following microwave-assisted wet-ashingby nitric acid of 300 mg of tissue, 100 mg of feces or 1 mL ofurine using a methodology described previously.17
The thawed blood plasma samples were passed through a0.45 mm filter (Whatman Mini-UniPrep, Clifton, NJ, USA) andsubjected to separation of the SelP by heparin affinity HPLC(Table S1, ESI†). Quantification was carried out using post-columnisotope dilution using an enriched (99.2%) 77Se standard.24 Theenriched isotope (10 ng Se per mL using mobile phase A as solvent)was pumped using a peristaltic pump and its accurate flow wasmonitored daily by weighing. The enriched stable isotope and theeluent from the HPLC column were mixed via a T-piece beforeentry into the nebulizer of the ICP-DRC-MS, which was used todetect the spike isotope (77Se) and the reference isotope (80Se) at50 ms dwell time per mass for the duration of the chromatographicseparation. Corrections were made daily for mass bias.
Then thawed urine samples were diluted (1 + 1) by the mobilephase and filtered prior to analysis. The separated Se species werequantified by external calibration by use of a single authenticstandard of the respective Se species as the calibrant.
For control of accuracy of Se analyses in organs and fecesthe certified reference material (CRM) Bovine Liver (BCR CRM185R No. 69, Geel, Belgium) with a certified value for Se of1680 � 140 ng g�1 was included in each batch of analyses.The values obtained were corrected for the dry matter contentof 93.2%. For determination of Se in urine samples theRM Seronormt Trace Elements Urine (Nycomed Pharma
Metallomics Paper
Publ
ishe
d on
17
Dec
embe
r 20
13. D
ownl
oade
d by
DT
U L
ibra
ry o
n 26
/03/
2014
12:
21:3
3.
View Article Online
This journal is©The Royal Society of Chemistry 2014 Metallomics, 2014, 6, 330--337 | 333
Diagnostics, Oslo, Norway) with a reference value for Se of58.6 ng Se per mL was used.
For the in situ synthesis of the ion in tissues and feces,500 mL of the organ homogenate or 50 mg of the dry fecescontaining Se0 were mixed with 250 mL of the 0.2 M sulfitesolution and water to a final volume of 1500 mL. The mixturewas placed in a flat bottom glass vial in a water bath at 50 1Cfor 20 minutes using magnetic stirring. After cooling, themixture was purified by passage through a disposable C18 filtercartridge mounted in series with a membrane filter with a0.45 mm pore size. Prior to HPLC analysis, sub-samples ofone for every ten of the sulfite-treated control samples werespiked with 0, 100 or 200 ng Se per mL as Se(VI), which wasco-chromatographed and used to construct a standard addi-tions calibration curve for Se on the basis of chromatographicpeak area. Anion exchange HPLC (Table S1, ESI†) was used toseparate the synthesized SeSO3
2�, which corresponded to theoriginal content of Se0, from the spiked Se(VI) calibrant andother naturally occurring Se-species in the sample.
The contents of Se or Se species in the biological materialswere compared using Student’s two sample t-test ( p o 0.05)after the F-test of the equality of variances (Excel, MicrosoftCorporation, WA, USA).
Results and discussionSe0 nanoparticle characterization
The size distribution of the Se0NPs in BSA solution determinedby DLS is shown in Fig. 1. The major fraction of the nano-particles had a diameter in the range of 10 to 80 nm with amaximum of the size distribution (mean � one s.d.) at 19 �1 nm. A small fraction of the Se0NPs was present as micrometersized aggregates, which could not be dispersed by ultrasound.The size distribution was determined immediately beforeand after the animal study to ensure that nanoparticles withthe same size characteristics were administered to the ratsthroughout the animal study. Transmission electron micro-scopy (Fig. 1) confirmed the determined diameter and showedthat the particles had a spherical shape. The total seleniumconcentration in the suspensions was (mean � one s.d.) 380 �3 mg mL�1. The amount of unbound selenium was undetectable
(o2 mg mL�1) showing that all administered Se was in the formof nanoparticles.
Absorption and distribution of Se
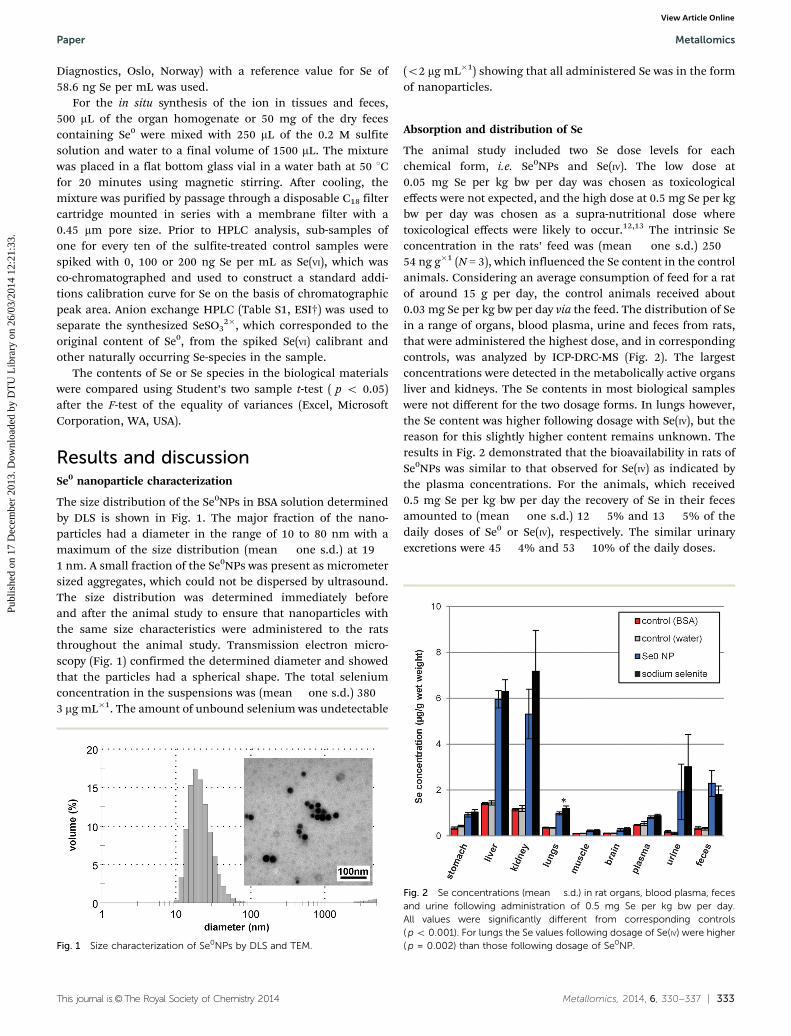
The animal study included two Se dose levels for eachchemical form, i.e. Se0NPs and Se(IV). The low dose at0.05 mg Se per kg bw per day was chosen as toxicologicaleffects were not expected, and the high dose at 0.5 mg Se per kgbw per day was chosen as a supra-nutritional dose wheretoxicological effects were likely to occur.12,13 The intrinsic Seconcentration in the rats’ feed was (mean � one s.d.) 250 �54 ng g�1 (N = 3), which influenced the Se content in the controlanimals. Considering an average consumption of feed for a ratof around 15 g per day, the control animals received about0.03 mg Se per kg bw per day via the feed. The distribution of Sein a range of organs, blood plasma, urine and feces from rats,that were administered the highest dose, and in correspondingcontrols, was analyzed by ICP-DRC-MS (Fig. 2). The largestconcentrations were detected in the metabolically active organsliver and kidneys. The Se contents in most biological sampleswere not different for the two dosage forms. In lungs however,the Se content was higher following dosage with Se(IV), but thereason for this slightly higher content remains unknown. Theresults in Fig. 2 demonstrated that the bioavailability in rats ofSe0NPs was similar to that observed for Se(IV) as indicated bythe plasma concentrations. For the animals, which received0.5 mg Se per kg bw per day the recovery of Se in their fecesamounted to (mean � one s.d.) 12 � 5% and 13 � 5% of thedaily doses of Se0 or Se(IV), respectively. The similar urinaryexcretions were 45 � 4% and 53 � 10% of the daily doses.
Fig. 1 Size characterization of Se0NPs by DLS and TEM.
Fig. 2 Se concentrations (mean � s.d.) in rat organs, blood plasma, fecesand urine following administration of 0.5 mg Se per kg bw per day.All values were significantly different from corresponding controls( p o 0.001). For lungs the Se values following dosage of Se(IV) were higher( p = 0.002) than those following dosage of Se0NP.
Paper Metallomics
Publ
ishe
d on
17
Dec
embe
r 20
13. D
ownl
oade
d by
DT
U L
ibra
ry o
n 26
/03/
2014
12:
21:3
3.
View Article Online

334 | Metallomics, 2014, 6, 330--337 This journal is©The Royal Society of Chemistry 2014
Analysis and occurrence of Se0 in liver, kidneys and feces
Given the finding that both administered Se forms were absorbedby rats, the question was in which chemical or physical form it waspresent. Bearing in mind that intact selenium nanoparticles werereported in livers following oral administration of BSA-stabilizedSe0NPs to mice,12 it was decided to test if Se0 occurred in the organsfrom the present work. The most straightforward way would be toapply an imaging method and screen for the presence of Se0NPs.Given that the mean diameter of the dosed Se0NPs was approxi-mately 20 nm and that the liver tissue concentration of Se wasapproximately 5 mg g�1, the number density however, was too lowfor any successful imaging of Se0NPs by TEM. Therefore, anionexchange HPLC-ICP-MS was used following in situ derivatisation ofSe0 with sulfite to SeSO3
2�.12,25,26
The usefulness of the method based on in situ derivatisationof Se0 in biological materials depended on its selectivity,accuracy and on possible associated matrix effects. In orderto test the selectivity of the derivatisation method to Se0, Sespecies that are known to occur in biological materials, andtherefore could interfere during the sulfite reaction, weretaken through the derivatisation procedure and the reactionproduct analysed by anion-exchange HPLC-ICP-MS. The resultsin Fig. 3 demonstrated that the method was selective to Se0,with the exception of GSSeSG for which a small HPLC peakco-eluted with the reaction product between Se0NPs and sulfite,i.e. SeSO3
2� (lower trace). This could be caused by instability ofthe selenotrisulfide, which was observed to degrade at neutralor alkaline pH followed by formation of elemental Se.27 Themethod was applied to the analysis of Se0 in the biologicalsamples and an example chromatogram is shown in ESI,†Fig. S0. The influence of the reaction time between sulfiteand Se0 on the yield of SeSO3
2� showed that reaction timeslonger than 20 minutes gave no further yield of this Se species,which was stable only for a few hours in the pre-treated biologicaltissue (ESI,† Fig. S1). The samples therefore had to be analyzedwithin a short time interval from the sample pre-treatment.Absolute recoveries of Se following spiking with Se0NPs to liver,kidneys or feces were 64–72%, and possible matrix effects on thecalibration curves based on spiking with Se(VI) were undetectableas shown in ESI,† Fig. S2.
The quantitative results for the content of Se0 in liver,kidneys and feces are given in Fig. 4 as a fraction of total Sein each biological sample. The results demonstrated that Se0
was indeed detected in the biological materials from animalsfollowing administration of Se0NPs or Se(IV) at both dose levels.The intake of Se from the feed was 0.03 mg kg�1 bw per day,which yielded detectable Se0 at around 5–10% of the total Seconcentration in the control samples. For the rats, which weredosed 0.05 mg kg�1 bw per day, the liver and kidney samplesalso showed a content of Se0, which did not differ from thecorresponding controls and did not depend on the dosage form.This suggested that the metabolic potential of Se in these organswas sufficient to convert the administered Se via natural pathways.In contrast, in the samples from rats, which were administeredthe ten times higher dose, i.e. 0.5 mg kg�1 bw per day, the
Fig. 3 Anion exchange HPLC-ICP-MS chromatograms of 150 ng Se permL of authentic Se standards, and 1000 ng Se per mL of Se0NPs treatedwith sulfite leading to formation of SeSO3
2�. See the Methods section forfurther details.
Metallomics Paper
Publ
ishe
d on
17
Dec
embe
r 20
13. D
ownl
oade
d by
DT
U L
ibra
ry o
n 26
/03/
2014
12:
21:3
3.
View Article Online

This journal is©The Royal Society of Chemistry 2014 Metallomics, 2014, 6, 330--337 | 335
relative amount of Se0 in liver and kidneys increased significantlyfrom 2 to 7% in the control and low dose animals to between 17 and40% of the total Se concentration in these organs. This increasecould be explained by exhaustion of the natural reductive pathwayby glutathione (GSH) leading to formation of Se0 via formation ofunstable GSSeSG or selenopersulfide intermediates.2,28 Undersuch circumstances the risk of Se toxicity may be prevalent dueto the associated possible oxidative damage.29 The relativeexcretion of Se0 in feces was generally higher from animals thatreceived Se0NPs than those receiving Se(IV), which indicated alower absorption of Se0NPs. The finding of Se0 in the feces alsofrom the Se(IV) dosed group of animals can be explained bybacterial reduction of Se(IV) to Se0.30
Selenoprotein P as a blood biomarker for exposure to Se0NPs
The bioavailability and incorporation of Se into Se-proteins wasmonitored by SelP in plasma. Because synthesis of seleno-proteins occurs as part of the suggested metabolic pathway ofSe in animals and humans, the up-regulation is considered toexpress that both forms of administered Se were available tothe pathway.1 The content of SelP in plasma was analysed byaffinity HPLC-ID-ICP-MS as shown by the example chromato-gram in ESI,† Fig. S3. The final results were calculated on thebasis of the ratio of 77Se to 80Se. The results in Fig. 5 showfor both dose levels of Se(IV), that SelP was expressed to ahigher concentration than that in the corresponding controls.Following the administration of two doses of Se0NPs to the ratshowever, this increase was observed only for the high dose of0.5 mg kg�1 bw per day. Because the levels of SelP in plasmawere not significantly different in the high dose Se0NPs groupas compared with Se(IV), it is concluded that both forms ofSe are equally bioavailable and cause an equal up-regulationof SelP in rats. The same conclusion was drawn for theliver, plasma and kidney glutathione peroxidases (GPx) in mice
supplemented with Se0NPs or Se(IV), but for up-regulation ofthioredoxin reductases (TrxR) in liver and kidneys, Se(IV) wasmore efficient than Se0NPs.9,12 The present findings in rats and thepreviously published results for mice indicate that the investigatedSe-proteins were up-regulated dependent on the supplementeddose of Se, but largely independent of its chemical form.
Excretion of Se in urine
The excretion of Se (Fig. 2) and Se species metabolites wasstudied in urine by HPLC-ICP-MS. Despite the fact that the levelof the glutathione may have been influenced by the animals’fasting at the day of collection of urine, and knowingthat this reductant influences the metabolism of Se in rats,still the state of fasting is relevant both to animals and tohumans e.g. while sleeping, or after the postprandial period.Representative chromatograms (ESI,† Fig. S4) show that theselenosugar, Se-methylseleno-N-acetyl-galactosamine (SeGalNAc)and trimethylselenonium-ion (TMSe+) were detected and thesemi-quantitative results are presented in Fig. 6. It appears thatfor animals treated with Se0NPs, the concentrations of SeGalNAcare higher in the low dose animals compared to high doseanimals, while the opposite pattern was observed in the animalsdosed with Se(IV). However, the variation between animals is verylarge. The results in Fig. 6 are given as urine concentrations, andcalculation of total excreted Se did not change this pattern. NoTMSe+ was detected in controls and low dose animals, whilelarge amounts were observed in both high dose groups. Whencalculating the percentage of Se excreted as SeGalNAc andTMSe+, respectively (ESI,† Table S2), it appeared that in low doseanimals that received both Se forms and in controls, about 70%of the Se content was excreted as SeGalNAc, while the averageexcretion of this Se species in high dose animals was around 20%.
Fig. 4 Elemental Se (Se0) as a percent of total Se (mean � s.d.) in rat liver,kidneys and feces. Columns correspond to administration of Se0NPs orSe(IV) (mg Se per kg bw per day) or controls.
Fig. 5 Concentration of selenoprotein P (SelP) in rat plasma (mean � s.d.)following administration of Se as Se0NPs or Se(IV) at low or high doses(mg kg�1 bw per day). The stars indicate the level of significant differencebetween dosage and control. The results corresponding to high doses ofSe0NP and Se(IV) were not significantly different.
Paper Metallomics
Publ
ishe
d on
17
Dec
embe
r 20
13. D
ownl
oade
d by
DT
U L
ibra
ry o
n 26
/03/
2014
12:
21:3
3.
View Article Online

336 | Metallomics, 2014, 6, 330--337 This journal is©The Royal Society of Chemistry 2014
At the same time the TMSe+ excretion increased to about 50%in both high dose groups. Thus, the average excretion patternsof SeGalNAc and TMSe+ were identical after Se0NP or Se(IV)administration. SeGalNAc is the major metabolite in urine,31,32
while the presence of TMSe+ is dose dependent in rats.33 Thefinding that the relative TMSe+ excretion increases with increasingdoses of selenite in rats is thus in accordance with previous resultsfor young rats,33 although the studies on groups of animals arelimited and no speciation data on Se excretion after Se0NPadministration have been published before.
Possible conversions of Se in the gastro-intestinal tract of ratsprior to absorption
Following oral administration by gavage of Se as Se0NPs or Se(IV)the dosed forms may undergo changes under the influence ofthe different physico-chemical and microbial conditions existingin the compartments of the gastrointestinal tract of rats. Thesimilar concentration of Se found in the blood and the organsfollowing oral administration of Se as Se0NPs or Se(IV) (Fig. 2)and the similar fraction of Se0 herein (Fig. 4) suggest that the twochemical forms were metabolized following similar pathways.
Such pathways may include that Se(IV) was reduced to Se0, orthat Se0NPs became dissolved and oxidized to inorganic oxo-anions of Se, as both reactions were possible in a microbialenvironment.3,34 Such conversions were demonstrated using theintestinal contents from rats as medium and it was shown thatSe(IV) was reduced to red elemental Se0 by the gut microflora.30 Ina study with broiler chickens, the animals were dosed with 75Se(IV)or as BSA-stabilized 75Se0NPs at approximately the same size asused in the present study.35 The results showed that the nano-particles were more effectively absorbed by the chickens incomparison with Se administered as Se(IV). The authors suggestedthat the Se0NPs were absorbed directly from the intestine, but didnot present any direct evidence to support this.
Alternatively, the dosed BSA-stabilized Se0NPs may becomedissolved in oxidized segments of the gastrointestinal tract andpossibly form Se(IV) via microbial or chemical activity.35 Inthis case, Se(IV) would be absorbed passively in a similarfashion for both dosage forms, and such a route would supportour findings. Furthermore, the slightly higher content of Se andhigher proportion of Se0 in feces from animals given the Se0NPsin this study (Fig. 2) lends credit to this fate of Se0NPs in rats.
Conclusions
In conclusion, our studies have shown that Se from Se0NPs wasabsorbed and distributed to organs and excreted to the sameextent as that observed for Se administered as Se(IV) used aspositive control. The bioavailability of nanoparticulate elemental Sewas derived from the finding of SelP in plasma. The entry of Se0NPsinto the metabolic pathway and its subsequent excretion was provenby the detection of the urinary metabolites Se-methylseleno-N-acetyl-galactosamine and TMSe+ and furthermore indicated by the similarexcretion patterns in rats’ urine after dosage of Se0NPs or Se(IV).The high relative amount (tens of percent) of Se0 found in liverand kidneys of animals receiving the high dose of Se0NPs orSe(IV) suggested a dissimilarity in metabolism in the animalsthat received low dose or controls. The possible toxic reactionassociated with the high dose triggered further study of seleniumtoxicity following exposure to Se0NPs, which is now underwayin our group. The fate and mechanisms behind the possibleconversions of Se in the gastrointestinal tract of rats to shedlight on which pathways are active prior to absorption needfurther elucidation. The aim of such research would be toanswer the question whether Se dosed as Se(IV) is reduced toSe0 and absorbed as such, or whether Se0 becomes oxidizedto oxo-anions of Se before absorption.
Acknowledgements
The authors wish to thank the Danish Food Industry Agencyfor funding the project. Anne Ørngreen, Maja Danielsen, EvaFerdinansen, Elise E. Navntoft, Eigil V. Frank, Kenneth R. Wormand Sarah G. Simonsen are thanked for excellent technicalassistance. Finally, we thank Dr Xueyun Gao, Institute for HighEnergy Physics, Chinese Academy of Sciences, Beijing, China forskillful synthesis of the BSA-stabilized Se0NPs.
References
1 C. Thiry, A. Ruttens, L. De Temmerman, Y. J. Schneider andL. Pussemier, Food Chem., 2012, 130(4), 767–784.
2 H. E. Ganther, Biochemistry, 1971, 10(22), 4089–4098.3 P. R. Dowdle and R. S. Oremland, Environ. Sci. Technol.,
1998, 32(23), 3749–3755.4 M. M. Gharieb, S. C. Wilkinson and G. M. Gadd, J. Ind.
Microbiol., 1995, 14(3–4), 300–311.5 S. K. Xia, L. Chen and J. Q. Liang, J. Agric. Food Chem., 2007,
55(6), 2413–2417.
Fig. 6 Concentration of Se-methylseleno-N-acetyl-galactosamine andtrimethylselenonium-ion in rat urine following administration of Se0NPsor Se(IV).
Metallomics Paper
Publ
ishe
d on
17
Dec
embe
r 20
13. D
ownl
oade
d by
DT
U L
ibra
ry o
n 26
/03/
2014
12:
21:3
3.
View Article Online

This journal is©The Royal Society of Chemistry 2014 Metallomics, 2014, 6, 330--337 | 337
6 G. Combs, C. Garbisu, B. Yee, A. Yee, D. Carlson, N. Smith,A. Magyarosy, T. Leighton and B. Buchanan, Biol. TraceElem. Res., 1996, 52(3), 209–225.
7 H. Wu, X. Li, W. Liu, T. Chen, Y. Li, W. Zheng, C. W.-Y. Man,M. K. Wong and K. H. Wong, J. Mater. Chem., 2012, 22(19),9602–9610.
8 S. Wu, K. Sun, X. Wang, D. Wang, X. Wan and J. Zhang,J. Agric. Food Chem., 2013, 61(30), 7268–7275.
9 J.-S. Zhang, X.-Y. Gao, L.-D. Zhan and Y.-P. Bao, BioFactors,2001, 15(1), 27–38.
10 J. Zhang, H. Wang, X. Yan and L. Zhang, Life Sci., 2005,76(10), 1099–1109.
11 H. Wang, J. Zhang and H. Yu, Free Radical Biol. Med., 2007,42(10), 1524–1533.
12 J. Zhang, X. Wang and T. Xu, Toxicol. Sci., 2008, 101(1),22–31.
13 X. Jia, N. Li and J. Chen, Life Sci., 2005, 76(17), 1989–2003.14 S. Sadeghian, G. Kojouri and A. Mohebbi, Biol. Trace Elem.
Res., 2012, 146(3), 302–308.15 L. Shi, W. Xun, W. Yue, C. Zhang, Y. Ren, L. Shi, Q. Wang,
R. Yang and F. Lei, Small Ruminant Res., 2011, 96(1),49–52.
16 K. C. Biswas, L. L. Barton, W. L. Tsui, K. Shuman, J. Gillespieand C. S. Eze, J. Microbiol. Methods, 2011, 86(2), 140–144.
17 E. Kapolna, P. R. Hillestrøm, K. H. Laursen, S. Husted andE. H. Larsen, Food Chem., 2009, 115(4), 1357–1363.
18 E. H. Larsen and S. Sturup, J. Anal. At. Spectrom., 1994, 9(10),1099–1105.
19 Handbook of Optical Constants of Solids, ed. E. D. Palik,Academic Press, Inc., 1991.
20 B. Gammelgaard, K. Jessen, F. Kristensen and O. Jøns, Anal.Chim. Acta, 2000, 404, 47–54.
21 B. Gammelgaard, L. Bendahl, N. W. Jacobsen and S. Sturup,J. Anal. At. Spectrom., 2005, 9, 889–893.
22 E. H. Larsen, J. Sloth, M. Hansen and S. Moesgaard, J. Anal.At. Spectrom., 2003, 18(4), 310–316.
23 J. J. Sloth, E. H. Larsen, S. H. Bugel and S. Moesgaard,J. Anal. At. Spectrom., 2003, 18(4), 317–322.
24 P. Rodrıguez-Gonzalez, A. Rodrıguez-Cea, J. I. Garcıa Alonsoand A. Sanz-Medel, Anal. Chem., 2005, 77(23), 7724–7734.
25 E. C. Pitzer and N. E. Gordon, Ind. Eng. Chem., Anal. Ed.,1938, 10, 0068–0069.
26 Y. Rodriguez-Lazcano, Y. Pena, M. T. S. Nair and P. K. Nair,Thin Solid Films, 2005, 493(1–2), 77–82.
27 C. Gabel-Jensen, B. Gammelgaard, L. Bendahl, S. Sturupand O. Jøns, Anal. Bioanal. Chem., 2006, 384(3), 697–702.
28 L. Margos and M. Webb, Crit. Rev. Toxicol., 1980, 8(1), 1–42.29 J. E. Spallholz, Free Radical Biol. Med., 1994, 17(1), 45–64.30 W. Krittaphol, A. McDowell, C. Thomson, M. Mikov and
J. P. Fawcett, Biol. Trace Elem. Res., 2011, 139(2), 188–196.31 K. T. Suzuki, J. Health Sci., 2005, 51, 107–114.32 B. Gammelgaard, M. I. Jackson and C. Gabel-Jensen, Anal.
Bioanal. Chem., 2011, 399(5), 1743–1763.33 K. T. Suzuki, K. Kurasaki, N. Okazaki and Y. Ogra, Toxicol.
Appl. Pharmacol., 2005, 206, 1–8.34 R. S. Oremland, M. J. Herbel, J. S. Blum, S. Langley,
T. J. Beveridge, P. M. Ajayan, T. Sutto, A. V. Ellis andS. Curran, Appl. Environ. Microbiol., 2004, 70(1), 52–60.
35 C. H. Hu, Y. L. Li, L. Xiong, H. M. Zhang, J. Song andM. S. Xia, Anim. Feed Sci. Technol., 2012, 177, 204–210.
Paper Metallomics
Publ
ishe
d on
17
Dec
embe
r 20
13. D
ownl
oade
d by
DT
U L
ibra
ry o
n 26
/03/
2014
12:
21:3
3.
View Article Online