absorçãoatomicaftheory chama
TRANSCRIPT
8/12/2019 Absorçãoatomicaftheory Chama
http://slidepdf.com/reader/full/absorcaoatomicaftheory-chama 1/81
1
CHAPTER 1 BASIC PRINCIPLES
All atoms can absorb light at certain wavelengths corresponding to the energyrequirements of the particular atom. Sodium atoms, for example, absorb light very
strongly at 589.0 nm, because light at this wavelength has exactly the right energyto transform the sodium atom to another electronic state. This electronictransition is quite specific for sodium; atoms of any other element are different, sotheir energy requirements are different and they cannot absorb light at this
wavelength. If the sodium atom is in the `ground state' we say that when asodium atom absorbs light it is transformed into an excited state; it is still asodium atom, but it contains more energy. There are several possible excited
states for the sodium atom and each has a particular energy. Usually theseenergies are measured in relation to the ground state, and a particular excitedstate for sodium may be 2.2 eV (electron volts) above the ground state. This
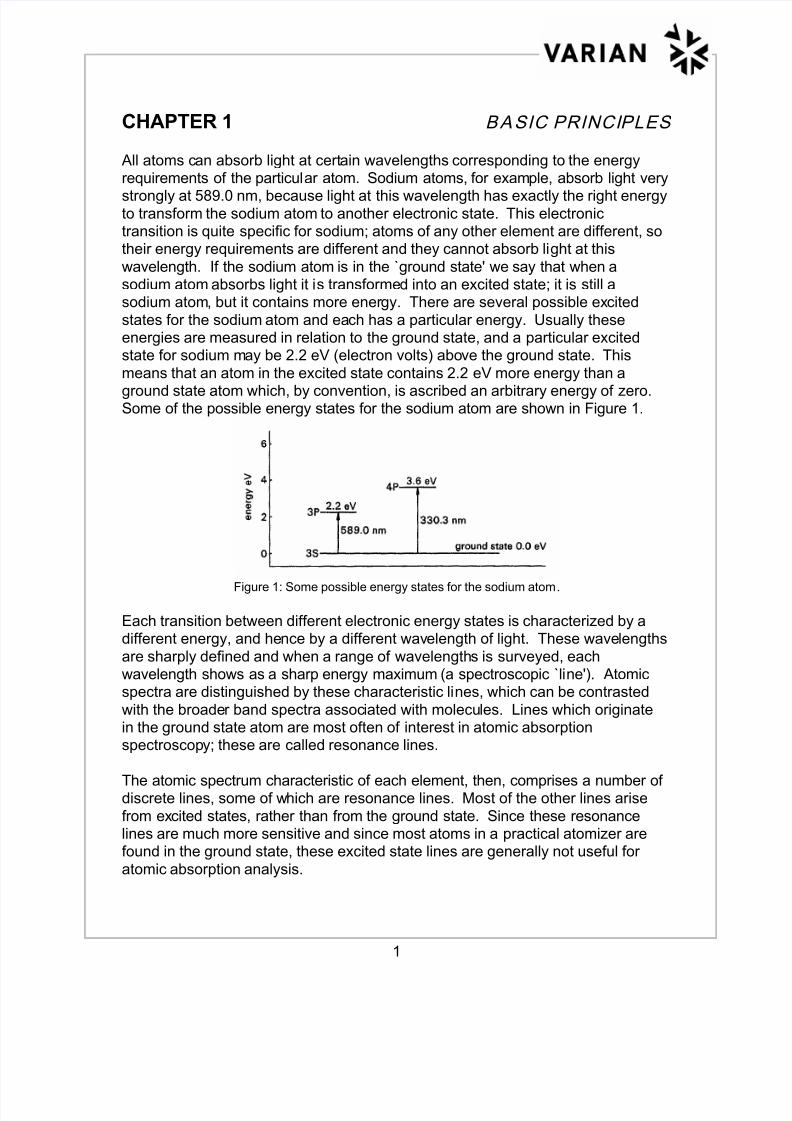
means that an atom in the excited state contains 2.2 eV more energy than aground state atom which, by convention, is ascribed an arbitrary energy of zero.Some of the possible energy states for the sodium atom are shown in Figure 1.
Figure 1: Some possible energy states for the sodium atom.
Each transition between different electronic energy states is characterized by adifferent energy, and hence by a different wavelength of light. These wavelengths
are sharply defined and when a range of wavelengths is surveyed, eachwavelength shows as a sharp energy maximum (a spectroscopic `line'). Atomicspectra are distinguished by these characteristic lines, which can be contrasted
with the broader band spectra associated with molecules. Lines which originatein the ground state atom are most often of interest in atomic absorptionspectroscopy; these are called resonance lines.
The atomic spectrum characteristic of each element, then, comprises a number ofdiscrete lines, some of which are resonance lines. Most of the other lines arise
from excited states, rather than from the ground state. Since these resonancelines are much more sensitive and since most atoms in a practical atomizer arefound in the ground state, these excited state lines are generally not useful for
atomic absorption analysis.

8/12/2019 Absorçãoatomicaftheory Chama
http://slidepdf.com/reader/full/absorcaoatomicaftheory-chama 2/81
2
The basic principles of atomic absorption spectroscopy can be expressed bythree simple statements:
1. All atoms can absorb light.
2. The wavelength at which light is absorbed is specific for a particularchemical element. If a sample containing nickel, for example, together withelements such as lead and copper is exposed to light at the characteristic
wavelength for nickel, then only the nickel atoms will absorb this light.
3. The amount of light absorbed is proportional to the concentration ofabsorbing atoms.
An atomic absorption spectrophotometer (Figure 2) is simply an instrument in
which these basic principles are applied to practical quantitative analysis. Theinstrument consists of:
Figure 2: Typical arrangement of atomic absorption spectrophotometer.
• A light source to generate light at the wavelength which is characteristic of the
analyte element.
• An atomizer to create a population of analyte atoms.
• A monochromator to separate light at the characteristic wavelength from all
other light.• An optical system to direct light from the source through the atom population
and into the monochromator.
• A light-sensitive detector.
• Suitable electronic devices which measure the response of the detector andtranslate this response into useful analytical measurements.
8/12/2019 Absorçãoatomicaftheory Chama
http://slidepdf.com/reader/full/absorcaoatomicaftheory-chama 3/81
3
At its most basic level, the general analytical procedure is straightforward:
• Convert the sample into solution.
• Make up a solution which contains no analyte element (the analytical blank).
• Make up a series of calibration solutions containing exactly known amounts ofanalyte element (the standards).
• Atomize the blank and standards in turn and measure the response for each
solution.
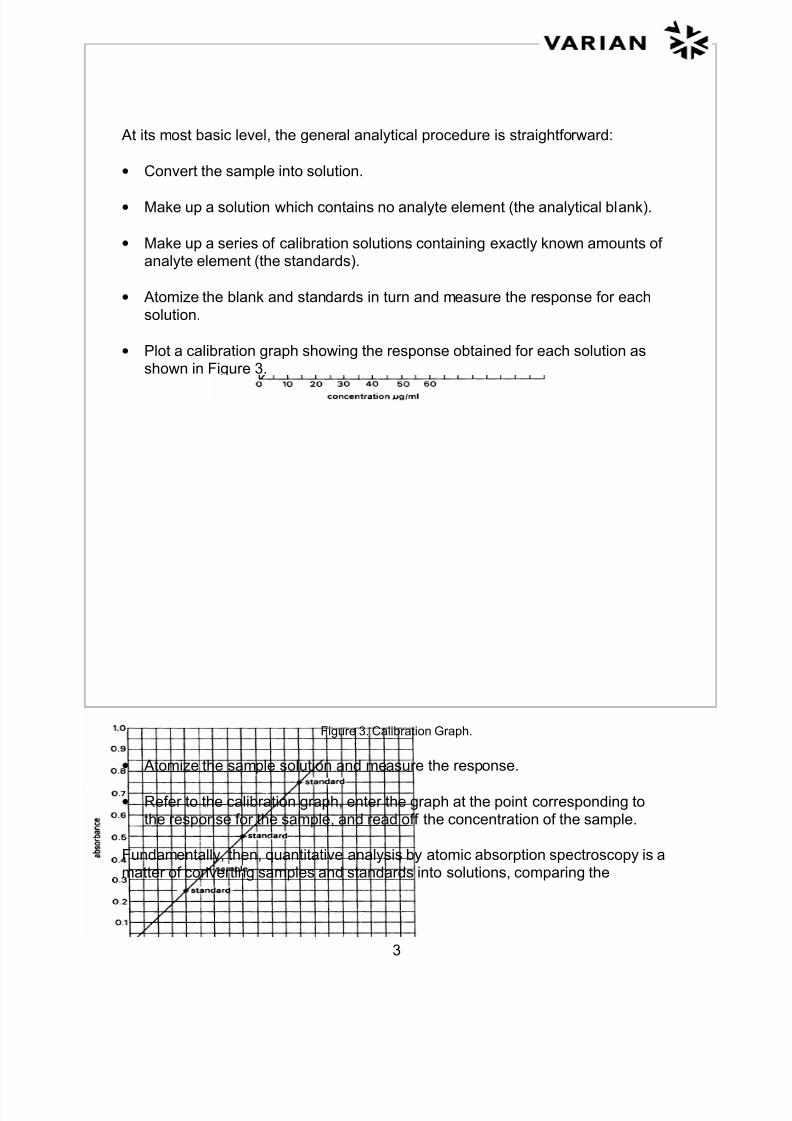
• Plot a calibration graph showing the response obtained for each solution asshown in Figure 3.
Figure 3. Calibration Graph.
• Atomize the sample solution and measure the response.
• Refer to the calibration graph, enter the graph at the point corresponding tothe response for the sample, and read off the concentration of the sample.
Fundamentally, then, quantitative analysis by atomic absorption spectroscopy is amatter of converting samples and standards into solutions, comparing the
8/12/2019 Absorçãoatomicaftheory Chama
http://slidepdf.com/reader/full/absorcaoatomicaftheory-chama 4/81
4
instrumental responses of standards and samples, and using these comparativeresponses to establish accurate concentration values for the element of interest.Basically this can be carried out using simple equipment and simple procedures.
Inevitably, however, there are aspects of the technique which are not quite as
simple and straightforward as this brief introduction suggests.
RELATIONSHIP BETWEEN LIGHT ABSORPTION AND ANALYTE
CONCENTRATION
The relation between light absorption and analyte concentration is defined in thefundamental laws of light absorption:
1. Lambert's law
The portion of light absorbed by a transparent medium is independent of theintensity of the incident light, and each successive unit thickness of the medium
absorbs an equal fraction of the light passing through it.
2. Beers law
Light absorption is proportional to the number of absorbing atoms in the sample.
The combined Beer-Lambert law may be expressed mathematically as:
It = Io(10)abc
Thus: log 10 I
I abc
o
t
= ....................(1)
where: Io = incident radiation power
It = transmitted radiation power
a = "absorption coefficient" (absorptivity)
b = length of absorption path
c = concentration of absorption atoms
that is, the absorbance is proportional to the concentration of the element for agiven absorption path length at any given wavelength.

8/12/2019 Absorçãoatomicaftheory Chama
http://slidepdf.com/reader/full/absorcaoatomicaftheory-chama 5/81
5
Thus, if a sample of concentration c results in a certain measured absorbance,another sample of concentration 2c will, according to the Beer-Lambert law, resultin twice this absorbance. The `absorbance' is a measure of the amount of light
absorbed by the atoms under given conditions, and this is the measurement of
interest; the Beer-Lambert law allows us to relate the measured absorbance to theconcentration of the analyte element in the sample.
In principle, it might be possible to calculate the concentration directly fromequation (1). In practice, however, the quantities a and b in equation (1) are
constants and are not normally determined. The simplest way to use atomicabsorption methods is to measure the absorbance for standard solutions where
the concentration is known, and then to compare these results with theabsorbance obtained for the unknown sample. Since the measured absorbancedepends directly on the concentration of the analyte element, this procedure gives
a simple and accurate method for determining the unknown concentration while
compensating for instrumental effects which make the theoretical calculation veryuncertain.
Conventionally, the calibration and comparison with standard may be donegraphically. A calibration curve is prepared for each situation, relating the element
concentration to the measured absorbance. Under the Beer Lambert law, thisgraph will be linear and the concentration of the unknown samples may bedetermined simply by interpolation on the graph (refer to Figure 3).
But, several factors relating to spectral effects and instrumental design cancombine to cause deviations from complete linearity, especially at higher
absorbances.

8/12/2019 Absorçãoatomicaftheory Chama
http://slidepdf.com/reader/full/absorcaoatomicaftheory-chama 6/81
6
Left Blank Intentionally
8/12/2019 Absorçãoatomicaftheory Chama
http://slidepdf.com/reader/full/absorcaoatomicaftheory-chama 7/81
7
CHAPTER 2 ATOMIC ABSORPTION HARDWARE
1. LIGHT SOURCES
a) General What are `continuum sources' and `line sources'? The most familiarcontinuum source is the domestic incandescent bulb. This type of sourceemits light over a wide wavelength range starting at about 300 nm and
extending far into the infra-red. Its spectral output characteristics areshown in Figure 4.
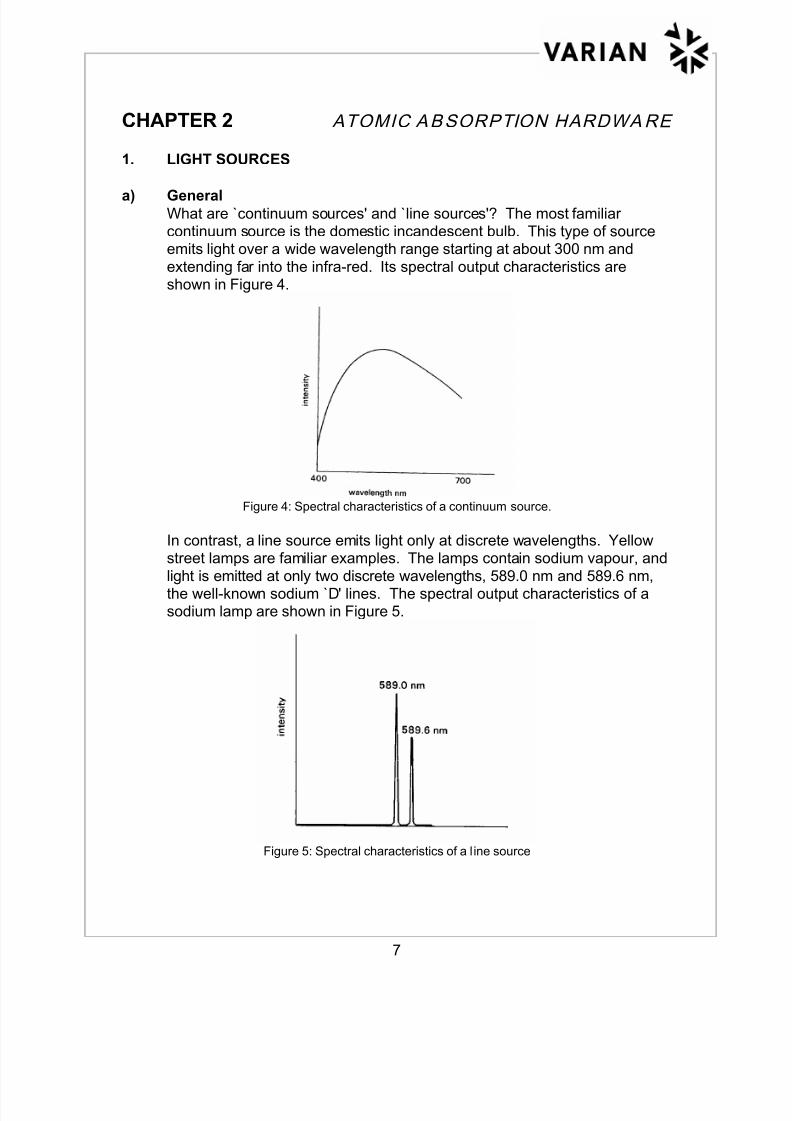
Figure 4: Spectral characteristics of a continuum source.
In contrast, a line source emits light only at discrete wavelengths. Yellowstreet lamps are familiar examples. The lamps contain sodium vapour, and
light is emitted at only two discrete wavelengths, 589.0 nm and 589.6 nm,the well-known sodium `D' lines. The spectral output characteristics of asodium lamp are shown in Figure 5.
Figure 5: Spectral characteristics of a l ine source
8/12/2019 Absorçãoatomicaftheory Chama
http://slidepdf.com/reader/full/absorcaoatomicaftheory-chama 8/81
8
For practical atomic absorption instruments, the light source is required toemit light which is at precisely the same wavelength as that at which atomicabsorption occurs for the element of interest.
Conveniently, this can be done by using a light source which emits thesame atomic spectrum, since the atomic emission and absorption
wavelengths are identical. In most atomic absorption instruments, the lightsource used is the hollow cathode lamp.
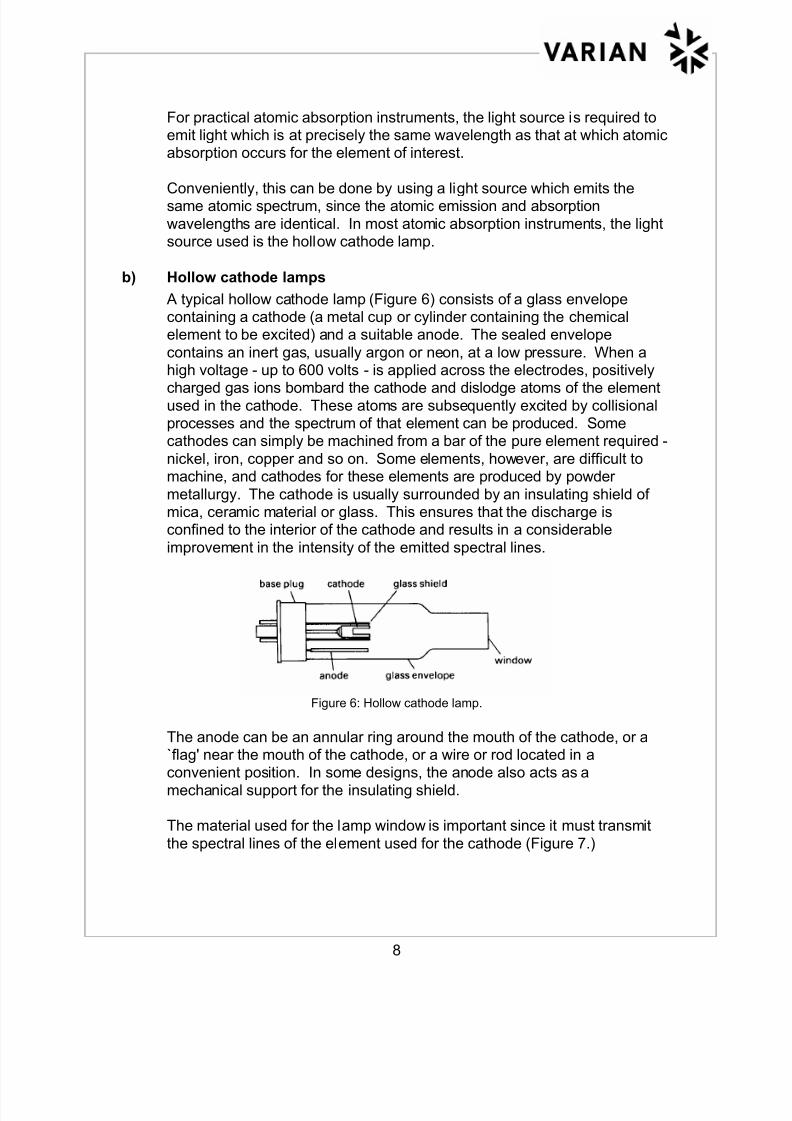
b) Hollow cathode lamps
A typical hollow cathode lamp (Figure 6) consists of a glass envelopecontaining a cathode (a metal cup or cylinder containing the chemicalelement to be excited) and a suitable anode. The sealed envelope
contains an inert gas, usually argon or neon, at a low pressure. When ahigh voltage - up to 600 volts - is applied across the electrodes, positively
charged gas ions bombard the cathode and dislodge atoms of the elementused in the cathode. These atoms are subsequently excited by collisionalprocesses and the spectrum of that element can be produced. Somecathodes can simply be machined from a bar of the pure element required -
nickel, iron, copper and so on. Some elements, however, are difficult tomachine, and cathodes for these elements are produced by powder
metallurgy. The cathode is usually surrounded by an insulating shield ofmica, ceramic material or glass. This ensures that the discharge isconfined to the interior of the cathode and results in a considerable
improvement in the intensity of the emitted spectral lines.
Figure 6: Hollow cathode lamp.
The anode can be an annular ring around the mouth of the cathode, or a`flag' near the mouth of the cathode, or a wire or rod located in aconvenient position. In some designs, the anode also acts as a
mechanical support for the insulating shield.
The material used for the lamp window is important since it must transmit
the spectral lines of the element used for the cathode (Figure 7.)

8/12/2019 Absorçãoatomicaftheory Chama
http://slidepdf.com/reader/full/absorcaoatomicaftheory-chama 9/81
9
Figure 7. Transmittance characteristics of quartz and Pyrex.
The fill gas is usually argon or neon at a pressure of 10 to 15 torr - about
1/50th of atmospheric pressure. Neon is preferred because it produces ahigher signal intensity than argon, but where a neon line occurs in close
proximity to the element's resonance line, argon is used instead.
Hollow cathode lamps are not, of course, the only light source capable of
producing the line spectra of chemical elements, but they are the mostuniversally accepted source for atomic absorption instruments.
OPERATING CONDITIONS
For practical operation, it is essential that the hollow cathode lamp is correctlyaligned in the optical path. This is, however, a simple matter of mechanically
aligning the lamp by means of one or two screws to obtain the maximum signal.Once the lamp is correctly aligned, the operating current is then the only lampparameter requiring any attention. Manufacturers generally recommend a
suitable operating current. This is seldom highly critical, and small departuresfrom it will not affect analytical sensitivity to any great extent.
Larger departures from the recommended current can be more serious. If thelamp current is too small, the analytical signal will require excessive amplification.This will almost always produce undesirably high noise.
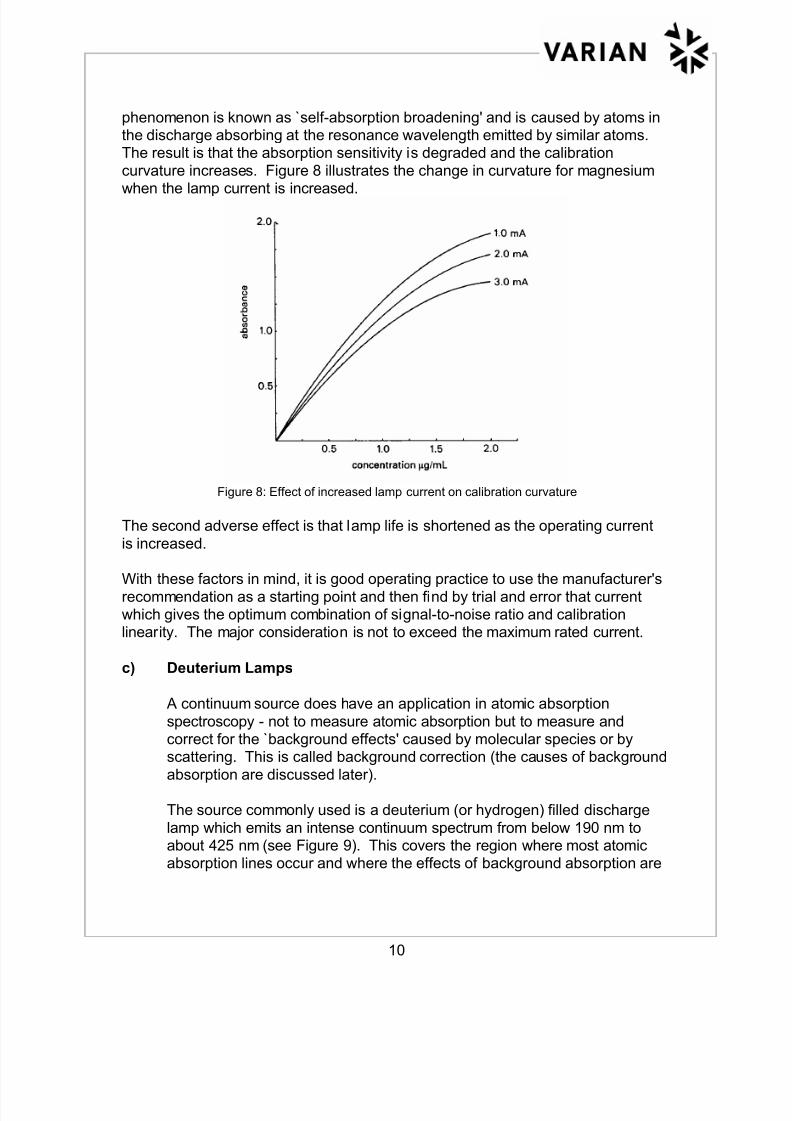
There are two adverse effects of operating a lamp at high current. The first ofthese is that the resonance line becomes broadened and distorted. This
8/12/2019 Absorçãoatomicaftheory Chama
http://slidepdf.com/reader/full/absorcaoatomicaftheory-chama 10/81
10
phenomenon is known as `self-absorption broadening' and is caused by atoms inthe discharge absorbing at the resonance wavelength emitted by similar atoms.The result is that the absorption sensitivity is degraded and the calibration
curvature increases. Figure 8 illustrates the change in curvature for magnesium
when the lamp current is increased.
Figure 8: Effect of increased lamp current on calibration curvature
The second adverse effect is that lamp life is shortened as the operating current
is increased.
With these factors in mind, it is good operating practice to use the manufacturer'srecommendation as a starting point and then find by trial and error that currentwhich gives the optimum combination of signal-to-noise ratio and calibrationlinearity. The major consideration is not to exceed the maximum rated current.
c) Deuterium Lamps
A continuum source does have an application in atomic absorption
spectroscopy - not to measure atomic absorption but to measure andcorrect for the `background effects' caused by molecular species or byscattering. This is called background correction (the causes of background
absorption are discussed later).
The source commonly used is a deuterium (or hydrogen) filled discharge
lamp which emits an intense continuum spectrum from below 190 nm toabout 425 nm (see Figure 9). This covers the region where most atomicabsorption lines occur and where the effects of background absorption are

8/12/2019 Absorçãoatomicaftheory Chama
http://slidepdf.com/reader/full/absorcaoatomicaftheory-chama 11/81
11
most pronounced. A polyatomic gas (H2 or D2) is used because acontinuum is produced rather than a line spectrum.
Figure 9: Spectral characteristics of deuterium lamp
The deuterium lamp is different to a hollow cathode lamp in construction andoperation. The lamp incorporates a heated, electron-emitting cathode, a metalanode and a restrictive aperture between the two (see Figure 10). A discharge
current of several hundred milliamperes excites the deuterium gas. Thedischarge is forced to pass through the small aperture, forming a defined areaof high excitation and hence high light emission. A quartz window transmits the
light to the spectrophotometer optical system.
The operating current for the deuterium lamp is usually automatically controlled
by the spectrophotometer - the operator simply switches the backgroundcorrector system on and ensures that the lamp is correctly aligned.
Figure 10: Deuterium lamp.
8/12/2019 Absorçãoatomicaftheory Chama
http://slidepdf.com/reader/full/absorcaoatomicaftheory-chama 12/81
12
2. MONOCHROMATORS
The function of the monochromator is to isolate a single atomic resonance linefrom the spectrum of lines emitted by the hollow cathode lamp. In effect, it is an
adjustable filter which selects a specific, narrow region of the spectrum fortransmission to the detector and rejects all wavelengths outside this region.Ideally, the monochromator should be capable of isolating the resonance line only
and excluding all other wavelengths. For some elements this is relatively easy,for others it is more difficult.
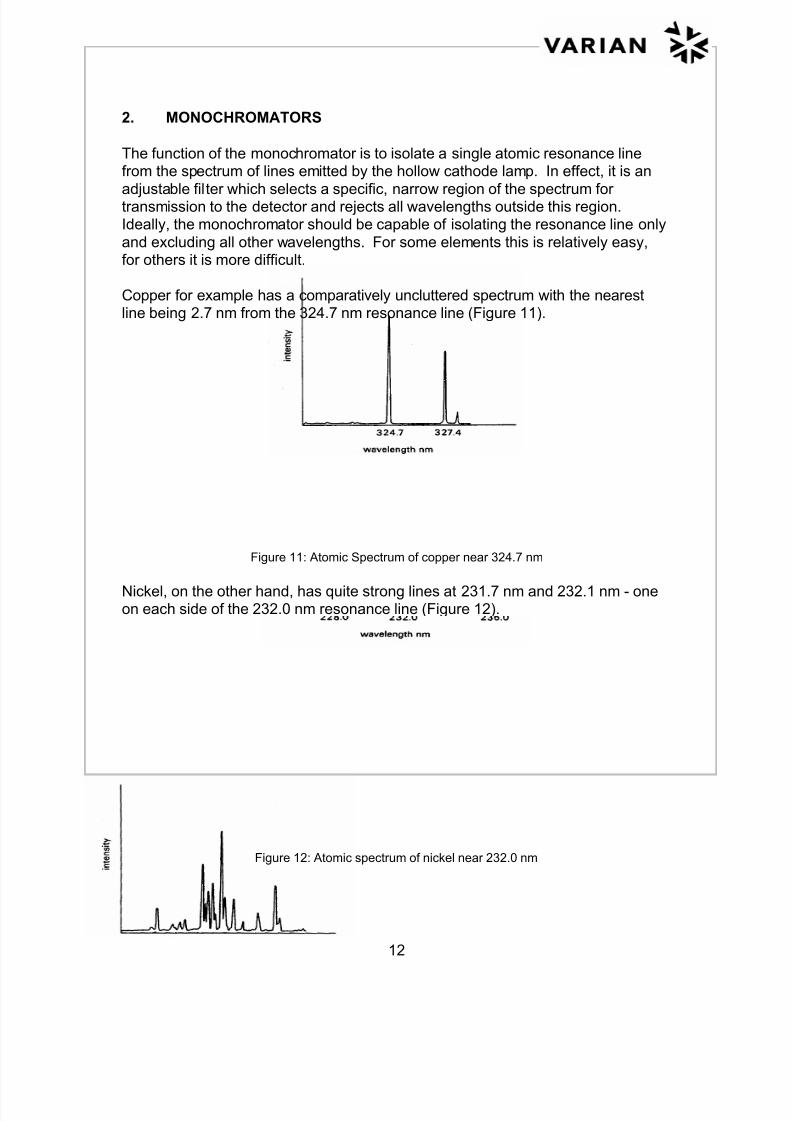
Copper for example has a comparatively uncluttered spectrum with the nearestline being 2.7 nm from the 324.7 nm resonance line (Figure 11).
Figure 11: Atomic Spectrum of copper near 324.7 nm
Nickel, on the other hand, has quite strong lines at 231.7 nm and 232.1 nm - oneon each side of the 232.0 nm resonance line (Figure 12).
Figure 12: Atomic spectrum of nickel near 232.0 nm
8/12/2019 Absorçãoatomicaftheory Chama
http://slidepdf.com/reader/full/absorcaoatomicaftheory-chama 13/81
13
The ability to discriminate between different wavelengths (usually referred to asresolution) is thus a very important characteristic of the monochromator.Extremely sophisticated monochromators are available which can isolate
wavelength regions as small as 0.01 nm and less; however, for atomic absorption
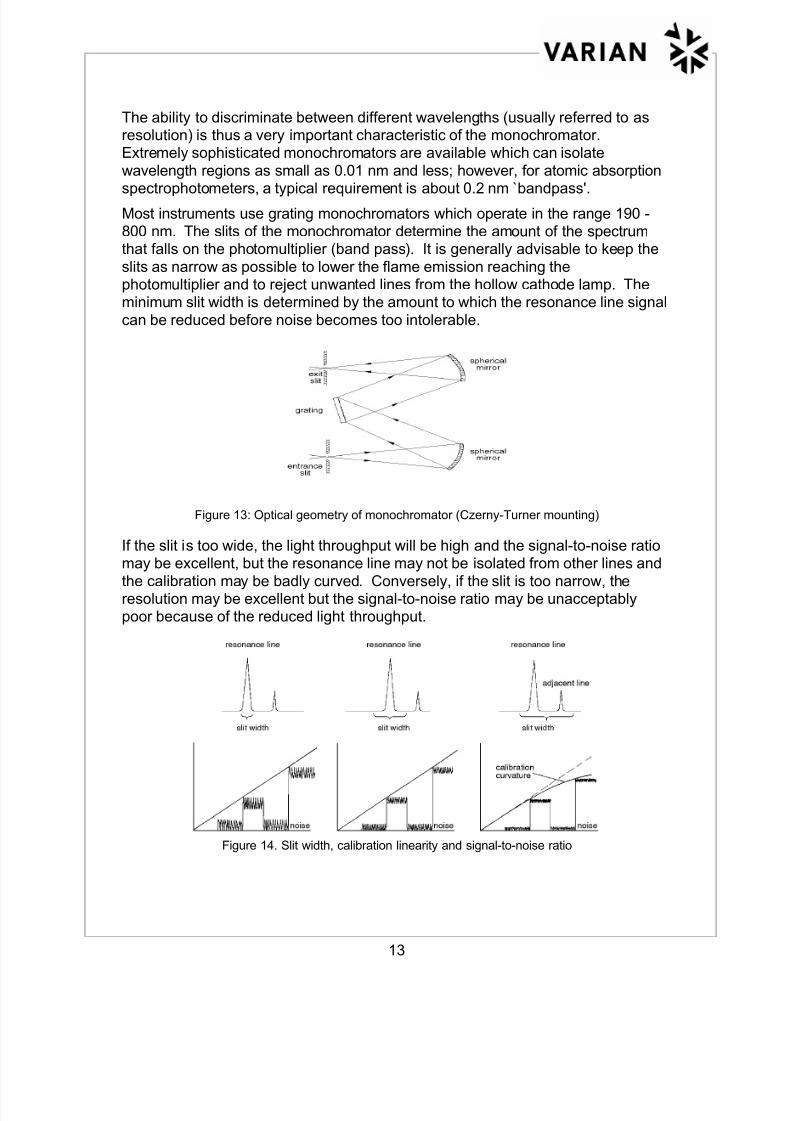
spectrophotometers, a typical requirement is about 0.2 nm ̀ bandpass'.Most instruments use grating monochromators which operate in the range 190 -800 nm. The slits of the monochromator determine the amount of the spectrumthat falls on the photomultiplier (band pass). It is generally advisable to keep the
slits as narrow as possible to lower the flame emission reaching thephotomultiplier and to reject unwanted lines from the hollow cathode lamp. Theminimum slit width is determined by the amount to which the resonance line signal
can be reduced before noise becomes too intolerable.
Figure 13: Optical geometry of monochromator (Czerny-Turner mounting)
If the slit is too wide, the light throughput will be high and the signal-to-noise ratiomay be excellent, but the resonance line may not be isolated from other lines and
the calibration may be badly curved. Conversely, if the slit is too narrow, theresolution may be excellent but the signal-to-noise ratio may be unacceptablypoor because of the reduced light throughput.
Figure 14. Slit width, calibration linearity and signal-to-noise ratio
8/12/2019 Absorçãoatomicaftheory Chama
http://slidepdf.com/reader/full/absorcaoatomicaftheory-chama 14/81
14
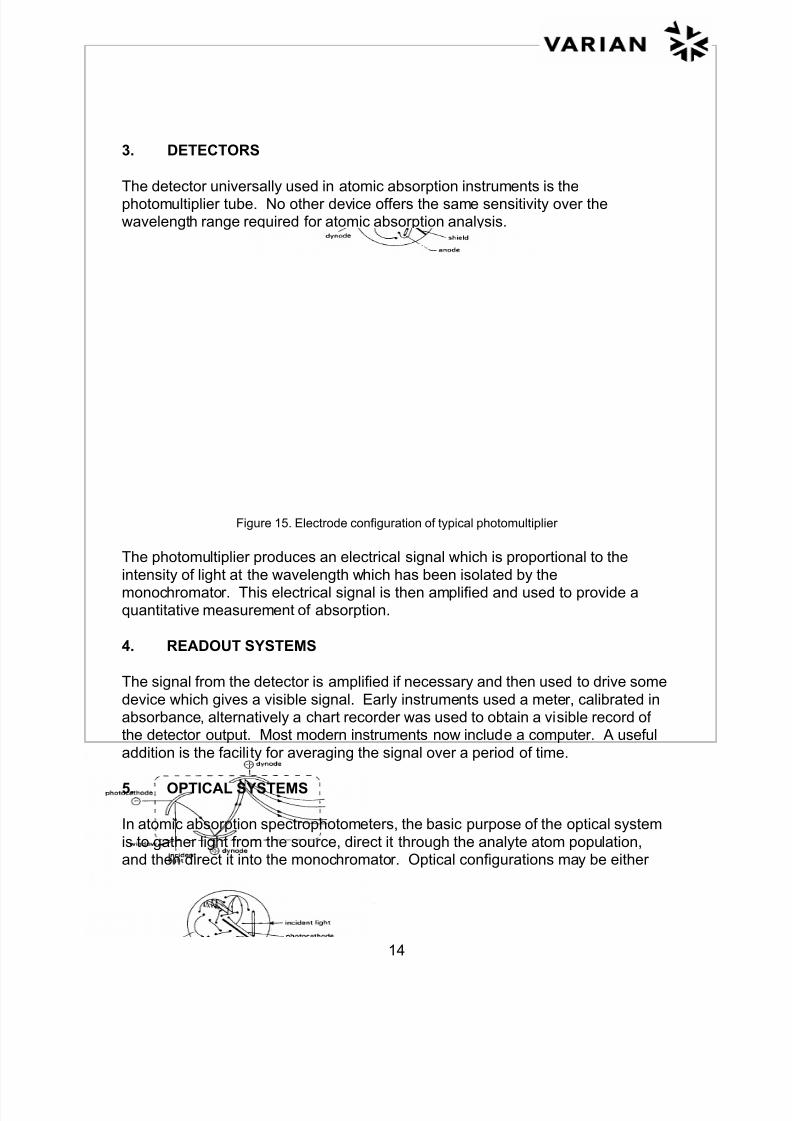
3. DETECTORS
The detector universally used in atomic absorption instruments is thephotomultiplier tube. No other device offers the same sensitivity over thewavelength range required for atomic absorption analysis.
Figure 15. Electrode configuration of typical photomultiplier
The photomultiplier produces an electrical signal which is proportional to the
intensity of light at the wavelength which has been isolated by themonochromator. This electrical signal is then amplified and used to provide aquantitative measurement of absorption.
4. READOUT SYSTEMS
The signal from the detector is amplified if necessary and then used to drive some
device which gives a visible signal. Early instruments used a meter, calibrated inabsorbance, alternatively a chart recorder was used to obtain a visible record ofthe detector output. Most modern instruments now include a computer. A useful
addition is the facility for averaging the signal over a period of time.
5. OPTICAL SYSTEMS
In atomic absorption spectrophotometers, the basic purpose of the optical system
is to gather light from the source, direct it through the analyte atom population,and then direct it into the monochromator. Optical configurations may be either
8/12/2019 Absorçãoatomicaftheory Chama
http://slidepdf.com/reader/full/absorcaoatomicaftheory-chama 15/81
15
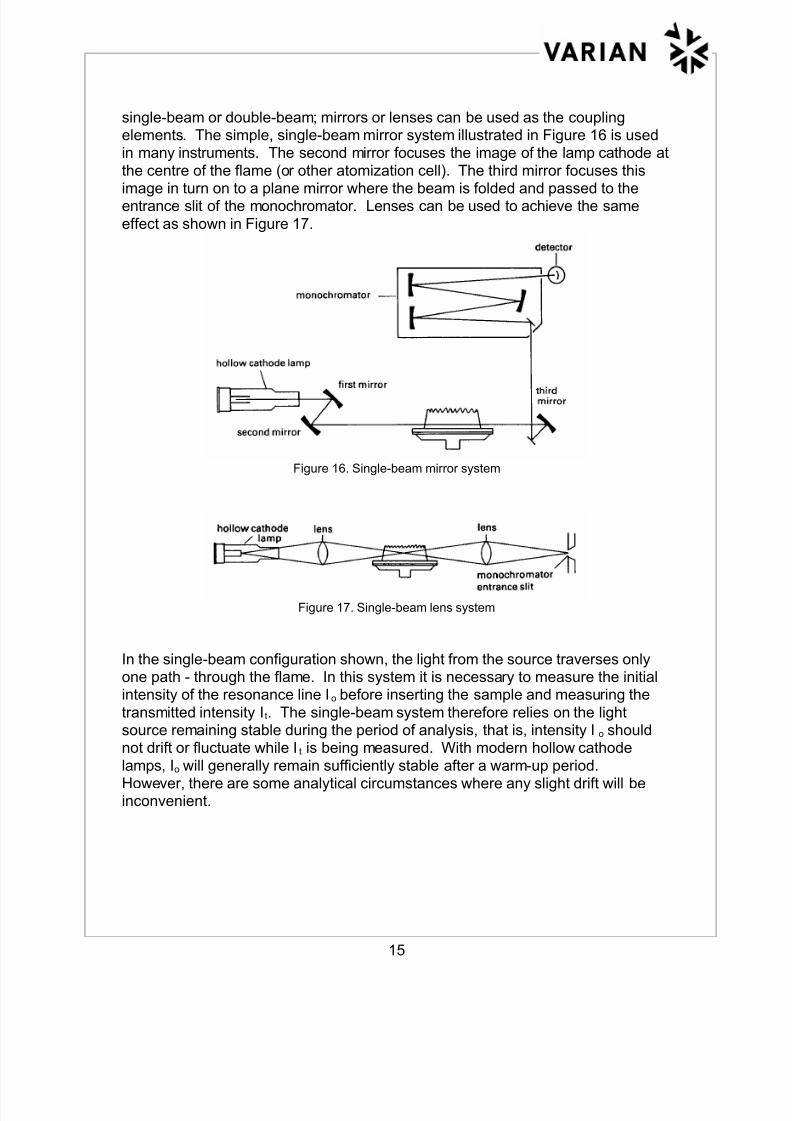
single-beam or double-beam; mirrors or lenses can be used as the couplingelements. The simple, single-beam mirror system illustrated in Figure 16 is usedin many instruments. The second mirror focuses the image of the lamp cathode at
the centre of the flame (or other atomization cell). The third mirror focuses this
image in turn on to a plane mirror where the beam is folded and passed to theentrance slit of the monochromator. Lenses can be used to achieve the same
effect as shown in Figure 17.
Figure 16. Single-beam mirror system
Figure 17. Single-beam lens system
In the single-beam configuration shown, the light from the source traverses onlyone path - through the flame. In this system it is necessary to measure the initialintensity of the resonance line Io before inserting the sample and measuring the
transmitted intensity It. The single-beam system therefore relies on the lightsource remaining stable during the period of analysis, that is, intensity Io shouldnot drift or fluctuate while It is being measured. With modern hollow cathode
lamps, Io will generally remain sufficiently stable after a warm-up period.However, there are some analytical circumstances where any slight drift will beinconvenient.
8/12/2019 Absorçãoatomicaftheory Chama
http://slidepdf.com/reader/full/absorcaoatomicaftheory-chama 16/81
16
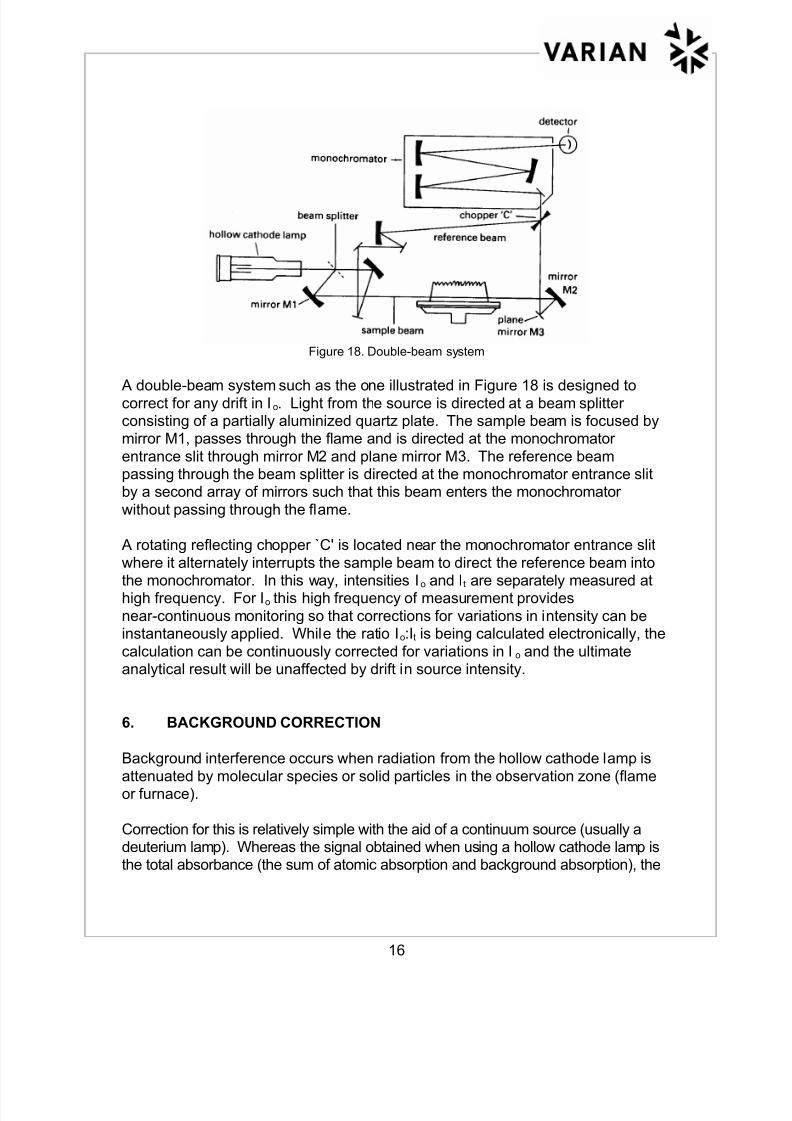
Figure 18. Double-beam system
A double-beam system such as the one illustrated in Figure 18 is designed tocorrect for any drift in Io. Light from the source is directed at a beam splitterconsisting of a partially aluminized quartz plate. The sample beam is focused bymirror M1, passes through the flame and is directed at the monochromator
entrance slit through mirror M2 and plane mirror M3. The reference beampassing through the beam splitter is directed at the monochromator entrance slitby a second array of mirrors such that this beam enters the monochromator
without passing through the flame.
A rotating reflecting chopper `C' is located near the monochromator entrance slit
where it alternately interrupts the sample beam to direct the reference beam intothe monochromator. In this way, intensities Io and It are separately measured athigh frequency. For Io this high frequency of measurement provides
near-continuous monitoring so that corrections for variations in intensity can beinstantaneously applied. While the ratio Io:It is being calculated electronically, the
calculation can be continuously corrected for variations in Io and the ultimateanalytical result will be unaffected by drift in source intensity.
6. BACKGROUND CORRECTION
Background interference occurs when radiation from the hollow cathode lamp isattenuated by molecular species or solid particles in the observation zone (flameor furnace).
Correction for this is relatively simple with the aid of a continuum source (usually adeuterium lamp). Whereas the signal obtained when using a hollow cathode lamp isthe total absorbance (the sum of atomic absorption and background absorption), the
8/12/2019 Absorçãoatomicaftheory Chama
http://slidepdf.com/reader/full/absorcaoatomicaftheory-chama 17/81
17
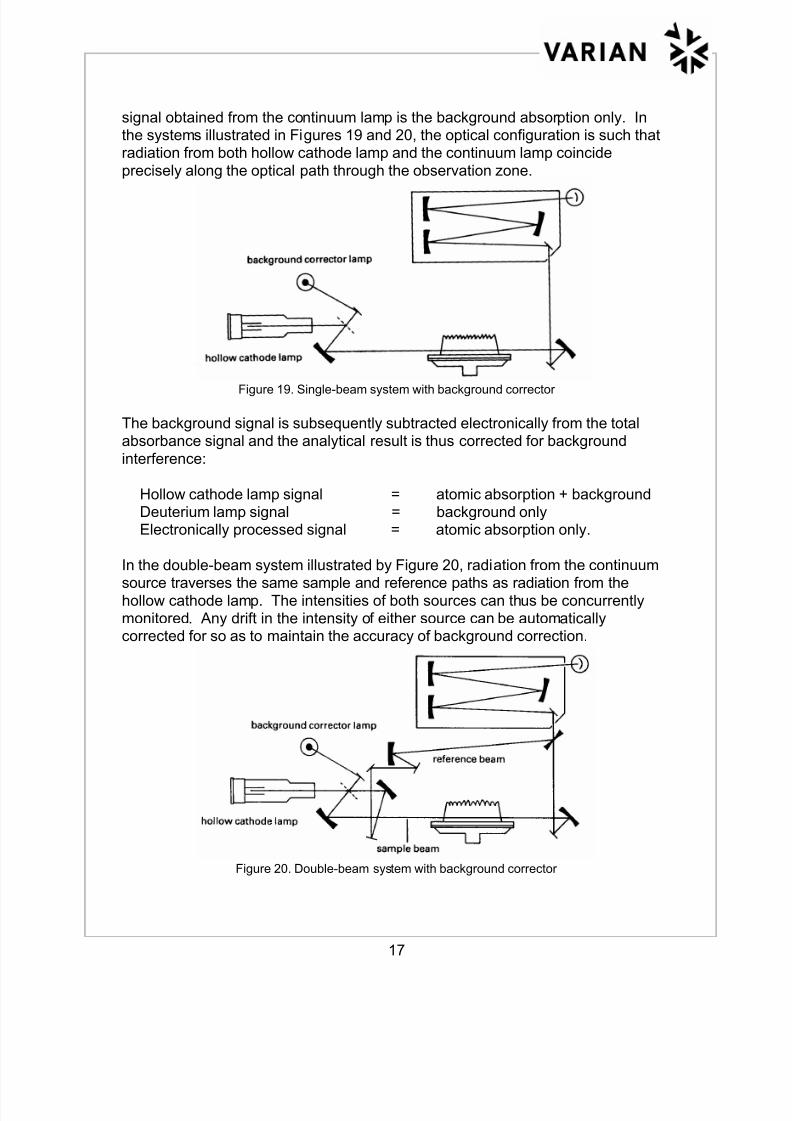
signal obtained from the continuum lamp is the background absorption only. Inthe systems illustrated in Figures 19 and 20, the optical configuration is such thatradiation from both hollow cathode lamp and the continuum lamp coincide
precisely along the optical path through the observation zone.
Figure 19. Single-beam system with background corrector
The background signal is subsequently subtracted electronically from the totalabsorbance signal and the analytical result is thus corrected for background
interference:
Hollow cathode lamp signal = atomic absorption + backgroundDeuterium lamp signal = background onlyElectronically processed signal = atomic absorption only.
In the double-beam system illustrated by Figure 20, radiation from the continuumsource traverses the same sample and reference paths as radiation from the
hollow cathode lamp. The intensities of both sources can thus be concurrentlymonitored. Any drift in the intensity of either source can be automaticallycorrected for so as to maintain the accuracy of background correction.
Figure 20. Double-beam system with background corrector

8/12/2019 Absorçãoatomicaftheory Chama
http://slidepdf.com/reader/full/absorcaoatomicaftheory-chama 18/81
18
Left Blank Intentionally
8/12/2019 Absorçãoatomicaftheory Chama
http://slidepdf.com/reader/full/absorcaoatomicaftheory-chama 19/81
19
CHAPTER 3 FLAME ATOMIZATION
GENERAL
It is worth stressing that successful atomic absorption analysis depends ongenerating a supply of uncombined analyte atoms in the ground state and
exposing this atom population to light at the characteristic absorption wavelength.
This process consists of taking a solution of the analyte and heating it to a
temperature that is sufficient to dissociate the compound. Traditionally, thethermal energy required has been supplied by a flame, although furnace
techniques are now widely used over a broad range of applications. But, theflame is still the most widely used dissociation agency, and a thorough grasp ofthe principles of flame atomization is fundamental to the understanding of atomic
absorption analysis.
1. THE BURNER-NEBULIZER SYSTEM
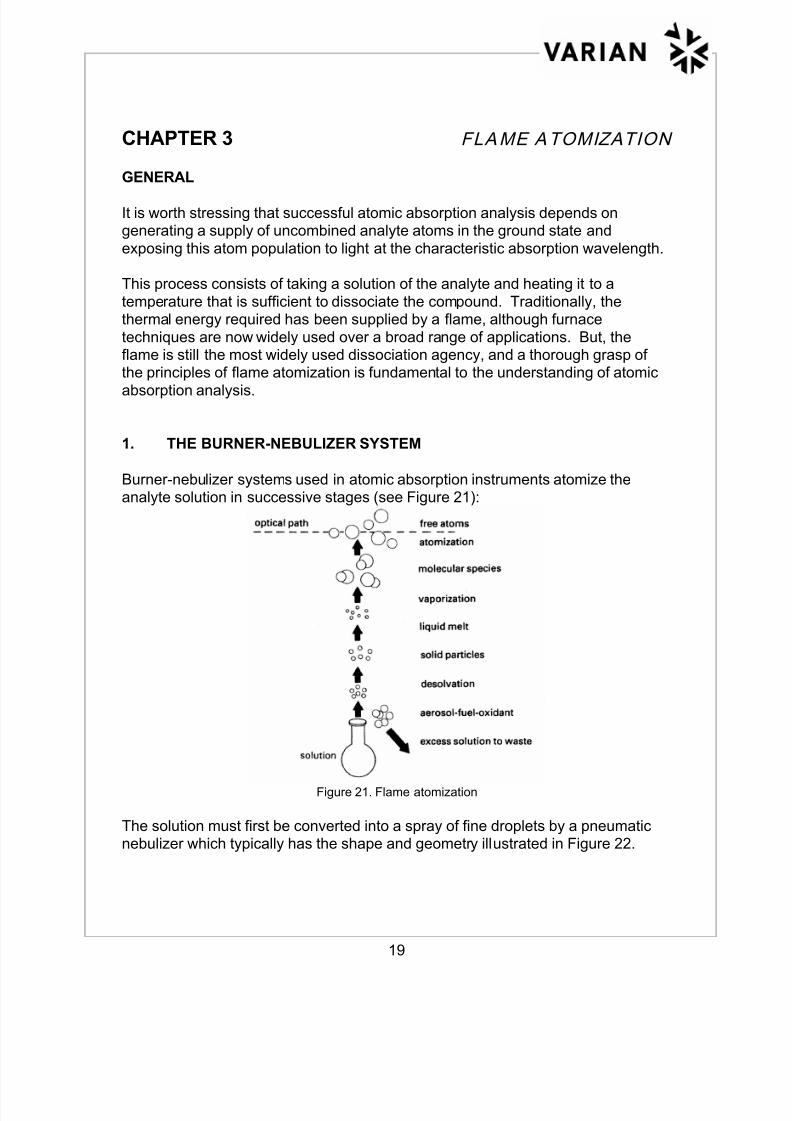
Burner-nebulizer systems used in atomic absorption instruments atomize theanalyte solution in successive stages (see Figure 21):
Figure 21. Flame atomization
The solution must first be converted into a spray of fine droplets by a pneumaticnebulizer which typically has the shape and geometry illustrated in Figure 22.
8/12/2019 Absorçãoatomicaftheory Chama
http://slidepdf.com/reader/full/absorcaoatomicaftheory-chama 20/81
20
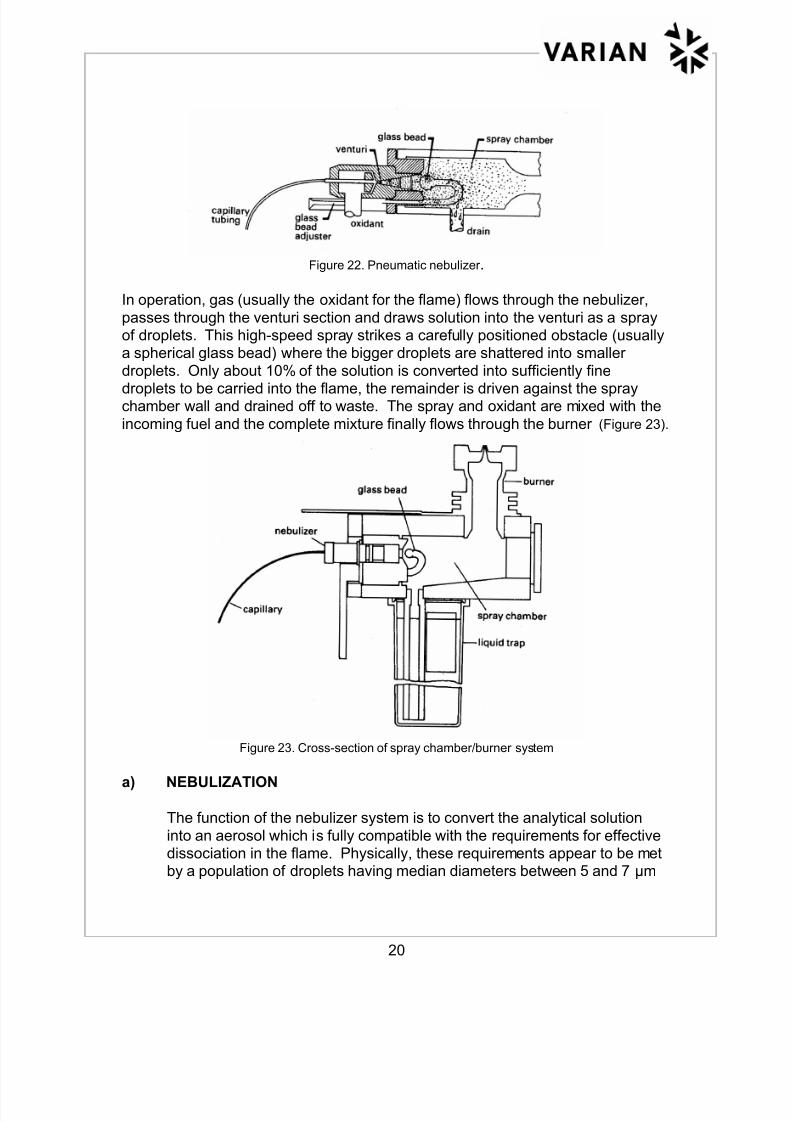
Figure 22. Pneumatic nebulizer .
In operation, gas (usually the oxidant for the flame) flows through the nebulizer,
passes through the venturi section and draws solution into the venturi as a sprayof droplets. This high-speed spray strikes a carefully positioned obstacle (usuallya spherical glass bead) where the bigger droplets are shattered into smaller
droplets. Only about 10% of the solution is converted into sufficiently finedroplets to be carried into the flame, the remainder is driven against the spraychamber wall and drained off to waste. The spray and oxidant are mixed with the
incoming fuel and the complete mixture finally flows through the burner (Figure 23).
Figure 23. Cross-section of spray chamber/burner system
a) NEBULIZATION
The function of the nebulizer system is to convert the analytical solution
into an aerosol which is fully compatible with the requirements for effectivedissociation in the flame. Physically, these requirements appear to be metby a population of droplets having median diameters between 5 and 7 µm
8/12/2019 Absorçãoatomicaftheory Chama
http://slidepdf.com/reader/full/absorcaoatomicaftheory-chama 21/81
21
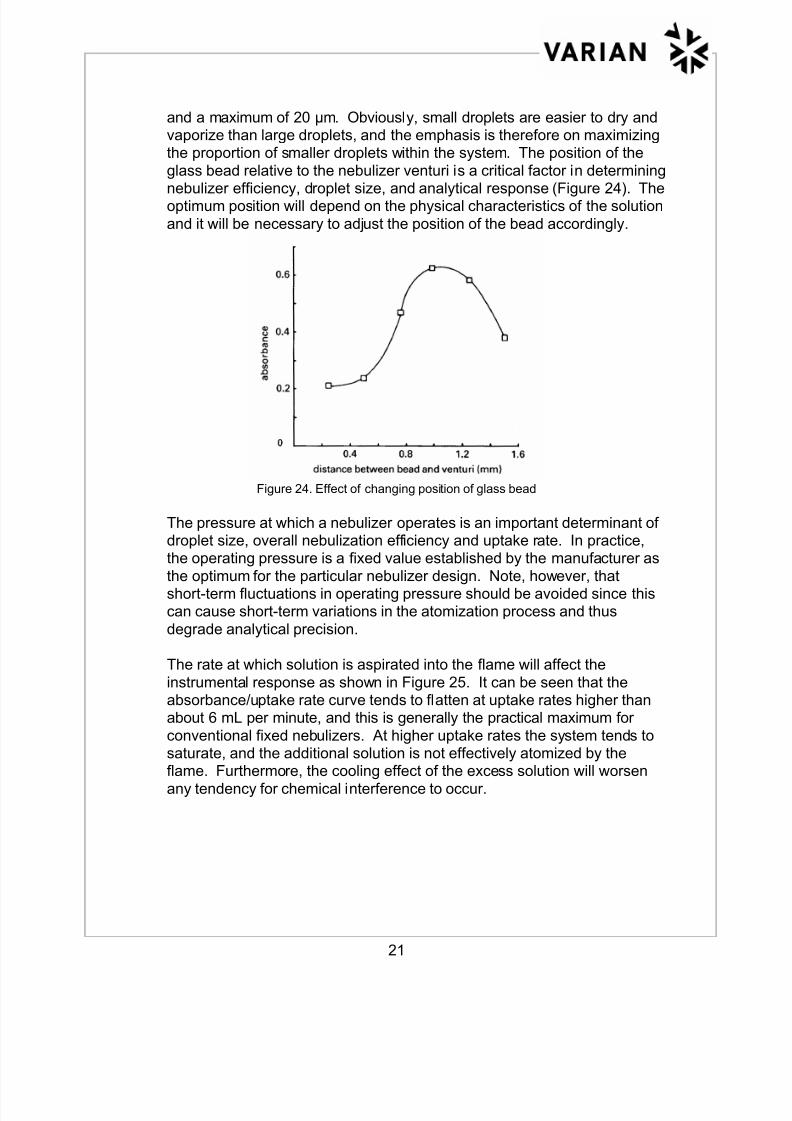
and a maximum of 20 µm. Obviously, small droplets are easier to dry andvaporize than large droplets, and the emphasis is therefore on maximizingthe proportion of smaller droplets within the system. The position of the
glass bead relative to the nebulizer venturi is a critical factor in determining
nebulizer efficiency, droplet size, and analytical response (Figure 24). Theoptimum position will depend on the physical characteristics of the solution
and it will be necessary to adjust the position of the bead accordingly.
Figure 24. Effect of changing position of glass bead
The pressure at which a nebulizer operates is an important determinant ofdroplet size, overall nebulization efficiency and uptake rate. In practice,the operating pressure is a fixed value established by the manufacturer as
the optimum for the particular nebulizer design. Note, however, thatshort-term fluctuations in operating pressure should be avoided since thiscan cause short-term variations in the atomization process and thus
degrade analytical precision.
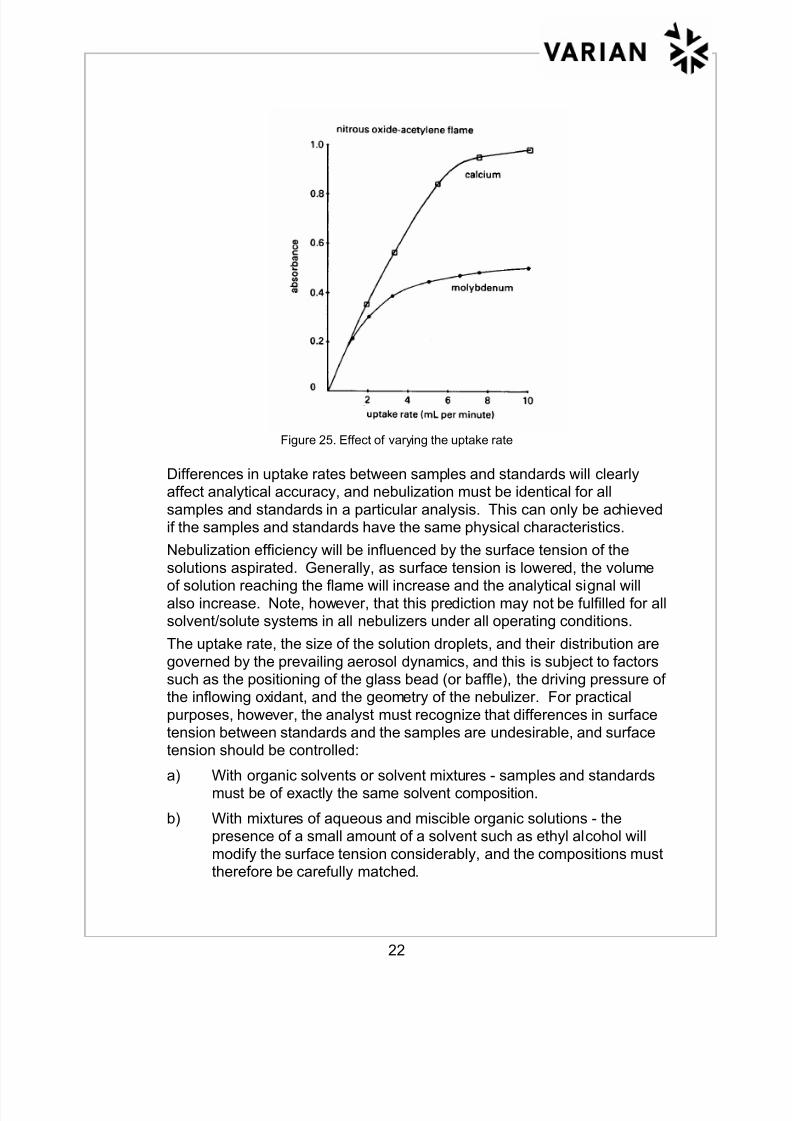
The rate at which solution is aspirated into the flame will affect the
instrumental response as shown in Figure 25. It can be seen that theabsorbance/uptake rate curve tends to flatten at uptake rates higher thanabout 6 mL per minute, and this is generally the practical maximum for
conventional fixed nebulizers. At higher uptake rates the system tends tosaturate, and the additional solution is not effectively atomized by the
flame. Furthermore, the cooling effect of the excess solution will worsenany tendency for chemical interference to occur.
8/12/2019 Absorçãoatomicaftheory Chama
http://slidepdf.com/reader/full/absorcaoatomicaftheory-chama 22/81
22
Figure 25. Effect of varying the uptake rate
Differences in uptake rates between samples and standards will clearlyaffect analytical accuracy, and nebulization must be identical for all
samples and standards in a particular analysis. This can only be achievedif the samples and standards have the same physical characteristics.
Nebulization efficiency will be influenced by the surface tension of the
solutions aspirated. Generally, as surface tension is lowered, the volumeof solution reaching the flame will increase and the analytical signal will
also increase. Note, however, that this prediction may not be fulfilled for allsolvent/solute systems in all nebulizers under all operating conditions.
The uptake rate, the size of the solution droplets, and their distribution are
governed by the prevailing aerosol dynamics, and this is subject to factorssuch as the positioning of the glass bead (or baffle), the driving pressure ofthe inflowing oxidant, and the geometry of the nebulizer. For practical
purposes, however, the analyst must recognize that differences in surfacetension between standards and the samples are undesirable, and surfacetension should be controlled:
a) With organic solvents or solvent mixtures - samples and standardsmust be of exactly the same solvent composition.
b) With mixtures of aqueous and miscible organic solutions - thepresence of a small amount of a solvent such as ethyl alcohol will
modify the surface tension considerably, and the compositions musttherefore be carefully matched.
8/12/2019 Absorçãoatomicaftheory Chama
http://slidepdf.com/reader/full/absorcaoatomicaftheory-chama 23/81
23
c) High salt concentrations will increase the surface tension of thesolution. The effect of nebulization is less severe than either (a) or
(b) but reasonable matching between samples and standards is
required.
2. FLAMES
Since the inception of atomic absorption flame spectroscopy, a variety of gas
mixtures have been used to produce the required flame. Many of the fuel/oxidantcombinations that were tried experimentally proved to be unsuitable in one way oranother for reasons of analytical usefulness, safety, cost or convenience. In
modern flame spectroscopy, air-acetylene and nitrous oxide-acetylene are almostuniversally used for practical analyses. Entrained air flames employing hydrogen
were quite widely used, mostly in association with vapour generation techniques,but modern vapour generation systems now rely on `absorption cells' heatedelectrically or by an air/acetylene flame. Air-hydrogen and nitrous oxide-hydrogenflames are still occasionally used for some applications, but modern practice
tends to favour their replacement with acetylene flames.
The air-acetylene flame is the most commonly used flame in practical atomic
absorption analysis. Operating temperature is about 2300°C.
The nitrous oxide-acetylene flame is considerably hotter and produces a
temperature of about 3000°C. It will atomize highly refractory compounds ofelements such as aluminium, silicon, vanadium and titanium as well as the rare
earth elements even though all these form highly refractory molecules in flames.
For each of these flames, the operating temperature and the intrinsic chemical
environment of the flame will depend on the fuel-oxidant ratio used. Theseconditions are characterized as:
(i) Fuel-lean or oxidizing. This is the hottest flame.
(ii) Fuel-rich or reducing. This is the coolest.
(iii) The stoichiometric, or chemically balanced flame. Temperature is
about the middle of the range; the fuel-oxidant ratio is abouthalf-way between fuel-lean and fuel-rich.
8/12/2019 Absorçãoatomicaftheory Chama
http://slidepdf.com/reader/full/absorcaoatomicaftheory-chama 24/81
24
3. FLAME REACTIONS
Although flame atomization systems have been in practical use for many years,molecular dissociation in flames has only been studied to a limited extent, and the
exact mechanisms of decomposition within the flame are not yet fully understood.In the simplest case, decomposition is most probably a direct progression fromanalyte compound through the monoxide to atomic constituents although, of
course, some monoxides are more refractory than others. Where the chemistryand thermodynamics are more complicated, decomposition is an indirect process,and a variety of intermediate compounds may be formed in the flame before the
analyte is finally released in atomic form. Some of these intermediate compoundsare formed by reactions with species such as C, C2, CH, CN and NH which areintrinsically present in chemical flames. Of these reactions, some promote
production of analyte atoms; other reactions result in the formation of refractorycompounds which inhibit the production of the analyte atoms. In some cases,
intermediate compounds may be formed by reactions between various speciespresent in the sample. Again, some of these reactions may be helpful inpromoting production of analyte atoms, others may inhibit the process.
From these general concepts it will be appreciated that it is difficult to predicttheoretically the decomposition chemistry for all elements under all analytical
circumstances. But, as a result of extensive practical experience, we can specifywhich flame should be used for particular elements and indicate general reasonsfor the use of different flames. For the purpose of this discussion it is convenient
to classify determinations into broad categories according to the relative difficultyof decomposition and the general nature and extent of the intermediate reactions
which interfere with the production of analyte atoms.
(a) The air-acetylene flame is almost universally used for those elementsclassified as easily atomized (copper, lead, potassium and sodium for
example).
In these simple decompositions, a high proportion of the available analyte
compound is readily converted to atoms in an air-acetylene flame (thecoolest flame in practical use). Interferences are negligible, and thechemical environment within the flame (oxidizing, stoichiometric or
reducing) is not a critical factor.
(b) It will be noted that several elements can be determined in either the
air-acetylene or nitrous oxide-acetylene flame. The monoxides of theseelements are more difficult to decompose than those in category (a). An
air-acetylene flame is useful for these elements, but is not fully effectiveacross the analytical range.
8/12/2019 Absorçãoatomicaftheory Chama
http://slidepdf.com/reader/full/absorcaoatomicaftheory-chama 25/81
25
If, for example, a solution of calcium nitrate is aspirated into an air--acetylene flame, the nitrate will decompose to the monoxide, but only a
limited proportion or the monoxide will be finally converted to atoms and
the analytical signal will be correspondingly small. In the hotter nitrousoxide-acetylene flame, however, a significantly higher proportion of
monoxide will be converted to atoms and a stronger analytical signal will beobtained.
While both flames can be used for determinations in this category,interferences in the air-acetylene flame can be severe, the chemical nature
of the flame is important, and it may be necessary to take the appropriatecounter measures described under category (e).
(c) Elements in this category invariably form compounds which are intrinsically
more refractory than those in category (b) and an air-acetylene flame willnot decompose them to any significant extent. All elements in this category
must be determined in the nitrous oxide-acetylene flame.
(d) Temperature is not always the main decomposition agency. Within each
flame type the chemical nature of the flame (oxidizing, stoichiometric orreducing) will also have a profound effect on the decomposition behaviourof many elements.
Consider the determination of molybdenum in an air-acetylene flame. If thefuel-to-oxidant ratio is such that the flame is chemically balanced
(stoichiometric), decomposition will proceed as far as the monoxide butvery little of the monoxide will be converted to atoms. If the flame is nowmade fuel-rich, it will be cooler than the stoichiometric flame, but it will be
strongly reducing and the monoxide will be reduced to molybdenum atoms.
Similarly, a stoichiometric nitrous oxide-acetylene flame produces a
relatively poor concentration of silicon atoms. On the other hand, a fuel-rich nitrous oxide-acetylene flame is considerably more effective.
For determinations in this category, therefore, generation of atoms is notmerely a straightforward matter of temperature, but requires an appropriate
combination of temperature and chemical environment within the flame.
(e) Determinations in this category are characterized by interferences
produced by reaction of the analyte element with other species in thesample.
8/12/2019 Absorçãoatomicaftheory Chama
http://slidepdf.com/reader/full/absorcaoatomicaftheory-chama 26/81
26
From the example of calcium nitrate in the air-acetylene flame it will beremembered that this flame can be used for practical analysis even thougha limited proportion of available monoxide is decomposed.
Suppose that the original calcium nitrate solution also contains a significantamount of the silicate of another element. In this circumstance, the
reaction in the flame will result in the formation of a calcium silicatecomplex. The concentration of free calcium atoms in the flame will now beconsiderably lower because the silicate complex is much more refractory
than the monoxide and the analytical response will be poor. Interferencesof this and kind are extremely severe for magnesium, calcium, strontium,
and barium because in the presence of aluminium, silicon andphosphorous, the formation of refractory aluminates, silicates andphosphates will seriously hinder the production of analyte atoms.
Three counter-measures are available:
(i) A nitrous oxide-acetylene flame will minimize or remove suchinterferences because the flame is hot enough to decompose thecompounds concerned.
(ii) A `buffer' element may be added to `compete' with the analyteelement for attachment to the interfering group, so that there will be
complete atomization even in lower temperature flames.
For instance, if a large excess of strontium is added to our original
calcium nitrate (+ silicate) solution, most of the silicate will attach tothe strontium (because of its greater concentration) so that the resultwill be a much greater concentration of free calcium atoms in the
flame. Such additives are often called `releasing agents'.
(iii) The standard solutions can be accurately matched to the samples
with respect to the interfering element. This is not of course alwayspossible as it demands a knowledge of sample composition which
may not be available.
If such precautions are not taken, it is obvious that seriously
incorrect results may be obtained. If, for example, a series ofcalcium standards were measured (with no silicate present) and acalibration constructed, then the measurement of unknown calcium
samples containing a reasonable concentration of silicate wouldyield very low results since the calcium atomic absorption reading inthe samples would be seriously depressed.
8/12/2019 Absorçãoatomicaftheory Chama
http://slidepdf.com/reader/full/absorcaoatomicaftheory-chama 27/81
27
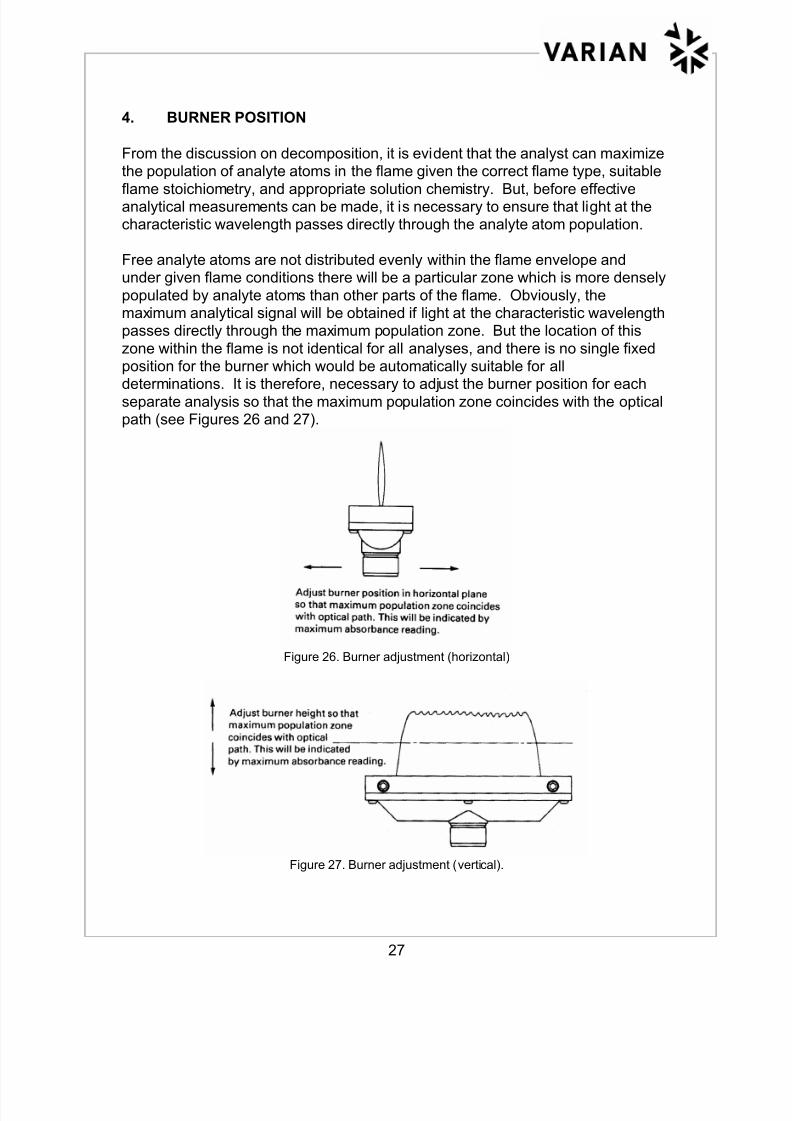
4. BURNER POSITION
From the discussion on decomposition, it is evident that the analyst can maximizethe population of analyte atoms in the flame given the correct flame type, suitable
flame stoichiometry, and appropriate solution chemistry. But, before effectiveanalytical measurements can be made, it is necessary to ensure that light at thecharacteristic wavelength passes directly through the analyte atom population.
Free analyte atoms are not distributed evenly within the flame envelope andunder given flame conditions there will be a particular zone which is more densely
populated by analyte atoms than other parts of the flame. Obviously, themaximum analytical signal will be obtained if light at the characteristic wavelengthpasses directly through the maximum population zone. But the location of this
zone within the flame is not identical for all analyses, and there is no single fixedposition for the burner which would be automatically suitable for all
determinations. It is therefore, necessary to adjust the burner position for eachseparate analysis so that the maximum population zone coincides with the opticalpath (see Figures 26 and 27).
Figure 26. Burner adjustment (horizontal)
Figure 27. Burner adjustment (vertical).

8/12/2019 Absorçãoatomicaftheory Chama
http://slidepdf.com/reader/full/absorcaoatomicaftheory-chama 28/81
28
All instruments incorporate simple controls which enable the analyst to move theburner to the position at which maximum absorbance is obtained. It is also
important to remember that altering the fuel-to oxidant ratio, or changing the total
gas flow without altering the stoichiometry can raise or lower the location of themaximum population zone within the flame.
Consequently, whenever flame conditions are changed, it is necessary tore-adjust the height of the burner until maximum absorbance is again obtained.
The burner can also be rotated so that the optical path passes obliquely through
the atom population. The effect of this is to shift the working concentration rangeupward.

8/12/2019 Absorçãoatomicaftheory Chama
http://slidepdf.com/reader/full/absorcaoatomicaftheory-chama 29/81
29
CHAPTER 4 OPERATION AND OPTIMIZATION
A. SPECTRAA SOFTWARE/OPERATION
1. Introduction
This short guide to operating the Varian SpectrAA Series instruments is meant toprovide the novice user with a short summary of the most essential steps in
getting started, developing an analytical method and running the SpectrAA. Thevery extensive “HELP” information in the operating software also provides useful
information to the user.
It is assumed that the SpectrAA has been installed and tested for correctoperation by a trained Varian Service Engineer, and that the user has been fully
made aware of all the safety aspects associated with the operation of theSpectrAA and has been given preliminary instruction in the basic operation ofthe instrument hardware and software.
It is also assumed that the user has some familiarity with Windows software andthe use of a “mouse”. “Left mouse button click” will be abbreviated to simple
“click” and, similarly, a “right mouse button click” to “right click”. A double mousebutton click will be indicated by “double click”. Double clicking a window in theInstrument page will blow it up, and double clicking the display again will restore
it. Ctrl, and double click will show all 4 displays. To select a button, click on it
with the mouse, or press the Tab key to move the focus to the button and press
Enter .
The “Help” function is accessed from any window, page, or dialog box in the
SpectrAA software by pressing F1 or the “Help” pushbutton by clicking on the “?”
and dragging this button to specific items in the software.
8/12/2019 Absorçãoatomicaftheory Chama
http://slidepdf.com/reader/full/absorcaoatomicaftheory-chama 30/81
30
2. Getting Started
1. Switch on SpectrAA Instrument Power (SPS-5 Sample Preparation System,
SIPS, if necessary)
2. Switch on PC, Monitor, & Printer
3. Turn on acetylene, air, & if necessary nitrous oxide gas supply
4. Switch on Laboratory Exhaust system
5. After Windows software is loaded, click on “SpectrAA Icon” to load the AAsoftware
6. (or click on “Start”, “Programs”, “SpectrAA”)
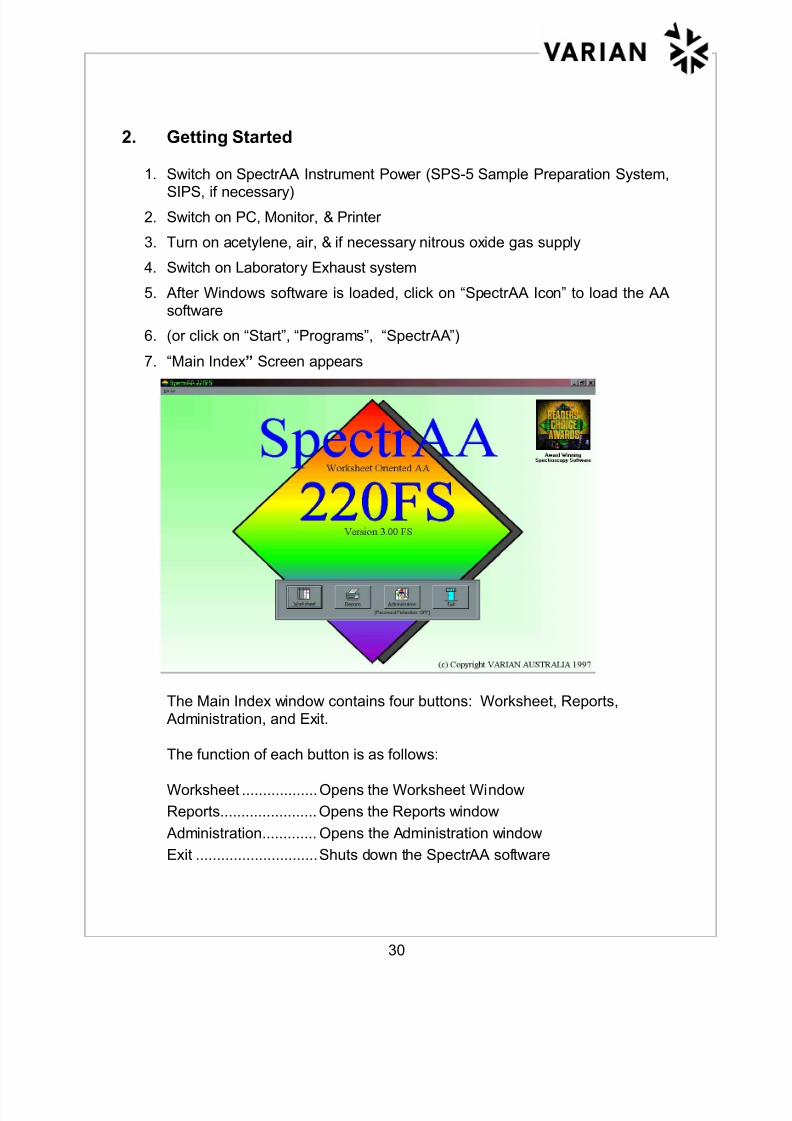
7. “Main Index” Screen appears
The Main Index window contains four buttons: Worksheet, Reports, Administration, and Exit.
The function of each button is as follows:
Worksheet ..................Opens the Worksheet Window
Reports.......................Opens the Reports window
Administration............. Opens the Administration window
Exit .............................Shuts down the SpectrAA software
8/12/2019 Absorçãoatomicaftheory Chama
http://slidepdf.com/reader/full/absorcaoatomicaftheory-chama 31/81
31
3. Developing a Method / Worksheet
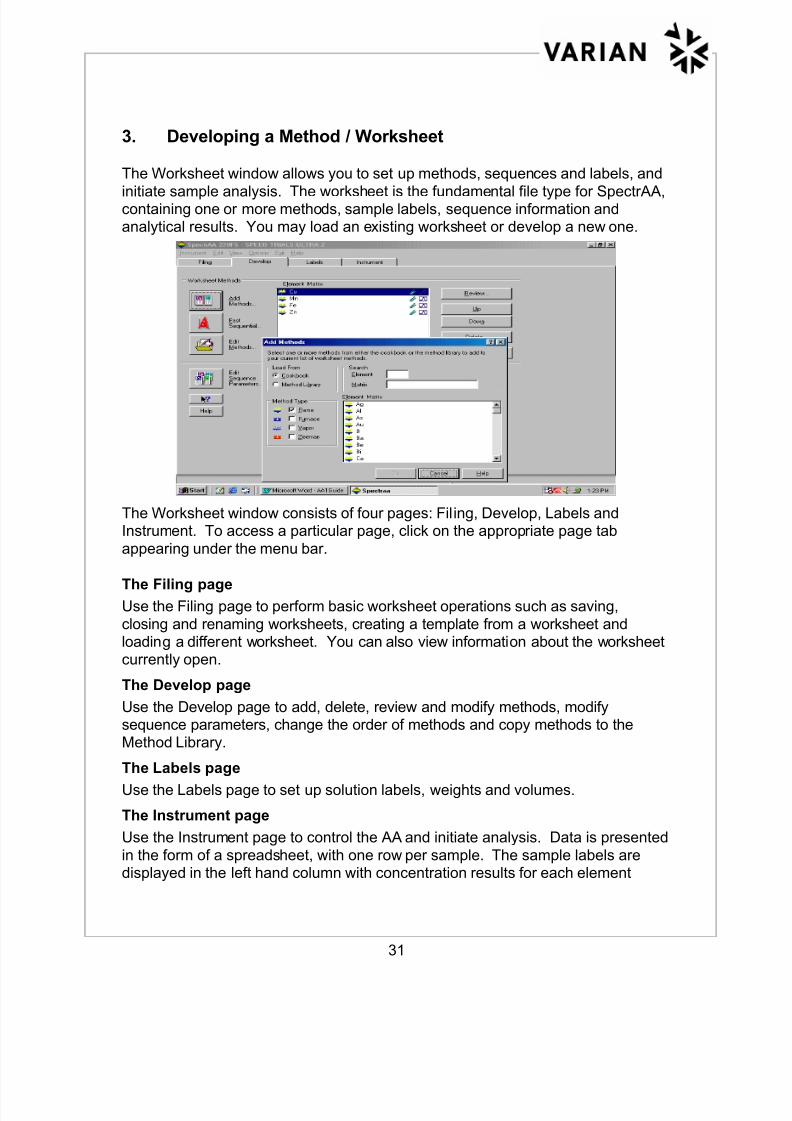
The Worksheet window allows you to set up methods, sequences and labels, and
initiate sample analysis. The worksheet is the fundamental file type for SpectrAA,containing one or more methods, sample labels, sequence information andanalytical results. You may load an existing worksheet or develop a new one.
The Worksheet window consists of four pages: Filing, Develop, Labels andInstrument. To access a particular page, click on the appropriate page tab
appearing under the menu bar.
The Filing page
Use the Filing page to perform basic worksheet operations such as saving,
closing and renaming worksheets, creating a template from a worksheet andloading a different worksheet. You can also view information about the worksheetcurrently open.
The Develop page
Use the Develop page to add, delete, review and modify methods, modifysequence parameters, change the order of methods and copy methods to theMethod Library.
The Labels page
Use the Labels page to set up solution labels, weights and volumes.
The Instrument page
Use the Instrument page to control the AA and initiate analysis. Data is presented
in the form of a spreadsheet, with one row per sample. The sample labels aredisplayed in the left hand column with concentration results for each element
8/12/2019 Absorçãoatomicaftheory Chama
http://slidepdf.com/reader/full/absorcaoatomicaftheory-chama 32/81
32
across the remaining columns.
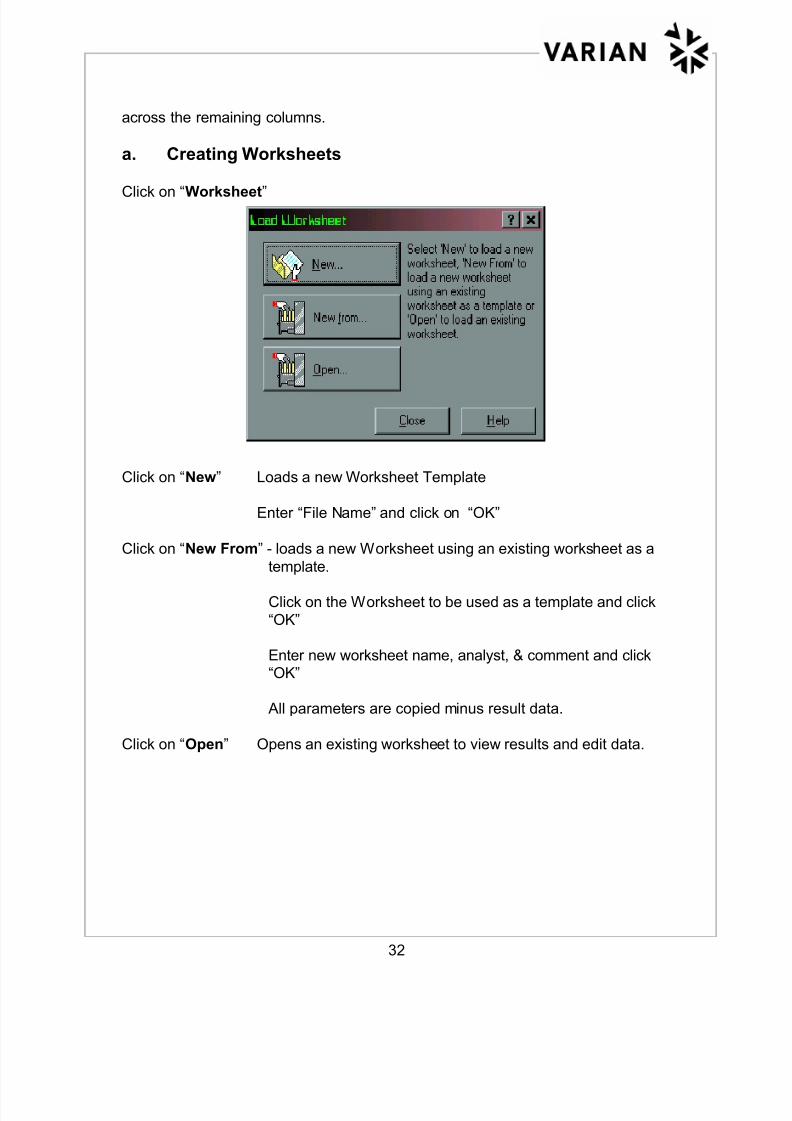
a. Creating Worksheets
Click on “Worksheet”
Click on “New” Loads a new Worksheet Template
Enter “File Name” and click on “OK”
Click on “New From” - loads a new Worksheet using an existing worksheet as a
template.
Click on the Worksheet to be used as a template and click
“OK”
Enter new worksheet name, analyst, & comment and click“OK”
All parameters are copied minus result data.
Click on “Open” Opens an existing worksheet to view results and edit data.

8/12/2019 Absorçãoatomicaftheory Chama
http://slidepdf.com/reader/full/absorcaoatomicaftheory-chama 33/81
33
Element Selection
Click on “Develop” tab to select elements
Click on “Add Methods” to enter each element
Element selection
The default is to Load From Cookbook methods from Varian’s Analytical Methods
or select Method Library to select methods previously developed (see #4 below to
store methods to Method Library).
Choose Method Type needed – check Flame, Furnace, Vapor, Zeeman and click
on elements to be analyzed in your method under Element Matrix and click on“OK”. Hold down the “ctrl” key and click on the elements to enter more than 1
element at a time and click on “OK”. Also, the chemical symbol or 1st letter of an
element can be entered under “Search”, choose the element under ElementMatrix and click and “OK”.
1) Review click on “Review” to look at the method parameters
set up for each element
2) Up and Down click on “Up” and “Down” to toggle between elements
3) Delete click on “Delete” to delete elements
4) Copy to Library click on “Copy to library” to copy worksheet methodto library– these methods are stored under “AddMethods” and can be added to worksheet under “Load
From” and click on “Method Library” to choose storedelement methods.
8/12/2019 Absorçãoatomicaftheory Chama
http://slidepdf.com/reader/full/absorcaoatomicaftheory-chama 34/81

8/12/2019 Absorçãoatomicaftheory Chama
http://slidepdf.com/reader/full/absorcaoatomicaftheory-chama 35/81
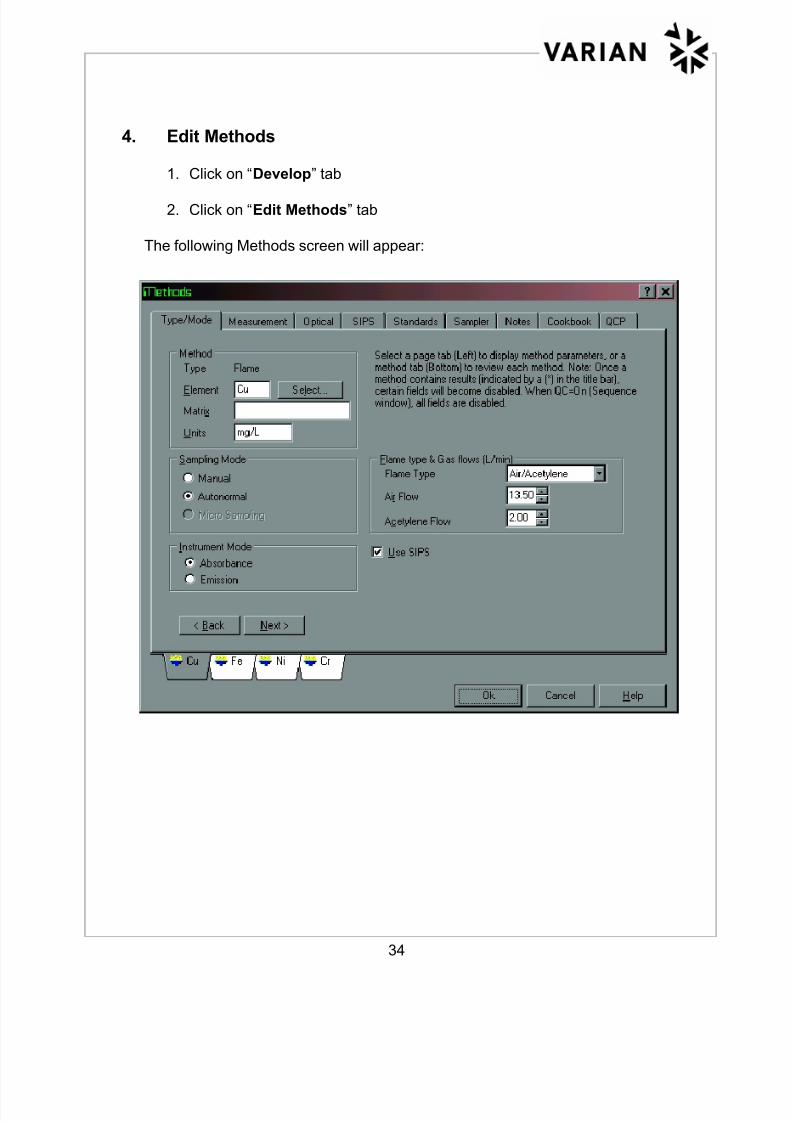
35
a) Typical General Settings - common settings for elements in a method.
General Settings
Click on “Develop”, “Edit Methods” and then the following tabs:
Type/Mode- Under Sampling Mode select manual or autonormal
(for autosampler)
Under Instrument Mode select absorbance or
emission mode
Flame type & Gas flows will default to Varian Cookbook Methods
√√√√ SIPS (when using SIPS)
8/12/2019 Absorçãoatomicaftheory Chama
http://slidepdf.com/reader/full/absorcaoatomicaftheory-chama 36/81
36
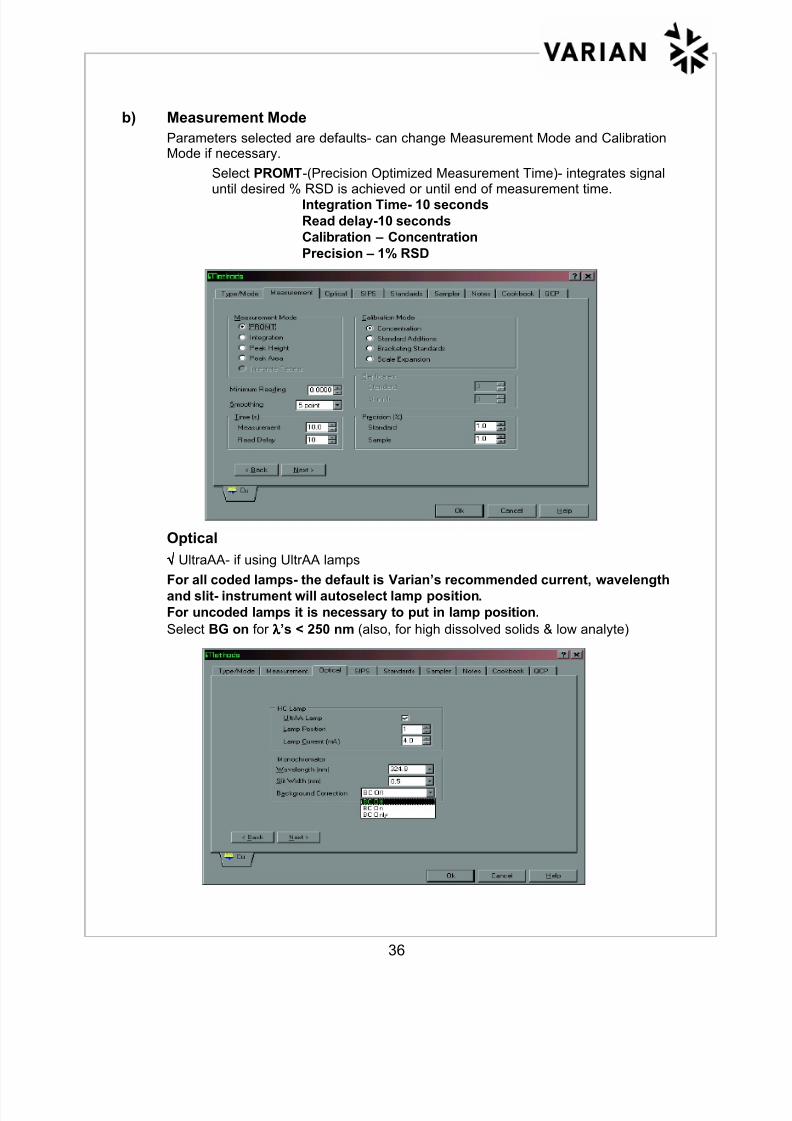
b) Measurement Mode
Parameters selected are defaults- can change Measurement Mode and CalibrationMode if necessary.
Select PROMT-(Precision Optimized Measurement Time)- integrates signal
until desired % RSD is achieved or until end of measurement time.Integration Time- 10 seconds
Read delay-10 seconds
Calibration – Concentration
Precision – 1% RSD
Optical
√√√√ UltraAA- if using UltrAA lamps
For all coded lamps- the default is Varian’s recommended current, wavelength
and slit- instrument will autoselect lamp position.
For uncoded lamps it is necessary to put in lamp position.
Select BG on for λλλλ’s < 250 nm (also, for high dissolved solids & low analyte)
8/12/2019 Absorçãoatomicaftheory Chama
http://slidepdf.com/reader/full/absorcaoatomicaftheory-chama 37/81
37
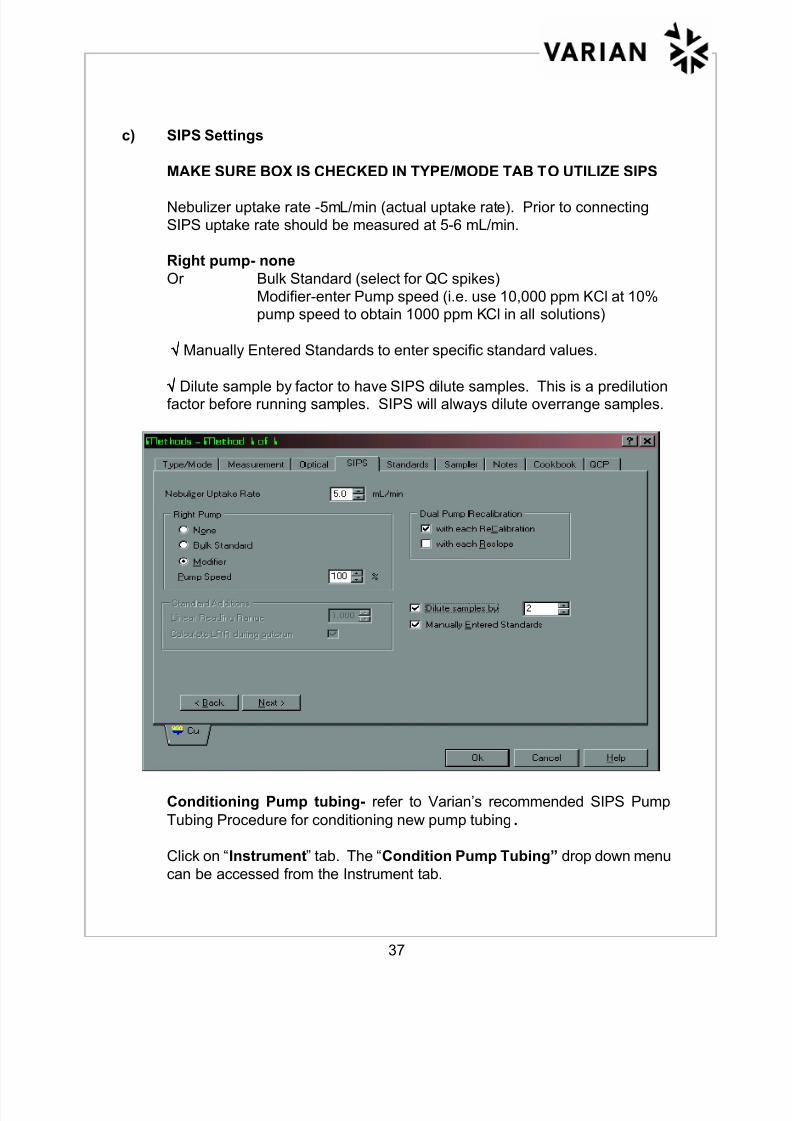
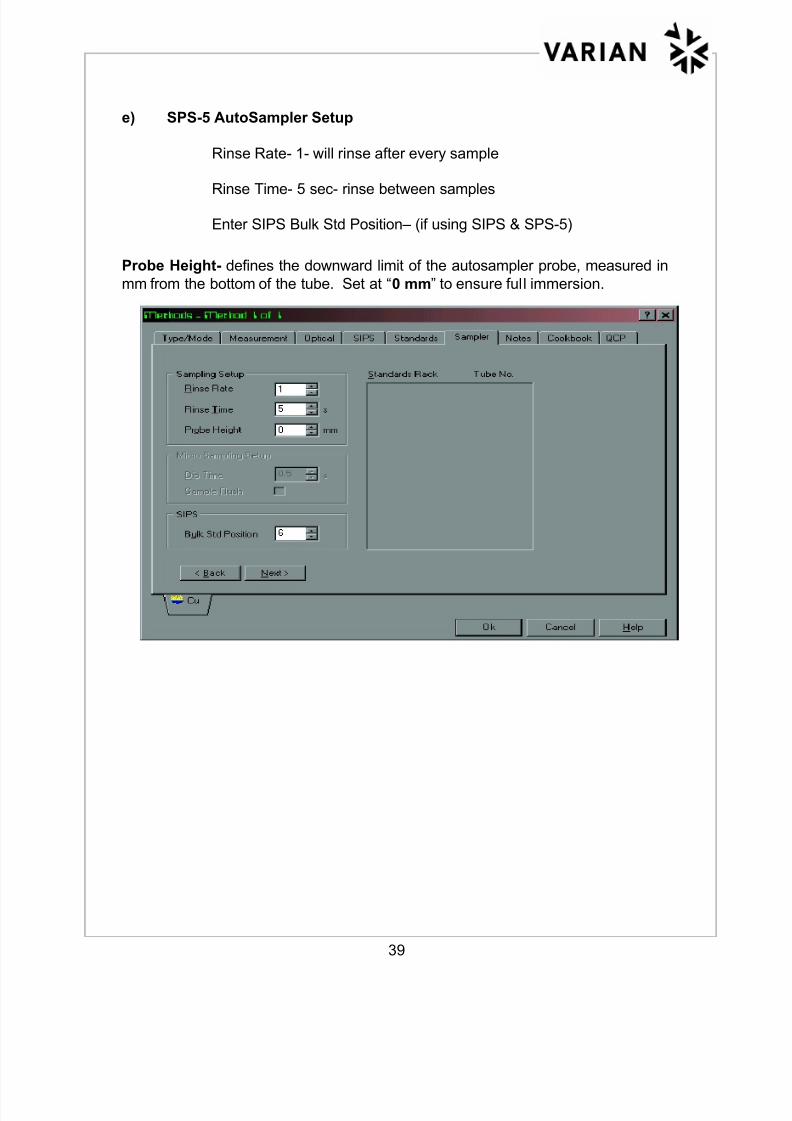
c) SIPS Settings
MAKE SURE BOX IS CHECKED IN TYPE/MODE TAB TO UTILIZE SIPS
Nebulizer uptake rate -5mL/min (actual uptake rate). Prior to connecting
SIPS uptake rate should be measured at 5-6 mL/min.
Right pump- none
Or Bulk Standard (select for QC spikes)
Modifier-enter Pump speed (i.e. use 10,000 ppm KCl at 10%pump speed to obtain 1000 ppm KCl in all solutions)
√√√√ Manually Entered Standards to enter specific standard values.
√√√√ Dilute sample by factor to have SIPS dilute samples. This is a predilutionfactor before running samples. SIPS will always dilute overrange samples.
Conditioning Pump tubing- refer to Varian’s recommended SIPS Pump
Tubing Procedure for conditioning new pump tubing.
Click on “Instrument” tab. The “Condition Pump Tubing” drop down menu
can be accessed from the Instrument tab.
8/12/2019 Absorçãoatomicaftheory Chama
http://slidepdf.com/reader/full/absorcaoatomicaftheory-chama 38/81
38
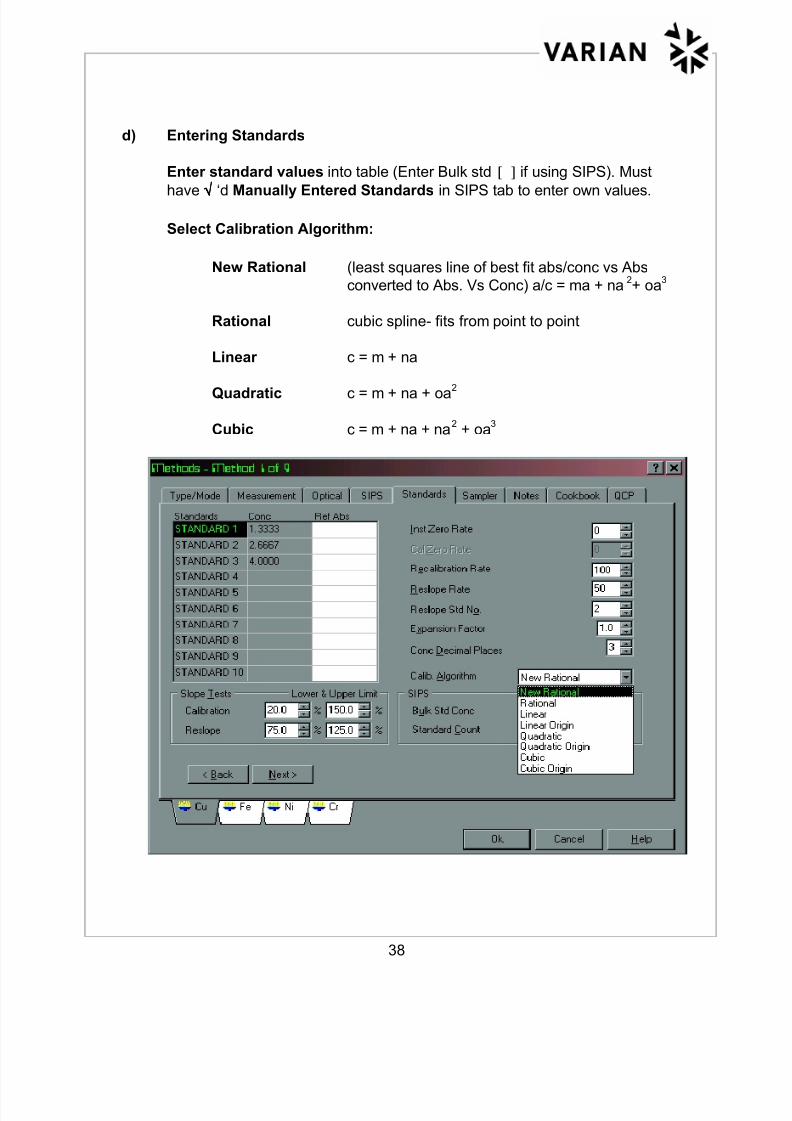
d) Entering Standards
Enter standard values into table (Enter Bulk std [ ] if using SIPS). Must
have √√√√ ‘d Manually Entered Standards in SIPS tab to enter own values.
Select Calibration Algorithm:
New Rational (least squares line of best fit abs/conc vs Abs
converted to Abs. Vs Conc) a/c = ma + na2+ oa
3
Rational cubic spline- fits from point to point
Linear c = m + na
Quadratic c = m + na + oa2
Cubic c = m + na + na2 + oa
3
8/12/2019 Absorçãoatomicaftheory Chama
http://slidepdf.com/reader/full/absorcaoatomicaftheory-chama 39/81
8/12/2019 Absorçãoatomicaftheory Chama
http://slidepdf.com/reader/full/absorcaoatomicaftheory-chama 40/81
40
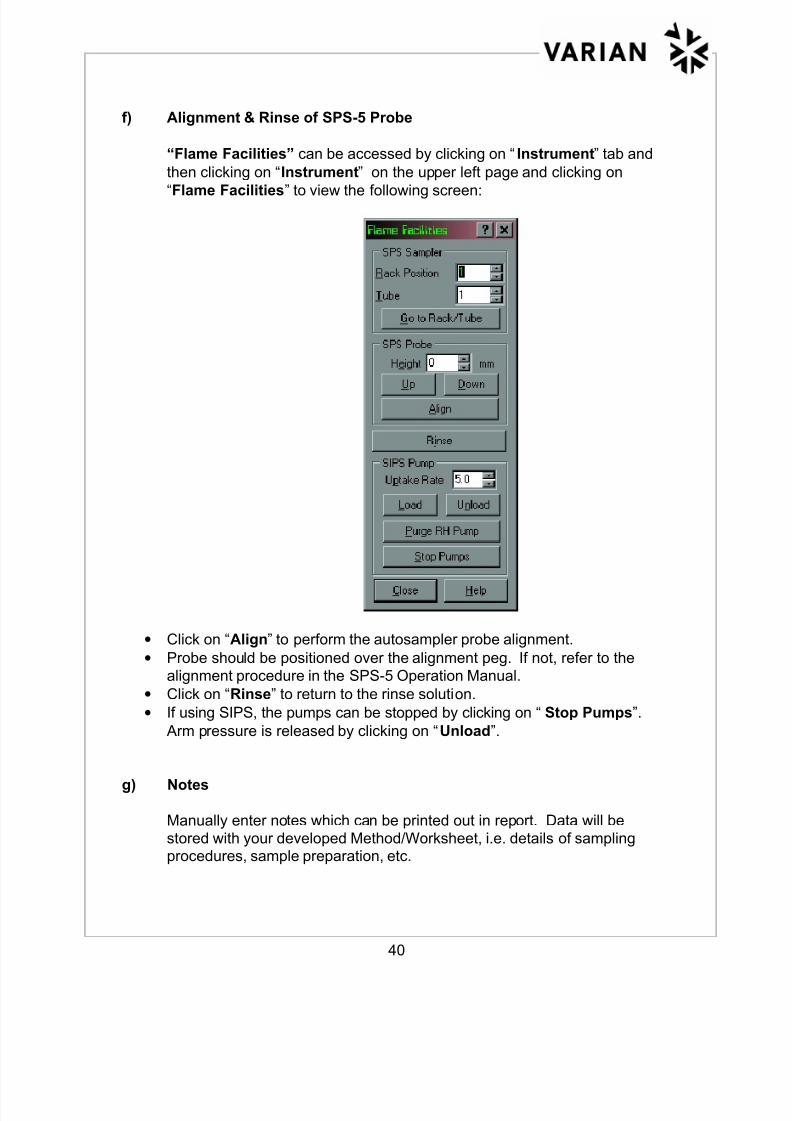
f) Alignment & Rinse of SPS-5 Probe
“Flame Facilities” can be accessed by clicking on “Instrument” tab and
then clicking on “Instrument” on the upper left page and clicking on
“Flame Facilities” to view the following screen:
• Click on “Align” to perform the autosampler probe alignment.
• Probe should be positioned over the alignment peg. If not, refer to the
alignment procedure in the SPS-5 Operation Manual.
• Click on “Rinse” to return to the rinse solution.
• If using SIPS, the pumps can be stopped by clicking on “Stop Pumps”.
Arm pressure is released by clicking on “Unload”.
g) Notes
Manually enter notes which can be printed out in report. Data will be
stored with your developed Method/Worksheet, i.e. details of samplingprocedures, sample preparation, etc.

8/12/2019 Absorçãoatomicaftheory Chama
http://slidepdf.com/reader/full/absorcaoatomicaftheory-chama 41/81
41
h) Cookbook and QCP
Cookbook contains Varian’s Analytical Methods and can be displayed asNotes or a Graph.
QCP
Click on “Limits” on left menu. √√√√ on “Enabled” for each specific test to
be included in method.
8/12/2019 Absorçãoatomicaftheory Chama
http://slidepdf.com/reader/full/absorcaoatomicaftheory-chama 42/81
42
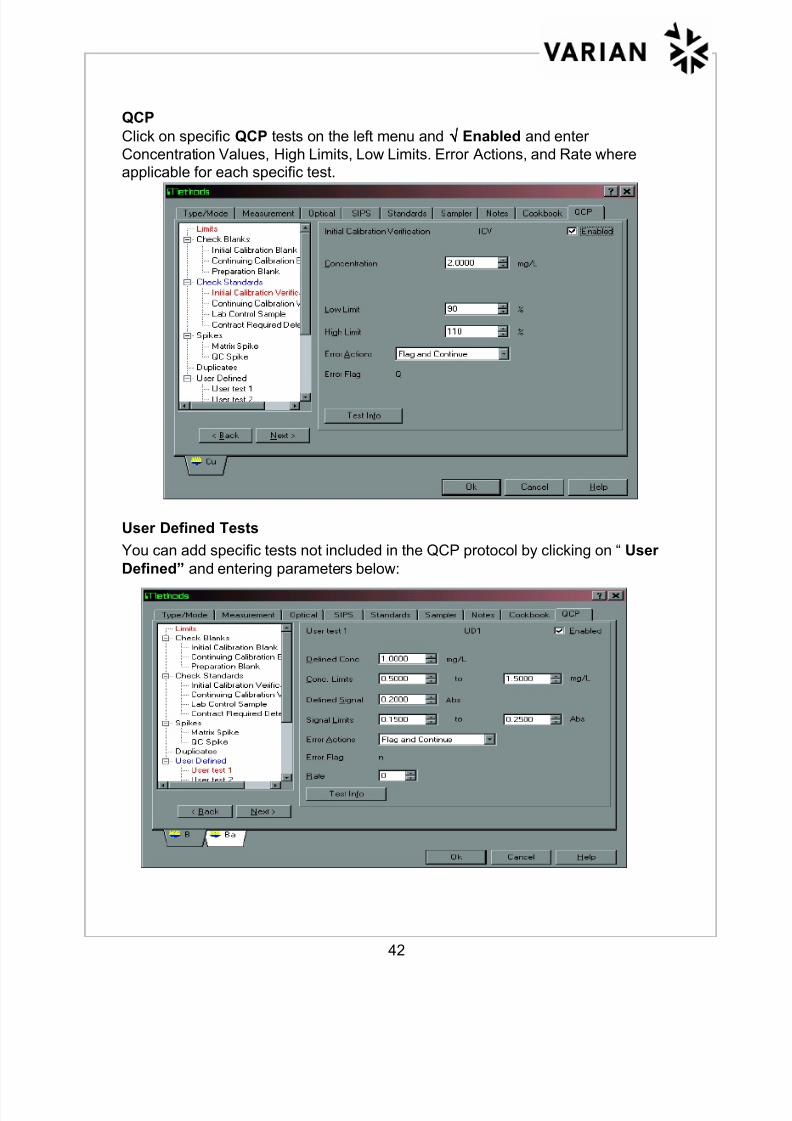
QCP
Click on specific QCP tests on the left menu and √√√√ Enabled and enter
Concentration Values, High Limits, Low Limits. Error Actions, and Rate where
applicable for each specific test.
User Defined Tests
You can add specific tests not included in the QCP protocol by clicking on “User
Defined” and entering parameters below:

8/12/2019 Absorçãoatomicaftheory Chama
http://slidepdf.com/reader/full/absorcaoatomicaftheory-chama 43/81
8/12/2019 Absorçãoatomicaftheory Chama
http://slidepdf.com/reader/full/absorcaoatomicaftheory-chama 44/81

8/12/2019 Absorçãoatomicaftheory Chama
http://slidepdf.com/reader/full/absorcaoatomicaftheory-chama 45/81
45
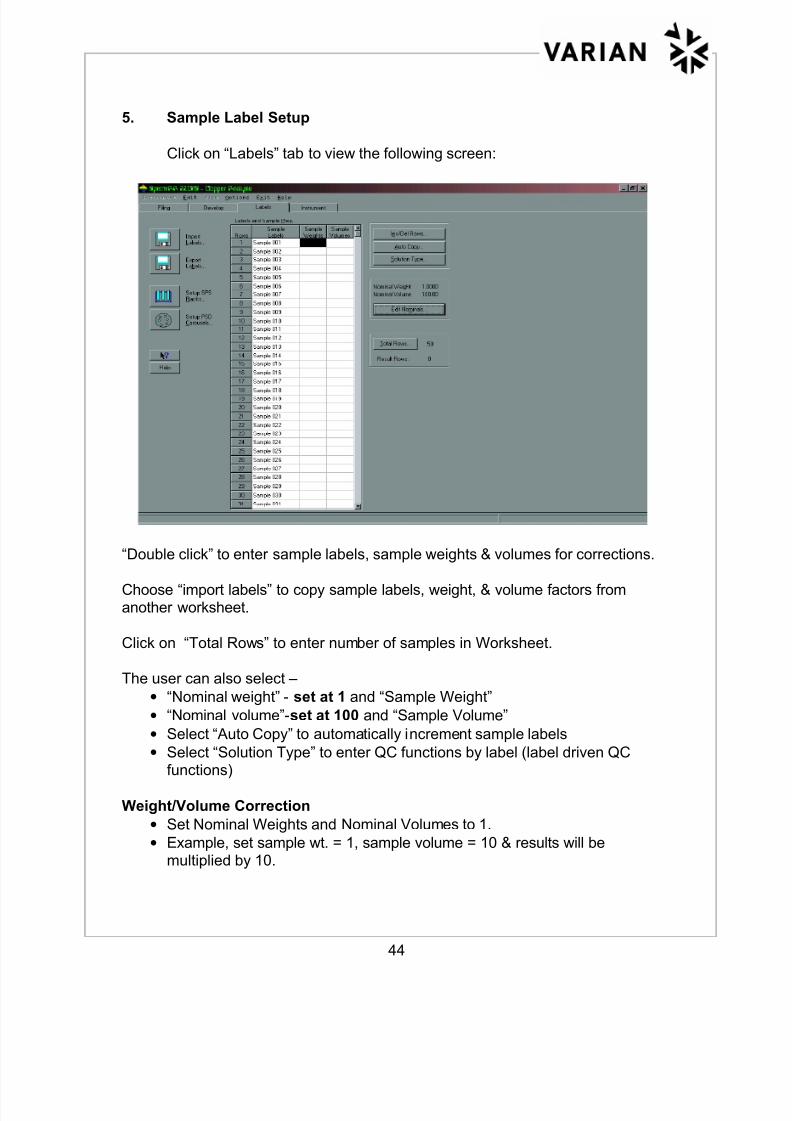
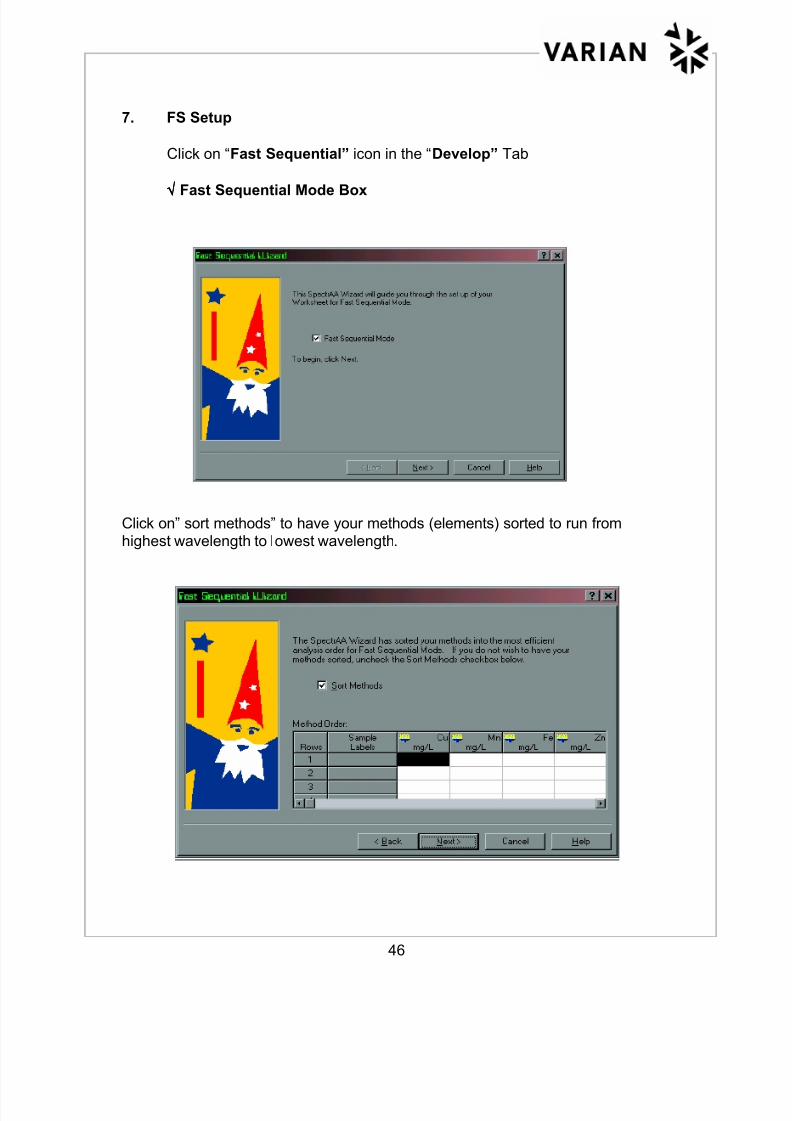
6. Printing SPS-5 Loading Guide
Click on the “Setup SPS Racks” icon on the “Labels” tab. The following
screen appears:
This screen shows autosampler positions for samples and standards, rack types,
and number of racks for the samples setup in the method. Click on “Loading
Guide” to print out sample labels and positions in the autosampler racks.
8/12/2019 Absorçãoatomicaftheory Chama
http://slidepdf.com/reader/full/absorcaoatomicaftheory-chama 46/81
8/12/2019 Absorçãoatomicaftheory Chama
http://slidepdf.com/reader/full/absorcaoatomicaftheory-chama 47/81
47
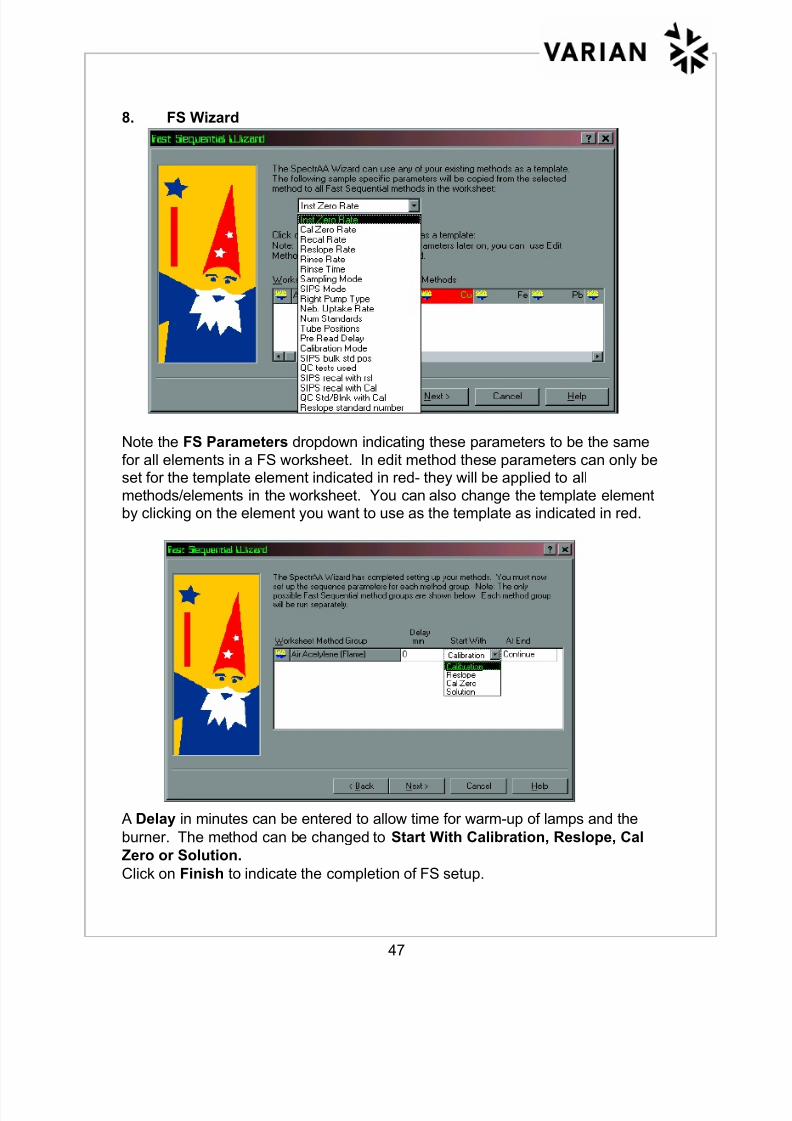
8. FS Wizard
Note the FS Parameters dropdown indicating these parameters to be the same
for all elements in a FS worksheet. In edit method these parameters can only beset for the template element indicated in red- they will be applied to all
methods/elements in the worksheet. You can also change the template elementby clicking on the element you want to use as the template as indicated in red.
A Delay in minutes can be entered to allow time for warm-up of lamps and the
burner. The method can be changed to Start With Calibration, Reslope, Cal
Zero or Solution.
Click on Finish to indicate the completion of FS setup.
8/12/2019 Absorçãoatomicaftheory Chama
http://slidepdf.com/reader/full/absorcaoatomicaftheory-chama 48/81
48
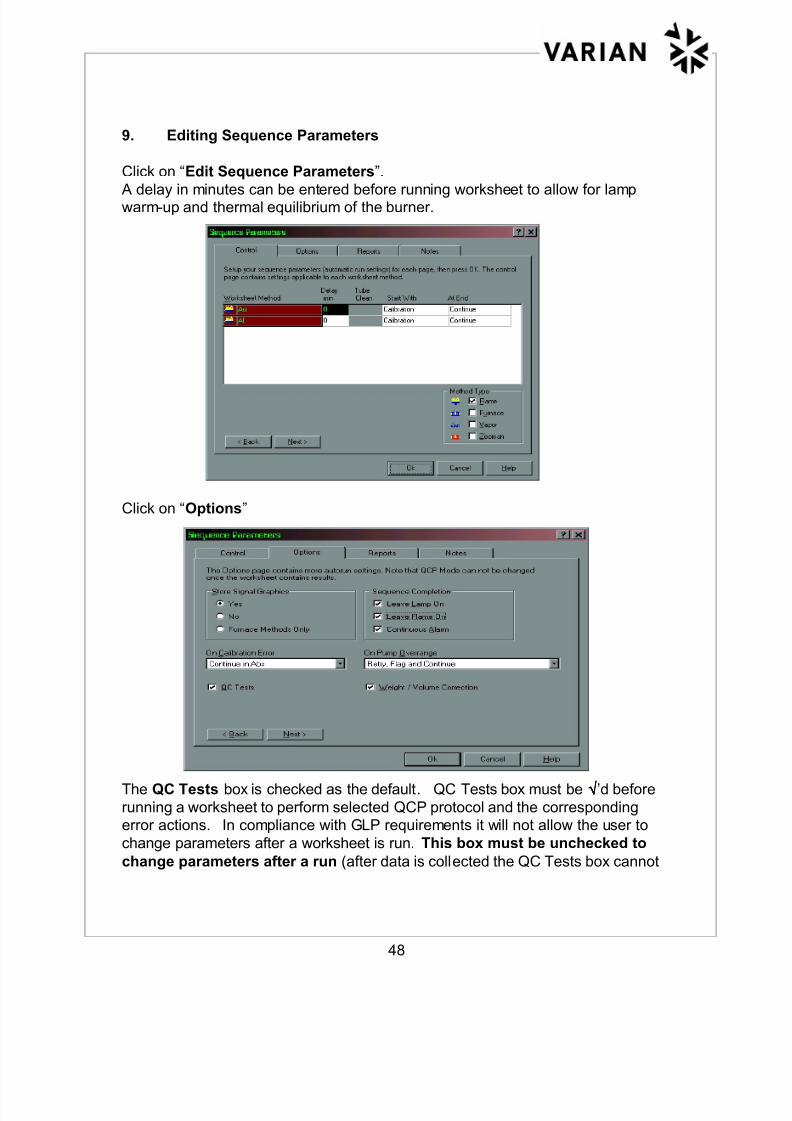
9. Editing Sequence Parameters
Click on “Edit Sequence Parameters”.
A delay in minutes can be entered before running worksheet to allow for lampwarm-up and thermal equilibrium of the burner.
Click on “Options”
The QC Tests box is checked as the default. QC Tests box must be √√√√’d before
running a worksheet to perform selected QCP protocol and the corresponding
error actions. In compliance with GLP requirements it will not allow the user to
change parameters after a worksheet is run. This box must be unchecked to
change parameters after a run (after data is collected the QC Tests box cannot

8/12/2019 Absorçãoatomicaftheory Chama
http://slidepdf.com/reader/full/absorcaoatomicaftheory-chama 49/81
8/12/2019 Absorçãoatomicaftheory Chama
http://slidepdf.com/reader/full/absorcaoatomicaftheory-chama 50/81
50
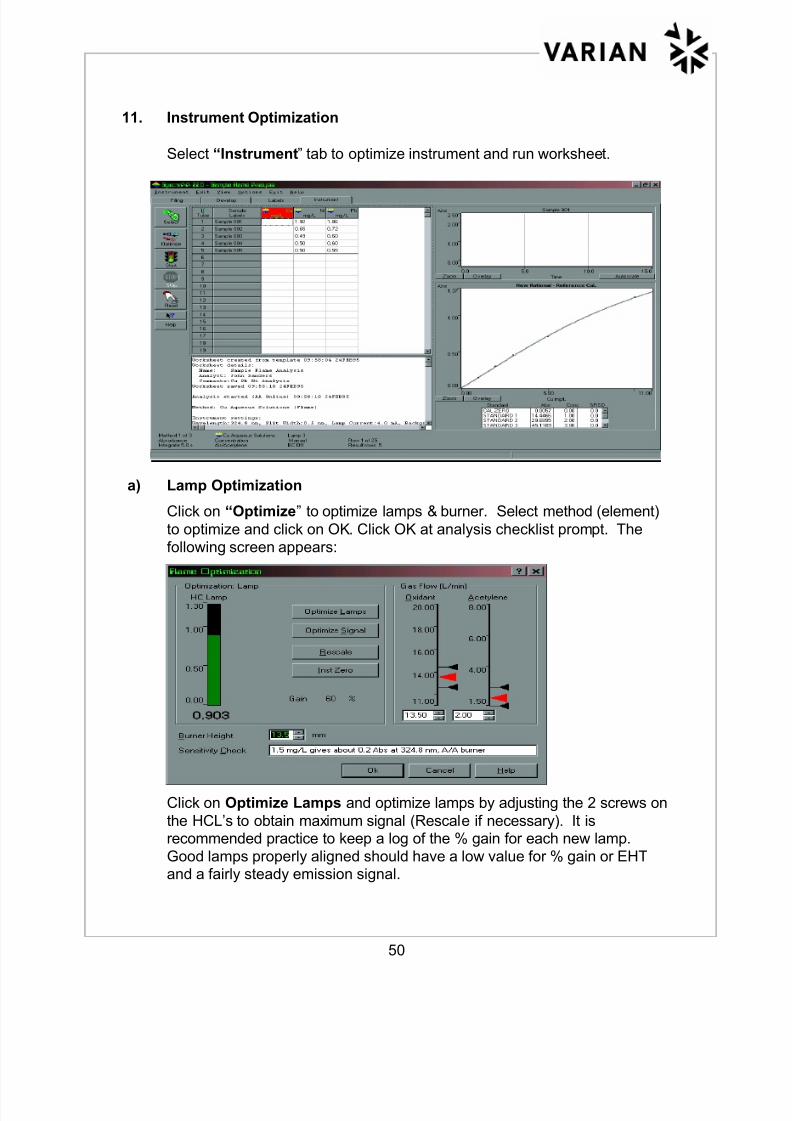
11. Instrument Optimization
Select “Instrument” tab to optimize instrument and run worksheet.
a) Lamp Optimization
Click on “Optimize” to optimize lamps & burner. Select method (element)
to optimize and click on OK. Click OK at analysis checklist prompt. The
following screen appears:
Click on Optimize Lamps and optimize lamps by adjusting the 2 screws on
the HCL’s to obtain maximum signal (Rescale if necessary). It isrecommended practice to keep a log of the % gain for each new lamp.
Good lamps properly aligned should have a low value for % gain or EHTand a fairly steady emission signal.
8/12/2019 Absorçãoatomicaftheory Chama
http://slidepdf.com/reader/full/absorcaoatomicaftheory-chama 51/81
51
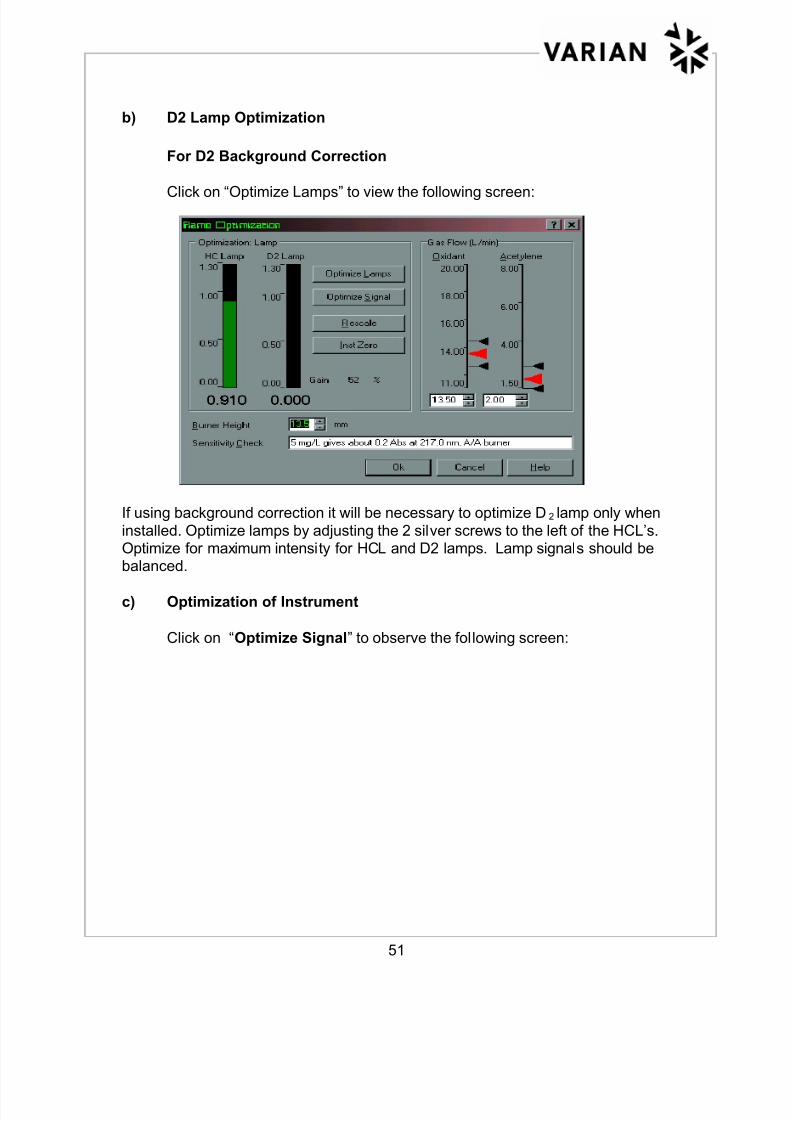
b) D2 Lamp Optimization
For D2 Background Correction
Click on “Optimize Lamps” to view the following screen:
If using background correction it will be necessary to optimize D2 lamp only when
installed. Optimize lamps by adjusting the 2 silver screws to the left of the HCL’s.Optimize for maximum intensity for HCL and D2 lamps. Lamp signals should be
balanced.
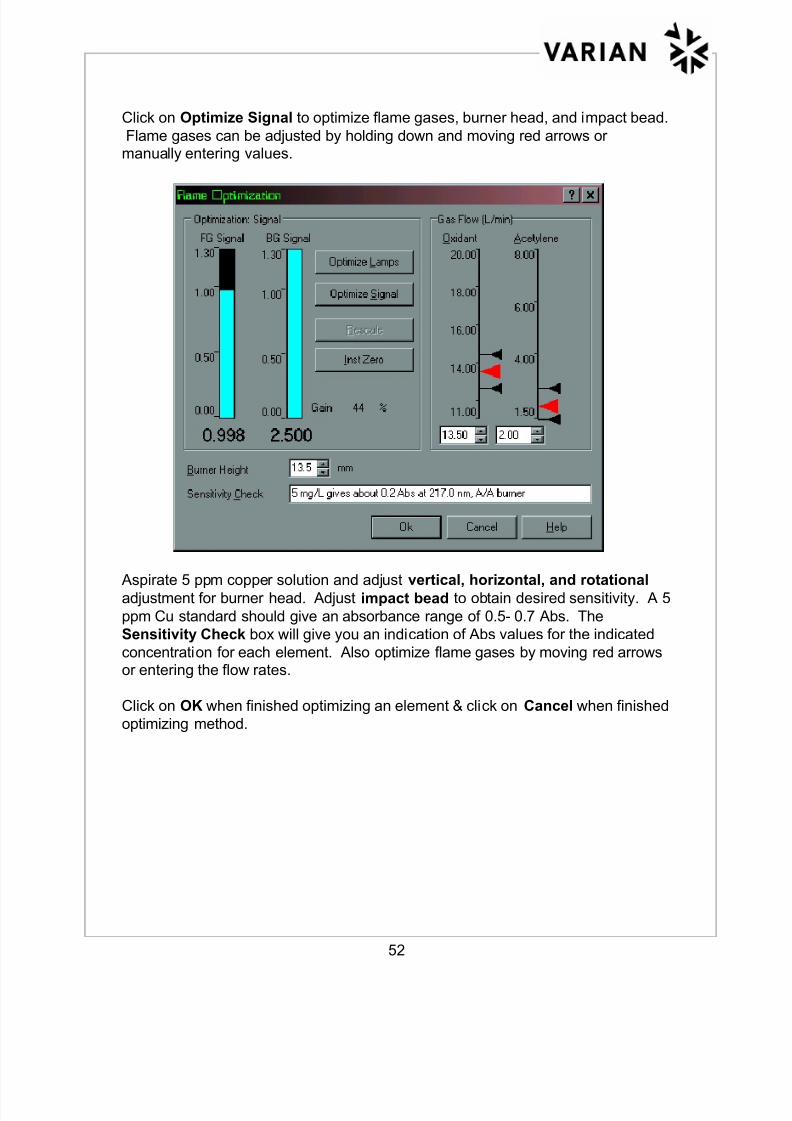
c) Optimization of Instrument
Click on “Optimize Signal” to observe the following screen:
8/12/2019 Absorçãoatomicaftheory Chama
http://slidepdf.com/reader/full/absorcaoatomicaftheory-chama 52/81
52
Click on Optimize Signal to optimize flame gases, burner head, and impact bead.
Flame gases can be adjusted by holding down and moving red arrows ormanually entering values.
Aspirate 5 ppm copper solution and adjust vertical, horizontal, and rotational
adjustment for burner head. Adjust impact bead to obtain desired sensitivity. A 5
ppm Cu standard should give an absorbance range of 0.5- 0.7 Abs. The
Sensitivity Check box will give you an indication of Abs values for the indicated
concentration for each element. Also optimize flame gases by moving red arrowsor entering the flow rates.
Click on OK when finished optimizing an element & click on Cancel when finished
optimizing method.
8/12/2019 Absorçãoatomicaftheory Chama
http://slidepdf.com/reader/full/absorcaoatomicaftheory-chama 53/81
53
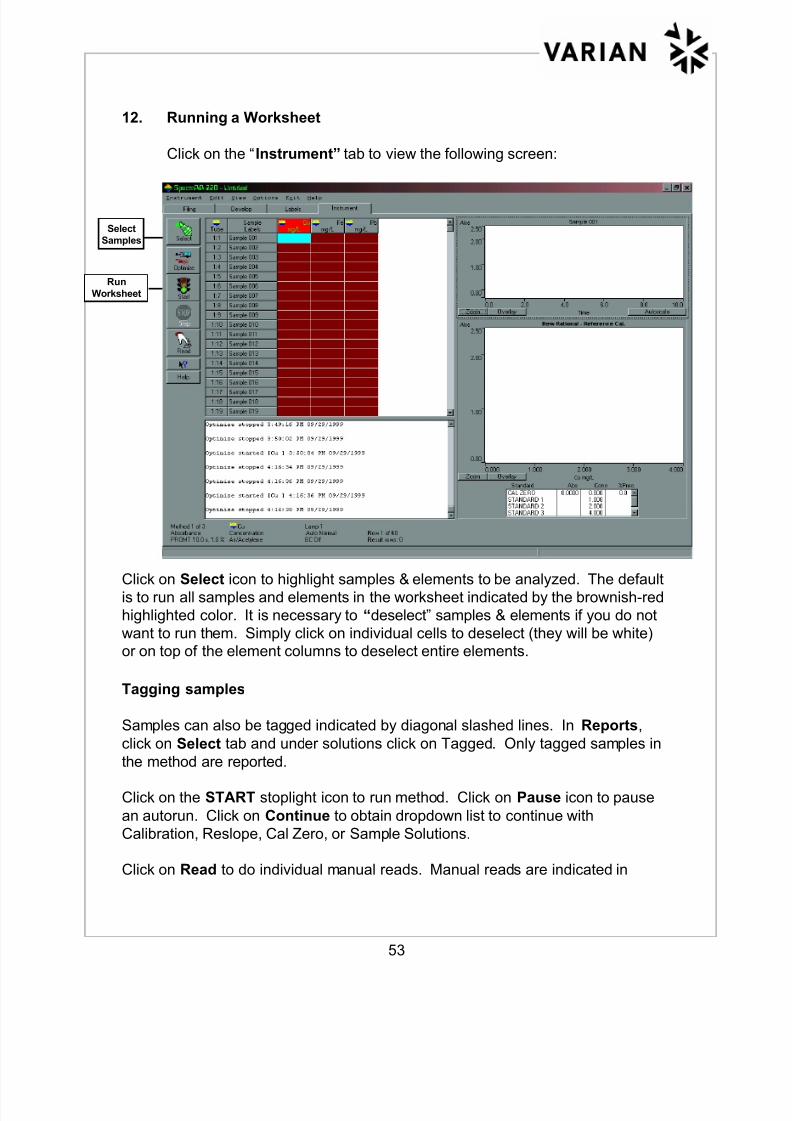
12. Running a Worksheet
Click on the “Instrument” tab to view the following screen:
Click on Select icon to highlight samples & elements to be analyzed. The defaultis to run all samples and elements in the worksheet indicated by the brownish-red
highlighted color. It is necessary to “deselect” samples & elements if you do not
want to run them. Simply click on individual cells to deselect (they will be white)
or on top of the element columns to deselect entire elements.
Tagging samples
Samples can also be tagged indicated by diagonal slashed lines. In Reports,
click on Select tab and under solutions click on Tagged. Only tagged samples in
the method are reported.
Click on the START stoplight icon to run method. Click on Pause icon to pause
an autorun. Click on Continue to obtain dropdown list to continue with
Calibration, Reslope, Cal Zero, or Sample Solutions.
Click on Read to do individual manual reads. Manual reads are indicated in
Select
Samples
Run
Worksheet

8/12/2019 Absorçãoatomicaftheory Chama
http://slidepdf.com/reader/full/absorcaoatomicaftheory-chama 54/81
54
report by an..m next to the result. Read allows you to randomly select and
measure any solution. Click on “Stop” to close this mode.
Click on Random icon to read a random sample or repeat a sample read during
an Autorun.
13. Editing Results & Viewing Calibration Results
Each standard result can be edited by masking 1 or more replicates or the mean.
Right click on the calibration standard to be edited on lower right screen of the
calibration curve.
Click on “Edit Replicates”. Click on either mean (to mask all replicates) or
choose single replicates to mask.
Click on “Mask”, “Apply”, and “Close”. Notice a ---e in the results indicating
results have been edited. By carrying out such editing you may save time in nothaving to re-run that particular standard, or even having to prepare a newstandard and a new calibration.
Click on Overlay on the calibration screen to overlay calibration curves by clicking
on individual sample cells on the Worksheet screen (top left of Instrument
screen).

8/12/2019 Absorçãoatomicaftheory Chama
http://slidepdf.com/reader/full/absorcaoatomicaftheory-chama 55/81
8/12/2019 Absorçãoatomicaftheory Chama
http://slidepdf.com/reader/full/absorcaoatomicaftheory-chama 56/81
56
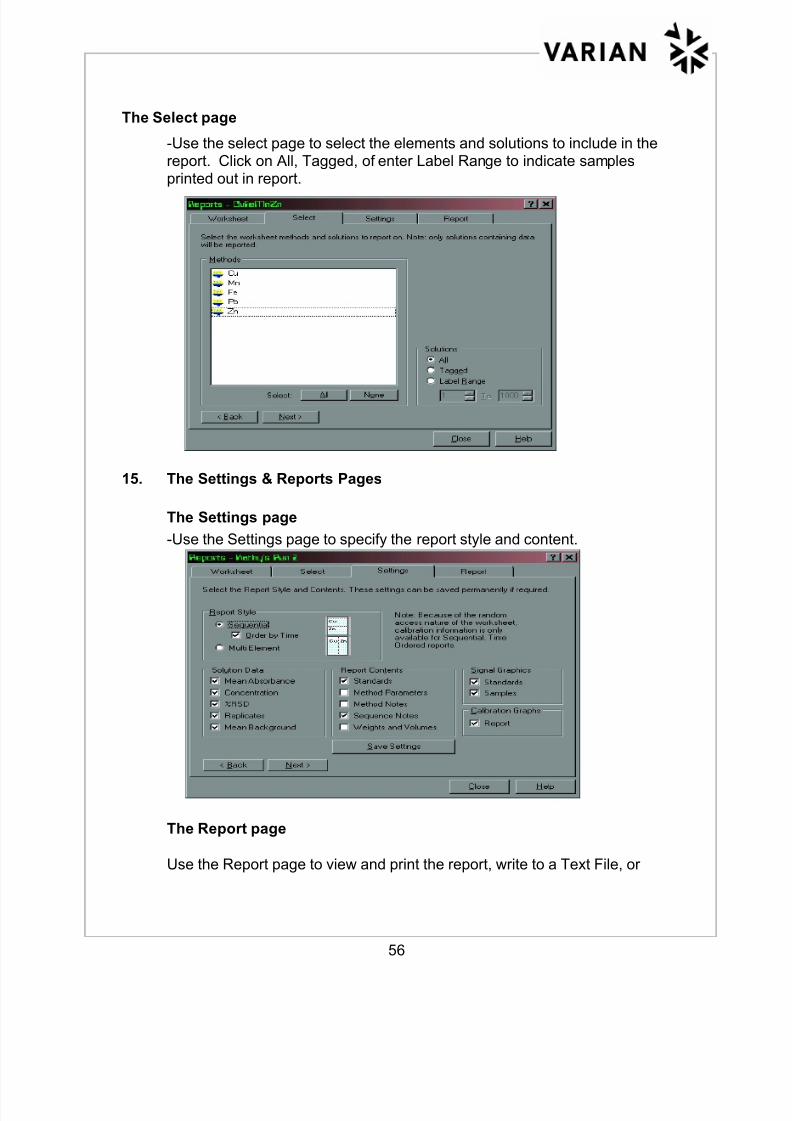
The Select page
-Use the select page to select the elements and solutions to include in thereport. Click on All, Tagged, of enter Label Range to indicate samplesprinted out in report.
15. The Settings & Reports Pages
The Settings page
-Use the Settings page to specify the report style and content.
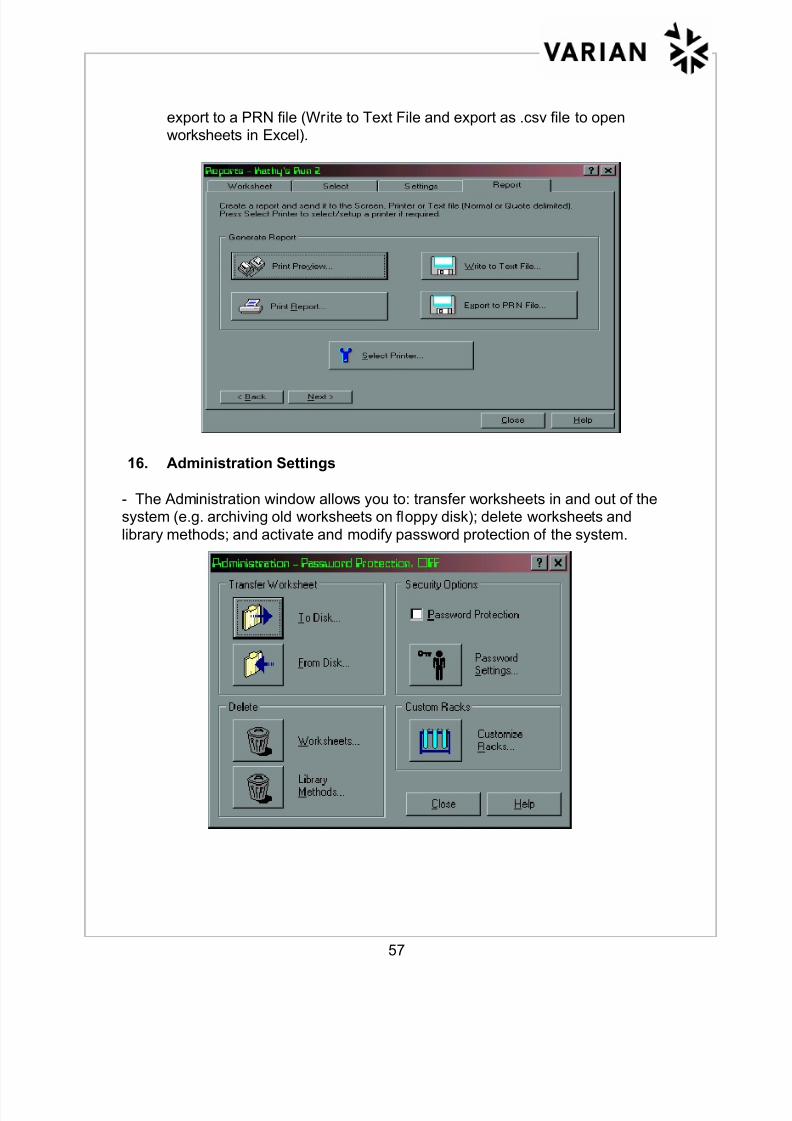
The Report page
Use the Report page to view and print the report, write to a Text File, or
8/12/2019 Absorçãoatomicaftheory Chama
http://slidepdf.com/reader/full/absorcaoatomicaftheory-chama 57/81
57
export to a PRN file (Write to Text File and export as .csv file to openworksheets in Excel).
16. Administration Settings
- The Administration window allows you to: transfer worksheets in and out of thesystem (e.g. archiving old worksheets on floppy disk); delete worksheets and
library methods; and activate and modify password protection of the system.
8/12/2019 Absorçãoatomicaftheory Chama
http://slidepdf.com/reader/full/absorcaoatomicaftheory-chama 58/81
58
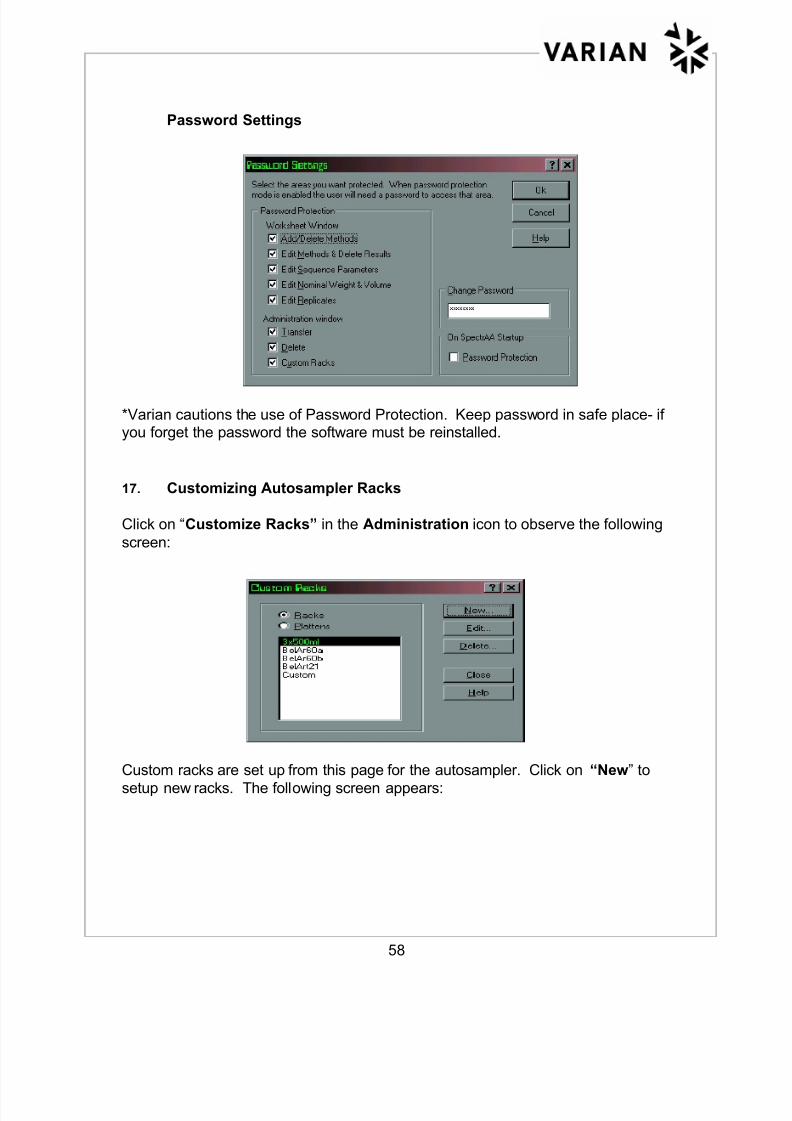
Password Settings
*Varian cautions the use of Password Protection. Keep password in safe place- ifyou forget the password the software must be reinstalled.
17. Customizing Autosampler Racks
Click on “Customize Racks” in the Administration icon to observe the following
screen:
Custom racks are set up from this page for the autosampler. Click on “New” tosetup new racks. The following screen appears:
8/12/2019 Absorçãoatomicaftheory Chama
http://slidepdf.com/reader/full/absorcaoatomicaftheory-chama 59/81
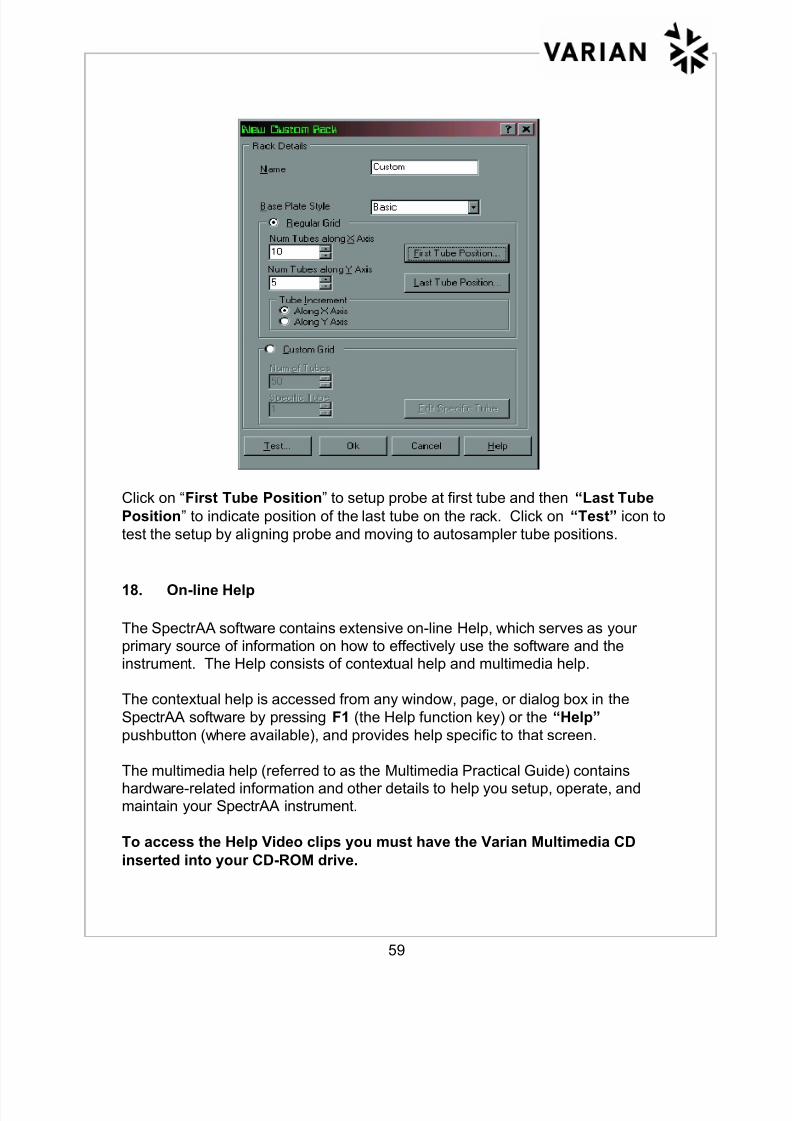
59
Click on “First Tube Position” to setup probe at first tube and then “Last Tube
Position” to indicate position of the last tube on the rack. Click on “Test” icon to
test the setup by aligning probe and moving to autosampler tube positions.
18. On-line Help
The SpectrAA software contains extensive on-line Help, which serves as your
primary source of information on how to effectively use the software and theinstrument. The Help consists of contextual help and multimedia help.
The contextual help is accessed from any window, page, or dialog box in the
SpectrAA software by pressing F1 (the Help function key) or the “Help”
pushbutton (where available), and provides help specific to that screen.
The multimedia help (referred to as the Multimedia Practical Guide) containshardware-related information and other details to help you setup, operate, andmaintain your SpectrAA instrument.
To access the Help Video clips you must have the Varian Multimedia CD
inserted into your CD-ROM drive.
8/12/2019 Absorçãoatomicaftheory Chama
http://slidepdf.com/reader/full/absorcaoatomicaftheory-chama 60/81
60
19. Instrument Shutdown
After finishing the analysis, rinse with ∼50 ml of DI water or dilute acid (0.1%-1%)
followed by DI water before exiting the system.
Click on “Filing” tab, Save, Close, and then “Exit”.
Or
From Instrument Window click on “exit” and “Shutdown SpectrAA”. The flame
will automatically shut down. If √√√√ ‘d in the sequence parameters, the flame and/or
lamps will automatically turn off at end of run.
All gas supplies should be turned off at the cylinders.
B. SPECTRAA OPTIMIZATION
Your AA cannot be expected to provide maximum analytical performance unless itis first set up correctly. Although complete details for the set up and optimizationprocedures are given in the help screens of the SpectrAA software the main
optimization parameters will be discussed in this chapter.
Before samples are analyzed, the hollow cathode lamp must be aligned and then
the flame signal is optimized to give maximum signal resolution.
A. Hollow Cathode Lamp alignment
A hollow cathode lamp should be aligned if:
• You need the best possible signal to noise ratio
• You are using a non-Varian lamp
• You are using a position previously used for a non-Varian lamp
• You have just installed the lamp.
1. Select the Instrument tab.
2. Press "Optimize" (the Optimize Method Select dialog box will appear).

8/12/2019 Absorçãoatomicaftheory Chama
http://slidepdf.com/reader/full/absorcaoatomicaftheory-chama 61/81
61
3. Select the flame method you wish to optimize from the method list box andpress "Optimize". The Flame Optimization window will appear.
Note: The Analysis Checklist dialog may appear containing a list of hardware
items that you must set up and/or confirm. Press “OK” once these items areconfirmed to continue with the optimization.
4. Allow the lamp time to warm up (about 10 minutes). If the lamp is notglowing review the method and make sure that the hollow cathode lamp isfitted at the current active position.
5. Make sure nothing is in the optical path.
6. While watching the lamp signal bar on the display, slowly turn one of thelamp adjustment knobs. If the signal decreases, turn the knob in the other
direction, until you find the maximum signal.
7. If the HC lamp signal is too small, first check that you have the correct lampfor the current method, and that it is glowing. If so, press "Rescale". This
will bring the signal back into range for display. You should also press"Rescale" if the signal becomes too large.
8. Repeat the previous step with the other adjustment knob.
B. Deuterium (D2) lamp alignment
1. Follow steps 1-4 in the above procedure choosing a method that uses
background correction. Allow the deuterium lamp to warm up for 30minutes before use.
2. While watching the lamp signal bar on the display, slowly turn one of theD2 lamp adjustment knobs (located on the front of the D2 lamp
compartment). If the signal decreases, turn the knob in the other direction,until you find the maximum signal.
3. If the D2 lamp signal is too small press "Rescale". This will bring the signal
back into range for display. You should also "Rescale" if the signalbecomes too large.
4. Repeat with the second D2 lamp adjustment knob.
8/12/2019 Absorçãoatomicaftheory Chama
http://slidepdf.com/reader/full/absorcaoatomicaftheory-chama 62/81
62
Note: The hollow cathode lamps and deuterium lamps should be aligned
separately such that each lamp bar is showing maximum energy. In manycases this will mean that the length of the two bars will be different.
C. Flame signal optimization
1. Press “InstZero” to zero the instrument.
2. Use one of the Varian supplied burner cleaning and alignment strips (or abusiness card) to locate the light path.
3. Rotate the burner, squeezing the prongs of the rotation handle, until theslot is parallel to the light path.
4. Place the card halfway along the slot. Position the card with the verticalline perpendicular to the slot, then adjust the burner height until the light
beam falls within the target area.
5. Light the flame. Wait until the flame is burning steadily before proceeding
to step 6.
6. Press the “Optimize Signal” button.
7. Aspirate a solution of analyte that will give an absorbance between 0.2 and0.8.
8. Watch the signal bar and adjust the burner height using the outer knob onthe burner adjuster to obtain the maximum absorbance, but keep the
burner below the light path. The burner height controls the sensitivity andwill also influence atomization interferences.
9. Carefully move the burner horizontally by turning the inner adjustment knobon the burner adjuster. In general, once optimized for maximum sensitivity,this position can be used for all analyses.
10. Now rotate the burner using the tweezer control and adjust for maximum
sensitivity.
11. Adjust the impact bead position by gradually turning the impact bead
adjustment screw first clockwise, then counter -clockwise, to find themaximum absorbance.
Note: If you are doing an Autorun you should optimize the burner position for one
of the methods prior to starting the run. For all elements except Cr and Si

8/12/2019 Absorçãoatomicaftheory Chama
http://slidepdf.com/reader/full/absorcaoatomicaftheory-chama 63/81
63
the burner position will be suitable for each method. Cr and Si should beanalyzed separately as their determination is critically dependent upon theburner position.
You can also optimize the gas flow rates if required.
12. Enter a value in the Gas Flow numeric entry fields or ‘click and drag’ thered marker to specify the gas flow rates to obtain the optimum absorbancefor the current method.
The black markers can also be moved with the mouse and their positions
saved when "OK" is pressed. Use them if you need to mark any gas flowlimits for the method.
13. When the signal and lamp values are satisfactory, press "OK". The system
is now optimized. You can now take readings, measure your calibrationstandards, or perform a reslope according to your analytical requirements.
Tip: Enter the actual gain, absorbance and concentration you used in the
sensitivity check text field as a reminder of the required settings.
D. Autorun set up
An Autorun allows SpectrAA to measure a batch of samples sequentially. Only theselected samples are measured.
1. Load an existing or new Worksheet.
2. Select the Labels page tab and enter your sample labels.
3. Enter the weight and volume of each sample (if required) and specify the
nominal weight and volume (if required).
4. Select the Develop page tab and add (and modify, if necessary) Worksheet
methods. Close the Methods dialog box when complete.
5. Press "Edit Sequence Parameters…" (the Sequence Parameters window
will appear).
6. Select the Control page tab.
7. Select the Method type(s) you wish to display.
8/12/2019 Absorçãoatomicaftheory Chama
http://slidepdf.com/reader/full/absorcaoatomicaftheory-chama 64/81
64
8. For each method displayed on the Control page, specify what you want tohappen at the start and end of each, i.e. do you want to delay the start of amethod? What actions do you want at the start and end of each method
and do you want to automatically clean the graphite tube at the start of a
furnace method?
9. Select the Options page tab.
10. Use ‘Store signal graphics’ if you want to store the signal graphics for each
sample.
11. Define what is to happen at the end of the autorun in the SequenceCompletion group.
12. If the calibration for a method fails, the system needs to know what you
want to do- specify this in the On calibration error listbox.
13. If you are using a SIPS accessory, use ‘On pump overrange’ to specifywhat you want to happen when a SIPS pump purge fails after an overrangesample. If you are not using SIPS, ignore this field.
14. If you want to use Quality Control Tests, select the 'QC Tests' checkbox.
Note: You should set up the QC test for each method in the Methods window.
15. If you entered sample weights and volumes in step 3, and wish to use them
to calculate the final sample concentration, select the 'Weight and volumecorrection' checkbox.
16. Select the Reports page tab.
17. Use the parameters in ‘Report contents’ to specify what your report shouldcontain.
18. Select ‘Print report’ (in the Setup auto report output group) to print a reportto the printer. Choose to print the report out as each sample is measuredduring the sequence or when the sequence is finished (Report group).
You can select to print the report directly to your PCs serial port (choose‘Output results to PC port’). Alternatively, you can export the report directly
to a PRN file (choose ‘Export report as PRN file’).
19 Select the Notes page tab.
8/12/2019 Absorçãoatomicaftheory Chama
http://slidepdf.com/reader/full/absorcaoatomicaftheory-chama 65/81
65
20. If you want to include some additional text on your report, type it in on theNotes page.
21. Close the Sequence Parameters window and return to the Labels page.
22. If you are using a SPS or PSD, use "Setup SPS Racks" or "Setup PSDcarousels".
23. Load your samples into the SPS or PSD (if you are using theseaccessories).
24. On the Instrument page, select the samples you wish to analyze.
25. Press "Start" to start the autorun.

8/12/2019 Absorçãoatomicaftheory Chama
http://slidepdf.com/reader/full/absorcaoatomicaftheory-chama 66/81

8/12/2019 Absorçãoatomicaftheory Chama
http://slidepdf.com/reader/full/absorcaoatomicaftheory-chama 67/81
67
CHAPTER 5 FLAME INTERFERENCES
1. BACKGROUND ABSORPTION
One of the major virtues of atomic absorption spectroscopy lies in the fact thatabsorption occurs at specific wavelengths which are characteristic of the chemicalelement. Theoretically, any absorption which occurs can be directly attributed to
the presence of analyte atoms, and the degree to which absorption occurs is afunction of the density of the atom population. In practice, however, the analyticalsignal can be attenuated by means other than atomic absorption. This will be
manifested as absorbance measurements which are higher than they should befor a given atom population, and the analytical result will not be valid.
The major sources of background absorption are molecular absorption and lightscattering. Molecular absorption occurs when the flame is not hot enough to
decompose all compounds in the sample. The remaining molecules will thenabsorb light, and if the absorption spectrum overlaps the analytical wavelengthsome additional absorption will be measured at the same time as the analytically
valid absorption signal. The flame itself produces absorption, especially at lowwavelengths.
Figure 28 shows the wavelength range over which sodium chloride molecules willabsorb.
Figure 28. Broad band absorption (sodium chloride)
8/12/2019 Absorçãoatomicaftheory Chama
http://slidepdf.com/reader/full/absorcaoatomicaftheory-chama 68/81
68
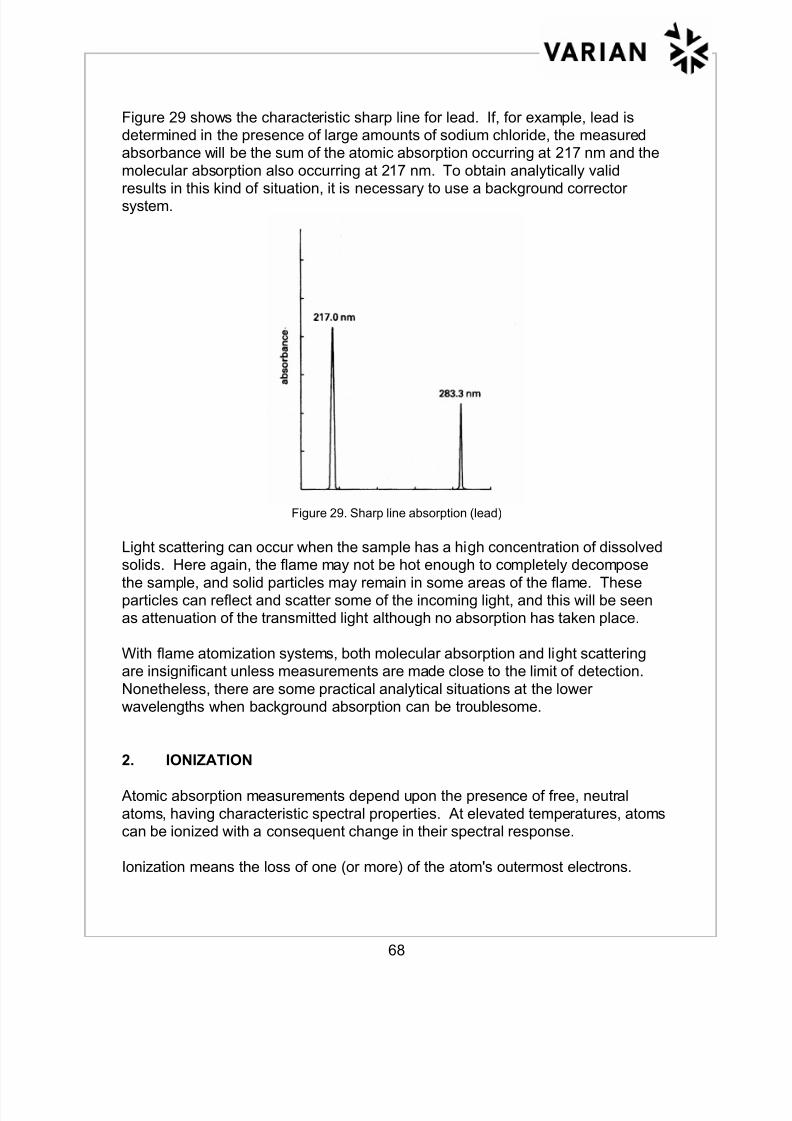
Figure 29 shows the characteristic sharp line for lead. If, for example, lead isdetermined in the presence of large amounts of sodium chloride, the measuredabsorbance will be the sum of the atomic absorption occurring at 217 nm and the
molecular absorption also occurring at 217 nm. To obtain analytically valid
results in this kind of situation, it is necessary to use a background correctorsystem.
Figure 29. Sharp line absorption (lead)
Light scattering can occur when the sample has a high concentration of dissolvedsolids. Here again, the flame may not be hot enough to completely decompose
the sample, and solid particles may remain in some areas of the flame. Theseparticles can reflect and scatter some of the incoming light, and this will be seenas attenuation of the transmitted light although no absorption has taken place.
With flame atomization systems, both molecular absorption and light scatteringare insignificant unless measurements are made close to the limit of detection.
Nonetheless, there are some practical analytical situations at the lowerwavelengths when background absorption can be troublesome.
2. IONIZATION
Atomic absorption measurements depend upon the presence of free, neutral
atoms, having characteristic spectral properties. At elevated temperatures, atomscan be ionized with a consequent change in their spectral response.
Ionization means the loss of one (or more) of the atom's outermost electrons.
8/12/2019 Absorçãoatomicaftheory Chama
http://slidepdf.com/reader/full/absorcaoatomicaftheory-chama 69/81
69
Since this electron was involved in the energy level transitions that define theresonance absorption line, no absorption can occur at this wavelength. Thedegree of ionization is different for each element, depending on the energy
required to remove electrons. This energy can be supplied in various ways, but
for atomic absorption the major source is the heat of the flame. In the nitrousoxide-acetylene flame particularly, many elements are at least partially ionized,
but the energy available is such that normally only one electron is removed andthe singly-charged ion is formed.
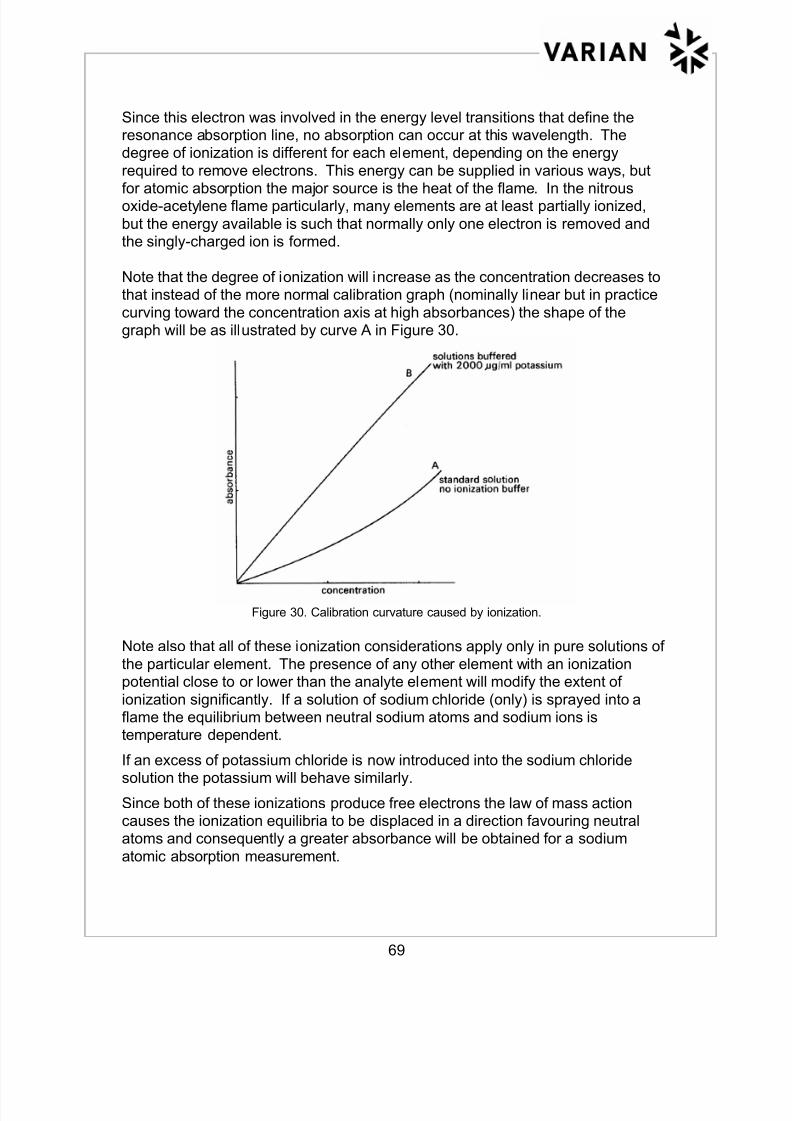
Note that the degree of ionization will increase as the concentration decreases tothat instead of the more normal calibration graph (nominally linear but in practice
curving toward the concentration axis at high absorbances) the shape of thegraph will be as illustrated by curve A in Figure 30.
Figure 30. Calibration curvature caused by ionization.
Note also that all of these ionization considerations apply only in pure solutions of
the particular element. The presence of any other element with an ionizationpotential close to or lower than the analyte element will modify the extent of
ionization significantly. If a solution of sodium chloride (only) is sprayed into aflame the equilibrium between neutral sodium atoms and sodium ions istemperature dependent.
If an excess of potassium chloride is now introduced into the sodium chloridesolution the potassium will behave similarly.
Since both of these ionizations produce free electrons the law of mass actioncauses the ionization equilibria to be displaced in a direction favouring neutralatoms and consequently a greater absorbance will be obtained for a sodium
atomic absorption measurement.

8/12/2019 Absorçãoatomicaftheory Chama
http://slidepdf.com/reader/full/absorcaoatomicaftheory-chama 70/81

8/12/2019 Absorçãoatomicaftheory Chama
http://slidepdf.com/reader/full/absorcaoatomicaftheory-chama 71/81
71
CHAPTER 6 ANALYSIS CONSIDERATIONS
The procedure used to measure the absorbance of a sample involves thefollowing steps once the analytical method has been developed:
(a) Preparation of sample solutions - the sample is dissolved in the correctsolvent system after any necessary decomposition procedures,
separations, additions and dilutions have been made. (Preparation ofstandard solutions, usually by dilutions from stock solutions will also benecessary for the measurement of concentration.)
(b) Adjustment of the instrument - the previously determined optimum
operating conditions must be achieved. This includes setting ofwavelength control, source current, slits, the detector and recordingsystem, the flow rates of gases if a flame is being used, and checking the
light path from source to monochromator entrance slit with respect toburner height, etc.
(C) Zeroing the instrument on distilled water then determining the absorbanceof the blank.
(d) Aspirating the standard solutions and recording their absorbances.
(e) Nebulizing the sample solution and reading its concentration from the
calibration graph.
CALIBRATION PROCEDURES
There are two commonly employed approaches to calibration in atomic absorption
spectroscopy. These are the methods of direct comparison and standardaddition.
(a) DIRECT COMPARISON
Theoretical considerations lead to the prediction that the measured absorbancewill increase linearly with increasing analyte concentration in conformity with
Beer's law.
At low concentrations this prediction is generally fulfilled and absorbance does
increase almost linearly with the analyte concentration. As the concentrationincreases, however, the correlation becomes increasingly curved. Traditionally,the shape of this curve was deter- mined experimentally for each analysis.
Absorbance measurements were obtained for standards of known concentration,
8/12/2019 Absorçãoatomicaftheory Chama
http://slidepdf.com/reader/full/absorcaoatomicaftheory-chama 72/81
72
and the analyte concentration in the sample was found by interpolation on thecurve. This graphical method is no longer required for routine analysis becauseinstruments can be calibrated to provide direct concentration measurements in
whatever units the operator chooses. Nonetheless, the graphical method is still a
valuable aid in establishing optimum working ranges and instrumental parameterswhen developing or investigating an analytical method.
But, calibration linearity is not the only matter of analytical concern. The practicalanalyst needs to know the capabilities of his spectrophotometer. For purposes of
comparison, three parameters are used to describe the analytical performance ofan atomic absorption spectrophotometer. All three are attempts to characterize
the useful range of measurement of the instrument for each element. The threeparameters are:
(a) Characteristic concentration
This is defined as the concentration, in solution, of the element to be determinedwhich will produce a change, compared to a blank solution, of 0.0044 absorbanceunits (i.e. I per cent absorption) in the optical transmission of the atomic vapor at
the wavelength of radiation used.
Note that different instruments will produce different characteristic concentrations.On any given instrument, however, there will be little variation from day-to-dayprovided that the operating conditions are not changed and the instrumental
conditions are optimized The characteristic concentration is easily measured andcan there- fore be used as a convenient check that the instrument is performing
correctly. Also, it enables an analyst to calculate the absorbance which will beproduced by a particular concentration of a given element. In practice acalibration graph is derived from measurements of a series of standard solutions.Using the mathematically linear portion of the graph, read off the absorbance 'A'
given by concentration 'C'.
Then: characteristic concentration = C x 0.0044
A
(b) Detection limit
The detection limit is that concentration which can be detected with 95%confidence. This is the concentration which gives an absorbance equal to twicethe standard deviation of a series of measurements at, or near, the blank level.
The practical virtue of the detection limit is that it indicates the concentration atwhich useful measurements can be made. Since the detection limit is theconcentration giving a relative standard deviation of 50%, it is obviously not
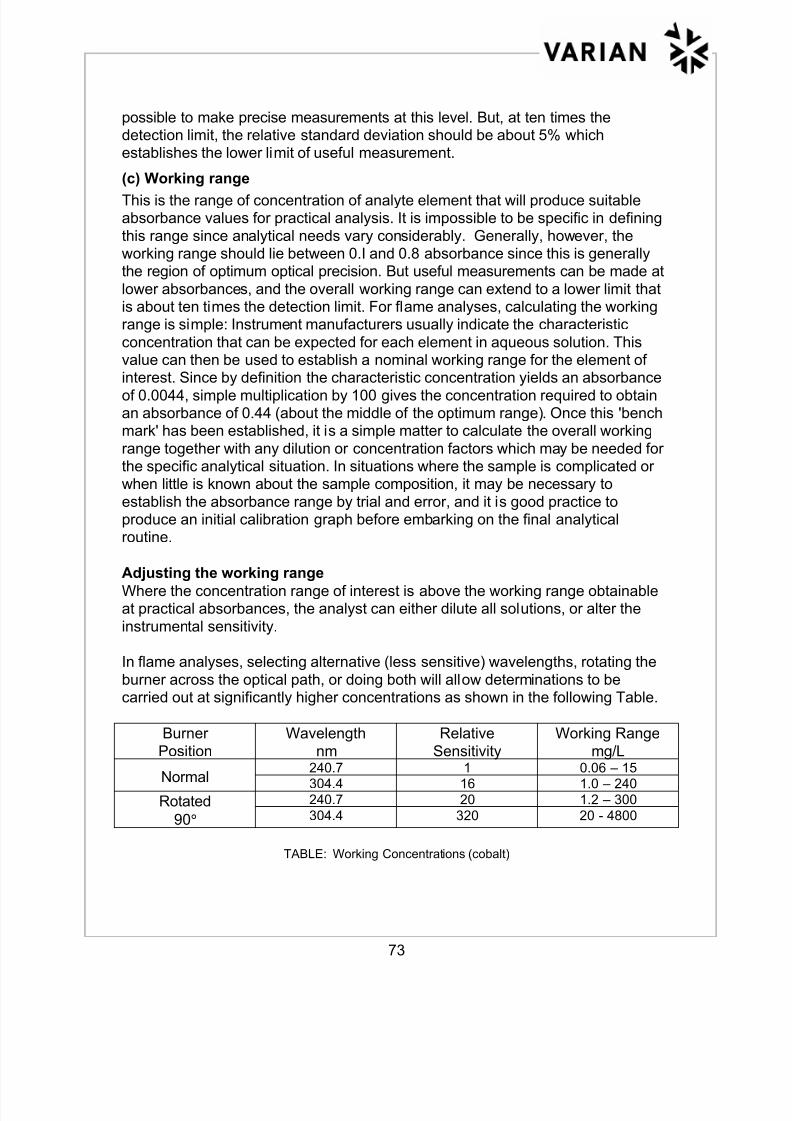
8/12/2019 Absorçãoatomicaftheory Chama
http://slidepdf.com/reader/full/absorcaoatomicaftheory-chama 73/81
73
possible to make precise measurements at this level. But, at ten times thedetection limit, the relative standard deviation should be about 5% whichestablishes the lower limit of useful measurement.
(c) Working range
This is the range of concentration of analyte element that will produce suitableabsorbance values for practical analysis. It is impossible to be specific in defining
this range since analytical needs vary considerably. Generally, however, theworking range should lie between 0.I and 0.8 absorbance since this is generallythe region of optimum optical precision. But useful measurements can be made at
lower absorbances, and the overall working range can extend to a lower limit thatis about ten times the detection limit. For flame analyses, calculating the workingrange is simple: Instrument manufacturers usually indicate the characteristic
concentration that can be expected for each element in aqueous solution. Thisvalue can then be used to establish a nominal working range for the element of
interest. Since by definition the characteristic concentration yields an absorbanceof 0.0044, simple multiplication by 100 gives the concentration required to obtainan absorbance of 0.44 (about the middle of the optimum range). Once this 'benchmark' has been established, it is a simple matter to calculate the overall working
range together with any dilution or concentration factors which may be needed forthe specific analytical situation. In situations where the sample is complicated orwhen little is known about the sample composition, it may be necessary to
establish the absorbance range by trial and error, and it is good practice toproduce an initial calibration graph before embarking on the final analyticalroutine.
Adjusting the working rangeWhere the concentration range of interest is above the working range obtainableat practical absorbances, the analyst can either dilute all solutions, or alter the
instrumental sensitivity.
In flame analyses, selecting alternative (less sensitive) wavelengths, rotating the
burner across the optical path, or doing both will allow determinations to becarried out at significantly higher concentrations as shown in the following Table.
Burner
Position
Wavelength
nm
Relative
Sensitivity
Working Range
mg/L
240.7 1 0.06 – 15Normal 304.4 16 1.0 – 240
240.7 20 1.2 – 300Rotated
90° 304.4 320 20 - 4800
TABLE: Working Concentrations (cobalt)
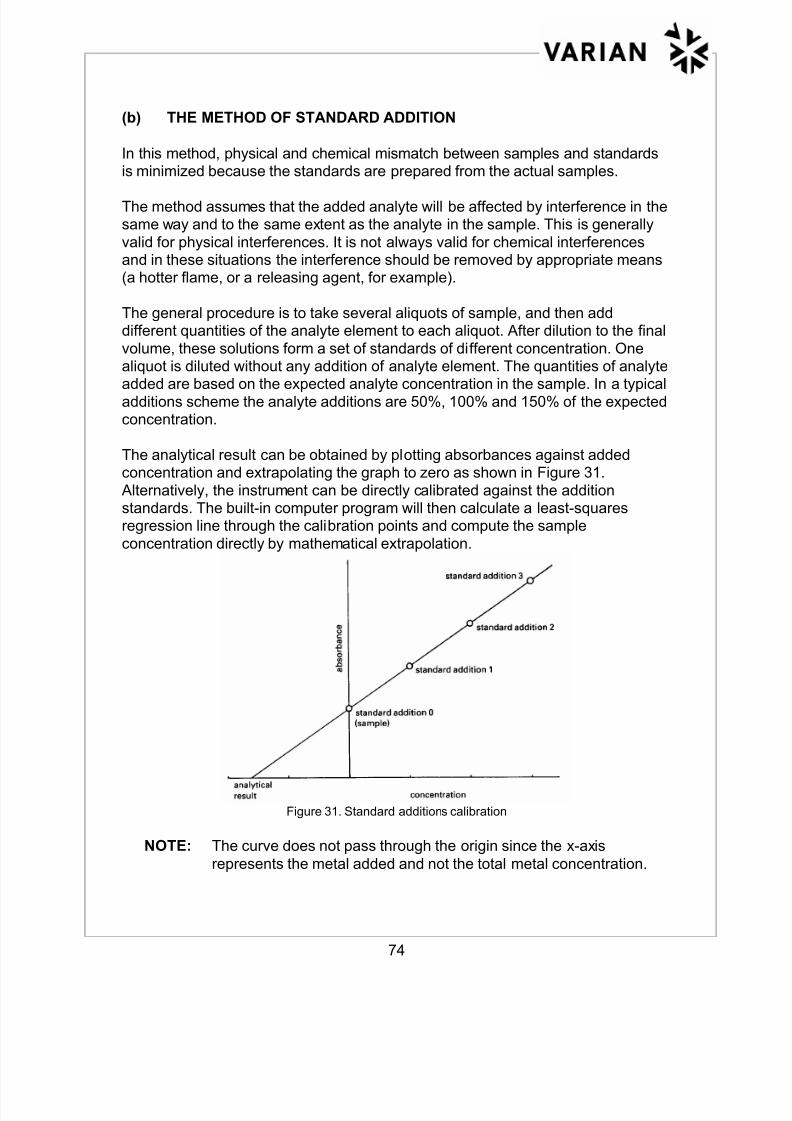
8/12/2019 Absorçãoatomicaftheory Chama
http://slidepdf.com/reader/full/absorcaoatomicaftheory-chama 74/81
74
(b) THE METHOD OF STANDARD ADDITION
In this method, physical and chemical mismatch between samples and standardsis minimized because the standards are prepared from the actual samples.
The method assumes that the added analyte will be affected by interference in thesame way and to the same extent as the analyte in the sample. This is generally
valid for physical interferences. It is not always valid for chemical interferencesand in these situations the interference should be removed by appropriate means(a hotter flame, or a releasing agent, for example).
The general procedure is to take several aliquots of sample, and then adddifferent quantities of the analyte element to each aliquot. After dilution to the final
volume, these solutions form a set of standards of different concentration. Onealiquot is diluted without any addition of analyte element. The quantities of analyte
added are based on the expected analyte concentration in the sample. In a typicaladditions scheme the analyte additions are 50%, 100% and 150% of the expectedconcentration.
The analytical result can be obtained by plotting absorbances against addedconcentration and extrapolating the graph to zero as shown in Figure 31.
Alternatively, the instrument can be directly calibrated against the additionstandards. The built-in computer program will then calculate a least-squaresregression line through the calibration points and compute the sample
concentration directly by mathematical extrapolation.
Figure 31. Standard additions calibration
NOTE: The curve does not pass through the origin since the x-axis
represents the metal added and not the total metal concentration.
8/12/2019 Absorçãoatomicaftheory Chama
http://slidepdf.com/reader/full/absorcaoatomicaftheory-chama 75/81
75
As a general rule, the addition standards must provide substantially linearcalibration since accurate regression cannot be obtained from non-linear
calibration points. It is essential to establish an accurate baseline from the
appropriate reagent blank.
In the most common applications of the standard additions method, each samplemust be analyzed individually against a set of standards which are specific forthat sample. There are some analytical situations in which a batch of samples can
be analyzed against the one set of addition standards, but this is only valid whenall samples in the batch are chemically and physically similar.
ACCURACY AND PRECISION
The accuracy of a determination is a measure of how close the value obtained is
to the "true" value. Unfortunately, the true value of a chemical constituent of asubstance cannot be known absolutely; hence the assessment of accuracy is, to alarge extent, subjective.
It is possible to develop standard reference materials that can be used to give anapproximation of the accuracy of a determination, i.e., a large number of samples
of the desired material are collected and a standardization programme involvingas many as possible different, but suitable, analytical techniques is followed. Thedata is then processed statistically and a set of accepted values generated.
Precision of determinations is a measure of the degree of scatter obtained on
replication of the analysis of the sample. Frequently good precision is mistakenlytaken to indicate good accuracy. In many cases, sampling may account for thegreatest source of error. Sampling procedures seldom receive the same criticalstudy as have methods of analysis; however, a discussion of sampling is beyond
the scope of this course. Thus precision can vary considerably withconcentration, nature of the sample and element determined.
SENSITIVITY AND DETECTION LIMIT
The term sensitivity is used to indicate the slope of the calibration curve at the
stated concentration of the analyte. On the other hand, the detection limit is thatconcentration of an element that gives a signal equal to some multiple, usually
twice, the standard deviation of the noise.
Sensitivity and detection limit for a given element depend on many factors. The
most important are the resonance wavelength chosen, the type of instrument, thetype of atomizer, the choice and adjustments of burner, flame and nebulizer, and
8/12/2019 Absorçãoatomicaftheory Chama
http://slidepdf.com/reader/full/absorcaoatomicaftheory-chama 76/81
76
the type of solvent. In addition, the detection limit is dependent on the nature andamount of dissolved matrix constituents in the solvent.
The concentration range over which the calibration curve is linear, or nearly so, is
not always very large. In general, atomic absorption studies are most used atvery low concentration Ievels to take advantage of the sensitivity of the method.
Measurements at higher concentration can only be made either after dilution ofthe sample or after reduction of sensitivity of measurement.
SAMPLES AND STANDARDS
1. GLASSWARE AND OTHER CONTAINERS
All glass apparatus and containers used in analytical work must be carefully
selected to meet the requirements of its particular use. Although several types of
special-purpose glasses are available, borosilicate thermal-resistant types suchas Pyrex or Kimax, are generally satisfactory for all ordinary laboratory purposes
in water analysis. Borosilicate glass is especially suitable for storage of neutral oracid solutions, for volumetric glassware, and for conducting reactions. Sinceborosilicate glass is not entirely resistant to attack by strongly alkaline solutions,
bottles of polyethylene or Teflon must be used for storage of standard solutions ofsilica, boron and the alkali metals.
All volumetric glassware, such as burettes, pipettes and volumetric flasks, mustbe of borosilicate glass and must contain or deliver volumes within the tolerancesof the method. In addition, if such glassware is frequently used to measure
strongly alkaline solutions it must be recalibrated at regular intervals. Directionsfor such calibration and testing of volumetric glassware are given by the NationalInstitute of Standards (1959) and in standard texts of quantitative analysis.
Evaporations may be carried out in glass, porcelain or platinum dishes. Platinumis preferred if the mass of the residue must be determined accurately, because
the mass of platinum vessels is very constant.
Although platinum is one of the most resistant metals, it is not completely inert
and is subject to embrittlement. The following precautions are recommended:
• Never put solutions containing tin, mercury or lead in a reducing environmentin platinum; if the free metal should be formed it will alloy with the platinum,
especially if heated.
• Do not heat mixtures of hydrochloric acid with oxidizing substances, such asnitrate or manganese dioxide; ferric chloride in hydrochloric acid attacks
platinum appreciably.
8/12/2019 Absorçãoatomicaftheory Chama
http://slidepdf.com/reader/full/absorcaoatomicaftheory-chama 77/81
77
• Place hot platinum vessels on a refractory material never on a cold metalsurface or on a dirty surface.
• Use only clean platinum-tipped tongs to handle hot platinum vessels.
Coarse crystal growth and embrittlement may result from prolonged heating athigh temperatures, heating under reducing conditions, and heating phosphatesor sulphates in the presence of organic compounds. Embrittlement can be
counteracted by rubbing the platinum ware with moistened sea sand. Gentlerubbing with sea sand cold works the metal and breaks down the coarse crystalstructure. Detailed instructions for the care and use of platinum are distributed
by manufacturers of these vessels and are described in textbooks ofquantitative analysis.
2. CHEMICALS AND SOLUTIONS
a) PURITY
Unless indicated to the contrary, all chemicals specified for use in theanalytical procedures shall conform to the specifications of the Committee
on Analytical reagents of the American Chemical Society. Chemicals usedfor primary standards may be obtained from the National Institute ofStandards or from manufacturers marketing chemicals of comparable
purity.
Water used to dilute samples or to prepare chemical solutions shall first be
demineralized by passage through mixed cation-anion exchange resins orby distillation. Its specific conductance at 25°C must not exceed 1.5µmho/cm, and it shall be stored in resistant glass or polyethylene bottles.
Carbon dioxide-free water may be prepared by boil ing and coolingdemineralized water immediately before use. Its pH should be between 6.2and 7.2.
Ammonia-free water may be prepared by passing distilled water through amixed-bed ion-exchange resin.
b) STANDARD SOLUTIONS The concentrations of standard solutions are indicated as the mass of agiven element equivalent to, or contained in, 1 mL of solution. The
strengths of acids and bases are given in terms of molarities.
c) NONSTANDARD SOLUTIONS
8/12/2019 Absorçãoatomicaftheory Chama
http://slidepdf.com/reader/full/absorcaoatomicaftheory-chama 78/81
78
The concentrations of nonstandard solutions are indicated in terms of themass of solute dissolved in a solvent and diluted to a given volume.Unless specifically indicated otherwise, it is understood that the solvent is
demineralized water of required purity. Designation of concentration in
terms of percent is not used.
d) ACCURACY OF MEASUREMENT
Within the methods significant figures are utilized to define the accuracy ofweights and measures. Weighings will be accurate to the last figureshown. For example, a mass designated as 4.532 g must be weighed
accurately to ± 0.0005 g, whereas a mass designated as 4.5 g must beweighed accurately to only ± 0.05 g.
Required accuracy for measurement of volume in the analysis andpreparation of reagents is shown similarly. Standard solutions are always
prepared in and measured from volumetric glassware. The significantfigures given for such measurements are in practical agreement with thetolerance limits for volumetric glassware used.
For example, "Add 2.0 mL of reagent" shows that a volumetric pipette mustbe used for the addition, but add "2 mL" or "add 1.5 mL" shows that a
serological pipette may be used; "dilute to 1000 mL" shows that avolumetric flask is essential, but "dilute to IL" permits the use of agraduated cylinder.
Although pipettes are calibrated to deliver a specific volume at 20
°C, theerror in measurement incurred by pipetting samples at room temperature is
insignificant for water analysis. One gram of pure water is contained in
1.002 mL at 20°C and in 1.007 mL at 38°C; the maximum error in volumethat will result from those temperature differences is only 0.5 percent.
Brine samples should be brought as near to 20°C as possible before
making dilutions for analysis because of density differences.
3. DILUTIONS OF WATER SAMPLES
The concentration of some inorganic constituents in a water sample very often willexceed the working range as recommended in the application section of each
method. For example, sodium in brines will exceed the recommended rangeseveral fold. Dilution is normally used to bring the concentration of any of theseconstituents into the appropriate range. This procedure with proper technique is
satisfactory for dilutions of 1 to 1000. The following techniques must be observed:
8/12/2019 Absorçãoatomicaftheory Chama
http://slidepdf.com/reader/full/absorcaoatomicaftheory-chama 79/81
79
• No more than two sequential dilutions can be made on a sample; for example(1 : 1000), 5.0 mL diluted to 500 mL and then 5.0 mL diluted to 50.0 mL.
• The dilution procedure above is for single pass data only. If more than a 1 to1000 dilution must be made, the sample must be analyzed in triplicate. This
will require making sequential dilutions of the sample in triplicate, andreporting the average of the three determinations.

8/12/2019 Absorçãoatomicaftheory Chama
http://slidepdf.com/reader/full/absorcaoatomicaftheory-chama 80/81
80
CHAPTER 7 AAMAINTENANCE AND SAFETY
For many analysts the routine measurement of metallic elements by AAS is oftenhindered by the instability of their analytical results. This phenomenon usually
manifests itself in high relative standard deviations being obtained. Instrumentalinstability was once strongly associated with poor electronic stability. Thetechnology today has so advanced with "state-of-the-art" electronics that mostcauses of instability can be associated with either a lack of basic maintenance or
poor optimization. This section details some of the important points associatedwith regular maintenance which can be easily carried out by the operator.
BURNER
• soak in dilute soap solution, wash thoroughly with distilled water and dry
completely before use.
• clean the Mark VI and VII burner slots with a cleaning card moistened with"Brasso"
NEBULIZER
• clean regularly. Aspirate the blank solvent (usually distilled water) at the endof each day to thoroughly flush out the nebulizer.
• use only the special wire provided for cleaning capillary (nebulizers areprecision manufactured components).
• use a tantalum venturi for corrosive samples (all Varian nebulizers have Pt/Ircapillaries).
GLASS BEAD
• check surface regularly for cracks or abrasions.
• check the in/out adjustment mechanism moves freely.
DRAIN
• ensure clear plastic tubing is not too long.
• ensure tubing travels downwards and not horizontally along bench.• flush regularly at the end of day.
• ensure that liquid level in waste receptacle is lower than drain tube (this willallow free drainage).
• check liquid drains evenly down drain tube
8/12/2019 Absorçãoatomicaftheory Chama
http://slidepdf.com/reader/full/absorcaoatomicaftheory-chama 81/81