absolute risk reduction, number needed to treat, and back-of-the- envelope cost effectiveness...
Post on 19-Dec-2015
216 views
TRANSCRIPT

Absolute Risk Reduction, Number Needed to Treat, and Back-of-the-
Envelope Cost Effectiveness Analysis
28 October 2004
Michael A. Kohn, MD, MPP
Using Randomized Trials to Quantify the Effects of a
Treatment

Evidence Based Medicine
I. Diagnosis: How to use tests to determine whether a patient has a disease.
II. Treatment: How to determine if a treatment is beneficial in patients with a disease, and if so, whether the benefits outweigh the costs and risks.

Evidence Based Medicine
I. Diagnosis: How to use tests to determine whether a patient has a disease.
II. Treatment: How to determine if a treatment is beneficial in patients with a disease, and if so, whether the benefits outweigh the costs and risks.
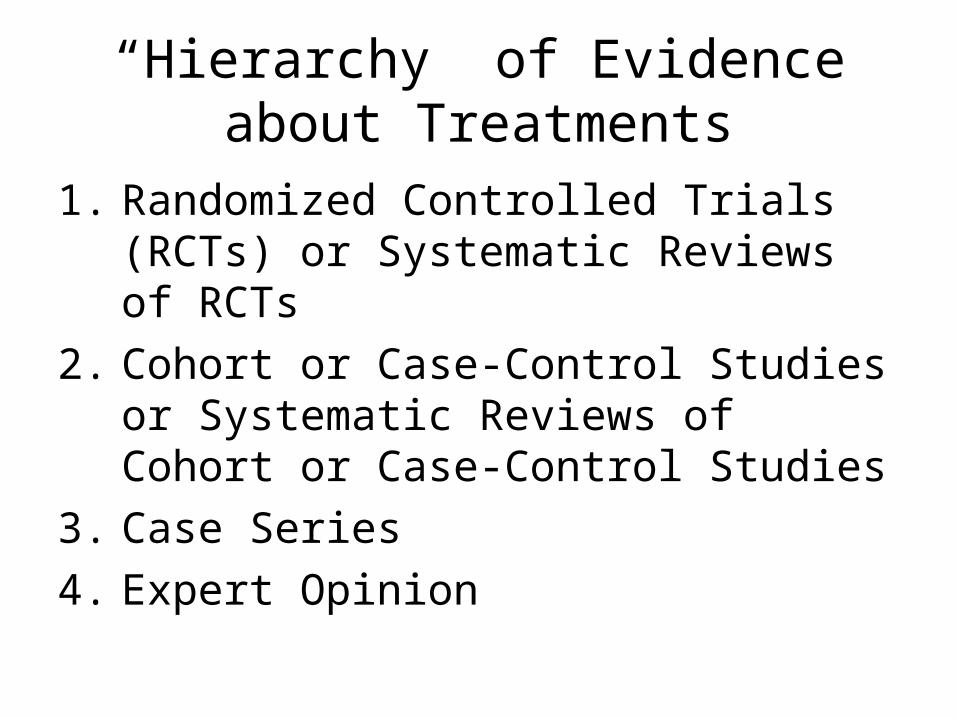
“Hierarchy” of Evidence about Treatments
1. Randomized Controlled Trials (RCTs) or Systematic Reviews of RCTs
2. Cohort or Case-Control Studies or Systematic Reviews of Cohort or Case-Control Studies
3. Case Series
4. Expert Opinion

“Hierarchy” of Evidence About Treatments
1. Randomized Controlled Trials (RCTs) or Systematic Reviews of RCTs
2. Cohort or Case Controls Studies or Systematic Reviews of Cohort or Case Control Studies
3. Case Series
4. Expert Opinion

Quantifying the Benefit of a Treatment: Take Home Points
• RCT Checklist: Importance of patient-oriented effect measures (POEMs), randomization, intention-to-treat analysis, good follow-up, blinding, and between-groups comparisons.
• The Relative Risk or Relative Risk Reduction associated with an intervention is of minimal use* without a baseline prevalence of bad outcomes.
• You need to have an absolute risk reduction to calculate number needed to treat. (NNT = 1/ARR)
• For undesired effects of treatment, calculate the absolute risk increase (ARI), and the number needed to harm (NNH = 1/ARI)
• Back-of-the-envelope CEA: Cost per bad outcome prevented = Treatment Cost x NNT
*Unless the RR is 1 and RRR is 0.

• Patient-Oriented Effect Measures (POEMs) vs. surrogate outcomes
• Randomization to address issues of confounding• Intention-to-treat analysis (once randomized always
analyzed)• Good follow-up to eliminate differential losses to follow-
up• Blinding of patients and clinicians to prevent differential
co-interventions• Blinding of outcome assessors to prevent bias• Between groups rather than within groups comparison• Compare entire randomization groups, not subgroups
*For checklist on study validity, see Chapter 1B1 “Therapy”, in Guyatt and Rennie (eds.), Users Guides to the Medical Literature: A Manual for Evidence-Based Clinical Practice; AMA Press; 2002. (Or try http://www.cche.net/usersguides/therapy.asp#Valid )
RCT Checklist for Study Validity*

RCTs of Orthopedic Treatments1. Kirkley A, Griffin S, Richards C, Miniaci A, Mohtadi N. Prospective
randomized clinical trial comparing the effectiveness of immediate arthroscopic stabilization versus immobilization and rehabilitation in first traumatic anterior dislocations of the shoulder. Arthroscopy. Jul-Aug 1999;15(5):507-514
2. Parker MJ, Khan RJ, Crawford J, Pryor GA. Hemiarthroplasty versus internal fixation for displaced intracapsular hip fractures in the elderly. A randomised trial of 455 patients. J Bone Joint Surg Br. Nov 2002;84(8):1150-1155.
3. Moseley JB, O'Malley K, Petersen NJ, Menke TJ, Brody BA, Kuykendall DH, et al. A controlled trial of arthroscopic surgery for osteoarthritis of the knee. N Engl J Med 2002;347(2):81-88.
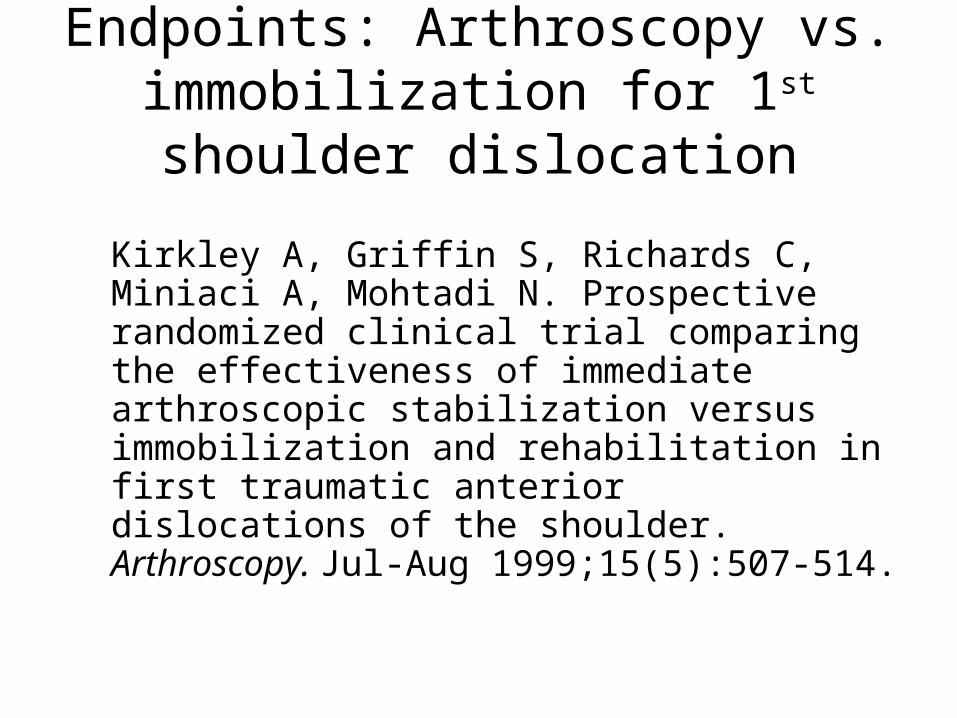
Endpoints: Arthroscopy vs. immobilization for 1st shoulder
dislocation
Kirkley A, Griffin S, Richards C, Miniaci A, Mohtadi N. Prospective randomized clinical trial comparing the effectiveness of immediate arthroscopic stabilization versus immobilization and rehabilitation in first traumatic anterior dislocations of the shoulder. Arthroscopy. Jul-Aug 1999;15(5):507-514.

Outcomes Affected by Treatments*
• Dichotomous (e.g. recurrent dislocation)
• Continuous (e.g. WOSI**)
Endpoints
• Patient relevant (e.g., ability to return to sports)
• Surrogate (e.g., MRI findings)
* Example: Arthroscopy vs. conservative tx for 1st Anterior Shoulder Dislocation (Arthroscopy. 1999 Jul-Aug;15(5):507-14. )**Western Ontario Shoulder Disability Index

Outcomes Affected by Treatments
• Dichotomous (e.g. recurrent dislocation)
• Continuous (e.g. WOSI)
Endpoints
• Patient relevant (e.g., ability to return to sports)
• Surrogate (e.g., MRI findings)

Randomization, Intention-to-Treat Analysis, and Follow-up: Arthroplasty vs. Internal
Fixation?• Pt is a 81-year-old woman with a displaced, intracapsular
femoral neck fracture. • Pt’s son is a physician. He asks about hemiarthroplasty
vs. internal fixation.
Pubmed search Parker MJ, Khan RJ, Crawford J, Pryor GA. Hemiarthroplasty versus internal fixation for displaced intracapsular hip fractures in the elderly. A randomised trial of 455 patients. J Bone Joint Surg Br. Nov 2002;84(8):1150-1155.
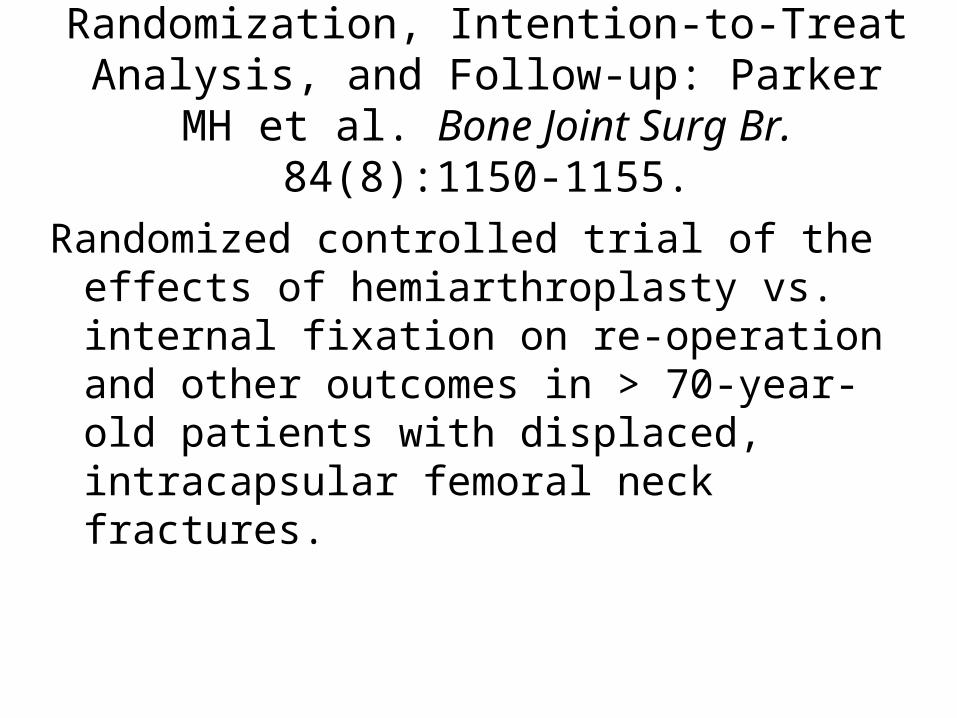
Randomization, Intention-to-Treat Analysis, and Follow-up: Parker MH et al. Bone Joint
Surg Br. 84(8):1150-1155.
Randomized controlled trial of the effects of hemiarthroplasty vs. internal fixation on re-operation and other outcomes in > 70-year-old patients with displaced, intracapsular femoral neck fractures.

Randomization: Parker MH et al. Bone Joint Surg Br. 84(8):1150-1155.
Why do a randomized experiment?
Why not do an observational study comparing mortality, re-operation rates, etc. between hemiarthroplasty patients and internal fixation patients?

Intention-to-Treat: Parker MH et al. Bone Joint Surg Br. 84(8):1150-1155.
Some patients randomized to the hemiarthroplasty group ended up getting internal fixation.
Why not include these patients’ outcomes in the internal fixation group or at least exclude them from the hemiarthroplasty group?

Losses to Follow-Up: Parker MH et al. Bone Joint Surg Br. 84(8):1150-1155.*
If each treatment group had 20% loss to follow-up, there could still be bias.
What if those in the internal fixation group were lost to follow-up because they got better and those in the hemi-arthroplasty group were lost because they died?
*In fact, there were no losses to follow-up in this study.

Blinding
Blinding of Patients
• Addresses placebo effect
Blinding of Patients and Clinicians
• Eliminates differential co-interventions
Blinding of Outcome Assessment
• Eliminates biased outcome assessment
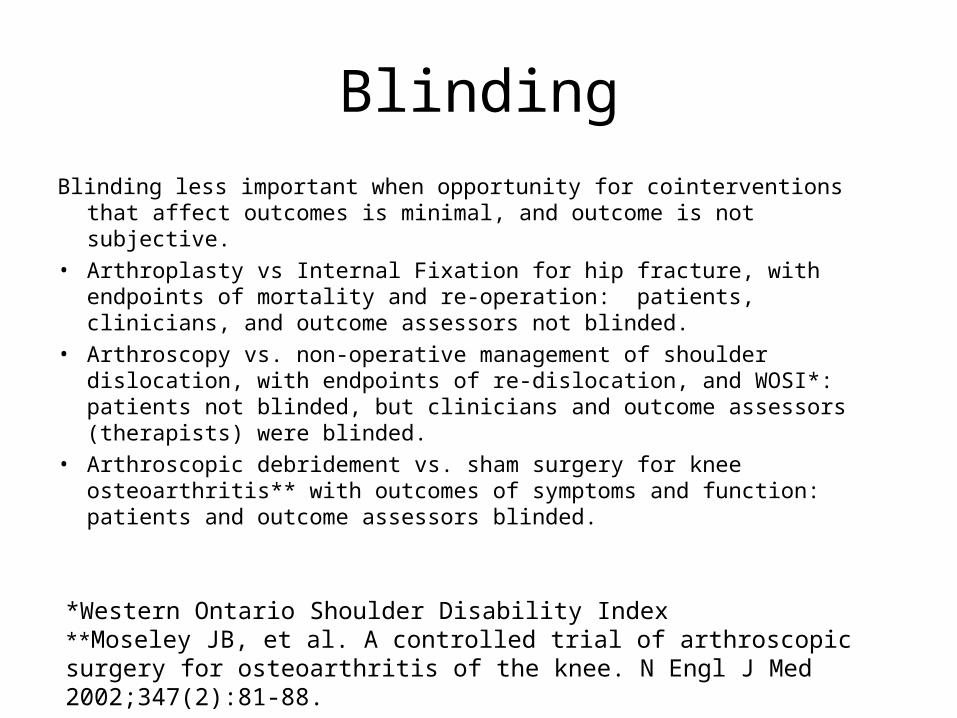
Blinding
Blinding less important when opportunity for cointerventions that affect outcomes is minimal, and outcome is not subjective.
• Arthroplasty vs Internal Fixation for hip fracture, with endpoints of mortality and re-operation: patients, clinicians, and outcome assessors not blinded.
• Arthroscopy vs. non-operative management of shoulder dislocation, with endpoints of re-dislocation, and WOSI*: patients not blinded, but clinicians and outcome assessors (therapists) were blinded.
• Arthroscopic debridement vs. sham surgery for knee osteoarthritis** with outcomes of symptoms and function: patients and outcome assessors blinded.
*Western Ontario Shoulder Disability Index**Moseley JB, et al. A controlled trial of arthroscopic surgery for osteoarthritis of the knee. N Engl J Med 2002;347(2):81-88.
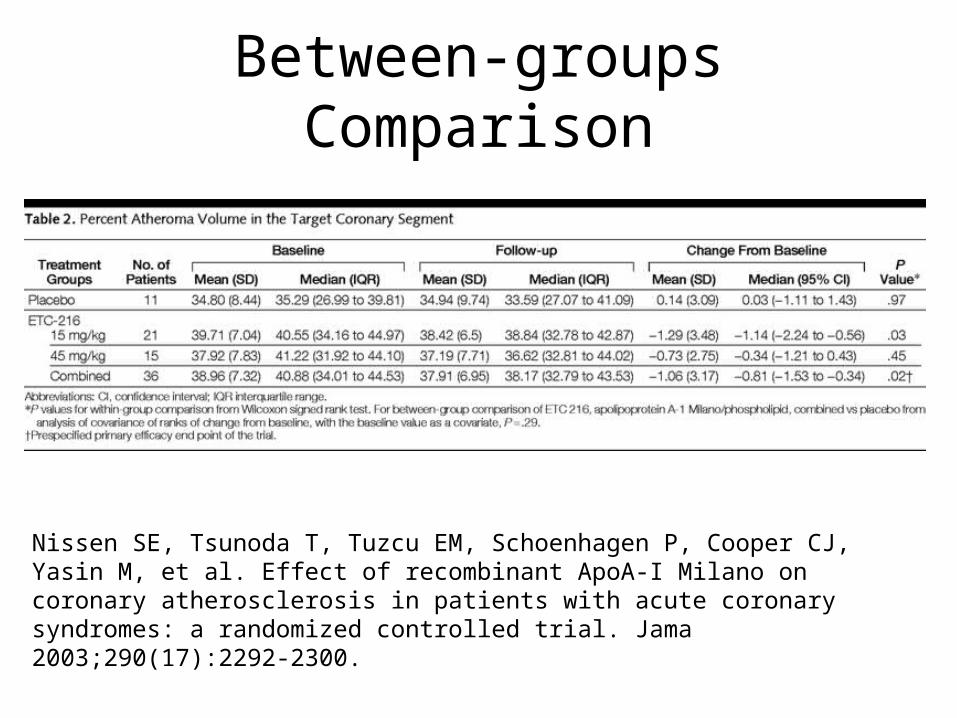
Between-groups Comparison
Nissen SE, Tsunoda T, Tuzcu EM, Schoenhagen P, Cooper CJ, Yasin M, et al. Effect of recombinant ApoA-I Milano on coronary atherosclerosis in patients with acute coronary syndromes: a randomized controlled trial. Jama 2003;290(17):2292-2300.

Sub-group Analysis: ISIS II*
30-day mortality
*Lancet 1988;2(8607):349-360.
Overall Geminis and Libras
Other signs
Aspirin 9.4% 11.1% 9.0%
Placebo 11.8% 10.2% 12.1%

• Patient-Oriented Effect Measures (POEMs) vs. surrogate outcomes
• Randomization to address issues of confounding• Intention-to-treat analysis (once randomized always
analyzed)• Good follow-up to eliminate differential losses to follow-
up• Blinding of patients and clinicians to prevent differential
co-interventions• Blinding of outcome assessors to prevent bias• Between groups rather than within groups comparison• Compare entire randomization groups, not subgroups
*For checklist on study validity, see Chapter 1B1 “Therapy”, in Guyatt and Rennie (eds.), Users Guides to the Medical Literature: A Manual for Evidence-Based Clinical Practice; AMA Press; 2002. (Or try http://www.cche.net/usersguides/therapy.asp#Valid )
DONE: RCT Checklist for Study Validity*

Effect Size
(Dichotomous Outcomes Only)

This study was properly randomized but not blinded, used an intention-to-treat analysis, and had NO losses to follow-up.
Results follow…
Parker MH et al. Bone Joint Surg Br. 84(8):1150-1155.
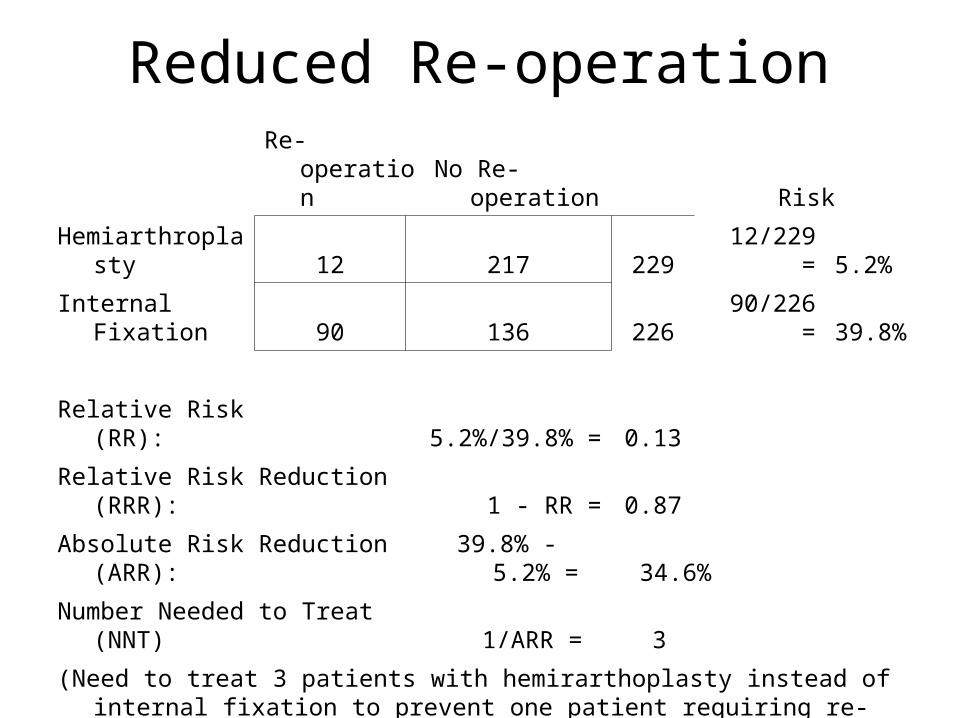
Reduced Re-operation
Re-operation No Re-operation Risk
Hemiarthroplasty 12 217 229 12/229 = 5.2%
Internal Fixation 90 136 226 90/226 = 39.8%
Relative Risk (RR): 5.2%/39.8% = 0.13
Relative Risk Reduction (RRR): 1 - RR = 0.87
Absolute Risk Reduction (ARR):39.8% - 5.2%
= 34.6%
Number Needed to Treat (NNT) 1/ARR = 3
(Need to treat 3 patients with hemirarthoplasty instead of internal fixation to prevent one patient requiring re-operation.)

Measures of Treatment Effect
RR= Relative Risk or Risk Ratio =
RR < 1 tx is associated with decreased risk, as is the usually the case for a primary endpoint. RR>1 means tx is associated with increased risk, as is usually the case for a side effect.
RRR = Relative Risk Reduction = 1-RR
)/(
)/(
dcc
baa
Bad Outcome
No Bad Outcome
Totals
Treatment a b a + b
Control c d c + d
Totals a + c b + d N = a + b + c + d
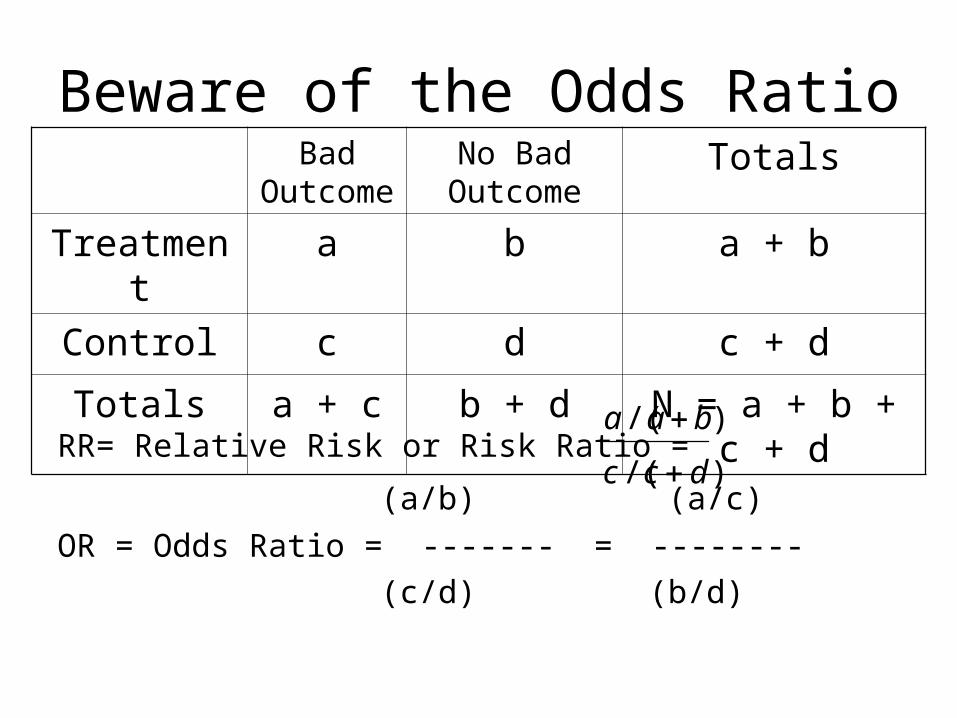
Beware of the Odds Ratio
RR= Relative Risk or Risk Ratio =
(a/b) (a/c)
OR = Odds Ratio = ------- = --------
(c/d) (b/d)
)/(
)/(
dcc
baa
Bad Outcome
No Bad Outcome
Totals
Treatment a b a + b
Control c d c + d
Totals a + c b + d N = a + b + c + d

Measures of Treatment Effect
ARR = Absolute Risk Reduction = c/(c+d) - a/(a+b)
NNT = Number Needed to Treat (to prevent 1 bad outcome) = 1/ARR
Bad Outcome
No Bad Outcome
Totals
Treatment a b a + b
Control c d c + d
Totals a + c b + d N = a + b + c + d
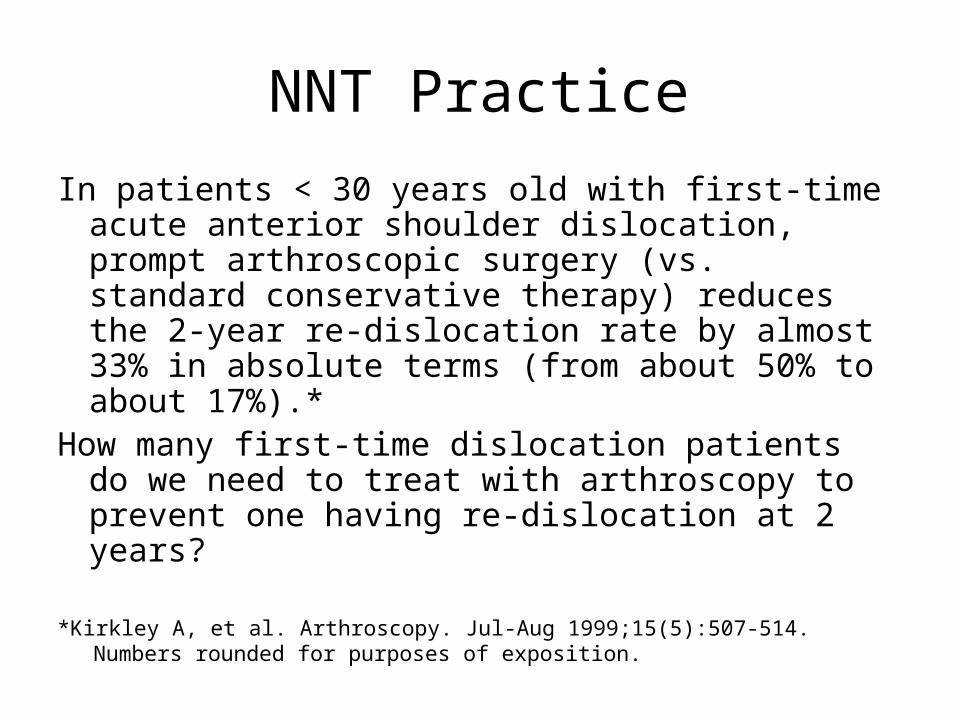
NNT Practice
In patients < 30 years old with first-time acute anterior shoulder dislocation, prompt arthroscopic surgery (vs. standard conservative therapy) reduces the 2-year re-dislocation rate by almost 33% in absolute terms (from about 50% to about 17%).*
How many first-time dislocation patients do we need to treat with arthroscopy to prevent one having re-dislocation at 2 years?
*Kirkley A, et al. Arthroscopy. Jul-Aug 1999;15(5):507-514. Numbers rounded for purposes of exposition.
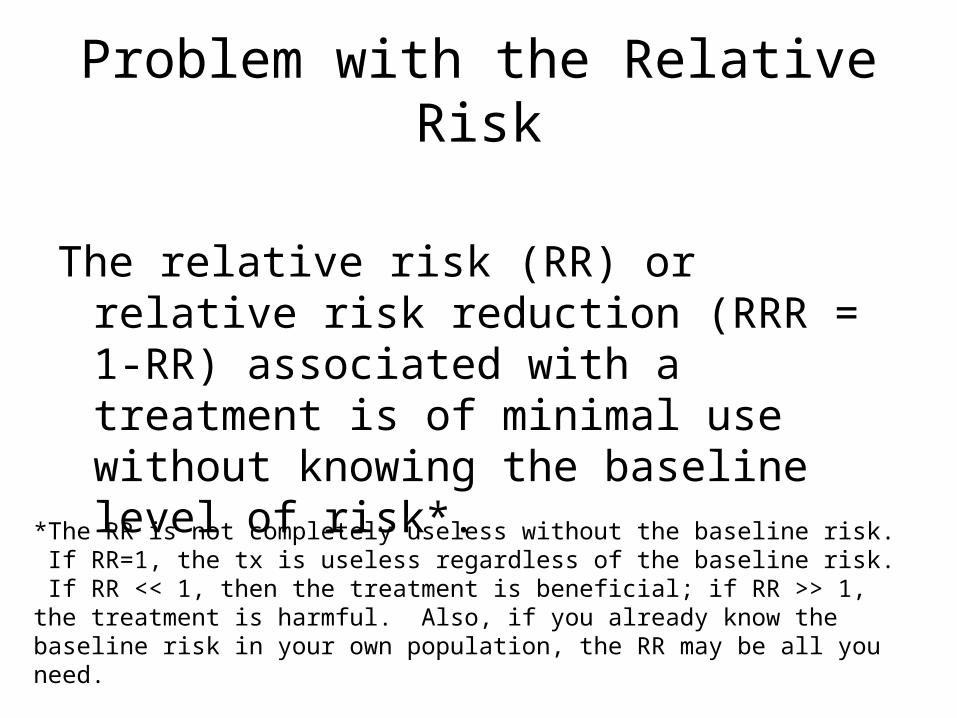
The relative risk (RR) or relative risk reduction (RRR = 1-RR) associated with a treatment is of minimal use without knowing the baseline level of risk*.
Problem with the Relative Risk
*The RR is not completely useless without the baseline risk. If RR=1, the tx is useless regardless of the baseline risk. If RR << 1, then the treatment is beneficial; if RR >> 1, the treatment is harmful. Also, if you already know the baseline risk in your own population, the RR may be all you need.

The selective estrogen receptor modulator raloxifene (Evista®) at a dose of 60 mg /d for 3 years reduces vertebral fracture risk by 33% in women with osteoporosis.*
How many women with osteoporosis do we need to treat with raloxifene to prevent a vertebral fracture?
Problem with the Relative Risk
*JAMA. 1999 Aug 18;282(7):637-45. Numbers rounded for exposition.

The selective estrogen receptor modulator raloxifene (Evista®) at a dose of 60 mg /d for 3 years reduces vertebral fracture risk by 33% in women with osteoporosis.
Baseline 3-year risk of vertebral fracture = 10%
How many women with osteoporosis do we need to treat with raloxifene to prevent a vertebral fracture?
Problem with the Relative RiskNeed Baseline Risk
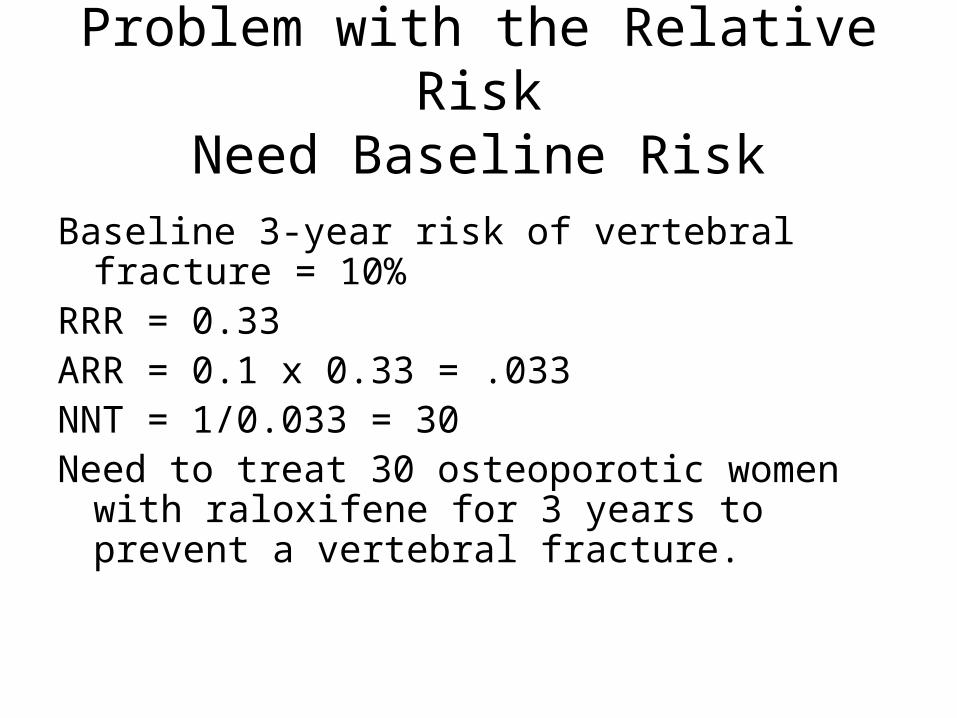
Baseline 3-year risk of vertebral fracture = 10%RRR = 0.33ARR = 0.1 x 0.33 = .033NNT = 1/0.033 = 30Need to treat 30 osteoporotic women with
raloxifene for 3 years to prevent a vertebral fracture.
Problem with the Relative RiskNeed Baseline Risk

Prophylactic Oseltamivir: Index Case Flu+*
Household Contacts
Flu No Flu Risk
Oseltamivir 3 206 209 3/209 = 1.4%
Placebo 26 180 206 26/206 = 12.6%
29 386 415
Relative Risk (RR): 1.4%/12.6% = 0.11
Relative Risk Reduction (RRR): 1 - RR = 0.89
Absolute Risk Reduction (ARR): 12.6% - 1.4% = 11.2%
Number Needed to Treat (NNT) 1/ARR = 9
*Welliver R et al. Effectiveness of Oseltamivir in Preventing Influenza in Household Contacts: A Randomized Controlled Trial. JAMA 2001; 285:748-754.

Prophylactic oseltamivir works if the index case has the flu, but you don’t know whether she does. You know that 45% of similar patients have laboratory proven influenza.
Probability of Flu + = 45%

NNT is calculated for patients with a particular condition “D”.
P = probability of that condition “D” in your patients
Your NNT* = NNT / P
Note that NNT* goes up as P = probability of condition “D” goes down.
Patient May Not Have The Condition That You’re Treating
*Assumes that treatment for patients without condition D has no value. (For D- patients, ARR = 0, NNT = ∞)

NNT if index case flu + = 9.
Probability of flu = 0.45
NNT* = 9 / 0.45 = 20
Probability of Flu + = 45%
*Assumes that treatment when index case is flu - has no value (ARR = 0, NNT = ∞)

Number Needed to HarmTransfusion No Transfusion
Hemiarthroplasty 44 179 223 44/223 = 19.7%
Internal Fixation 4 219 223 4/223 = 1.8%
Relative Risk (RR): 19.7%/1.8% = 11.00
Absolute Risk Increase (ARI): 19.7% - 1.8% = 17.9%
Number Needed to Harm (NNH) 1/ARI = 6
(Need to treat 6 patients with hemirarthoplasty instead of internal fixation to cause one patient requiring transfusion.)

Number Needed to Harm
Not an apt term for number needed to treat to cause one bad outcome.
Would prefer NNTc (“Number Needed to Treat to cause”) vs. NNTp (“Number Needed to Treat to prevent”), but NNH is well established.

Ratio of Undesired to Desired Effects
“Harms” / Bad Outcome Prevented =
ARI/ARR =
NNT/NNH
Or
Bad Outcomes Prevented / Harm Caused =
ARR/ARI =
NNH/NNT

Ratio of Desired to Undesired Effects
Bad Outcomes Prevented / Harm Caused = ARR/ARI = NNH/NNT
Arthroplasty vs. Internal Fixation for Hip FxNNT to prevent one re-operation: 3NNH to cause one transfusion: 6Re-operations prevented/Transfusion
Caused = 6/3 = 2

Number Needed To HarmNausea No Nausea Risk
Oseltamivir 27 467 494 27/467 = 5.5%
Placebo 12 449 461 12/449 = 2.6%
Relative Risk (RR): 5.5%/2.6% = 2.1
Absolute Risk Increase (ARI): 5.5% - 2.6% = 2.9%
Number Needed to Harm (NNH): 1/ARI = 35
NNH is really number needed to treat to cause one undesired effect.

Ratio of Undesired to Desired Effects
Cases of Nausea / Flu Case Prevented =
2.9%/ 11% =
9 / 35 ≈ 0.25
Or
Flu Cases Prevented / Nausea Caused =
11%/2.9% =
35/9 ≈ 4
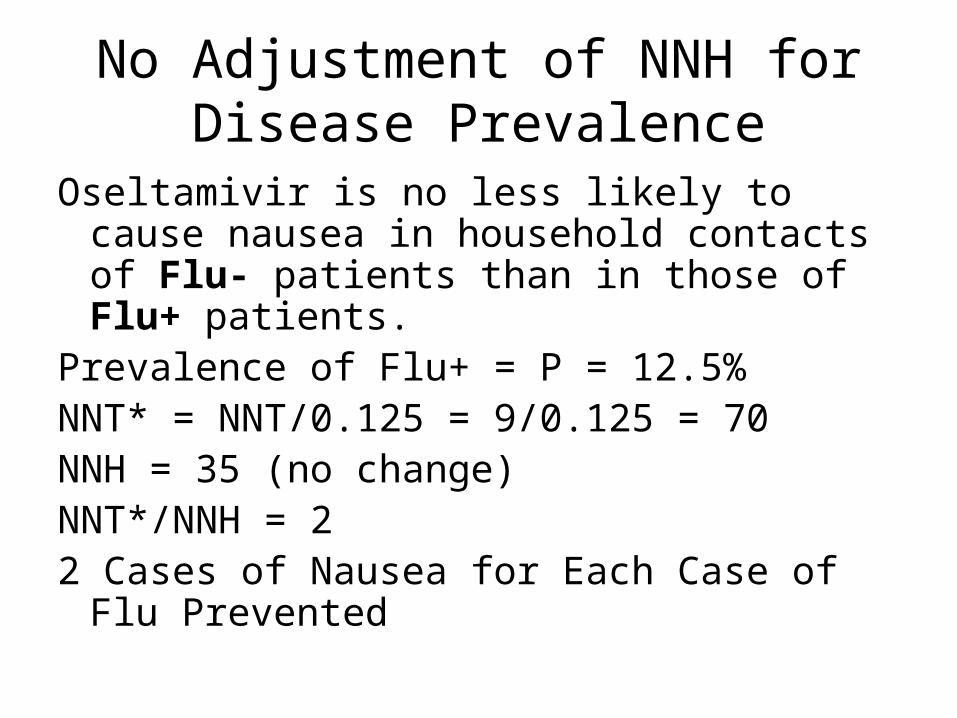
No Adjustment of NNH for Disease Prevalence
Oseltamivir is no less likely to cause nausea in household contacts of Flu- patients than in those of Flu+ patients.
Prevalence of Flu+ = P = 12.5%NNT* = NNT/0.125 = 9/0.125 = 70NNH = 35 (no change)NNT*/NNH = 22 Cases of Nausea for Each Case of Flu
Prevented

No Adjustment of NNH for Disease Prevalence?
Long-term aspirin tx for primary prevention of MI
Assuming baseline risks are 1%/yr for MI, 0.03%/year for hemorrhagic CVAAnd RR’s are 0.76 for MI and 2.0 for hemorrhagic CVA
Risk of: Aspirin Placebo DifferenceNNT
MI 0.0076 0.01 -0.0024 417
Hemorrhagic CVA 0.0006 0.0003 0.0003 3333
Ratio of the rate differences = (0.0024/0.0003) = 3333/417 = 8
“For every 8 heart attacks prevented by aspirin, it causes 1 hemorrhagic stroke”

No Adjustment of NNH for Disease Prevalence?
Long-term aspirin for primary prevention of MI
Sensitivity to changes in the baseline risk of MI:
Baseline risk of MI:Ratio of MI prevented/CVA caused1%/year 82%/year 160.1%/year 0.8 (or, 1.25 strokes/MI)
But, this assumes that the risk of stroke is independent of the risk of MI. Aren’t both the result of vascular disease?
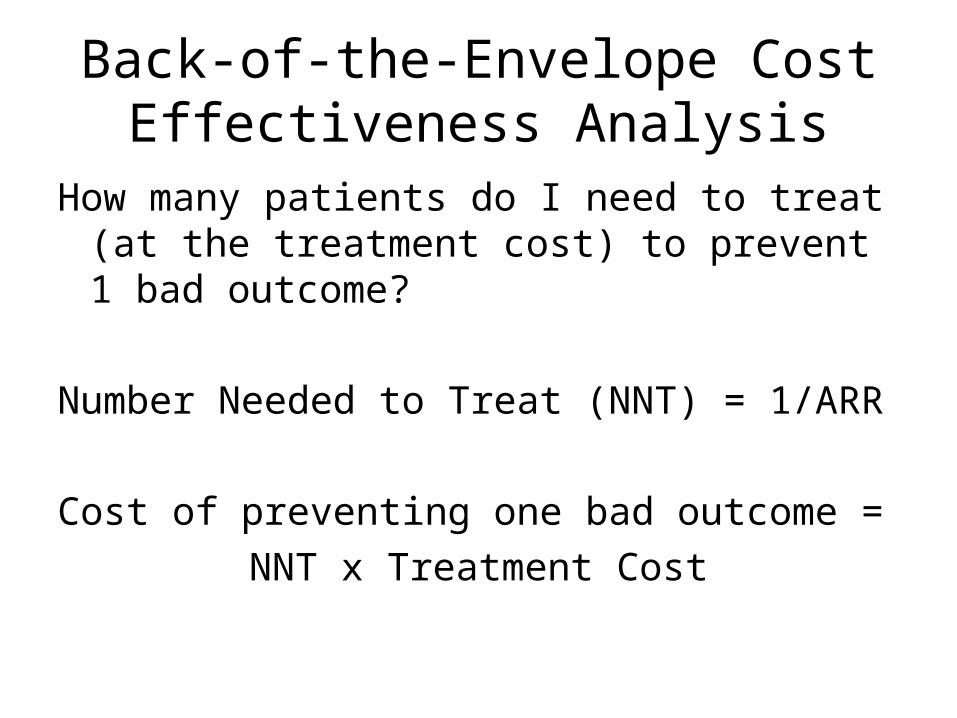
Back-of-the-Envelope Cost Effectiveness Analysis
How many patients do I need to treat (at the treatment cost) to prevent 1 bad outcome?
Number Needed to Treat (NNT) = 1/ARR
Cost of preventing one bad outcome =
NNT x Treatment Cost

BOTE CEA: Oseltamivir
Index Case Flu +• NNT = 9 (Treat 9 household contacts, prevent 1
flu case)• NNT x Treatment Cost* = 9 x $35 = $315/flu
case prevented
45% Prob Flu+• NNT* = 9/0.45 = 20• NNT* x Treatment Cost = 20 x $35 = $700/flu
case prevented
* Cost of Tamiflu 75 mg #10 = $59.99 www.drugstore.com 3/4/2004
BOTE CEA Example
Raloxifene vs. placebo in women with osteoporosis

Raloxifene vs. Placebo
Raloxifene (Evista®) 60 mg/d x 30 d = $80
36 months of treatment = 36 x $80 = $2880
Need to treat 30 patients to prevent 1 fx
30 x $2880 ≈ $82,000 per vertebral fx prevented.

BOTE CEA Example
Letrozole (Femara®) to prevent breast cancer recurrence after 5 years of tamoxifen therapy.

Drug cuts risk of breast-cancer relapse
Findings so promising, study halted so scientists could release news
By Sabin RussellChronicle Medical Writer
Front Page, San Francisco Chronicle 10/10/03
RCT of Letrozole (Femara®), after tamoxifen, to prevent breast cancer recurrence

RRR or ARR?
“The trial was interrupted almost 2½ years after it began. Researchers had scheduled a midpoint peak at the data, and found letrozole was apparently working far better than expected. The women who took it had 43 percent fewer recurrences of their breast cancer compared to those assigned in the study to take a placebo, or dummy pill.”

Femara Trial Results
Recurrence No Recurrence
Letrozole 61 2514 2575
Placebo 106 2476 2582
Risk(Letrozole) = 61/2575 = 2.4%Risk(Placebo) = 106/2582 = 4.1%
N Engl J Med. 2003 Nov 6;349(19):1793-802.

Femara Trial Results
ARR = 4.1% - 2.4% = 1.7%
NNT = 59
Treatment Cost = $252/month* x 12 months/year x 2.4 years = $7260
Cost per Recurrence Prevented =
$7260 x 59 = $428,000
*2.5mg tablets are available from the International Pharmacy for $252/30 day supply (30 tablets)
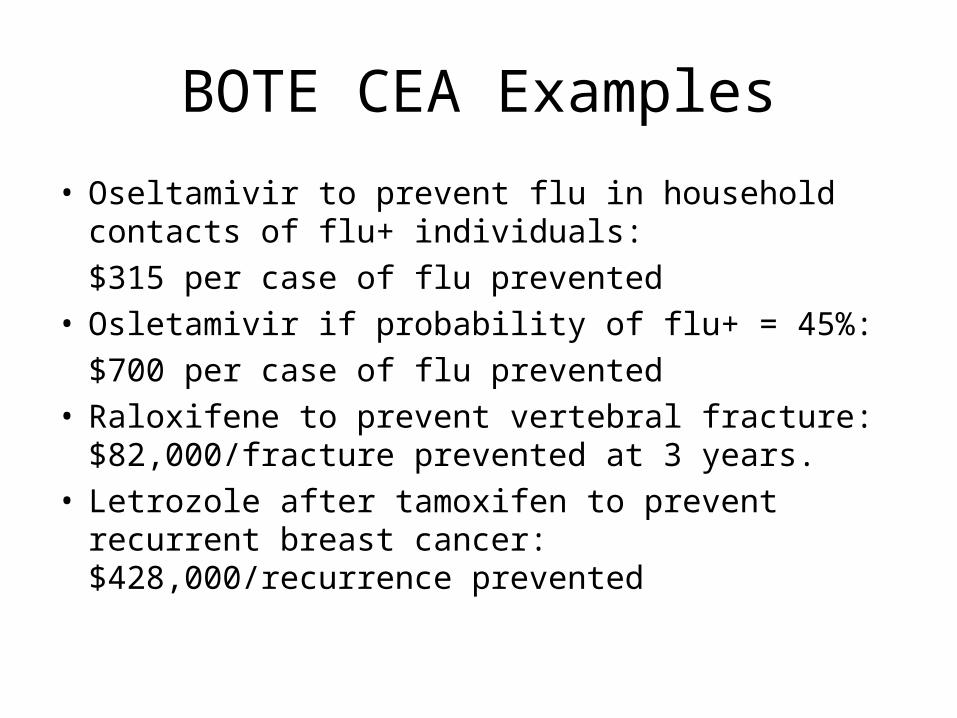
BOTE CEA Examples
• Oseltamivir to prevent flu in household contacts of flu+ individuals:
$315 per case of flu prevented• Osletamivir if probability of flu+ = 45%:
$700 per case of flu prevented• Raloxifene to prevent vertebral fracture:
$82,000/fracture prevented at 3 years.• Letrozole after tamoxifen to prevent recurrent
breast cancer: $428,000/recurrence prevented

BOTE vs. “Real” CEA
Estimates treatment costs per bad outcome prevented – including the bad outcome’s costs
Treatment Costs---------------------------------------------------Bad Outcome + Bad Outcome’s Costs
“Real” Cost Effectiveness Analysis:
Treatment Costs – Bad Outcome’s Costs-------------------------------------------------------
Bad Outcome

BOTE vs. “Real” CEABack of the envelope:
Treatment Costs---------------------------------------------------Bad Outcome + Bad Outcome’s Costs
“Real”:
Treatment Costs – Bad Outcome’s Costs-------------------------------------------------------
Bad Outcome
Note that “real” analysis LOWERS the cost per bad outcome prevented and makes treatment look better.

Quantifying the Benefit* of a Treatment: Take Home Points
• The Relative Risk or Relative Risk Reduction associated with an intervention is of minimal use without a baseline prevalence of bad outcomes.
• You need to have an absolute risk reduction to calculate number needed to treat. (NNT = 1/ARR)
• For undesired effects of treatment, calculate the absolute risk increase (ARI), and the number needed to harm (NNH = 1/ARI)
• Back-of-the-envelope CEA: Cost per bad outcome prevented = Treatment Cost x NNT
*With regard to dichotomous outcomes