absence minded, absence and labour turnover 2006, … and labour turnover... · absence and labour...
TRANSCRIPT
Absence mindedAbsence and labour turnover 2006
For further copies of this report, please go to: www.cbi.org.uk/bookshop
Copyright © CBI 2006.
The content may not be copied, distributed, reported or dealt with in whole or in part without prior consent of the CBI.
May 2006
ISBN 0 85201 629 8
£40.00
cover image: Getty Images
For a copy of this report in a large text format,
please contact Jonathan Hale
T: +44 (0)20 7395 8293
E: [email protected]. uk

Absence mindedAbsence and labour turnover 2006
For AXA:
DUDLEY LUSTEDHead of Corporate Healthcare DevelopmentAXA PPP healthcareUnion House, Eridge RoadTunbridge WellsKent TN4 8HF
T: 01892 508945F: 01892 510102E: [email protected]
AXA is a world leader in financial protection and wealth management. Its UK healthcare arm, AXA PPP healthcare, is one of Britain’s leading medical insurers and today helps employers to develop and introduce strategies to manage health at work through health audits, health screening and workplace health surveillance, medical and dental cover (in conjunction with its sister company, Denplan), and occupational health, attendance management and employee support services. For more information please visit www.axappphealthcare.co.uk.
For the CBI:
jonaThan haLE Policy adviser CBI Centre Point 103 New Oxford Street London WC1A 1DU
T: 020 7395 8293 F: 020 7240 8287E: [email protected]
If you have any questions or comments on the report please contact:
absence and labour turnover 2006
Foreword 4
Overview 5
Section 1: Survey respondents 7
Section 2: Time lost through absence stands at 6.6 days 9 per employee
Section 3: Absence costs increased to over £13bn 14
Section 4: Long-term absence accounts for over a third 16 of working time lost
Section 5: Absence levels are lowest where HR managers 21 take responsibility
Section 6: Labour turnover remains stable 26
Absence and labour turnover questionnaire 2006 29
Contents
�
absence and labour turnover 2006
The 2006 CBI/AXA Absence and Labour Turnover Survey is in its nineteenth consecutive year providing the most authoritative long-term data on absence and labour turnover trends in the UK.
It’s good news that average absence across the UK economy is continuing to fall but overall absence rates do not give the complete picture. Absence in 2005 stood at 6.6 days per employee and cost over £13bn in 2005 – so there’s no room for complacency. We need renewed effort to close the persist-ent gap between the best and the worst performing organisa-tions – nearly nine days this year. If the worst performing employers could reduce absence to the levels of the best, absence costs could fall by as much as £5.4bn.
The public sector was, again, the sector with the highest absence – 8.5 days lost per employee – 2.5 days more than the private sector average. At the current rate of progress the public sector would take over 30 years to reach current levels of absence in the private sector! Most worrying is that just 6% of absence cases were long term – but this represented over half of the time lost. The public sector must face up to the challenge of tackling long-term absence and ensure that employees return to the workplace when they are able.
�
All employers should look to benchmark their perform-ance against others in the same sector and of a similar size. Our survey shows that the route to successful absence management is clear. Commitment from the top is essential – where senior management take responsibility absence falls by almost one day and where HR managers have primary responsibility for absence management, nearly two fewer days are lost compared with where line managers have respon-sibility. A combination of carrot and stick is most effective. Policies which also have a significant impact on absence levels include private medical insurance which can reduce absence by up to two days and waiting days before paying occupational sick pay can reduce absence by up to one day when used.
The vast majority of absence is genuine and long-term – and so early intervention and providing medical treatment is the best remedy. However, absenteeism or ‘pulling a ‘sickie’ remains an issue – employers believe over 10% of all absence is not due to genuine illness – costing the UK economy £1.2bn. To reduce absence even further we need to cut down on absenteeism while offering support to those employees who are genuinely ill – this is what good absence manage-ment is all about. Susan Anderson, Director of Human Resources Policy
Foreword
In 2005 time lost to absence stood at 6.6 daysIn 2005 absence fell to an average of 6.6 days per employee – 3.1% of working time. This is the lowest level since our sur-vey began. Across the UK economy, 161 million working days were lost in 2005. The best performing organisations lost an average of 2.6 days per employee – nearly nine days less than the worst performing organisations which lost an average of 11.4 days to absence.
Manual employees had higher rates of absence (8.2 days com-pared to 5.7 days for non-manual employees), as did larger organisations (over three days more than in the smallest) The public sector had the highest rate of absence (8.5 days per employee), followed by transport & communication (8.4 days) and utilities (8.2 days). Our survey consistently finds that organisations recognising trade unions have higher levels of absence. Organisations that recognised a trade union had two days more absence than those organisations that did not – 7.6 days compared with 5.5 days. In unionised public sector organisations, absence was nearly three days higher than where unions were not recognised.
Public sector has the highest levels of absenceIn 2005 public sector employees were absent for an average of 8.5 days – 2.5 days more than the private sector average. In every size of organisation – other than the very smallest – absence was higher irrespective of employer size. The pro-portion of time lost to long-term absence is also higher in the public sector – 6% of absence cases are long-term but they account for 51% of the total working time lost (compared to 5% and 33% in the private sector). Organisations in the public sector typically took action after ten days of absence – three days more than the best performing.
Absence costs UK employers over £13bn per yearThe direct cost of absence – based on salary costs of absent individuals, replacement costs and lost service or production time – was £531 per employee. Across the UK economy this means absence cost UK employers £13.2bn in 2005. Absence costs were higher in larger organisations and particular sectors – the highest costs were found in IT/hi-tech services
(£1,080 per employee), transport & communication (£843) and utilities (£785).
Most organisations do not measure indirect costs – but where they do they calculate absence costs an additional £584 per employee. This is the cost arising from lower customer satisfaction, poorer customer service and efforts to prevent absence. Across the whole of the UK economy the total cost of absence would top £27bn.
Genuine sickness causes the majority of absence Employers believe the vast majority of absence is caused by genuine illness, with minor illnesses being the most com-mon. But employers believe around 13% of all absence is not due to genuine sickness. Taking sickness leave and pay as an entitlement is the second most frequent cause of absence after minor illness. Nearly three quarters (73%) of employers can demonstrate that unauthorised weekend extensions are prevalent and six in ten demonstrate that unauthorised exten-sions are taken to holidays.
Commitment from the top is essentialCommitment from senior management and putting the right policies in place is key. Where senior management take responsibility absence falls by almost a day. Where HR managers have primary responsibility for absence manage-ment nearly two fewer days are lost than where line managers have primary responsibility. In sectors where a large number of line managers take primary responsibility for absence, absence rates tend to be higher.
The sectors with the most generous sick pay provision also had the highest levels of absence (public sector, utilities and transport & communications). But it is not about generosity, it is about having the right policies in place. Banking, finance & insurance and service employers had generous provisions for sick pay but over two days fewer absence.
Employers typically take action when an individual is absent after three spells or after ten days of absence. Eighty-four percent of employers have rehabilitation policies in place – flexible working, counselling and training programmes are the most popular. Almost three-quarters of organisations have a stress management policy.
�
absence and labour turnover 2006
Overview
absence and labour turnover 2006
The most effective policies were the provision of private medical insurance (1.7 days less absence for manual employ-ees and 0.7 days for non-manual employees, waiting days before paying occupational sick pay (0.8 days less for manual employees and 0.4 days for non-manual employees) and attendance bonuses (0.4 days less for manual workers, 0.3 days for non-manual workers).
Turnover remains stableLabour turnover fell slightly in 2005 to 15.4%. The high-est turnover was found in retailing & distribution, hotels & restaurants (22%) and the lowest in manufacturing (13%). Most employers were satisfied with their turnover rates but nearly a quarter (24%) thought they were too high and one in ten (10%) thought they were low. Job security fell overall in 2005 – 12% thought it had increased compared to 21% who thought it had fallen. This was more marked in the public sector where 6% thought job security had increased com-pared with 23% who thought it had fallen.
�
�
absence and labour turnover 2006
The survey covers a representative sample The CBI/AXA absence and labour turnover survey is now in its nineteenth year and is the definitive source of up-to-date information and unique trend data on absence and labour turnover in the UK.
This survey was conducted during January and February 2006 for the period January to December 2005. The survey questionnaire was sent to senior managers and HR practi-tioners in more than 10,000 private sector companies and public sector organisations. The organisations responding to this year’s survey employ a total of 1.4 million employees.1
The respondents to the survey provide a representative sample of the UK workforce when measured by region, sector and size of organisation.
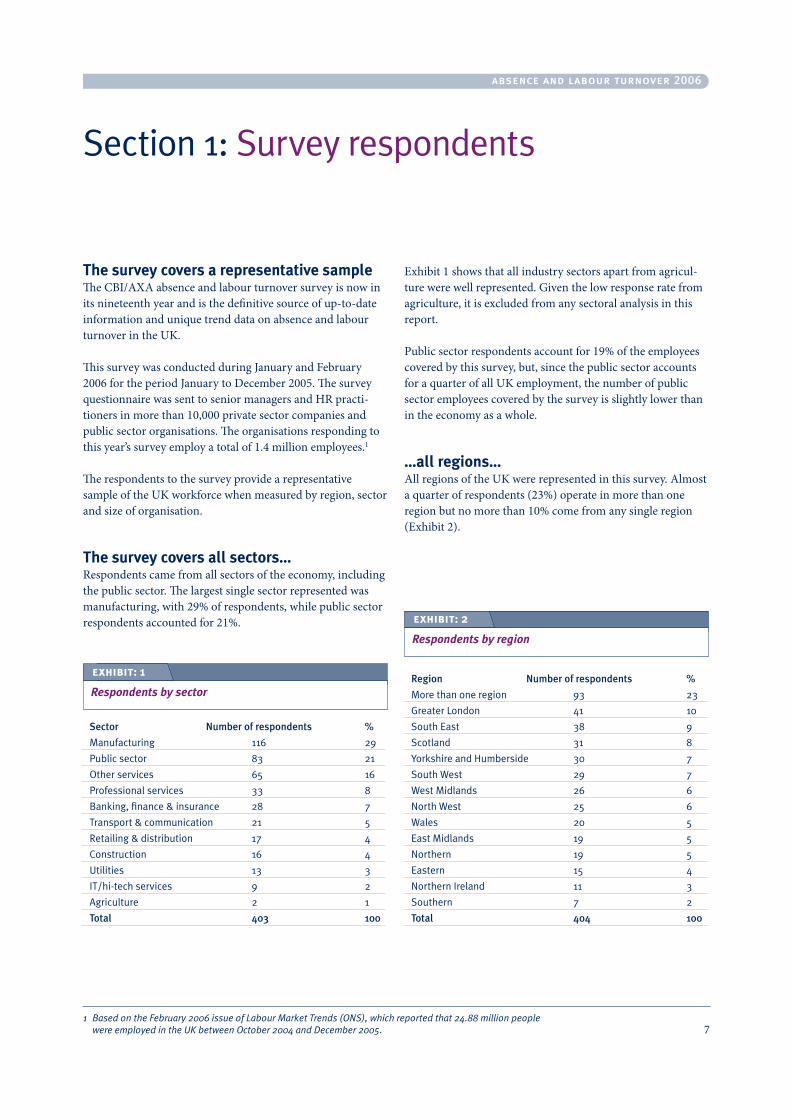
The survey covers all sectors…Respondents came from all sectors of the economy, including the public sector. The largest single sector represented was manufacturing, with 29% of respondents, while public sector respondents accounted for 21%.
Exhibit 1 shows that all industry sectors apart from agricul-ture were well represented. Given the low response rate from agriculture, it is excluded from any sectoral analysis in this report.
Public sector respondents account for 19% of the employees covered by this survey, but, since the public sector accounts for a quarter of all UK employment, the number of public sector employees covered by the survey is slightly lower than in the economy as a whole.
…all regions…All regions of the UK were represented in this survey. Almost a quarter of respondents (23%) operate in more than one region but no more than 10% come from any single region (Exhibit 2).
1 Based on the February 2006 issue of Labour Market Trends (ONS), which reported that 24.88 million people were employed in the UK between October 2004 and December 2005.
Sector Numberofrespondents %
Manufacturing 116 29
Public sector 83 21
Other services 65 16
Professional services 33 8
Banking, finance & insurance 28 7
Transport & communication 21 5
Retailing & distribution 17 4
Construction 16 4
Utilities 13 3
IT/hi-tech services 9 2
Agriculture 2 1
Total 403 100
exhibit: 1
Respondents by sectorRegion Numberofrespondents %
More than one region 93 23
Greater London 41 10
South East 38 9
Scotland 31 8
Yorkshire and Humberside 30 7
South West 29 7
West Midlands 26 6
North West 25 6
Wales 20 5
East Midlands 19 5
Northern 19 5
Eastern 15 4
Northern Ireland 11 3
Southern 7 2
Total 404 100
exhibit: 2
Respondents by region
Section 1: Survey respondents
absence and labour turnover 2006
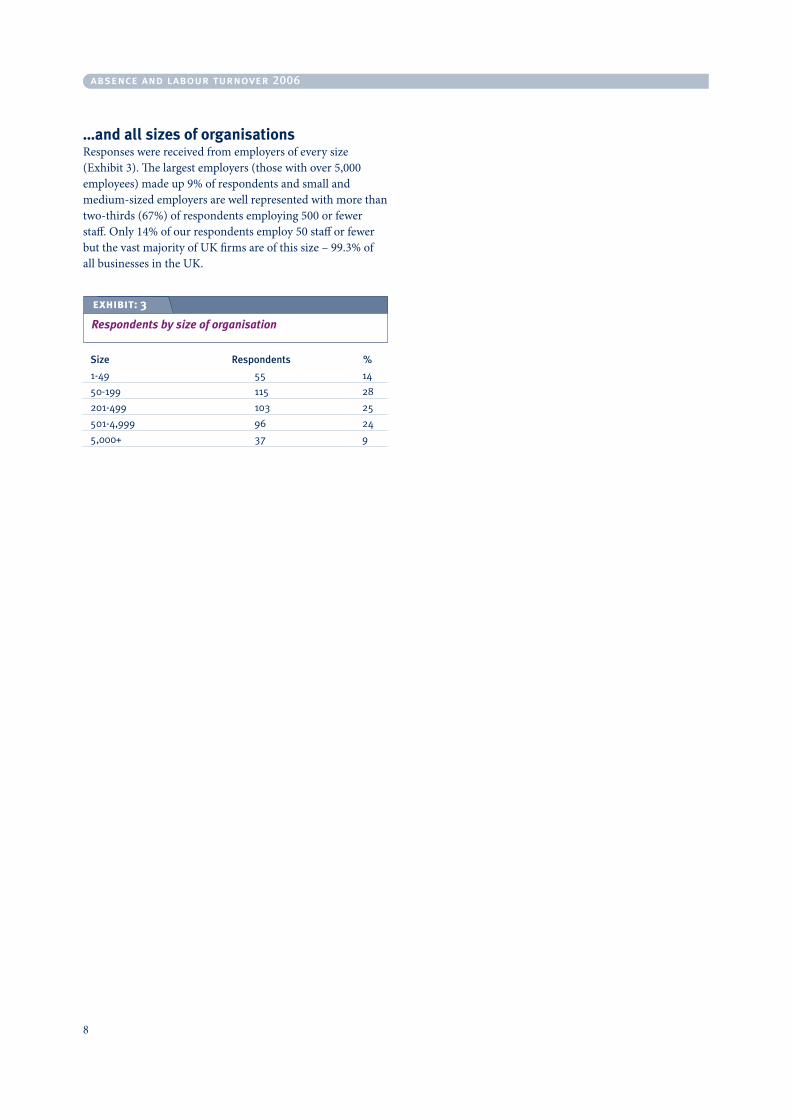
…and all sizes of organisationsResponses were received from employers of every size (Exhibit 3). The largest employers (those with over 5,000 employees) made up 9% of respondents and small and medium-sized employers are well represented with more than two-thirds (67%) of respondents employing 500 or fewer staff. Only 14% of our respondents employ 50 staff or fewer but the vast majority of UK firms are of this size – 99.3% of all businesses in the UK.
�
Size Respondents %
1-49 55 14
50-199 115 28
201-499 103 25
501-4,999 96 24
5,000+ 37 9
exhibit: 3
Respondents by size of organisation
absence and labour turnover 2006
SUmmAry
n Time lost through absence stands at 6.6 days per employee
n The difference between the best and worst performing organisations was 8.8 days
n Manual employees have higher rates of absence – but absence levels have fallen considerably
n Small firms have the lowest levels of absence
n Public sector absence is 30% higher than in the private sector
n Absence varies widely between regions
n Organisations recognising trade unions have higher levels of absence.
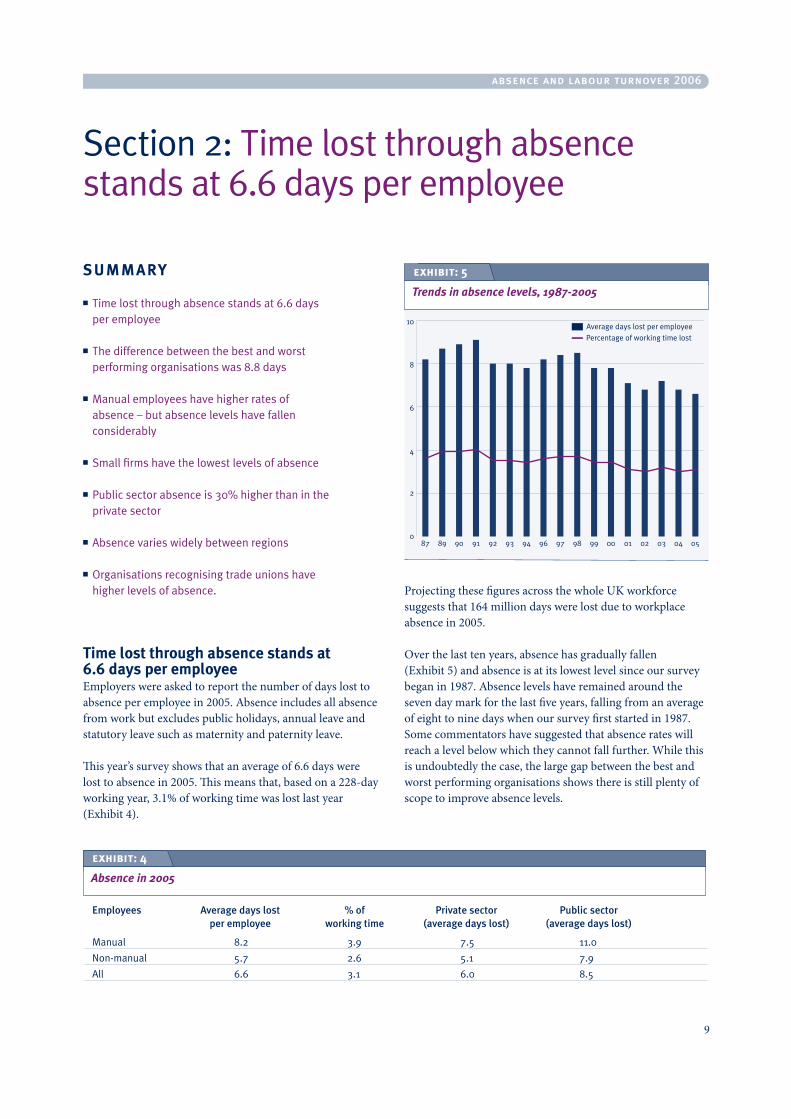
Time lost through absence stands at 6.6 days per employeeEmployers were asked to report the number of days lost to absence per employee in 2005. Absence includes all absence from work but excludes public holidays, annual leave and statutory leave such as maternity and paternity leave.
This year’s survey shows that an average of 6.6 days were lost to absence in 2005. This means that, based on a 228-day working year, 3.1% of working time was lost last year (Exhibit 4).
Projecting these figures across the whole UK workforce suggests that 164 million days were lost due to workplace absence in 2005.
Over the last ten years, absence has gradually fallen (Exhibit 5) and absence is at its lowest level since our survey began in 1987. Absence levels have remained around the seven day mark for the last five years, falling from an average of eight to nine days when our survey first started in 1987. Some commentators have suggested that absence rates will reach a level below which they cannot fall further. While this is undoubtedly the case, the large gap between the best and worst performing organisations shows there is still plenty of scope to improve absence levels.
Section 2: Time lost through absence stands at 6.6 days per employee
exhibit: 5
Trends in absence levels, 1987-2005
�
Employees Averagedayslost %of Privatesector Publicsector peremployee workingtime (averagedayslost) (averagedayslost)
Manual 8.2 3.9 7.5 11.0
Non-manual 5.7 2.6 5.1 7.9
All 6.6 3.1 6.0 8.5
exhibit: 4
Absence in 2005
absence and labour turnover 2006
The evidence from the survey supports this view. Tackling non-genuine sickness absence (estimated at 13% of absence) and more effective practices (such as early assessment and rehabilitation) could deliver further reductions.
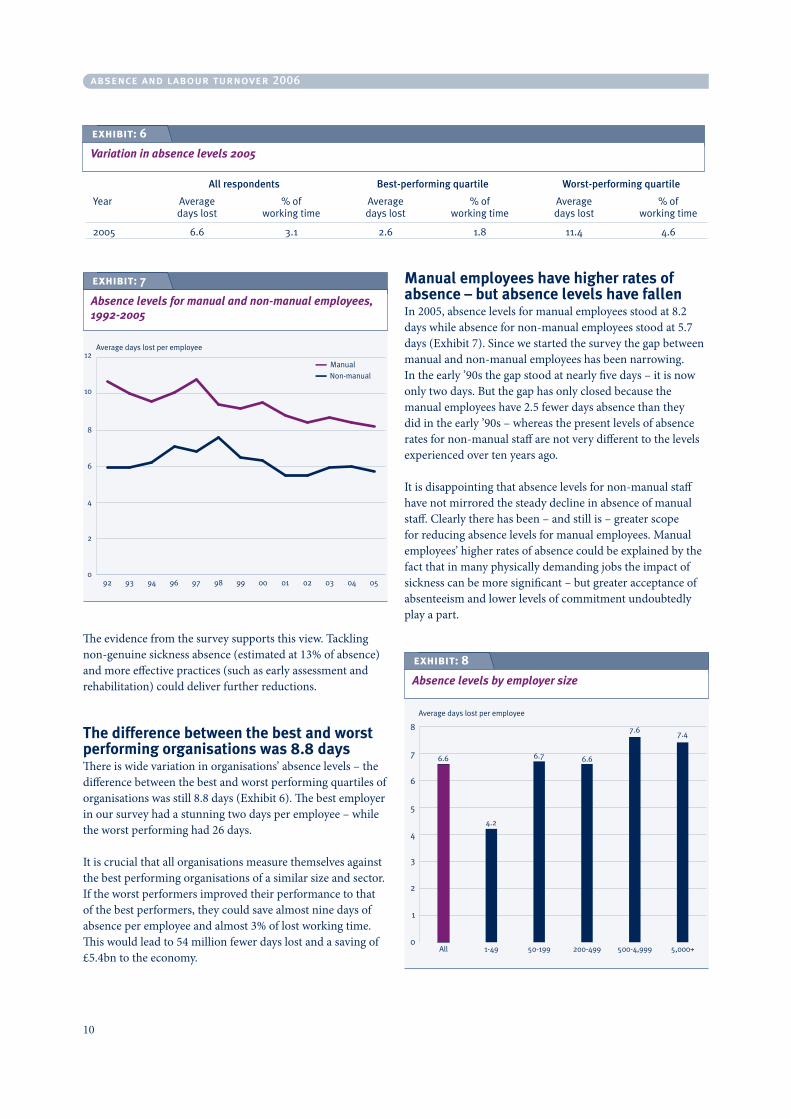
The difference between the best and worst performing organisations was 8.8 daysThere is wide variation in organisations’ absence levels – the difference between the best and worst performing quartiles of organisations was still 8.8 days (Exhibit 6). The best employer in our survey had a stunning two days per employee – while the worst performing had 26 days.
It is crucial that all organisations measure themselves against the best performing organisations of a similar size and sector. If the worst performers improved their performance to that of the best performers, they could save almost nine days of absence per employee and almost 3% of lost working time. This would lead to 54 million fewer days lost and a saving of £5.4bn to the economy.
manual employees have higher rates of absence – but absence levels have fallen In 2005, absence levels for manual employees stood at 8.2 days while absence for non-manual employees stood at 5.7 days (Exhibit 7). Since we started the survey the gap between manual and non-manual employees has been narrowing. In the early ’90s the gap stood at nearly five days – it is now only two days. But the gap has only closed because the manual employees have 2.5 fewer days absence than they did in the early ’90s – whereas the present levels of absence rates for non-manual staff are not very different to the levels experienced over ten years ago.
It is disappointing that absence levels for non-manual staff have not mirrored the steady decline in absence of manual staff. Clearly there has been – and still is – greater scope for reducing absence levels for manual employees. Manual employees’ higher rates of absence could be explained by the fact that in many physically demanding jobs the impact of sickness can be more significant – but greater acceptance of absenteeism and lower levels of commitment undoubtedly play a part.
Allrespondents Best-performingquartile Worst-performingquartile
Year Average % of Average % of Average % of days lost working time days lost working time days lost working time
2005 6.6 3.1 2.6 1.8 11.4 4.6
exhibit: 6
Variation in absence levels 2005
exhibit: 7
Absence levels for manual and non-manual employees, 1992-2005
10
exhibit: 8
Absence levels by employer size
11
absence and labour turnover 2006
Small firms have the lowest levels of absenceAbsence levels vary between sector, region, manual and non-manual work. However, smaller organisations consistently record lower absence levels than the larger organisations in our survey – 4.2 days compared with 7.4 days for the larger employers (Exhibit 8).
Lower levels of absence in smaller organisations could be explained by a greater awareness of the adverse effect of absence on the organisation and on fellow employees and the direct contact between employees and senior staff. Year on year, the survey shows that where senior managers have direct responsibility for absence management absence levels are lower – a key factor explaining lower absence levels in smaller organisations.
In over half of the smallest firms employing fewer than 50 staff, senior managers take primary responsibility for absence management – where senior managers take responsibility in the largest firms, absence levels are 6.0 days, compared with 8.0 days where line managers are in charge.
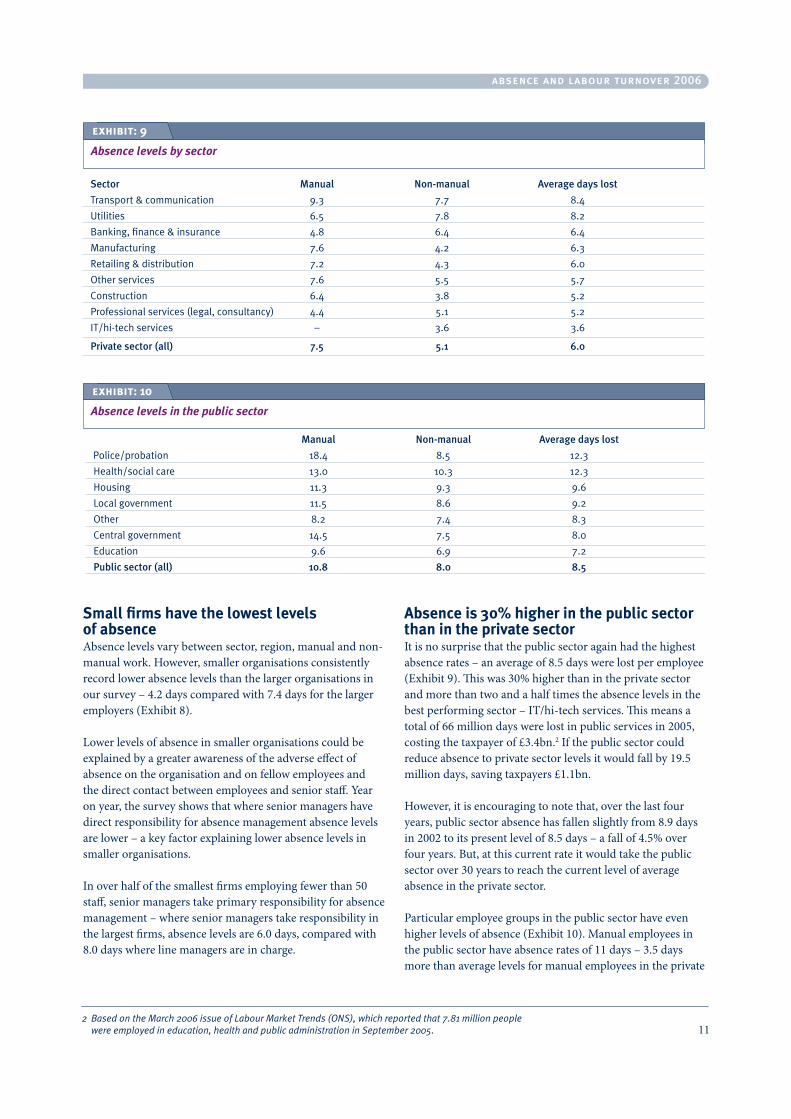
Absence is 30% higher in the public sector than in the private sectorIt is no surprise that the public sector again had the highest absence rates – an average of 8.5 days were lost per employee (Exhibit 9). This was 30% higher than in the private sector and more than two and a half times the absence levels in the best performing sector – IT/hi-tech services. This means a total of 66 million days were lost in public services in 2005, costing the taxpayer of £3.4bn.2 If the public sector could reduce absence to private sector levels it would fall by 19.5 million days, saving taxpayers £1.1bn.
However, it is encouraging to note that, over the last four years, public sector absence has fallen slightly from 8.9 days in 2002 to its present level of 8.5 days – a fall of 4.5% over four years. But, at this current rate it would take the public sector over 30 years to reach the current level of average absence in the private sector.
Particular employee groups in the public sector have even higher levels of absence (Exhibit 10). Manual employees in the public sector have absence rates of 11 days – 3.5 days more than average levels for manual employees in the private
2 Based on the March 2006 issue of Labour Market Trends (ONS), which reported that 7.81 million people were employed in education, health and public administration in September 2005.
Sector Manual Non-manual Averagedayslost
Transport & communication 9.3 7.7 8.4
Utilities 6.5 7.8 8.2
Banking, finance & insurance 4.8 6.4 6.4
Manufacturing 7.6 4.2 6.3
Retailing & distribution 7.2 4.3 6.0
Other services 7.6 5.5 5.7
Construction 6.4 3.8 5.2
Professional services (legal, consultancy) 4.4 5.1 5.2
IT/hi-tech services – 3.6 3.6
Privatesector(all) 7.5 5.1 6.0
exhibit: 9
Absence levels by sector
Manual Non-manual Averagedayslost
Police/probation 18.4 8.5 12.3
Health/social care 13.0 10.3 12.3
Housing 11.3 9.3 9.6
Local government 11.5 8.6 9.2
Other 8.2 7.4 8.3
Central government 14.5 7.5 8.0
Education 9.6 6.9 7.2
Publicsector(all) 10.8 8.0 8.5
exhibit: 10
Absence levels in the public sector
absence and labour turnover 2006
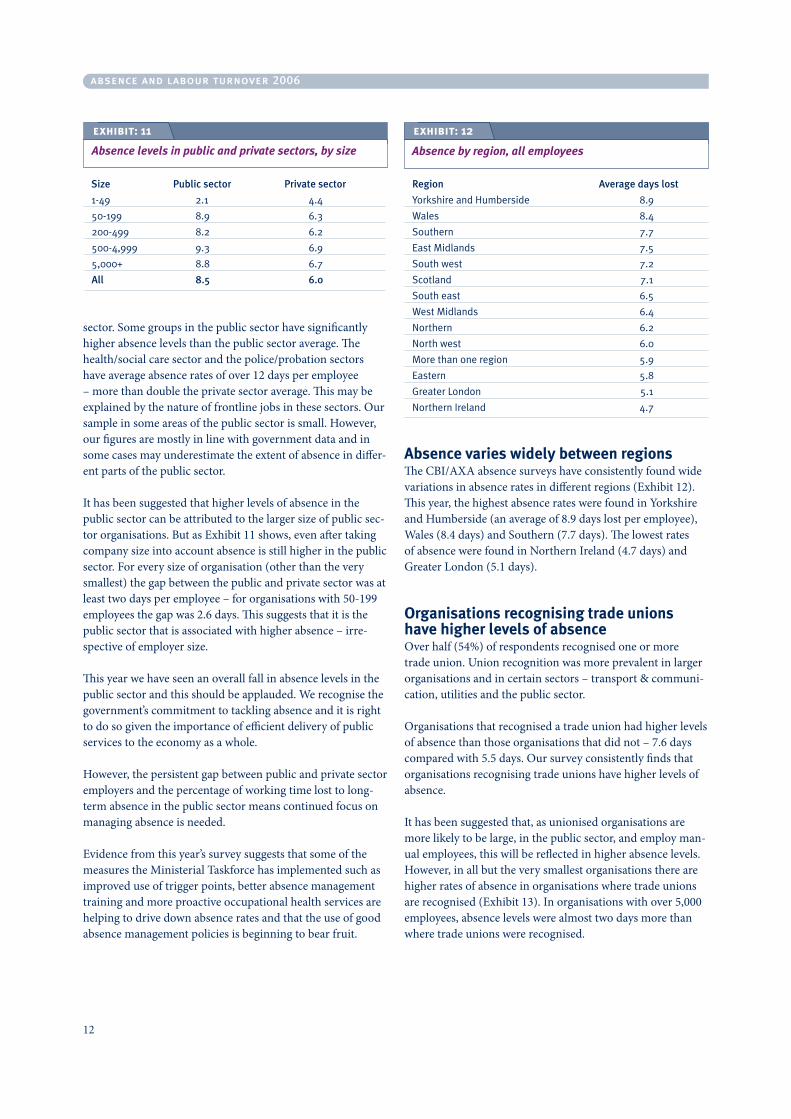
sector. Some groups in the public sector have significantly higher absence levels than the public sector average. The health/social care sector and the police/probation sectors have average absence rates of over 12 days per employee – more than double the private sector average. This may be explained by the nature of frontline jobs in these sectors. Our sample in some areas of the public sector is small. However, our figures are mostly in line with government data and in some cases may underestimate the extent of absence in differ-ent parts of the public sector.
It has been suggested that higher levels of absence in the public sector can be attributed to the larger size of public sec-tor organisations. But as Exhibit 11 shows, even after taking company size into account absence is still higher in the public sector. For every size of organisation (other than the very smallest) the gap between the public and private sector was at least two days per employee – for organisations with 50-199 employees the gap was 2.6 days. This suggests that it is the public sector that is associated with higher absence – irre-spective of employer size.
This year we have seen an overall fall in absence levels in the public sector and this should be applauded. We recognise the government’s commitment to tackling absence and it is right to do so given the importance of efficient delivery of public services to the economy as a whole.
However, the persistent gap between public and private sector employers and the percentage of working time lost to long-term absence in the public sector means continued focus on managing absence is needed.
Evidence from this year’s survey suggests that some of the measures the Ministerial Taskforce has implemented such as improved use of trigger points, better absence management training and more proactive occupational health services are helping to drive down absence rates and that the use of good absence management policies is beginning to bear fruit.
Absence varies widely between regionsThe CBI/AXA absence surveys have consistently found wide variations in absence rates in different regions (Exhibit 12). This year, the highest absence rates were found in Yorkshire and Humberside (an average of 8.9 days lost per employee), Wales (8.4 days) and Southern (7.7 days). The lowest rates of absence were found in Northern Ireland (4.7 days) and Greater London (5.1 days).
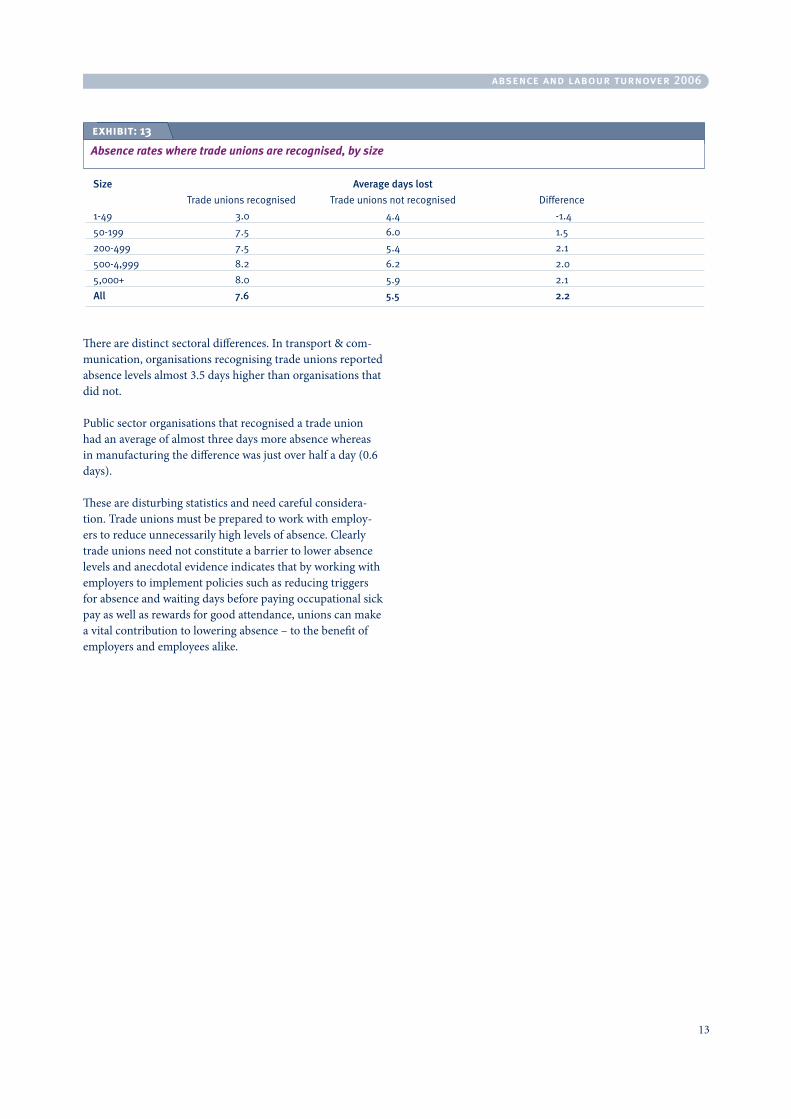
Organisations recognising trade unions have higher levels of absenceOver half (54%) of respondents recognised one or more trade union. Union recognition was more prevalent in larger organisations and in certain sectors – transport & communi-cation, utilities and the public sector.
Organisations that recognised a trade union had higher levels of absence than those organisations that did not – 7.6 days compared with 5.5 days. Our survey consistently finds that organisations recognising trade unions have higher levels of absence.
It has been suggested that, as unionised organisations are more likely to be large, in the public sector, and employ man-ual employees, this will be reflected in higher absence levels. However, in all but the very smallest organisations there are higher rates of absence in organisations where trade unions are recognised (Exhibit 13). In organisations with over 5,000 employees, absence levels were almost two days more than where trade unions were recognised.
12
Size Publicsector Privatesector
1-49 2.1 4.4
50-199 8.9 6.3
200-499 8.2 6.2
500-4,999 9.3 6.9
5,000+ 8.8 6.7
All 8.5 6.0
exhibit: 11
Absence levels in public and private sectors, by size
Region Averagedayslost
Yorkshire and Humberside 8.9
Wales 8.4
Southern 7.7
East Midlands 7.5
South west 7.2
Scotland 7.1
South east 6.5
West Midlands 6.4
Northern 6.2
North west 6.0
More than one region 5.9
Eastern 5.8
Greater London 5.1
Northern Ireland 4.7
exhibit: 12
Absence by region, all employees
absence and labour turnover 2006
There are distinct sectoral differences. In transport & com-munication, organisations recognising trade unions reported absence levels almost 3.5 days higher than organisations that did not.
Public sector organisations that recognised a trade union had an average of almost three days more absence whereas in manufacturing the difference was just over half a day (0.6 days).
These are disturbing statistics and need careful considera-tion. Trade unions must be prepared to work with employ-ers to reduce unnecessarily high levels of absence. Clearly trade unions need not constitute a barrier to lower absence levels and anecdotal evidence indicates that by working with employers to implement policies such as reducing triggers for absence and waiting days before paying occupational sick pay as well as rewards for good attendance, unions can make a vital contribution to lowering absence – to the benefit of employers and employees alike.
1�
Size Averagedayslost
Trade unions recognised Trade unions not recognised Difference
1-49 3.0 4.4 -1.4
50-199 7.5 6.0 1.5
200-499 7.5 5.4 2.1
500-4,999 8.2 6.2 2.0
5,000+ 8.0 5.9 2.1
All 7.6 5.5 2.2
exhibit: 13
Absence rates where trade unions are recognised, by size
absence and labour turnover 2006
SUmmAry
n The average direct cost of absence is £531 per employee
n Indirect costs are significant – they add £584 per employee on average
n Larger organisations report higher direct costs of absence
n Cost varies considerably between sectors.
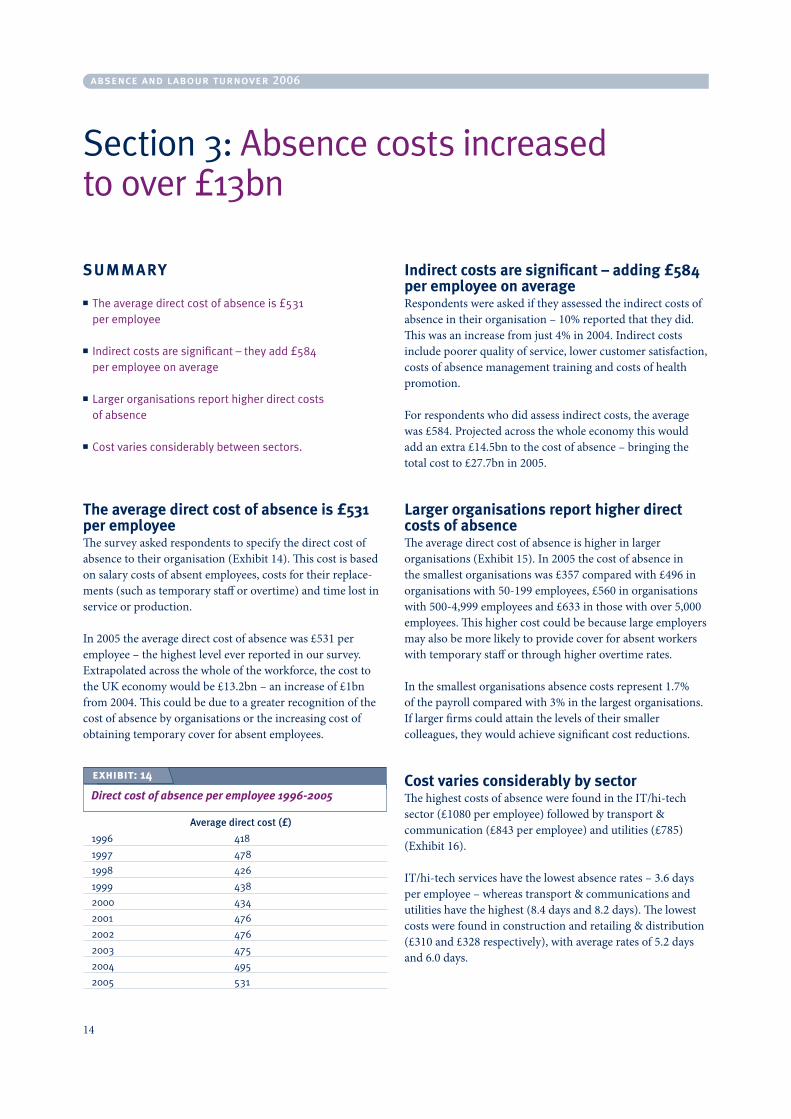
The average direct cost of absence is £531 per employeeThe survey asked respondents to specify the direct cost of absence to their organisation (Exhibit 14). This cost is based on salary costs of absent employees, costs for their replace-ments (such as temporary staff or overtime) and time lost in service or production.
In 2005 the average direct cost of absence was £531 per employee – the highest level ever reported in our survey. Extrapolated across the whole of the workforce, the cost to the UK economy would be £13.2bn – an increase of £1bn from 2004. This could be due to a greater recognition of the cost of absence by organisations or the increasing cost of obtaining temporary cover for absent employees.
Indirect costs are significant – adding £584 per employee on averageRespondents were asked if they assessed the indirect costs of absence in their organisation – 10% reported that they did. This was an increase from just 4% in 2004. Indirect costs include poorer quality of service, lower customer satisfaction, costs of absence management training and costs of health promotion.
For respondents who did assess indirect costs, the average was £584. Projected across the whole economy this would add an extra £14.5bn to the cost of absence – bringing the total cost to £27.7bn in 2005.
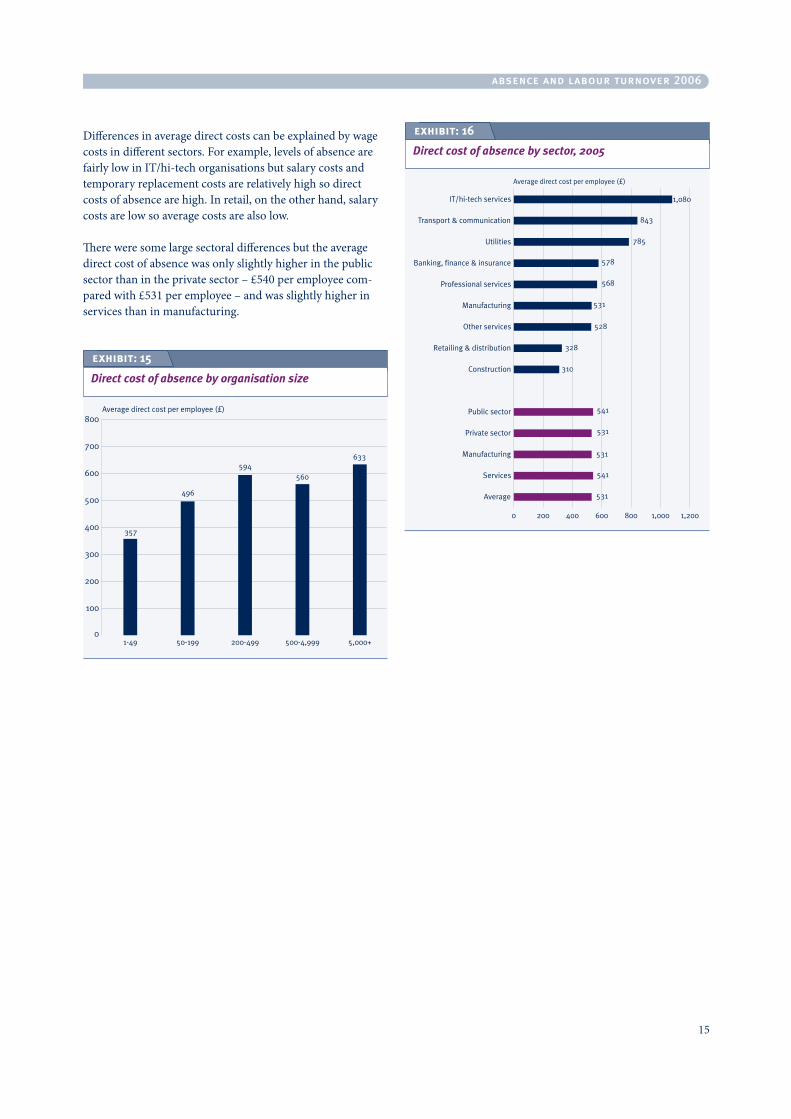
Larger organisations report higher direct costs of absenceThe average direct cost of absence is higher in larger organisations (Exhibit 15). In 2005 the cost of absence in the smallest organisations was £357 compared with £496 in organisations with 50-199 employees, £560 in organisations with 500-4,999 employees and £633 in those with over 5,000 employees. This higher cost could be because large employers may also be more likely to provide cover for absent workers with temporary staff or through higher overtime rates.
In the smallest organisations absence costs represent 1.7% of the payroll compared with 3% in the largest organisations. If larger firms could attain the levels of their smaller colleagues, they would achieve significant cost reductions.
Cost varies considerably by sectorThe highest costs of absence were found in the IT/hi-tech sector (£1080 per employee) followed by transport & communication (£843 per employee) and utilities (£785) (Exhibit 16).
IT/hi-tech services have the lowest absence rates – 3.6 days per employee – whereas transport & communications and utilities have the highest (8.4 days and 8.2 days). The lowest costs were found in construction and retailing & distribution (£310 and £328 respectively), with average rates of 5.2 days and 6.0 days.
Section 3: Absence costs increased to over £13bn
1�
Averagedirectcost(£)
1996 418
1997 478
1998 426
1999 438
2000 434
2001 476
2002 476
2003 475
2004 495
2005 531
exhibit: 14
Direct cost of absence per employee 1996-2005
absence and labour turnover 2006
Differences in average direct costs can be explained by wage costs in different sectors. For example, levels of absence are fairly low in IT/hi-tech organisations but salary costs and temporary replacement costs are relatively high so direct costs of absence are high. In retail, on the other hand, salary costs are low so average costs are also low.
There were some large sectoral differences but the average direct cost of absence was only slightly higher in the public sector than in the private sector – £540 per employee com-pared with £531 per employee – and was slightly higher in services than in manufacturing.
1�
exhibit: 15
Direct cost of absence by organisation size
exhibit: 16
Direct cost of absence by sector, 2005
absence and labour turnover 2006
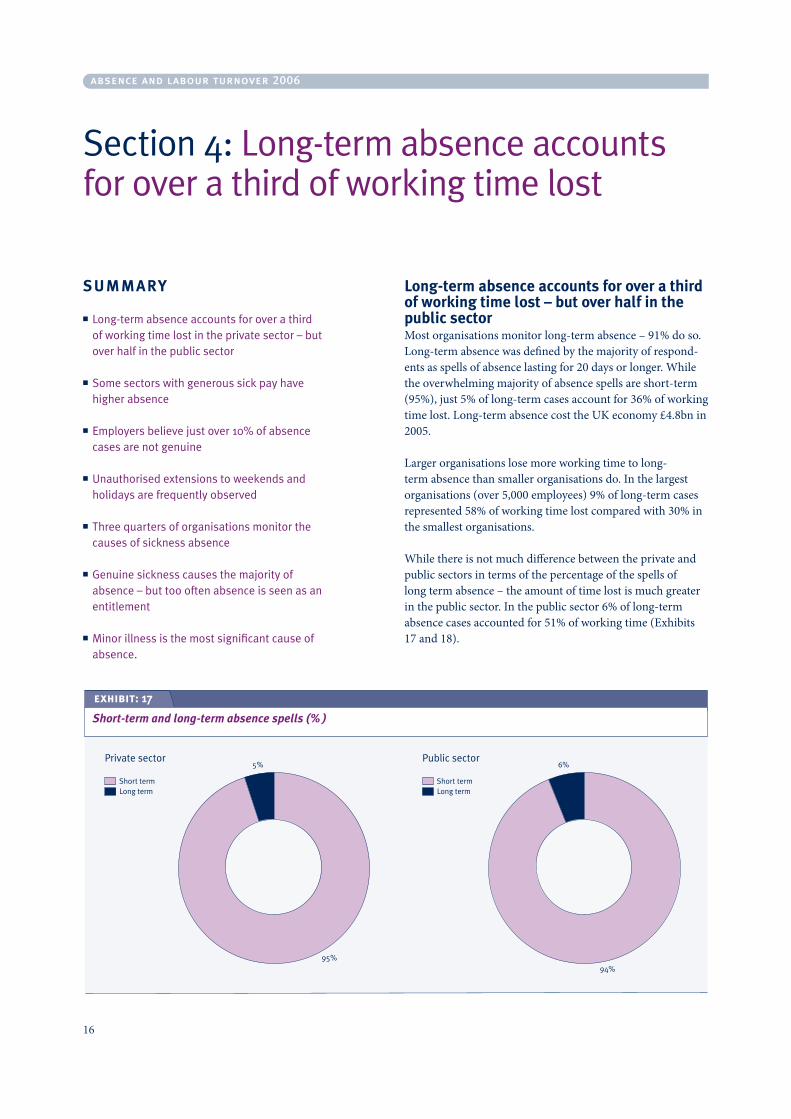
Long-term absence accounts for over a third of working time lost – but over half in the public sectorMost organisations monitor long-term absence – 91% do so. Long-term absence was defined by the majority of respond-ents as spells of absence lasting for 20 days or longer. While the overwhelming majority of absence spells are short-term (95%), just 5% of long-term cases account for 36% of working time lost. Long-term absence cost the UK economy £4.8bn in 2005.
Larger organisations lose more working time to long-term absence than smaller organisations do. In the largest organisations (over 5,000 employees) 9% of long-term cases represented 58% of working time lost compared with 30% in the smallest organisations.
While there is not much difference between the private and public sectors in terms of the percentage of the spells of long term absence – the amount of time lost is much greater in the public sector. In the public sector 6% of long-term absence cases accounted for 51% of working time (Exhibits 17 and 18).
SUmmAry
n Long-term absence accounts for over a third of working time lost in the private sector – but over half in the public sector
n Some sectors with generous sick pay have higher absence
n Employers believe just over 10% of absence cases are not genuine
n Unauthorised extensions to weekends and holidays are frequently observed
n Three quarters of organisations monitor the causes of sickness absence
n Genuine sickness causes the majority of absence – but too often absence is seen as an entitlement
n Minor illness is the most significant cause of absence.
Section 4: Long-term absence accounts for over a third of working time lost
exhibit: 17
Short-term and long-term absence spells (%)
1�
absence and labour turnover 2006
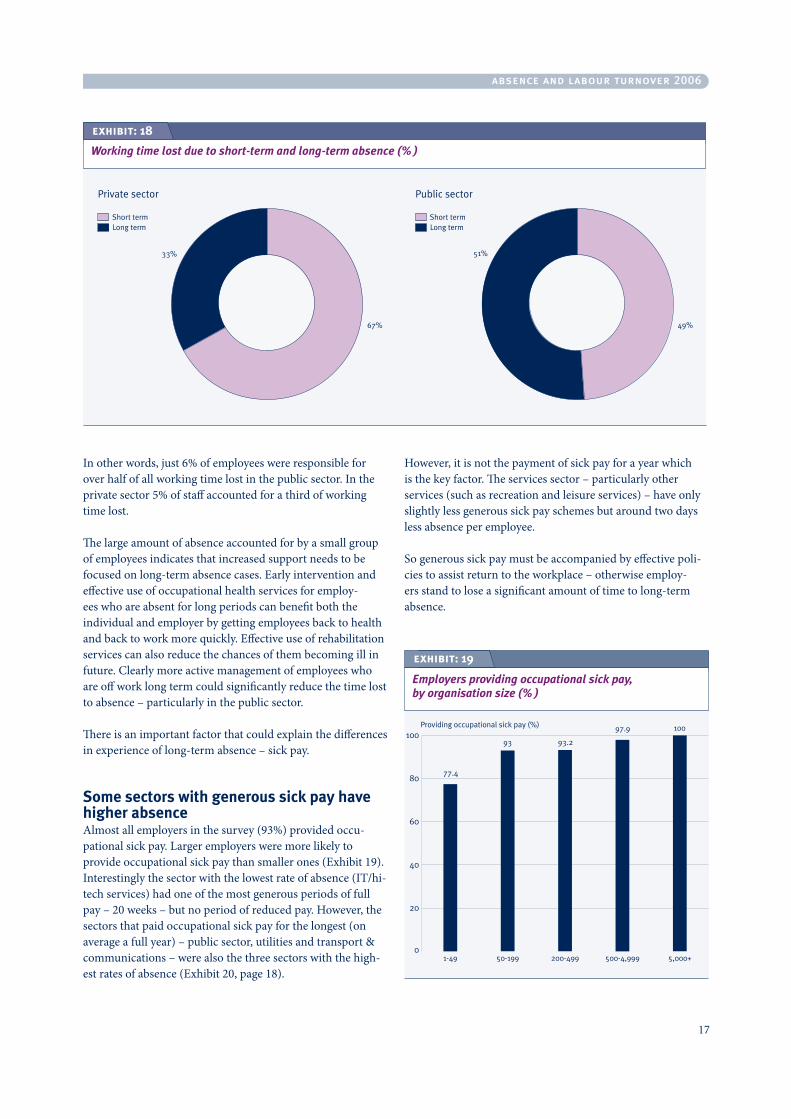
In other words, just 6% of employees were responsible for over half of all working time lost in the public sector. In the private sector 5% of staff accounted for a third of working time lost.
The large amount of absence accounted for by a small group of employees indicates that increased support needs to be focused on long-term absence cases. Early intervention and effective use of occupational health services for employ-ees who are absent for long periods can benefit both the individual and employer by getting employees back to health and back to work more quickly. Effective use of rehabilitation services can also reduce the chances of them becoming ill in future. Clearly more active management of employees who are off work long term could significantly reduce the time lost to absence – particularly in the public sector.
There is an important factor that could explain the differences in experience of long-term absence – sick pay.
Some sectors with generous sick pay have higher absenceAlmost all employers in the survey (93%) provided occu-pational sick pay. Larger employers were more likely to provide occupational sick pay than smaller ones (Exhibit 19). Interestingly the sector with the lowest rate of absence (IT/hi-tech services) had one of the most generous periods of full pay – 20 weeks – but no period of reduced pay. However, the sectors that paid occupational sick pay for the longest (on average a full year) – public sector, utilities and transport & communications – were also the three sectors with the high-est rates of absence (Exhibit 20, page 18).
However, it is not the payment of sick pay for a year which is the key factor. The services sector – particularly other services (such as recreation and leisure services) – have only slightly less generous sick pay schemes but around two days less absence per employee.
So generous sick pay must be accompanied by effective poli-cies to assist return to the workplace – otherwise employ-ers stand to lose a significant amount of time to long-term absence.
exhibit: 18
Working time lost due to short-term and long-term absence (%)
1�
exhibit: 19
Employers providing occupational sick pay, by organisation size (%)
absence and labour turnover 2006
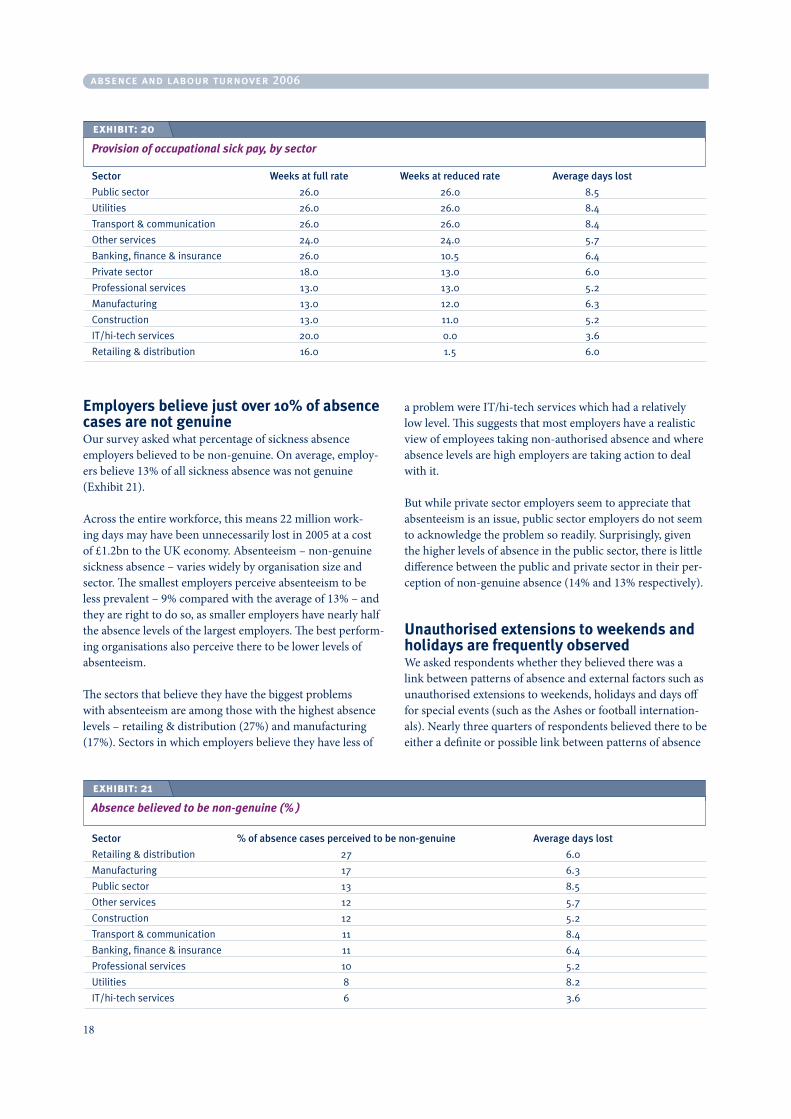
Employers believe just over 10% of absence cases are not genuineOur survey asked what percentage of sickness absence employers believed to be non-genuine. On average, employ-ers believe 13% of all sickness absence was not genuine (Exhibit 21).
Across the entire workforce, this means 22 million work-ing days may have been unnecessarily lost in 2005 at a cost of £1.2bn to the UK economy. Absenteeism – non-genuine sickness absence – varies widely by organisation size and sector. The smallest employers perceive absenteeism to be less prevalent – 9% compared with the average of 13% – and they are right to do so, as smaller employers have nearly half the absence levels of the largest employers. The best perform-ing organisations also perceive there to be lower levels of absenteeism.
The sectors that believe they have the biggest problems with absenteeism are among those with the highest absence levels – retailing & distribution (27%) and manufacturing (17%). Sectors in which employers believe they have less of
a problem were IT/hi-tech services which had a relatively low level. This suggests that most employers have a realistic view of employees taking non-authorised absence and where absence levels are high employers are taking action to deal with it.
But while private sector employers seem to appreciate that absenteeism is an issue, public sector employers do not seem to acknowledge the problem so readily. Surprisingly, given the higher levels of absence in the public sector, there is little difference between the public and private sector in their per-ception of non-genuine absence (14% and 13% respectively).
Unauthorised extensions to weekends and holidays are frequently observed We asked respondents whether they believed there was a link between patterns of absence and external factors such as unauthorised extensions to weekends, holidays and days off for special events (such as the Ashes or football internation-als). Nearly three quarters of respondents believed there to be either a definite or possible link between patterns of absence
1�
Sector Weeksatfullrate Weeksatreducedrate Averagedayslost
Public sector 26.0 26.0 8.5
Utilities 26.0 26.0 8.4
Transport & communication 26.0 26.0 8.4
Other services 24.0 24.0 5.7
Banking, finance & insurance 26.0 10.5 6.4
Private sector 18.0 13.0 6.0
Professional services 13.0 13.0 5.2
Manufacturing 13.0 12.0 6.3
Construction 13.0 11.0 5.2
IT/hi-tech services 20.0 0.0 3.6
Retailing & distribution 16.0 1.5 6.0
exhibit: 20
Provision of occupational sick pay, by sector
Sector %ofabsencecasesperceivedtobenon-genuine Averagedayslost
Retailing & distribution 27 6.0
Manufacturing 17 6.3
Public sector 13 8.5
Other services 12 5.7
Construction 12 5.2
Transport & communication 11 8.4
Banking, finance & insurance 11 6.4
Professional services 10 5.2
Utilities 8 8.2
IT/hi-tech services 6 3.6
exhibit: 21
Absence believed to be non-genuine (%)
absence and labour turnover 2006
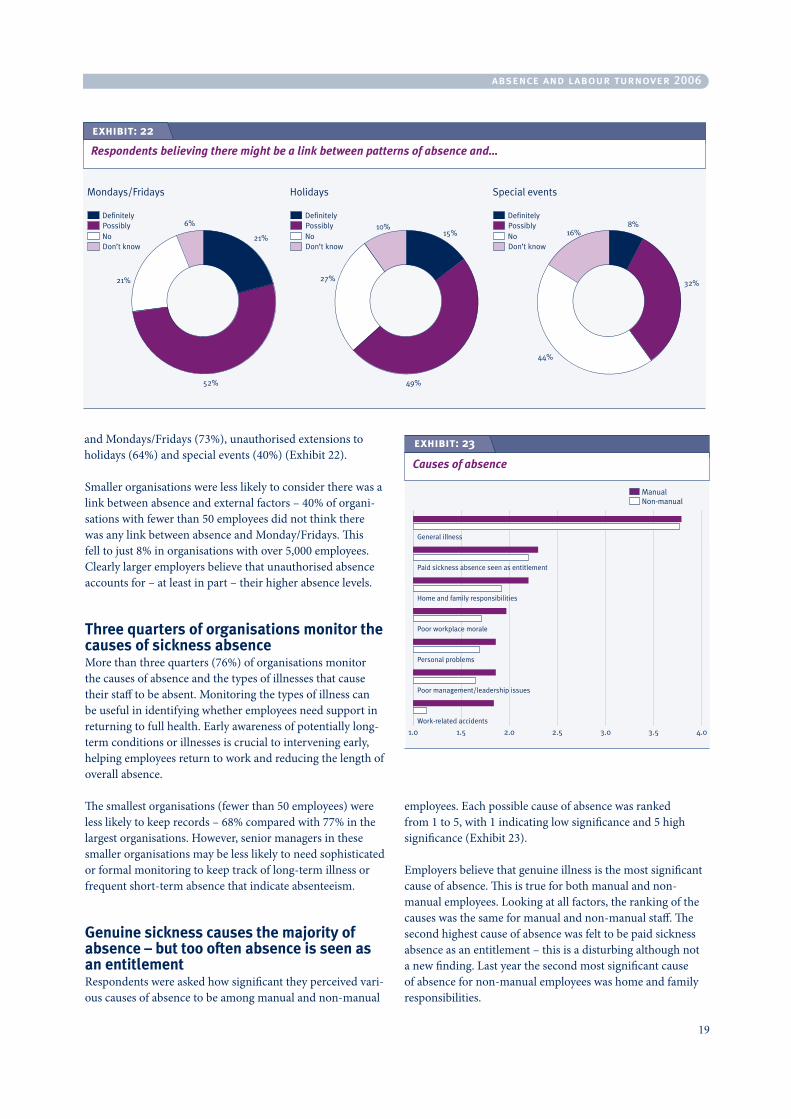
and Mondays/Fridays (73%), unauthorised extensions to holidays (64%) and special events (40%) (Exhibit 22).
Smaller organisations were less likely to consider there was a link between absence and external factors – 40% of organi-sations with fewer than 50 employees did not think there was any link between absence and Monday/Fridays. This fell to just 8% in organisations with over 5,000 employees. Clearly larger employers believe that unauthorised absence accounts for – at least in part – their higher absence levels.
Three quarters of organisations monitor the causes of sickness absenceMore than three quarters (76%) of organisations monitor the causes of absence and the types of illnesses that cause their staff to be absent. Monitoring the types of illness can be useful in identifying whether employees need support in returning to full health. Early awareness of potentially long-term conditions or illnesses is crucial to intervening early, helping employees return to work and reducing the length of overall absence.
The smallest organisations (fewer than 50 employees) were less likely to keep records – 68% compared with 77% in the largest organisations. However, senior managers in these smaller organisations may be less likely to need sophisticated or formal monitoring to keep track of long-term illness or frequent short-term absence that indicate absenteeism.
Genuine sickness causes the majority of absence – but too often absence is seen as an entitlement Respondents were asked how significant they perceived vari-ous causes of absence to be among manual and non-manual
employees. Each possible cause of absence was ranked from 1 to 5, with 1 indicating low significance and 5 high significance (Exhibit 23).
Employers believe that genuine illness is the most significant cause of absence. This is true for both manual and non-manual employees. Looking at all factors, the ranking of the causes was the same for manual and non-manual staff. The second highest cause of absence was felt to be paid sickness absence as an entitlement – this is a disturbing although not a new finding. Last year the second most significant cause of absence for non-manual employees was home and family responsibilities.
exhibit: 22
Respondents believing there might be a link between patterns of absence and…
1�
Causes of absence
exhibit: 23
absence and labour turnover 2006
There is a real need to address the problem that some groups of employees appear to believe they have an entitlement to a certain amount of paid sick leave each year. More employ-ers believe this to be the case in the public sector than in the private sector. Sick leave is not an alternative to holiday leave and employees do not have a right to skip work if they feel they deserve a day off. Of course employees who are genuinely ill must have time off work but employers need to address cultural issues within their workplaces. Indeed the survey shows that employers recognise that there are other factors at play – such as poor workplace morale and poor management. Employers and employees must work together to address all the causes of absence. Clearly there is much more to sickness absence than just being sick.
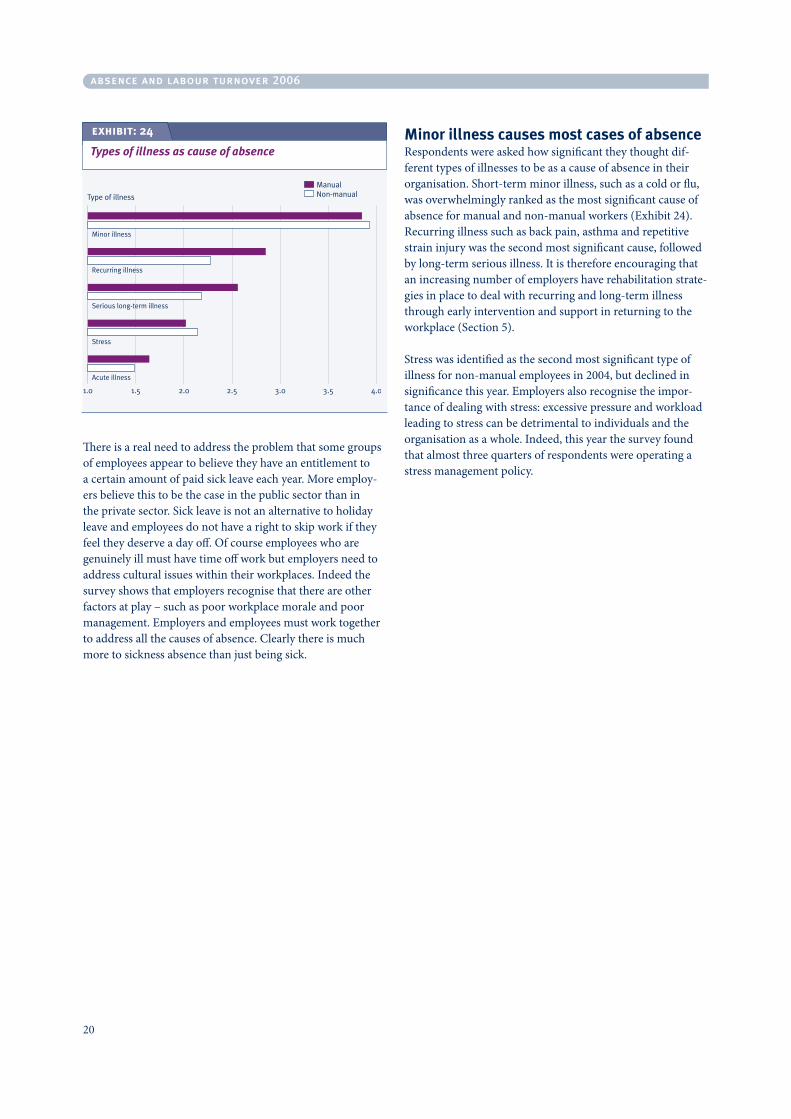
minor illness causes most cases of absenceRespondents were asked how significant they thought dif-ferent types of illnesses to be as a cause of absence in their organisation. Short-term minor illness, such as a cold or flu, was overwhelmingly ranked as the most significant cause of absence for manual and non-manual workers (Exhibit 24). Recurring illness such as back pain, asthma and repetitive strain injury was the second most significant cause, followed by long-term serious illness. It is therefore encouraging that an increasing number of employers have rehabilitation strate-gies in place to deal with recurring and long-term illness through early intervention and support in returning to the workplace (Section 5).
Stress was identified as the second most significant type of illness for non-manual employees in 2004, but declined in significance this year. Employers also recognise the impor-tance of dealing with stress: excessive pressure and workload leading to stress can be detrimental to individuals and the organisation as a whole. Indeed, this year the survey found that almost three quarters of respondents were operating a stress management policy.
20
exhibit: 24
Types of illness as cause of absence
absence and labour turnover 2006
SUmmAry
n In most organisations line managers have primary responsibility for managing absence…
n …but absence is lowest where HR managers have primary responsibility
n Employers use a range of practices to manage sickness absence
n … but a combination of carrot and stick is most effective
n Most employers offer rehabilitation services
n Smaller organisations intervene earlier
n More employers offer stress management policies
n Most organisations are acting to reduce absence – but there is more to do.
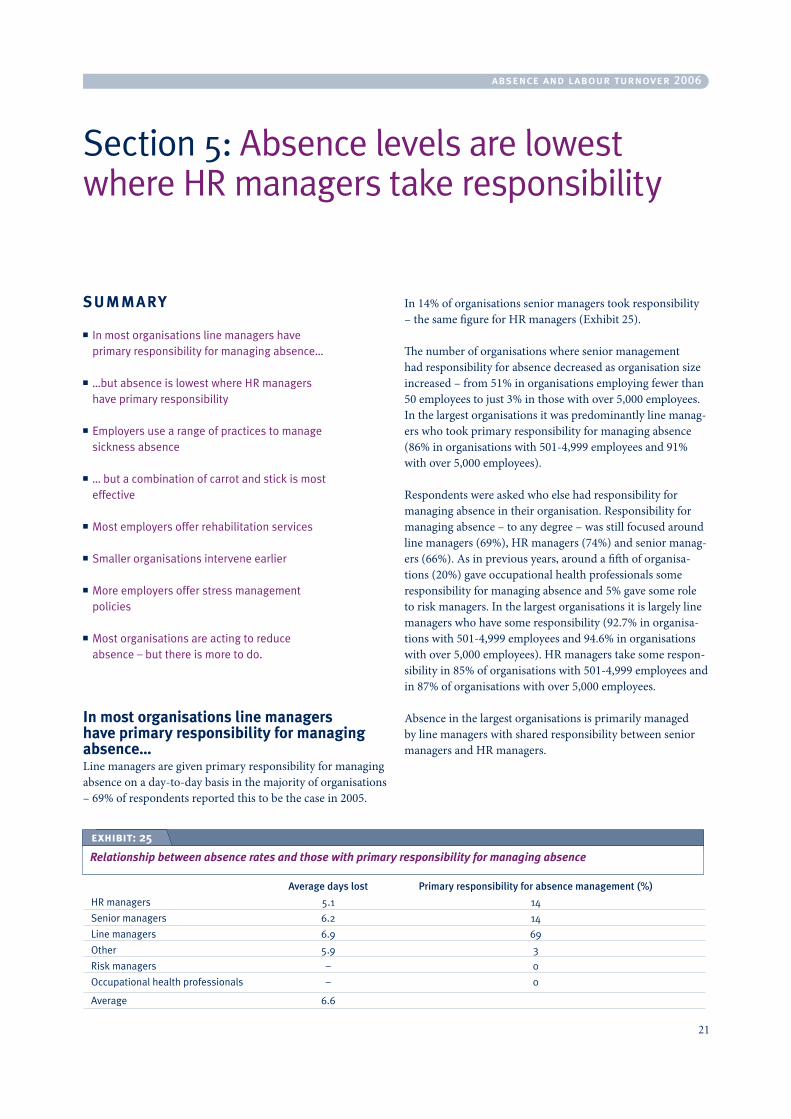
In most organisations line managers have primary responsibility for managing absence…Line managers are given primary responsibility for managing absence on a day-to-day basis in the majority of organisations – 69% of respondents reported this to be the case in 2005.
In 14% of organisations senior managers took responsibility – the same figure for HR managers (Exhibit 25).
The number of organisations where senior management had responsibility for absence decreased as organisation size increased – from 51% in organisations employing fewer than 50 employees to just 3% in those with over 5,000 employees. In the largest organisations it was predominantly line manag-ers who took primary responsibility for managing absence (86% in organisations with 501-4,999 employees and 91% with over 5,000 employees).
Respondents were asked who else had responsibility for managing absence in their organisation. Responsibility for managing absence – to any degree – was still focused around line managers (69%), HR managers (74%) and senior manag-ers (66%). As in previous years, around a fifth of organisa-tions (20%) gave occupational health professionals some responsibility for managing absence and 5% gave some role to risk managers. In the largest organisations it is largely line managers who have some responsibility (92.7% in organisa-tions with 501-4,999 employees and 94.6% in organisations with over 5,000 employees). HR managers take some respon-sibility in 85% of organisations with 501-4,999 employees and in 87% of organisations with over 5,000 employees.
Absence in the largest organisations is primarily managed by line managers with shared responsibility between senior managers and HR managers.
Section 5: Absence levels are lowest where HR managers take responsibility
21
exhibit: 25
Relationship between absence rates and those with primary responsibility for managing absence
Averagedayslost Primaryresponsibilityforabsencemanagement(%)
HR managers 5.1 14
Senior managers 6.2 14
Line managers 6.9 69
Other 5.9 3
Risk managers – 0
Occupational health professionals – 0
Average 6.6
absence and labour turnover 2006
…but absence is lowest where Hr managers have primary responsibilityWhere HR managers have primary responsibility for absence management, nearly two fewer days are lost compared with organisations where line managers have primary respon-sibility (5.1 days per employee compared with 6.9 days). Absence is also lower where senior managers have primary responsibility – 6.2 days per employee (Exhibit 25, page 21). In previous years the survey has consistently shown lower absence levels where senior management takes responsibility. This year, for the first time, we found that HR managers had the best record for managing absence.
In smaller and medium-sized organisations senior managers are more likely to be involved in day-to-day absence manage-ment and this may explain lower absence rates in small and medium-sized organisations. But HR managers are particu-larly successful in reducing absence levels in organisations with 501-5,000 employees, suggesting that size is not the only determining factor here. Giving a greater role to HR manag-ers and senior managers for absence management in larger organisations could bring significant benefits – especially if their commitment is replicated throughout the organisation.
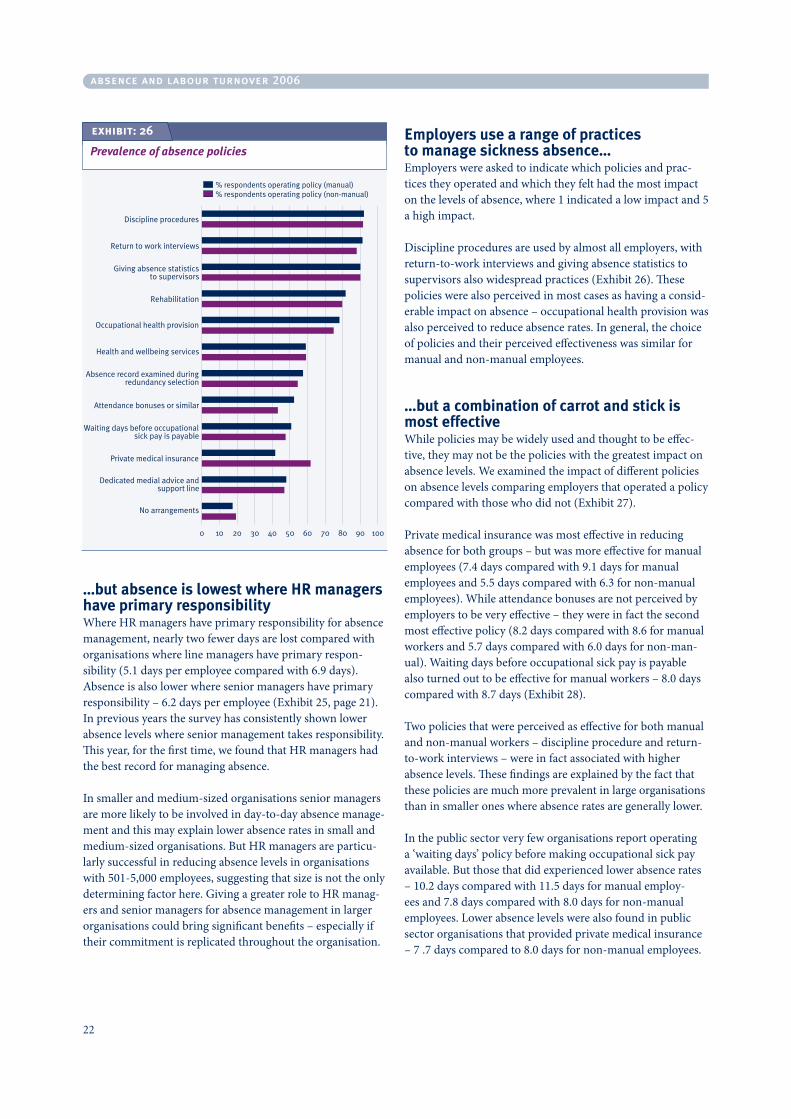
Employers use a range of practices to manage sickness absence…Employers were asked to indicate which policies and prac-tices they operated and which they felt had the most impact on the levels of absence, where 1 indicated a low impact and 5 a high impact.
Discipline procedures are used by almost all employers, with return-to-work interviews and giving absence statistics to supervisors also widespread practices (Exhibit 26). These policies were also perceived in most cases as having a consid-erable impact on absence – occupational health provision was also perceived to reduce absence rates. In general, the choice of policies and their perceived effectiveness was similar for manual and non-manual employees.
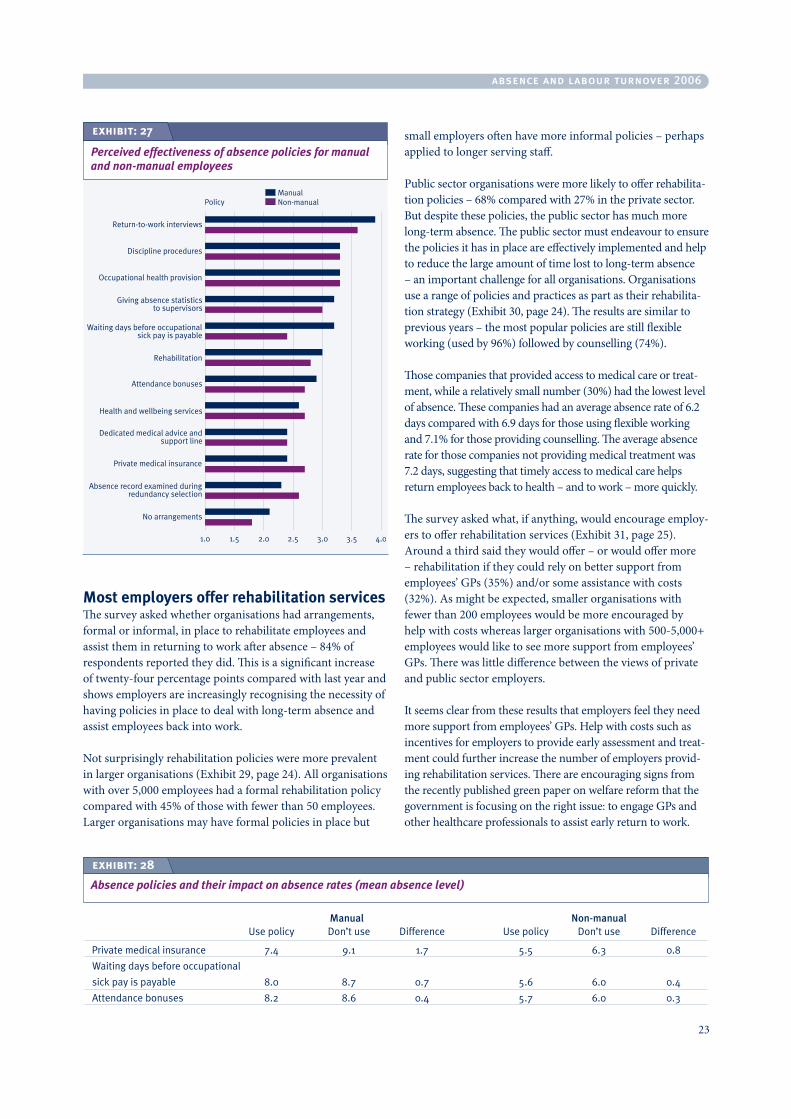
…but a combination of carrot and stick is most effectiveWhile policies may be widely used and thought to be effec-tive, they may not be the policies with the greatest impact on absence levels. We examined the impact of different policies on absence levels comparing employers that operated a policy compared with those who did not (Exhibit 27).
Private medical insurance was most effective in reducing absence for both groups – but was more effective for manual employees (7.4 days compared with 9.1 days for manual employees and 5.5 days compared with 6.3 for non-manual employees). While attendance bonuses are not perceived by employers to be very effective – they were in fact the second most effective policy (8.2 days compared with 8.6 for manual workers and 5.7 days compared with 6.0 days for non-man-ual). Waiting days before occupational sick pay is payable also turned out to be effective for manual workers – 8.0 days compared with 8.7 days (Exhibit 28).
Two policies that were perceived as effective for both manual and non-manual workers – discipline procedure and return-to-work interviews – were in fact associated with higher absence levels. These findings are explained by the fact that these policies are much more prevalent in large organisations than in smaller ones where absence rates are generally lower.
In the public sector very few organisations report operating a ‘waiting days’ policy before making occupational sick pay available. But those that did experienced lower absence rates – 10.2 days compared with 11.5 days for manual employ-ees and 7.8 days compared with 8.0 days for non-manual employees. Lower absence levels were also found in public sector organisations that provided private medical insurance – 7 .7 days compared to 8.0 days for non-manual employees.
22
Prevalence of absence policies
exhibit: 26
absence and labour turnover 2006
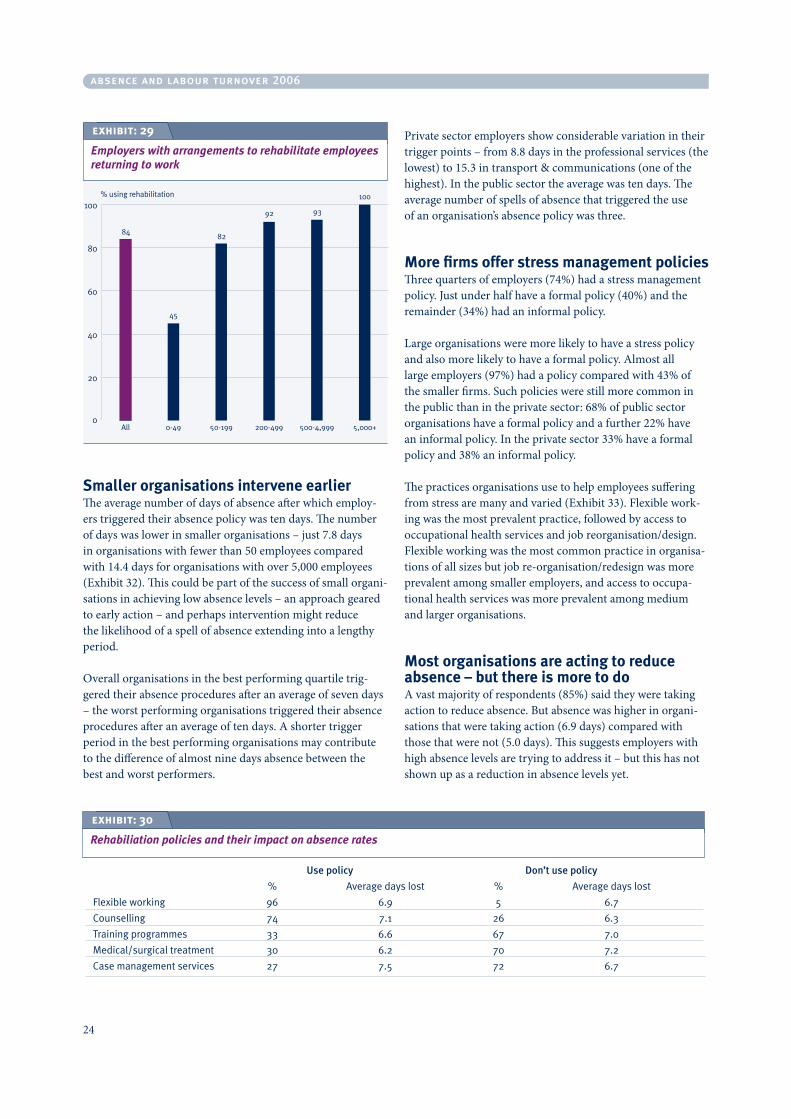
most employers offer rehabilitation servicesThe survey asked whether organisations had arrangements, formal or informal, in place to rehabilitate employees and assist them in returning to work after absence – 84% of respondents reported they did. This is a significant increase of twenty-four percentage points compared with last year and shows employers are increasingly recognising the necessity of having policies in place to deal with long-term absence and assist employees back into work.
Not surprisingly rehabilitation policies were more prevalent in larger organisations (Exhibit 29, page 24). All organisations with over 5,000 employees had a formal rehabilitation policy compared with 45% of those with fewer than 50 employees. Larger organisations may have formal policies in place but
small employers often have more informal policies – perhaps applied to longer serving staff.
Public sector organisations were more likely to offer rehabilita-tion policies – 68% compared with 27% in the private sector. But despite these policies, the public sector has much more long-term absence. The public sector must endeavour to ensure the policies it has in place are effectively implemented and help to reduce the large amount of time lost to long-term absence – an important challenge for all organisations. Organisations use a range of policies and practices as part as their rehabilita-tion strategy (Exhibit 30, page 24). The results are similar to previous years – the most popular policies are still flexible working (used by 96%) followed by counselling (74%).
Those companies that provided access to medical care or treat-ment, while a relatively small number (30%) had the lowest level of absence. These companies had an average absence rate of 6.2 days compared with 6.9 days for those using flexible working and 7.1% for those providing counselling. The average absence rate for those companies not providing medical treatment was 7.2 days, suggesting that timely access to medical care helps return employees back to health – and to work – more quickly.
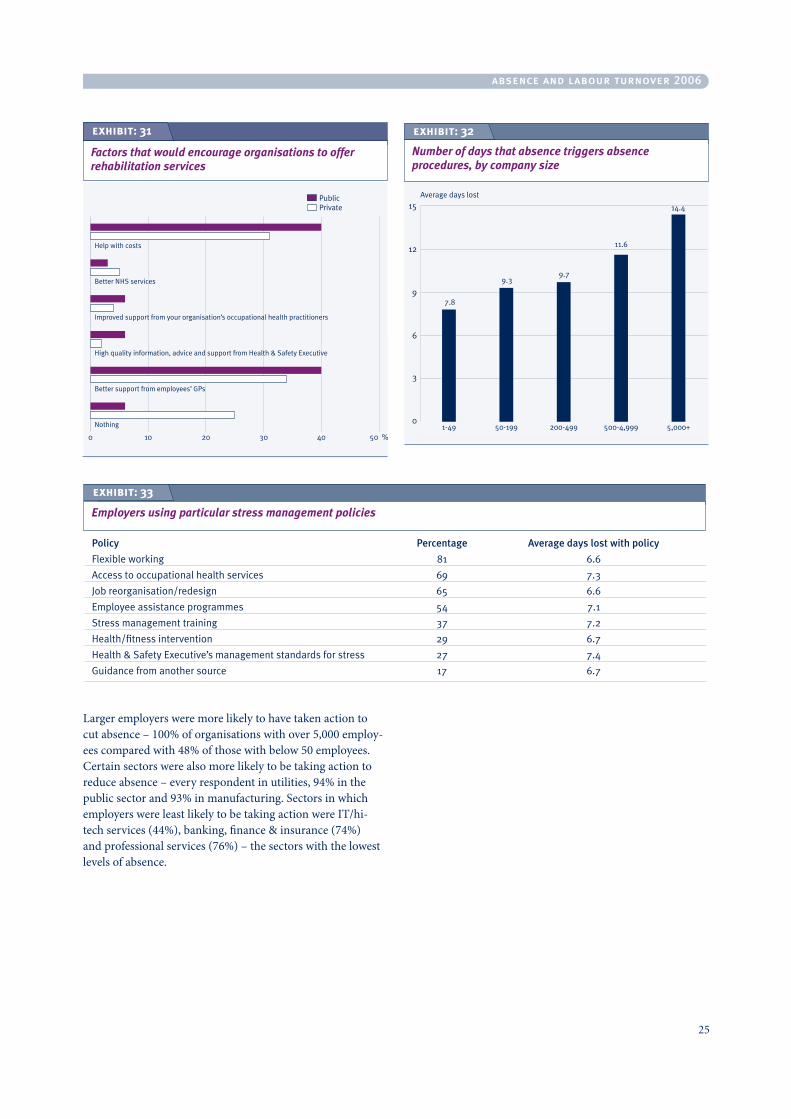
The survey asked what, if anything, would encourage employ-ers to offer rehabilitation services (Exhibit 31, page 25). Around a third said they would offer – or would offer more – rehabilitation if they could rely on better support from employees’ GPs (35%) and/or some assistance with costs (32%). As might be expected, smaller organisations with fewer than 200 employees would be more encouraged by help with costs whereas larger organisations with 500-5,000+ employees would like to see more support from employees’ GPs. There was little difference between the views of private and public sector employers.
It seems clear from these results that employers feel they need more support from employees’ GPs. Help with costs such as incentives for employers to provide early assessment and treat-ment could further increase the number of employers provid-ing rehabilitation services. There are encouraging signs from the recently published green paper on welfare reform that the government is focusing on the right issue: to engage GPs and other healthcare professionals to assist early return to work.
Manual Non-manual Use policy Don’t use Difference Use policy Don’t use Difference
Private medical insurance 7.4 9.1 1.7 5.5 6.3 0.8
Waiting days before occupational
sick pay is payable 8.0 8.7 0.7 5.6 6.0 0.4
Attendance bonuses 8.2 8.6 0.4 5.7 6.0 0.3
exhibit: 28
Absence policies and their impact on absence rates (mean absence level)
2�
Perceived effectiveness of absence policies for manual and non-manual employees
exhibit: 27
absence and labour turnover 2006
Smaller organisations intervene earlierThe average number of days of absence after which employ-ers triggered their absence policy was ten days. The number of days was lower in smaller organisations – just 7.8 days in organisations with fewer than 50 employees compared with 14.4 days for organisations with over 5,000 employees (Exhibit 32). This could be part of the success of small organi-sations in achieving low absence levels – an approach geared to early action – and perhaps intervention might reduce the likelihood of a spell of absence extending into a lengthy period.
Overall organisations in the best performing quartile trig-gered their absence procedures after an average of seven days – the worst performing organisations triggered their absence procedures after an average of ten days. A shorter trigger period in the best performing organisations may contribute to the difference of almost nine days absence between the best and worst performers.
Private sector employers show considerable variation in their trigger points – from 8.8 days in the professional services (the lowest) to 15.3 in transport & communications (one of the highest). In the public sector the average was ten days. The average number of spells of absence that triggered the use of an organisation’s absence policy was three.
more firms offer stress management policiesThree quarters of employers (74%) had a stress management policy. Just under half have a formal policy (40%) and the remainder (34%) had an informal policy.
Large organisations were more likely to have a stress policy and also more likely to have a formal policy. Almost all large employers (97%) had a policy compared with 43% of the smaller firms. Such policies were still more common in the public than in the private sector: 68% of public sector organisations have a formal policy and a further 22% have an informal policy. In the private sector 33% have a formal policy and 38% an informal policy.
The practices organisations use to help employees suffering from stress are many and varied (Exhibit 33). Flexible work-ing was the most prevalent practice, followed by access to occupational health services and job reorganisation/design. Flexible working was the most common practice in organisa-tions of all sizes but job re-organisation/redesign was more prevalent among smaller employers, and access to occupa-tional health services was more prevalent among medium and larger organisations.
most organisations are acting to reduce absence – but there is more to do A vast majority of respondents (85%) said they were taking action to reduce absence. But absence was higher in organi-sations that were taking action (6.9 days) compared with those that were not (5.0 days). This suggests employers with high absence levels are trying to address it – but this has not shown up as a reduction in absence levels yet.
exhibit: 29
Employers with arrangements to rehabilitate employees returning to work
2�
Usepolicy Don’tusepolicy
% Average days lost % Average days lost
Flexible working 96 6.9 5 6.7
Counselling 74 7.1 26 6.3
Training programmes 33 6.6 67 7.0
Medical/surgical treatment 30 6.2 70 7.2
Case management services 27 7.5 72 6.7
exhibit: 30
Rehabiliation policies and their impact on absence rates
absence and labour turnover 2006
Larger employers were more likely to have taken action to cut absence – 100% of organisations with over 5,000 employ-ees compared with 48% of those with below 50 employees. Certain sectors were also more likely to be taking action to reduce absence – every respondent in utilities, 94% in the public sector and 93% in manufacturing. Sectors in which employers were least likely to be taking action were IT/hi-tech services (44%), banking, finance & insurance (74%) and professional services (76%) – the sectors with the lowest levels of absence.
Factors that would encourage organisations to offer rehabilitation services
exhibit: 31 exhibit: 32
Number of days that absence triggers absence procedures, by company size
2�
Policy Percentage Averagedayslostwithpolicy
Flexible working 81 6.6
Access to occupational health services 69 7.3
Job reorganisation/redesign 65 6.6
Employee assistance programmes 54 7.1
Stress management training 37 7.2
Health/fitness intervention 29 6.7
Health & Safety Executive’s management standards for stress 27 7.4
Guidance from another source 17 6.7
exhibit: 33
Employers using particular stress management policies
absence and labour turnover 2006
Section 6: Labour turnover remains stable
SUmmAry
n Labour turnover fell to 15%
n Sectoral differences still prevalent
n Turnover highest in medium-sized organisations
n More employers are satisfied with turnover
n Job security fell in 2005.
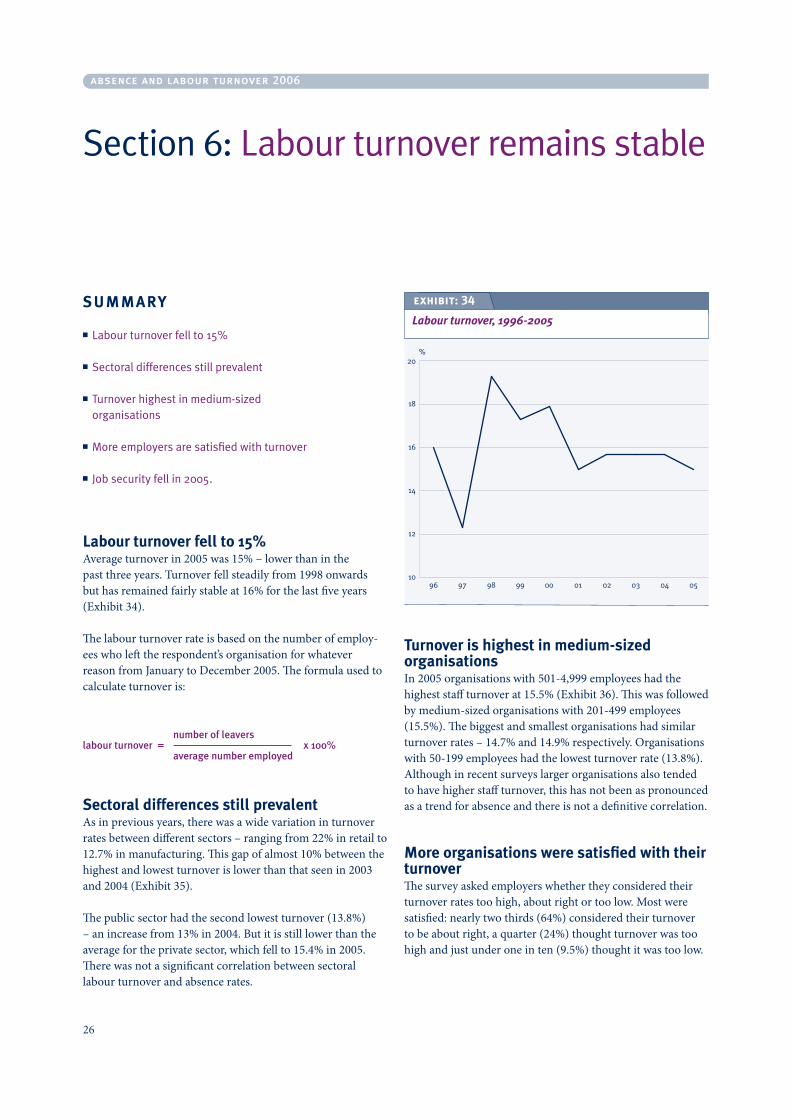
Labour turnover fell to 15% Average turnover in 2005 was 15% – lower than in the past three years. Turnover fell steadily from 1998 onwards but has remained fairly stable at 16% for the last five years (Exhibit 34).
The labour turnover rate is based on the number of employ-ees who left the respondent’s organisation for whatever reason from January to December 2005. The formula used to calculate turnover is:
numberofleaverslabourturnover=
averagenumberemployedx100%
Sectoral differences still prevalentAs in previous years, there was a wide variation in turnover rates between different sectors – ranging from 22% in retail to 12.7% in manufacturing. This gap of almost 10% between the highest and lowest turnover is lower than that seen in 2003 and 2004 (Exhibit 35).
The public sector had the second lowest turnover (13.8%) – an increase from 13% in 2004. But it is still lower than the average for the private sector, which fell to 15.4% in 2005. There was not a significant correlation between sectoral labour turnover and absence rates.
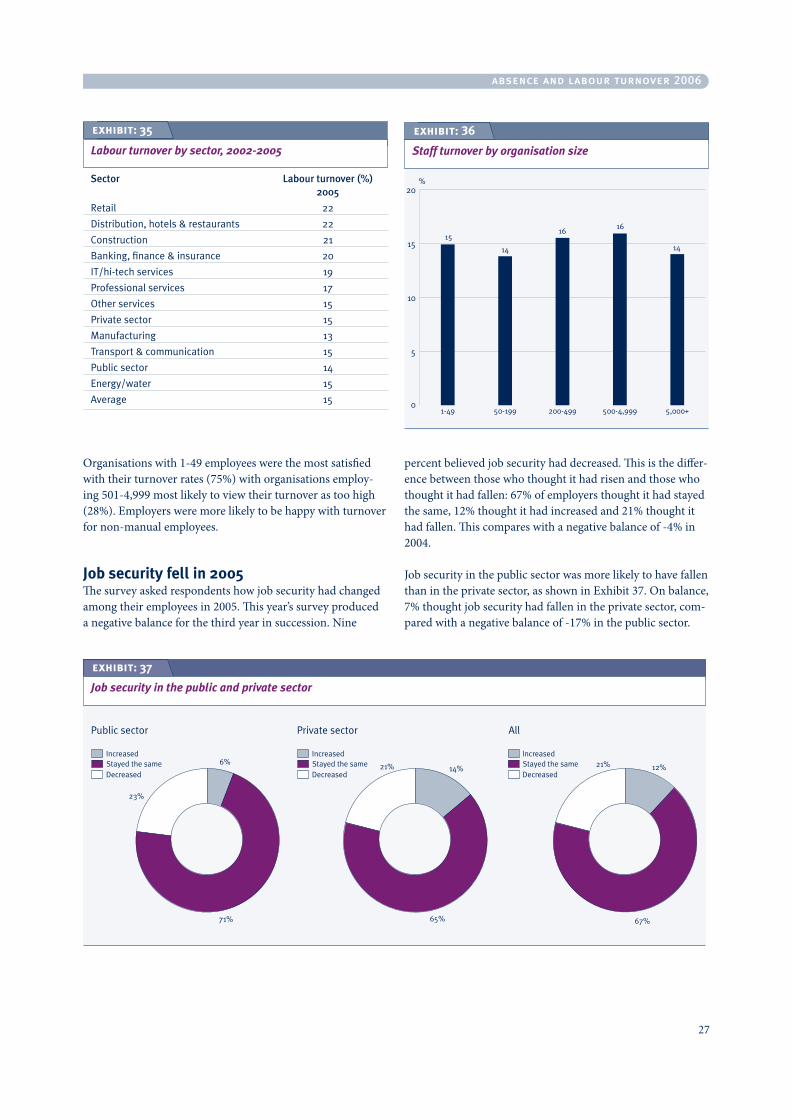
Turnover is highest in medium-sized organisationsIn 2005 organisations with 501-4,999 employees had the highest staff turnover at 15.5% (Exhibit 36). This was followed by medium-sized organisations with 201-499 employees (15.5%). The biggest and smallest organisations had similar turnover rates – 14.7% and 14.9% respectively. Organisations with 50-199 employees had the lowest turnover rate (13.8%). Although in recent surveys larger organisations also tended to have higher staff turnover, this has not been as pronounced as a trend for absence and there is not a definitive correlation.
more organisations were satisfied with their turnoverThe survey asked employers whether they considered their turnover rates too high, about right or too low. Most were satisfied: nearly two thirds (64%) considered their turnover to be about right, a quarter (24%) thought turnover was too high and just under one in ten (9.5%) thought it was too low.
exhibit: 34
Labour turnover, 1996-2005
2�
2�
absence and labour turnover 2006
Organisations with 1-49 employees were the most satisfied with their turnover rates (75%) with organisations employ-ing 501-4,999 most likely to view their turnover as too high (28%). Employers were more likely to be happy with turnover for non-manual employees.
Job security fell in 2005The survey asked respondents how job security had changed among their employees in 2005. This year’s survey produced a negative balance for the third year in succession. Nine
percent believed job security had decreased. This is the differ-ence between those who thought it had risen and those who thought it had fallen: 67% of employers thought it had stayed the same, 12% thought it had increased and 21% thought it had fallen. This compares with a negative balance of -4% in 2004.
Job security in the public sector was more likely to have fallen than in the private sector, as shown in Exhibit 37. On balance, 7% thought job security had fallen in the private sector, com-pared with a negative balance of -17% in the public sector.
Sector Labourturnover(%) 2005
Retail 22
Distribution, hotels & restaurants 22
Construction 21
Banking, finance & insurance 20
IT/hi-tech services 19
Professional services 17
Other services 15
Private sector 15
Manufacturing 13
Transport & communication 15
Public sector 14
Energy/water 15
Average 15
exhibit: 35
Labour turnover by sector, 2002-2005
exhibit: 37
Job security in the public and private sector
exhibit: 36
Staff turnover by organisation size

Questionnaire
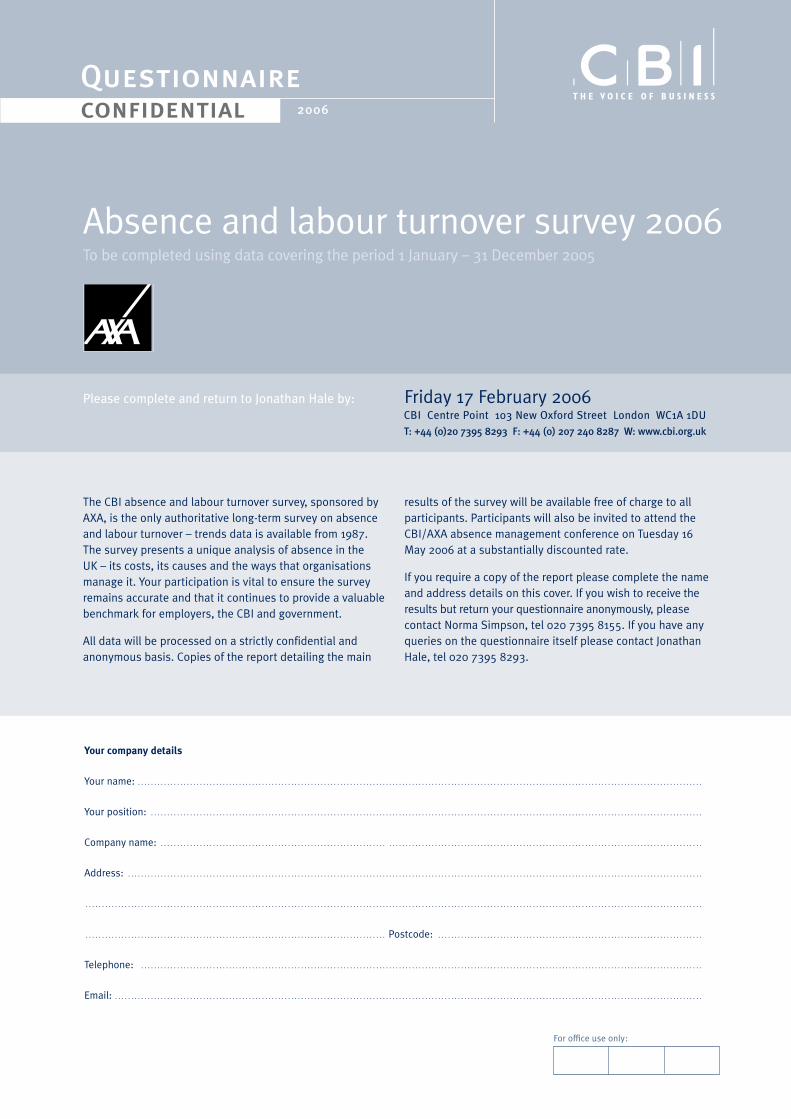
Please complete and return to Jonathan Hale by: Friday 17 February 2006CBI Centre Point 103 New Oxford Street London WC1A 1DUT:+44(0)2073958293F:+44(0)2072408287W:www.cbi.org.uk
The CBI absence and labour turnover survey, sponsored by AXA, is the only authoritative long-term survey on absence and labour turnover – trends data is available from 1987. The survey presents a unique analysis of absence in the UK – its costs, its causes and the ways that organisations manage it. Your participation is vital to ensure the survey remains accurate and that it continues to provide a valuable benchmark for employers, the CBI and government.
All data will be processed on a strictly confidential and anonymous basis. Copies of the report detailing the main
results of the survey will be available free of charge to all participants. Participants will also be invited to attend the CBI/AXA absence management conference on Tuesday 16 May 2006 at a substantially discounted rate.
If you require a copy of the report please complete the name and address details on this cover. If you wish to receive the results but return your questionnaire anonymously, please contact Norma Simpson, tel 020 7395 8155. If you have any queries on the questionnaire itself please contact Jonathan Hale, tel 020 7395 8293.
2006
For o÷ce use only:
your company details
Your name: . . . . . . . . . . . . . . . . . . . . . . . . . . . . . . . . . . . . . . . . . . . . . . . . . . . . . . . . . . . . . . . . . . . . . . . . . . . . . . . . . . . . . . . . . . . . . . . . . . . . . . . . . . . . . . . . . . . . . . . . . . . . . . . . . . . . . . . . . . . . . . . . . . . . . . . . . . . . . . . . . . . . . . . . . . . . .
Your position: . . . . . . . . . . . . . . . . . . . . . . . . . . . . . . . . . . . . . . . . . . . . . . . . . . . . . . . . . . . . . . . . . . . . . . . . . . . . . . . . . . . . . . . . . . . . . . . . . . . . . . . . . . . . . . . . . . . . . . . . . . . . . . . . . . . . . . . . . . . . . . . . . . . . . . . . . . . . . . . . . . . . . . . . .
Company name: . . . . . . . . . . . . . . . . . . . . . . . . . . . . . . . . . . . . . . . . . . . . . . . . . . . . . . . . . . . . . . . . . . . . . . . . . . . . . . . . . . . . . . . . . . . . . . . . . . . . . . . . . . . . . . . . . . . . . . . . . . . . . . . . . . . . . . . . . . . . . . . . . . . . . . . . . . . . . . . . . . . . .
Address: . . . . . . . . . . . . . . . . . . . . . . . . . . . . . . . . . . . . . . . . . . . . . . . . . . . . . . . . . . . . . . . . . . . . . . . . . . . . . . . . . . . . . . . . . . . . . . . . . . . . . . . . . . . . . . . . . . . . . . . . . . . . . . . . . . . . . . . . . . . . . . . . . . . . . . . . . . . . . . . . . . . . . . . . . . . . . . . .
. . . . . . . . . . . . . . . . . . . . . . . . . . . . . . . . . . . . . . . . . . . . . . . . . . . . . . . . . . . . . . . . . . . . . . . . . . . . . . . . . . . . . . . . . . . . . . . . . . . . . . . . . . . . . . . . . . . . . . . . . . . . . . . . . . . . . . . . . . . . . . . . . . . . . . . . . . . . . . . . . . . . . . . . . . . . . . . . . . . . . . . . . . . . .
. . . . . . . . . . . . . . . . . . . . . . . . . . . . . . . . . . . . . . . . . . . . . . . . . . . . . . . . . . . . . . . . . . . . . . . . . . . . . . . . . . . . . . . . . . . . Postcode: . . . . . . . . . . . . . . . . . . . . . . . . . . . . . . . . . . . . . . . . . . . . . . . . . . . . . . . . . . . . . . . . . . . . . . . . . . . . . . . . .
Telephone: . . . . . . . . . . . . . . . . . . . . . . . . . . . . . . . . . . . . . . . . . . . . . . . . . . . . . . . . . . . . . . . . . . . . . . . . . . . . . . . . . . . . . . . . . . . . . . . . . . . . . . . . . . . . . . . . . . . . . . . . . . . . . . . . . . . . . . . . . . . . . . . . . . . . . . . . . . . . . . . . . . . . . . . . . . . .
Email: . . . . . . . . . . . . . . . . . . . . . . . . . . . . . . . . . . . . . . . . . . . . . . . . . . . . . . . . . . . . . . . . . . . . . . . . . . . . . . . . . . . . . . . . . . . . . . . . . . . . . . . . . . . . . . . . . . . . . . . . . . . . . . . . . . . . . . . . . . . . . . . . . . . . . . . . . . . . . . . . . . . . . . . . . . . . . . . . . . . .
Absence and labour turnover survey 2006To be completed using data covering the period 1 January – 31 December 2005
confidential

�0
absence and labour turnover survey 2006
�1
Your organisation
Please indicate the sector in which your organisation primarily operates (please tick one box only).
1 Agriculture 2 Utilities 3 Manufacturing
4 Construction 5 Hotels and restaurants 6 Professional services
(legal, consultancy)
7 Retailing and distribution 8 Transport and communication 9 Banking, finance and insurance
10 IT/hi-tech services 11 Other services 12 Public sector
Please indicate where your organisation primarily operates (please tick one box only).
1 Operating in more than one region 2 Greater London 3 East Midlands
4 West Midlands 5 South Eastern 6 South West
7 Yorkshire and Humberside 8 Eastern 9 Wales
10 Scotland 11 Southern 12 Northern Ireland
13 Northern 14 North West
Please indicate the number of employees in your organisation according to whether they are manual or non-manual staff, full-time or part-time (please use all if you cannot provide disaggregated data).
full-time part-time all
Manual
Non-manual
Does your organisation currently recognise one or more trade unions?
Yes No
Absence in 2005
For as many groups as you are able, please indicate the average number of days of absence per employee between 1 January and 31 December 2005 (please use all if you cannot provide disaggregated data).
full-time part-time all
Manual
Non-manual
If possible, please give the average percentage of working time lost per employee in the following categories:
full-time part-time all
Manual
Non-manual
1
2
3
4
5
6
For o÷ce use only:
% % %
% % %
absence and labour turnover survey 2006
absence and labour turnover survey 2006
�2
7
8
9
10
Causes of absence
In your organisation, how significant do you perceive the following causes of absence to have been in 2005? Please tick one box for manual and non-manual for each possible cause, indicating its level of significance (1 = low significance and 5 = high significance). manual Non-manual
low high low high
Causes of absence 1 2 3 4 5 1 2 3 4 5
General illness (physical and mental)
Work-related accidents
Paid sickness absence seen as entitlement/ unauthorised absence
Home and family responsibilities
Personal problems (eg drink/drugs, relationship problems)
Poor workplace morale/lack of commitment
Poor management/leadership issues
How significant are the following types of illness in causing absence? Tick one box for manual and non-manual for each possible cause, indicating its level of significance (1 = low significance and 5 = high significance).
manual Non-manual
low high low high
Types of illness 1 2 3 4 5 1 2 3 4 5
Minor illness (cold, flu, migraine etc)
Serious long-term illness
Recurring illness (muscular/skeletal, back pain, repetitive strain, asthma etc)
Stress
Acute illness (heart attack, emergency surgery etc)
Does your organisation keep records on specific causes of absence and/or types of illness?
Causes of absence Yes No
Types of illness Yes No
Of the total amount of reported sickness absence in your organisation, what percentage do you believe to be not due to genuine sickness absence for whatever reason?
%
absence and labour turnover survey 2006
��
Do you consider that there may be a link between patterns of absence and the following external factors?
Yes, Yes, No Don’t definitely possibly know
Mondays/Fridays
Summer/Christmas/school holidays
Special events – eg cricket matches, football internationals
Other (please specify) ……………………………………………………………...........................
Does your organisation monitor long-term absence?
Yes No
If no, please continue to question 15.
How does your organisation define long-term absence? (Please indicate the minimum number of days which qualify as long-term absence, indicating whether this represents calendar days or working days by deleting as appropriate).
Long-term absence definition: calendar/working days or more.
What percentage of absence was long-term in 2005? If possible, please express as a percentage of absence spells (that is, incidents of absence) and as a percentage of total working time lost.
Percentage of absence spells that were long-term
Percentage of total working time lost due to these long-term spells of absence
Do you provide occupational sick pay? (If no, please continue to question 17).
Yes No
For how long do you provide occupational sick pay? (Please specify the maximum number of weeks which employees are entitled to).
At the full rate of pay weeks
At a reduced rate of pay weeks
11
12
13
14
15
16
%
%
absence and labour turnover survey 2006
��
Absence policies
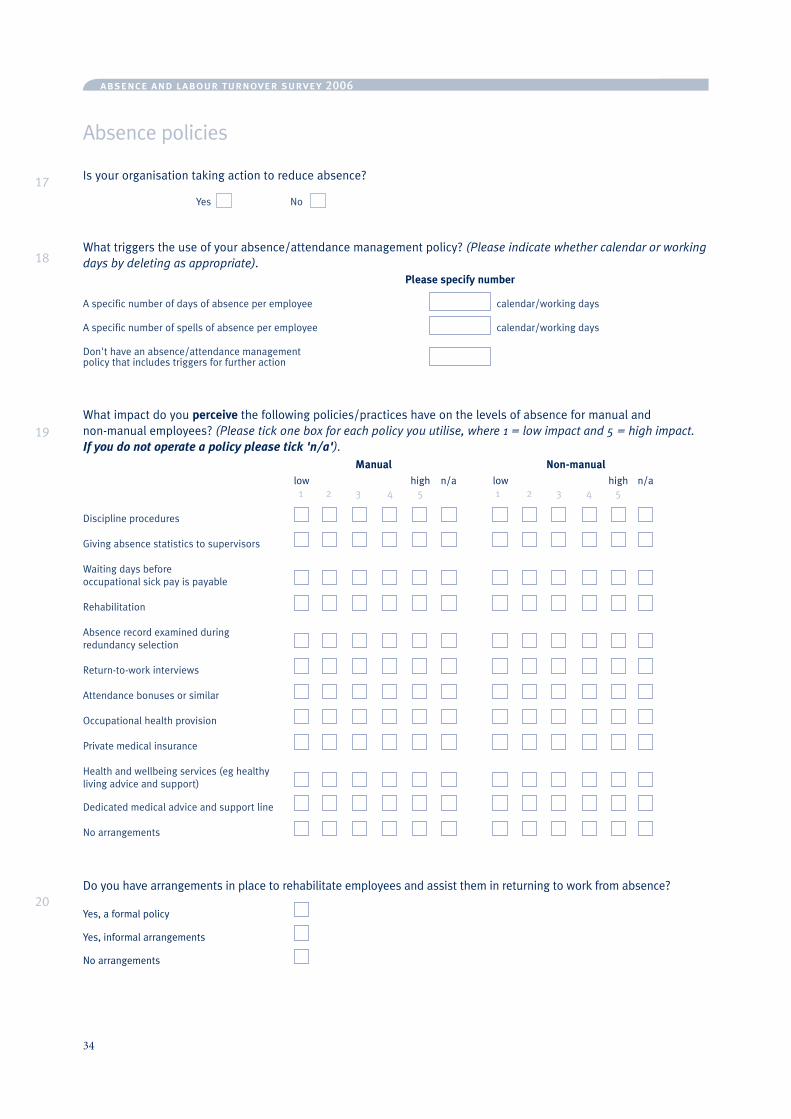
Is your organisation taking action to reduce absence?
Yes No
What triggers the use of your absence/attendance management policy? (Please indicate whether calendar or working days by deleting as appropriate). Please specify number
A specific number of days of absence per employee calendar/working days
A specific number of spells of absence per employee calendar/working days
Don't have an absence/attendance management policy that includes triggers for further action
What impact do you perceive the following policies/practices have on the levels of absence for manual and non-manual employees? (Please tick one box for each policy you utilise, where 1 = low impact and 5 = high impact. If you do not operate a policy please tick 'n/a'). manual Non-manual low high n/a low high n/a 1 2 3 4 5 1 2 3 4 5
Discipline procedures
Giving absence statistics to supervisors
Waiting days before occupational sick pay is payable
Rehabilitation
Absence record examined during redundancy selection
Return-to-work interviews
Attendance bonuses or similar
Occupational health provision
Private medical insurance
Health and wellbeing services (eg healthy living advice and support)
Dedicated medical advice and support line
No arrangements
Do you have arrangements in place to rehabilitate employees and assist them in returning to work from absence?
Yes, a formal policy
Yes, informal arrangements
No arrangements
17
18
19
20
absence and labour turnover survey 2006
��
21
22
23
24
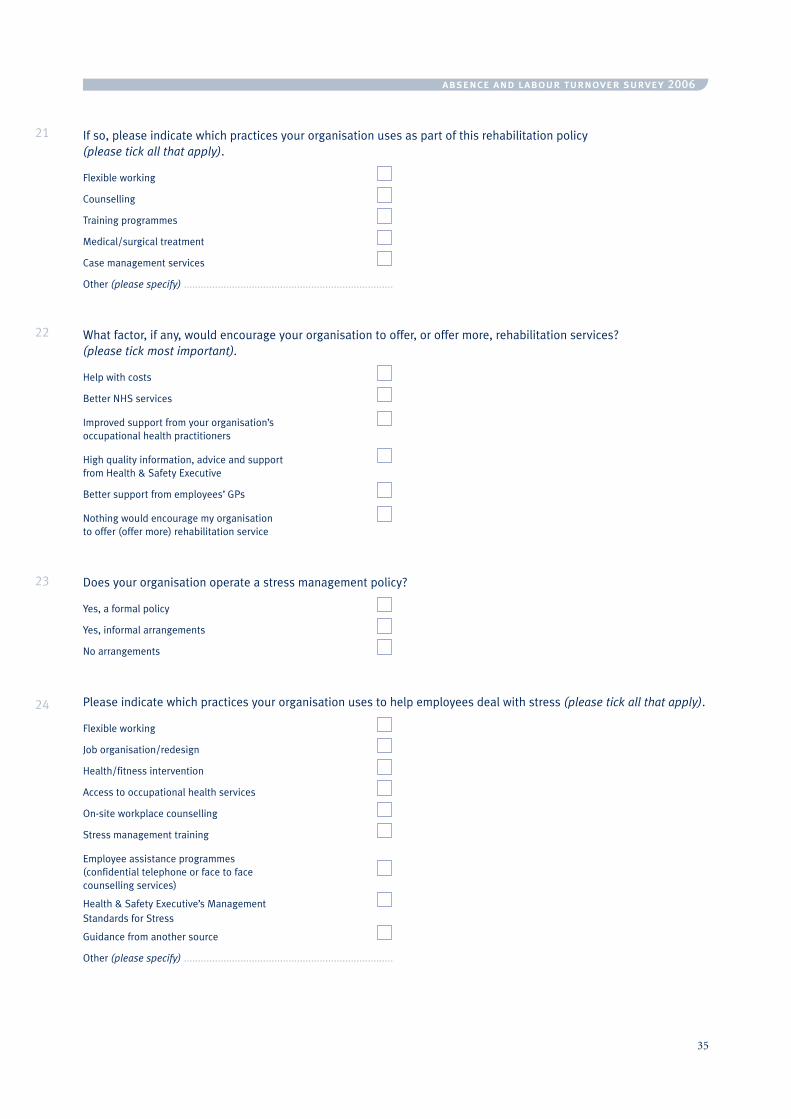
If so, please indicate which practices your organisation uses as part of this rehabilitation policy (please tick all that apply).
Flexible working
Counselling
Training programmes
Medical/surgical treatment
Case management services
Other (please specify) ..........................................................................
What factor, if any, would encourage your organisation to offer, or offer more, rehabilitation services? (please tick most important).
Help with costs
Better NHS services
Improved support from your organisation’s occupational health practitioners
High quality information, advice and support from Health & Safety Executive
Better support from employees’ GPs
Nothing would encourage my organisation to offer (offer more) rehabilitation service
Does your organisation operate a stress management policy?
Yes, a formal policy
Yes, informal arrangements
No arrangements
Please indicate which practices your organisation uses to help employees deal with stress (please tick all that apply).
Flexible working
Job organisation/redesign
Health/fitness intervention
Access to occupational health services
On-site workplace counselling
Stress management training
Employee assistance programmes (confidential telephone or face to face counselling services)
Health & Safety Executive’s Management Standards for Stress
Guidance from another source
Other (please specify) ..........................................................................
absence and labour turnover survey 2006
��
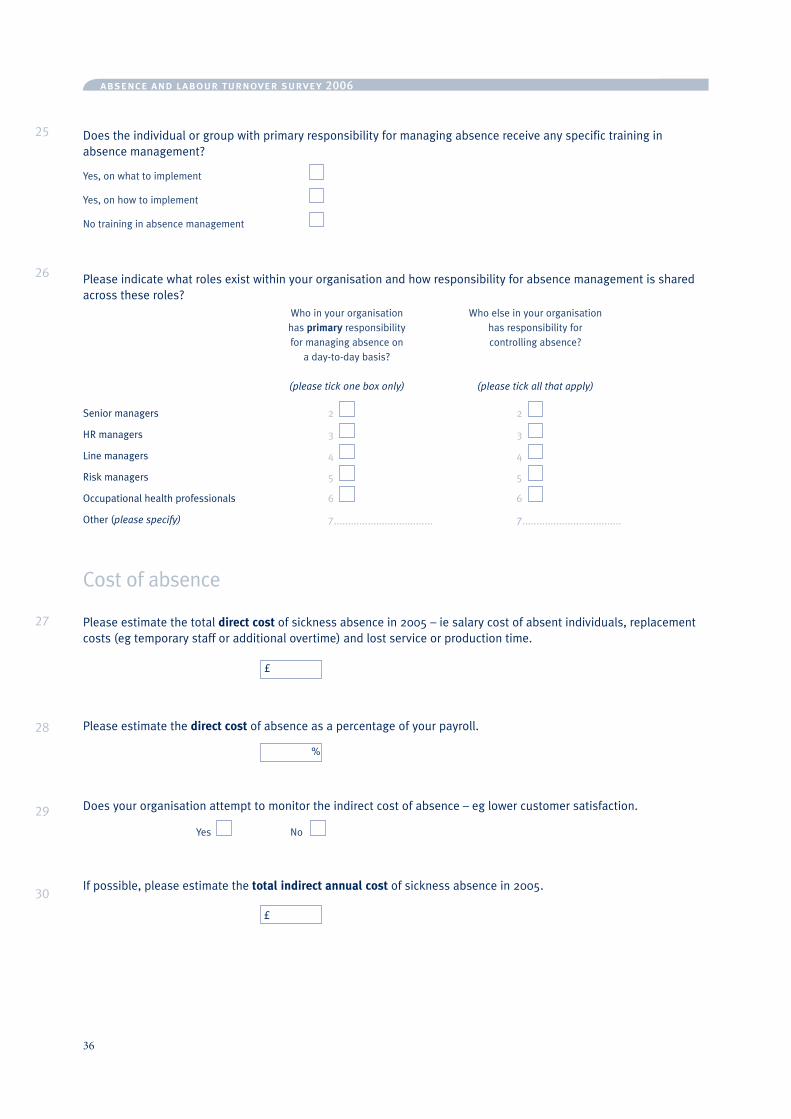
Does the individual or group with primary responsibility for managing absence receive any specific training in absence management?
Yes, on what to implement
Yes, on how to implement
No training in absence management
Please indicate what roles exist within your organisation and how responsibility for absence management is shared across these roles? Who in your organisation Who else in your organisation has primary responsibility has responsibility for for managing absence on controlling absence? a day-to-day basis?
(please tick one box only) (please tick all that apply)
Senior managers 2 2
HR managers 3 3
Line managers 4 4
Risk managers 5 5
Occupational health professionals 6 6
Other (please specify) 7 ................................... 7 ...................................
Cost of absence
Please estimate the total direct cost of sickness absence in 2005 – ie salary cost of absent individuals, replacement costs (eg temporary staff or additional overtime) and lost service or production time.
Please estimate the direct cost of absence as a percentage of your payroll.
Does your organisation attempt to monitor the indirect cost of absence – eg lower customer satisfaction.
Yes No
If possible, please estimate the total indirect annual cost of sickness absence in 2005.
25
26
27
28
29
30
£
£
%
absence and labour turnover survey 2006
��
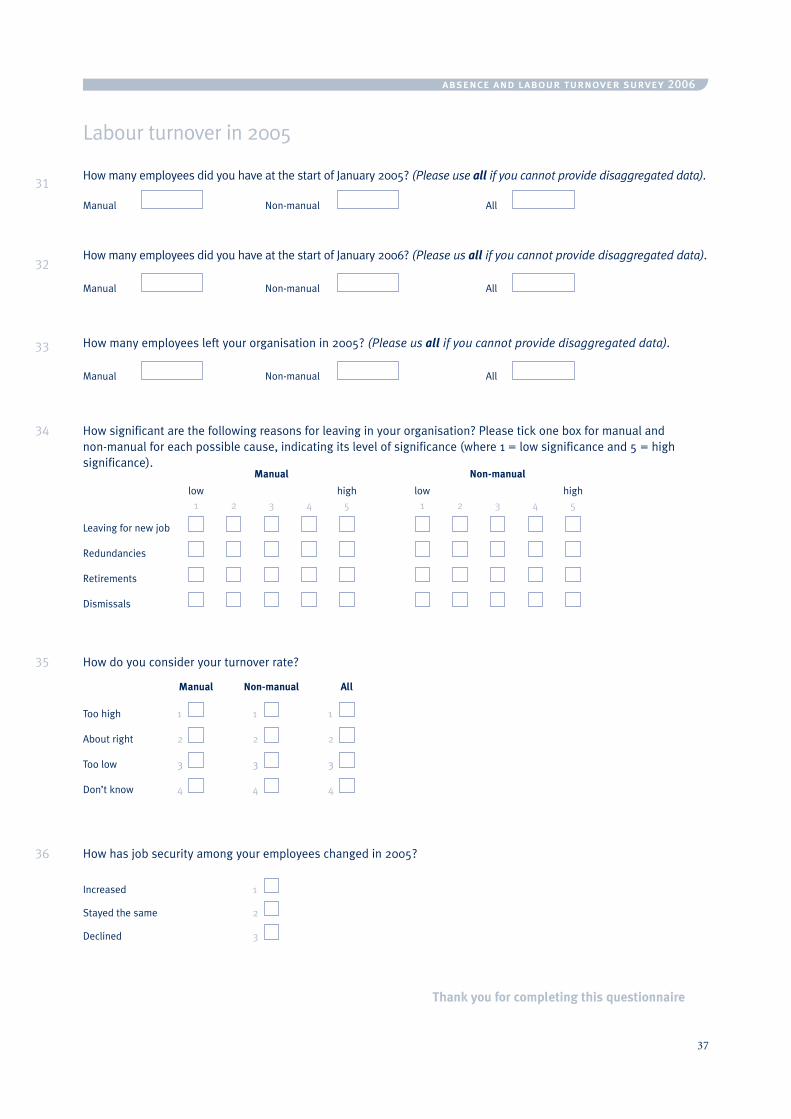
Labour turnover in 2005
How many employees did you have at the start of January 2005? (Please use all if you cannot provide disaggregated data).
Manual Non-manual All
How many employees did you have at the start of January 2006? (Please us all if you cannot provide disaggregated data).
Manual Non-manual All
How many employees left your organisation in 2005? (Please us all if you cannot provide disaggregated data).
Manual Non-manual All
How significant are the following reasons for leaving in your organisation? Please tick one box for manual and non-manual for each possible cause, indicating its level of significance (where 1 = low significance and 5 = high significance). manual Non-manual
low high low high 1 2 3 4 5 1 2 3 4 5
Leaving for new job
Redundancies
Retirements
Dismissals
How do you consider your turnover rate?
manual Non-manual All
Too high 1 1 1
About right 2 2 2
Too low 3 3 3
Don’t know 4 4 4
How has job security among your employees changed in 2005?
Increased 1
Stayed the same 2
Declined 3
31
32
33
34
35
36
Thank you for completing this questionnaire