abridged schemewise annual reports 2017 - 2018...were invested in reverse repos/cblo and (-0.37%) %...
TRANSCRIPT

Abridged Schemewise Annual Reports 2017 - 2018

► INDEX
1
25
48
72
95
118
141
163
185
207
229
253
278
304
329
355
379
412
HSBC Large Cap Equity Fund
HSBC Global Emerging Markets Fund
HSBC Multi Cap Equity Fund
HSBC Small Cap Equity Fund
HSBC Dynamic Asset Allocation Fund
HSBC Tax Saver Equity Fund
HSBC Global Emerging Markets Fund
HSBC Asia Pacific (Ex Japan) Dividend Yield Fund
HSBC Brazil Fund
HSBC Global Consumer Opportunities Fund
HSBC Regular Savings Fund
HSBC Short Duration Fund
HSBC Low Duration Fund
HSBC Cash Fund
HSBC Flexi Debt Fund
HSBC Debt Fund
HSBC Capital Protection Oriented Fund
HSBC Fixed Term Series
HSBC Managed Solutions 521

HSBC Large Cap Equity Fund (erstwhile HSBC Equity Fund)Large Cap Fund – An open ended equity Scheme predominantly investing in large cap stocks
Abridged Annual Report 2017 - 2018


1
Dear Investor,
Globally, we are witnessing a very interesting phase. The equity markets delivered a stellar performance in 2017. However, there are worries about the impact of higher rates, global trade wars, an economic growth moderation and higher volatility.
Closer home, India has become the world’s sixth-biggest economy. India has doubled its GDP to USD 2.2 trillion within a decade. The introduction of reform measures, including demonetisation and the Goods and Services Tax (GST), had put pressure on selective parts of the economy in 2017. The impact of these measures is likely to be transitory. India’s economic growth is expected to accelerate from 6.7% in FY18 to 7.4% in the current year as per IMF forecasts.
There has been a shift in the domestic savings pool supporting the market. Domestic investors have been increasing exposure to equities and financial assets moving away from gold and real estate. Mutual funds witnessed sizable inflows on the back of the boost in liquidity within the banking system from demonetisation. The AUM of the mutual fund industry grew by 21.7% in March 2018 compared to March 2017.
With growth, comes responsibility. Last year, the regulator, Securities and Exchange Board of India (SEBI) issued a circular to rationalise and categorise mutual fund schemes in India. We are pleased to state that none of our funds needed to be redesigned. All our schemes have been defined as per the new categorisation. We believe this classification will simplify investing into mutual funds and enhance comparability within the schemes offered.
As India moves to a digital age, e-commerce platforms are becoming increasingly popular. I request you to logon to our online transaction platform. It is a quick, convenient and an efficient tool to invest into our funds and manage your investments online.
At HSBC Global Asset Management, India, we are dedicated to one goal: delivering exceptional investment management for our clients. By bringing together our

2
global investment knowledge and capabilities, we are able to offer specialised expertise across asset classes. This has helped us to become a trusted partner to our individual and institutional investors.
We remain committed to our long-term perspective and disciplined investment approach as we conduct a rigorous, fundamental analysis of investments with a strong emphasis on risk management. Although the investment landscape appears favourable, it is worth remembering that markets are dynamic and constantly evolving. Therefore, we believe active, professional investment management serves investors well. Amid changing markets and economic conditions, we are confident that investors with a well-diversified portfolio and a patient, long-term outlook should be well positioned for the years ahead.
Together we thrive.
Warm regards,
Ravi Menon
Chief Executive Officer, HSBC Global Asset Management, India

3
SPONSORHSBC Securities and Capital Markets (India) Private LimitedRegd. Office: 52/60, Mahatma Gandhi Road, Fort, Mumbai - 400 001.
TRUSTEEBoard of TrusteesOffice: 16, Veer Nariman Road, Fort, Mumbai 400 001.
ASSET MANAGEMENT COMPANYHSBC Asset Management (India) Private LimitedCorp. & Regd. Office: 16, Veer Nariman Road, Fort, Mumbai 400 001.
CUSTODIANStandard Chartered Bank (SCB)Corp. & Regd. Office: Crescenzo, Securities Services, 3rd Floor, C-38/39, G-Block, Bandra Kurla Complex, Bandra East, Mumbai – 400051.
AUDITORS TO THE SCHEMEBSR & Co. LLPChartered Accountants 5th Floor, Lodha Excelus, Apollo Mills Compound, N.M. Joshi Marg, Mahalaxmi, Mumbai 400 011.
REGISTRAR & TRANSFER AGENTSComputer Age Management Services Private Limited (CAMS)Unit: HSBC Mutual Fund ’C’ Block, 2nd Floor, Hanudev Info Park P. Ltd., SF No. 558/2, Udayampalayam Road, Nava India, Coimbatore - 641 028.
BOARD OF TRUSTEESMr. Nasser Munjee
Mr. Manu Tandon
Mr. Mehli Mistri
Mr. Dilip J. Thakkar
Ms. Jasmine Batliwalla
Mr. Pedro Bastos
BOARD OF DIRECTORSMs. Kishori J. Udeshi - Chairperson
Mr. S. P. Mustafa
Mr. Dinesh Mittal
Mr. Ravi Menon - Chief Executive Officer

4
The Trustees of HSBC Mutual Fund (“Fund”) present the Sixteenth Annual Report and the audited abridged financial statements of the schemes of the Fund for the year ended March 31, 2018.
As at March 31, 2018, the Fund offered 30 schemes across asset classes to meet the varying investment needs of the investors. Notably, three Schemes of HSBC Mutual Fund viz. HSBC Large Cap Equity Fund, HSBC Short Duration Fund and HSBC Cash Fund have completed 15 years of operations during the year.
During the year, the Fund has launched Plan(s) under Fixed Term Series and carried out merger of the existing schemes viz HSBC Dividend Yield Equity Fund merged into HSBC Multi Cap Equity Fund (HMEF), erstwhile HSBC India Opportunities Fund, as offering sub-scale fund was not in the interest of the unitholders.
Further, in order to bring uniformity in the practice across Mutual Funds and to standardize the scheme categories and characteristics of schemes, SEBI vide its circular no. SEBI/HO/IMD/DF3/CIR/P/2017/114 dated October 06, 2017, issued guidelines for categorization and rationalization of Mutual Fund schemes.
Accordingly, HSBC Large Cap Equity Fund (erstwhile HSBC Equity Fund), HSBC Small Cap Equity Fund (erstwhile HSBC Mid Cap Equity Fund) , HSBC Infrastructure Equity Fund, HSBC Global Emerging Market Fund (erstwhile HSBC Emerging Market Fund), HSBC Debt Fund (erstwhile HSBC Income Fund – Investments Plan), HSBC Short Duration Fund (erstwhile HSBC Income Fund – Short Term Plan), HSBC Low Duration Fund (erstwhile HSBC Ultra Short Term Bond Fund), HSBC Regular Savings Fund (erstwhile HSBC Monthly Income Plan) and HSBC Managed Solutions have undergone fundamental attributes changes with effective from March 14, 2018.
The Fund continues its focus on delivering consistent long term returns. The comments on the performance of the Scheme(s) is provided hereinafter. Dividends were declared under various schemes as per the provisions contained in the respective Scheme Information Documents after considering the distributable surplus available under the respective Schemes. Details of dividends declared can be viewed on our website at www.assetmanagement.hsbc.com/in.
1. Scheme Performance, future outlook and oPerationS of the SchemeS
a. Operations and Performance of the Schemes
HSBC Large Cap Equity Fund (HLEF), erstwhile HSBC Equity Fund (Large Cap Fund – An open ended equity Scheme predominantly investing in large cap stocks)
HLEF seeks to generate long-term capital growth from an actively managed portfolio of equity and equity related securities of predominantly large cap companies. However, there can be no assurance or guarantee that the investment objective of the scheme would be achieved.
The net assets of HLEF amounted to Rs. 648.24 crores as at March 31, 2018 as against Rs. 598.66 crores as at March 31, 2017. Around 98.35% of the net assets were invested in equities, 2.02% of the net assets were invested in reverse repos/CBLO and (-0.37%) % in net current assets as at March 31, 2018.
HLEF is a large cap fund and we remained invested in a diversified portfolio across large capitalization stocks. The scheme has outperformed its benchmark over 3 year, 5 year period and since inception. It was possible due to superior stock selection, especially in sectors like Consumer Discretionary, Materials, and Energy. Going forward, we will continue with our approach of selecting sustainably profitable companies at reasonable valuations. In terms of allocation, being overweight in Financials, Industrials, and Consumer Discretionary sectors and underweight in Energy, Staples, Healthcare and Utilities sectors contributed to outperformance.
Scheme Name & Benchmarks Absolute Returns
(%)
Compounded Annualized Returns (%)
Date of Inception : 10 December 2002 1 Year 3 Years 5 Years Since Inception
HSBC Large Cap Equity Fund - Growth 10.24 9.19 14.04 21.35
Nifty 50 TRI (Scheme Benchmark) 12.68 7.99 13.63 17.47
S&P BSE Sensex TRI (Standard Benchmark) 13.51 7.76 13.48 17.43
Rs. 10,000, if invested in HLEF, would have become 11,024 13,024 19,295 193,368
Trustees’ ReportFor the year ended March 31, 2018

5
Scheme Name & Benchmarks Absolute Returns
(%)
Compounded Annualized Returns (%)
Date of Inception : 10 December 2002 1 Year 3 Years 5 Years Since Inception
Rs. 10,000, if invested in Nifty 50, would have become 11,268 12,599 18,950 117,588
Rs. 10,000, if invested in S&P BSE 200, would have become
11,351 12,518 18,826 116,976
Past performance may or may not be sustained in future. The returns for the respective periods are provided as on last business day of March 2018 for Growth Option. Different plans shall have a different expense structure. As TRI data is not available Since Inception of the scheme, benchmark performance is calculated using composite CAGR of S&P BSE Sensex PRI values from date 10-Dec- 2002 to date 31-May-2007 and TRI values since date 31-May-2007.
b. Market Overview & Outlook (as furnished by HSBC Asset Management (India) Private Limited)
EqUITY OUTLOOKIndian equity markets continued to remain strong during fiscal year 2017-18 and posted gains of 11.76% by S&P CNX Nifty and 13.24% by BSE Midcap index respectively. Biggest drivers of the markets were, robust DII flow into equities, continued push of mega reforms – Goods and Services Tax (GST) implementation, Insolvency and Bankruptcy Code implementation, Real Estate (Regulation and Development) Act, second consecutive normal monsoon, and electoral victories of the ruling party in many state elections. On the other hand, the markets weather the storm of disruption in economy due to GST implementation, lingering impact of demonetization, muted FII flows, and rising yields in developed markets. Domestic Mutual Fund segment had their best ever year and they brought in ~USD 22 bn of net inflows in equities during the year. Even after witnessing ~USD 4.3 bn of net outflows from the domestic insurers, the net DII tally was a very impressive ~USD 17.7 bn of net inflows. There were mixed global cues well and the Foreign Institutional Investors (FIIs) net bought Indian equities worth USD 3.2 bn. The inflows by both FIIs and domestic MFs acted as a factor in the strong market performance.
Indices Returns (April 1, 2017 to March 31, 2018) 1 Year (%)
S&P BSE Sensex 12.70%
NSE CNX Nifty 11.76%
S&P BSE 100 12.12%
S&P BSE 200 12.49%
S&P BSE 500 13.21%
S&P BSE Midcap 14.31%
S&P BSE 250 Small-cap 14.13%
Source: Bloomberg (All values are total return)
Our view on the key aspects related to equity markets are presented below -
The impressive performance in equity markets during FY 2017-18 has come on the back of strong liquidity largely by domestic MFs but supported in party by FII flows, positive global growth, benign macro – both domestically and global, expectation of the continuation of favorable policy environment domestically and expectation of corporate earnings revival. Possibility of sound macro, economic reforms and implementation of existing reforms have increased, especially after continued success of the ruling party at the centre in state elections. However, after this strong performance in markets and rather long wait for earnings to be delivered has meant that the equity markets are currently trading above their historical averages.
Moving into FY 2018-19, we expect a continuation of the economic recovery process domestically, recovery in corporate earnings - led early by volume growth, and continued DII flows. Government led investment
Trustees’ ReportFor the year ended March 31, 2018 (Contd...)

6
spending and rural consumption are likely to lead with private sector investments contributing later (possibly after general elections 2019). The budget document that was presented in early February provides a good medium term policy direction for the economy. Occasionally the policy actions can serve up a few bumps and jolts but over the medium term, across different governments, there is a thread of continuity connecting many key economic policies such as in the case of this year’s union budget. We, in our investment process, prefer to take comfort in these threads of continuity and remain constructive on the India growth story. This makes us positive on the Indian equity markets over the medium to long term.
Risks are in the form of market valuations trending above historical averages, weaker than expected delivery in corporate earnings going forward, external news flows related to trade protectionism, developed market central banks raising rates prematurely, and geopolitical tensions and other eco-political events would also influence market performance going forward, as the recent rally in the markets was supported by strong FII inflows.
DEBT OUTLOOKFixed Income in Financial Year 2017-18 has seen volatility further step up in this year. Markets went to perfect storm with higher crude prices, low liquidity and pressure on currency, apart from rate hike expectations.
Inflation has followed the glide path to lower numbers towards 4% RBI target and even lower than the target number when inflation printed a lowly 1.46% in June 2018 on back of lower food prices. RBI went for a cut despite of neutral stance. This positivity continued till until crude shock came in form of higher crude process. Global prices of Brent crude saw substantial increase in second half of the year, which jeopardized the inflation path. Other worries that gathered around this time were related to GST collection and eventual impact on fiscal situation.
Government of India allowed the fiscal deficit to slip to 3.5% (budget 3.2%) and kept next year target at 3.3% (in place of earlier path of 3%). This was on back of some excise relaxation for oil products and a month less collected for GST due to implementation in the current year. The fear of fiscal slippage alongwith the announcement of higher bond issuances spooked the bond markets into higher yields. Government finally borrowed only INR 90 bln extra (in place of INR 500 bln announced initially).
On the Monetary front the year was very volatile as well. RBI changed its stance to neutral causing some worry around rate hikes. Thereafter it cut rates and again went for OMO sales operations simultaneously. This created some confusion in the market participants regarding rates direction. Finally extra supply, higher oil prices and higher inflation paved way for rates higher. RBI also held position on regulatory forbearance about spreading out losses by banks publicly. It eventually gave up the position in the end of March. However, the swift changes in stance caused lot of pressure and volatility in bonds.
Liquidity situation continuously deteriorated due to OMO sales initially and withdrawal of deposits due to remonetisation. Further liquidity was absorbed out due to portfolio outflows and reduction in reserves. Despite of defense from RBI utilizing the reserves, the currency depreciated meaningfully, which caused further jitters in foreign investor sentiments. Lack of liquidity also affected 1-3 year rates which were elevated in second half of the year.
Going forward following are key variables to watch out for:• Liquidity: Liquidity will drive short end rates and eventually drive decisions leading to market interventions
and CRR cuts. RBI has focused now on neutral liquidity stance and providing liquidity to system, which will bode well short end rates.
• Inflation: Inflation numbers will determine future course of action for RBI and remains a critical variable for policy. We expect inflation to remain at 4.7% level in the ease in second half of FY 2018-19 in line with RBI’s expectations.
• Growth: GDP growth numbers as well as industrial activity will also determine the decision on policy.
• Fiscal deficit: Fiscal deficit and government spending will determine the government borrowing and crowding out in interest rate curve. We expect prudence in government spending and prospect of spending on infrastructure to pick up which will crowd in private investment as well.
• Current Account Deficit: Current Account Deficit determines how the pressure on currency works and effective management of forex reserves.
• Currency levels: Level of INR will determine how the central bank reacts to the situation on the global crisis etc.
Trustees’ ReportFor the year ended March 31, 2018 (Contd...)

7
2. Brief Background of SPonSorS, Board of truSteeS and aSSet management comPany
a. Sponsor
HSBC Mutual Fund is sponsored by HSBC Securities and Capital Markets (India) Private Limited (HSCI). The Sponsor is the Settler of the Mutual Fund Trust. The Sponsor has entrusted a sum of Rs. 1,00,000 (Rupees One Lakh only) to the Trustee as the initial contribution towards the corpus of the Mutual Fund.
HSCI offers integrated investment banking services, securities and corporate finance & advisory. HSCI is a member of the Bombay Stock Exchange Limited and National Stock Exchange (capital and derivative market segments). HSCI holds 100% of the paid up equity share capital of HSBC Asset Management (India) Private Limited.
b. HSBC Mutual Fund
HSBC Mutual Fund (“the Mutual Fund” or “the Fund”) has been constituted as a Trust in accordance with the provisions of the Indian Trusts Act, 1882 (2 of 1882) vide a Trust Deed dated February 7, 2002 with HSBC Securities and Capital Markets (India) Private Limited, as the Sponsor and the Board of Individual Trustees. The Trustee has entered into an Investment Management Agreement dated February 7, 2002 with HSBC Asset Management (India) Private Limited (AMC) to function as the Investment Manager for all the schemes of the Fund. The Fund was registered with SEBI vide registration number MF/046/02/5 dated May 27, 2002.
The Trust has been formed for the purpose of pooling of capital from the public for collective investment in securities for the purpose of providing facilities for participation by persons as beneficiaries in such investments and in the profits/income arising therefrom.
c. Board of Trustees (the Trustees)
The Board of Trustees is the exclusive owner of the Trust Fund and holds the same in trust for the benefit of the unit holders. The Trustees have been discharging their duties and carrying out the responsibilities as provided in the SEBI (Mutual Funds) Regulations, 1996 and the Trust Deed. The Trustees seek to ensure that the Fund and the schemes floated there under are managed by the AMC in accordance with the Trust Deed, the said Regulations, directions and guidelines issued by the SEBI, the Stock Exchanges, the Association of Mutual Funds in India and other regulatory agencies.
d. Asset Management Company (the AMC)
HSBC Asset Management (India) Private Limited (the Investment Manager or the AMC) is a private limited company incorporated under the Companies Act, 1956 on December 12, 2001 having its Registered Office at 16, V. N. Road, Fort, Mumbai 400 001. HSBC Asset Management (India) Private Limited has been appointed as the Asset Management Company of HSBC Mutual Fund by the Trustee vide Investment Management Agreement (IMA) dated February 7, 2002 and executed between the Trustees and the AMC. SEBI approved the AMC to act as the Investment Manager of the Fund vide its letter No. MFD/BC/163/2002 dated May 27, 2002. The paid-up equity share capital of the AMC is Rs. 61.59 crores. The AMC is registered as a Portfolio Manager under the SEBI (Portfolio Managers) Regulations, 1993 vide registration no. INP000001322. The AMC also offers non-binding Advisory services to offshore funds under the mutual fund license.
HSBC Securities and Capital Markets (India) Private Limited holds 100% of the paid up equity share capital of the AMC.
3. inveStment oBjective of the SchemeS The investment objective of the respective schemes has been provided above under the heading “Scheme
Performance, Future Outlook and Operation of the Scheme” (Refer Section 1).
4. Significant accounting PolicieS The Significant Accounting Policies form part of the Notes to the Accounts annexed to the Balance Sheet
of the Schemes in the Full Annual Report. The accounting policies are in accordance with Securities Exchange Board of India (Mutual Funds) Regulations 1996.
Trustees’ ReportFor the year ended March 31, 2018 (Contd...)

8
5. unclaimed dividendS & redemPtionS Summary of number of investors & corresponding amount Scheme-wise as on March 31, 2018.
SchemeUnclaimed Dividend Unclaimed Redemption
Amount (Rs.) No. of Investors
Amount (Rs.) No. of Investors
HSBC Large Cap Equity Fund 11,192,868.38 1284 7,687,209.04 165
6. inveStor ServiceSThe number of official points of acceptance of transactions is 205 locations. In addition to the offices of the Registrar & Transfer agents, the AMC has Investor Service Centres in 9 locations at its own offices - namely Mumbai, New Delhi, Kolkata, Bangaluru, Pune, Ahmedabad, Hyderabad, Chandigarh and Chennai. With a view to enhance customer convenience, the AMC has the facility of priority based servicing to key distributors through the enhancement of the Interactive Voice Reponses. The AMC has a single Toll Free number which can be dialed from anywhere in India. The call centre service is being managed by the Registrar and Transfer Agents.
On the distribution front, the number of empanelled distributors was 460 as on March 31, 2018. During the year, the AMC initiated tie-ups for online distribution of the Mutual Fund’s schemes with several channel partners taking the total number of such tie-ups to 42.
7. detailS of inveStor grievance redreSSalThe details of the redressal of investor complaints received against HSBC Mutual Fund during April 2017 - March 2018 are as follows:
2017-2018
Com- plaint Code
Type of complaint (a) No. of complaints
pending at the
beginning of the year
(b) No. of complaints received during
the year
Action on (a) and (b)
Resolved Non Actiona-
ble*
Pending
Within 30
days
30 - 60 days
60 - 180 days
Beyond 180 days
0 - 3 months
3 - 6 months
6 - 9 months
9 - 12 months
I A Non receipt of Dividend on Units
0 5 4 1 0 0 0 0 0 0 0
I B Interest on delayed payment of Dividend
0 0 0 0 0 0 0 0 0 0 0
I C Non receipt ofRedemption Proceeds
1 12 12 1 0 0 0 1 0 0 0
I D Interest on delayedp a y m e n t o f Redemption
0 1 1 0 0 0 0 0 0 0 0
II A Non receipt of Statement of Account / Unit Certificate
0 0 0 0 0 0 0 0 0 0 0
II B D i s c r e p a n c y i n Statement of Account
0 0 0 0 0 0 0 0 0 0 0
II C Data corrections in Investor details **
0 34 34 0 0 0 0 0 0 0 0
II D Non receipt of Annual Report /Abridged Summary
0 0 0 0 0 0 0 0 0 0 0
Trustees’ ReportFor the year ended March 31, 2018 (Contd...)

9
2017-2018
Com- plaint Code
Type of complaint (a) No. of complaints
pending at the
beginning of the year
(b) No. of complaints received during
the year
Action on (a) and (b)
Resolved Non Actiona-
ble*
Pending
Within 30
days
30 - 60 days
60 - 180 days
Beyond 180 days
0 - 3 months
3 - 6 months
6 - 9 months
9 - 12 months
III A Wrong switch between Schemes
0 0 0 0 0 0 0 0 0 0 0
III B Unauthorized switch between Schemes
0 0 0 0 0 0 0 0 0 0 0
III C Deviation from Scheme attributes
0 0 0 0 0 0 0 0 0 0 0
III D Wrong or excess charges / load
0 0 0 0 0 0 0 0 0 0 0
III E Non updat ion of changes viz. address, PAN, bank details, nomination, etc
0 6 6 0 0 0 0 0 0 0 0
IV Others 1 41 42 0 0 0 0 0 0 0 0
Total 2 99 99 2 0 0 0 0 0 0 0
Summary of Complaints for FY 2017-18
Particulars Count
Total complaints received 99
Total number of folios 140099
% of complaints against the folio 0.071%
# active folios** As per AMFI Best Practice Guidelines Circular No.25/2011-12 for Revisions in the Guidelines on
Standardization of Complaints/Grievances Reporting Procedure. If “Others” include a type of complaint which is more than 10% of overall complaints, then such a reason should be provided separately. Hence data corrections in Investor Details is included as a separate category
* Non actionable means the complaint is incomplete / outside the scope of the mutual fund
8. inveStor education initiativeS The Fund undertook various investor education and awareness initiatives related to investments in mutual funds throughout India in English / Hindi and Regional languages via mass media. The Fund conducted 16 roadshows at various locations in India to promote various Investor Awareness related topics including Asset Allocation, SIPs, Equity Mutual Funds and Financial Planning. The Fund has a Year-long tie-up with Mutual Fund Insights Magazine that includes 3 pages of content and advertorial publication in their monthly issue. Each issue contains a story promoting SIPs to achieve one’s various investment goals. In the month of December 2017 and January 2018 investor awareness promotion was done through Outlook and Outlook Money magazines through advertorials on various Mutual Fund topics.
9. Proxy voting PolicyIn terms of SEBI Circular no. SEBI/IMD/CIR No. 18/198647/2010 dated March 15, 2010, the Fund has adopted Proxy Voting Policy and Procedures for exercising voting rights in respect of securities held by the Schemes.
The summary of the votes casted in the general meetings of the Investee companies, by the AMC for and on behalf of the Schemes of the Fund, for the financial year 2017-18 is provided below:
Trustees’ ReportFor the year ended March 31, 2018 (Contd...)

10
quarter Total no. of resolutions
Break-up of vote decision
For Against Abstained
June 2017 184 116 5 63
September 2017 920 827 12 81
December 2017 49 45 1 3
March 2018 36 29 1 6
Total 1,189 1,017 19 153
In terms of the requirement of SEBI Circular no. CIR/IMD/DF/05/2014 dated March 24, 2014 and SEBI/HO/IMD/DF2/CIR/P/2016/68 dated August 10, 2016; the AMC has obtained certificate from M/s. M. P. Chitale & Co., Chartered Accountants, who is acting as a Scrutinizer, on the voting report for the FY 2017-18. The certificate dated May 3, 2018 issued by M/s. M. P. Chitale & Co., is available on the website of the AMC as part of the full Annual Report.
Unit holders can refer to the full Annual Report for complete details of actual exercise of votes in the general meetings of the investee companies for the financial year 2017-18 or log on to our website at www.assetmanagement.hsbc.com/in.
10. Statutory detailSa) The Sponsors are not responsible or liable for any loss resulting from the operation of the Schemes of
the Fund beyond initial contribution of Rs. 1 lakh for setting up the Fund.
b) The price and redemption value of the units, and income from them, can go up as well as down with fluctuations in the market value of its underlying investments.
c) Full Annual Report shall be disclosed on the website at www.assetmanagement.hsbc.com/in and shall be available for inspection at the Head Office of the Mutual Fund. Present and prospective unit holders can obtain copy of the Trust Deed, the full Annual Report of the Scheme(s), the Annual Report of HSBC Asset Management (India) Private Limited and the text of the relevant Scheme(s) at a price.
11. acknowledgementSThe Trustees wish to thank the Unit holders of the Schemes for their support throughout the year and also thank the Government of India, the Securities and Exchange Board of India (SEBI), the Reserve Bank of India (RBI) and the Association of Mutual Funds in India (AMFI) for the guidance provided by them. The Trustees also appreciate the services provided by the Registrar and Transfer Agent, Fund Accountant, Custodian, Bankers, Distributors and Brokers. The guidance and services provided by the Auditors and advocates and the ebullience, sincerity and dedication of the employees of HSBC Asset Management (India) Private Limited is also appreciated.
The Trustees look forward to the continued support of everyone.
For and on behalf of the Board of Trustees of HSBC Mutual Fund
Sd/-
Dilip Thakkar
Trustee
Mumbai
July 17, 2018.
Trustees’ ReportFor the year ended March 31, 2018 (Contd...)

11
To the Board of Trustees of
HSBC Mutual Fund – HSBC Large Cap Equity Fund (Formerly known as HSBC Equity Fund)
Report on the Financial StatementsWe have audited the accompanying Financial Statements of HSBC Large Cap Equity Fund (formerly known as HSBC Equity Fund) (the ‘Scheme’), which comprise the balance sheet as at 31 March 2018, the related revenue account and the cash flow statement for the year then ended, and a summary of significant accounting policies and other explanatory information, annexed thereto.
Management’s responsibility for the Financial StatementsThe Board of Trustees to the HSBC Mutual Fund (the ‘Board of Trustees’) and HSBC Asset Management (India) Private Limited (the ‘AMC’), being the investment manager to HSBC Mutual Fund (the ‘Fund’) (collectively referred as ‘Management’), are responsible for the preparation of these financial statements that give a true and fair view of the financial position and financial performance of the Scheme in accordance with the accounting policies and standards specified in the Ninth Schedule of the Securities and Exchange Board of India (Mutual Funds) Regulations, 1996, as amended (the ‘Regulations’) and the accounting principles generally accepted in India. This responsibility includes maintenance of adequate accounting records for safeguarding of the assets of the Scheme and for preventing and detecting frauds and other irregularities; selection and application of appropriate accounting policies; making judgments and estimates that are reasonable and prudent; and design, implementation and maintenance of adequate internal financial controls, that were operating effectively for ensuring the accuracy and completeness of the accounting records, relevant to the preparation and presentation of the financial statements that give a true and fair view and are free from material misstatement, whether due to fraud or error.
In preparing the financial statements, management is responsible for assessing the Scheme’s ability to continue as a going concern, disclosing, as applicable, matters related to going concern and using the going concern basis of accounting unless management either intends to liquidate the Fund or to cease operations, or has no realistic alternative but to do so.
Auditor’s ResponsibilityOur responsibility is to express an opinion on these financial statements based on our audit. We conducted our audit in accordance with the Standards on Auditing issued by the Institute of Chartered Accountants of India (the ‘ICAI’). Those Standards require that we comply with ethical requirements and plan and perform the audit to obtain reasonable assurance about whether the financial statements are free from material misstatement.
An audit involves performing procedures to obtain audit evidence about the amounts and disclosures in the financial statements. The procedures selected depend on the auditor’s judgment, including the assessment of the risks of material misstatement of the financial statements, whether due to fraud or error. In making those risk assessments, the auditor considers internal controls relevant to preparation and fair presentation of the financial statements, of the Scheme, in order to design audit procedures that are appropriate in the circumstances, but not for the purpose of expressing an opinion on the effectiveness of the Scheme’s internal controls. An audit also includes evaluating the appropriateness of accounting policies used and the reasonableness of the accounting estimates made by Management, as well as evaluating the overall presentation of the financial statements.
We are also responsible to conclude on the appropriateness of management’s use of the going concern basis of accounting and, based on the audit evidence obtained, whether a material uncertainty exists related to events or conditions that may cast significant doubt on the Scheme’s ability to continue as a going concern. If we conclude that a material uncertainty exists, we are required to draw attention in the auditor’s report to the related disclosures in the financial statements or, if such disclosures are inadequate, to modify the opinion. Our conclusions are based on the audit evidence obtained up to the date of the auditor’s report. However, future events or conditions may cause the Scheme to cease to continue as a going concern.
We believe that the audit evidence we have obtained is sufficient and appropriate to provide a basis for our audit opinion.
Independent Auditors’ Report
12
Independent Auditors’ Report (Contd...)
OpinionIn our opinion, and to the best of our information and according to the explanations given to us, the aforesaid financial statements give the information required by the Regulations in the manner so required and give a true and fair view in conformity with the accounting principles generally accepted in India:
(i) in the case of the balance sheet, of the state of affairs of the Scheme as at 31 March 2018;
(ii) in the case of the revenue account, of the net surplus for the year ended on that date; and
(iii) in the case of the cash flow statement, of the cash flows of the Scheme for the year ended on that date.
Report on other Legal and Regulatory Requirements1 As required by Regulation 55(4) to the Regulations, we report that:
(a) We have obtained all information and explanations which, to the best of our knowledge and belief, were necessary for the purposes of the audit;
(b) The balance sheet and revenue account have been prepared in accordance with the accounting policies and standards specified in the Ninth Schedule of the Regulations.
2 As required by Clause 5(ii)(2) of the Eleventh Schedule of the Regulations, we report that the balance sheet and revenue account are in agreement with the books of account of the Scheme.
3 In our opinion and on the basis of information and explanations given to us, the methods used to value non - traded securities, as at 31 March 2018, as determined by the Board of Directors of AMC, are in accordance with the Regulations and other guidelines issued by the Securities and Exchange Board of India as applicable and approved by the Board of Trustees are fair and reasonable.
For B S R & Co. LLP Chartered Accountants Firm’s Registration No: 101248W/W-100022
Sd/-
Milind Ranade Partner Membership No: 100564
Place : Mumbai Date : July 17, 2018.

13
Abridged Balance Sheet as at March 31, 2018
Rs. in Lakhs
HSBC LARGE CAP EqUITY FUNDAs at
March 31, 2018As at
March 31, 2017
LIABILITIES1 Unit Capital 7,688.07 7,764.84 2 Reserves & Surplus2.1 Unit Premium Reserves (10,058.80) (10,081.39)2.2 Unrealised Appreciation Reserve 11,220.67 13,606.79 2.3 Other Reserves 55,973.77 48,607.04 3 Loans & Borrowings – – 4 Current Liabilities & Provisions4.1 Provision for doubtful Income/Deposits – – 4.2 Other Current Liabilities & Provisions 470.57 461.94
TOTAL 65,294.28 60,359.22
ASSETS 0.00 0.00
1 Investments1.1 Listed Securities:1.1.1 Equity Shares 63,757.42 58,869.22 1.1.2 Preference Shares – – 1.1.3 Equity Linked Debentures – – 1.1.4 Other Debentures & Bonds – – 1.1.5 Securitised Debt securities – – 1.2 Securities Awaited Listing:1.2.1 Equity Shares – – 1.2.2 Preference Shares – – 1.2.3 Equity Linked Debentures – – 1.2.4 Other Debentures & Bonds – – 1.2.5 Securitised Debt securities – – 1.3 Unlisted Securities1.3.1 Equity Shares – – 1.3.2 Preference Shares – – 1.3.3 Equity Linked Debentures – – 1.3.4 Other Debentures & Bonds – – 1.3.5 Securitised Debt securities – – 1.4 Government Securities – – 1.5 Treasury Bills – – 1.6 Commercial Paper – – 1.7 Certificate of Deposits – – 1.8 Bill Rediscounting – – 1.9 Units of Domestic Mutual Fund – – 1.10 Foreign Securities – –
Total Investments 63,757.42 58,869.22
2 Deposits 8.76 5.25 3 Other Current Assets3.1 Cash & Bank Balance 65.24 24.07 3.2 CBLO/Reverse Repo Lending 1,308.02 873.25 3.3 Others 154.84 587.43 4 Deferred Revenue Expenditure (to the extent not written off) – –
TOTAL 65,294.28 60,359.22
Notes to Accounts – Annexure I

14
Abridged Revenue Account for the year ended March 31, 2018
Rs. in Lakhs
HSBC LARGE CAP EqUITY FUNDCurrent
Year ended March 31, 2018
Previous Year ended
March 31, 2017
1 INCOME1.1 Dividend 948.02 672.09 1.2 Interest 93.66 77.17 1.3 Realised Gain / (Loss) on Foreign Exchange Transactions – – 1.4 Realised Gains / (Losses) on Interscheme sale of investments – – 1.5 Realised Gains / (Losses) on External sale / redemption of
investments8,601.21 8,574.14
1.6 Realised Gains / (Losses) on Derivative Transactions – – 1.7 Other Income 0.23 0.35
(A) 9,643.12 9,323.75
2 EXPENSES2.1 Management fees 983.35 931.59 2.2 GST / Service tax on Management fees 170.10 138.93 2.3 Transfer agents fees and expenses 84.62 72.29 2.4 Custodian fees 7.79 7.08 2.5 Trusteeship fees 1.31 1.27 2.6 Commission to Agents 254.04 222.89 2.7 Marketing & Distribution expenses – – 2.8 Audit fees 3.78 3.47 2.9 Investor Education Expenses 12.94 11.74 2.10 Other operating expenses 18.28 15.75 2.11 Less:Expenses to be Reimbursed by the Investment Manager – –
(B) 1,536.21 1,405.01
3 NET REALISED GAINS/(LOSSES) FOR THE YEAR (A–B=C) 8,106.91 7,918.74
4 Change in Unrealised Depreciation in value of investments and derivatives (D) – –
5 NET GAINS / (LOSSES) FOR THE YEAR [E=(C+D)] 8,106.91 7,918.74
6 Change in unrealised appreciation in the value of investments and derivatives (F) (2,386.12) 5,108.16
7 NET SURPLUS / (DEFICIT) FOR THE YEAR (E+F=G) 5,720.79 13,026.90
7.1 Add: Balance transfer from Unrealised Appreciation Reserve 2,386.12 – 7.2 Less: Balance transfer to Unrealised Appreciation Reserve – 5,108.16 7.3 Add / (Less): Equalisation 1,655.83 (6,696.89)7.4 Transfer from Reserve Fund 48,607.04 49,509.44
8 Total 58,369.78 50,731.29
9 Dividend appropriation9.1 Income Distributed during the year 2,396.01 2,124.25 9.2 Tax on income distributed during the year – – 10 Retained Surplus / (Deficit)
carried forward to Balance sheet 55,973.77 48,607.04
Notes to Accounts – Annexure I

15
Key Statistics for the year ended March 31, 2018
HSBC LARGE CAP EqUITY FUND Current
Year ended March 31, 2018
Previous Year ended
March 31, 2017
1. NAV per unit (Rs.):
Open
Regular Plan Growth Option 176.9354 141.2682
Regular Plan Dividend Option 29.1250 25.8480
Direct Plan - Growth Option 182.5970 144.7545
Direct Plan - Dividend Option 30.2968 26.6029
High
Regular Plan Growth Option 213.9390 177.0058
Regular Plan Dividend Option 33.3533 30.8070
Direct Plan - Growth Option 222.0827 182.6662
Direct Plan - Dividend Option 34.8786 31.8040
Low
Regular Plan Growth Option 176.1402 137.2160
Regular Plan Dividend Option 22.7841 24.6306
Direct Plan - Growth Option 127.5066 140.6212
Direct Plan - Dividend Option 23.4331 25.5723
End
Regular Plan Growth Option 193.2264 176.9354
Regular Plan Dividend Option 28.4644 29.1250
Direct Plan - Growth Option 200.8599 182.5970
Direct Plan - Dividend Option 29.9810 30.2968
2. Closing Assets Under Management (Rs. in Lakhs)
End 64,824 59,866
Average (AAuM)1 64,706 58,719
3. Gross income as % of AAuM2 14.90% 15.88%
4. Expense Ratio:
a. Total Expense as % of AAuM (including service tax / GST on Management fees) (planwise)
Regular Plan (Continue) 2.66% 2.66%
Direct Plan 1.93% 1.95%
b. Management Fee as % of AAuM (planwise)
Regular Plan (Continue) 1.52% 1.59%
Direct Plan 1.52% 1.59%
5. Net Income as a percentage of AAuM3 12.53% 13.49%
6. Portfolio turnover ratio4 0.88 0.82

16
Key Statistics for the year ended March 31, 2018 (Contd...)
HSBC LARGE CAP EqUITY FUND Current
Year ended March 31, 2018
Previous Year ended
March 31, 2017
7. Total Dividend per unit distributed during the year (planwise)
Retail
Regular Plan Dividend Option 3.50 3.00
Direct Plan - Dividend Option 3.50 3.00
Corporate
Regular Plan Dividend Option 3.50 3.00
Direct Plan - Dividend Option 3.50 3.00
8. Returns (%):
a. Last One Year
Scheme
Regular Plan Growth Option 10.2432 25.2479
Direct Plan - Growth Option 11.0445 26.1425
Benchmark
Nifty 50 12.6800 18.5484
b. Since Inception
Scheme
Regular Plan Growth Option 21.3459 22.2272
Direct Plan - Growth Option 12.7385 13.3624
Benchmark
Nifty 50 17.4700 16.2430
1. AAuM=Average daily net assets2. Gross income = amount against (A) in the Revenue Account i.e. Income3. Net income = amount against (C) in the Revenue Account i.e. Net Realised Gains / (Losses) for the year4. Portfolio Turnover = Lower of sales or purchase divided by the Average AuM for the year5. The net asset value disclosed represents the computed NAV on March 31, 2018 (Non-business Day), and
not the last declared NAV
17
Notes to Accounts – Annexure ITo the Abridged Balance Sheet and Revenue Account for the Year ended March 31, 2018
hSBc large caP eQuity fund
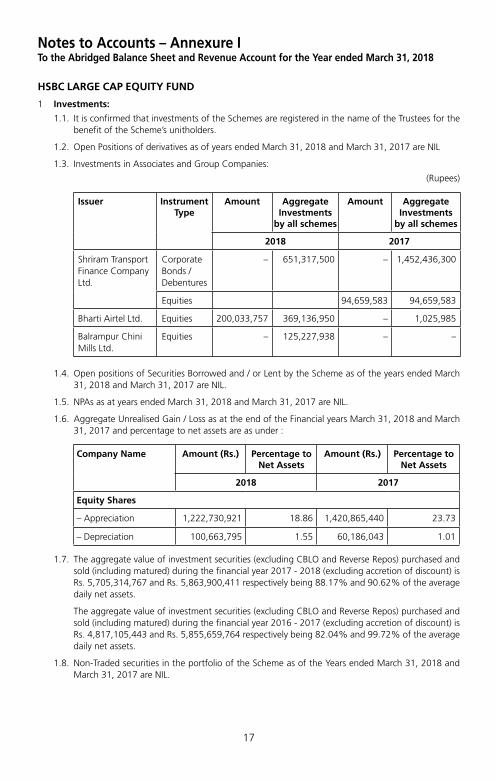
1 Investments:
1.1. It is confirmed that investments of the Schemes are registered in the name of the Trustees for the benefit of the Scheme’s unitholders.
1.2. Open Positions of derivatives as of years ended March 31, 2018 and March 31, 2017 are NIL
1.3. Investments in Associates and Group Companies:
(Rupees)
Issuer Instrument Type
Amount Aggregate Investments
by all schemes
Amount Aggregate Investments
by all schemes
2018 2017
Shriram Transport Finance Company Ltd.
Corporate Bonds / Debentures
– 651,317,500 – 1,452,436,300
Equities 94,659,583 94,659,583
Bharti Airtel Ltd. Equities 200,033,757 369,136,950 – 1,025,985
Balrampur Chini Mills Ltd.
Equities – 125,227,938 – –
1.4. Open positions of Securities Borrowed and / or Lent by the Scheme as of the years ended March 31, 2018 and March 31, 2017 are NIL.
1.5. NPAs as at years ended March 31, 2018 and March 31, 2017 are NIL.
1.6. Aggregate Unrealised Gain / Loss as at the end of the Financial years March 31, 2018 and March 31, 2017 and percentage to net assets are as under :
Company Name Amount (Rs.) Percentage to Net Assets
Amount (Rs.) Percentage to Net Assets
2018 2017
Equity Shares
– Appreciation 1,222,730,921 18.86 1,420,865,440 23.73
– Depreciation 100,663,795 1.55 60,186,043 1.01
1.7. The aggregate value of investment securities (excluding CBLO and Reverse Repos) purchased and sold (including matured) during the financial year 2017 - 2018 (excluding accretion of discount) is Rs. 5,705,314,767 and Rs. 5,863,900,411 respectively being 88.17% and 90.62% of the average daily net assets.
The aggregate value of investment securities (excluding CBLO and Reverse Repos) purchased and sold (including matured) during the financial year 2016 - 2017 (excluding accretion of discount) is Rs. 4,817,105,443 and Rs. 5,855,659,764 respectively being 82.04% and 99.72% of the average daily net assets.
1.8. Non-Traded securities in the portfolio of the Scheme as of the Years ended March 31, 2018 and March 31, 2017 are NIL.

18
2 Disclosure Under Regulation 25(8) of the Securities and Exchange Board of India (Mutual Funds) Regulations, 1996 as amended
During the year 2017-18, The Hongkong and Shanghai Banking Corporation Limited, an associate entity of HSBC Asset Management (India) Private Limited was paid collection/bank charges amounting to Rs. Nil and clearing member charges on derivative transactions amounting to Rs. Nil.
During the year 2016-17, The Hongkong and Shanghai Banking Corporation Limited, an associate entity of HSBC Asset Management (India) Private Limited was paid collection/bank charges amounting to Rs. Nil and clearing member charges on derivative transactions amounting to Rs. Nil.
Commission paid to Sponsor/AMC and its associates/related parties/group companies
Name of Sponsor/AMC and its associates/related parties/group companies
Nature of Association / Nature of
Relation
Period Covered
Business Given [Rs. In Crores]
% of Total Business
received by the Fund
Commission paid [Rs.]
% of Total commission paid by the
Fund
The Hongkong and Shanghai Banking Corporation Limited
Associate of Investment Manager
2017-2018 53.54 28.84 6,271,609 26.39
Name of Sponsor/AMC and its associates/related parties/group companies
Nature of Association / Nature of
Relation
Period Covered
Business Given [Rs. In Crores]
% of Total Business
received by the Fund
Commission paid [Rs.]
% of Total commission paid by the
Fund
The Hongkong and Shanghai Banking Corporation Limited
Associate of Investment Manager
2016-2017 10.69 9.47 4,202,846 19.88
Brokerage paid to Sponsor/AMC and its associates/related parties/group companies
Name of Sponsor/AMC and its associates/related parties/group companies
Nature of Association /Nature of
relation
Period Covered
Value of Transactions
[Rs. In Crores]
% of total value of
transactions of the fund
Brokerage paid [Rs. ]
% of total brokerage paid by the
fund
HSBC Securities and Capital Market (India) Private Limited
Sponsor 2017-2018 17.09 1.48 146,978 1.15
Name of Sponsor/AMC and its associates/related parties/group companies
Nature of Association /Nature of
relation
Period Covered
Value of Transactions
[Rs. In Crores]
% of total value of
transactions of the fund
Brokerage paid [Rs. ]
% of total brokerage paid by the
fund
HSBC Securities and Capital Market (India) Private Limited
Sponsor 2016-2017 18.76 1.76 225,076 1.87
The brokerage paid was at rates similar to those offered to other brokers / distributors. The Commission/Brokerage paid to related party includes both upfront and trail and hence not comparable with the % of business brought and % of commission paid.
Notes to Accounts - Annexure I (Contd...)To the Abridged Balance Sheet and Revenue Account for the Year ended March 31, 2018

19
Further, The Hongkong and Shanghai Banking Corporation Limited, an associate of the Sponsor, is on the panel of bankers with whom HSBC Mutual Fund places money on fixed deposits and enters into reverse repo transactions from time to time at competitive rates.
(i) Any underwriting obligations undertaken by the schemes of the mutual funds with respect to issue of securities associate companies - Nil (Previous year also Nil).
(ii) Devolvement - Nil (Previous year also Nil).
(iii) Subscription by the schemes in the issues lead managed by associate companies - Nil (Previous year also Nil).
(iv) Subscription to any issue of equity or debt on private placement basis where the sponsor or itsassociate companies have acted as arranger or manager - Nil (Previous year also Nil).
3 None of the Investors held more than 25% of the total net assets of the Scheme at the years ended March 31, 2018 and March 31, 2017.
4 Unit Capital movement during the years ended March 31, 2018 and March 31, 2017:
Description
2017-2018
Opening Units Subscription Redemption Closing UnitsFace Value
per unit (Rupees)
Regular Plan Growth Option
12,279,251.293 2,984,640.397 2,641,672.372 12,622,219.318 10
Regular Plan Dividend Option
52,242,885.892 8,502,563.072 10,041,348.881 50,704,100.083 10
Direct Plan - Growth Option
12,461,138.545 1,995,011.404 1,617,880.530 12,838,269.419 10
Direct Plan - Dividend Option
665,127.377 16,335,588.075 16,284,636.342 716,079.110 10
Description
2016-2017
Opening Units Subscription Redemption Closing UnitsFace Value
per unit (Rupees)
Regular Plan Growth Option
14,054,147.391 667,074.951 2,441,971.049 12,279,251.293 10
Regular Plan Dividend Option
61,896,207.796 22,504,997.170 32,158,319.074 52,242,885.892 10
Direct Plan - Growth Option
14,298,056.590 1,803,272.765 3,640,190.810 12,461,138.545 10
Direct Plan - Dividend Option
606,276.584 230,021.500 171,170.707 665,127.377 10
**Units held by the AMC (Seed Capital) in Direct Plan Growth Option as on March 31, 2018 is 33,261.112 and as on March 31, 2017 is 33,261.112
5 Previous year figures have been re-grouped/re-arranged where necessary.
6 No contingent liabilities for the years ended March 31, 2018 and March 31, 2017.
Notes to Accounts – Annexure I (Contd...)To the Abridged Balance Sheet and Revenue Account for the Year ended March 31, 2018

20
7 Expenses other than Management Fees are Inclusive of GST / Service Tax where applicable.
8 Other income of Rs. 22,767/- represents Exit load (net of GST / service tax) credited to the Scheme. (2017: Rs. 35,081 represents Exit load (net of service tax) credited to the Scheme & an Old Balance in Redemption Recon written off ).
9 Investor Education Awareness
In view of the AMFI Best Practices Guidelines Circular No. 56/2015-16, the IEF (Investor Education Fund) accrual is set aside in a separate bank account and the consolidated balance across all schemes as on March 31, 2018. The break-up of which is as under:
March 31, 2018 March 31, 2017
Particulars Amount (in Rs. Lacs) Amount (in Rs. Lacs)
Opening Balance 44.00 –
Add: Accrual during the year 219.83 182.34
Less: Transferred to AMFI 101.10 83.24
Less: Payable to AMFI (March accrual) 8.81 7.93
Add: Investment Income for the year 8.28 11.24
Less: Spent during the year 43.17 58.41
Closing Balance 119.02 44.00
10 Categorization and Rationalization of Schemes
Pursuant to SEBI circular no. SEBI/HO/IMD/DF3/CIR/P/2017/114 dated October 6, 2017 and SEBI circular no. SEBI/HO/IMD/DF3/CIR/P/2017/126 dated December 4, 2017 on ‘Categorization and Rationalization of schemes’, fundamental attribute related changes were carried out in certain schemes of HSBC Mutual Fund to align the same with the requirements specified in the aforesaid circulars effective from March 14, 2018. The said changes have been approved by the Board of Directors of the HSBC Asset Management (India) Pvt. Ltd. (the AMC) and the Board of Trustees (the Trustees). SEBI vide its letter no. IMD/DF3/OW/P/2018/89/1 dated January 2, 2018 has also conveyed it’s no objection to the said changes.
A notice-cum-addendum providing details of changes in the fundamental attributes of certain schemes was published in the newspaper on February 3, 2018 and is also available on the website of the AMC at www.assetmanagement.hsbc.com/in. The exit window period of 30 days was provided to the investors during which no exit load was charged to investors on switches/redemptions.
Apart from the fundamental attribute changes, there has been change in the ‘type of Scheme’ for all the open ended schemes and ‘name of Scheme’ in certain schemes for the purposes of alignment of the existing schemes with the provisions of the Circular. The details of the schemes impacted is provided below:
Existing Name Revised name Fundamental Attribute change Benchmark Change
HSBC Equity Fund HSBC Large Cap Equity Fund
Yes No
11 The Annual Accounts of the Schemes prepared in accordance with the accounting policies and standards specified in the Ninth Schedule of The Securities and Exchange Board of India (Mutual Funds) Regulations, 1996 has been approved by the Board of Directors of HSBC Asset Management (India) Private Limited and The Board of Trustees of HSBC Mutual Fund at their meetings held on July 16, 2018 and July 17, 2018 respectively. The audit report attached herewith refers to the said Annual Accounts. The aforesaid abridged accounts are an extract of the Annual Accounts and are prepared in accordance with SEBI Circular No. IMD/Cir8/132968/2008 dated July 24, 2008.
Notes to Accounts - Annexure I (Contd...)To the Abridged Balance Sheet and Revenue Account for the Year ended March 31, 2018

21
Voting Policy and Procedures
In view of SEBI guidelines related to “Role of Mutual Funds in Corporate Governance of Public Listed Companies”, AMIN has formulated its “Policy for Proxy Voting in Public Listed Companies”. The said policy and details of actual exercise of proxy votes along with the summary of votes cast and the auditors certification during the Financial Year 2017 – 18 is available on its website – http://www.assetmanagement.hsbc.com/in and in full Annual Report for the Financial Year 2017 – 18.

22
Statutory Details & Disclaimers
All returns have been sourced from Mutual Funds India Explorer software unless otherwise stated. With regard to equity schemes (including the equity component of MIPs), Fund performance is calculated on a total return basis (i.e. it includes dividends re-invested) while the benchmark is calculated on a price return basis (i.e. it does not consider dividends re-invested). This document has been prepared by HSBC Asset Management (India) Private Ltd (HSBC) for information purposes only and should not be construed as an offer or solicitation of an offer for purchase of any of the funds of HSBC Mutual Fund. All information contained in this document (including that sourced from third parties), is obtained from sources HSBC, the third party believes to be reliable but which it has not independently verified and HSBC, the third party makes no guarantee, representation or warranty and accepts no responsibility or liability as to the accuracy or completeness of such information. The information and opinions contained within the document are based upon publicly available information and rates of taxation applicable at the time of publication, which are subject to change from time to time. Expressions of opinion are those of HSBC only and are subject to change without notice. It does not have regard to specific investment objectives, financial situation and the particular needs of any specific person who may receive this document. Investors should seek financial advice regarding the appropriateness of investing in any securities or investment strategies that may have been discussed or recommended in this report and should understand that the views regarding future prospects may or may not be realized. Neither this document nor the units of HSBC Mutual Fund have been registered in any jurisdiction. The distribution of this document in certain jurisdictions may be restricted or totally prohibited and accordingly, persons who come into possession of this document are required to inform themselves about, and to observe, any such restrictions.
Investors should not invest in the Scheme solely based on the information provided in this document and should read the Scheme Information Document and Statement of Additional Information of the Fund for details. This document does not constitute an offering document.
No part of this publication may be reproduced, stored in a retrieval system, or transmitted, on any form or by any means, electronic, mechanical, photocopying, recording, or otherwise, without the prior written permission of HSBC Asset Management (India) Private Ltd.
Mutual Fund investments are subject to market risks, read all scheme related documents carefully.

HSBC Global Emerging Markets Fund (erstwhile HSBC Emerging Markets Fund)An open ended fund of fund Scheme investing in HSBC Global Investment Funds - Global Emerging Markets Equity Fund
Abridged Annual Report 2017 - 2018


1
Dear Investor,
Globally, we are witnessing a very interesting phase. The equity markets delivered a stellar performance in 2017. However, there are worries about the impact of higher rates, global trade wars, an economic growth moderation and higher volatility.
Closer home, India has become the world’s sixth-biggest economy. India has doubled its GDP to USD 2.2 trillion within a decade. The introduction of reform measures, including demonetisation and the Goods and Services Tax (GST), had put pressure on selective parts of the economy in 2017. The impact of these measures is likely to be transitory. India’s economic growth is expected to accelerate from 6.7% in FY18 to 7.4% in the current year as per IMF forecasts.
There has been a shift in the domestic savings pool supporting the market. Domestic investors have been increasing exposure to equities and financial assets moving away from gold and real estate. Mutual funds witnessed sizable inflows on the back of the boost in liquidity within the banking system from demonetisation. The AUM of the mutual fund industry grew by 21.7% in March 2018 compared to March 2017.
With growth, comes responsibility. Last year, the regulator, Securities and Exchange Board of India (SEBI) issued a circular to rationalise and categorise mutual fund schemes in India. We are pleased to state that none of our funds needed to be redesigned. All our schemes have been defined as per the new categorisation. We believe this classification will simplify investing into mutual funds and enhance comparability within the schemes offered.
As India moves to a digital age, e-commerce platforms are becoming increasingly popular. I request you to logon to our online transaction platform. It is a quick, convenient and an efficient tool to invest into our funds and manage your investments online.
At HSBC Global Asset Management, India, we are dedicated to one goal: delivering exceptional investment management for our clients. By bringing together our

2
global investment knowledge and capabilities, we are able to offer specialised expertise across asset classes. This has helped us to become a trusted partner to our individual and institutional investors.
We remain committed to our long-term perspective and disciplined investment approach as we conduct a rigorous, fundamental analysis of investments with a strong emphasis on risk management. Although the investment landscape appears favourable, it is worth remembering that markets are dynamic and constantly evolving. Therefore, we believe active, professional investment management serves investors well. Amid changing markets and economic conditions, we are confident that investors with a well-diversified portfolio and a patient, long-term outlook should be well positioned for the years ahead.
Together we thrive.
Warm regards,
Ravi Menon
Chief Executive Officer, HSBC Global Asset Management, India

3
SPONSORHSBC Securities and Capital Markets (India) Private LimitedRegd. Office: 52/60, Mahatma Gandhi Road, Fort, Mumbai - 400 001.
TRUSTEEBoard of TrusteesOffice: 16, Veer Nariman Road, Fort, Mumbai 400 001.
ASSET MANAGEMENT COMPANYHSBC Asset Management (India) Private LimitedCorp. & Regd. Office: 16, Veer Nariman Road, Fort, Mumbai 400 001.
CUSTODIANStandard Chartered Bank (SCB)Corp. & Regd. Office: Crescenzo, Securities Services, 3rd Floor, C-38/39, G-Block, Bandra Kurla Complex, Bandra East, Mumbai – 400051.
AUDITORS TO THE SCHEMEBSR & Co. LLPChartered Accountants 5th Floor, Lodha Excelus, Apollo Mills Compound, N.M. Joshi Marg, Mahalaxmi, Mumbai 400 011.
REGISTRAR & TRANSFER AGENTSComputer Age Management Services Private Limited (CAMS)Unit: HSBC Mutual Fund ’C’ Block, 2nd Floor, Hanudev Info Park P. Ltd., SF No. 558/2, Udayampalayam Road, Nava India, Coimbatore - 641 028.
BOARD OF TRUSTEESMr. Nasser Munjee
Mr. Manu Tandon
Mr. Mehli Mistri
Mr. Dilip J. Thakkar
Ms. Jasmine Batliwalla
Mr. Pedro Bastos
BOARD OF DIRECTORSMs. Kishori J. Udeshi - Chairperson
Mr. S. P. Mustafa
Mr. Dinesh Mittal
Mr. Ravi Menon - Chief Executive Officer

4
The Trustees of HSBC Mutual Fund (“Fund”) present the Sixteenth Annual Report and the audited abridged financial statements of the schemes of the Fund for the year ended March 31, 2018.
As at March 31, 2018, the Fund offered 30 schemes across asset classes to meet the varying investment needs of the investors. Notably, three Schemes of HSBC Mutual Fund viz. HSBC Large Cap Equity Fund, HSBC Short Duration Fund and HSBC Cash Fund have completed 15 years of operations during the year.
During the year, the Fund has launched Plan(s) under Fixed Term Series and carried out merger of the existing schemes viz HSBC Dividend Yield Equity Fund merged into HSBC Multi Cap Equity Fund (HMEF), erstwhile HSBC India Opportunities Fund, as offering sub-scale fund was not in the interest of the unitholders.
Further, in order to bring uniformity in the practice across Mutual Funds and to standardize the scheme categories and characteristics of schemes, SEBI vide its circular no. SEBI/HO/IMD/DF3/CIR/P/2017/114 dated October 06, 2017, issued guidelines for categorization and rationalization of Mutual Fund schemes.
Accordingly, HSBC Large Cap Equity Fund (erstwhile HSBC Equity Fund), HSBC Small Cap Equity Fund (erstwhile HSBC Mid Cap Equity Fund) , HSBC Infrastructure Equity Fund, HSBC Global Emerging Market Fund (erstwhile HSBC Emerging Market Fund), HSBC Debt Fund (erstwhile HSBC Income Fund – Investments Plan), HSBC Short Duration Fund (erstwhile HSBC Income Fund – Short Term Plan), HSBC Low Duration Fund (erstwhile HSBC Ultra Short Term Bond Fund), HSBC Regular Savings Fund (erstwhile HSBC Monthly Income Plan) and HSBC Managed Solutions have undergone fundamental attributes changes with effective from March 14, 2018.
The Fund continues its focus on delivering consistent long term returns. The comments on the performance of the Scheme(s) is provided hereinafter. Dividends were declared under various schemes as per the provisions contained in the respective Scheme Information Documents after considering the distributable surplus available under the respective Schemes. Details of dividends declared can be viewed on our website at www.assetmanagement.hsbc.com/in.
1. Scheme Performance, future outlook and oPerationS of the SchemeS
a. Operations and Performance of the Schemes
HSBC Global Emerging Markets Fund (HGEMF) (erstwhile HSBC Emerging Markets Fund)(An open-ended fund of fund Scheme investing in HSBC Global Investment Funds - Global Emerging Markets Equity Fund)
The primary investment objective of the Scheme is to provide long term capital appreciation by investing predominantly in units / shares of HSBC Global Investment Funds - Global Emerging Markets Equity Fund. The Scheme may also invest a certain proportion of its corpus in money market instruments and / or units of liquid mutual fund schemes, in order to meet liquidity requirements from time to time. However, there can be no assurance or guarantee that the investment objective of the scheme would be achieved.
The net assets of HGEMF amounted to Rs. 9.33 crores as at March 31, 2018 compared to Rs. 9.28 crores as at March 31, 2017. Around 97.82% of the net assets were invested in HSBC GEM Equity Fund (overseas mutual fund), 2.81% of the net assets comprised of reverse repos/CBLO and current assets as at March 31, 2018.
HGEMF underperformed its benchmark during 2017-2018 on account of the performance of its underlying fund.
Scheme Name & Benchmarks Absolute Returns
(%)
Compounded Annualized Returns (%)
Date of Inception : 17 March 2008 1 Year 3 Years 5 Years Since Inception
HSBC Global Emerging Markets Fund - Growth 19.81 8.81 6.68 3.76
MSCI Emerging Market Index (Scheme Benchmark) 22.73 10.60 8.69 8.32
Nifty 50 (Standard Benchmark) 12.68 7.99 13.63 9.69
Rs. 10,000, if invested in HGEMF, would have become 11,981 12,889 13,819 14,483
Trustees’ ReportFor the year ended March 31, 2018

5
Scheme Name & Benchmarks Absolute Returns
(%)
Compounded Annualized Returns (%)
Date of Inception : 17 March 2008 1 Year 3 Years 5 Years Since Inception
Rs. 10,000, if invested in MSCI Emerging Market Index, would have become
12,273 13,536 15,172 22,303
Rs. 10,000, if invested in Nifty 50, would have become 11,268 12,599 18,950 25,299
Past performance may or may not be sustained in future. The returns for the respective periods are provided as on last business day of March 2018 for Growth Option. Different plans shall have a different expense structure. Performance of the respective benchmark is calculated as per the Total Return Index (TRI).
b. Market Overview & Outlook (as furnished by HSBC Asset Management (India) Private Limited)
EqUITY OUTLOOKIndian equity markets continued to remain strong during fiscal year 2017-18 and posted gains of 11.76% by S&P CNX Nifty and 13.24% by BSE Midcap index respectively. Biggest drivers of the markets were, robust DII flow into equities, continued push of mega reforms – Goods and Services Tax (GST) implementation, Insolvency and Bankruptcy Code implementation, Real Estate (Regulation and Development) Act, second consecutive normal monsoon, and electoral victories of the ruling party in many state elections. On the other hand, the markets weather the storm of disruption in economy due to GST implementation, lingering impact of demonetization, muted FII flows, and rising yields in developed markets. Domestic Mutual Fund segment had their best ever year and they brought in ~USD 22 bn of net inflows in equities during the year. Even after witnessing ~USD 4.3 bn of net outflows from the domestic insurers, the net DII tally was a very impressive ~USD 17.7 bn of net inflows. There were mixed global cues well and the Foreign Institutional Investors (FIIs) net bought Indian equities worth USD 3.2 bn. The inflows by both FIIs and domestic MFs acted as a factor in the strong market performance.
Indices Returns (April 1, 2017 to March 31, 2018) 1 Year (%)
S&P BSE Sensex 12.70%
NSE CNX Nifty 11.76%
S&P BSE 100 12.12%
S&P BSE 200 12.49%
S&P BSE 500 13.21%
S&P BSE Midcap 14.31%
S&P BSE 250 Small-cap 14.13%
Source: Bloomberg (All values are total return)
Our view on the key aspects related to equity markets are presented below -
The impressive performance in equity markets during FY 2017-18 has come on the back of strong liquidity largely by domestic MFs but supported in party by FII flows, positive global growth, benign macro – both domestically and global, expectation of the continuation of favorable policy environment domestically and expectation of corporate earnings revival. Possibility of sound macro, economic reforms and implementation of existing reforms have increased, especially after continued success of the ruling party at the centre in state elections. However, after this strong performance in markets and rather long wait for earnings to be delivered has meant that the equity markets are currently trading above their historical averages.
Moving into FY 2018-19, we expect a continuation of the economic recovery process domestically, recovery in corporate earnings - led early by volume growth, and continued DII flows. Government led investment
Trustees’ ReportFor the year ended March 31, 2018 (Contd...)

6
spending and rural consumption are likely to lead with private sector investments contributing later (possibly after general elections 2019). The budget document that was presented in early February provides a good medium term policy direction for the economy. Occasionally the policy actions can serve up a few bumps and jolts but over the medium term, across different governments, there is a thread of continuity connecting many key economic policies such as in the case of this year’s union budget. We, in our investment process, prefer to take comfort in these threads of continuity and remain constructive on the India growth story. This makes us positive on the Indian equity markets over the medium to long term.
Risks are in the form of market valuations trending above historical averages, weaker than expected delivery in corporate earnings going forward, external news flows related to trade protectionism, developed market central banks raising rates prematurely, and geopolitical tensions and other eco-political events would also influence market performance going forward, as the recent rally in the markets was supported by strong FII inflows.
DEBT OUTLOOKFixed Income in Financial Year 2017-18 has seen volatility further step up in this year. Markets went to perfect storm with higher crude prices, low liquidity and pressure on currency, apart from rate hike expectations.
Inflation has followed the glide path to lower numbers towards 4% RBI target and even lower than the target number when inflation printed a lowly 1.46% in June 2018 on back of lower food prices. RBI went for a cut despite of neutral stance. This positivity continued till until crude shock came in form of higher crude process. Global prices of Brent crude saw substantial increase in second half of the year, which jeopardized the inflation path. Other worries that gathered around this time were related to GST collection and eventual impact on fiscal situation.
Government of India allowed the fiscal deficit to slip to 3.5% (budget 3.2%) and kept next year target at 3.3% (in place of earlier path of 3%). This was on back of some excise relaxation for oil products and a month less collected for GST due to implementation in the current year. The fear of fiscal slippage alongwith the announcement of higher bond issuances spooked the bond markets into higher yields. Government finally borrowed only INR 90 bln extra (in place of INR 500 bln announced initially).
On the Monetary front the year was very volatile as well. RBI changed its stance to neutral causing some worry around rate hikes. Thereafter it cut rates and again went for OMO sales operations simultaneously. This created some confusion in the market participants regarding rates direction. Finally extra supply, higher oil prices and higher inflation paved way for rates higher. RBI also held position on regulatory forbearance about spreading out losses by banks publicly. It eventually gave up the position in the end of March. However, the swift changes in stance caused lot of pressure and volatility in bonds.
Liquidity situation continuously deteriorated due to OMO sales initially and withdrawal of deposits due to remonetisation. Further liquidity was absorbed out due to portfolio outflows and reduction in reserves. Despite of defense from RBI utilizing the reserves, the currency depreciated meaningfully, which caused further jitters in foreign investor sentiments. Lack of liquidity also affected 1-3 year rates which were elevated in second half of the year.
Going forward following are key variables to watch out for:• Liquidity: Liquidity will drive short end rates and eventually drive decisions leading to market interventions
and CRR cuts. RBI has focused now on neutral liquidity stance and providing liquidity to system, which will bode well short end rates.
• Inflation: Inflation numbers will determine future course of action for RBI and remains a critical variable for policy. We expect inflation to remain at 4.7% level in the ease in second half of FY 2018-19 in line with RBI’s expectations.
• Growth: GDP growth numbers as well as industrial activity will also determine the decision on policy.
• Fiscal deficit: Fiscal deficit and government spending will determine the government borrowing and crowding out in interest rate curve. We expect prudence in government spending and prospect of spending on infrastructure to pick up which will crowd in private investment as well.
• Current Account Deficit: Current Account Deficit determines how the pressure on currency works and effective management of forex reserves.
• Currency levels: Level of INR will determine how the central bank reacts to the situation on the global crisis etc.
Trustees’ ReportFor the year ended March 31, 2018 (Contd...)

7
2. Brief Background of SPonSorS, Board of truSteeS and aSSet management comPany
a. Sponsor
HSBC Mutual Fund is sponsored by HSBC Securities and Capital Markets (India) Private Limited (HSCI). The Sponsor is the Settler of the Mutual Fund Trust. The Sponsor has entrusted a sum of Rs. 1,00,000 (Rupees One Lakh only) to the Trustee as the initial contribution towards the corpus of the Mutual Fund.
HSCI offers integrated investment banking services, securities and corporate finance & advisory. HSCI is a member of the Bombay Stock Exchange Limited and National Stock Exchange (capital and derivative market segments). HSCI holds 100% of the paid up equity share capital of HSBC Asset Management (India) Private Limited.
b. HSBC Mutual Fund
HSBC Mutual Fund (“the Mutual Fund” or “the Fund”) has been constituted as a Trust in accordance with the provisions of the Indian Trusts Act, 1882 (2 of 1882) vide a Trust Deed dated February 7, 2002 with HSBC Securities and Capital Markets (India) Private Limited, as the Sponsor and the Board of Individual Trustees. The Trustee has entered into an Investment Management Agreement dated February 7, 2002 with HSBC Asset Management (India) Private Limited (AMC) to function as the Investment Manager for all the schemes of the Fund. The Fund was registered with SEBI vide registration number MF/046/02/5 dated May 27, 2002.
The Trust has been formed for the purpose of pooling of capital from the public for collective investment in securities for the purpose of providing facilities for participation by persons as beneficiaries in such investments and in the profits/income arising therefrom.
c. Board of Trustees (the Trustees)
The Board of Trustees is the exclusive owner of the Trust Fund and holds the same in trust for the benefit of the unit holders. The Trustees have been discharging their duties and carrying out the responsibilities as provided in the SEBI (Mutual Funds) Regulations, 1996 and the Trust Deed. The Trustees seek to ensure that the Fund and the schemes floated there under are managed by the AMC in accordance with the Trust Deed, the said Regulations, directions and guidelines issued by the SEBI, the Stock Exchanges, the Association of Mutual Funds in India and other regulatory agencies.
d. Asset Management Company (the AMC)
HSBC Asset Management (India) Private Limited (the Investment Manager or the AMC) is a private limited company incorporated under the Companies Act, 1956 on December 12, 2001 having its Registered Office at 16, V. N. Road, Fort, Mumbai 400 001. HSBC Asset Management (India) Private Limited has been appointed as the Asset Management Company of HSBC Mutual Fund by the Trustee vide Investment Management Agreement (IMA) dated February 7, 2002 and executed between the Trustees and the AMC. SEBI approved the AMC to act as the Investment Manager of the Fund vide its letter No. MFD/BC/163/2002 dated May 27, 2002. The paid-up equity share capital of the AMC is Rs. 61.59 crores. The AMC is registered as a Portfolio Manager under the SEBI (Portfolio Managers) Regulations, 1993 vide registration no. INP000001322. The AMC also offers non-binding Advisory services to offshore funds under the mutual fund license.
HSBC Securities and Capital Markets (India) Private Limited holds 100% of the paid up equity share capital of the AMC.
3. inveStment oBjective of the SchemeS The investment objective of the respective schemes has been provided above under the heading “Scheme
Performance, Future Outlook and Operation of the Scheme” (Refer Section 1).
4. Significant accounting PolicieS The Significant Accounting Policies form part of the Notes to the Accounts annexed to the Balance Sheet
of the Schemes in the Full Annual Report. The accounting policies are in accordance with Securities Exchange Board of India (Mutual Funds) Regulations 1996.
Trustees’ ReportFor the year ended March 31, 2018 (Contd...)

8
Trustees’ ReportFor the year ended March 31, 2017 (Contd...)
5. unclaimed dividendS & redemPtionS Summary of number of investors & corresponding amount Scheme-wise as on March 31, 2018.
SchemeUnclaimed Dividend Unclaimed Redemption
Amount (Rs.) No. of Investors
Amount (Rs.) No. of Investors
HSBC Global Emerging Markets Fund - - 1,022,660.06 24
6. inveStor ServiceSThe number of official points of acceptance of transactions is 205 locations. In addition to the offices of the Registrar & Transfer agents, the AMC has Investor Service Centres in 9 locations at its own offices - namely Mumbai, New Delhi, Kolkata, Bangaluru, Pune, Ahmedabad, Hyderabad, Chandigarh and Chennai. With a view to enhance customer convenience, the AMC has the facility of priority based servicing to key distributors through the enhancement of the Interactive Voice Reponses. The AMC has a single Toll Free number which can be dialed from anywhere in India. The call centre service is being managed by the Registrar and Transfer Agents.
On the distribution front, the number of empanelled distributors was 460 as on March 31, 2018. During the year, the AMC initiated tie-ups for online distribution of the Mutual Fund’s schemes with several channel partners taking the total number of such tie-ups to 42.
7. detailS of inveStor grievance redreSSalThe details of the redressal of investor complaints received against HSBC Mutual Fund during April 2017 - March 2018 are as follows:
2017-2018
Com- plaint Code
Type of complaint (a) No. of complaints
pending at the
beginning of the year
(b) No. of complaints received during
the year
Action on (a) and (b)
Resolved Non Actiona-
ble*
Pending
Within 30
days
30 - 60 days
60 - 180 days
Beyond 180 days
0 - 3 months
3 - 6 months
6 - 9 months
9 - 12 months
I A Non receipt of Dividend on Units
0 5 4 1 0 0 0 0 0 0 0
I B Interest on delayed payment of Dividend
0 0 0 0 0 0 0 0 0 0 0
I C Non receipt ofRedemption Proceeds
1 12 12 1 0 0 0 1 0 0 0
I D Interest on delayedp a y m e n t o f Redemption
0 1 1 0 0 0 0 0 0 0 0
II A Non receipt of Statement of Account / Unit Certificate
0 0 0 0 0 0 0 0 0 0 0
II B D i s c r e p a n c y i n Statement of Account
0 0 0 0 0 0 0 0 0 0 0
II C Data corrections in Investor details **
0 34 34 0 0 0 0 0 0 0 0
II D Non receipt of Annual Report /Abridged Summary
0 0 0 0 0 0 0 0 0 0 0
Trustees’ ReportFor the year ended March 31, 2018 (Contd...)
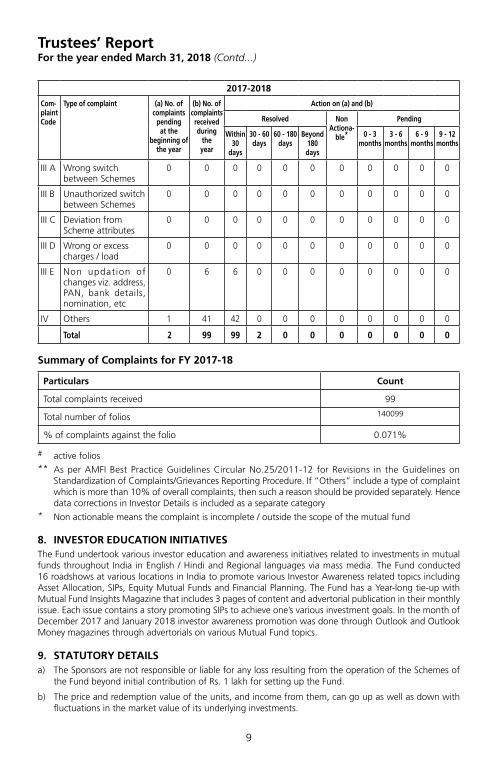
9
2017-2018
Com- plaint Code
Type of complaint (a) No. of complaints
pending at the
beginning of the year
(b) No. of complaints received during
the year
Action on (a) and (b)
Resolved Non Actiona-
ble*
Pending
Within 30
days
30 - 60 days
60 - 180 days
Beyond 180 days
0 - 3 months
3 - 6 months
6 - 9 months
9 - 12 months
III A Wrong switch between Schemes
0 0 0 0 0 0 0 0 0 0 0
III B Unauthorized switch between Schemes
0 0 0 0 0 0 0 0 0 0 0
III C Deviation from Scheme attributes
0 0 0 0 0 0 0 0 0 0 0
III D Wrong or excess charges / load
0 0 0 0 0 0 0 0 0 0 0
III E Non updat ion of changes viz. address, PAN, bank details, nomination, etc
0 6 6 0 0 0 0 0 0 0 0
IV Others 1 41 42 0 0 0 0 0 0 0 0
Total 2 99 99 2 0 0 0 0 0 0 0
Summary of Complaints for FY 2017-18
Particulars Count
Total complaints received 99
Total number of folios 140099
% of complaints against the folio 0.071%
# active folios** As per AMFI Best Practice Guidelines Circular No.25/2011-12 for Revisions in the Guidelines on
Standardization of Complaints/Grievances Reporting Procedure. If “Others” include a type of complaint which is more than 10% of overall complaints, then such a reason should be provided separately. Hence data corrections in Investor Details is included as a separate category
* Non actionable means the complaint is incomplete / outside the scope of the mutual fund
8. inveStor education initiativeS The Fund undertook various investor education and awareness initiatives related to investments in mutual funds throughout India in English / Hindi and Regional languages via mass media. The Fund conducted 16 roadshows at various locations in India to promote various Investor Awareness related topics including Asset Allocation, SIPs, Equity Mutual Funds and Financial Planning. The Fund has a Year-long tie-up with Mutual Fund Insights Magazine that includes 3 pages of content and advertorial publication in their monthly issue. Each issue contains a story promoting SIPs to achieve one’s various investment goals. In the month of December 2017 and January 2018 investor awareness promotion was done through Outlook and Outlook Money magazines through advertorials on various Mutual Fund topics.
9. Statutory detailSa) The Sponsors are not responsible or liable for any loss resulting from the operation of the Schemes of
the Fund beyond initial contribution of Rs. 1 lakh for setting up the Fund.
b) The price and redemption value of the units, and income from them, can go up as well as down with fluctuations in the market value of its underlying investments.
Trustees’ ReportFor the year ended March 31, 2018 (Contd...)

10
c) Full Annual Report shall be disclosed on the website at www.assetmanagement.hsbc.com/in and shall be available for inspection at the Head Office of the Mutual Fund. Present and prospective unit holders can obtain copy of the Trust Deed, the full Annual Report of the Scheme(s), the Annual Report of HSBC Asset Management (India) Private Limited and the text of the relevant Scheme(s) at a price.
10. acknowledgementSThe Trustees wish to thank the Unit holders of the Schemes for their support throughout the year and also thank the Government of India, the Securities and Exchange Board of India (SEBI), the Reserve Bank of India (RBI) and the Association of Mutual Funds in India (AMFI) for the guidance provided by them. The Trustees also appreciate the services provided by the Registrar and Transfer Agent, Fund Accountant, Custodian, Bankers, Distributors and Brokers. The guidance and services provided by the Auditors and advocates and the ebullience, sincerity and dedication of the employees of HSBC Asset Management (India) Private Limited is also appreciated.
The Trustees look forward to the continued support of everyone.
For and on behalf of the Board of Trustees of HSBC Mutual Fund
Sd/-
Dilip Thakkar
Trustee
Mumbai
July 17, 2018.
Trustees’ ReportFor the year ended March 31, 2018 (Contd...)
11
To the Board of Trustees
HSBC Mutual Fund – HSBC Global Emerging Markets Fund (formerly known as HSBC Emerging Markets Fund)
Report on the Financial StatementsWe have audited the accompanying Financial Statements of HSBC Global Emerging Markets Fund (formerly known as HSBC Emerging Markets Fund) (the ‘Scheme’), which comprise the balance sheet as at 31 March 2018 and the related revenue account for the year then ended, and a summary of significant accounting policies and other explanatory information, annexed thereto.
Management’s responsibility for the Financial StatementsThe Board of Trustees to the HSBC Mutual Fund (the ‘Board of Trustees’) and HSBC Asset Management (India) Private Limited (the ‘AMC’), being the investment manager to HSBC Mutual Fund (the ‘Fund’) (collectively referred as ‘Management’), are responsible for the preparation of these financial statements that give a true and fair view of the financial position and financial performance of the Scheme in accordance with the accounting policies and standards specified in the Ninth Schedule of the Securities and Exchange Board of India (Mutual Funds) Regulations, 1996, as amended (the ‘Regulations’) and the accounting principles generally accepted in India. This responsibility includes maintenance of adequate accounting records for safeguarding of the assets of the Scheme and for preventing and detecting frauds and other irregularities; selection and application of appropriate accounting policies; making judgments and estimates that are reasonable and prudent; and design, implementation and maintenance of adequate internal financial controls, that were operating effectively for ensuring the accuracy and completeness of the accounting records, relevant to the preparation and presentation of the financial statements that give a true and fair view and are free from material misstatement, whether due to fraud or error.
In preparing the financial statements, management is responsible for assessing the Scheme’s ability to continue as a going concern, disclosing, as applicable, matters related to going concern and using the going concern basis of accounting unless management either intends to liquidate the Fund or to cease operations, or has no realistic alternative but to do so.
Auditor’s responsibilityOur responsibility is to express an opinion on these financial statements based on our audit. We conducted our audit in accordance with the Standards on Auditing issued by the Institute of Chartered Accountants of India (the ‘ICAI’). Those Standards require that we comply with ethical requirements and plan and perform the audit to obtain reasonable assurance about whether the financial statements are free from material misstatement.
An audit involves performing procedures to obtain audit evidence about the amounts and disclosures in the financial statements. The procedures selected depend on the auditor’s judgment, including the assessment of the risks of material misstatement of the financial statements, whether due to fraud or error. In making those risk assessments, the auditor considers internal controls relevant to preparation and fair presentation of the financial statements, of the Scheme, in order to design audit procedures that are appropriate in the circumstances, but not for the purpose of expressing an opinion on the effectiveness of the Scheme’s internal controls. An audit also includes evaluating the appropriateness of accounting policies used and the reasonableness of the accounting estimates made by Management, as well as evaluating the overall presentation of the financial statements.
We are also responsible to conclude on the appropriateness of management’s use of the going concern basis of accounting and, based on the audit evidence obtained, whether a material uncertainty exists related to events or conditions that may cast significant doubt on the Scheme’s ability to continue as a going concern. If we conclude that a material uncertainty exists, we are required to draw attention in the auditor’s report to the related disclosures in the financial statements or, if such disclosures are inadequate, to modify the opinion. Our conclusions are based on the audit evidence obtained up to the date of the auditor’s report. However, future events or conditions may cause the Scheme to cease to continue as a going concern.
We believe that the audit evidence we have obtained is sufficient and appropriate to provide a basis for our audit opinion.
Independent Auditors’ Report

12
OpinionIn our opinion, and to the best of our information and according to the explanations given to us, the aforesaid financial statements give the information required by the Regulations in the manner so required and give a true and fair view in conformity with the accounting principles generally accepted in India:
(i) in the case of the balance sheet, of the state of affairs of the Scheme as at 31 March 2018; and
(ii) in the case of the revenue account, of the net surplus for the year ended on that date.
Report on other Legal and Regulatory Requirements1 As required by Regulation 55(4) to the Regulations, we report that:
(a) We have obtained all information and explanations which, to the best of our knowledge and belief, were necessary for the purposes of the audit;
(b) The balance sheet and revenue account have been prepared in accordance with the accounting policies and standards specified in the Ninth Schedule of the Regulations.
2 As required by Clause 5(ii)(2) of the Eleventh Schedule of the Regulations, we report that the balance sheet and revenue account are in agreement with the books of account of the Scheme.
3 In our opinion and on the basis of information and explanations given to us, the methods used to value non - traded securities, as at 31 March 2018, as determined by the Board of Directors of AMC, are in accordance with the Regulations and other guidelines issued by the Securities and Exchange Board of India as applicable and approved by the Board of Trustees are fair and reasonable.
For B S R & Co. LLP Chartered Accountants Firm’s Registration No: 101248W/W-100022
Milind Ranade Partner Membership No: 100564
Place : Mumbai Date : July 17, 2018.
Independent Auditors’ Report (Contd...)

13
Abridged Balance Sheet as at March 31, 2018
Rs. in Lakhs
HSBC GLOBAL EMERGING MARKETS FUND
As at March 31, 2018
As at March 31, 2017
LIABILITIES1 Unit Capital 649.91 784.53 2 Reserves & Surplus2.1 Unit Premium Reserves (472.08) (456.13)2.2 Unrealised Appreciation Reserve 269.43 136.85 2.3 Other Reserves 485.69 463.22 3 Loans & Borrowings – – 4 Current Liabilities & Provisions4.1 Provision for doubtful Income/Deposits – – 4.2 Other Current Liabilities & Provisions 18.03 12.75
TOTAL 950.98 941.22
ASSETS1 Investments1.1 Listed Securities:1.1.1 Equity Shares – – 1.1.2 Preference Shares – – 1.1.3 Equity Linked Debentures – – 1.1.4 Other Debentures & Bonds – – 1.1.5 Securitised Debt securities – – 1.2 Securities Awaited Listing:1.2.1 Equity Shares – – 1.2.2 Preference Shares – – 1.2.3 Equity Linked Debentures – – 1.2.4 Other Debentures & Bonds – – 1.2.5 Securitised Debt securities – – 1.3 Unlisted Securities1.3.1 Equity Shares – – 1.3.2 Preference Shares – – 1.3.3 Equity Linked Debentures – – 1.3.4 Other Debentures & Bonds – – 1.3.5 Securitised Debt securities – – 1.4 Government Securities – – 1.5 Treasury Bills – – 1.6 Commercial Paper – – 1.7 Certificate of Deposits – – 1.8 Bill Rediscounting – – 1.9 Units of Domestic Mutual Fund – – 1.10 Foreign Securities 912.62 896.36
Total Investments 912.62 896.36
2 Deposits 0.24 0.07 3 Other Current Assets3.1 Cash & Bank Balance 0.10 1.00 3.2 CBLO/Reverse Repo Lending 28.72 35.17 3.3 Others 9.30 8.62 4 Deferred Revenue Expenditure (to the extent not written off) – –
TOTAL 950.98 941.22
Notes to Accounts – Annexure I

14
Abridged Revenue Account for the year ended March 31, 2018
Rs. in Lakhs
HSBC Global Emerging Markets FundCurrent
Year ended March 31, 2018
Previous Year ended
March 31, 2017
1 INCOME1.1 Dividend 13.52 18.78
1.2 Interest 1.93 1.391.3 Realised Gain / (Loss) on Foreign Exchange Transactions 0.08 (0.36)1.4 Realised Gains / (Losses) on Interscheme sale of investments – –1.5 Realised Gains / (Losses) on External sale / redemption of
investments48.43 12.64
1.6 Realised Gains / (Losses) on Derivative Transactions – –1.7 Other Income 0.01 –
(A) 63.97 32.45
2 EXPENSES2.1 Management fees 7.96 7.242.2 GST / Service tax on Management fees 1.41 1.082.3 Transfer agents fees and expenses 0.60 0.502.4 Custodian fees 1.70 1.622.5 Trusteeship fees 0.02 0.022.6 Commission to Agents 5.37 5.032.7 Marketing & Distribution expenses 0.01 0.022.8 Audit fees 0.20 0.202.9 Investor Education Expenses 0.19 0.182.10 Other operating expenses 0.47 0.702.11 Less: Expenses to be Reimbursed by the Investment Manager – –
(B) 17.93 16.59
3 NET REALISED GAINS / (LOSSES) FOR THE YEAR (A –B = C) 46.04 15.86
4 Change in Unrealised Depreciation in value of investments*** (D) – (0.07)
5 NET GAINS / (LOSSES) FOR THE YEAR [E=(C+D)] 46.04 15.79
6 Change in unrealised appreciation in the value of investments and derivatives (F) 132.59 121.95
7 NET SURPLUS / (DEFICIT) FOR THE YEAR (E + F = G) 178.63 137.74
7.1 Add: Balance transfer from Unrealised Appreciation Reserve – –7.2 Less: Balance transfer to Unrealised Appreciation Reserve 132.59 121.957.3 Add / (Less): Equalisation (23.57) (9.23)7.4 Transfer from Reserve Fund 463.22 456.66
8 Total 485.69 463.22
9 Dividend appropriation
9.1 Income Distributed during the year – –9.2 Tax on income distributed during the year – –10 Retained Surplus / (Deficit) carried forward
to Balance sheet 485.69 463.22
Notes to Accounts – Annexure I*** Includes Unrealised Depreciation in the value of Foreign Currency Transactions.

15
Key Statistics for the year ended March 31, 2018
HSBC GLOBAL EMERGING MARKETS FUND Current
Year ended March 31, 2018
Previous Year ended
March 31, 2017
1. NAV per unit (Rs.):
Open
Regular Plan Growth Option 11.9610 10.2862
Regular Plan Dividend Option 11.4436 9.8413
Direct Plan - Growth Option 12.3347 10.5337
Direct Plan - Dividend Option 11.8110 10.0863
High
Regular Plan Growth Option 15.4020 12.2453
Regular Plan Dividend Option 14.7358 11.7157
Direct Plan - Growth Option 15.9774 12.6251
Direct Plan - Dividend Option 15.2992 12.0889
Low
Regular Plan Growth Option 11.7656 9.7917
Regular Plan Dividend Option 11.2566 9.3682
Direct Plan - Growth Option 12.1358 10.0367
Direct Plan - Dividend Option 11.6204 9.6104
End
Regular Plan Growth Option 14.4767 11.9610
Regular Plan Dividend Option 13.8506 11.4436
Direct Plan - Growth Option 15.0374 12.3347
Direct Plan - Dividend Option 14.3991 11.8110
2. Closing Assets Under Management (Rs. in Lakhs)
End 933 928
Average (AAuM)1 946 906
3. Gross income as % of AAuM2 6.76% 3.58%
4. Expense Ratio:
a. Total Expense as % of AAuM (including service tax / GST on Management fees) (planwise)
Regular Plan (Continue) 1.95% 1.87%
Direct Plan 1.22% 1.17%
b. Management Fee as % of AAuM (planwise)
Regular Plan (Continue) 0.59% 0.80%
Direct Plan 0.59% 0.80%
5. Net Income as a percentage of AAuM3 4.87% 1.75%
6. Portfolio turnover ratio4 0.04 0.02
7. Total Dividend per unit distributed during the year (planwise)
Retail
Regular Plan Dividend Option – –
Direct Plan - Dividend Option – –

16
HSBC GLOBAL EMERGING MARKETS FUND Current
Year ended March 31, 2018
Previous Year ended
March 31, 2017
Corporate
Regular Plan Dividend Option – –
Direct Plan - Dividend Option – –
8. Returns (%):
a. Last One Year
Scheme
Regular Plan Growth Option 19.8136 16.2820
Direct Plan - Growth Option 20.6821 17.0975
Benchmark
MSCI Emerging Markets Index 22.7300 12.4242
b. Since Inception
Scheme
Regular Plan Growth Option 3.7569 1.9997
Direct Plan - Growth Option 5.5999 2.0725
Benchmark
MSCI Emerging Markets Index 8.3187 1.8320
1. AAuM=Average daily net assets2. Gross income = amount against (A) in the Revenue account i.e. Income3. Net income = amount against (C) in the Revenue account i.e. Net Realised Gains / (Losses) for the year4. Portfolio Turnover = Lower of sales or purchase divided by the Average AuM for the year5 The net asset value disclosed represents the computed NAV on March 31, 2018 (Non-business Day),
and not the last declared NAV.6 The Total management fees and other expenses charged by the underlying fund along with the
management fee and recurring expenses charged by the domestic Mutual Fund is as follows:
Scheme TER charged by underlying Fund ***
TER of the domestic Fund***
Total TER *** Maximum TER Cap as per circular ***
2017-18
HSBC Global Emerging Markets Fund
0.85% 1.84% 2.69% 2.70%
2016-17
HSBC Global Emerging Markets Fund
0.85% 1.77% 2.62% 2.70%
*** The TER excludes GST / Service Tax on Management fees
Key Statistics for the year ended March 31, 2018 (Contd...)

17
Notes to Accounts – Annexure ITo the Abridged Balance Sheet and Revenue Account for the Year ended March 31, 2018
HSBC GLOBAL EMERGING MARKETS FUND1 Investments:–
1.1 It is confirmed that investments of the Scheme are registered in the name of the Trustees for the benefit of the Scheme’s unitholders.
1.2 Open Positions of derivatives as of year ended March 31, 2018 and March 31, 2017 are NIL
1.3 Investments in Associates and Group Companies as of period ended March 31, 2018 & March 31, 2017 are NIL.
1.4 Open positions of Securities Borrowed and / or Lent by the Scheme as of the years ended March 31, 2018 and March 31, 2017 are NIL.
1.5 NPAs as at years ended March 31, 2018 and March 31, 2017 are NIL.
1.6 Aggregate Unrealised Gain / Loss as at the end of the financial years end and their percentages to net assets are as under:
Security Category Amount (Rupees)
Percentage to Net Assets
Amount (Rupees)
Percentage to Net Assets
2018 2017Foreign Securities
– Appreciation 26,943,496 28.88 13,684,634 14.74
– Depreciation – – – –
1.7 The aggregate value of investments securities (excluding CBLO and Reverse Repos) purchased and sold (including matured) during the financial year 2017 - 2018 (excluding accretion of discount) is Rs. 3,629,841 and 20,106,910 respectively being 3.84% and 21.25% of the average daily net assets.
The aggregate value of investments securities (excluding CBLO and Reverse Repos) purchased and sold (including matured) during the financial year 2016 - 2017 (excluding accretion of discount) is Rs. 1877656 and 11,112,687 respectively being 2.07% and 12.26% of the average daily net assets.
1.8 Non-Traded securities in the portfolios as at March 31, 2018 and March 31, 2017 are NIL.
2 Disclosure Under Regulation 25(8) of the Securities and Exchange Board of India (Mutual Funds) Regulations, 1996 as amended
Commission paid to Sponsor / AMC and its associates / related parties / group companies
Name of Sponsor / AMC and its associates / related parties / group companies
Nature of Association / Nature of
Relation
Period Covered
Business Given [Rs. In Crores]
% of Total Business
received by the Fund
Commission paid [Rs.]
% of Total commission paid by the
Fund
The Hongkong and Shanghai Banking Corporation Limited
Associate of Investment Manager
2017-2018 0.01 0.32 86,097.44 17.50
Name of Sponsor / AMC and its associates / related parties / group companies
Nature of Association / Nature of
Relation
Period Covered
Business Given [Rs. In Crores]
% of Total Business
received by the Fund
Commission paid [Rs.]
% of Total commission paid by the
Fund
The Hongkong and Shanghai Banking Corporation Limited
Associate of Investment Manager
2016-2017 0.13 30.24 101,711.63 22.21

18
Brokerage paid to Sponsor/AMC and its associates/related parties/group companies is NIL. (Previous year also NIL)
(i) Any underwriting obligations undertaken by the schemes of the mutual funds with respect to issue of securities associate companies - Nil (Previous year also Nil)
(ii) Devolvement - Nil (Previous year also Nil)
(iii) Subscription by the schemes in the issues lead managed by associate companies - Nil (Previous year also Nil)
(iv) Subscription to any issue of equity or debt on private placement basis where the sponsor or its associate companies have acted as arranger or manager - Nil. (Previous year also Nil)
3 None of the Investors held more than 25% of the total net assets of the Scheme at the year ended March 31, 2018 and March 31, 2017.
4 Unit Capital movement during the years ended March 31, 2018 and March 31, 2017:
Description
2017-2018
Opening Units Subscription Redemption Closing Units Face Value per unit (Rupees)
Regular Plan Growth Option
5,048,545.632 496,078.130 1,114,399.732 4,430,224.030 10
Regular Plan Dividend Option
2,282,850.367 57,291.737 705,759.264 1,634,382.840 10
Direct Plan - Growth Option
510,536.033 504,186.146 595,159.061 419,563.118 10
Direct Plan - Dividend Option
3,374.592 11,559.119 – 14,933.711 10
Description
2016–2017
Opening Units Subscription Redemption Closing Units Face Value per unit (Rupees)
Regular Plan Growth Option
5,569,323.787 319,549.456 840,327.611 5,048,545.632 10
Regular Plan Dividend Option
2,547,371.707 34,037.579 298,558.919 2,282,850.367 10
Direct Plan - Growth Option
497,559.401 28,559.337 15,582.705 510,536.033 10
Direct Plan - Dividend Option
3,374.592 – – 3,374.592 10
** Units held by the AMC (Seed Capital) in Direct Plan Growth Option as on March 31, 2018 is 113,484.384 and as on March 31, 2017 is 113,484.384
5 Previous year’s figures have been re-grouped / re-arranged where appropriate.
6 No contingent liabilities for the years ended March 31, 2018 and March 31, 2017.
7 Expenses other than Management Fees are Inclusive of GST / Service Tax where applicable.
Notes to Accounts – Annexure I (Contd...)To the Abridged Balance Sheet and Revenue Account for the Year ended March 31, 2018

19
Notes to Accounts – Annexure I (Contd...)To the Abridged Balance Sheet and Revenue Account for the Year ended March 31, 2018
8 Other income of Rs. 551 represents Exit load (net of service tax) credited to the Scheme (2017: Rs. 497 represents Exit load (net of service tax) credited to the Scheme).
9 Investor Education Awareness
In view of the AMFI Best Practices Guidelines Circular No. 56/2015-16, the IEF ( Investor Education Fund) accrual is set aside in a separate bank account and the consolidated balance across all schemes as on March 31, 2018. The break-up of which is as under:
Particulars March 31, 2018 Amount
(in Rs. Lacs)
March 31, 2017 Amount
(in Rs. Lacs)
Opening Balance 44.00 –
Add: Accrual during the year 219.83 182
Less: Transferred to AMFI 101.10 83
Less: Payable to AMFI (March accrual) 8.81 8
Add: Investment Income for the year 8.28 11
Less: Spent during the year 43.17 58
Closing Balance 119.02 44
10 Categorization and Rationalization of Schemes
Pursuant to SEBI circular no. SEBI/HO/IMD/DF3/CIR/P/2017/114 dated October 6, 2017 and SEBI circular no. SEBI/HO/IMD/DF3/CIR/P/2017/126 dated December 4, 2017 on ‘Categorization and Rationalization of Schemes’, fundamental attribute related changes were carried out in certain Schemes of HSBC Mutual Fund to align the same with the requirements specified in the aforesaid circulars effective from March 14, 2018. The said changes have been approved by the Board of Directors of the HSBC Asset Management (India) Pvt. Ltd. (the AMC) and the Board of Trustees (the Trustees). SEBI vide its letter no. IMD/DF3/OW/P/2018/89/1 dated January 2, 2018 has also conveyed it’s no objection to the said changes.
A notice-cum-addendum providing details of changes in the fundamental attributes of certain Schemes was published in the newspaper on February 3, 2018 and is also available on the website of the AMC at www.assetmanagement.hsbc.com/in. The exit window period of 30 days was provided to the investors during which no exit load was charged to investors on switches/redemptions.
Apart from the fundamental attribute changes, there has been change in the ‘type of Scheme’ for all the open ended Schemes and ‘name of Scheme’ in certain Schemes for the purposes of alignment of the existing Schemes with the provisions of the Circular. The details of the Schemes impacted is provided below:
Existing Name Revised Name Fundamental Attribute change
Benchmark Change
HSBC Emerging Markets Fund
HSBC Global Emerging Markets Fund
Yes No
11 The Annual Accounts of the Schemes prepared in accordance with the accounting policies and standards specified in the Ninth Schedule of The Securities and Exchange Board of India (Mutual Funds) Regulations, 1996 has been approved by the Board of Directors of HSBC Asset Management (India) Private Limited and The Board of Trustees of HSBC Mutual Fund at their meetings held on July 16, 2018 and July 17, 2018 respectively. The audit report attached herewith refers to the said Annual Accounts. The aforesaid abridged accounts are an extract of the Annual Accounts and are prepared in accordance with SEBI Circular No. IMD/Cir8/132968/2008 dated July 24, 2008.

20
Voting Policy and Procedures
In view of SEBI guidelines related to “Role of Mutual Funds in Corporate Governance of Public Listed Companies”, AMIN has formulated its “Policy for Proxy Voting in Public Listed Companies”. The said policy and details of actual exercise of proxy votes along with the summary of votes cast and the auditors certification during the Financial Year 2017 – 18 is available on its website – http://www.assetmanagement.hsbc.com/in and in full Annual Report for the Financial Year 2017 – 18.

Statutory Details & DisclaimersAll returns have been sourced from Mutual Funds India Explorer software unless otherwise stated. With regard to equity schemes (including the equity component of MIPs), Fund performance is calculated on a total return basis (i.e. it includes dividends re-invested) while the benchmark is calculated on a price return basis (i.e. it does not consider dividends re-invested). This document has been prepared by HSBC Asset Management (India) Private Ltd (HSBC) for information purposes only and should not be construed as an offer or solicitation of an offer for purchase of any of the funds of HSBC Mutual Fund. All information contained in this document (including that sourced from third parties), is obtained from sources HSBC, the third party believes to be reliable but which it has not independently verified and HSBC, the third party makes no guarantee, representation or warranty and accepts no responsibility or liability as to the accuracy or completeness of such information. The information and opinions contained within the document are based upon publicly available information and rates of taxation applicable at the time of publication, which are subject to change from time to time. Expressions of opinion are those of HSBC only and are subject to change without notice. It does not have regard to specific investment objectives, financial situation and the particular needs of any specific person who may receive this document. Investors should seek financial advice regarding the appropriateness of investing in any securities or investment strategies that may have been discussed or recommended in this report and should understand that the views regarding future prospects may or may not be realized. Neither this document nor the units of HSBC Mutual Fund have been registered in any jurisdiction. The distribution of this document in certain jurisdictions may be restricted or totally prohibited and accordingly, persons who come into possession of this document are required to inform themselves about, and to observe, any such restrictions.
Investors should not invest in the Scheme solely based on the information provided in this document and should read the Scheme Information Document and Statement of Additional Information of the Fund for details. This document does not constitute an offering document.
No part of this publication may be reproduced, stored in a retrieval system, or transmitted, on any form or by any means, electronic, mechanical, photocopying, recording, or otherwise, without the prior written permission of HSBC Asset Management (India) Private Ltd.
Mutual Fund investments are subject to market risks, read all scheme related documents carefully.

HSBC Multi Cap Equity Fund (erstwhile HSBC India Opportunities Fund)Multi Cap Fund – An open ended equity Scheme investing across large cap, mid cap, small cap stocks
Abridged Annual Report 2017 - 2018

1
Dear Investor,
Globally, we are witnessing a very interesting phase. The equity markets delivered a stellar performance in 2017. However, there are worries about the impact of higher rates, global trade wars, an economic growth moderation and higher volatility.
Closer home, India has become the world’s sixth-biggest economy. India has doubled its GDP to USD 2.2 trillion within a decade. The introduction of reform measures, including demonetisation and the Goods and Services Tax (GST), had put pressure on selective parts of the economy in 2017. The impact of these measures is likely to be transitory. India’s economic growth is expected to accelerate from 6.7% in FY18 to 7.4% in the current year as per IMF forecasts.
There has been a shift in the domestic savings pool supporting the market. Domestic investors have been increasing exposure to equities and financial assets moving away from gold and real estate. Mutual funds witnessed sizable inflows on the back of the boost in liquidity within the banking system from demonetisation. The AUM of the mutual fund industry grew by 21.7% in March 2018 compared to March 2017.
With growth, comes responsibility. Last year, the regulator, Securities and Exchange Board of India (SEBI) issued a circular to rationalise and categorise mutual fund schemes in India. We are pleased to state that none of our funds needed to be redesigned. All our schemes have been defined as per the new categorisation. We believe this classification will simplify investing into mutual funds and enhance comparability within the schemes offered.
As India moves to a digital age, e-commerce platforms are becoming increasingly popular. I request you to logon to our online transaction platform. It is a quick, convenient and an efficient tool to invest into our funds and manage your investments online.
At HSBC Global Asset Management, India, we are dedicated to one goal: delivering exceptional investment management for our clients. By bringing together our

2
global investment knowledge and capabilities, we are able to offer specialised expertise across asset classes. This has helped us to become a trusted partner to our individual and institutional investors.
We remain committed to our long-term perspective and disciplined investment approach as we conduct a rigorous, fundamental analysis of investments with a strong emphasis on risk management. Although the investment landscape appears favourable, it is worth remembering that markets are dynamic and constantly evolving. Therefore, we believe active, professional investment management serves investors well. Amid changing markets and economic conditions, we are confident that investors with a well-diversified portfolio and a patient, long-term outlook should be well positioned for the years ahead.
Together we thrive.
Warm regards,
Ravi Menon
Chief Executive Officer, HSBC Global Asset Management, India

3
SPONSORHSBC Securities and Capital Markets (India) Private LimitedRegd. Office: 52/60, Mahatma Gandhi Road, Fort, Mumbai - 400 001.
TRUSTEEBoard of TrusteesOffice: 16, Veer Nariman Road, Fort, Mumbai 400 001.
ASSET MANAGEMENT COMPANYHSBC Asset Management (India) Private LimitedCorp. & Regd. Office: 16, Veer Nariman Road, Fort, Mumbai 400 001.
CUSTODIANStandard Chartered Bank (SCB)Corp. & Regd. Office: Crescenzo, Securities Services, 3rd Floor, C-38/39, G-Block, Bandra Kurla Complex, Bandra East, Mumbai – 400051.
AUDITORS TO THE SCHEMEBSR & Co. LLPChartered Accountants 5th Floor, Lodha Excelus, Apollo Mills Compound, N.M. Joshi Marg, Mahalaxmi, Mumbai 400 011.
REGISTRAR & TRANSFER AGENTSComputer Age Management Services Private Limited (CAMS)Unit: HSBC Mutual Fund ’C’ Block, 2nd Floor, Hanudev Info Park P. Ltd., SF No. 558/2, Udayampalayam Road, Nava India, Coimbatore - 641 028.
BOARD OF TRUSTEESMr. Nasser Munjee
Mr. Manu Tandon
Mr. Mehli Mistri
Mr. Dilip J. Thakkar
Ms. Jasmine Batliwalla
Mr. Pedro Bastos
BOARD OF DIRECTORSMs. Kishori J. Udeshi - Chairperson
Mr. S. P. Mustafa
Mr. Dinesh Mittal
Mr. Ravi Menon - Chief Executive Officer

4
The Trustees of HSBC Mutual Fund (“Fund”) present the Sixteenth Annual Report and the audited abridged financial statements of the schemes of the Fund for the year ended March 31, 2018.
As at March 31, 2018, the Fund offered 30 schemes across asset classes to meet the varying investment needs of the investors. Notably, three Schemes of HSBC Mutual Fund viz. HSBC Large Cap Equity Fund, HSBC Short Duration Fund and HSBC Cash Fund have completed 15 years of operations during the year.
During the year, the Fund has launched Plan(s) under Fixed Term Series and carried out merger of the existing schemes viz HSBC Dividend Yield Equity Fund merged into HSBC Multi Cap Equity Fund (HMEF), erstwhile HSBC India Opportunities Fund, as offering sub-scale fund was not in the interest of the unitholders.
Further, in order to bring uniformity in the practice across Mutual Funds and to standardize the scheme categories and characteristics of schemes, SEBI vide its circular no. SEBI/HO/IMD/DF3/CIR/P/2017/114 dated October 06, 2017, issued guidelines for categorization and rationalization of Mutual Fund schemes.
Accordingly, HSBC Large Cap Equity Fund (erstwhile HSBC Equity Fund), HSBC Small Cap Equity Fund (erstwhile HSBC Mid Cap Equity Fund) , HSBC Infrastructure Equity Fund, HSBC Global Emerging Market Fund (erstwhile HSBC Emerging Market Fund), HSBC Debt Fund (erstwhile HSBC Income Fund – Investments Plan), HSBC Short Duration Fund (erstwhile HSBC Income Fund – Short Term Plan), HSBC Low Duration Fund (erstwhile HSBC Ultra Short Term Bond Fund), HSBC Regular Savings Fund (erstwhile HSBC Monthly Income Plan) and HSBC Managed Solutions have undergone fundamental attributes changes with effective from March 14, 2018.
The Fund continues its focus on delivering consistent long term returns. The comments on the performance of the Scheme(s) is provided hereinafter. Dividends were declared under various schemes as per the provisions contained in the respective Scheme Information Documents after considering the distributable surplus available under the respective Schemes. Details of dividends declared can be viewed on our website at www.assetmanagement.hsbc.com/in.
1. Scheme Performance, future outlook and oPerationS of the SchemeS
a. Operations and Performance of the Schemes
HSBC Multi Cap Equity Fund (HMEF), erstwhile HSBC India Opportunities Fund (Multi Cap Fund – An open ended equity Scheme investing across large cap, mid cap, small cap stocks)
HMEF seeks long term capital growth through investments across all market capitalisations, including small, mid and large cap stocks. The fund aims to be predominantly invested in equity and equity related securities. However, it could move a significant portion of its assets towards fixed income securities if the fund manager becomes negative on equity markets. However, there can be no assurance or guarantee that the investment objective of the scheme would be achieved.
The net assets of HMEF amounted to Rs. 597.77 crores as at March 31, 2018 as compared to Rs 454.14 crores as at March 31, 2017. Around 98.45% of the net assets were invested in equities, 1.59% of the net assets were invested in reverse repos/CBLO and (-0.04%) in net current assets as at March 31, 2018.
HMEF is a multi-cap fund and we remained invested in a diversified portfolio across all capitalization stocks. HMEF has outperformed its benchmark over 3 year, 5 year period and since inception. It has been possible due to superior stock selection, especially in sectors like Financials, Materials, and Energy. Going forward, we will continue with our approach of selecting sustainably profitable companies at reasonable valuations. In terms of allocation, being overweight in Materials, Industrials, Financials, and Consumer Discretionary sectors and underweight in Staples, Energy, Technology, Utilities, and Health care sectors contributed to outperformance.
Scheme Name & Benchmarks Absolute Returns
(%)
Compounded Annualized Returns (%)
Date of Inception : 24 February 2004 1 Year 3 Years 5 Years Since Inception
HSBC Multi Cap Equity Fund - Growth 10.67 9.63 19.60 16.37
S&P BSE 200 TRI (Scheme Benchmark) 13.51 9.91 15.77 14.79
Nifty 50 TRI (Standard Benchmark) 12.68 7.99 13.63 14.42
Trustees’ ReportFor the year ended March 31, 2018

5
Scheme Name & Benchmarks Absolute Returns
(%)
Compounded Annualized Returns (%)
Date of Inception : 24 February 2004 1 Year 3 Years 5 Years Since Inception
Rs. 10,000, if invested in HMEF, would have become 11,067 13,183 24,483 84,775
Rs. 10,000, if invested in S&P BSE 500, would have become 11,351 13,284 20,804 69,914
Rs. 10,000, if invested in Nifty 50, would have become 11,268 12,599 18,950 66,803
Past performance may or may not be sustained in future. The returns for the respective periods are provided as on last business day of March 2018 for Growth Option. Different plans shall have a different expense structure. As TRI data is not available since Inception of the scheme, benchmark performance is calculated using composite CAGR of S&P BSE 200 PRI values from date 24-Feb-2004 to date 29-Jun-2007 and TRI values since date 29-Jun-2007.
b. Market Overview & Outlook (as furnished by HSBC Asset Management (India) Private Limited)
EqUITY OUTLOOKIndian equity markets continued to remain strong during fiscal year 2017-18 and posted gains of 11.76% by S&P CNX Nifty and 13.24% by BSE Midcap index respectively. Biggest drivers of the markets were, robust DII flow into equities, continued push of mega reforms – Goods and Services Tax (GST) implementation, Insolvency and Bankruptcy Code implementation, Real Estate (Regulation and Development) Act, second consecutive normal monsoon, and electoral victories of the ruling party in many state elections. On the other hand, the markets weather the storm of disruption in economy due to GST implementation, lingering impact of demonetization, muted FII flows, and rising yields in developed markets. Domestic Mutual Fund segment had their best ever year and they brought in ~USD 22 bn of net inflows in equities during the year. Even after witnessing ~USD 4.3 bn of net outflows from the domestic insurers, the net DII tally was a very impressive ~USD 17.7 bn of net inflows. There were mixed global cues well and the Foreign Institutional Investors (FIIs) net bought Indian equities worth USD 3.2 bn. The inflows by both FIIs and domestic MFs acted as a factor in the strong market performance.
Indices Returns (April 1, 2017 to March 31, 2018) 1 Year (%)
S&P BSE Sensex 12.70%
NSE CNX Nifty 11.76%
S&P BSE 100 12.12%
S&P BSE 200 12.49%
S&P BSE 500 13.21%
S&P BSE Midcap 14.31%
S&P BSE 250 Small-cap 14.13%
Source: Bloomberg (All values are total return)
Our view on the key aspects related to equity markets are presented below -
The impressive performance in equity markets during FY 2017-18 has come on the back of strong liquidity largely by domestic MFs but supported in party by FII flows, positive global growth, benign macro – both domestically and global, expectation of the continuation of favorable policy environment domestically and expectation of corporate earnings revival. Possibility of sound macro, economic reforms and implementation of existing reforms have increased, especially after continued success of the ruling party at the centre in state elections. However, after this strong performance in markets and rather long wait for earnings to be delivered has meant that the equity markets are currently trading above their historical averages.
Trustees’ ReportFor the year ended March 31, 2018 (Contd...)

6
Moving into FY 2018-19, we expect a continuation of the economic recovery process domestically, recovery in corporate earnings - led early by volume growth, and continued DII flows. Government led investment spending and rural consumption are likely to lead with private sector investments contributing later (possibly after general elections 2019). The budget document that was presented in early February provides a good medium term policy direction for the economy. Occasionally the policy actions can serve up a few bumps and jolts but over the medium term, across different governments, there is a thread of continuity connecting many key economic policies such as in the case of this year’s union budget. We, in our investment process, prefer to take comfort in these threads of continuity and remain constructive on the India growth story. This makes us positive on the Indian equity markets over the medium to long term.
Risks are in the form of market valuations trending above historical averages, weaker than expected delivery in corporate earnings going forward, external news flows related to trade protectionism, developed market central banks raising rates prematurely, and geopolitical tensions and other eco-political events would also influence market performance going forward, as the recent rally in the markets was supported by strong FII inflows.
DEBT OUTLOOKFixed Income in Financial Year 2017-18 has seen volatility further step up in this year. Markets went to perfect storm with higher crude prices, low liquidity and pressure on currency, apart from rate hike expectations.
Inflation has followed the glide path to lower numbers towards 4% RBI target and even lower than the target number when inflation printed a lowly 1.46% in June 2018 on back of lower food prices. RBI went for a cut despite of neutral stance. This positivity continued till until crude shock came in form of higher crude process. Global prices of Brent crude saw substantial increase in second half of the year, which jeopardized the inflation path. Other worries that gathered around this time were related to GST collection and eventual impact on fiscal situation.
Government of India allowed the fiscal deficit to slip to 3.5% (budget 3.2%) and kept next year target at 3.3% (in place of earlier path of 3%). This was on back of some excise relaxation for oil products and a month less collected for GST due to implementation in the current year. The fear of fiscal slippage alongwith the announcement of higher bond issuances spooked the bond markets into higher yields. Government finally borrowed only INR 90 bln extra (in place of INR 500 bln announced initially).
On the Monetary front the year was very volatile as well. RBI changed its stance to neutral causing some worry around rate hikes. Thereafter it cut rates and again went for OMO sales operations simultaneously. This created some confusion in the market participants regarding rates direction. Finally extra supply, higher oil prices and higher inflation paved way for rates higher. RBI also held position on regulatory forbearance about spreading out losses by banks publicly. It eventually gave up the position in the end of March. However, the swift changes in stance caused lot of pressure and volatility in bonds.
Liquidity situation continuously deteriorated due to OMO sales initially and withdrawal of deposits due to remonetisation. Further liquidity was absorbed out due to portfolio outflows and reduction in reserves. Despite of defense from RBI utilizing the reserves, the currency depreciated meaningfully, which caused further jitters in foreign investor sentiments. Lack of liquidity also affected 1-3 year rates which were elevated in second half of the year.
Going forward following are key variables to watch out for:• Liquidity: Liquidity will drive short end rates and eventually drive decisions leading to market interventions
and CRR cuts. RBI has focused now on neutral liquidity stance and providing liquidity to system, which will bode well short end rates.
• Inflation: Inflation numbers will determine future course of action for RBI and remains a critical variable for policy. We expect inflation to remain at 4.7% level in the ease in second half of FY 2018-19 in line with RBI’s expectations.
• Growth: GDP growth numbers as well as industrial activity will also determine the decision on policy.
• Fiscal deficit: Fiscal deficit and government spending will determine the government borrowing and crowding out in interest rate curve. We expect prudence in government spending and prospect of spending on infrastructure to pick up which will crowd in private investment as well.
• Current Account Deficit: Current Account Deficit determines how the pressure on currency works and effective management of forex reserves.
Trustees’ ReportFor the year ended March 31, 2018 (Contd...)

7
• Currency levels: Level of INR will determine how the central bank reacts to the situation on the global crisis etc.
2. Brief Background of SPonSorS, Board of truSteeS and aSSet managementcomPany
a. Sponsor
HSBC Mutual Fund is sponsored by HSBC Securities and Capital Markets (India) Private Limited (HSCI).The Sponsor is the Settler of the Mutual Fund Trust. The Sponsor has entrusted a sum of Rs. 1,00,000(Rupees One Lakh only) to the Trustee as the initial contribution towards the corpus of the Mutual Fund.
HSCI offers integrated investment banking services, securities and corporate finance & advisory. HSCI is a member of the Bombay Stock Exchange Limited and National Stock Exchange (capital and derivativemarket segments). HSCI holds 100% of the paid up equity share capital of HSBC Asset Management(India) Private Limited.
b. HSBC Mutual Fund
HSBC Mutual Fund (“the Mutual Fund” or “the Fund”) has been constituted as a Trust in accordance with the provisions of the Indian Trusts Act, 1882 (2 of 1882) vide a Trust Deed dated February 7, 2002 with HSBC Securities and Capital Markets (India) Private Limited, as the Sponsor and the Board of Individual Trustees. The Trustee has entered into an Investment Management Agreement dated February 7, 2002 with HSBC Asset Management (India) Private Limited (AMC) to function as the Investment Manager for all the schemes of the Fund. The Fund was registered with SEBI vide registration number MF/046/02/5dated May 27, 2002.
The Trust has been formed for the purpose of pooling of capital from the public for collective investment in securities for the purpose of providing facilities for participation by persons as beneficiaries in suchinvestments and in the profits/income arising therefrom.
c. Board of Trustees (the Trustees)
The Board of Trustees is the exclusive owner of the Trust Fund and holds the same in trust for the benefit of the unit holders. The Trustees have been discharging their duties and carrying out the responsibilities as provided in the SEBI (Mutual Funds) Regulations, 1996 and the Trust Deed. The Trustees seek to ensure that the Fund and the schemes floated there under are managed by the AMC in accordance with theTrust Deed, the said Regulations, directions and guidelines issued by the SEBI, the Stock Exchanges, the Association of Mutual Funds in India and other regulatory agencies.
d. Asset Management Company (the AMC)
HSBC Asset Management (India) Private Limited (the Investment Manager or the AMC) is a private limited company incorporated under the Companies Act, 1956 on December 12, 2001 having its RegisteredOffice at 16, V. N. Road, Fort, Mumbai 400 001. HSBC Asset Management (India) Private Limited hasbeen appointed as the Asset Management Company of HSBC Mutual Fund by the Trustee vide Investment Management Agreement (IMA) dated February 7, 2002 and executed between the Trustees and theAMC. SEBI approved the AMC to act as the Investment Manager of the Fund vide its letter No. MFD/BC/163/2002 dated May 27, 2002. The paid-up equity share capital of the AMC is Rs. 61.59 crores. The AMC is registered as a Portfolio Manager under the SEBI (Portfolio Managers) Regulations, 1993 videregistration no. INP000001322. The AMC also offers non-binding Advisory services to offshore fundsunder the mutual fund license.
HSBC Securities and Capital Markets (India) Private Limited holds 100% of the paid up equity sharecapital of the AMC.
3. inveStment oBjective of the SchemeSThe investment objective of the respective schemes has been provided above under the heading “SchemePerformance, Future Outlook and Operation of the Scheme” (Refer Section 1).
Trustees’ ReportFor the year ended March 31, 2018 (Contd...)

8
4. Significant accounting PolicieS The Significant Accounting Policies form part of the Notes to the Accounts annexed to the Balance Sheet
of the Schemes in the Full Annual Report. The accounting policies are in accordance with Securities Exchange Board of India (Mutual Funds) Regulations 1996.
5. unclaimed dividendS & redemPtionS Summary of number of investors & corresponding amount Scheme-wise as on March 31, 2018.
SchemeUnclaimed Dividend Unclaimed Redemption
Amount (Rs.) No. of Investors
Amount (Rs.) No. of Investors
HSBC Multi Cap Equity Fund 4,305,796.93 476 3,072,391.28 65
6. inveStor ServiceSThe number of official points of acceptance of transactions is 205 locations. In addition to the offices of the Registrar & Transfer agents, the AMC has Investor Service Centres in 9 locations at its own offices - namely Mumbai, New Delhi, Kolkata, Bangaluru, Pune, Ahmedabad, Hyderabad, Chandigarh and Chennai. With a view to enhance customer convenience, the AMC has the facility of priority based servicing to key distributors through the enhancement of the Interactive Voice Reponses. The AMC has a single Toll Free number which can be dialed from anywhere in India. The call centre service is being managed by the Registrar and Transfer Agents.
On the distribution front, the number of empanelled distributors was 460 as on March 31, 2018. During the year, the AMC initiated tie-ups for online distribution of the Mutual Fund’s schemes with several channel partners taking the total number of such tie-ups to 42.
7. detailS of inveStor grievance redreSSalThe details of the redressal of investor complaints received against HSBC Mutual Fund during April 2017 - March 2018 are as follows:
2017-2018
Com- plaint Code
Type of complaint (a) No. of complaints
pending at the
beginning of the year
(b) No. of complaints received during
the year
Action on (a) and (b)
Resolved Non Actiona-
ble*
Pending
Within 30
days
30 - 60 days
60 - 180 days
Beyond 180 days
0 - 3 months
3 - 6 months
6 - 9 months
9 - 12 months
I A Non receipt of Dividend on Units
0 5 4 1 0 0 0 0 0 0 0
I B Interest on delayed payment of Dividend
0 0 0 0 0 0 0 0 0 0 0
I C Non receipt ofRedemption Proceeds
1 12 12 1 0 0 0 1 0 0 0
I D Interest on delayedp a y m e n t o f Redemption
0 1 1 0 0 0 0 0 0 0 0
II A Non receipt of Statement of Account / Unit Certificate
0 0 0 0 0 0 0 0 0 0 0
II B D i s c r e p a n c y i n Statement of Account
0 0 0 0 0 0 0 0 0 0 0
Trustees’ ReportFor the year ended March 31, 2018 (Contd...)

9
2017-2018
Com- plaint Code
Type of complaint (a) No. of complaints
pending at the
beginning of the year
(b) No. of complaints received during
the year
Action on (a) and (b)
Resolved Non Actiona-
ble*
Pending
Within 30
days
30 - 60 days
60 - 180 days
Beyond 180 days
0 - 3 months
3 - 6 months
6 - 9 months
9 - 12 months
II C Data corrections in Investor details **
0 34 34 0 0 0 0 0 0 0 0
II D Non receipt of Annual Report /Abridged Summary
0 0 0 0 0 0 0 0 0 0 0
III A Wrong switch between Schemes
0 0 0 0 0 0 0 0 0 0 0
III B Unauthorized switch between Schemes
0 0 0 0 0 0 0 0 0 0 0
III C Deviation from Scheme attributes
0 0 0 0 0 0 0 0 0 0 0
III D Wrong or excess charges / load
0 0 0 0 0 0 0 0 0 0 0
III E Non updat ion of changes viz. address, PAN, bank details, nomination, etc
0 6 6 0 0 0 0 0 0 0 0
IV Others 1 41 42 0 0 0 0 0 0 0 0
Total 2 99 99 2 0 0 0 0 0 0 0
Summary of Complaints for FY 2017-18
Particulars Count
Total complaints received 99
Total number of folios 140099
% of complaints against the folio 0.071%
# active folios** As per AMFI Best Practice Guidelines Circular No.25/2011-12 for Revisions in the Guidelines on
Standardization of Complaints/Grievances Reporting Procedure. If “Others” include a type of complaint which is more than 10% of overall complaints, then such a reason should be provided separately. Hence data corrections in Investor Details is included as a separate category
* Non actionable means the complaint is incomplete / outside the scope of the mutual fund
8. inveStor education initiativeS The Fund undertook various investor education and awareness initiatives related to investments in mutual funds throughout India in English / Hindi and Regional languages via mass media. The Fund conducted 16 roadshows at various locations in India to promote various Investor Awareness related topics including Asset Allocation, SIPs, Equity Mutual Funds and Financial Planning. The Fund has a Year-long tie-up with Mutual Fund Insights Magazine that includes 3 pages of content and advertorial publication in their monthly issue. Each issue contains a story promoting SIPs to achieve one’s various investment goals. In the month of December 2017 and January 2018 investor awareness promotion was done through Outlook and Outlook Money magazines through advertorials on various Mutual Fund topics.
Trustees’ ReportFor the year ended March 31, 2018 (Contd...)

10
9. Proxy voting PolicyIn terms of SEBI Circular no. SEBI/IMD/CIR No. 18/198647/2010 dated March 15, 2010, the Fund has adopted Proxy Voting Policy and Procedures for exercising voting rights in respect of securities held by the Schemes.
The summary of the votes casted in the general meetings of the Investee companies, by the AMC for and on behalf of the Schemes of the Fund, for the financial year 2017-18 is provided below:
quarter Total no. of resolutions
Break-up of vote decision
For Against Abstained
June 2017 184 116 5 63
September 2017 920 827 12 81
December 2017 49 45 1 3
March 2018 36 29 1 6
Total 1,189 1,017 19 153
In terms of the requirement of SEBI Circular no. CIR/IMD/DF/05/2014 dated March 24, 2014 and SEBI/HO/IMD/DF2/CIR/P/2016/68 dated August 10, 2016; the AMC has obtained certificate from M/s. M. P. Chitale & Co., Chartered Accountants, who is acting as a Scrutinizer, on the voting report for the FY 2017-18. The certificate dated May 3, 2018 issued by M/s. M. P. Chitale & Co., is available on the website of the AMC as part of the full Annual Report.
Unit holders can refer to the full Annual Report for complete details of actual exercise of votes in the general meetings of the investee companies for the financial year 2017-18 or log on to our website at www.assetmanagement.hsbc.com/in.
10. Statutory detailSa) The Sponsors are not responsible or liable for any loss resulting from the operation of the Schemes of
the Fund beyond initial contribution of Rs. 1 lakh for setting up the Fund.
b) The price and redemption value of the units, and income from them, can go up as well as down with fluctuations in the market value of its underlying investments.
c) Full Annual Report shall be disclosed on the website at www.assetmanagement.hsbc.com/in and shall be available for inspection at the Head Office of the Mutual Fund. Present and prospective unit holders can obtain copy of the Trust Deed, the full Annual Report of the Scheme(s), the Annual Report of HSBC Asset Management (India) Private Limited and the text of the relevant Scheme(s) at a price.
11. acknowledgementSThe Trustees wish to thank the Unit holders of the Schemes for their support throughout the year and also thank the Government of India, the Securities and Exchange Board of India (SEBI), the Reserve Bank of India (RBI) and the Association of Mutual Funds in India (AMFI) for the guidance provided by them. The Trustees also appreciate the services provided by the Registrar and Transfer Agent, Fund Accountant, Custodian, Bankers, Distributors and Brokers. The guidance and services provided by the Auditors and advocates and the ebullience, sincerity and dedication of the employees of HSBC Asset Management (India) Private Limited is also appreciated.
The Trustees look forward to the continued support of everyone.
For and on behalf of the Board of Trustees of HSBC Mutual Fund
Sd/-
Dilip Thakkar
Trustee
Mumbai
July 17, 2018.
Trustees’ ReportFor the year ended March 31, 2018 (Contd...)

11
To the Board of Trustees of
HSBC Mutual Fund – HSBC Multi Cap Equity Fund (Formerly known as HSBC India Opportunities Fund)
Report on the Financial StatementsWe have audited the accompanying Financial Statements of HSBC Multi Cap Equity Fund (formerly known as HSBC India Opportunities Fund) (the ‘Scheme’), which comprise the balance sheet as at 31 March 2018, the related revenue account and the cash flow statement for the year then ended, and a summary of significant accounting policies and other explanatory information, annexed thereto.
Management’s responsibility for the Financial StatementsThe Board of Trustees to the HSBC Mutual Fund (the ‘Board of Trustees’) and HSBC Asset Management (India) Private Limited (the ‘AMC’), being the investment manager to HSBC Mutual Fund (the ‘Fund’) (collectively referred as ‘Management’), are responsible for the preparation of these financial statements that give a true and fair view of the financial position and financial performance of the Scheme in accordance with the accounting policies and standards specified in the Ninth Schedule of the Securities and Exchange Board of India (Mutual Funds) Regulations, 1996, as amended (the ‘Regulations’) and the accounting principles generally accepted in India. This responsibility includes maintenance of adequate accounting records for safeguarding of the assets of the Scheme and for preventing and detecting frauds and other irregularities; selection and application of appropriate accounting policies; making judgments and estimates that are reasonable and prudent; and design, implementation and maintenance of adequate internal financial controls, that were operating effectively for ensuring the accuracy and completeness of the accounting records, relevant to the preparation and presentation of the financial statements that give a true and fair view and are free from material misstatement, whether due to fraud or error.
In preparing the financial statements, management is responsible for assessing the Scheme’s ability to continue as a going concern, disclosing, as applicable, matters related to going concern and using the going concern basis of accounting unless management either intends to liquidate the Fund or to cease operations, or has no realistic alternative but to do so.
Auditor’s responsibilityOur responsibility is to express an opinion on these financial statements based on our audit. We conducted our audit in accordance with the Standards on Auditing issued by the Institute of Chartered Accountants of India (the ‘ICAI’). Those Standards require that we comply with ethical requirements and plan and perform the audit to obtain reasonable assurance about whether the financial statements are free from material misstatement.
An audit involves performing procedures to obtain audit evidence about the amounts and disclosures in the financial statements. The procedures selected depend on the auditor’s judgment, including the assessment of the risks of material misstatement of the financial statements, whether due to fraud or error. In making those risk assessments, the auditor considers internal controls relevant to preparation and fair presentation of the financial statements, of the Scheme, in order to design audit procedures that are appropriate in the circumstances, but not for the purpose of expressing an opinion on the effectiveness of the Scheme’s internal controls. An audit also includes evaluating the appropriateness of accounting policies used and the reasonableness of the accounting estimates made by Management, as well as evaluating the overall presentation of the financial statements.
We are also responsible to conclude on the appropriateness of management’s use of the going concern basis of accounting and, based on the audit evidence obtained, whether a material uncertainty exists related to events or conditions that may cast significant doubt on the Scheme’s ability to continue as a going concern. If we conclude that a material uncertainty exists, we are required to draw attention in the auditor’s report to the related disclosures in the financial statements or, if such disclosures are inadequate, to modify the opinion. Our conclusions are based on the audit evidence obtained up to the date of the auditor’s report. However, future events or conditions may cause the Scheme to cease to continue as a going concern.
Independent Auditors’ Report

12
Independent Auditors’ Report (Contd...)
We believe that the audit evidence we have obtained is sufficient and appropriate to provide a basis for our audit opinion.
OpinionIn our opinion, and to the best of our information and according to the explanations given to us, the aforesaid financial statements give the information required by the Regulations in the manner so required and give a true and fair view in conformity with the accounting principles generally accepted in India:
(i) in the case of the balance sheet, of the state of affairs of the Scheme as at 31 March 2018;
(ii) in the case of the revenue account, of the net surplus for the year ended on that date; and
(iii) in the case of the cash flow statement, of the cash flows of the Scheme for the year ended on that date.
Report on other Legal and Regulatory Requirements1 As required by Regulation 55(4) to the Regulations, we report that:
(a) We have obtained all information and explanations which, to the best of our knowledge and belief, were necessary for the purposes of the audit;
(b) The balance sheet and revenue account have been prepared in accordance with the accounting policies and standards specified in the Ninth Schedule of the Regulations.
2 As required by Clause 5(ii)(2) of the Eleventh Schedule of the Regulations, we report that the balance sheet and revenue account are in agreement with the books of account of the Scheme.
3 In our opinion and on the basis of information and explanations given to us, the methods used to value non - traded securities, as at 31 March 2018, as determined by the Board of Directors of AMC, are in accordance with the Regulations and other guidelines issued by the Securities and Exchange Board of India as applicable and approved by the Board of Trustees are fair and reasonable.
For B S R & Co. LLP Chartered Accountants Firm’s Registration No: 101248W/W-100022
Sd/-
Milind Ranade Partner Membership No: 100564
Place : Mumbai Date : July 17, 2018.

13
Abridged Balance Sheet as at March 31, 2018
Rs. in Lakhs
HSBC MULTICAP EqUITY FUND
As at March 31, 2018
As at March 31, 2017
LIABILITIES1 Unit Capital 12,877.69 11,251.70 2 Reserves & Surplus2.1 Unit Premium Reserves (7,333.39) (8,846.95)2.2 Unrealised Appreciation Reserve 10,340.35 11,663.27 2.3 Other Reserves 43,891.84 31,397.19 3 Loans & Borrowings – – 4 Current Liabilities & Provisions4.1 Provision for doubtful Income/Deposits – – 4.2 Other Current Liabilities & Provisions 344.53 837.86
TOTAL 60,121.02 46,303.07
ASSETS 60,121.01 46,303.07
1 Investments1.1 Listed Securities:1.1.1 Equity Shares 58,852.60 44,273.21 1.1.2 Preference Shares – – 1.1.3 Equity Linked Debentures – – 1.1.4 Other Debentures & Bonds – – 1.1.5 Securitised Debt securities – – 1.2 Securities Awaited Listing:1.2.1 Equity Shares – – 1.2.2 Preference Shares – – 1.2.3 Equity Linked Debentures – – 1.2.4 Other Debentures & Bonds – – 1.2.5 Securitised Debt securities – – 1.3 Unlisted Securities1.3.1 Equity Shares – – 1.3.2 Preference Shares – – 1.3.3 Equity Linked Debentures – – 1.3.4 Other Debentures & Bonds1.3.5 Securitised Debt securities – – 1.4 Government Securities – – 1.5 Treasury Bills – – 1.6 Commercial Paper – – 1.7 Certificate of Deposits – – 1.8 Bill Rediscounting – – 1.9 Units of Domestic Mutual Fund – – 1.10 Foreign Securities – –
Total Investments 58,852.60 44,273.21
2 Deposits 13.66 3.11 3 Other Current Assets3.1 Cash & Bank Balance 46.95 86.72 3.2 CBLO/Reverse Repo Lending 948.02 1,591.39 3.3 Others 259.79 348.64 4 Deferred Revenue Expenditure (to the extent not written off) – –
TOTAL 60,121.02 46,303.07
Notes to Accounts – Annexure I

14
Abridged Revenue Account for the year ended March 31, 2018
Rs. in Lakhs
HSBC MULTICAP EqUITY FUNDCurrent
Year ended March 31, 2018
Previous Year ended
March 31, 2017
1 INCOME1.1 Dividend 663.67 395.54
1.2 Interest 76.97 71.50
1.3 Realised Gain / (Loss) on Foreign Exchange Transactions – –
1.4 Realised Gains / (Losses) on Interscheme sale of investments – –
1.5 Realised Gains / (Losses) on External sale / redemption of investments
6,728.30 5,778.90
1.6 Realised Gains / (Losses) on Derivative Transactions – –
1.7 Other Income 0.04 0.04 (A) 7,468.98 6,245.98
2 EXPENSES2.1 Management fees 653.43 675.34
2.2 GST / Service tax on Management fees 112.91 100.90
2.3 Transfer agents fees and expenses 73.75 57.36
2.4 Custodian fees 6.76 5.63
2.5 Trusteeship fees 1.23 1.03
2.6 Commission to Agents 595.68 399.59
2.7 Marketing & Distribution expenses 2.50 0.56
2.8 Audit fees 3.46 2.68
2.9 Investor Education Expenses 11.19 9.32
2.10 Other operating expenses 17.53 10.66
2.11 Less: Expenses to be Reimbursed by the Investment Manager – (18.15) (B) 1,478.44 1,244.92
3 NET REALISED GAINS / (LOSSES) FOR THE YEAR (A–B=C) 5,990.54 5,001.06
4 Change in Unrealised Depreciation in value of investments and derivatives (d) – –
5 NET GAINS / (LOSSES) FOR THE YEAR [E=(C+D)] 5,990.54 5,001.06 6 Change in unrealised appreciation in the
value of investments and derivatives (F) (1,322.92) 6,123.33
7 NET SURPLUS / (DEFICIT) FOR THE YEAR (E+F=G) 4,667.62 11,124.39 7.1 Add: Balance transfer from Unrealised Appreciation Reserve 1,322.92 –
7.2 Less: Balance transfer to Unrealised Appreciation Reserve – 6,123.33
7.3 Add / (Less): Equalisation 8,378.19 (7,886.42)
7.4 Transfer from Reserve Fund 31,397.19 35,448.45
8 Total 45,765.92 32,563.09 9 Dividend appropriation9.1 Income Distributed during the year 1,874.08 1,165.90
9.2 Tax on income distributed during the year – –
10 Retained Surplus / (Deficit) carried forward to Balance sheet
43,891.84 31,397.19
Notes to Accounts – Annexure I

15
Key Statistics for the year ended March 31, 2018
HSBC MULTICAP EqUITY FUND Current
Year ended March 31, 2018
Previous Year ended
March 31, 2017
1. NAV per unit (Rs.):
Open
Regular Plan Growth Option 77.2302 61.0480
Regular Plan Dividend Option 24.5936 20.6385
Direct Plan – Growth Option 79.6946 62.5482
Direct Plan – Dividend Option 26.9482 22.3399
High
Regular Plan Growth Option 95.0094 77.2302
Regular Plan Dividend Option 30.2551 25.8705
Direct Plan – Growth Option 98.6473 79.6946
Direct Plan – Dividend Option 33.3570 28.1979
Low
Regular Plan Growth Option 76.7350 59.8941
Regular Plan Dividend Option 18.0459 20.2484
Direct Plan – Growth Option 54.6499 61.3742
Direct Plan – Dividend Option 19.5189 21.9206
End
Regular Plan Growth Option 84.7455 77.2302
Regular Plan Dividend Option 24.8244 24.5936
Direct Plan – Growth Option 88.1158 79.6946
Direct Plan – Dividend Option 27.6324 26.9482
2. Closing Assets Under Management (Rs. in Lakhs)
End 59,777 45,414
Average (AAuM)1 55,962 46,588
3. Gross income as % of AAuM2 13.35% 13.41%
4. Expense Ratio:
a. Total Expense as % of AAuM (Including service tax / GST on Management fees) (planwise)
Regular Plan (Continue) 2.66% 2.69%
Direct Plan 1.90% 1.98%
b. Management Fee as % of AAuM (planwise)
Regular Plan (Continue) 1.14% 1.45%
Direct Plan 1.14% 1.45%
5. Net Income as a percentage of AAuM3 10.70% 10.73%
6. Portfolio turnover ratio4 0.48 0.36

16
Key Statistics for the year ended March 31, 2018 (Contd...)
HSBC MULTICAP EqUITY FUND Current
Year ended March 31, 2018
Previous Year ended
March 31, 2017
7. Total Dividend per unit distributed during the year (planwise)
Retail
Regular Plan Dividend Option 2.25 1.50
Direct Plan – Dividend Option 2.25 1.50
Corporate
Regular Plan Dividend Option 2.25 1.50
Direct Plan – Dividend Option 2.25 1.50
8. Returns (%):
a. Last One Year
Scheme
Regular Plan Growth Option 10.6698 26.5073
Direct Plan – Growth Option 11.5131 27.4131
Benchmark
S&P BSE 200 13.5100 22.4731
b. Since Inception
Scheme
Regular Plan Growth Option 16.3688 16.8785
Direct Plan – Growth Option 17.2638 18.8582
Benchmark
S&P BSE 200 14.7900 13.7930
1. AAuM=Average daily net assets.2. Gross income = amount against (A) in the Revenue Account i.e. Income.3. Net income = amount against (C) in the Revenue Account i.e. Net Realised Gains / (Losses) for the year.4. Portfolio Turnover = Lower of sales or purchase divided by the Average AuM for the year.5. The net asset value disclosed represents the computed NAV on March 31, 2018 (Non-business Day), and
not the last declared NAV

17
Notes to Accounts – Annexure ITo the Abridged Balance Sheet and Revenue Account for the Year ended March 31, 2018
hSBc multicaP eQuity fund
1 Investments: 1.1. It is confirmed that investments of the Schemes are registered in the name of the Trustees for the
benefit of the Scheme’s unitholders.
1.2. Open Positions of derivatives as of years ended March 31, 2018 and March 31, 2017 are NIL.
1.3. Investments in Associates and Group Companies:
(Rupees)
Issuer Instrument Type
Amount Aggregate Investments
by all schemes
Amount Aggregate Investments
by all schemes
2018 2017
Shriram Transport Finance Company Ltd.
Corporate Bonds / Debentures
– 651,317,500 – 1,452,436,300
Equities – – – 94,659,583
Bharti Airtel Ltd. Equities 74,589,634 369,136,950 – 1,025,985
Balrampur Chini Mills Ltd.
Equities 83,875,535 125,227,938 – –
1.4. Open position of Securities Borrowed and / or Lent by the Scheme as of financial years ended 2018 and 2017 are NIL.
1.5. The NPAs as on March 31, 2018 and March 31, 2017 are NIL.
1.6. Aggregate Unrealised Gain / Loss as at the end of the Financial Years March 31, 2018 and March 31, 2017 are as under :
Security Category Amount (Rs.) Percentage to Net Assets
Amount (Rs.) Percentage to Net Assets
2018 2017
Equity Shares
– Appreciation 1,236,222,477 20.68 1,237,575,093 27.25
– Depreciation 202,187,476 3.38 71,248,018 1.57
1.7. The aggregate value of investment securities (excluding CBLO and Reverse Repos) purchased and sold (including matured) during the financial year 2017-18 (excluding accretion of discount) is Rs. 3,363,722,755 and Rs. 2,685,203,246 respectively being 60.11% and 47.98% of the average daily net assets.
The aggregate value of investment securities (excluding CBLO and Reverse Repos) purchased and sold (including matured) during the financial year 2016-17 (excluding accretion of discount) is Rs. 1,681,371,410 and Rs. 2,993,446,387 respectively being 36.09% and 65.25% of the average daily net assets.
1.8. Non-Traded securities in the portfolio as on March 31, 2018 and March 31, 2017 are Nil.

18
2 Disclosure Under Regulation 25(8) of the Securities and Exchange Board of India (Mutual Funds) Regulations, 1996 as amended
Details of amounts paid to associates in terms of Regulation 25 (8) are as follows :
Commission paid to Sponsor/AMC and its associates/related parties/group companies
Name of Sponsor/AMC and its associates/related parties/group companies
Nature of Association / Nature of
Relation
Period Covered
Business Given [Rs. In Crores]
% of Total Business
received by the Fund
Commission paid [Rs.]
% of Total commission paid by the
Fund
The Hongkong and Shanghai Banking Corporation Limited
Associate of Investment Manager
2017-2018 123.70 42.55 25,001,914 45.18
Name of Sponsor/AMC and its associates/related parties/group companies
Nature of Association / Nature of
Relation
Period Covered
Business Given [Rs. In Crores]
% of Total Business
received by the Fund
Commission paid [Rs.]
% of Total commission paid by the
Fund
The Hongkong and Shanghai Banking Corporation Limited
Associate of Investment Manager
2016-2017 53.50 43.32 19,197,398 54.44
Brokerage paid to Sponsor/AMC and its associates/related parties/group companies
Name of Sponsor/AMC and its associates/related parties/group companies
Nature of Association /Nature of
relation
Period Covered
Value of Transactions
[Rs. In Crores]
% of total value of
transactions of the fund
Brokerage paid [Rs. ]
% of total brokerage paid by the
fund
HSBC Securities and Capital Market (India) Private Limited
Sponsor 2017-2018 8.91 1.42 80,186 1.21
Name of Sponsor/AMC and its associates/related parties/group companies
Nature of Association /Nature of
relation
Period Covered
Value of Transactions
[Rs. In Crores]
% of total value of
transactions of the fund
Brokerage paid [Rs. ]
% of total brokerage paid by the
fund
HSBC Securities and Capital Market (India) Private Limited
Sponsor 2016-2017 2.21 0.47 26,515 0.50
The brokerage paid was at rates similar to those offered to other brokers / distributors. The Commission / Brokerage paid to related party includes both upfront and trail and hence not comparable with the % of business brought and % of commission paid.
Further, The Hongkong and Shanghai Banking Corporation Limited, an associate of the Sponsor, is on the panel of bankers with whom HSBC Mutual Fund places money on fixed deposits and enters into reverse repo transactions from time to time at competitive rates.
(i) Any underwriting obligations undertaken by the schemes of the mutual funds with respect to issue of securities associate companies - Nil. (Previous year also Nil)
Notes to Accounts - Annexure I (Contd...)To the Abridged Balance Sheet and Revenue Account for the Year ended March 31, 2018

19
(ii) Devolvement - Nil. (Previous year also Nil)
(iii) Subscription by the schemes in the issues lead managed by associate companies - Nil. (Previous year also Nil)
(iv) Subscription to any issue of equity or debt on private placement basis where the sponsor or its associate companies have acted as arranger or manager - Nil. (Previous year also Nil)
3 None of the Investors held more than 25% of the total net assets of the Scheme at the years ended March 31, 2018 and March 31, 2017.
4 Unit Capital movement during the years ended March 31, 2018 and March 31, 2017:
Description
2017-2018
Opening Units Subscription Redemption Closing UnitsFace Value
per unit (Rupees)
Regular Plan - Growth Option
32,345,567.860 25,558,910.928 13,212,339.253 44,692,139.535 10
Regular Plan - Dividend Option
78,468,555.878 21,604,073.702 17,841,328.133 82,231,301.447 10
Direct Plan - Growth Option
1,379,290.879 493,564.500 258,630.891 1,614,224.488 10
Direct Plan - Dividend Option
323,615.272 58,076.425 142,501.657 239,190.040 10
Description
2016-2017
Opening Units Subscription Redemption Closing UnitsFace Value
per unit (Rupees)
Regular Plan - Growth Option
41,711,714.841 11,489,195.576 20,855,342.557 32,345,567.860 10
Regular Plan - Dividend Option
98,605,873.865 11,164,695.313 31,302,013.300 78,468,555.878 10
Direct Plan - Growth Option
1,019,631.010 690,362.046 330,702.177 1,379,290.879 10
Direct Plan - Dividend Option
273,348.554 112,451.027 62,184.309 323,615.272 10
** Units held by the AMC (Seed Capital) in Direct Plan Growth Option as on March 31, 2018 is 146,278.186 & as on March 31, 2017 is 76,942.845
5 Previous years figures have been re-grouped/re-arranged where appropriate.
6 No contingent liabilities for the years ended March 31, 2018 and March 31, 2017.
7 Expenses other than Management Fees are Inclusive of GST / Service Tax where applicable.
Notes to Accounts – Annexure I (Contd...)To the Abridged Balance Sheet and Revenue Account for the Year ended March 31, 2018

20
8 Other income of Rs. 4,440 represents Exit load (net of GST / service tax) credited to the Scheme. (2017: Rs. 3,529/- represents Exit load (net of service tax) credited to the Scheme.)
9 Investor Education Awareness
In view of the AMFI Best Practices Guidelines Circular No. 56/2015-16, the IEF (Investor Education Fund) accrual is set aside in a separate bank account and the consolidated balance across all schemes as on March 31, 2018. The break-up of which is as under:
March 31, 2018 March 31, 2017
Particulars Amount (in Rs. Lacs) Amount (in Rs. Lacs)
Opening Balance 44.00 –
Add: Accrual during the year 219.83 182.34
Less: Transferred to AMFI 101.10 83.24
Less: Payable to AMFI (March accrual) 8.81 7.93
Add: Investment Income for the year 8.28 11.24
Less: Spent during the year 43.17 58.41
Closing Balance 119.02 44.00
10 Categorization and Rationalization of schemes
Pursuant to SEBI circular no. SEBI/HO/IMD/DF3/CIR/P/2017/114 dated October 6, 2017 and SEBI circular no. SEBI/HO/IMD/DF3/CIR/P/2017/126 dated December 4, 2017 on ‘Categorization and Rationalization of schemes’, fundamental attribute related changes were carried out in certain schemes of HSBC Mutual Fund to align the same with the requirements specified in the aforesaid circulars effective from March 14, 2018. The said changes have been approved by the Board of Directors of the HSBC Asset Management (India) Pvt. Ltd. (the AMC) and the Board of Trustees (the Trustees). SEBI vide its letter no. IMD/DF3/OW/P/2018/89/1 dated January 2, 2018 has also conveyed it’s no objection to the said changes.
A notice-cum-addendum providing details of changes in the fundamental attributes of certain schemes was published in the newspaper on February 3, 2018 and is also available on the website of the AMC at www.assetmanagement.hsbc.com/in. The exit window period of 30 days was provided to the investors during which no exit load was charged to investors on switches/redemptions.
Apart from the fundamental attribute changes, there has been change in the ‘type of Scheme’ for all the open ended schemes and ‘name of Scheme’ in certain schemes for the purposes of alignment of the existing schemes with the provisions of the Circular. The details of the schemes impacted is provided below:
Existing Name Revised Name Fundamental Attribute change Benchmark Change
HSBC India Opportunities Fund
HSBC Multi Cap Equity Fund
No No
11 Merger of HSBC Dividend Yield Equity Fund (HDYEF) into HSBC Multi Cap Equity Fund (HMCEF)
The Board of Directors of HSBC Asset Management (India) Private limited and Board of Trustees of HSBC Mutual Fund have approved the merger of HDYEF into HMCEF in their meetings held on February 01, 2017 and February 02, 2017 respectively. SEBI has also granted it’s no objection to the aforesaid merger vide its letter dated April 03, 2017. Accordingly, a notice was published on May, 24, 2017 giving an option to the unitholders of HDYEF to exit during the period from May 31, 2017 to June 30, 2017 at the applicable NAV, without payment of exit load, if any and sale of units in the HDYEF was suspended effective from May 31, 2017. The HDYEF was merged into HMCEF and ceased to exists from July 01, 2017. The unit holders of HDYEF who have not exercised the exit option during the aforesaid exit window have been allotted units of HMCEF at the NAV declared as on the close of business hours on June 30, 2017.
Notes to Accounts - Annexure I (Contd...)To the Abridged Balance Sheet and Revenue Account for the Year ended March 31, 2018

21
Details of Scheme merged are as follows :
Transferor Scheme Surviving Scheme Net assets taken over
Face value of units issued
Unit premium of units issued
HSBC Dividend Yield Equity Fund
HSBC Multi Cap Equity Fund
425,035,171 98,413,867 326,621,305
12 The Annual Accounts of the Schemes prepared in accordance with the accounting policies and standards specified in the Ninth Schedule of The Securities and Exchange Board of India (Mutual Funds) Regulations, 1996 has been approved by the Board of Directors of HSBC Asset Management (India) Private Limited and The Board of Trustees of HSBC Mutual Fund at their meetings held on July 16, 2018 and July 17, 2018 respectively. The audit report attached herewith refers to the said Annual Accounts. The aforesaid abridged accounts are an extract of the Annual Accounts and are prepared in accordance with SEBI Circular No. IMD/Cir8/132968/2008 dated July 24, 2008.
Notes to Accounts – Annexure I (Contd...)To the Abridged Balance Sheet and Revenue Account for the Year ended March 31, 2018

22
Voting Policy and Procedures
In view of SEBI guidelines related to “Role of Mutual Funds in Corporate Governance of Public Listed Companies”, AMIN has formulated its “Policy for Proxy Voting in Public Listed Companies”. The said policy and details of actual exercise of proxy votes along with the summary of votes cast and the auditors certification during the Financial Year 2017 – 18 is available on its website – http://www.assetmanagement.hsbc.com/in and in full Annual Report for the Financial Year 2017 – 18.

23
Statutory Details & Disclaimers
All returns have been sourced from Mutual Funds India Explorer software unless otherwise stated. With regard to equity schemes (including the equity component of MIPs), Fund performance is calculated on a total return basis (i.e. it includes dividends re-invested) while the benchmark is calculated on a price return basis (i.e. it does not consider dividends re-invested). This document has been prepared by HSBC Asset Management (India) Private Ltd (HSBC) for information purposes only and should not be construed as an offer or solicitation of an offer for purchase of any of the funds of HSBC Mutual Fund. All information contained in this document (including that sourced from third parties), is obtained from sources HSBC, the third party believes to be reliable but which it has not independently verified and HSBC, the third party makes no guarantee, representation or warranty and accepts no responsibility or liability as to the accuracy or completeness of such information. The information and opinions contained within the document are based upon publicly available information and rates of taxation applicable at the time of publication, which are subject to change from time to time. Expressions of opinion are those of HSBC only and are subject to change without notice. It does not have regard to specific investment objectives, financial situation and the particular needs of any specific person who may receive this document. Investors should seek financial advice regarding the appropriateness of investing in any securities or investment strategies that may have been discussed or recommended in this report and should understand that the views regarding future prospects may or may not be realized. Neither this document nor the units of HSBC Mutual Fund have been registered in any jurisdiction. The distribution of this document in certain jurisdictions may be restricted or totally prohibited and accordingly, persons who come into possession of this document are required to inform themselves about, and to observe, any such restrictions.
Investors should not invest in the Scheme solely based on the information provided in this document and should read the Scheme Information Document and Statement of Additional Information of the Fund for details. This document does not constitute an offering document.
No part of this publication may be reproduced, stored in a retrieval system, or transmitted, on any form or by any means, electronic, mechanical, photocopying, recording, or otherwise, without the prior written permission of HSBC Asset Management (India) Private Ltd.
Mutual Fund investments are subject to market risks, read all scheme related documents carefully.
HSBC Small Cap Equity Fund (erstwhile HSBC Mid-cap Equity Fund)Small Cap Fund - An open ended equity Scheme predominantly investing in small cap stocks
Abridged Annual Report 2017 - 2018

1
Dear Investor,
Globally, we are witnessing a very interesting phase. The equity markets delivered a stellar performance in 2017. However, there are worries about the impact of higher rates, global trade wars, an economic growth moderation and higher volatility.
Closer home, India has become the world’s sixth-biggest economy. India has doubled its GDP to USD 2.2 trillion within a decade. The introduction of reform measures, including demonetisation and the Goods and Services Tax (GST), had put pressure on selective parts of the economy in 2017. The impact of these measures is likely to be transitory. India’s economic growth is expected to accelerate from 6.7% in FY18 to 7.4% in the current year as per IMF forecasts.
There has been a shift in the domestic savings pool supporting the market. Domestic investors have been increasing exposure to equities and financial assets moving away from gold and real estate. Mutual funds witnessed sizable inflows on the back of the boost in liquidity within the banking system from demonetisation. The AUM of the mutual fund industry grew by 21.7% in March 2018 compared to March 2017.
With growth, comes responsibility. Last year, the regulator, Securities and Exchange Board of India (SEBI) issued a circular to rationalise and categorise mutual fund schemes in India. We are pleased to state that none of our funds needed to be redesigned. All our schemes have been defined as per the new categorisation. We believe this classification will simplify investing into mutual funds and enhance comparability within the schemes offered.
As India moves to a digital age, e-commerce platforms are becoming increasingly popular. I request you to logon to our online transaction platform. It is a quick, convenient and an efficient tool to invest into our funds and manage your investments online.
At HSBC Global Asset Management, India, we are dedicated to one goal: delivering exceptional investment management for our clients. By bringing together our

2
global investment knowledge and capabilities, we are able to offer specialised expertise across asset classes. This has helped us to become a trusted partner to our individual and institutional investors.
We remain committed to our long-term perspective and disciplined investment approach as we conduct a rigorous, fundamental analysis of investments with a strong emphasis on risk management. Although the investment landscape appears favourable, it is worth remembering that markets are dynamic and constantly evolving. Therefore, we believe active, professional investment management serves investors well. Amid changing markets and economic conditions, we are confident that investors with a well-diversified portfolio and a patient, long-term outlook should be well positioned for the years ahead.
Together we thrive.
Warm regards,
Ravi Menon
Chief Executive Officer, HSBC Global Asset Management, India

3
SPONSORHSBC Securities and Capital Markets (India) Private LimitedRegd. Office: 52/60, Mahatma Gandhi Road, Fort, Mumbai - 400 001.
TRUSTEEBoard of TrusteesOffice: 16, Veer Nariman Road, Fort, Mumbai 400 001.
ASSET MANAGEMENT COMPANYHSBC Asset Management (India) Private LimitedCorp. & Regd. Office: 16, Veer Nariman Road, Fort, Mumbai 400 001.
CUSTODIANStandard Chartered Bank (SCB)Corp. & Regd. Office: Crescenzo, Securities Services, 3rd Floor, C-38/39, G-Block, Bandra Kurla Complex, Bandra East, Mumbai – 400051.
AUDITORS TO THE SCHEMEBSR & Co. LLPChartered Accountants 5th Floor, Lodha Excelus, Apollo Mills Compound, N.M. Joshi Marg, Mahalaxmi, Mumbai 400 011.
REGISTRAR & TRANSFER AGENTSComputer Age Management Services Private Limited (CAMS)Unit: HSBC Mutual Fund ’C’ Block, 2nd Floor, Hanudev Info Park P. Ltd., SF No. 558/2, Udayampalayam Road, Nava India, Coimbatore - 641 028.
BOARD OF TRUSTEESMr. Nasser Munjee
Mr. Manu Tandon
Mr. Mehli Mistri
Mr. Dilip J. Thakkar
Ms. Jasmine Batliwalla
Mr. Pedro Bastos
BOARD OF DIRECTORSMs. Kishori J. Udeshi - Chairperson
Mr. S. P. Mustafa
Mr. Dinesh Mittal
Mr. Ravi Menon - Chief Executive Officer

4
The Trustees of HSBC Mutual Fund (“Fund”) present the Sixteenth Annual Report and the audited abridged financial statements of the schemes of the Fund for the year ended March 31, 2018.
As at March 31, 2018, the Fund offered 30 schemes across asset classes to meet the varying investment needs of the investors. Notably, three Schemes of HSBC Mutual Fund viz. HSBC Large Cap Equity Fund, HSBC Short Duration Fund and HSBC Cash Fund have completed 15 years of operations during the year.
During the year, the Fund has launched Plan(s) under Fixed Term Series and carried out merger of the existing schemes viz HSBC Dividend Yield Equity Fund merged into HSBC Multi Cap Equity Fund (HMEF), erstwhile HSBC India Opportunities Fund, as offering sub-scale fund was not in the interest of the unitholders.
Further, in order to bring uniformity in the practice across Mutual Funds and to standardize the scheme categories and characteristics of schemes, SEBI vide its circular no. SEBI/HO/IMD/DF3/CIR/P/2017/114 dated October 6, 2017, issued guidelines for categorization and rationalization of Mutual Fund schemes.
Accordingly, HSBC Large Cap Equity Fund (erstwhile HSBC Equity Fund), HSBC Small Cap Equity Fund (erstwhile HSBC Mid Cap Equity Fund) , HSBC Infrastructure Equity Fund, HSBC Global Emerging Market Fund (erstwhile HSBC Emerging Market Fund), HSBC Debt Fund (erstwhile HSBC Income Fund – Investments Plan), HSBC Short Duration Fund (erstwhile HSBC Income Fund – Short Term Plan), HSBC Low Duration Fund (erstwhile HSBC Ultra Short Term Bond Fund), HSBC Regular Savings Fund (erstwhile HSBC Monthly Income Plan) and HSBC Managed Solutions have undergone fundamental attributes changes with effective from March 14, 2018.
The Fund continues its focus on delivering consistent long term returns. The comments on the performance of the Scheme(s) is provided hereinafter. Dividends were declared under various schemes as per the provisions contained in the respective Scheme Information Documents after considering the distributable surplus available under the respective Schemes. Details of dividends declared can be viewed on our website at www.assetmanagement.hsbc.com/in.
1. Scheme Performance, future outlook and oPerationS of the SchemeS
a. Operations and Performance of the Schemes
HSBC Small Cap Equity Fund (HSEF), erstwhile HSBC Mid-cap Equity Fund (Small Cap Fund - An open ended equity Scheme predominantly investing in small cap stocks)
HSEF seeks to generate long term capital growth from an actively managed portfolio of equity and equity related securities of predominantly small cap companies. However, it could move a portion of its assets towards fixed income securities if the fund manager becomes negative on the Indian equity markets. However, there can be no assurance or guarantee that the investment objective of the scheme would be achieved.
The net assets of HSEF amounted to Rs. 608.02 crores as at March 31, 2018 as compared to Rs. 429.86 crores as at March 31, 2017. Around 99.34 % of the net assets were invested in equities, 1.19% of the net assets were invested in reverse repos/CBLO and (-0.53%) in net current assets as at March 31, 2018.
HSEF is a small cap fund and we remained invested in a diversified portfolio across small capitalization stocks. HSEF has done well in terms of outperformance v/s its benchmark due to stock selection across various sectors for long term periods. The focus on reasonable growth oriented companies available at attractive valuations (price to book ratio / return on equity) paid off over longer periods of outperformance v/s benchmark. HSEF continues to be overweight in Specialty Chemicals, NBFCs, Capital Goods, Construction, and Metals, and underweight in FMCG, technology, and discretionary consumption sector.
Scheme Name & Benchmarks Absolute Returns
(%)
Compounded Annualized Returns (%)
Date of Inception : 19 May 2005 1 Year 3 Years 5 Years Since Inception
HSBC Small Cap Equity Fund - Growth 19.24 16.67 27.76 14.62
S&P BSE 250 Small Cap Index (Scheme Benchmark) 16.64 15.31 20.27 NA
Nifty 50 TRI (Standard Benchmark) 12.68 7.99 13.63 14.91
Trustees’ ReportFor the year ended March 31, 2018

5
Scheme Name & Benchmarks Absolute Returns
(%)
Compounded Annualized Returns (%)
Date of Inception : 19 May 2005 1 Year 3 Years 5 Years Since Inception
Rs. 10,000, if invested in HSEF, would have become 11,924 15,894 34,062 57,867
Rs. 10,000, if invested in S&P BSE 250 Small Cap Index, would have become
11,664 15,344 25,177 NA
Rs. 10,000, if invested in Nifty 50, would have become 11,268 12,599 18,950 59,779
Past performance may or may not be sustained in future. The returns for the respective periods are provided as on last business day of March 2018 for Growth Option. Different plans shall have a different expense structure. Performance of the respective benchmark is calculated as per the Total Return Index (TRI) Index returns,
Please Note: NA means not available.
Pursuant to the circular issued by SEBI on ‘Categorization and Rationalization of the Schemes, there has been change in the fundamental attribute(s) of the aforesaid scheme, including change in the benchmark to S&P BSE 250 Small Cap Index effective from Mar 14, 2018. The launch date of the S&P BSE 250 Small Cap Index (INR) is November 30, 2017 whereas the inception date of the scheme is May 19, 2005. All information presented prior to the index launch date is back-tested which is available from Mar 31, 2008. The corresponding benchmark returns since inception of the scheme is not available. All index data is available on the website of Asia Index Pvt. Ltd. a joint venture between BSE Ltd. and S&P Dow Jones Indices LLC. (source: http://www.asiaindex.co.in).
b. Market Overview & Outlook (as furnished by HSBC Asset Management (India) Private Limited)
EqUITY OUTLOOKIndian equity markets continued to remain strong during fiscal year 2017-18 and posted gains of 11.76% by S&P CNX Nifty and 13.24% by BSE Midcap index respectively. Biggest drivers of the markets were, robust DII flow into equities, continued push of mega reforms – Goods and Services Tax (GST) implementation, Insolvency and Bankruptcy Code implementation, Real Estate (Regulation and Development) Act, second consecutive normal monsoon, and electoral victories of the ruling party in many state elections. On the other hand, the markets weather the storm of disruption in economy due to GST implementation, lingering impact of demonetization, muted FII flows, and rising yields in developed markets. Domestic Mutual Fund segment had their best ever year and they brought in ~USD 22 bn of net inflows in equities during the year. Even after witnessing ~USD 4.3 bn of net outflows from the domestic insurers, the net DII tally was a very impressive ~USD 17.7 bn of net inflows. There were mixed global cues well and the Foreign Institutional Investors (FIIs) net bought Indian equities worth USD 3.2 bn. The inflows by both FIIs and domestic MFs acted as a factor in the strong market performance.
Indices Returns (April 1, 2017 to March 31, 2018) 1 Year (%)
S&P BSE Sensex 12.70%
NSE CNX Nifty 11.76%
S&P BSE 100 12.12%
S&P BSE 200 12.49%
S&P BSE 500 13.21%
S&P BSE Midcap 14.31%
S&P BSE 250 Small-cap 14.13%
Source: Bloomberg (All values are total return)
Trustees’ ReportFor the year ended March 31, 2018 (Contd...)

6
Our view on the key aspects related to equity markets are presented below -
The impressive performance in equity markets during FY 2017-18 has come on the back of strong liquidity largely by domestic MFs but supported in party by FII flows, positive global growth, benign macro – both domestically and global, expectation of the continuation of favorable policy environment domestically and expectation of corporate earnings revival. Possibility of sound macro, economic reforms and implementation of existing reforms have increased, especially after continued success of the ruling party at the centre in state elections. However, after this strong performance in markets and rather long wait for earnings to be delivered has meant that the equity markets are currently trading above their historical averages.
Moving into FY 2018-19, we expect a continuation of the economic recovery process domestically, recovery in corporate earnings - led early by volume growth, and continued DII flows. Government led investment spending and rural consumption are likely to lead with private sector investments contributing later (possibly after general elections 2019). The budget document that was presented in early February provides a good medium term policy direction for the economy. Occasionally the policy actions can serve up a few bumps and jolts but over the medium term, across different governments, there is a thread of continuity connecting many key economic policies such as in the case of this year’s union budget. We, in our investment process, prefer to take comfort in these threads of continuity and remain constructive on the India growth story. This makes us positive on the Indian equity markets over the medium to long term.
Risks are in the form of market valuations trending above historical averages, weaker than expected delivery in corporate earnings going forward, external news flows related to trade protectionism, developed market central banks raising rates prematurely, and geopolitical tensions and other eco-political events would also influence market performance going forward, as the recent rally in the markets was supported by strong FII inflows.
DEBT OUTLOOKFixed Income in Financial Year 2017-18 has seen volatility further step up in this year. Markets went to perfect storm with higher crude prices, low liquidity and pressure on currency, apart from rate hike expectations.
Inflation has followed the glide path to lower numbers towards 4% RBI target and even lower than the target number when inflation printed a lowly 1.46% in June 2018 on back of lower food prices. RBI went for a cut despite of neutral stance. This positivity continued till until crude shock came in form of higher crude process. Global prices of Brent crude saw substantial increase in second half of the year, which jeopardized the inflation path. Other worries that gathered around this time were related to GST collection and eventual impact on fiscal situation.
Government of India allowed the fiscal deficit to slip to 3.5% (budget 3.2%) and kept next year target at 3.3% (in place of earlier path of 3%). This was on back of some excise relaxation for oil products and a month less collected for GST due to implementation in the current year. The fear of fiscal slippage alongwith the announcement of higher bond issuances spooked the bond markets into higher yields. Government finally borrowed only INR 90 bln extra (in place of INR 500 bln announced initially).
On the Monetary front the year was very volatile as well. RBI changed its stance to neutral causing some worry around rate hikes. Thereafter it cut rates and again went for OMO sales operations simultaneously. This created some confusion in the market participants regarding rates direction. Finally extra supply, higher oil prices and higher inflation paved way for rates higher. RBI also held position on regulatory forbearance about spreading out losses by banks publicly. It eventually gave up the position in the end of March. However, the swift changes in stance caused lot of pressure and volatility in bonds.
Liquidity situation continuously deteriorated due to OMO sales initially and withdrawal of deposits due to remonetisation. Further liquidity was absorbed out due to portfolio outflows and reduction in reserves. Despite of defense from RBI utilizing the reserves, the currency depreciated meaningfully, which caused further jitters in foreign investor sentiments. Lack of liquidity also affected 1-3 year rates which were elevated in second half of the year.
Going forward following are key variables to watch out for:
• Liquidity: Liquidity will drive short end rates and eventually drive decisions leading to market interventions and CRR cuts. RBI has focused now on neutral liquidity stance and providing liquidity to system, which will bode well short end rates.
Trustees’ ReportFor the year ended March 31, 2018 (Contd...)

7
• Inflation: Inflation numbers will determine future course of action for RBI and remains a critical variable for policy. We expect inflation to remain at 4.7% level in the ease in second half of FY 2018-19 in line with RBI’s expectations.
• Growth: GDP growth numbers as well as industrial activity will also determine the decision on policy.
• Fiscal deficit: Fiscal deficit and government spending will determine the government borrowing and crowding out in interest rate curve. We expect prudence in government spending and prospect of spending on infrastructure to pick up which will crowd in private investment as well.
• Current Account Deficit: Current Account Deficit determines how the pressure on currency works and effective management of forex reserves.
• Currency levels: Level of INR will determine how the central bank reacts to the situation on the global crisis etc.
2. Brief Background of SPonSorS, Board of truSteeS and aSSet management comPany
a. Sponsor
HSBC Mutual Fund is sponsored by HSBC Securities and Capital Markets (India) Private Limited (HSCI). The Sponsor is the Settler of the Mutual Fund Trust. The Sponsor has entrusted a sum of Rs. 1,00,000 (Rupees One Lakh only) to the Trustee as the initial contribution towards the corpus of the Mutual Fund.
HSCI offers integrated investment banking services, securities and corporate finance & advisory. HSCI is a member of the Bombay Stock Exchange Limited and National Stock Exchange (capital and derivative market segments). HSCI holds 100% of the paid up equity share capital of HSBC Asset Management (India) Private Limited.
b. HSBC Mutual Fund
HSBC Mutual Fund (“the Mutual Fund” or “the Fund”) has been constituted as a Trust in accordance with the provisions of the Indian Trusts Act, 1882 (2 of 1882) vide a Trust Deed dated February 7, 2002 with HSBC Securities and Capital Markets (India) Private Limited, as the Sponsor and the Board of Individual Trustees. The Trustee has entered into an Investment Management Agreement dated February 7, 2002 with HSBC Asset Management (India) Private Limited (AMC) to function as the Investment Manager for all the schemes of the Fund. The Fund was registered with SEBI vide registration number MF/046/02/5 dated May 27, 2002.
The Trust has been formed for the purpose of pooling of capital from the public for collective investment in securities for the purpose of providing facilities for participation by persons as beneficiaries in such investments and in the profits/income arising therefrom.
c. Board of Trustees (the Trustees)
The Board of Trustees is the exclusive owner of the Trust Fund and holds the same in trust for the benefit of the unit holders. The Trustees have been discharging their duties and carrying out the responsibilities as provided in the SEBI (Mutual Funds) Regulations, 1996 and the Trust Deed. The Trustees seek to ensure that the Fund and the schemes floated there under are managed by the AMC in accordance with the Trust Deed, the said Regulations, directions and guidelines issued by the SEBI, the Stock Exchanges, the Association of Mutual Funds in India and other regulatory agencies.
d. Asset Management Company (the AMC)
HSBC Asset Management (India) Private Limited (the Investment Manager or the AMC) is a private limited company incorporated under the Companies Act, 1956 on December 12, 2001 having its Registered Office at 16, V. N. Road, Fort, Mumbai 400 001. HSBC Asset Management (India) Private Limited has been appointed as the Asset Management Company of HSBC Mutual Fund by the Trustee vide Investment Management Agreement (IMA) dated February 7, 2002 and executed between the Trustees and the AMC. SEBI approved the AMC to act as the Investment Manager of the Fund vide its letter No. MFD/BC/163/2002 dated May 27, 2002. The paid-up equity share capital of the AMC is Rs. 61.59 crores. The AMC is registered as a Portfolio Manager under the SEBI (Portfolio Managers) Regulations, 1993 vide registration no. INP000001322. The AMC also offers non-binding Advisory services to offshore funds under the mutual fund license.
Trustees’ ReportFor the year ended March 31, 2018 (Contd...)

8
HSBC Securities and Capital Markets (India) Private Limited holds 100% of the paid up equity share capital of the AMC.
3. inveStment oBjective of the SchemeSThe investment objective of the respective schemes has been provided above under the heading “SchemePerformance, Future Outlook and Operation of the Scheme” (Refer Section 1).
4. Significant accounting PolicieSThe Significant Accounting Policies form part of the Notes to the Accounts annexed to the Balance Sheet of the Schemes in the Full Annual Report. The accounting policies are in accordance with SecuritiesExchange Board of India (Mutual Funds) Regulations 1996.
5. unclaimed dividendS & redemPtionSSummary of number of investors & corresponding amount Scheme-wise as on March 31, 2018.
SchemeUnclaimed Dividend Unclaimed Redemption
Amount (Rs.) No. of Investors
Amount (Rs.) No. of Investors
HSBC Small Cap Equity Fund 2,495,344.95 523 2,182,416.17 68
6. inveStor ServiceSThe number of official points of acceptance of transactions is 205 locations. In addition to the offices of the Registrar & Transfer agents, the AMC has Investor Service Centres in 9 locations at its own offices - namely Mumbai, New Delhi, Kolkata, Bangaluru, Pune, Ahmedabad, Hyderabad, Chandigarh and Chennai. With a view to enhance customer convenience, the AMC has the facility of priority based servicing to key distributors through the enhancement of the Interactive Voice Reponses. The AMC has a single Toll Free number which can be dialed from anywhere in India. The call centre service is being managed by the Registrar and Transfer Agents.
On the distribution front, the number of empanelled distributors was 460 as on March 31, 2018. During the year, the AMC initiated tie-ups for online distribution of the Mutual Fund’s schemes with several channel partners taking the total number of such tie-ups to 42.
7. detailS of inveStor grievance redreSSalThe details of the redressal of investor complaints received against HSBC Mutual Fund during April 2017 - March 2018 are as follows:
2017-2018
Com- plaint Code
Type of complaint (a) No. of complaints
pending at the
beginning of the year
(b) No. of complaints received during
the year
Action on (a) and (b)
Resolved Non Actiona-
ble*
Pending
Within 30
days
30 - 60 days
60 - 180 days
Beyond 180 days
0 - 3 months
3 - 6 months
6 - 9 months
9 - 12 months
I A Non receipt of Dividend on Units
0 5 4 1 0 0 0 0 0 0 0
I B Interest on delayed payment of Dividend
0 0 0 0 0 0 0 0 0 0 0
I C Non receipt ofRedemption Proceeds
1 12 12 1 0 0 0 1 0 0 0
I D Interest on delayedp a y m e n t o fRedemption
0 1 1 0 0 0 0 0 0 0 0
II A N o n r e c e i p t o f Statement of Account / Unit Certificate
0 0 0 0 0 0 0 0 0 0 0
Trustees’ ReportFor the year ended March 31, 2018 (Contd...)
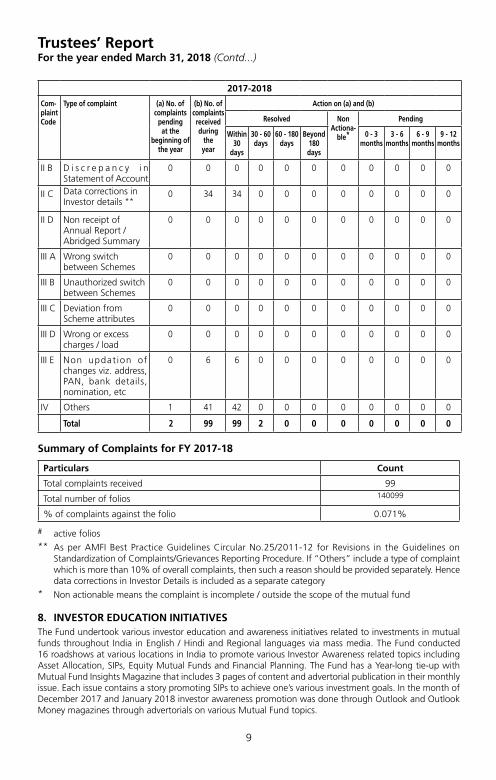
9
2017-2018
Com- plaint Code
Type of complaint (a) No. of complaints
pending at the
beginning of the year
(b) No. of complaints received during
the year
Action on (a) and (b)
Resolved Non Actiona-
ble*
Pending
Within 30
days
30 - 60 days
60 - 180 days
Beyond 180 days
0 - 3 months
3 - 6 months
6 - 9 months
9 - 12 months
II B D i s c r e p a n c y i n Statement of Account
0 0 0 0 0 0 0 0 0 0 0
II C Data corrections in Investor details **
0 34 34 0 0 0 0 0 0 0 0
II D Non receipt of Annual Report /Abridged Summary
0 0 0 0 0 0 0 0 0 0 0
III A Wrong switch between Schemes
0 0 0 0 0 0 0 0 0 0 0
III B Unauthorized switch between Schemes
0 0 0 0 0 0 0 0 0 0 0
III C Deviation from Scheme attributes
0 0 0 0 0 0 0 0 0 0 0
III D Wrong or excess charges / load
0 0 0 0 0 0 0 0 0 0 0
III E Non updat ion of changes viz. address, PAN, bank details, nomination, etc
0 6 6 0 0 0 0 0 0 0 0
IV Others 1 41 42 0 0 0 0 0 0 0 0
Total 2 99 99 2 0 0 0 0 0 0 0
Summary of Complaints for FY 2017-18
Particulars Count
Total complaints received 99
Total number of folios 140099
% of complaints against the folio 0.071%
# active folios** As per AMFI Best Practice Guidelines Circular No.25/2011-12 for Revisions in the Guidelines on
Standardization of Complaints/Grievances Reporting Procedure. If “Others” include a type of complaint which is more than 10% of overall complaints, then such a reason should be provided separately. Hence data corrections in Investor Details is included as a separate category
* Non actionable means the complaint is incomplete / outside the scope of the mutual fund
8. inveStor education initiativeS The Fund undertook various investor education and awareness initiatives related to investments in mutual funds throughout India in English / Hindi and Regional languages via mass media. The Fund conducted 16 roadshows at various locations in India to promote various Investor Awareness related topics including Asset Allocation, SIPs, Equity Mutual Funds and Financial Planning. The Fund has a Year-long tie-up with Mutual Fund Insights Magazine that includes 3 pages of content and advertorial publication in their monthly issue. Each issue contains a story promoting SIPs to achieve one’s various investment goals. In the month of December 2017 and January 2018 investor awareness promotion was done through Outlook and Outlook Money magazines through advertorials on various Mutual Fund topics.
Trustees’ ReportFor the year ended March 31, 2018 (Contd...)

10
9. Proxy voting PolicyIn terms of SEBI Circular no. SEBI/IMD/CIR No. 18/198647/2010 dated March 15, 2010, the Fund has adopted Proxy Voting Policy and Procedures for exercising voting rights in respect of securities held by the Schemes.
The summary of the votes casted in the general meetings of the Investee companies, by the AMC for and on behalf of the Schemes of the Fund, for the financial year 2017-18 is provided below:
quarter Total no. of resolutions
Break-up of vote decision
For Against Abstained
June 2017 184 116 5 63
September 2017 920 827 12 81
December 2017 49 45 1 3
March 2018 36 29 1 6
Total 1,189 1,017 19 153
In terms of the requirement of SEBI Circular no. CIR/IMD/DF/05/2014 dated March 24, 2014 and SEBI/HO/IMD/DF2/CIR/P/2016/68 dated August 10, 2016; the AMC has obtained certificate from M/s. M. P. Chitale & Co., Chartered Accountants, who is acting as a Scrutinizer, on the voting report for the FY 2017-18. The certificate dated May 3, 2018 issued by M/s. M. P. Chitale & Co., is available on the website of the AMC as part of the full Annual Report.
Unit holders can refer to the full Annual Report for complete details of actual exercise of votes in the general meetings of the investee companies for the financial year 2017-18 or log on to our website at www.assetmanagement.hsbc.com/in.
10. Statutory detailSa) The Sponsors are not responsible or liable for any loss resulting from the operation of the Schemes of
the Fund beyond initial contribution of Rs. 1 lakh for setting up the Fund.
b) The price and redemption value of the units, and income from them, can go up as well as down withfluctuations in the market value of its underlying investments.
c) Full Annual Report shall be disclosed on the website at www.assetmanagement.hsbc.com/in and shallbe available for inspection at the Head Office of the Mutual Fund. Present and prospective unit holders can obtain copy of the Trust Deed, the full Annual Report of the Scheme(s), the Annual Report of HSBC Asset Management (India) Private Limited and the text of the relevant Scheme(s) at a price.
11. acknowledgementSThe Trustees wish to thank the Unit holders of the Schemes for their support throughout the year and also thank the Government of India, the Securities and Exchange Board of India (SEBI), the Reserve Bank of India (RBI) and the Association of Mutual Funds in India (AMFI) for the guidance provided by them. The Trustees also appreciate the services provided by the Registrar and Transfer Agent, Fund Accountant, Custodian, Bankers, Distributors and Brokers. The guidance and services provided by the Auditors and advocates and the ebullience, sincerity and dedication of the employees of HSBC Asset Management (India) Private Limited is also appreciated.
The Trustees look forward to the continued support of everyone.
For and on behalf of the Board of Trustees of HSBC Mutual Fund
Sd/-
Dilip Thakkar
Trustee
Mumbai
July 17, 2018.
Trustees’ ReportFor the year ended March 31, 2018 (Contd...)

11
To the Board of Trustees
HSBC Mutual Fund – HSBC Small Cap Equity Fund (formerly known as HSBC Midcap Equity Fund)
Report on the Financial StatementsWe have audited the accompanying Financial Statements of HSBC Small Cap Equity Fund (formerly known as HSBC Midcap Equity Fund) (the ‘Scheme’), which comprise the balance sheet as at 31 March 2018, the related revenue account and the cash flow statement for the year then ended, and a summary of significant accounting policies and other explanatory information, annexed thereto.
Management’s responsibility for the Financial StatementsThe Board of Trustees to the HSBC Mutual Fund (the ‘Board of Trustees’) and HSBC Asset Management (India) Private Limited (the ‘AMC’), being the investment manager to HSBC Mutual Fund (the ‘Fund’) (collectively referred as ‘Management’), are responsible for the preparation of these financial statements that give a true and fair view of the financial position and financial performance of the Scheme in accordance with the accounting policies and standards specified in the Ninth Schedule of the Securities and Exchange Board of India (Mutual Funds) Regulations, 1996, as amended (the ‘Regulations’) and the accounting principles generally accepted in India. This responsibility includes maintenance of adequate accounting records for safeguarding of the assets of the Scheme and for preventing and detecting frauds and other irregularities; selection and application of appropriate accounting policies; making judgments and estimates that are reasonable and prudent; and design, implementation and maintenance of adequate internal financial controls, that were operating effectively for ensuring the accuracy and completeness of the accounting records, relevant to the preparation and presentation of the financial statements that give a true and fair view and are free from material misstatement, whether due to fraud or error.
In preparing the financial statements, management is responsible for assessing the Scheme’s ability to continue as a going concern, disclosing, as applicable, matters related to going concern and using the going concern basis of accounting unless management either intends to liquidate the Fund or to cease operations, or has no realistic alternative but to do so.
Auditor’s responsibilityOur responsibility is to express an opinion on these financial statements based on our audit. We conducted our audit in accordance with the Standards on Auditing issued by the Institute of Chartered Accountants of India (the ‘ICAI’). Those Standards require that we comply with ethical requirements and plan and perform the audit to obtain reasonable assurance about whether the financial statements are free from material misstatement.
An audit involves performing procedures to obtain audit evidence about the amounts and disclosures in the financial statements. The procedures selected depend on the auditor’s judgment, including the assessment of the risks of material misstatement of the financial statements, whether due to fraud or error. In making those risk assessments, the auditor considers internal controls relevant to preparation and fair presentation of the financial statements, of the Scheme, in order to design audit procedures that are appropriate in the circumstances, but not for the purpose of expressing an opinion on the effectiveness of the Scheme’s internal controls. An audit also includes evaluating the appropriateness of accounting policies used and the reasonableness of the accounting estimates made by Management, as well as evaluating the overall presentation of the financial statements.
We are also responsible to conclude on the appropriateness of management’s use of the going concern basis of accounting and, based on the audit evidence obtained, whether a material uncertainty exists related to events or conditions that may cast significant doubt on the Scheme’s ability to continue as a going concern. If we conclude that a material uncertainty exists, we are required to draw attention in the auditor’s report to the related disclosures in the financial statements or, if such disclosures are inadequate, to modify the opinion. Our conclusions are based on the audit evidence obtained up to the date of the auditor’s report. However, future events or conditions may cause the Scheme to cease to continue as a going concern.
We believe that the audit evidence we have obtained is sufficient and appropriate to provide a basis for our audit opinion.
Independent Auditors’ Report

12
Independent Auditors’ Report (Contd...)
OpinionIn our opinion, and to the best of our information and according to the explanations given to us, the aforesaid financial statements give the information required by the Regulations in the manner so required and give a true and fair view in conformity with the accounting principles generally accepted in India:
(i) in the case of the balance sheet, of the state of affairs of the Scheme as at 31 March 2018;
(ii) in the case of the revenue account, of the net surplus for the year ended on that date; and
(iii) in the case of the cash flow statement, of the cash flows of the Scheme for the year ended on that date.
Report on other Legal and Regulatory Requirements1 As required by Regulation 55(4) to the Regulations, we report that:
(a) We have obtained all information and explanations which, to the best of our knowledge and belief, were necessary for the purposes of the audit;
(b) The balance sheet and revenue account have been prepared in accordance with the accounting policies and standards specified in the Ninth Schedule of the Regulations.
2 As required by Clause 5(ii)(2) of the Eleventh Schedule of the Regulations, we report that the balance sheet and revenue account are in agreement with the books of account of the Scheme.
3 In our opinion and on the basis of information and explanations given to us, the methods used to value non - traded securities, as at 31 March 2018, as determined by the Board of Directors of AMC, are in accordance with the Regulations and other guidelines issued by the Securities and Exchange Board of India as applicable and approved by the Board of Trustees are fair and reasonable.
For B S R & Co. LLP Chartered Accountants Firm’s Registration No: 101248W/W-100022
Sd/-
Milind Ranade Partner Membership No: 100564
Place : Mumbai Date : July 17, 2018.

13
Abridged Balance Sheet as at March 31, 2018
Rs. in Lakhs
HSBC SMALL CAP EqUITY FUND
As at March 31, 2018
As at March 31, 2017
LIABILITIES1 Unit Capital 13,126.31 11,170.04 2 Reserves & Surplus2.1 Unit Premium Reserves 5,816.23 2,213.63 2.2 Unrealised Appreciation Reserve 11,973.74 11,514.23 2.3 Other Reserves 29,885.16 18,146.21 3 Loans & Borrowings – – 4 Current Liabilities & Provisions4.1 Provision for doubtful Income/Deposits – – 4.2 Other Current Liabilities & Provisions 406.43 200.11
TOTAL 61,207.87 43,244.22
ASSETS – –
1 Investments1.1 Listed Securities:1.1.1 Equity Shares 60,382.61 42,631.61 1.1.2 Preference Shares – – 1.1.3 Equity Linked Debentures – – 1.1.4 Other Debentures & Bonds – – 1.1.5 Securitised Debt securities – – 1.2 Securities Awaited Listing:1.2.1 Equity Shares – – 1.2.2 Preference Shares – – 1.2.3 Equity Linked Debentures – – 1.2.4 Other Debentures & Bonds – – 1.2.5 Securitised Debt securities – – 1.3 Unlisted Securities1.3.1 Equity Shares – – 1.3.2 Preference Shares – – 1.3.3 Equity Linked Debentures – – 1.3.4 Other Debentures & Bonds – – 1.3.5 Securitised Debt securities – – 1.4 Government Securities – – 1.5 Treasury Bills – – 1.6 Commercial Paper – – 1.7 Certificate of Deposits – – 1.8 Bill Rediscounting – – 1.9 Units of Domestic Mutual Fund – – 1.10 Foreign Securities – –
Total Investments 60,382.61 42,631.61
2 Deposits 8.03 1.40 3 Other Current Assets3.1 Cash & Bank Balance 13.24 23.21 3.2 CBLO/Reverse Repo Lending 1.41 – 3.3 Others 802.58 588.00 4 Deferred Revenue Expenditure (to the extent not written off) – –
TOTAL 61,207.87 43,244.22
Notes to Accounts – Annexure I

14
Abridged Revenue Account for the year ended March 31, 2018
Rs. in Lakhs
HSBC SMALL CAP EqUITY FUNDCurrent
Year ended March 31, 2018
Previous Year ended
March 31, 2017
1 INCOME1.1 Dividend 585.05 368.14
1.2 Interest 54.96 31.99
1.3 Realised Gain / (Loss) on Foreign Exchange Transactions – –
1.4 Realised Gains / (Losses) on Interscheme sale of investments – –
1.5 Realised Gains / (Losses) on External sale / redemption of investments
7,644.93 4,792.45
1.6 Realised Gains / (Losses) on Derivative Transactions – –
1.7 Other Income 0.07 0.11 (A) 8,285.01 5,192.69
2 EXPENSES2.1 Management fees 662.45 593.92
2.2 GST / Service tax on Management fees 114.67 88.68
2.3 Transfer agents fees and expenses 70.23 48.64
2.4 Custodian fees 6.48 4.81
2.5 Trusteeship fees 1.11 0.81
2.6 Commission to Agents 499.34 309.18
2.7 Marketing & Distribution expenses 4.66 –
2.8 Audit fees 3.66 2.37
2.9 Investor Education Expenses 10.66 7.86
2.10 Other operating expenses 15.55 8.34
2.11 Less:Expenses to be Reimbursed by the Investment Manager (23.49) (29.96)
(B) 1,365.32 1,034.65
3 NET REALISED GAINS / (LOSSES) FOR THE YEAR (A -B = C) 6,919.69 4,158.04
4 Change in Unrealised Depreciation in value of investments and derivatives (D) – –
5 NET GAINS / (LOSSES) FOR THE YEAR [E=(C+D)] 6,919.69 4,158.04
6 Change in unrealised appreciation in the value of investments and derivatives (F) (459.51) (7,945.97)
7 NET SURPLUS / (DEFICIT) FOR THE YEAR (E + F = G) 6,460.18 (3,787.93)
7.1 Add: Balance transfer from Unrealised Appreciation Reserve 459.51 7,945.97
7.2 Less: Balance transfer to Unrealised Appreciation Reserve – –
7.3 Add / (Less): Equalisation 4,819.26 (1,804.50)
7.4 Transfer from Reserve Fund 18,146.21 16,555.57
8 Total 29,885.16 18,909.11
9 Dividend appropriation9.1 Income Distributed during the year – 762.90
9.2 Tax on income distributed during the year – –
10 Retained Surplus / (Deficit) carried forward to Balance sheet 29,885.16 18,146.21
Notes to Accounts – Annexure I

15
Key Statistics for the year ended March 31, 2018
HSBC SMALL CAP EqUITY FUND Current
Year ended March 31, 2018
Previous Year ended
March 31, 2017
1. NAV per unit (Rs.):
Open
Growth Option 49.3277 36.4435
Dividend Option 21.2134 17.0700
Direct Plan - Growth Option 50.9217 37.3519
Direct Plan - Dividend Option 25.3285 19.9660
High
Growth Option 67.7560 49.3277
Dividend Option 29.1383 22.2175
Direct Plan - Growth Option 70.3526 50.9217
Direct Plan - Dividend Option 34.9935 26.0904
Low
Growth Option 48.5124 36.2656
Dividend Option 20.8628 16.6941
Direct Plan - Growth Option 50.1320 37.1732
Direct Plan - Dividend Option 24.9358 19.8705
End
Growth Option 57.8655 49.3277
Dividend Option 24.8848 21.2134
Direct Plan - Growth Option 60.1887 50.9217
Direct Plan - Dividend Option 29.9381 25.3285
2. Closing Assets Under Management (Rs. in Lakhs)
End 60,802 42,986
Average (AAuM)1 53,307 39,287
3. Gross income as % of AAuM2 15.54% 13.22%
4. Expense Ratio:
a. Total Expense as % of AAuM (including service tax / GST on Management fees) (planwise)
Regular Plan (Continue) 2.69% 2.75%
Direct Plan 1.92% 2.04%
b. Management Fee as % of AAuM (planwise)
Regular Plan (Continue) 1.24% 1.51%
Direct Plan 1.24% 1.51%
5. Net Income as a percentage of AAuM3 12.98% 10.58%
6. Portfolio turnover ratio4 0.36 0.30

16
Key Statistics for the year ended March 31, 2018 (Contd...)
HSBC SMALL CAP EqUITY FUND Current
Year ended March 31, 2018
Previous Year ended
March 31, 2017
7. Total Dividend per unit distributed during the year (planwise)
Retail
Dividend Option – 1.75
Direct Plan - Dividend Option – 1.75
Corporate
Dividend Option – 1.75
Direct Plan - Dividend Option – 1.75
8. Returns(%):
a. Last One Year
Scheme
Growth Option 19.2447 35.3539
Direct Plan - Growth Option 20.1481 36.3296
Benchmark
S&P BSE 250 Small Cap Index 16.6400 32.7499
b. Since Inception
Scheme
Growth Option 14.6218 14.3854
Direct Plan - Growth Option 22.6190 23.6306
Benchmark
S&P BSE 250 Small Cap Index NA+ 10.8077
+ For HSBC Small Cap Equity Fund: BSE vide its notification dated April 10, 2015 have notified change in the index composition of S&P BSE Midcap Index. As a result returns for the said benchmark are different when compared to the historically published returns. The historical index data for S&P BSE Midcap Index is available only from Sept 16, 2005 whereas the inception date of the Scheme is May 19, 2005, as a result the since inception benchmark returns are not available.
1 AAuM=Average daily net assets.2 Gross income = amount against (A) in the Revenue account i.e. Income.3 Net income = amount against (C) in the Revenue account i.e. Net Realised Gains / (Losses) for the year.4 Portfolio Turnover = Lower of sales or purchase divided by the Average AuM for the year.5 The net asset value disclosed represents the computed NAV on March 31, 2018 (Non-business Day), and
not the last declared NAV

17
Notes to Accounts – Annexure ITo the Abridged Balance Sheet and Revenue Account for the Year ended March 31, 2018
hSBc Small caP eQuity fund
1 Investments: 1.1. It is confirmed that investments of the Schemes are registered in the name of the Trustees for the
benefit of the Scheme’s unitholders.
1.2. Open Positions of derivatives as of years ended March 31, 2018 and March 31, 2017 are NIL.
1.3. Investments in Associates and Group Companies as of years ended March 31, 2018 and March 31, 2017 are NIL.
1.4. Open positions of Securities Borrowed and / or Lent by the Scheme as of the years ended March 31, 2018 and March 31, 2017 are NIL.
1.5. NPAs as at years ended March 31, 2018 and March 31, 2017 are NIL.
1.6. Aggregate Unrealised Gain / Loss as at the end of the Financial years March 31, 2018 and March 31, 2017 are as under :
Security Category Amount (Rupees)
Percentage to Net Assets
Amount (Rupees)
Percentage to Net Assets
2018 2017
Equity Shares
– Appreciation 1,554,525,410 25.57 1,409,769,112 32.80
– Depreciation 357,151,249 5.87 258,346,442 6.01
1.7. The aggregate value of investments securities (excluding CBLO and Reverse Repos) purchased and sold (including matured) during the financial year 2017 - 2018 (excluding accretion of discount) is Rs. 2,869,288,510 and Rs. 1,904,672,530 respectively being 53.83% and 35.73% of the average daily net assets.
The aggregate value of investments securities (excluding CBLO and Reverse Repos) purchased and sold (including matured) during the financial year 2016 - 2017 (excluding accretion of discount) is Rs. 1,176,145,124 and Rs. 1,770,798,009 respectively being 29.94% and 45.07% of the average daily net assets.
1.8. Non-Traded securities in the portfolio of the Scheme as of the Years ended March 31, 2018 and March 31, 2017 are NIL.
2 Disclosure Under Regulation 25(8) of the Securities and Exchange Board of India (Mutual Funds) Regulations, 1996 as amended
Details of amounts paid to associates in terms of Regulation 25 (8) are as follows :
Commission paid to Sponsor / AMC and its associates / related parties / group companies
Name of Sponsor/AMC and its associates / related parties / group companies
Nature of Association / Nature of
Relation
Period Covered
Business Given [Rs. In Crores]
% of Total Business received by the Fund
Commission paid [Rs.]
% of Total commission paid by the
Fund
The Hongkong and Shanghai Banking Corporation Limited
Associate of Investment Manager
2017-2018 161.26 47.87 23,237,372 51.27
Name of Sponsor/ AMC and its associates / related parties / group companies
Nature of Association / Nature of
Relation
Period Covered
Business Given [Rs. In Crores]
% of Total Business
received by the Fund
Commission paid [Rs.]
% of Total commission paid by the
Fund
The Hongkong and Shanghai Banking Corporation Limited
Associate of Investment Manager
2016-2017 100.28 67.62 15,132,500 54.27

18
Brokerage paid to Sponsor /AMC and its associates / related parties / group companies
Name of Sponsor /AMC and its associates / related parties / group companies
Nature of Association /Nature of
relation
Period Covered
Value of Transactions
[Rs. In Crores]
% of total value of
transactions of the fund
Brokerage paid [Rs.]
% of total brokerage
paid by the fund
HSBC Securities and Capital Market (India) Private Limited
Sponsor 2017-2018 6.56 1.37 78,664 1.52
Name of Sponsor / AMC and its associates / related parties / group companies
Nature of Association /Nature of
relation
Period Covered
Value of Transactions
[Rs. In Crores]
% of total value of
transactions of the fund
Brokerage paid [Rs.]
(on accrual basis)
% of total brokerage
paid by the fund
HSBC Securities and Capital Market (India) Private Limited
Sponsor 2016-2017 9.50 3.22 113,956 3.27
The brokerage paid was at rates similar to those offered to other brokers / distributors. And the Commission/Brokerage paid to related party includes both upfront and trail and hence not comparable with the % of business brought and % of commission paid.
Further, The Hongkong and Shanghai Banking Corporation Limited, an associate of the Sponsor, is on the panel of bankers with whom HSBC Mutual Fund places money on fixed deposits and enters into reverse repo transactions from time to time at competitive rates.
(i) Any underwriting obligations undertaken by the schemes of the mutual funds with respect to issue of securities associate companies - Nil. (Previous year also Nil)
(ii) Devolvement - Nil. (Previous year also Nil)
(iii) Subscription by the schemes in the issues lead managed by associate companies - Nil. (Previous year also Nil)
(iv) Subscription to any issue of equity or debt on private placement basis where the sponsor or its associate companies have acted as arranger or manager - Nil. (Previous year also Nil)
3 None of the Investors held more than 25% of the total net assets of the Scheme at the year ended March 31, 2018 and March 31, 2017.
4 Unit Capital movement during the years ended March 31, 2018 and March 31, 2017:
Description
2017-2018
Opening Units Subscription Redemption Closing Units Face Value per unit (Rupees)
Growth Option 54,119,206.211 37,886,065.498 24,311,026.633 67,694,245.076 10
Dividend Option 43,458,386.802 16,921,903.663 13,666,227.447 46,714,063.018 10
Direct Plan - Growth Option
13,879,606.303 10,353,571.324 7,839,589.713 16,393,587.914 10
Direct Plan - Dividend Option
243,243.761 401,232.666 183,297.822 461,178.605 10
Notes to Accounts - Annexure I (Contd...)To the Abridged Balance Sheet and Revenue Account for the Year ended March 31, 2018

19
Description
2016-2017
Opening Units Subscription Redemption Closing Units Face Value per unit (Rupees)
Growth Option 60,015,072.936 24,366,468.574 30,262,335.299 54,119,206.211 10
Dividend Option 47,674,873.624 11,627,491.175 15,843,977.997 43,458,386.802 10
Direct Plan - Growth Option
15,888,452.518 2,423,946.434 4,432,792.649 13,879,606.303 10
Direct Plan - Dividend Option
228,462.529 368,903.382 354,122.150 243,243.761 10
** Units held by the AMC (Seed Capital) in Direct Plan Growth Option as on March 31, 2018 is 129,937.630 and as on March 31, 2017 is 129,937.630
5 Previous year’s figures have been re–grouped/re-arranged where appropriate.
6 No contingent liabilities for the year ended March 31, 2018 and March 31, 2017.
7 Expenses other than Management Fees are inclusive of GST / Service Tax where applicable.
8 Other Income of Rs. 7,233 (2017: Rs. 11,196) represents Exit load (net of GST / Service Tax) credited to the Scheme.
9 Investor Education Awareness In view of the AMFI Best Practices Guidelines Circular No. 56/2015-16, the IEF (Investor Education Fund)
accrual is set aside in a separate bank account and the consolidated balance across all schemes as on March 31, 2018. The break-up of which is as under:
Particulars March 31, 2018 Amount (in Rs. Lacs)
March 31, 2017 Amount (in Rs. Lacs)
Opening Balance as on April 01, 2017 44.00 –
Add: Accrual during FY 2017-18 219.83 182.34
Less: Transferred to AMFI 101.10 83.24
Less: Payable to AMFI (March 2018 accrual) 8.81 7.93
Add: Investment Income FY 2017-18 8.28 11.24
Less: Spent during FY 2017-18 43.17 58.41
Closing Balance as on March 31, 2018 119.02 44.00
10 Categorization and Rationalization of schemes
Pursuant to SEBI circular no. SEBI/HO/IMD/DF3/CIR/P/2017/114 dated October 6, 2017 and SEBI circular no. SEBI/HO/IMD/DF3/CIR/P/2017/126 dated December 4, 2017 on ‘Categorization and Rationalization of schemes’, fundamental attribute related changes were carried out in certain schemes of HSBC Mutual Fund to align the same with the requirements specified in the aforesaid circulars effective from March 14, 2018. The said changes have been approved by the Board of Directors of the HSBC Asset Management (India) Pvt. Ltd. (the AMC) and the Board of Trustees (the Trustees). SEBI vide its letter no. IMD/DF3/OW/P/2018/89/1 dated January 2, 2018 has also conveyed it’s no objection to the said changes.
A notice-cum-addendum providing details of changes in the fundamental attributes of certain schemes was published in the newspaper on February 3, 2018 and is also available on the website of the AMC at www.assetmanagement.hsbc.com/in. The exit window period of 30 days was provided to the investors during which no exit load was charged to investors on switches/redemptions.
Apart from the fundamental attribute changes, there has been change in the ‘type of Scheme’ for all the open ended schemes and ‘name of Scheme’ in certain schemes for the purposes of alignment of
Notes to Accounts – Annexure I (Contd...)To the Abridged Balance Sheet and Revenue Account for the Year ended March 31, 2018

20
the existing schemes with the provisions of the Circular. The details of the schemes impacted is provided below:
Existing Name Revised Name Fundamental Attribute change
Benchmark Change
HSBC Mid Cap Equity Fund HSBC Small Cap Fund Yes S&P BSE 250 Small Cap Index (previous benchmark S&P BSE
Midcap Index)
11 The Annual Accounts of the Schemes prepared in accordance with the accounting policies and standards specified in the Ninth Schedule of The Securities and Exchange Board of India (Mutual Funds) Regulations, 1996 has been approved by the Board of Directors of HSBC Asset Management (India) Private Limited and The Board of Trustees of HSBC Mutual Fund at their meetings held on July 16, 2018 and July 17, 2018 respectively. The audit report attached herewith refers to the said Annual Accounts. The aforesaid abridged accounts are an extract of the Annual Accounts and are prepared in accordance with SEBI Circular No. IMD/Cir8/132968/2008 dated July 24, 2008.
Notes to Accounts - Annexure I (Contd...)To the Abridged Balance Sheet and Revenue Account for the Year ended March 31, 2018
21
Voting Policy and Procedures
In view of SEBI guidelines related to “Role of Mutual Funds in Corporate Governance of Public Listed Companies”, AMIN has formulated its “Policy for Proxy Voting in Public Listed Companies”. The said policy and details of actual exercise of proxy votes along with the summary of votes cast and the auditors certification during the Financial Year 2017 – 18 is available on its website – http://www.assetmanagement.hsbc.com/in and in full Annual Report for the Financial Year 2017 – 18.

22
Statutory Details & Disclaimers
All returns have been sourced from Mutual Funds India Explorer software unless otherwise stated. With regard to equity schemes (including the equity component of MIPs), Fund performance is calculated on a total return basis (i.e. it includes dividends re-invested) while the benchmark is calculated on a price return basis (i.e. it does not consider dividends re-invested). This document has been prepared by HSBC Asset Management (India) Private Ltd (HSBC) for information purposes only and should not be construed as an offer or solicitation of an offer for purchase of any of the funds of HSBC Mutual Fund. All information contained in this document (including that sourced from third parties), is obtained from sources HSBC, the third party believes to be reliable but which it has not independently verified and HSBC, the third party makes no guarantee, representation or warranty and accepts no responsibility or liability as to the accuracy or completeness of such information. The information and opinions contained within the document are based upon publicly available information and rates of taxation applicable at the time of publication, which are subject to change from time to time. Expressions of opinion are those of HSBC only and are subject to change without notice. It does not have regard to specific investment objectives, financial situation and the particular needs of any specific person who may receive this document. Investors should seek financial advice regarding the appropriateness of investing in any securities or investment strategies that may have been discussed or recommended in this report and should understand that the views regarding future prospects may or may not be realized. Neither this document nor the units of HSBC Mutual Fund have been registered in any jurisdiction. The distribution of this document in certain jurisdictions may be restricted or totally prohibited and accordingly, persons who come into possession of this document are required to inform themselves about, and to observe, any such restrictions.
Investors should not invest in the Scheme solely based on the information provided in this document and should read the Scheme Information Document and Statement of Additional Information of the Fund for details. This document does not constitute an offering document.
No part of this publication may be reproduced, stored in a retrieval system, or transmitted, on any form or by any means, electronic, mechanical, photocopying, recording, or otherwise, without the prior written permission of HSBC Asset Management (India) Private Ltd.
Mutual Fund investments are subject to market risks, read all scheme related documents carefully.

HSBC Dynamic Asset Allocation Fund (erstwhile HSBC Dynamic Fund)An open ended Dynamic Asset Allocation Fund
Abridged Annual Report 2017 - 2018

1
Dear Investor,
Globally, we are witnessing a very interesting phase. The equity markets delivered a stellar performance in 2017. However, there are worries about the impact of higher rates, global trade wars, an economic growth moderation and higher volatility.
Closer home, India has become the world’s sixth-biggest economy. India has doubled its GDP to USD 2.2 trillion within a decade. The introduction of reform measures, including demonetisation and the Goods and Services Tax (GST), had put pressure on selective parts of the economy in 2017. The impact of these measures is likely to be transitory. India’s economic growth is expected to accelerate from 6.7% in FY18 to 7.4% in the current year as per IMF forecasts.
There has been a shift in the domestic savings pool supporting the market. Domestic investors have been increasing exposure to equities and financial assets moving away from gold and real estate. Mutual funds witnessed sizable inflows on the back of the boost in liquidity within the banking system from demonetisation. The AUM of the mutual fund industry grew by 21.7% in March 2018 compared to March 2017.
With growth, comes responsibility. Last year, the regulator, Securities and Exchange Board of India (SEBI) issued a circular to rationalise and categorise mutual fund schemes in India. We are pleased to state that none of our funds needed to be redesigned. All our schemes have been defined as per the new categorisation. We believe this classification will simplify investing into mutual funds and enhance comparability within the schemes offered.
As India moves to a digital age, e-commerce platforms are becoming increasingly popular. I request you to logon to our online transaction platform. It is a quick, convenient and an efficient tool to invest into our funds and manage your investments online.
At HSBC Global Asset Management, India, we are dedicated to one goal: delivering exceptional investment management for our clients. By bringing together our

2
global investment knowledge and capabilities, we are able to offer specialised expertise across asset classes. This has helped us to become a trusted partner to our individual and institutional investors.
We remain committed to our long-term perspective and disciplined investment approach as we conduct a rigorous, fundamental analysis of investments with a strong emphasis on risk management. Although the investment landscape appears favourable, it is worth remembering that markets are dynamic and constantly evolving. Therefore, we believe active, professional investment management serves investors well. Amid changing markets and economic conditions, we are confident that investors with a well-diversified portfolio and a patient, long-term outlook should be well positioned for the years ahead.
Together we thrive.
Warm regards,
Ravi Menon
Chief Executive Officer, HSBC Global Asset Management, India

3
SPONSORHSBC Securities and Capital Markets (India) Private LimitedRegd. Office: 52/60, Mahatma Gandhi Road, Fort, Mumbai - 400 001.
TRUSTEEBoard of TrusteesOffice: 16, Veer Nariman Road, Fort, Mumbai 400 001.
ASSET MANAGEMENT COMPANYHSBC Asset Management (India) Private LimitedCorp. & Regd. Office: 16, Veer Nariman Road, Fort, Mumbai 400 001.
CUSTODIANStandard Chartered Bank (SCB)Corp. & Regd. Office: Crescenzo, Securities Services, 3rd Floor, C-38/39, G-Block, Bandra Kurla Complex, Bandra East, Mumbai – 400051.
AUDITORS TO THE SCHEMEBSR & Co. LLPChartered Accountants 5th Floor, Lodha Excelus, Apollo Mills Compound, N.M. Joshi Marg, Mahalaxmi, Mumbai 400 011.
REGISTRAR & TRANSFER AGENTSComputer Age Management Services Private Limited (CAMS)Unit: HSBC Mutual Fund ’C’ Block, 2nd Floor, Hanudev Info Park P. Ltd., SF No. 558/2, Udayampalayam Road, Nava India, Coimbatore - 641 028.
BOARD OF TRUSTEESMr. Nasser Munjee
Mr. Manu Tandon
Mr. Mehli Mistri
Mr. Dilip J. Thakkar
Ms. Jasmine Batliwalla
Mr. Pedro Bastos
BOARD OF DIRECTORSMs. Kishori J. Udeshi - Chairperson
Mr. S. P. Mustafa
Mr. Dinesh Mittal
Mr. Ravi Menon - Chief Executive Officer

4
The Trustees of HSBC Mutual Fund (“Fund”) present the Sixteenth Annual Report and the audited abridged financial statements of the schemes of the Fund for the year ended March 31, 2018.
As at March 31, 2018, the Fund offered 30 schemes across asset classes to meet the varying investment needs of the investors. Notably, three Schemes of HSBC Mutual Fund viz. HSBC Large Cap Equity Fund, HSBC Short Duration Fund and HSBC Cash Fund have completed 15 years of operations during the year.
During the year, the Fund has launched Plan(s) under Fixed Term Series and carried out merger of the existing schemes viz HSBC Dividend Yield Equity Fund merged into HSBC Multi Cap Equity Fund (HMEF), erstwhile HSBC India Opportunities Fund, as offering sub-scale fund was not in the interest of the unitholders.
Further, in order to bring uniformity in the practice across Mutual Funds and to standardize the scheme categories and characteristics of schemes, SEBI vide its circular no. SEBI/HO/IMD/DF3/CIR/P/2017/114 dated October 06, 2017, issued guidelines for categorization and rationalization of Mutual Fund schemes.
Accordingly, HSBC Large Cap Equity Fund (erstwhile HSBC Equity Fund), HSBC Small Cap Equity Fund (erstwhile HSBC Mid Cap Equity Fund) , HSBC Infrastructure Equity Fund, HSBC Global Emerging Market Fund (erstwhile HSBC Emerging Market Fund), HSBC Debt Fund (erstwhile HSBC Income Fund – Investments Plan), HSBC Short Duration Fund (erstwhile HSBC Income Fund – Short Term Plan), HSBC Low Duration Fund (erstwhile HSBC Ultra Short Term Bond Fund), HSBC Regular Savings Fund (erstwhile HSBC Monthly Income Plan) and HSBC Managed Solutions have undergone fundamental attributes changes with effective from March 14, 2018.
The Fund continues its focus on delivering consistent long term returns. The comments on the performance of the Scheme(s) is provided hereinafter. Dividends were declared under various schemes as per the provisions contained in the respective Scheme Information Documents after considering the distributable surplus available under the respective Schemes. Details of dividends declared can be viewed on our website at www.assetmanagement.hsbc.com/in.
1. Scheme Performance, future outlook and oPerationS of the SchemeS
a. Operations and Performance of the Schemes
HSBC Dynamic Asset Allocation Fund (HDAAF), erstwhile HSBC Dynamic Fund(An open ended Dynamic Asset Allocation Fund)
HDAAF seeks to provide long term capital appreciation by allocating funds in equity and equity related instruments. It also has the flexibility to move, entirely if required, into debt instruments in times that the view on equity markets seems negative. However, there can be no assurance or guarantee that the investment objective of the scheme would be achieved.
The net assets of HDAAF amounted to Rs. 42.20 crores as at March 31, 2018 compared to Rs. 46.22 crores as at March 31, 2017. Around 95.09% of the net assets were invested in equities, 5.53% of the net assets were invested in reverse repos/CBLO and (-0.41%) % in net current assets as at March 31, 2018.
HDAAF is an asset allocation fund where assets are allocated to equity and debt depending upon attractiveness of the asset classes. The debt portion is invested in CBLO products, which under performs pure equity benchmark. Over 1 year, 3 year, 5 year periods, equities has performed very well and CBLO portion has underperformed equities. It is the primary reason of under performance of the fund over these periods. Superior stock selection, especially in Materials, Financials, and Energy helped in reducing extent of underperformance.
Scheme Name & Benchmarks Absolute Returns
(%)
Compounded Annualized Returns (%)
Date of Inception : 24 September 2007 1 Year 3 Years 5 Years Since Inception
HSBC Dynamic Asset Allocation Fund - Growth 9.89 7.55 11.62 5.16
S&P BSE 200 TRI (Scheme Benchmark) 13.51 9.91 15.77 8.98
Nifty 50 TRI (Standard Benchmark) 12.68 7.99 13.63 8.32
Rs. 10,000, if invested in HDAF, would have become 10,989 12,445 17,332 16,973
Trustees’ ReportFor the year ended March 31, 2018

5
Scheme Name & Benchmarks Absolute Returns
(%)
Compounded Annualized Returns (%)
Date of Inception : 24 September 2007 1 Year 3 Years 5 Years Since Inception
Rs. 10,000, if invested in S&P BSE 200, would have become 11,351 13,284 20,804 24,700
Rs. 10,000, if invested in Nifty 50, would have become 11,268 12,599 18,950 23,172
Past performance may or may not be sustained in future. The returns for the respective periods are provided as on last business day of March 2018 for Growth Option. Different plans shall have a different expense structure. Performance of the respective benchmark is calculated as per the Total Return Index (TRI).
b. Market Overview & Outlook (as furnished by HSBC Asset Management (India) Private Limited)
EqUITY OUTLOOKIndian equity markets continued to remain strong during fiscal year 2017-18 and posted gains of 11.76% by S&P CNX Nifty and 13.24% by BSE Midcap index respectively. Biggest drivers of the markets were, robust DII flow into equities, continued push of mega reforms – Goods and Services Tax (GST) implementation, Insolvency and Bankruptcy Code implementation, Real Estate (Regulation and Development) Act, second consecutive normal monsoon, and electoral victories of the ruling party in many state elections. On the other hand, the markets weather the storm of disruption in economy due to GST implementation, lingering impact of demonetization, muted FII flows, and rising yields in developed markets. Domestic Mutual Fund segment had their best ever year and they brought in ~USD 22 bn of net inflows in equities during the year. Even after witnessing ~USD 4.3 bn of net outflows from the domestic insurers, the net DII tally was a very impressive ~USD 17.7 bn of net inflows. There were mixed global cues well and the Foreign Institutional Investors (FIIs) net bought Indian equities worth USD 3.2 bn. The inflows by both FIIs and domestic MFs acted as a factor in the strong market performance.
Indices Returns (April 1, 2017 to March 31, 2018) 1 Year (%)
S&P BSE Sensex 12.70%
NSE CNX Nifty 11.76%
S&P BSE 100 12.12%
S&P BSE 200 12.49%
S&P BSE 500 13.21%
S&P BSE Midcap 14.31%
S&P BSE 250 Small-cap 14.13%
Source: Bloomberg (All values are total return)
Our view on the key aspects related to equity markets are presented below -
The impressive performance in equity markets during FY 2017-18 has come on the back of strong liquidity largely by domestic MFs but supported in party by FII flows, positive global growth, benign macro – both domestically and global, expectation of the continuation of favorable policy environment domestically and expectation of corporate earnings revival. Possibility of sound macro, economic reforms and implementation of existing reforms have increased, especially after continued success of the ruling party at the centre in state elections. However, after this strong performance in markets and rather long wait for earnings to be delivered has meant that the equity markets are currently trading above their historical averages.
Moving into FY 2018-19, we expect a continuation of the economic recovery process domestically, recovery in corporate earnings - led early by volume growth, and continued DII flows. Government led investment spending and rural consumption are likely to lead with private sector investments contributing later (possibly
Trustees’ ReportFor the year ended March 31, 2018 (Contd...)

6
after general elections 2019). The budget document that was presented in early February provides a good medium term policy direction for the economy. Occasionally the policy actions can serve up a few bumps and jolts but over the medium term, across different governments, there is a thread of continuity connecting many key economic policies such as in the case of this year’s union budget. We, in our investment process, prefer to take comfort in these threads of continuity and remain constructive on the India growth story. This makes us positive on the Indian equity markets over the medium to long term.
Risks are in the form of market valuations trending above historical averages, weaker than expected delivery in corporate earnings going forward, external news flows related to trade protectionism, developed market central banks raising rates prematurely, and geopolitical tensions and other eco-political events would also influence market performance going forward, as the recent rally in the markets was supported by strong FII inflows.
DEBT OUTLOOKFixed Income in Financial Year 2017-18 has seen volatility further step up in this year. Markets went to perfect storm with higher crude prices, low liquidity and pressure on currency, apart from rate hike expectations.
Inflation has followed the glide path to lower numbers towards 4% RBI target and even lower than the target number when inflation printed a lowly 1.46% in June 2018 on back of lower food prices. RBI went for a cut despite of neutral stance. This positivity continued till until crude shock came in form of higher crude process. Global prices of Brent crude saw substantial increase in second half of the year, which jeopardized the inflation path. Other worries that gathered around this time were related to GST collection and eventual impact on fiscal situation.
Government of India allowed the fiscal deficit to slip to 3.5% (budget 3.2%) and kept next year target at 3.3% (in place of earlier path of 3%). This was on back of some excise relaxation for oil products and a month less collected for GST due to implementation in the current year. The fear of fiscal slippage alongwith the announcement of higher bond issuances spooked the bond markets into higher yields. Government finally borrowed only INR 90 bln extra (in place of INR 500 bln announced initially).
On the Monetary front the year was very volatile as well. RBI changed its stance to neutral causing some worry around rate hikes. Thereafter it cut rates and again went for OMO sales operations simultaneously. This created some confusion in the market participants regarding rates direction. Finally extra supply, higher oil prices and higher inflation paved way for rates higher. RBI also held position on regulatory forbearance about spreading out losses by banks publicly. It eventually gave up the position in the end of March. However, the swift changes in stance caused lot of pressure and volatility in bonds.
Liquidity situation continuously deteriorated due to OMO sales initially and withdrawal of deposits due to remonetisation. Further liquidity was absorbed out due to portfolio outflows and reduction in reserves. Despite of defense from RBI utilizing the reserves, the currency depreciated meaningfully, which caused further jitters in foreign investor sentiments. Lack of liquidity also affected 1-3 year rates which were elevated in second half of the year.
Going forward following are key variables to watch out for:• Liquidity: Liquidity will drive short end rates and eventually drive decisions leading to market interventions
and CRR cuts. RBI has focused now on neutral liquidity stance and providing liquidity to system, which will bode well short end rates.
• Inflation: Inflation numbers will determine future course of action for RBI and remains a critical variable for policy. We expect inflation to remain at 4.7% level in the ease in second half of FY 2018-19 in line with RBI’s expectations.
• Growth: GDP growth numbers as well as industrial activity will also determine the decision on policy.
• Fiscal deficit: Fiscal deficit and government spending will determine the government borrowing and crowding out in interest rate curve. We expect prudence in government spending and prospect of spending on infrastructure to pick up which will crowd in private investment as well.
• Current Account Deficit: Current Account Deficit determines how the pressure on currency works and effective management of forex reserves.
• Currency levels: Level of INR will determine how the central bank reacts to the situation on the global crisis etc.
Trustees’ ReportFor the year ended March 31, 2018 (Contd...)

7
2. Brief Background of SPonSorS, Board of truSteeS and aSSet management comPany
a. Sponsor
HSBC Mutual Fund is sponsored by HSBC Securities and Capital Markets (India) Private Limited (HSCI). The Sponsor is the Settler of the Mutual Fund Trust. The Sponsor has entrusted a sum of Rs. 1,00,000 (Rupees One Lakh only) to the Trustee as the initial contribution towards the corpus of the Mutual Fund.
HSCI offers integrated investment banking services, securities and corporate finance & advisory. HSCI is a member of the Bombay Stock Exchange Limited and National Stock Exchange (capital and derivative market segments). HSCI holds 100% of the paid up equity share capital of HSBC Asset Management (India) Private Limited.
b. HSBC Mutual Fund
HSBC Mutual Fund (“the Mutual Fund” or “the Fund”) has been constituted as a Trust in accordance with the provisions of the Indian Trusts Act, 1882 (2 of 1882) vide a Trust Deed dated February 7, 2002 with HSBC Securities and Capital Markets (India) Private Limited, as the Sponsor and the Board of Individual Trustees. The Trustee has entered into an Investment Management Agreement dated February 7, 2002 with HSBC Asset Management (India) Private Limited (AMC) to function as the Investment Manager for all the schemes of the Fund. The Fund was registered with SEBI vide registration number MF/046/02/5 dated May 27, 2002.
The Trust has been formed for the purpose of pooling of capital from the public for collective investment in securities for the purpose of providing facilities for participation by persons as beneficiaries in such investments and in the profits/income arising therefrom.
c. Board of Trustees (the Trustees)
The Board of Trustees is the exclusive owner of the Trust Fund and holds the same in trust for the benefit of the unit holders. The Trustees have been discharging their duties and carrying out the responsibilities as provided in the SEBI (Mutual Funds) Regulations, 1996 and the Trust Deed. The Trustees seek to ensure that the Fund and the schemes floated there under are managed by the AMC in accordance with the Trust Deed, the said Regulations, directions and guidelines issued by the SEBI, the Stock Exchanges, the Association of Mutual Funds in India and other regulatory agencies.
d. Asset Management Company (the AMC)
HSBC Asset Management (India) Private Limited (the Investment Manager or the AMC) is a private limited company incorporated under the Companies Act, 1956 on December 12, 2001 having its Registered Office at 16, V. N. Road, Fort, Mumbai 400 001. HSBC Asset Management (India) Private Limited has been appointed as the Asset Management Company of HSBC Mutual Fund by the Trustee vide Investment Management Agreement (IMA) dated February 7, 2002 and executed between the Trustees and the AMC. SEBI approved the AMC to act as the Investment Manager of the Fund vide its letter No. MFD/BC/163/2002 dated May 27, 2002. The paid-up equity share capital of the AMC is Rs. 61.59 crores. The AMC is registered as a Portfolio Manager under the SEBI (Portfolio Managers) Regulations, 1993 vide registration no. INP000001322. The AMC also offers non-binding Advisory services to offshore funds under the mutual fund license.
HSBC Securities and Capital Markets (India) Private Limited holds 100% of the paid up equity share capital of the AMC.
3. inveStment oBjective of the SchemeS The investment objective of the respective schemes has been provided above under the heading “Scheme
Performance, Future Outlook and Operation of the Scheme” (Refer Section 1).
4. Significant accounting PolicieS The Significant Accounting Policies form part of the Notes to the Accounts annexed to the Balance Sheet
of the Schemes in the Full Annual Report. The accounting policies are in accordance with Securities Exchange Board of India (Mutual Funds) Regulations 1996.
Trustees’ ReportFor the year ended March 31, 2018 (Contd...)

8
5. unclaimed dividendS & redemPtionS Summary of number of investors & corresponding amount Scheme-wise as on March 31, 2018.
SchemeUnclaimed Dividend Unclaimed Redemption
Amount (Rs.) No. of Investors
Amount (Rs.) No. of Investors
HSBC Dynamic Asset Allocation Fund – – 2,659,233.10 78
6. inveStor ServiceSThe number of official points of acceptance of transactions is 205 locations. In addition to the offices of the Registrar & Transfer agents, the AMC has Investor Service Centres in 9 locations at its own offices - namely Mumbai, New Delhi, Kolkata, Bangaluru, Pune, Ahmedabad, Hyderabad, Chandigarh and Chennai. With a view to enhance customer convenience, the AMC has the facility of priority based servicing to key distributors through the enhancement of the Interactive Voice Reponses. The AMC has a single Toll Free number which can be dialed from anywhere in India. The call centre service is being managed by the Registrar and Transfer Agents.
On the distribution front, the number of empanelled distributors was 460 as on March 31, 2018. During the year, the AMC initiated tie-ups for online distribution of the Mutual Fund’s schemes with several channel partners taking the total number of such tie-ups to 42.
7. detailS of inveStor grievance redreSSalThe details of the redressal of investor complaints received against HSBC Mutual Fund during April 2017 - March 2018 are as follows:
2017-2018
Com- plaint Code
Type of complaint (a) No. of complaints
pending at the
beginning of the year
(b) No. of complaints received during
the year
Action on (a) and (b)
Resolved Non Actiona-
ble*
Pending
Within 30
days
30 - 60 days
60 - 180 days
Beyond 180 days
0 - 3 months
3 - 6 months
6 - 9 months
9 - 12 months
I A Non receipt of Dividend on Units
0 5 4 1 0 0 0 0 0 0 0
I B Interest on delayed payment of Dividend
0 0 0 0 0 0 0 0 0 0 0
I C Non receipt ofRedemption Proceeds
1 12 12 1 0 0 0 1 0 0 0
I D Interest on delayedp a y m e n t o f Redemption
0 1 1 0 0 0 0 0 0 0 0
II A Non receipt of Statement of Account / Unit Certificate
0 0 0 0 0 0 0 0 0 0 0
II B D i s c r e p a n c y i n Statement of Account
0 0 0 0 0 0 0 0 0 0 0
II C Data corrections in Investor details **
0 34 34 0 0 0 0 0 0 0 0
II D Non receipt of Annual Report /Abridged Summary
0 0 0 0 0 0 0 0 0 0 0
Trustees’ ReportFor the year ended March 31, 2018 (Contd...)

9
2017-2018
Com- plaint Code
Type of complaint (a) No. of complaints
pending at the
beginning of the year
(b) No. of complaints received during
the year
Action on (a) and (b)
Resolved Non Actiona-
ble*
Pending
Within 30
days
30 - 60 days
60 - 180 days
Beyond 180 days
0 - 3 months
3 - 6 months
6 - 9 months
9 - 12 months
III A Wrong switch between Schemes
0 0 0 0 0 0 0 0 0 0 0
III B Unauthorized switch between Schemes
0 0 0 0 0 0 0 0 0 0 0
III C Deviation from Scheme attributes
0 0 0 0 0 0 0 0 0 0 0
III D Wrong or excess charges / load
0 0 0 0 0 0 0 0 0 0 0
III E Non updat ion of changes viz. address, PAN, bank details, nomination, etc
0 6 6 0 0 0 0 0 0 0 0
IV Others 1 41 42 0 0 0 0 0 0 0 0
Total 2 99 99 2 0 0 0 0 0 0 0
Summary of Complaints for FY 2017-18
Particulars Count
Total complaints received 99
Total number of folios 140099
% of complaints against the folio 0.071%
# active folios** As per AMFI Best Practice Guidelines Circular No. 25/2011-12 for Revisions in the Guidelines on
Standardization of Complaints/Grievances Reporting Procedure. If “Others” include a type of complaint which is more than 10% of overall complaints, then such a reason should be provided separately. Hence data corrections in Investor Details is included as a separate category
* Non actionable means the complaint is incomplete / outside the scope of the mutual fund
8. inveStor education initiativeS The Fund undertook various investor education and awareness initiatives related to investments in mutual funds throughout India in English / Hindi and Regional languages via mass media. The Fund conducted 16 roadshows at various locations in India to promote various Investor Awareness related topics including Asset Allocation, SIPs, Equity Mutual Funds and Financial Planning. The Fund has a Year-long tie-up with Mutual Fund Insights Magazine that includes 3 pages of content and advertorial publication in their monthly issue. Each issue contains a story promoting SIPs to achieve one’s various investment goals. In the month of December 2017 and January 2018 investor awareness promotion was done through Outlook and Outlook Money magazines through advertorials on various Mutual Fund topics.
9. Proxy voting PolicyIn terms of SEBI Circular no. SEBI/IMD/CIR No. 18/198647/2010 dated March 15, 2010, the Fund has adopted Proxy Voting Policy and Procedures for exercising voting rights in respect of securities held by the Schemes.
The summary of the votes casted in the general meetings of the Investee companies, by the AMC for and on behalf of the Schemes of the Fund, for the financial year 2017-18 is provided below:
Trustees’ ReportFor the year ended March 31, 2018 (Contd...)

10
quarter Total no. of resolutions
Break-up of vote decision
For Against Abstained
June 2017 184 116 5 63
September 2017 920 827 12 81
December 2017 49 45 1 3
March 2018 36 29 1 6
Total 1,189 1,017 19 153
In terms of the requirement of SEBI Circular no. CIR/IMD/DF/05/2014 dated March 24, 2014 and SEBI/HO/IMD/DF2/CIR/P/2016/68 dated August 10, 2016; the AMC has obtained certificate from M/s. M. P. Chitale & Co., Chartered Accountants, who is acting as a Scrutinizer, on the voting report for the FY 2017-18. The certificate dated May 3, 2018 issued by M/s. M. P. Chitale & Co., is available on the website of the AMC as part of the full Annual Report.
Unit holders can refer to the full Annual Report for complete details of actual exercise of votes in the general meetings of the investee companies for the financial year 2017-18 or log on to our website at www.assetmanagement.hsbc.com/in.
10. Statutory detailSa) The Sponsors are not responsible or liable for any loss resulting from the operation of the Schemes of
the Fund beyond initial contribution of Rs. 1 lakh for setting up the Fund.
b) The price and redemption value of the units, and income from them, can go up as well as down with fluctuations in the market value of its underlying investments.
c) Full Annual Report shall be disclosed on the website at www.assetmanagement.hsbc.com/in and shall be available for inspection at the Head Office of the Mutual Fund. Present and prospective unit holders can obtain copy of the Trust Deed, the full Annual Report of the Scheme(s), the Annual Report of HSBC Asset Management (India) Private Limited and the text of the relevant Scheme(s) at a price.
11. acknowledgementSThe Trustees wish to thank the Unit holders of the Schemes for their support throughout the year and also thank the Government of India, the Securities and Exchange Board of India (SEBI), the Reserve Bank of India (RBI) and the Association of Mutual Funds in India (AMFI) for the guidance provided by them. The Trustees also appreciate the services provided by the Registrar and Transfer Agent, Fund Accountant, Custodian, Bankers, Distributors and Brokers. The guidance and services provided by the Auditors and advocates and the ebullience, sincerity and dedication of the employees of HSBC Asset Management (India) Private Limited is also appreciated.
The Trustees look forward to the continued support of everyone.
For and on behalf of the Board of Trustees of HSBC Mutual Fund
Sd/-
Dilip Thakkar
Trustee
Mumbai
July 17, 2018.
Trustees’ ReportFor the year ended March 31, 2018 (Contd...)

11
To the Board of Trustees of
HSBC Mutual Fund – HSBC Dynamic Asset Allocation Fund (Formerly known as HSBC Dynamic Fund)
Report on the Financial StatementsWe have audited the accompanying Financial Statements of HSBC Dynamic Asset Allocation Fund (formerly known as HSBC Dynamic Fund) (the ‘Scheme’), which comprise the balance sheet as at 31 March 2018 and the related revenue account for the year then ended, and a summary of significant accounting policies and other explanatory information, annexed thereto.
Management’s responsibility for the Financial StatementsThe Board of Trustees to the HSBC Mutual Fund (the ‘Board of Trustees’) and HSBC Asset Management (India) Private Limited (the ‘AMC’), being the investment manager to HSBC Mutual Fund (the ‘Fund’) (collectively referred as ‘Management’), are responsible for the preparation of these financial statements that give a true and fair view of the financial position and financial performance of the Scheme in accordance with the accounting policies and standards specified in the Ninth Schedule of the Securities and Exchange Board of India (Mutual Funds) Regulations, 1996, as amended (the ‘Regulations’) and the accounting principles generally accepted in India. This responsibility includes maintenance of adequate accounting records for safeguarding of the assets of the Scheme and for preventing and detecting frauds and other irregularities; selection and application of appropriate accounting policies; making judgments and estimates that are reasonable and prudent; and design, implementation and maintenance of adequate internal financial controls, that were operating effectively for ensuring the accuracy and completeness of the accounting records, relevant to the preparation and presentation of the financial statements that give a true and fair view and are free from material misstatement, whether due to fraud or error.
In preparing the financial statements, management is responsible for assessing the Scheme’s ability to continue as a going concern, disclosing, as applicable, matters related to going concern and using the going concern basis of accounting unless management either intends to liquidate the Fund or to cease operations, or has no realistic alternative but to do so.
Auditor’s responsibilityOur responsibility is to express an opinion on these financial statements based on our audit. We conducted our audit in accordance with the Standards on Auditing issued by the Institute of Chartered Accountants of India (the ‘ICAI’). Those Standards require that we comply with ethical requirements and plan and perform the audit to obtain reasonable assurance about whether the financial statements are free from material misstatement.
An audit involves performing procedures to obtain audit evidence about the amounts and disclosures in the financial statements. The procedures selected depend on the auditor’s judgment, including the assessment of the risks of material misstatement of the financial statements, whether due to fraud or error. In making those risk assessments, the auditor considers internal controls relevant to preparation and fair presentation of the financial statements, of the Scheme, in order to design audit procedures that are appropriate in the circumstances, but not for the purpose of expressing an opinion on the effectiveness of the Scheme’s internal controls. An audit also includes evaluating the appropriateness of accounting policies used and the reasonableness of the accounting estimates made by Management, as well as evaluating the overall presentation of the financial statements.
We are also responsible to conclude on the appropriateness of management’s use of the going concern basis of accounting and, based on the audit evidence obtained, whether a material uncertainty exists related to events or conditions that may cast significant doubt on the Scheme’s ability to continue as a going concern. If we conclude that a material uncertainty exists, we are required to draw attention in the auditor’s report to the related disclosures in the financial statements or, if such disclosures are inadequate, to modify the opinion. Our conclusions are based on the audit evidence obtained up to the date of the auditor’s report. However, future events or conditions may cause the Scheme to cease to continue as a going concern.
We believe that the audit evidence we have obtained is sufficient and appropriate to provide a basis for our audit opinion.
Independent Auditors’ Report

12
Independent Auditors’ Report (Contd...)
OpinionIn our opinion, and to the best of our information and according to the explanations given to us, the aforesaid financial statements give the information required by the Regulations in the manner so required and give a true and fair view in conformity with the accounting principles generally accepted in India:
(i) in the case of the balance sheet, of the state of affairs of the Scheme as at 31 March 2018; and
(ii) in the case of the revenue account, of the net surplus for the year ended on that date.
Report on other Legal and Regulatory Requirements1 As required by Regulation 55(4) to the Regulations, we report that:
(a) We have obtained all information and explanations which, to the best of our knowledge and belief, were necessary for the purposes of the audit;
(b) The balance sheet and revenue account have been prepared in accordance with the accounting policies and standards specified in the Ninth Schedule of the Regulations.
2 As required by Clause 5(ii)(2) of the Eleventh Schedule of the Regulations, we report that the balance sheet and revenue account are in agreement with the books of account of the Scheme.
3 In our opinion and on the basis of information and explanations given to us, the methods used to value non - traded securities, as at 31 March 2018, as determined by the Board of Directors of AMC, are in accordance with the Regulations and other guidelines issued by the Securities and Exchange Board of India as applicable and approved by the Board of Trustees are fair and reasonable.
For B S R & Co. LLP Chartered Accountants Firm’s Registration No: 101248W/W-100022
Sd/-
Milind Ranade Partner Membership No: 100564
Place : Mumbai Date : July 17, 2018.
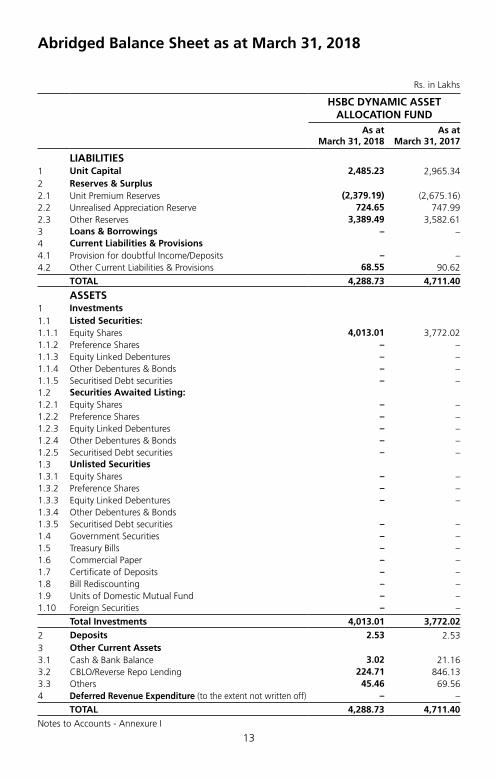
13
Abridged Balance Sheet as at March 31, 2018
Rs. in Lakhs
HSBC DYNAMIC ASSET ALLOCATION FUND
As at March 31, 2018
As at March 31, 2017
LIABILITIES1 Unit Capital 2,485.23 2,965.34 2 Reserves & Surplus2.1 Unit Premium Reserves (2,379.19) (2,675.16)2.2 Unrealised Appreciation Reserve 724.65 747.99 2.3 Other Reserves 3,389.49 3,582.61 3 Loans & Borrowings – – 4 Current Liabilities & Provisions4.1 Provision for doubtful Income/Deposits – – 4.2 Other Current Liabilities & Provisions 68.55 90.62
TOTAL 4,288.73 4,711.40
ASSETS1 Investments1.1 Listed Securities:1.1.1 Equity Shares 4,013.01 3,772.02 1.1.2 Preference Shares – – 1.1.3 Equity Linked Debentures – – 1.1.4 Other Debentures & Bonds – – 1.1.5 Securitised Debt securities – – 1.2 Securities Awaited Listing:1.2.1 Equity Shares – – 1.2.2 Preference Shares – – 1.2.3 Equity Linked Debentures – – 1.2.4 Other Debentures & Bonds – – 1.2.5 Securitised Debt securities – – 1.3 Unlisted Securities1.3.1 Equity Shares – – 1.3.2 Preference Shares – – 1.3.3 Equity Linked Debentures – – 1.3.4 Other Debentures & Bonds1.3.5 Securitised Debt securities – – 1.4 Government Securities – – 1.5 Treasury Bills – – 1.6 Commercial Paper – – 1.7 Certificate of Deposits – – 1.8 Bill Rediscounting – – 1.9 Units of Domestic Mutual Fund – – 1.10 Foreign Securities – –
Total Investments 4,013.01 3,772.02
2 Deposits 2.53 2.53 3 Other Current Assets3.1 Cash & Bank Balance 3.02 21.16 3.2 CBLO/Reverse Repo Lending 224.71 846.13 3.3 Others 45.46 69.56 4 Deferred Revenue Expenditure (to the extent not written off) – –
TOTAL 4,288.73 4,711.40
Notes to Accounts - Annexure I

14
Abridged Revenue Account for the year ended March 31, 2018
Rs. in Lakhs
HSBC DYNAMIC ASSET ALLOCATION FUND
Current Year ended
March 31, 2018
Previous Year ended
March 31, 2017
1 INCOME1.1 Dividend 62.97 56.38 1.2 Interest 20.70 57.29 1.3 Realised Gain / (Loss) on Foreign Exchange Transactions – – 1.4 Realised Gains / (Losses) on Interscheme sale of investments – – 1.5 Realised Gains / (Losses) on External sale / redemption of
investments476.59 430.94
1.6 Realised Gains / (Losses) on Derivative Transactions – – 1.7 Other Income 0.02 0.01
(A) 560.28 544.62
2 EXPENSES2.1 Management fees 80.68 85.50 2.2 GST / Service tax on Management fees 13.94 12.74 2.3 Transfer agents fees and expenses 5.94 5.98 2.4 Custodian fees 0.52 0.50 2.5 Trusteeship fees 0.09 0.10 2.6 Commission to Agents 30.47 34.66 2.7 Marketing & Distribution expenses 0.01 0.11 2.8 Audit fees 0.25 0.27 2.9 Investor Education Expenses 0.91 0.97 2.10 Other operating expenses 1.18 1.87 2.11 Less: Expenses to be Reimbursed by the Investment Manager – –
(B) 133.99 142.70
3 NET REALISED GAINS / (LOSSES) FOR THE YEAR (A–B=C) 426.29 401.92
4 Change in Unrealised Depreciation in value of investments and derivatives (D) – –
5 NET GAINS / (LOSSES) FOR THE YEAR [E=(C+D)] 426.29 401.92
6 Change in unrealised appreciation in the value of investments and derivatives (F) (23.34) 391.10
7 NET SURPLUS / (DEFICIT) FOR THE YEAR (E+F=G) 402.95 793.02
7.1 Add: Balance transfer from Unrealised Appreciation Reserve 23.34 – 7.2 Less: Balance transfer to Unrealised Appreciation Reserve – 391.10 7.3 Add / (Less): Equalisation (619.41) (1,326.36)7.4 Transfer from Reserve Fund 3,582.61 4,507.05
8 Total 3,389.49 3,582.61
9 Dividend appropriation9.1 Income Distributed during the year – – 9.2 Tax on income distributed during the year – – 10 Retained Surplus / (Deficit) carried forward to
Balance sheet 3,389.49 3,582.61
Notes to Accounts – Annexure I

15
Key Statistics for the year ended March 31, 2018
HSBC DYNAMIC ASSET ALLOCATION FUND
Current Year ended
March 31, 2018
Previous Year ended
March 31, 2017
1. NAV per unit (Rs.):
Open
Regular Plan Growth Option 15.5762 13.3378
Regular Plan Dividend Option 15.5762 13.3378
Direct Plan – Growth Option 16.0556 13.6523
Direct Plan – Dividend Option 16.0556 13.6523
High
Regular Plan Growth Option 18.7037 15.5762
Regular Plan Dividend Option 18.7037 15.5762
Direct Plan – Growth Option 19.3899 16.0556
Direct Plan – Dividend Option 19.3899 16.0556
Low
Regular Plan Growth Option 15.4772 13.0429
Regular Plan Dividend Option 12.0504 13.0429
Direct Plan – Growth Option 12.3264 13.3523
Direct Plan – Dividend Option 12.3264 13.3523
End
Regular Plan Growth Option 16.9645 15.5762
Regular Plan Dividend Option 16.9645 15.5762
Direct Plan – Growth Option 17.6095 16.0556
Direct Plan – Dividend Option 17.6095 16.0556
2. Closing Assets Under Management (Rs. in Lakhs)
End 4,220 4,622
Average (AAuM)1 4,551 4,867
3. Gross income as % of AAuM2 12.31% 11.19%
4. Expense Ratio:
a. Total Expense as % of AAuM (including service tax / GST on Management fees) (planwise)
Regular Plan (Continue) 2.96% 2.94%
Direct Plan 2.25% 2.24%
b. Management Fee as % of AAuM (planwise)
Regular Plan (Continue) 1.74% 1.76%
Direct Plan 1.74% 1.76%
5. Net Income as a percentage of AAuM3 9.37% 8.26%
6. Portfolio turnover ratio4 0.78 0.66

16
Key Statistics for the year ended March 31, 2018 (Contd...)
HSBC DYNAMIC ASSET ALLOCATION FUND
Current Year ended
March 31, 2018
Previous Year ended
March 31, 2017
7. Total Dividend per unit distributed during the year (planwise)
Retail
Regular Plan Dividend Option – –
Direct Plan – Dividend Option – –
Corporate
Regular Plan Dividend Option – –
Direct Plan – Dividend Option – –
8. Returns (%):
a. Last One Year
Scheme
Regular Plan Growth Option 9.8913 16.7824
Direct Plan – Growth Option 10.6647 17.6036
Benchmark
S&P BSE 200 13.5100 22.4731
b. Since Inception
Scheme
Regular Plan Growth Option 5.1571 4.7634
Direct Plan – Growth Option 10.0480 10.1110
Benchmark
S&P BSE 200 8.9800 7.1347
1. AAuM=Average daily net assets2. Gross income = amount against (A) in the Revenue Account i.e. Income3. Net income = amount against (C) in the Revenue Account i.e. Net Realised Gains / (Losses) for the year4. Portfolio Turnover = Lower of sales or purchase divided by the Average AuM for the year5. The net asset value disclosed represents the computed NAV on March 31, 2018 (Non-business Day), and
not the last declared NAV
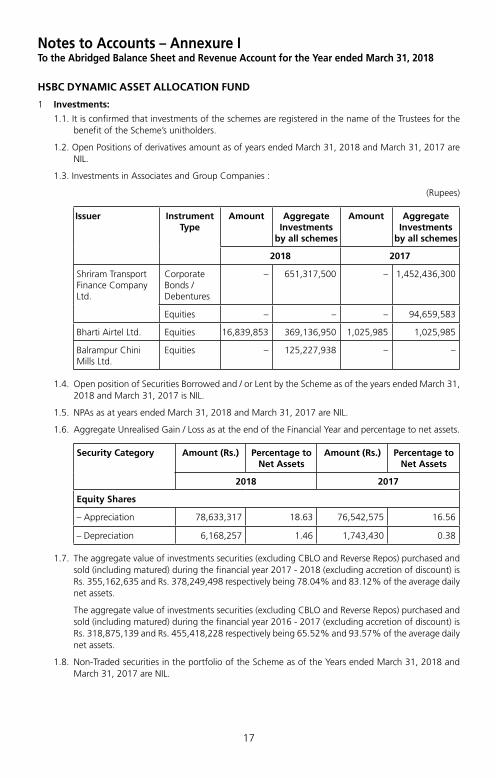
17
Notes to Accounts – Annexure ITo the Abridged Balance Sheet and Revenue Account for the Year ended March 31, 2018
hSBc dynamic aSSet allocation fund
1 Investments:
1.1. It is confirmed that investments of the schemes are registered in the name of the Trustees for the benefit of the Scheme’s unitholders.
1.2. Open Positions of derivatives amount as of years ended March 31, 2018 and March 31, 2017 are NIL.
1.3. Investments in Associates and Group Companies :
(Rupees)
Issuer Instrument Type
Amount Aggregate Investments
by all schemes
Amount Aggregate Investments
by all schemes
2018 2017
Shriram Transport Finance Company Ltd.
Corporate Bonds / Debentures
– 651,317,500 – 1,452,436,300
Equities – – – 94,659,583
Bharti Airtel Ltd. Equities 16,839,853 369,136,950 1,025,985 1,025,985
Balrampur Chini Mills Ltd.
Equities – 125,227,938 – –
1.4. Open position of Securities Borrowed and / or Lent by the Scheme as of the years ended March 31, 2018 and March 31, 2017 is NIL.
1.5. NPAs as at years ended March 31, 2018 and March 31, 2017 are NIL.
1.6. Aggregate Unrealised Gain / Loss as at the end of the Financial Year and percentage to net assets.
Security Category Amount (Rs.) Percentage to Net Assets
Amount (Rs.) Percentage to Net Assets
2018 2017
Equity Shares
– Appreciation 78,633,317 18.63 76,542,575 16.56
– Depreciation 6,168,257 1.46 1,743,430 0.38
1.7. The aggregate value of investments securities (excluding CBLO and Reverse Repos) purchased and sold (including matured) during the financial year 2017 - 2018 (excluding accretion of discount) is Rs. 355,162,635 and Rs. 378,249,498 respectively being 78.04% and 83.12% of the average daily net assets.
The aggregate value of investments securities (excluding CBLO and Reverse Repos) purchased and sold (including matured) during the financial year 2016 - 2017 (excluding accretion of discount) is Rs. 318,875,139 and Rs. 455,418,228 respectively being 65.52% and 93.57% of the average daily net assets.
1.8. Non-Traded securities in the portfolio of the Scheme as of the Years ended March 31, 2018 and March 31, 2017 are NIL.

18
2 Disclosure Under Regulation 25(8) of the Securities and Exchange Board of India (Mutual Funds) Regulations, 1996 as amended
Details of amounts paid to associates in terms of Regulation 25 (8) are as follows :
Commission paid to Sponsor/AMC and its associates/related parties/group companies
Name of Sponsor/AMC and its associates/related parties/group companies
Nature of Association / Nature of
Relation
Period Covered
Business Given [Rs. In Crores]
% of Total Business
received by the Fund
Commission paid [Rs.]
% of Total commission paid by the
Fund
The Hongkong and Shanghai Banking Corporation Limited
Associate of Investment Manager
2017-2018 0.00 0.26 730,739.98 25.76
Name of Sponsor/AMC and its associates/related parties/group companies
Nature of Association / Nature of
Relation
Period Covered
Business Given [Rs. In Crores]
% of Total Business
received by the Fund
Commission paid [Rs.]
% of Total commission paid by the
Fund
The Hongkong and Shanghai Banking Corporation Limited
Associate of Investment Manager
2016-2017 4.64 90.33 1,084,039 34.14
Brokerage paid to Sponsor/AMC and its associates/related parties/group companies
Name of Sponsor/AMC and its associates/related parties/group companies
Nature of Association /Nature of
relation
Period Covered
Value of Transactions
[Rs. In Crores]
% of total value of
transactions of the fund
Brokerage paid [Rs. ]
% of total brokerage paid by the
fund
HSBC Securities and Capital Market (India) Private Limited
Sponsor 2017-2018 0.66 0.90 3,316 0.40
Name of Sponsor/AMC and its associates/related parties/group companies
Nature of Association /Nature of
relation
Period Covered
Value of Transactions
[Rs. In Crores]
% of total value of
transactions of the fund
Brokerage paid [Rs. ]
% of total brokerage paid by the
fund
HSBC Securities and Capital Market (India) Private Limited
Sponsor 2016-2017 – – – –
The brokerage paid was at rates similar to those offered to other brokers / distributors. The Commission/Brokerage paid to related party includes both upfront and trial and hence not comparable with the % of business brought and % of commission paid.
Further, The Hong Kong and Shanghai Banking Corporation Limited, an associate of the Sponsor, is on the panel of bankers with whom HSBC Mutual Fund places money on fixed deposits and enters into reverse repo transactions from time to time at competitive rates.
(i) Any underwriting obligations undertaken by the schemes of the mutual funds with respect to issue of securities associate companies - Nil (Previous year also Nil).
Notes to Accounts - Annexure I (Contd...)To the Abridged Balance Sheet and Revenue Account for the Year ended March 31, 2018

19
(ii) Devolvement - Nil (Previous year also Nil).
(iii) Subscription by the schemes in the issues lead managed by associate companies - Nil (Previous year also Nil).
(iv) Subscription to any issue of equity or debt on private placement basis where the sponsor or its associate companies have acted as arranger or manager - Nil (Previous year also Nil).
3 None of the Investors held more than 25% of the total net assets of the Scheme at the years ended March 31, 2018 and March 31, 2017.
4 Unit Capital movement during the years ended March 31, 2018 and March 31, 2017.
Description
2017-2018
Opening Units Subscription Redemption Closing UnitsFace Value
per unit (Rupees)
Regular Plan Growth Option
19,133,085.348 167,405.784 3,611,045.018 15,689,446.114 10
Regular Plan Dividend Option
10,121,799.994 174,026.760 1,772,280.820 8,523,545.934 10
Direct Plan - Growth Option
393,112.603 255,977.482 20,193.846 628,896.239 10
Direct Plan - Dividend Option
5,419.402 6,496.691 1,519.596 10,396.497 10
Description
2016-2017
Opening Units Subscription Redemption Closing UnitsFace Value
per unit (Rupees)
Regular Plan Growth Option
21,838,405.104 3,055,782.763 5,761,102.519 19,133,085.348 10
Regular Plan Dividend Option
17,759,428.505 420,688.114 8,058,316.625 10,121,799.994 10
Direct Plan - Growth Option
456,848.648 15,258.393 78,994.438 393,112.603 10
Direct Plan - Dividend Option
4,528.200 2,148.166 1,256.964 5,419.402 10
** Units held by the AMC (Seed Capital) in Direct Plan Growth Option as on March 31, 2018 is 360,147.516 and as on March 31, 2017 is 360,147.516
5 Previous year’s figures have been re-grouped / re-arranged where appropriate.
6 No contingent liabilities for the years ended March 31, 2018 and March 31, 2017.
7 Expenses other than Management Fees are Inclusive of Service Tax where applicable.
Notes to Accounts – Annexure I (Contd...)To the Abridged Balance Sheet and Revenue Account for the Year ended March 31, 2018

20
8 Other income of Rs. 1674 represents Exit load (net of GST / service tax) credited to the Scheme. (2017: Rs. 1,148.06 represents Exit load (net of service tax) credited to the Scheme.
9 Investor Education Awareness
In view of the AMFI Best Practices Guidelines Circular No. 56/2015-16, the IEF (Investor Education Fund) accrual is set aside in a separate bank account and the consolidated balance across all schemes as on March 31, 2018. The break-up of which is as under:
March 31, 2018 March 31, 2017
Particulars Amount (in Rs. Lacs) Amount (in Rs. Lacs)
Opening Balance 44.00 –
Add: Accrual during the year 219.83 182.34
Less: Transferred to AMFI 101.10 83.24
Less: Payable to AMFI (March accrual) 8.81 7.93
Add: Investment Income for the year 8.28 11.24
Less: Spent during the year 43.17 58.41
Closing Balance 119.02 44.00
10 Categorization and Rationalization of Schemes
Pursuant to SEBI circular no. SEBI/HO/IMD/DF3/CIR/P/2017/114 dated October 6, 2017 and SEBI circular no. SEBI/HO/IMD/DF3/CIR/P/2017/126 dated December 4, 2017 on ‘Categorization and Rationalization of schemes’, fundamental attribute related changes were carried out in certain schemes of HSBC Mutual Fund to align the same with the requirements specified in the aforesaid circulars effective from March 14, 2018. The said changes have been approved by the Board of Directors of the HSBC Asset Management (India) Pvt. Ltd. (the AMC) and the Board of Trustees (the Trustees). SEBI vide its letter no. IMD/DF3/OW/P/2018/89/1 dated January 2, 2018 has also conveyed it’s no objection to the said changes.
A notice-cum-addendum providing details of changes in the fundamental attributes of certain schemes was published in the newspaper on February 3, 2018 and is also available on the website of the AMC at www.assetmanagement.hsbc.com/in. The exit window period of 30 days was provided to the investors during which no exit load was charged to investors on switches/redemptions.
Apart from the fundamental attribute changes, there has been change in the ‘type of Scheme’ for all the open ended schemes and ‘name of Scheme’ in certain schemes for the purposes of alignment of the existing schemes with the provisions of the Circular. The details of the schemes impacted is provided below:
Existing Name Revised Name Fundamental Attribute change Benchmark Change
HSBC Dynamic Fund
HSBC Dynamic Asset Allocation
Fund
No No
11 The Annual Accounts of the Schemes prepared in accordance with the accounting policies and standards specified in the Ninth Schedule of The Securities and Exchange Board of India (Mutual Funds) Regulations, 1996 has been approved by the Board of Directors of HSBC Asset Management (India) Private Limited and The Board of Trustees of HSBC Mutual Fund at their meetings held on July 16, 2018 and July 17, 2018 respectively. The audit report attached herewith refers to the said Annual Accounts. The aforesaid abridged accounts are an extract of the Annual Accounts and are prepared in accordance with SEBI Circular No. IMD/Cir8/132968/2008 dated July 24, 2008.
Notes to Accounts - Annexure I (Contd...)To the Abridged Balance Sheet and Revenue Account for the Year ended March 31, 2018

21
Voting Policy and Procedures
In view of SEBI guidelines related to “Role of Mutual Funds in Corporate Governance of Public Listed Companies”, AMIN has formulated its “Policy for Proxy Voting in Public Listed Companies”. The said policy and details of actual exercise of proxy votes along with the summary of votes cast and the auditors certification during the Financial Year 2017 – 18 is available on its website – http://www.assetmanagement.hsbc.com/in and in full Annual Report for the Financial Year 2017 – 18.
22
Statutory Details & Disclaimers
All returns have been sourced from Mutual Funds India Explorer software unless otherwise stated. With regard to equity schemes (including the equity component of MIPs), Fund performance is calculated on a total return basis (i.e. it includes dividends re-invested) while the benchmark is calculated on a price return basis (i.e. it does not consider dividends re-invested). This document has been prepared by HSBC Asset Management (India) Private Ltd (HSBC) for information purposes only and should not be construed as an offer or solicitation of an offer for purchase of any of the funds of HSBC Mutual Fund. All information contained in this document (including that sourced from third parties), is obtained from sources HSBC, the third party believes to be reliable but which it has not independently verified and HSBC, the third party makes no guarantee, representation or warranty and accepts no responsibility or liability as to the accuracy or completeness of such information. The information and opinions contained within the document are based upon publicly available information and rates of taxation applicable at the time of publication, which are subject to change from time to time. Expressions of opinion are those of HSBC only and are subject to change without notice. It does not have regard to specific investment objectives, financial situation and the particular needs of any specific person who may receive this document. Investors should seek financial advice regarding the appropriateness of investing in any securities or investment strategies that may have been discussed or recommended in this report and should understand that the views regarding future prospects may or may not be realized. Neither this document nor the units of HSBC Mutual Fund have been registered in any jurisdiction. The distribution of this document in certain jurisdictions may be restricted or totally prohibited and accordingly, persons who come into possession of this document are required to inform themselves about, and to observe, any such restrictions.
Investors should not invest in the Scheme solely based on the information provided in this document and should read the Scheme Information Document and Statement of Additional Information of the Fund for details. This document does not constitute an offering document.
No part of this publication may be reproduced, stored in a retrieval system, or transmitted, on any form or by any means, electronic, mechanical, photocopying, recording, or otherwise, without the prior written permission of HSBC Asset Management (India) Private Ltd.
Mutual Fund investments are subject to market risks, read all scheme related documents carefully.

HSBC Tax Saver Equity FundAn open ended Equity Linked Saving Scheme with a statutory lock-in of 3 years and tax benefit
Abridged Annual Report 2017 - 2018

1
Dear Investor,
Globally, we are witnessing a very interesting phase. The equity markets delivered a stellar performance in 2017. However, there are worries about the impact of higher rates, global trade wars, an economic growth moderation and higher volatility.
Closer home, India has become the world’s sixth-biggest economy. India has doubled its GDP to USD 2.2 trillion within a decade. The introduction of reform measures, including demonetisation and the Goods and Services Tax (GST), had put pressure on selective parts of the economy in 2017. The impact of these measures is likely to be transitory. India’s economic growth is expected to accelerate from 6.7% in FY18 to 7.4% in the current year as per IMF forecasts.
There has been a shift in the domestic savings pool supporting the market. Domestic investors have been increasing exposure to equities and financial assets moving away from gold and real estate. Mutual funds witnessed sizable inflows on the back of the boost in liquidity within the banking system from demonetisation. The AUM of the mutual fund industry grew by 21.7% in March 2018 compared to March 2017.
With growth, comes responsibility. Last year, the regulator, Securities and Exchange Board of India (SEBI) issued a circular to rationalise and categorise mutual fund schemes in India. We are pleased to state that none of our funds needed to be redesigned. All our schemes have been defined as per the new categorisation. We believe this classification will simplify investing into mutual funds and enhance comparability within the schemes offered.
As India moves to a digital age, e-commerce platforms are becoming increasingly popular. I request you to logon to our online transaction platform. It is a quick, convenient and an efficient tool to invest into our funds and manage your investments online.
At HSBC Global Asset Management, India, we are dedicated to one goal: delivering exceptional investment management for our clients. By bringing together our

2
global investment knowledge and capabilities, we are able to offer specialised expertise across asset classes. This has helped us to become a trusted partner to our individual and institutional investors.
We remain committed to our long-term perspective and disciplined investment approach as we conduct a rigorous, fundamental analysis of investments with a strong emphasis on risk management. Although the investment landscape appears favourable, it is worth remembering that markets are dynamic and constantly evolving. Therefore, we believe active, professional investment management serves investors well. Amid changing markets and economic conditions, we are confident that investors with a well-diversified portfolio and a patient, long-term outlook should be well positioned for the years ahead.
Together we thrive.
Warm regards,
Ravi Menon
Chief Executive Officer, HSBC Global Asset Management, India

3
SPONSORHSBC Securities and Capital Markets (India) Private LimitedRegd. Office: 52/60, Mahatma Gandhi Road, Fort, Mumbai - 400 001.
TRUSTEEBoard of TrusteesOffice: 16, Veer Nariman Road, Fort, Mumbai 400 001.
ASSET MANAGEMENT COMPANYHSBC Asset Management (India) Private LimitedCorp. & Regd. Office: 16, Veer Nariman Road, Fort, Mumbai 400 001.
CUSTODIANStandard Chartered Bank (SCB)Corp. & Regd. Office: Crescenzo, Securities Services, 3rd Floor, C-38/39, G-Block, Bandra Kurla Complex, Bandra East, Mumbai – 400051.
AUDITORS TO THE SCHEMEBSR & Co. LLPChartered Accountants 5th Floor, Lodha Excelus, Apollo Mills Compound, N.M. Joshi Marg, Mahalaxmi, Mumbai 400 011.
REGISTRAR & TRANSFER AGENTSComputer Age Management Services Private Limited (CAMS)Unit: HSBC Mutual Fund ’C’ Block, 2nd Floor, Hanudev Info Park P. Ltd., SF No. 558/2, Udayampalayam Road, Nava India, Coimbatore - 641 028.
BOARD OF TRUSTEESMr. Nasser Munjee
Mr. Manu Tandon
Mr. Mehli Mistri
Mr. Dilip J. Thakkar
Ms. Jasmine Batliwalla
Mr. Pedro Bastos
BOARD OF DIRECTORSMs. Kishori J. Udeshi - Chairperson
Mr. S. P. Mustafa
Mr. Dinesh Mittal
Mr. Ravi Menon - Chief Executive Officer

4
The Trustees of HSBC Mutual Fund (“Fund”) present the Sixteenth Annual Report and the audited abridged financial statements of the schemes of the Fund for the year ended March 31, 2018.
As at March 31, 2018, the Fund offered 30 schemes across asset classes to meet the varying investment needs of the investors. Notably, three Schemes of HSBC Mutual Fund viz. HSBC Large Cap Equity Fund, HSBC Short Duration Fund and HSBC Cash Fund have completed 15 years of operations during the year.
During the year, the Fund has launched Plan(s) under Fixed Term Series and carried out merger of the existing schemes viz HSBC Dividend Yield Equity Fund merged into HSBC Multi Cap Equity Fund (HMEF), erstwhile HSBC India Opportunities Fund, as offering sub-scale fund was not in the interest of the unitholders.
Further, in order to bring uniformity in the practice across Mutual Funds and to standardize the scheme categories and characteristics of schemes, SEBI vide its circular no. SEBI/HO/IMD/DF3/CIR/P/2017/114 dated October 06, 2017, issued guidelines for categorization and rationalization of Mutual Fund schemes.
Accordingly, HSBC Large Cap Equity Fund (erstwhile HSBC Equity Fund), HSBC Small Cap Equity Fund (erstwhile HSBC Mid Cap Equity Fund) , HSBC Infrastructure Equity Fund, HSBC Global Emerging Market Fund (erstwhile HSBC Emerging Market Fund), HSBC Debt Fund (erstwhile HSBC Income Fund – Investments Plan), HSBC Short Duration Fund (erstwhile HSBC Income Fund – Short Term Plan), HSBC Low Duration Fund (erstwhile HSBC Ultra Short Term Bond Fund), HSBC Regular Savings Fund (erstwhile HSBC Monthly Income Plan) and HSBC Managed Solutions have undergone fundamental attributes changes with effective from March 14, 2018.
The Fund continues its focus on delivering consistent long term returns. The comments on the performance of the Scheme(s) is provided hereinafter. Dividends were declared under various schemes as per the provisions contained in the respective Scheme Information Documents after considering the distributable surplus available under the respective Schemes. Details of dividends declared can be viewed on our website at www.assetmanagement.hsbc.com/in.
1. Scheme Performance, future outlook and oPerationS of the SchemeS
a. Operations and Performance of the Schemes
HSBC Tax Saver Equity Fund (HTSF) (An open ended Equity Linked Saving Scheme with a statutory lock-in of 3 years and tax benefit)
HTSF seeks to provide long term capital appreciation by investing in a diversified portfolio of equity & equity related instruments of companies across various sectors and industries, with no capitalization bias. The Fund may also invest in fixed income securities. However, there can be no assurance or guarantee that the investment objective of the scheme would be achieved.
The net assets of HTSF amounted to Rs. 169.04 crores as at March 31, 2018 compared to Rs 181.97 crores as at March 31, 2017. Around 99.58% of the net assets were invested in equities, 0.98% of the net assets were invested in reverse repos/CBLO and (-0.56%) in net current assets as at March 31, 2018.
HTSF outperformed its benchmark during most of the time periods except the last one year. Performance for the year was good but January-March period was bad due to significant correction in the mid-cap segment of the market which impacted the scheme negatively. Some of the themes which impacted the scheme were corporate private banks (as the asset quality improvement is taking longer time for improvement), cement (pricing scenario was weak due to sudden increase in competition), Building materials space (post GST the unorganized segment did better as the compliance was very weak thereby impact the organized players), being underweight in technology sector, etc. Some of these negative factors are transient and would turn positive. Also we have seen this year when the macro scenario has slightly become adverse there is a movement towards quality and defensives have done better. Going forward, the portfolio would be managed in a similar fashion of bottom up stock picking approach following our valuation - profitability framework of price to book/return on equity balanced by adequate risk management and we are confident that the performance would bounce back.
Trustees’ ReportFor the year ended March 31, 2018

5
Scheme Name & Benchmarks Absolute Returns
(%)
Compounded Annualized Returns (%)
Date of Inception : 5 January 2007 1 Year 3 Years 5 Years Since Inception
HSBC Tax Saver Equity Fund - Growth 10.81 11.11 18.27 12.16
S&P BSE 200 (Scheme Benchmark) 13.51 9.91 15.77 10.55
Nifty 50 (Standard Benchmark) 12.68 7.99 13.63 9.95
10,000, if invested in HTSF, would have become 11,081 13,725 23,151 36,293
10,000, if invested in S&P BSE 200, would have become 11,351 13,284 20,804 30,852
10,000, if invested in Nifty 50 , would have become 11,268 12,599 18,950 29,023
Past performance may or may not be sustained in future. The returns for the respective periods are provided as on last business day of March 2018 for Growth Option. Different plans shall have a different expense structure. As TRI data is not available Since Inception of the scheme, benchmark performance is calculated using composite CAGR of S&P BSE 200 PRI values from date 5-Jan-2007 to date 29-Jun-2007 and TRI values since date 29-Jun-2007.
b. Market Overview & Outlook (as furnished by HSBC Asset Management (India) Private Limited)
EqUITY OUTLOOKIndian equity markets continued to remain strong during fiscal year 2017-18 and posted gains of 11.76% by S&P CNX Nifty and 13.24% by BSE Midcap index respectively. Biggest drivers of the markets were, robust DII flow into equities, continued push of mega reforms – Goods and Services Tax (GST) implementation, Insolvency and Bankruptcy Code implementation, Real Estate (Regulation and Development) Act, second consecutive normal monsoon, and electoral victories of the ruling party in many state elections. On the other hand, the markets weather the storm of disruption in economy due to GST implementation, lingering impact of demonetization, muted FII flows, and rising yields in developed markets. Domestic Mutual Fund segment had their best ever year and they brought in ~USD 22 bn of net inflows in equities during the year. Even after witnessing ~USD 4.3 bn of net outflows from the domestic insurers, the net DII tally was a very impressive ~USD 17.7 bn of net inflows. There were mixed global cues well and the Foreign Institutional Investors (FIIs) net bought Indian equities worth USD 3.2 bn. The inflows by both FIIs and domestic MFs acted as a factor in the strong market performance.
Indices Returns (April 1, 2017 to March 31, 2018) 1 Year (%)
S&P BSE Sensex 12.70%
NSE CNX Nifty 11.76%
S&P BSE 100 12.12%
S&P BSE 200 12.49%
S&P BSE 500 13.21%
S&P BSE Midcap 14.31%
S&P BSE 250 Small-cap 14.13%
Source: Bloomberg (All values are total return)
Our view on the key aspects related to equity markets are presented below -
The impressive performance in equity markets during FY 2017-18 has come on the back of strong liquidity largely by domestic MFs but supported in party by FII flows, positive global growth, benign macro – both domestically and global, expectation of the continuation of favorable policy environment domestically and expectation of corporate earnings revival. Possibility of sound macro, economic reforms and implementation of existing reforms have increased, especially after continued success of the ruling party at the centre in state
Trustees’ ReportFor the year ended March 31, 2018 (Contd...)

6
elections. However, after this strong performance in markets and rather long wait for earnings to be delivered has meant that the equity markets are currently trading above their historical averages.
Moving into FY 2018-19, we expect a continuation of the economic recovery process domestically, recovery in corporate earnings - led early by volume growth, and continued DII flows. Government led investment spending and rural consumption are likely to lead with private sector investments contributing later (possibly after general elections 2019). The budget document that was presented in early February provides a good medium term policy direction for the economy. Occasionally the policy actions can serve up a few bumps and jolts but over the medium term, across different governments, there is a thread of continuity connecting many key economic policies such as in the case of this year’s union budget. We, in our investment process, prefer to take comfort in these threads of continuity and remain constructive on the India growth story. This makes us positive on the Indian equity markets over the medium to long term.
Risks are in the form of market valuations trending above historical averages, weaker than expected delivery in corporate earnings going forward, external news flows related to trade protectionism, developed market central banks raising rates prematurely, and geopolitical tensions and other eco-political events would also influence market performance going forward, as the recent rally in the markets was supported by strong FII inflows.
DEBT OUTLOOKFixed Income in Financial Year 2017-18 has seen volatility further step up in this year. Markets went to perfect storm with higher crude prices, low liquidity and pressure on currency, apart from rate hike expectations.
Inflation has followed the glide path to lower numbers towards 4% RBI target and even lower than the target number when inflation printed a lowly 1.46% in June 2018 on back of lower food prices. RBI went for a cut despite of neutral stance. This positivity continued till until crude shock came in form of higher crude process. Global prices of Brent crude saw substantial increase in second half of the year, which jeopardized the inflation path. Other worries that gathered around this time were related to GST collection and eventual impact on fiscal situation.
Government of India allowed the fiscal deficit to slip to 3.5% (budget 3.2%) and kept next year target at 3.3% (in place of earlier path of 3%). This was on back of some excise relaxation for oil products and a month less collected for GST due to implementation in the current year. The fear of fiscal slippage alongwith the announcement of higher bond issuances spooked the bond markets into higher yields. Government finally borrowed only INR 90 bln extra (in place of INR 500 bln announced initially).
On the Monetary front the year was very volatile as well. RBI changed its stance to neutral causing some worry around rate hikes. Thereafter it cut rates and again went for OMO sales operations simultaneously. This created some confusion in the market participants regarding rates direction. Finally extra supply, higher oil prices and higher inflation paved way for rates higher. RBI also held position on regulatory forbearance about spreading out losses by banks publicly. It eventually gave up the position in the end of March. However, the swift changes in stance caused lot of pressure and volatility in bonds.
Liquidity situation continuously deteriorated due to OMO sales initially and withdrawal of deposits due to remonetisation. Further liquidity was absorbed out due to portfolio outflows and reduction in reserves. Despite of defense from RBI utilizing the reserves, the currency depreciated meaningfully, which caused further jitters in foreign investor sentiments. Lack of liquidity also affected 1-3 year rates which were elevated in second half of the year.
Going forward following are key variables to watch out for:• Liquidity: Liquidity will drive short end rates and eventually drive decisions leading to market interventions
and CRR cuts. RBI has focused now on neutral liquidity stance and providing liquidity to system, which will bode well short end rates.
• Inflation: Inflation numbers will determine future course of action for RBI and remains a critical variable for policy. We expect inflation to remain at 4.7% level in the ease in second half of FY 2018-19 in line with RBI’s expectations.
• Growth: GDP growth numbers as well as industrial activity will also determine the decision on policy.
• Fiscal deficit: Fiscal deficit and government spending will determine the government borrowing and crowding out in interest rate curve. We expect prudence in government spending and prospect of spending on infrastructure to pick up which will crowd in private investment as well.
Trustees’ ReportFor the year ended March 31, 2018 (Contd...)

7
• Current Account Deficit: Current Account Deficit determines how the pressure on currency works and effective management of forex reserves.
• Currency levels: Level of INR will determine how the central bank reacts to the situation on the global crisis etc.
2. Brief Background of SPonSorS, Board of truSteeS and aSSet management comPany
a. Sponsor
HSBC Mutual Fund is sponsored by HSBC Securities and Capital Markets (India) Private Limited (HSCI). The Sponsor is the Settler of the Mutual Fund Trust. The Sponsor has entrusted a sum of Rs. 1,00,000 (Rupees One Lakh only) to the Trustee as the initial contribution towards the corpus of the Mutual Fund.
HSCI offers integrated investment banking services, securities and corporate finance & advisory. HSCI is a member of the Bombay Stock Exchange Limited and National Stock Exchange (capital and derivative market segments). HSCI holds 100% of the paid up equity share capital of HSBC Asset Management (India) Private Limited.
b. HSBC Mutual Fund
HSBC Mutual Fund (“the Mutual Fund” or “the Fund”) has been constituted as a Trust in accordance with the provisions of the Indian Trusts Act, 1882 (2 of 1882) vide a Trust Deed dated February 7, 2002 with HSBC Securities and Capital Markets (India) Private Limited, as the Sponsor and the Board of Individual Trustees. The Trustee has entered into an Investment Management Agreement dated February 7, 2002 with HSBC Asset Management (India) Private Limited (AMC) to function as the Investment Manager for all the schemes of the Fund. The Fund was registered with SEBI vide registration number MF/046/02/5 dated May 27, 2002.
The Trust has been formed for the purpose of pooling of capital from the public for collective investment in securities for the purpose of providing facilities for participation by persons as beneficiaries in such investments and in the profits/income arising therefrom.
c. Board of Trustees (the Trustees)
The Board of Trustees is the exclusive owner of the Trust Fund and holds the same in trust for the benefit of the unit holders. The Trustees have been discharging their duties and carrying out the responsibilities as provided in the SEBI (Mutual Funds) Regulations, 1996 and the Trust Deed. The Trustees seek to ensure that the Fund and the schemes floated there under are managed by the AMC in accordance with the Trust Deed, the said Regulations, directions and guidelines issued by the SEBI, the Stock Exchanges, the Association of Mutual Funds in India and other regulatory agencies.
d. Asset Management Company (the AMC)
HSBC Asset Management (India) Private Limited (the Investment Manager or the AMC) is a private limited company incorporated under the Companies Act, 1956 on December 12, 2001 having its Registered Office at 16, V. N. Road, Fort, Mumbai 400 001. HSBC Asset Management (India) Private Limited has been appointed as the Asset Management Company of HSBC Mutual Fund by the Trustee vide Investment Management Agreement (IMA) dated February 7, 2002 and executed between the Trustees and the AMC. SEBI approved the AMC to act as the Investment Manager of the Fund vide its letter No. MFD/BC/163/2002 dated May 27, 2002. The paid-up equity share capital of the AMC is Rs. 61.59 crores. The AMC is registered as a Portfolio Manager under the SEBI (Portfolio Managers) Regulations, 1993 vide registration no. INP000001322. The AMC also offers non-binding Advisory services to offshore funds under the mutual fund license.
HSBC Securities and Capital Markets (India) Private Limited holds 100% of the paid up equity share capital of the AMC.
3. inveStment oBjective of the SchemeS The investment objective of the respective schemes has been provided above under the heading “Scheme
Performance, Future Outlook and Operation of the Scheme” (Refer Section 1).
Trustees’ ReportFor the year ended March 31, 2018 (Contd...)

8
4. Significant accounting PolicieS The Significant Accounting Policies form part of the Notes to the Accounts annexed to the Balance Sheet
of the Schemes in the Full Annual Report. The accounting policies are in accordance with Securities Exchange Board of India (Mutual Funds) Regulations 1996.
5. unclaimed dividendS & redemPtionS Summary of number of investors & corresponding amount Scheme-wise as on March 31, 2018.
SchemeUnclaimed Dividend Unclaimed Redemption
Amount (Rs.) No. of Investors
Amount (Rs.) No. of Investors
HSBC Tax Saver Equity Fund 5,753,342.06 1309 4,324,905.15 163
6. inveStor ServiceSThe number of official points of acceptance of transactions is 205 locations. In addition to the offices of the Registrar & Transfer agents, the AMC has Investor Service Centres in 9 locations at its own offices - namely Mumbai, New Delhi, Kolkata, Bangaluru, Pune, Ahmedabad, Hyderabad, Chandigarh and Chennai. With a view to enhance customer convenience, the AMC has the facility of priority based servicing to key distributors through the enhancement of the Interactive Voice Reponses. The AMC has a single Toll Free number which can be dialed from anywhere in India. The call centre service is being managed by the Registrar and Transfer Agents.
On the distribution front, the number of empanelled distributors was 460 as on March 31, 2018. During the year, the AMC initiated tie-ups for online distribution of the Mutual Fund’s schemes with several channel partners taking the total number of such tie-ups to 42.
7. detailS of inveStor grievance redreSSalThe details of the redressal of investor complaints received against HSBC Mutual Fund during April 2017 - March 2018 are as follows:
2017-2018
Com- plaint Code
Type of complaint (a) No. of complaints
pending at the
beginning of the year
(b) No. of complaints received during
the year
Action on (a) and (b)
Resolved Non Actiona-
ble*
Pending
Within 30
days
30 - 60 days
60 - 180 days
Beyond 180 days
0 - 3 months
3 - 6 months
6 - 9 months
9 - 12 months
I A Non receipt of Dividend on Units
0 5 4 1 0 0 0 0 0 0 0
I B Interest on delayed payment of Dividend
0 0 0 0 0 0 0 0 0 0 0
I C Non receipt ofRedemption Proceeds
1 12 12 1 0 0 0 1 0 0 0
I D Interest on delayedp a y m e n t o f Redemption
0 1 1 0 0 0 0 0 0 0 0
II A Non receipt of Statement of Account / Unit Certificate
0 0 0 0 0 0 0 0 0 0 0
II B D i s c r e p a n c y i n Statement of Account
0 0 0 0 0 0 0 0 0 0 0
II C Data corrections in Investor details **
0 34 34 0 0 0 0 0 0 0 0
Trustees’ ReportFor the year ended March 31, 2018 (Contd...)

9
2017-2018
Com- plaint Code
Type of complaint (a) No. of complaints
pending at the
beginning of the year
(b) No. of complaints received during
the year
Action on (a) and (b)
Resolved Non Actiona-
ble*
Pending
Within 30
days
30 - 60 days
60 - 180 days
Beyond 180 days
0 - 3 months
3 - 6 months
6 - 9 months
9 - 12 months
II D Non receipt of Annual Report /Abridged Summary
0 0 0 0 0 0 0 0 0 0 0
III A Wrong switch between Schemes
0 0 0 0 0 0 0 0 0 0 0
III B Unauthorized switch between Schemes
0 0 0 0 0 0 0 0 0 0 0
III C Deviation from Scheme attributes
0 0 0 0 0 0 0 0 0 0 0
III D Wrong or excess charges / load
0 0 0 0 0 0 0 0 0 0 0
III E Non updat ion of changes viz. address, PAN, bank details, nomination, etc
0 6 6 0 0 0 0 0 0 0 0
IV Others 1 41 42 0 0 0 0 0 0 0 0
Total 2 99 99 2 0 0 0 0 0 0 0
Summary of Complaints for FY 2017-18
Particulars Count
Total complaints received 99
Total number of folios 140099
% of complaints against the folio 0.071%
# active folios** As per AMFI Best Practice Guidelines Circular No.25/2011-12 for Revisions in the Guidelines on
Standardization of Complaints/Grievances Reporting Procedure. If “Others” include a type of complaint which is more than 10% of overall complaints, then such a reason should be provided separately. Hence data corrections in Investor Details is included as a separate category
* Non actionable means the complaint is incomplete / outside the scope of the mutual fund
8. inveStor education initiativeS The Fund undertook various investor education and awareness initiatives related to investments in mutual funds throughout India in English / Hindi and Regional languages via mass media. The Fund conducted 16 roadshows at various locations in India to promote various Investor Awareness related topics including Asset Allocation, SIPs, Equity Mutual Funds and Financial Planning. The Fund has a Year-long tie-up with Mutual Fund Insights Magazine that includes 3 pages of content and advertorial publication in their monthly issue. Each issue contains a story promoting SIPs to achieve one’s various investment goals. In the month of December 2017 and January 2018 investor awareness promotion was done through Outlook and Outlook Money magazines through advertorials on various Mutual Fund topics.
9. Proxy voting PolicyIn terms of SEBI Circular no. SEBI/IMD/CIR No. 18/198647/2010 dated March 15, 2010, the Fund has adopted Proxy Voting Policy and Procedures for exercising voting rights in respect of securities held by the Schemes.
Trustees’ ReportFor the year ended March 31, 2018 (Contd...)

10
Trustees’ ReportFor the year ended March 31, 2018 (Contd...)
The summary of the votes casted in the general meetings of the Investee companies, by the AMC for and on behalf of the Schemes of the Fund, for the financial year 2017-18 is provided below:
quarter Total no. of resolutions
Break-up of vote decision
For Against Abstained
June 2017 184 116 5 63
September 2017 920 827 12 81
December 2017 49 45 1 3
March 2018 36 29 1 6
Total 1,189 1,017 19 153
In terms of the requirement of SEBI Circular no. CIR/IMD/DF/05/2014 dated March 24, 2014 and SEBI/HO/IMD/DF2/CIR/P/2016/68 dated August 10, 2016; the AMC has obtained certificate from M/s. M. P. Chitale & Co., Chartered Accountants, who is acting as a Scrutinizer, on the voting report for the FY 2017-18. The certificate dated May 3, 2018 issued by M/s. M. P. Chitale & Co., is available on the website of the AMC as part of the full Annual Report.
Unit holders can refer to the full Annual Report for complete details of actual exercise of votes in the general meetings of the investee companies for the financial year 2017-18 or log on to our website at www.assetmanagement.hsbc.com/in.
10. Statutory detailSa) The Sponsors are not responsible or liable for any loss resulting from the operation of the Schemes of
the Fund beyond initial contribution of Rs. 1 lakh for setting up the Fund.
b) The price and redemption value of the units, and income from them, can go up as well as down with fluctuations in the market value of its underlying investments.
c) Full Annual Report shall be disclosed on the website at www.assetmanagement.hsbc.com/in and shall be available for inspection at the Head Office of the Mutual Fund. Present and prospective unit holders can obtain copy of the Trust Deed, the full Annual Report of the Scheme(s), the Annual Report of HSBC Asset Management (India) Private Limited and the text of the relevant Scheme(s) at a price.
11. acknowledgementSThe Trustees wish to thank the Unit holders of the Schemes for their support throughout the year and also thank the Government of India, the Securities and Exchange Board of India (SEBI), the Reserve Bank of India (RBI) and the Association of Mutual Funds in India (AMFI) for the guidance provided by them. The Trustees also appreciate the services provided by the Registrar and Transfer Agent, Fund Accountant, Custodian, Bankers, Distributors and Brokers. The guidance and services provided by the Auditors and advocates and the ebullience, sincerity and dedication of the employees of HSBC Asset Management (India) Private Limited is also appreciated.
The Trustees look forward to the continued support of everyone.
For and on behalf of the Board of Trustees of HSBC Mutual Fund
Sd/-
Dilip Thakkar
Trustee
Mumbai
July 17, 2018.

11
To the Board of Trustees
HSBC Mutual Fund – HSBC Tax Saver Equity Fund
Report on the Financial StatementsWe have audited the accompanying Financial Statements of HSBC Tax Saver Equity Fund (the ‘Scheme’), which comprise the balance sheet as at 31 March 2018 and the related revenue account for the year then ended, and a summary of significant accounting policies and other explanatory information, annexed thereto.
Management’s responsibility for the Financial StatementsThe Board of Trustees to the HSBC Mutual Fund (the ‘Board of Trustees’) and HSBC Asset Management (India) Private Limited (the ‘AMC’), being the investment manager to HSBC Mutual Fund (the ‘Fund’) (collectively referred as ‘Management’), are responsible for the preparation of these financial statements that give a true and fair view of the financial position and financial performance of the Scheme in accordance with the accounting policies and standards specified in the Ninth Schedule of the Securities and Exchange Board of India (Mutual Funds) Regulations, 1996, as amended (the ‘Regulations’) and the accounting principles generally accepted in India. This responsibility includes maintenance of adequate accounting records for safeguarding of the assets of the Scheme and for preventing and detecting frauds and other irregularities; selection and application of appropriate accounting policies; making judgments and estimates that are reasonable and prudent; and design, implementation and maintenance of adequate internal financial controls, that were operating effectively for ensuring the accuracy and completeness of the accounting records, relevant to the preparation and presentation of the financial statements that give a true and fair view and are free from material misstatement, whether due to fraud or error.
In preparing the financial statements, management is responsible for assessing the Scheme’s ability to continue as a going concern, disclosing, as applicable, matters related to going concern and using the going concern basis of accounting unless management either intends to liquidate the Fund or to cease operations, or has no realistic alternative but to do so.
Auditor’s responsibilityOur responsibility is to express an opinion on these financial statements based on our audit. We conducted our audit in accordance with the Standards on Auditing issued by the Institute of Chartered Accountants of India (the ‘ICAI’). Those Standards require that we comply with ethical requirements and plan and perform the audit to obtain reasonable assurance about whether the financial statements are free from material misstatement.
An audit involves performing procedures to obtain audit evidence about the amounts and disclosures in the financial statements. The procedures selected depend on the auditor’s judgment, including the assessment of the risks of material misstatement of the financial statements, whether due to fraud or error. In making those risk assessments, the auditor considers internal controls relevant to preparation and fair presentation of the financial statements, of the Scheme, in order to design audit procedures that are appropriate in the circumstances, but not for the purpose of expressing an opinion on the effectiveness of the Scheme’s internal controls. An audit also includes evaluating the appropriateness of accounting policies used and the reasonableness of the accounting estimates made by Management, as well as evaluating the overall presentation of the financial statements.
We are also responsible to conclude on the appropriateness of management’s use of the going concern basis of accounting and, based on the audit evidence obtained, whether a material uncertainty exists related to events or conditions that may cast significant doubt on the Scheme’s ability to continue as a going concern. If we conclude that a material uncertainty exists, we are required to draw attention in the auditor’s report to the related disclosures in the financial statements or, if such disclosures are inadequate, to modify the opinion. Our conclusions are based on the audit evidence obtained up to the date of the auditor’s report. However, future events or conditions may cause the Scheme to cease to continue as a going concern.
We believe that the audit evidence we have obtained is sufficient and appropriate to provide a basis for our audit opinion.
Independent Auditors’ Report

12
Independent Auditors’ Report (Contd...)
OpinionIn our opinion, and to the best of our information and according to the explanations given to us, the aforesaid financial statements give the information required by the Regulations in the manner so required and give a true and fair view in conformity with the accounting principles generally accepted in India:
(i) in the case of the balance sheet, of the state of affairs of the Scheme as at 31 March 2018; and
(ii) in the case of the revenue account, of the net surplus for the year ended on that date.
Report on other Legal and Regulatory Requirements1 As required by Regulation 55(4) to the Regulations, we report that:
(a) We have obtained all information and explanations which, to the best of our knowledge and belief, were necessary for the purposes of the audit;
(b) The balance sheet and revenue account have been prepared in accordance with the accounting policies and standards specified in the Ninth Schedule of the Regulations.
2 As required by Clause 5(ii)(2) of the Eleventh Schedule of the Regulations, we report that the balance sheet and revenue account are in agreement with the books of account of the Scheme.
3 In our opinion and on the basis of information and explanations given to us, the methods used to value non - traded securities, as at 31 March 2018, as determined by the Board of Directors of AMC, are in accordance with the Regulations and other guidelines issued by the Securities and Exchange Board of India as applicable and approved by the Board of Trustees are fair and reasonable.
For B S R & Co. LLP Chartered Accountants Firm’s Registration No: 101248W/W-100022
Sd/-
Milind Ranade Partner Membership No: 100564
Place : Mumbai Date : July 17, 2018.

13
Rs. in Lakhs
HSBC TAX SAVER EqUITY FUNDAs at
March 31, 2018As at
March 31, 2017
LIABILITIES1 Unit Capital 5,451.63 6,257.442 Reserves & Surplus2.1 Unit Premium Reserves (3,364.37) (3,138.29)2.2 Unrealised Appreciation Reserve 3,663.77 4,371.932.3 Other Reserves 11,153.46 10,699.033 Loans & Borrowings – –4 Current Liabilities & Provisions4.1 Provision for doubtful Income/Deposits – –4.2 Other Current Liabilities & Provisions 214.27 197.22
TOTAL 17,118.76 18,387.33
ASSETS1 Investments1.1 Listed Securities:1.1.1 Equity Shares 16,831.19 17,684.681.1.2 Preference Shares – –1.1.3 Equity Linked Debentures – –1.1.4 Other Debentures & Bonds – –1.1.5 Securitised Debt securities – –1.2 Securities Awaited Listing:1.2.1 Equity Shares – – 1.2.2 Preference Shares – – 1.2.3 Equity Linked Debentures – – 1.2.4 Other Debentures & Bonds – – 1.2.5 Securitised Debt securities – – 1.3 Unlisted Securities1.3.1 Equity Shares – – 1.3.2 Preference Shares – – 1.3.3 Equity Linked Debentures – – 1.3.4 Other Debentures & Bonds1.3.5 Securitised Debt securities – – 1.4 Government Securities – – 1.5 Treasury Bills – – 1.6 Commercial Paper – – 1.7 Certificate of Deposits – – 1.8 Bill Rediscounting – – 1.9 Units of Domestic Mutual Fund – – 1.10 Foreign Securities – –
Total Investments 16,831.19 17,684.68
2 Deposits 1.13 1.593 Other Current Assets3.1 Cash & Bank Balance 6.07 14.603.2 CBLO/Reverse Repo Lending 166.06 157.533.3 Others 114.31 528.934 Deferred Revenue Expenditure (to the extent not written off) – –
TOTAL 17,118.76 18,387.33
Notes to Accounts - Annexure I
Abridged Balance Sheet as at March 31, 2018

14
Abridged Revenue Account for the year ended March 31, 2018
Rs. in Lakhs
HSBC TAX SAVER EqUITY FUNDCurrent
Year ended March 31, 2018
Previous Year ended
March 31, 2017
1 INCOME1.1 Dividend 199.83 153.431.2 Interest 14.98 23.621.3 Realised Gain / (Loss) on Foreign Exchange Transactions – –1.4 Realised Gains / (Losses) on Interscheme sale of investments – –1.5 Realised Gains / (Losses) on External sale / redemption of
investments2,774.96 2,698.24
1.6 Realised Gains / (Losses) on Derivative Transactions – –1.7 Other Income – –
(A) 2,989.77 2,875.29
2 EXPENSES2.1 Management fees 308.25 295.432.2 Service tax on Management fees 53.28 44.062.3 Transfer agents fees and expenses 24.22 21.312.4 Custodian fees 2.27 2.072.5 Trusteeship fees 0.48 0.372.6 Commission to Agents 127.22 114.452.7 Marketing & Distribution expenses 0.14 0.492.8 Audit fees 1.00 1.062.9 Investor Education Expenses 3.72 3.442.10 Other operating expenses 4.83 6.302.11 Less:Expenses to be Reimbursed by the Investment Manager – –
(B) 525.41 488.98
3 NET REALISED GAINS / (LOSSES) FOR THE YEAR (A – B = C) 2,464.36 2,386.31
4 Change in Unrealised Depreciation in value of investments and derivatives (D) – –
5 NET GAINS / (LOSSES) FOR THE YEAR [E = (C + D)] 2,464.36 2,386.31
6 Change in unrealised appreciation in the value of investments and derivatives (F) (708.16) 2,258.93
7 NET SURPLUS / (DEFICIT) FOR THE YEAR (E + F = G) 1,756.20 4,645.24
7.1 Add: Balance transfer from Unrealised Appreciation Reserve 708.16 –7.2 Less: Balance transfer to Unrealised Appreciation Reserve – 2,258.937.3 Add / (Less): Equalisation (1,500.17) (1,366.65)
7.4 Transfer from Reserve Fund 10,699.03 10,027.60
8 Total 11,663.22 11,047.26
9 Dividend appropriation9.1 Income Distributed during the year 509.76 348.239.2 Tax on income distributed during the year – –
10 Retained Surplus / (Deficit) carried forward to Balance sheet 11,153.46 10,699.03
Notes to Accounts - Annexure I

15
Key Statistics for the year ended March 31, 2018
HSBC TAX SAVER EqUITY FUND Current
Year ended March 31, 2018
Previous Year ended
March 31, 2017
1. NAV per unit (Rs.):
Open
Regular Plan Growth Option 33.1854 25.4025
Regular Plan Dividend Option 22.0461 18.0472
Direct Plan - Growth Option 34.2301 26.0174
Direct Plan - Dividend Option 22.9142 18.5799
High
Regular Plan Growth Option 40.8995 33.1854
Regular Plan Dividend Option 27.1709 23.1073
Direct Plan - Growth Option 42.4312 34.2301
Direct Plan - Dividend Option 28.4040 23.9550
Low
Regular Plan Growth Option 33.2459 24.6506
Regular Plan Dividend Option 17.1772 17.5131
Direct Plan - Growth Option 22.8397 25.2508
Direct Plan - Dividend Option 17.6335 18.0324
End
Regular Plan Growth Option 36.2798 33.1854
Regular Plan Dividend Option 21.8184 22.0461
Direct Plan - Growth Option 37.6887 34.2301
Direct Plan - Dividend Option 22.9431 22.9142
2. Closing Assets Under Management (Rs. in Lakhs)
End 16,904 18,197
Average (AAuM)1 18,582 17,217
3. Gross income as % of AAuM2 16.09% 16.70%
4. Expense Ratio:
a. Total Expense as % of AAuM (Including service tax / GST on Management fees) (planwise)
Regular Plan (Continue) 2.84% 2.85%
Direct Plan 2.13% 2.14%
b. Management Fee as % of AAuM (planwise)
Regular Plan (Continue) 1.63% 1.72%
Direct Plan 1.63% 1.72%
5. Net Income as a percentage of AAuM3 13.26% 13.86%
6. Portfolio turnover ratio4 0.49 0.63

16
HSBC TAX SAVER EqUITY FUND Current
Year ended March 31, 2018
Previous Year ended
March 31, 2017
7. Total Dividend per unit distributed during the year (planwise)
Retail
Regular Plan Dividend Option 2.50 1.50
Direct Plan - Dividend Option 2.50 1.50
Corporate
Regular Plan Dividend Option 2.50 1.50
Direct Plan - Dividend Option 2.50 1.50
8. Returns (%):
a. Last One Year
Scheme
Regular Plan Growth Option 10.8143 30.6383
Direct Plan - Growth Option 11.6037 31.5662
Benchmark
S&P BSE 200 13.5100 22.4731
b. Since Inception
Scheme
Regular Plan Growth Option 12.1585 12.4264
Direct Plan - Growth Option 16.4705 17.9834
Benchmark
S&P BSE 200 10.5500 8.9235
1. AAuM=Average daily net assets.2. Gross income = amount against (A) in the Revenue Account i.e. Income.3. Net income = amount against (C) in the Revenue Account i.e. Net Realised Gains / (Losses) for the year.4. Portfolio Turnover = Lower of sales or purchase divided by the Average AuM for the year.5. The net asset value disclosed represents the computed NAV on March 31, 2018 (Non-business Day),
and not the last declared NAV
Key Statistics for the year ended March 31, 2017 (Contd...)

17
Notes to Accounts – Annexure ITo the Abridged Balance Sheet and Revenue Account for the Year ended March 31, 2018
HSBC TAX SAVER EqUITY FUND
1 Investments:
1.1. It is confirmed that investments of the Schemes are registered in the name of the Trustees for the benefit of the Scheme’s unitholders.
1.2. Open Positions of derivatives as of years ended March 31, 2018 and March 31, 2017 are NIL
1.3. Investments in Associates and Group Companies are as under :
(Rupees)
Issuer Instrument Type
Amount Aggregate Investments
by all schemes
Amount Aggregate Investments
by all schemes
2018 2017
Shriram Transport Finance Company Ltd.
Corporate Bonds / Debentures
– 651,317,500 – 1,452,436,300
Equities – – – 94,659,583
Bharti Airtel Ltd. Equities 62,906,242 369,136,950 – 1,025,985
Balrampur Chini Mills Ltd.
Equities 28,839,643 125,227,938 – –
1.4. Open position of Securities Borrowed and / or Lent by the Scheme as of the years ended 31 March, 2018 and March 31, 2017 are NIL.
1.5. NPAs as at years ended March 31, 2018 and March 31, 2017 are NIL.
1.6. Aggregate Unrealised Gain / Loss as at the end of the Financial year and their percentages to net assets are as under:
Company Name Amount (Rs.) Percentage to Net Assets
Amount (Rs.) Percentage to Net Assets
2018 2017
Equity Shares
– Appreciation 432,626,573 25.59 474,804,951 26.09
– Depreciation 66,249,785 3.92 37,612,098 2.07
1.7. The aggregate value of investments securities (excluding CBLO and Reverse Repos) purchased and sold (including matured) during the financial year 2017-18 (excluding accretion of discount) is Rs. 915,391,307 and Rs. 1,207,431,021 respectively being 49.26% and 64.28% of the average daily net assets.
The aggregate value of investments securities (excluding CBLO and Reverse Repos) purchased and sold (including matured) during the financial year 2016-17 (excluding accretion of discount) is Rs. 1,086,271,967 and Rs. 1,406,333,513 respectively being 63.09% and 81.69% of the average daily net assets.
1.8. Non-Traded securities in the portfolio of the Scheme as of the Years ended March 31, 2018 and March 31, 2017 are NIL

18
2 Disclosure Under Regulation 25(8) of the Securities and Exchange Board of India (Mutual Funds) Regulations, 1996 as amended
Details of amounts paid to associates in terms of Regulation 25 (8) are as follows :
Commission paid to Sponsor/AMC and its associates/related parties/group companies
Name of Sponsor/AMC and its associates/related parties/group companies
Nature of Association / Nature of
Relation
Period Covered
Business Given [Rs. In Crores]
% of Total Business
received by the Fund
Commission paid [Rs.]
% of Total commission paid by the
Fund
The Hongkong and Shanghai Banking Corporation Limited
Associate of Investment Manager
2017-2018 2.38 34.02 618,144 5.22
Name of Sponsor/AMC and its associates/related parties/group companies
Nature of Association / Nature of
Relation
Period Covered
Business Given [Rs. In Crores]
% of Total Business
received by the Fund
Commission paid [Rs.]
% of Total commission paid by the
Fund
The Hongkong and Shanghai Banking Corporation Limited
Associate of Investment Manager
2016-2017 0.96 18.38 390,163 3.79
Brokerage paid to Sponsor/AMC and its associates/related parties/group companies
Name of Sponsor/AMC and its associates/related parties/group companies
Nature of Association /Nature of
relation
Period Covered
Value of Transactions
[Rs. In Crores]
% of total value of
transactions of the fund
Brokerage paid [Rs. ]
% of total brokerage paid by the
fund
HSBC Securities and Capital Market (India) Private Limited
Sponsor 2017-2018 7.82 3.68 69,599 2.78
Name of Sponsor/AMC and its associates/related parties/group companies
Nature of Association /Nature of
relation
Period Covered
Value of Transactions
[Rs. In Crores]
% of total value of
transactions of the fund
Brokerage paid [Rs. ]
% of total brokerage paid by the
fund
HSBC Securities and Capital Market (India) Private Limited
Sponsor 2016-2017 2.63 1.05 31,545 1.06
The brokerage paid was at rates similar to those offered to other brokers / distributors. The Commission / Brokerage paid to related party includes both upfront and trail and hence not comparable with the % of business brought and % of commission paid.
Further, The Hongkong and Shanghai Banking Corporation Limited, an associate of the Sponsor, is on the panel of bankers with whom HSBC Mutual Fund places money on fixed deposits and enters into reverse repo transactions from time to time at competitive rates.
Notes to Accounts – Annexure I (Contd...)To the Abridged Balance Sheet and Revenue Account for the Year ended March 31, 2018

19
(i) Any underwriting obligations undertaken by the schemes of the mutual funds with respect to issue of securities associate companies - Nil. (Previous year also Nil)
(ii) Devolvement - Nil. (Previous year also Nil)
(iii) Subscription by the schemes in the issues lead managed by associate companies - Nil. (Previous year also Nil)
(iv) Subscription to any issue of equity or debt on private placement basis where the sponsor or its associate companies have acted as arranger or manager - Nil. (Previous year also Nil)
3 None of the Investors held more than 25% of the total net assets of the Scheme at the years ended March 31, 2018 and March 31, 2017.
4 Unit Capital movement during the years ended March 31, 2018 and March 31, 2017:
Description
2017-2018
Opening Units Subscription Redemption Closing UnitsFace Value
per unit (Rupees)
Growth Option
38,645,003.163 979,332.051 5,941,649.620 33,682,685.594 10
Dividend Option
23,009,792.919 446,891.290 3,718,085.503 19,738,598.706 10
Direct Plan - Growth Option
725,813.137 179,856.032 47,214.573 858,454.596 10
Direct Plan - Dividend Option
193,797.262 70,871.964 28,127.938 236,541.288 10
Description
2016-2017
Opening Units Subscription Redemption Closing UnitsFace Value
per unit (Rupees)
Growth Option
44,160,495.610 863,365.911 6,378,858.358 38,645,003.163 10
Dividend Option
26,079,028.181 379,489.487 3,448,724.749 23,009,792.919 10
Direct Plan - Growth Option
646,815.360 163,110.181 84,112.404 725,813.137 10
Direct Plan - Dividend Option
164,419.463 41,924.891 12,547.092 193,797.262 10
** Units held by the AMC (Seed Capital) in Direct Plan Growth Option as on March 31, 2018 is 187,801.892 and as on March 31, 2017 is 187,801.892
5 Previous year’s figures have been re-grouped / re-arranged where appropriate.
6 No contingent liabilities for the years ended March 31, 2018 and March 31, 2017.
7 Expenses other than Management Fees are Inclusive of GST / Service Tax where applicable.
Notes to Accounts – Annexure I (Contd...)To the Abridged Balance Sheet and Revenue Account for the Year ended March 31, 2018

20
Notes to Accounts – Annexure I (Contd...)To the Abridged Balance Sheet and Revenue Account for the Year ended March 31, 2018
8 Other income for the years ended March 31, 2018 and March 31, 2017 is NIL .
9 Investor Education Awareness In view of the AMFI Best Practices Guidelines Circular No. 56/2015-16, the IEF ( Investor Education Fund)
accrual is set aside in a separate bank account and the consolidated balance across all schemes as on March 31, 2018. The break-up of which is as under:
March 31, 2018 March 31, 2017
Particulars Amount (in Rs. Lacs) Amount (in Rs. Lacs)
Opening Balance 44.00 –
Add: Accrual during the year 219.83 182.34
Less: Transferred to AMFI 101.10 83.24
Less: Payable to AMFI (March accrual) 8.81 7.93
Add: Investment Income for the year 8.28 11.24
Less: Spent during the year 43.17 58.41
Closing Balance 119.02 44.00
10 Categorization and Rationalization of schemes
Pursuant to SEBI circular no. SEBI/HO/IMD/DF3/CIR/P/2017/114 dated October 6, 2017 and SEBI circular no. SEBI/HO/IMD/DF3/CIR/P/2017/126 dated December 4, 2017 on ‘Categorization and Rationalization of schemes’, fundamental attribute related changes were carried out in certain schemes of HSBC Mutual Fund to align the same with the requirements specified in the aforesaid circulars effective from March 14, 2018. The said changes have been approved by the Board of Directors of the HSBC Asset Management (India) Pvt. Ltd. (the AMC) and the Board of Trustees (the Trustees). SEBI vide its letter no. IMD/DF3/OW/P/2018/89/1 dated January 2, 2018 has also conveyed it’s no objection to the said changes.
A notice-cum-addendum providing details of changes in the fundamental attributes of certain schemes was published in the newspaper on February 3, 2018 and is also available on the website of the AMC at www.assetmanagement.hsbc.com/in. The exit window period of 30 days was provided to the investors during which no exit load was charged to investors on switches/redemptions.
Apart from the fundamental attribute changes, there has been change in the ‘type of Scheme’ for all the open ended schemes and ‘name of Scheme’ in certain schemes for the purposes of alignment of the existing schemes with the provisions of the Circular. The details of the schemes impacted is provided below:
Existing Name Revised Name Fundamental Attribute change Benchmark Change
HSBC Tax Saver Equity Fund
HSBC Tax Saver Equity Fund
No No
11 The Annual Accounts of the Schemes prepared in accordance with the accounting policies and standards specified in the Ninth Schedule of The Securities and Exchange Board of India (Mutual Funds) Regulations, 1996 has been approved by the Board of Directors of HSBC Asset Management (India) Private Limited and The Board of Trustees of HSBC Mutual Fund at their meetings held on July 16, 2018 and July 17, 2018 respectively. The audit report attached herewith refers to the said Annual Accounts. The aforesaid abridged accounts are an extract of the Annual Accounts and are prepared in accordance with SEBI Circular No. IMD/Cir8/132968/2008 dated July 24, 2008.

21
Voting Policy and Procedures
In view of SEBI guidelines related to “Role of Mutual Funds in Corporate Governance of Public Listed Companies”, AMIN has formulated its “Policy for Proxy Voting in Public Listed Companies”. The said policy and details of actual exercise of proxy votes along with the summary of votes cast and the auditors certification during the Financial Year 2017 – 18 is available on its website – http://www.assetmanagement.hsbc.com/in and in full Annual Report for the Financial Year 2017 – 18.

22
Statutory Details & Disclaimers
All returns have been sourced from Mutual Funds India Explorer software unless otherwise stated. With regard to equity schemes (including the equity component of MIPs), Fund performance is calculated on a total return basis (i.e. it includes dividends re-invested) while the benchmark is calculated on a price return basis (i.e. it does not consider dividends re-invested). This document has been prepared by HSBC Asset Management (India) Private Ltd (HSBC) for information purposes only and should not be construed as an offer or solicitation of an offer for purchase of any of the funds of HSBC Mutual Fund. All information contained in this document (including that sourced from third parties), is obtained from sources HSBC, the third party believes to be reliable but which it has not independently verified and HSBC, the third party makes no guarantee, representation or warranty and accepts no responsibility or liability as to the accuracy or completeness of such information. The information and opinions contained within the document are based upon publicly available information and rates of taxation applicable at the time of publication, which are subject to change from time to time. Expressions of opinion are those of HSBC only and are subject to change without notice. It does not have regard to specific investment objectives, financial situation and the particular needs of any specific person who may receive this document. Investors should seek financial advice regarding the appropriateness of investing in any securities or investment strategies that may have been discussed or recommended in this report and should understand that the views regarding future prospects may or may not be realized. Neither this document nor the units of HSBC Mutual Fund have been registered in any jurisdiction. The distribution of this document in certain jurisdictions may be restricted or totally prohibited and accordingly, persons who come into possession of this document are required to inform themselves about, and to observe, any such restrictions.
Investors should not invest in the Scheme solely based on the information provided in this document and should read the Scheme Information Document and Statement of Additional Information of the Fund for details. This document does not constitute an offering document.
No part of this publication may be reproduced, stored in a retrieval system, or transmitted, on any form or by any means, electronic, mechanical, photocopying, recording, or otherwise, without the prior written permission of HSBC Asset Management (India) Private Ltd.
Mutual Fund investments are subject to market risks, read all scheme related documents carefully.

HSBC Global Emerging Markets Fund (erstwhile HSBC Emerging Markets Fund)An open ended fund of fund Scheme investing in HSBC Global Investment Funds - Global Emerging Markets Equity Fund
Abridged Annual Report 2017 - 2018

1
Dear Investor,
Globally, we are witnessing a very interesting phase. The equity markets delivered a stellar performance in 2017. However, there are worries about the impact of higher rates, global trade wars, an economic growth moderation and higher volatility.
Closer home, India has become the world’s sixth-biggest economy. India has doubled its GDP to USD 2.2 trillion within a decade. The introduction of reform measures, including demonetisation and the Goods and Services Tax (GST), had put pressure on selective parts of the economy in 2017. The impact of these measures is likely to be transitory. India’s economic growth is expected to accelerate from 6.7% in FY18 to 7.4% in the current year as per IMF forecasts.
There has been a shift in the domestic savings pool supporting the market. Domestic investors have been increasing exposure to equities and financial assets moving away from gold and real estate. Mutual funds witnessed sizable inflows on the back of the boost in liquidity within the banking system from demonetisation. The AUM of the mutual fund industry grew by 21.7% in March 2018 compared to March 2017.
With growth, comes responsibility. Last year, the regulator, Securities and Exchange Board of India (SEBI) issued a circular to rationalise and categorise mutual fund schemes in India. We are pleased to state that none of our funds needed to be redesigned. All our schemes have been defined as per the new categorisation. We believe this classification will simplify investing into mutual funds and enhance comparability within the schemes offered.
As India moves to a digital age, e-commerce platforms are becoming increasingly popular. I request you to logon to our online transaction platform. It is a quick, convenient and an efficient tool to invest into our funds and manage your investments online.
At HSBC Global Asset Management, India, we are dedicated to one goal: delivering exceptional investment management for our clients. By bringing together our

2
global investment knowledge and capabilities, we are able to offer specialised expertise across asset classes. This has helped us to become a trusted partner to our individual and institutional investors.
We remain committed to our long-term perspective and disciplined investment approach as we conduct a rigorous, fundamental analysis of investments with a strong emphasis on risk management. Although the investment landscape appears favourable, it is worth remembering that markets are dynamic and constantly evolving. Therefore, we believe active, professional investment management serves investors well. Amid changing markets and economic conditions, we are confident that investors with a well-diversified portfolio and a patient, long-term outlook should be well positioned for the years ahead.
Together we thrive.
Warm regards,
Ravi Menon
Chief Executive Officer, HSBC Global Asset Management, India

3
SPONSORHSBC Securities and Capital Markets (India) Private LimitedRegd. Office: 52/60, Mahatma Gandhi Road, Fort, Mumbai - 400 001.
TRUSTEEBoard of TrusteesOffice: 16, Veer Nariman Road, Fort, Mumbai 400 001.
ASSET MANAGEMENT COMPANYHSBC Asset Management (India) Private LimitedCorp. & Regd. Office: 16, Veer Nariman Road, Fort, Mumbai 400 001.
CUSTODIANStandard Chartered Bank (SCB)Corp. & Regd. Office: Crescenzo, Securities Services, 3rd Floor, C-38/39, G-Block, Bandra Kurla Complex, Bandra East, Mumbai – 400051.
AUDITORS TO THE SCHEMEBSR & Co. LLPChartered Accountants 5th Floor, Lodha Excelus, Apollo Mills Compound, N.M. Joshi Marg, Mahalaxmi, Mumbai 400 011.
REGISTRAR & TRANSFER AGENTSComputer Age Management Services Private Limited (CAMS)Unit: HSBC Mutual Fund ’C’ Block, 2nd Floor, Hanudev Info Park P. Ltd., SF No. 558/2, Udayampalayam Road, Nava India, Coimbatore - 641 028.
BOARD OF TRUSTEESMr. Nasser Munjee
Mr. Manu Tandon
Mr. Mehli Mistri
Mr. Dilip J. Thakkar
Ms. Jasmine Batliwalla
Mr. Pedro Bastos
BOARD OF DIRECTORSMs. Kishori J. Udeshi - Chairperson
Mr. S. P. Mustafa
Mr. Dinesh Mittal
Mr. Ravi Menon - Chief Executive Officer

4
The Trustees of HSBC Mutual Fund (“Fund”) present the Sixteenth Annual Report and the audited abridged financial statements of the schemes of the Fund for the year ended March 31, 2018.
As at March 31, 2018, the Fund offered 30 schemes across asset classes to meet the varying investment needs of the investors. Notably, three Schemes of HSBC Mutual Fund viz. HSBC Large Cap Equity Fund, HSBC Short Duration Fund and HSBC Cash Fund have completed 15 years of operations during the year.
During the year, the Fund has launched Plan(s) under Fixed Term Series and carried out merger of the existing schemes viz HSBC Dividend Yield Equity Fund merged into HSBC Multi Cap Equity Fund (HMEF), erstwhile HSBC India Opportunities Fund, as offering sub-scale fund was not in the interest of the unitholders.
Further, in order to bring uniformity in the practice across Mutual Funds and to standardize the scheme categories and characteristics of schemes, SEBI vide its circular no. SEBI/HO/IMD/DF3/CIR/P/2017/114 dated October 06, 2017, issued guidelines for categorization and rationalization of Mutual Fund schemes.
Accordingly, HSBC Large Cap Equity Fund (erstwhile HSBC Equity Fund), HSBC Small Cap Equity Fund (erstwhile HSBC Mid Cap Equity Fund) , HSBC Infrastructure Equity Fund, HSBC Global Emerging Market Fund (erstwhile HSBC Emerging Market Fund), HSBC Debt Fund (erstwhile HSBC Income Fund – Investments Plan), HSBC Short Duration Fund (erstwhile HSBC Income Fund – Short Term Plan), HSBC Low Duration Fund (erstwhile HSBC Ultra Short Term Bond Fund), HSBC Regular Savings Fund (erstwhile HSBC Monthly Income Plan) and HSBC Managed Solutions have undergone fundamental attributes changes with effective from March 14, 2018.
The Fund continues its focus on delivering consistent long term returns. The comments on the performance of the Scheme(s) is provided hereinafter. Dividends were declared under various schemes as per the provisions contained in the respective Scheme Information Documents after considering the distributable surplus available under the respective Schemes. Details of dividends declared can be viewed on our website at www.assetmanagement.hsbc.com/in.
1. Scheme Performance, future outlook and oPerationS of the SchemeS
a. Operations and Performance of the Schemes
HSBC Global Emerging Markets Fund (HGEMF) (erstwhile HSBC Emerging Markets Fund)(An open-ended fund of fund Scheme investing in HSBC Global Investment Funds - Global Emerging Markets Equity Fund)
The primary investment objective of the Scheme is to provide long term capital appreciation by investing predominantly in units / shares of HSBC Global Investment Funds - Global Emerging Markets Equity Fund. The Scheme may also invest a certain proportion of its corpus in money market instruments and / or units of liquid mutual fund schemes, in order to meet liquidity requirements from time to time. However, there can be no assurance or guarantee that the investment objective of the scheme would be achieved.
The net assets of HGEMF amounted to Rs. 9.33 crores as at March 31, 2018 compared to Rs. 9.28 crores as at March 31, 2017. Around 97.82% of the net assets were invested in HSBC GEM Equity Fund (overseas mutual fund), 2.81% of the net assets comprised of reverse repos/CBLO and current assets as at March 31, 2018.
HGEMF underperformed its benchmark during 2017-2018 on account of the performance of its underlying fund.
Scheme Name & Benchmarks Absolute Returns
(%)
Compounded Annualized Returns (%)
Date of Inception : 17 March 2008 1 Year 3 Years 5 Years Since Inception
HSBC Global Emerging Markets Fund - Growth 19.81 8.81 6.68 3.76
MSCI Emerging Market Index (Scheme Benchmark) 22.73 10.60 8.69 8.32
Nifty 50 (Standard Benchmark) 12.68 7.99 13.63 9.69
Rs. 10,000, if invested in HGEMF, would have become 11,981 12,889 13,819 14,483
Trustees’ ReportFor the year ended March 31, 2018

5
Scheme Name & Benchmarks Absolute Returns
(%)
Compounded Annualized Returns (%)
Date of Inception : 17 March 2008 1 Year 3 Years 5 Years Since Inception
Rs. 10,000, if invested in MSCI Emerging Market Index, would have become
12,273 13,536 15,172 22,303
Rs. 10,000, if invested in Nifty 50, would have become 11,268 12,599 18,950 25,299
Past performance may or may not be sustained in future. The returns for the respective periods are provided as on last business day of March 2018 for Growth Option. Different plans shall have a different expense structure. Performance of the respective benchmark is calculated as per the Total Return Index (TRI).
b. Market Overview & Outlook (as furnished by HSBC Asset Management (India) Private Limited)
EqUITY OUTLOOKIndian equity markets continued to remain strong during fiscal year 2017-18 and posted gains of 11.76% by S&P CNX Nifty and 13.24% by BSE Midcap index respectively. Biggest drivers of the markets were, robust DII flow into equities, continued push of mega reforms – Goods and Services Tax (GST) implementation, Insolvency and Bankruptcy Code implementation, Real Estate (Regulation and Development) Act, second consecutive normal monsoon, and electoral victories of the ruling party in many state elections. On the other hand, the markets weather the storm of disruption in economy due to GST implementation, lingering impact of demonetization, muted FII flows, and rising yields in developed markets. Domestic Mutual Fund segment had their best ever year and they brought in ~USD 22 bn of net inflows in equities during the year. Even after witnessing ~USD 4.3 bn of net outflows from the domestic insurers, the net DII tally was a very impressive ~USD 17.7 bn of net inflows. There were mixed global cues well and the Foreign Institutional Investors (FIIs) net bought Indian equities worth USD 3.2 bn. The inflows by both FIIs and domestic MFs acted as a factor in the strong market performance.
Indices Returns (April 1, 2017 to March 31, 2018) 1 Year (%)
S&P BSE Sensex 12.70%
NSE CNX Nifty 11.76%
S&P BSE 100 12.12%
S&P BSE 200 12.49%
S&P BSE 500 13.21%
S&P BSE Midcap 14.31%
S&P BSE 250 Small-cap 14.13%
Source: Bloomberg (All values are total return)
Our view on the key aspects related to equity markets are presented below -
The impressive performance in equity markets during FY 2017-18 has come on the back of strong liquidity largely by domestic MFs but supported in party by FII flows, positive global growth, benign macro – both domestically and global, expectation of the continuation of favorable policy environment domestically and expectation of corporate earnings revival. Possibility of sound macro, economic reforms and implementation of existing reforms have increased, especially after continued success of the ruling party at the centre in state elections. However, after this strong performance in markets and rather long wait for earnings to be delivered has meant that the equity markets are currently trading above their historical averages.
Moving into FY 2018-19, we expect a continuation of the economic recovery process domestically, recovery in corporate earnings - led early by volume growth, and continued DII flows. Government led investment
Trustees’ ReportFor the year ended March 31, 2018 (Contd...)

6
spending and rural consumption are likely to lead with private sector investments contributing later (possibly after general elections 2019). The budget document that was presented in early February provides a good medium term policy direction for the economy. Occasionally the policy actions can serve up a few bumps and jolts but over the medium term, across different governments, there is a thread of continuity connecting many key economic policies such as in the case of this year’s union budget. We, in our investment process, prefer to take comfort in these threads of continuity and remain constructive on the India growth story. This makes us positive on the Indian equity markets over the medium to long term.
Risks are in the form of market valuations trending above historical averages, weaker than expected delivery in corporate earnings going forward, external news flows related to trade protectionism, developed market central banks raising rates prematurely, and geopolitical tensions and other eco-political events would also influence market performance going forward, as the recent rally in the markets was supported by strong FII inflows.
DEBT OUTLOOKFixed Income in Financial Year 2017-18 has seen volatility further step up in this year. Markets went to perfect storm with higher crude prices, low liquidity and pressure on currency, apart from rate hike expectations.
Inflation has followed the glide path to lower numbers towards 4% RBI target and even lower than the target number when inflation printed a lowly 1.46% in June 2018 on back of lower food prices. RBI went for a cut despite of neutral stance. This positivity continued till until crude shock came in form of higher crude process. Global prices of Brent crude saw substantial increase in second half of the year, which jeopardized the inflation path. Other worries that gathered around this time were related to GST collection and eventual impact on fiscal situation.
Government of India allowed the fiscal deficit to slip to 3.5% (budget 3.2%) and kept next year target at 3.3% (in place of earlier path of 3%). This was on back of some excise relaxation for oil products and a month less collected for GST due to implementation in the current year. The fear of fiscal slippage alongwith the announcement of higher bond issuances spooked the bond markets into higher yields. Government finally borrowed only INR 90 bln extra (in place of INR 500 bln announced initially).
On the Monetary front the year was very volatile as well. RBI changed its stance to neutral causing some worry around rate hikes. Thereafter it cut rates and again went for OMO sales operations simultaneously. This created some confusion in the market participants regarding rates direction. Finally extra supply, higher oil prices and higher inflation paved way for rates higher. RBI also held position on regulatory forbearance about spreading out losses by banks publicly. It eventually gave up the position in the end of March. However, the swift changes in stance caused lot of pressure and volatility in bonds.
Liquidity situation continuously deteriorated due to OMO sales initially and withdrawal of deposits due to remonetisation. Further liquidity was absorbed out due to portfolio outflows and reduction in reserves. Despite of defense from RBI utilizing the reserves, the currency depreciated meaningfully, which caused further jitters in foreign investor sentiments. Lack of liquidity also affected 1-3 year rates which were elevated in second half of the year.
Going forward following are key variables to watch out for:• Liquidity: Liquidity will drive short end rates and eventually drive decisions leading to market interventions
and CRR cuts. RBI has focused now on neutral liquidity stance and providing liquidity to system, which will bode well short end rates.
• Inflation: Inflation numbers will determine future course of action for RBI and remains a critical variable for policy. We expect inflation to remain at 4.7% level in the ease in second half of FY 2018-19 in line with RBI’s expectations.
• Growth: GDP growth numbers as well as industrial activity will also determine the decision on policy.
• Fiscal deficit: Fiscal deficit and government spending will determine the government borrowing and crowding out in interest rate curve. We expect prudence in government spending and prospect of spending on infrastructure to pick up which will crowd in private investment as well.
• Current Account Deficit: Current Account Deficit determines how the pressure on currency works and effective management of forex reserves.
• Currency levels: Level of INR will determine how the central bank reacts to the situation on the global crisis etc.
Trustees’ ReportFor the year ended March 31, 2018 (Contd...)

7
2. Brief Background of SPonSorS, Board of truSteeS and aSSet management comPany
a. Sponsor
HSBC Mutual Fund is sponsored by HSBC Securities and Capital Markets (India) Private Limited (HSCI). The Sponsor is the Settler of the Mutual Fund Trust. The Sponsor has entrusted a sum of Rs. 1,00,000 (Rupees One Lakh only) to the Trustee as the initial contribution towards the corpus of the Mutual Fund.
HSCI offers integrated investment banking services, securities and corporate finance & advisory. HSCI is a member of the Bombay Stock Exchange Limited and National Stock Exchange (capital and derivative market segments). HSCI holds 100% of the paid up equity share capital of HSBC Asset Management (India) Private Limited.
b. HSBC Mutual Fund
HSBC Mutual Fund (“the Mutual Fund” or “the Fund”) has been constituted as a Trust in accordance with the provisions of the Indian Trusts Act, 1882 (2 of 1882) vide a Trust Deed dated February 7, 2002 with HSBC Securities and Capital Markets (India) Private Limited, as the Sponsor and the Board of Individual Trustees. The Trustee has entered into an Investment Management Agreement dated February 7, 2002 with HSBC Asset Management (India) Private Limited (AMC) to function as the Investment Manager for all the schemes of the Fund. The Fund was registered with SEBI vide registration number MF/046/02/5 dated May 27, 2002.
The Trust has been formed for the purpose of pooling of capital from the public for collective investment in securities for the purpose of providing facilities for participation by persons as beneficiaries in such investments and in the profits/income arising therefrom.
c. Board of Trustees (the Trustees)
The Board of Trustees is the exclusive owner of the Trust Fund and holds the same in trust for the benefit of the unit holders. The Trustees have been discharging their duties and carrying out the responsibilities as provided in the SEBI (Mutual Funds) Regulations, 1996 and the Trust Deed. The Trustees seek to ensure that the Fund and the schemes floated there under are managed by the AMC in accordance with the Trust Deed, the said Regulations, directions and guidelines issued by the SEBI, the Stock Exchanges, the Association of Mutual Funds in India and other regulatory agencies.
d. Asset Management Company (the AMC)
HSBC Asset Management (India) Private Limited (the Investment Manager or the AMC) is a private limited company incorporated under the Companies Act, 1956 on December 12, 2001 having its Registered Office at 16, V. N. Road, Fort, Mumbai 400 001. HSBC Asset Management (India) Private Limited has been appointed as the Asset Management Company of HSBC Mutual Fund by the Trustee vide Investment Management Agreement (IMA) dated February 7, 2002 and executed between the Trustees and the AMC. SEBI approved the AMC to act as the Investment Manager of the Fund vide its letter No. MFD/BC/163/2002 dated May 27, 2002. The paid-up equity share capital of the AMC is Rs. 61.59 crores. The AMC is registered as a Portfolio Manager under the SEBI (Portfolio Managers) Regulations, 1993 vide registration no. INP000001322. The AMC also offers non-binding Advisory services to offshore funds under the mutual fund license.
HSBC Securities and Capital Markets (India) Private Limited holds 100% of the paid up equity share capital of the AMC.
3. inveStment oBjective of the SchemeS The investment objective of the respective schemes has been provided above under the heading “Scheme
Performance, Future Outlook and Operation of the Scheme” (Refer Section 1).
4. Significant accounting PolicieS The Significant Accounting Policies form part of the Notes to the Accounts annexed to the Balance Sheet
of the Schemes in the Full Annual Report. The accounting policies are in accordance with Securities Exchange Board of India (Mutual Funds) Regulations 1996.
Trustees’ ReportFor the year ended March 31, 2018 (Contd...)

8
Trustees’ ReportFor the year ended March 31, 2017 (Contd...)
5. unclaimed dividendS & redemPtionS Summary of number of investors & corresponding amount Scheme-wise as on March 31, 2018.
SchemeUnclaimed Dividend Unclaimed Redemption
Amount (Rs.) No. of Investors
Amount (Rs.) No. of Investors
HSBC Global Emerging Markets Fund - - 1,022,660.06 24
6. inveStor ServiceSThe number of official points of acceptance of transactions is 205 locations. In addition to the offices of the Registrar & Transfer agents, the AMC has Investor Service Centres in 9 locations at its own offices - namely Mumbai, New Delhi, Kolkata, Bangaluru, Pune, Ahmedabad, Hyderabad, Chandigarh and Chennai. With a view to enhance customer convenience, the AMC has the facility of priority based servicing to key distributors through the enhancement of the Interactive Voice Reponses. The AMC has a single Toll Free number which can be dialed from anywhere in India. The call centre service is being managed by the Registrar and Transfer Agents.
On the distribution front, the number of empanelled distributors was 460 as on March 31, 2018. During the year, the AMC initiated tie-ups for online distribution of the Mutual Fund’s schemes with several channel partners taking the total number of such tie-ups to 42.
7. detailS of inveStor grievance redreSSalThe details of the redressal of investor complaints received against HSBC Mutual Fund during April 2017 - March 2018 are as follows:
2017-2018
Com- plaint Code
Type of complaint (a) No. of complaints
pending at the
beginning of the year
(b) No. of complaints received during
the year
Action on (a) and (b)
Resolved Non Actiona-
ble*
Pending
Within 30
days
30 - 60 days
60 - 180 days
Beyond 180 days
0 - 3 months
3 - 6 months
6 - 9 months
9 - 12 months
I A Non receipt of Dividend on Units
0 5 4 1 0 0 0 0 0 0 0
I B Interest on delayed payment of Dividend
0 0 0 0 0 0 0 0 0 0 0
I C Non receipt ofRedemption Proceeds
1 12 12 1 0 0 0 1 0 0 0
I D Interest on delayedp a y m e n t o f Redemption
0 1 1 0 0 0 0 0 0 0 0
II A Non receipt of Statement of Account / Unit Certificate
0 0 0 0 0 0 0 0 0 0 0
II B D i s c r e p a n c y i n Statement of Account
0 0 0 0 0 0 0 0 0 0 0
II C Data corrections in Investor details **
0 34 34 0 0 0 0 0 0 0 0
II D Non receipt of Annual Report /Abridged Summary
0 0 0 0 0 0 0 0 0 0 0
Trustees’ ReportFor the year ended March 31, 2018 (Contd...)

9
2017-2018
Com- plaint Code
Type of complaint (a) No. of complaints
pending at the
beginning of the year
(b) No. of complaints received during
the year
Action on (a) and (b)
Resolved Non Actiona-
ble*
Pending
Within 30
days
30 - 60 days
60 - 180 days
Beyond 180 days
0 - 3 months
3 - 6 months
6 - 9 months
9 - 12 months
III A Wrong switch between Schemes
0 0 0 0 0 0 0 0 0 0 0
III B Unauthorized switch between Schemes
0 0 0 0 0 0 0 0 0 0 0
III C Deviation from Scheme attributes
0 0 0 0 0 0 0 0 0 0 0
III D Wrong or excess charges / load
0 0 0 0 0 0 0 0 0 0 0
III E Non updat ion of changes viz. address, PAN, bank details, nomination, etc
0 6 6 0 0 0 0 0 0 0 0
IV Others 1 41 42 0 0 0 0 0 0 0 0
Total 2 99 99 2 0 0 0 0 0 0 0
Summary of Complaints for FY 2017-18
Particulars Count
Total complaints received 99
Total number of folios 140099
% of complaints against the folio 0.071%
# active folios** As per AMFI Best Practice Guidelines Circular No.25/2011-12 for Revisions in the Guidelines on
Standardization of Complaints/Grievances Reporting Procedure. If “Others” include a type of complaint which is more than 10% of overall complaints, then such a reason should be provided separately. Hence data corrections in Investor Details is included as a separate category
* Non actionable means the complaint is incomplete / outside the scope of the mutual fund
8. inveStor education initiativeS The Fund undertook various investor education and awareness initiatives related to investments in mutual funds throughout India in English / Hindi and Regional languages via mass media. The Fund conducted 16 roadshows at various locations in India to promote various Investor Awareness related topics including Asset Allocation, SIPs, Equity Mutual Funds and Financial Planning. The Fund has a Year-long tie-up with Mutual Fund Insights Magazine that includes 3 pages of content and advertorial publication in their monthly issue. Each issue contains a story promoting SIPs to achieve one’s various investment goals. In the month of December 2017 and January 2018 investor awareness promotion was done through Outlook and Outlook Money magazines through advertorials on various Mutual Fund topics.
9. Statutory detailSa) The Sponsors are not responsible or liable for any loss resulting from the operation of the Schemes of
the Fund beyond initial contribution of Rs. 1 lakh for setting up the Fund.
b) The price and redemption value of the units, and income from them, can go up as well as down with fluctuations in the market value of its underlying investments.
Trustees’ ReportFor the year ended March 31, 2018 (Contd...)

10
c) Full Annual Report shall be disclosed on the website at www.assetmanagement.hsbc.com/in and shall be available for inspection at the Head Office of the Mutual Fund. Present and prospective unit holders can obtain copy of the Trust Deed, the full Annual Report of the Scheme(s), the Annual Report of HSBC Asset Management (India) Private Limited and the text of the relevant Scheme(s) at a price.
10. acknowledgementSThe Trustees wish to thank the Unit holders of the Schemes for their support throughout the year and also thank the Government of India, the Securities and Exchange Board of India (SEBI), the Reserve Bank of India (RBI) and the Association of Mutual Funds in India (AMFI) for the guidance provided by them. The Trustees also appreciate the services provided by the Registrar and Transfer Agent, Fund Accountant, Custodian, Bankers, Distributors and Brokers. The guidance and services provided by the Auditors and advocates and the ebullience, sincerity and dedication of the employees of HSBC Asset Management (India) Private Limited is also appreciated.
The Trustees look forward to the continued support of everyone.
For and on behalf of the Board of Trustees of HSBC Mutual Fund
Sd/-
Dilip Thakkar
Trustee
Mumbai
July 17, 2018.
Trustees’ ReportFor the year ended March 31, 2018 (Contd...)

11
To the Board of Trustees
HSBC Mutual Fund – HSBC Global Emerging Markets Fund (formerly known as HSBC Emerging Markets Fund)
Report on the Financial StatementsWe have audited the accompanying Financial Statements of HSBC Global Emerging Markets Fund (formerly known as HSBC Emerging Markets Fund) (the ‘Scheme’), which comprise the balance sheet as at 31 March 2018 and the related revenue account for the year then ended, and a summary of significant accounting policies and other explanatory information, annexed thereto.
Management’s responsibility for the Financial StatementsThe Board of Trustees to the HSBC Mutual Fund (the ‘Board of Trustees’) and HSBC Asset Management (India) Private Limited (the ‘AMC’), being the investment manager to HSBC Mutual Fund (the ‘Fund’) (collectively referred as ‘Management’), are responsible for the preparation of these financial statements that give a true and fair view of the financial position and financial performance of the Scheme in accordance with the accounting policies and standards specified in the Ninth Schedule of the Securities and Exchange Board of India (Mutual Funds) Regulations, 1996, as amended (the ‘Regulations’) and the accounting principles generally accepted in India. This responsibility includes maintenance of adequate accounting records for safeguarding of the assets of the Scheme and for preventing and detecting frauds and other irregularities; selection and application of appropriate accounting policies; making judgments and estimates that are reasonable and prudent; and design, implementation and maintenance of adequate internal financial controls, that were operating effectively for ensuring the accuracy and completeness of the accounting records, relevant to the preparation and presentation of the financial statements that give a true and fair view and are free from material misstatement, whether due to fraud or error.
In preparing the financial statements, management is responsible for assessing the Scheme’s ability to continue as a going concern, disclosing, as applicable, matters related to going concern and using the going concern basis of accounting unless management either intends to liquidate the Fund or to cease operations, or has no realistic alternative but to do so.
Auditor’s responsibilityOur responsibility is to express an opinion on these financial statements based on our audit. We conducted our audit in accordance with the Standards on Auditing issued by the Institute of Chartered Accountants of India (the ‘ICAI’). Those Standards require that we comply with ethical requirements and plan and perform the audit to obtain reasonable assurance about whether the financial statements are free from material misstatement.
An audit involves performing procedures to obtain audit evidence about the amounts and disclosures in the financial statements. The procedures selected depend on the auditor’s judgment, including the assessment of the risks of material misstatement of the financial statements, whether due to fraud or error. In making those risk assessments, the auditor considers internal controls relevant to preparation and fair presentation of the financial statements, of the Scheme, in order to design audit procedures that are appropriate in the circumstances, but not for the purpose of expressing an opinion on the effectiveness of the Scheme’s internal controls. An audit also includes evaluating the appropriateness of accounting policies used and the reasonableness of the accounting estimates made by Management, as well as evaluating the overall presentation of the financial statements.
We are also responsible to conclude on the appropriateness of management’s use of the going concern basis of accounting and, based on the audit evidence obtained, whether a material uncertainty exists related to events or conditions that may cast significant doubt on the Scheme’s ability to continue as a going concern. If we conclude that a material uncertainty exists, we are required to draw attention in the auditor’s report to the related disclosures in the financial statements or, if such disclosures are inadequate, to modify the opinion. Our conclusions are based on the audit evidence obtained up to the date of the auditor’s report. However, future events or conditions may cause the Scheme to cease to continue as a going concern.
We believe that the audit evidence we have obtained is sufficient and appropriate to provide a basis for our audit opinion.
Independent Auditors’ Report

12
OpinionIn our opinion, and to the best of our information and according to the explanations given to us, the aforesaid financial statements give the information required by the Regulations in the manner so required and give a true and fair view in conformity with the accounting principles generally accepted in India:
(i) in the case of the balance sheet, of the state of affairs of the Scheme as at 31 March 2018; and
(ii) in the case of the revenue account, of the net surplus for the year ended on that date.
Report on other Legal and Regulatory Requirements1 As required by Regulation 55(4) to the Regulations, we report that:
(a) We have obtained all information and explanations which, to the best of our knowledge and belief, were necessary for the purposes of the audit;
(b) The balance sheet and revenue account have been prepared in accordance with the accounting policies and standards specified in the Ninth Schedule of the Regulations.
2 As required by Clause 5(ii)(2) of the Eleventh Schedule of the Regulations, we report that the balance sheet and revenue account are in agreement with the books of account of the Scheme.
3 In our opinion and on the basis of information and explanations given to us, the methods used to value non - traded securities, as at 31 March 2018, as determined by the Board of Directors of AMC, are in accordance with the Regulations and other guidelines issued by the Securities and Exchange Board of India as applicable and approved by the Board of Trustees are fair and reasonable.
For B S R & Co. LLP Chartered Accountants Firm’s Registration No: 101248W/W-100022
Milind Ranade Partner Membership No: 100564
Place : Mumbai Date : July 17, 2018.
Independent Auditors’ Report (Contd...)

13
Abridged Balance Sheet as at March 31, 2018
Rs. in Lakhs
HSBC GLOBAL EMERGING MARKETS FUND
As at March 31, 2018
As at March 31, 2017
LIABILITIES1 Unit Capital 649.91 784.53 2 Reserves & Surplus2.1 Unit Premium Reserves (472.08) (456.13)2.2 Unrealised Appreciation Reserve 269.43 136.85 2.3 Other Reserves 485.69 463.22 3 Loans & Borrowings – – 4 Current Liabilities & Provisions4.1 Provision for doubtful Income/Deposits – – 4.2 Other Current Liabilities & Provisions 18.03 12.75
TOTAL 950.98 941.22
ASSETS1 Investments1.1 Listed Securities:1.1.1 Equity Shares – – 1.1.2 Preference Shares – – 1.1.3 Equity Linked Debentures – – 1.1.4 Other Debentures & Bonds – – 1.1.5 Securitised Debt securities – – 1.2 Securities Awaited Listing:1.2.1 Equity Shares – – 1.2.2 Preference Shares – – 1.2.3 Equity Linked Debentures – – 1.2.4 Other Debentures & Bonds – – 1.2.5 Securitised Debt securities – – 1.3 Unlisted Securities1.3.1 Equity Shares – – 1.3.2 Preference Shares – – 1.3.3 Equity Linked Debentures – – 1.3.4 Other Debentures & Bonds – – 1.3.5 Securitised Debt securities – – 1.4 Government Securities – – 1.5 Treasury Bills – – 1.6 Commercial Paper – – 1.7 Certificate of Deposits – – 1.8 Bill Rediscounting – – 1.9 Units of Domestic Mutual Fund – – 1.10 Foreign Securities 912.62 896.36
Total Investments 912.62 896.36
2 Deposits 0.24 0.07 3 Other Current Assets3.1 Cash & Bank Balance 0.10 1.00 3.2 CBLO/Reverse Repo Lending 28.72 35.17 3.3 Others 9.30 8.62 4 Deferred Revenue Expenditure (to the extent not written off) – –
TOTAL 950.98 941.22
Notes to Accounts – Annexure I

14
Abridged Revenue Account for the year ended March 31, 2018
Rs. in Lakhs
HSBC Global Emerging Markets FundCurrent
Year ended March 31, 2018
Previous Year ended
March 31, 2017
1 INCOME1.1 Dividend 13.52 18.78
1.2 Interest 1.93 1.391.3 Realised Gain / (Loss) on Foreign Exchange Transactions 0.08 (0.36)1.4 Realised Gains / (Losses) on Interscheme sale of investments – –1.5 Realised Gains / (Losses) on External sale / redemption of
investments48.43 12.64
1.6 Realised Gains / (Losses) on Derivative Transactions – –1.7 Other Income 0.01 –
(A) 63.97 32.45
2 EXPENSES2.1 Management fees 7.96 7.242.2 GST / Service tax on Management fees 1.41 1.082.3 Transfer agents fees and expenses 0.60 0.502.4 Custodian fees 1.70 1.622.5 Trusteeship fees 0.02 0.022.6 Commission to Agents 5.37 5.032.7 Marketing & Distribution expenses 0.01 0.022.8 Audit fees 0.20 0.202.9 Investor Education Expenses 0.19 0.182.10 Other operating expenses 0.47 0.702.11 Less: Expenses to be Reimbursed by the Investment Manager – –
(B) 17.93 16.59
3 NET REALISED GAINS / (LOSSES) FOR THE YEAR (A –B = C) 46.04 15.86
4 Change in Unrealised Depreciation in value of investments*** (D) – (0.07)
5 NET GAINS / (LOSSES) FOR THE YEAR [E=(C+D)] 46.04 15.79
6 Change in unrealised appreciation in the value of investments and derivatives (F) 132.59 121.95
7 NET SURPLUS / (DEFICIT) FOR THE YEAR (E + F = G) 178.63 137.74
7.1 Add: Balance transfer from Unrealised Appreciation Reserve – –7.2 Less: Balance transfer to Unrealised Appreciation Reserve 132.59 121.957.3 Add / (Less): Equalisation (23.57) (9.23)7.4 Transfer from Reserve Fund 463.22 456.66
8 Total 485.69 463.22
9 Dividend appropriation
9.1 Income Distributed during the year – –9.2 Tax on income distributed during the year – –10 Retained Surplus / (Deficit) carried forward
to Balance sheet 485.69 463.22
Notes to Accounts – Annexure I*** Includes Unrealised Depreciation in the value of Foreign Currency Transactions.

15
Key Statistics for the year ended March 31, 2018
HSBC GLOBAL EMERGING MARKETS FUND Current
Year ended March 31, 2018
Previous Year ended
March 31, 2017
1. NAV per unit (Rs.):
Open
Regular Plan Growth Option 11.9610 10.2862
Regular Plan Dividend Option 11.4436 9.8413
Direct Plan - Growth Option 12.3347 10.5337
Direct Plan - Dividend Option 11.8110 10.0863
High
Regular Plan Growth Option 15.4020 12.2453
Regular Plan Dividend Option 14.7358 11.7157
Direct Plan - Growth Option 15.9774 12.6251
Direct Plan - Dividend Option 15.2992 12.0889
Low
Regular Plan Growth Option 11.7656 9.7917
Regular Plan Dividend Option 11.2566 9.3682
Direct Plan - Growth Option 12.1358 10.0367
Direct Plan - Dividend Option 11.6204 9.6104
End
Regular Plan Growth Option 14.4767 11.9610
Regular Plan Dividend Option 13.8506 11.4436
Direct Plan - Growth Option 15.0374 12.3347
Direct Plan - Dividend Option 14.3991 11.8110
2. Closing Assets Under Management (Rs. in Lakhs)
End 933 928
Average (AAuM)1 946 906
3. Gross income as % of AAuM2 6.76% 3.58%
4. Expense Ratio:
a. Total Expense as % of AAuM (including service tax / GST on Management fees) (planwise)
Regular Plan (Continue) 1.95% 1.87%
Direct Plan 1.22% 1.17%
b. Management Fee as % of AAuM (planwise)
Regular Plan (Continue) 0.59% 0.80%
Direct Plan 0.59% 0.80%
5. Net Income as a percentage of AAuM3 4.87% 1.75%
6. Portfolio turnover ratio4 0.04 0.02
7. Total Dividend per unit distributed during the year (planwise)
Retail
Regular Plan Dividend Option – –
Direct Plan - Dividend Option – –

16
HSBC GLOBAL EMERGING MARKETS FUND Current
Year ended March 31, 2018
Previous Year ended
March 31, 2017
Corporate
Regular Plan Dividend Option – –
Direct Plan - Dividend Option – –
8. Returns (%):
a. Last One Year
Scheme
Regular Plan Growth Option 19.8136 16.2820
Direct Plan - Growth Option 20.6821 17.0975
Benchmark
MSCI Emerging Markets Index 22.7300 12.4242
b. Since Inception
Scheme
Regular Plan Growth Option 3.7569 1.9997
Direct Plan - Growth Option 5.5999 2.0725
Benchmark
MSCI Emerging Markets Index 8.3187 1.8320
1. AAuM=Average daily net assets2. Gross income = amount against (A) in the Revenue account i.e. Income3. Net income = amount against (C) in the Revenue account i.e. Net Realised Gains / (Losses) for the year4. Portfolio Turnover = Lower of sales or purchase divided by the Average AuM for the year5 The net asset value disclosed represents the computed NAV on March 31, 2018 (Non-business Day),
and not the last declared NAV.6 The Total management fees and other expenses charged by the underlying fund along with the
management fee and recurring expenses charged by the domestic Mutual Fund is as follows:
Scheme TER charged by underlying Fund ***
TER of the domestic Fund***
Total TER *** Maximum TER Cap as per circular ***
2017-18
HSBC Global Emerging Markets Fund
0.85% 1.84% 2.69% 2.70%
2016-17
HSBC Global Emerging Markets Fund
0.85% 1.77% 2.62% 2.70%
*** The TER excludes GST / Service Tax on Management fees
Key Statistics for the year ended March 31, 2018 (Contd...)

17
Notes to Accounts – Annexure ITo the Abridged Balance Sheet and Revenue Account for the Year ended March 31, 2018
HSBC GLOBAL EMERGING MARKETS FUND1 Investments:–
1.1 It is confirmed that investments of the Scheme are registered in the name of the Trustees for the benefit of the Scheme’s unitholders.
1.2 Open Positions of derivatives as of year ended March 31, 2018 and March 31, 2017 are NIL
1.3 Investments in Associates and Group Companies as of period ended March 31, 2018 & March 31, 2017 are NIL.
1.4 Open positions of Securities Borrowed and / or Lent by the Scheme as of the years ended March 31, 2018 and March 31, 2017 are NIL.
1.5 NPAs as at years ended March 31, 2018 and March 31, 2017 are NIL.
1.6 Aggregate Unrealised Gain / Loss as at the end of the financial years end and their percentages to net assets are as under:
Security Category Amount (Rupees)
Percentage to Net Assets
Amount (Rupees)
Percentage to Net Assets
2018 2017Foreign Securities
– Appreciation 26,943,496 28.88 13,684,634 14.74
– Depreciation – – – –
1.7 The aggregate value of investments securities (excluding CBLO and Reverse Repos) purchased and sold (including matured) during the financial year 2017 - 2018 (excluding accretion of discount) is Rs. 3,629,841 and 20,106,910 respectively being 3.84% and 21.25% of the average daily net assets.
The aggregate value of investments securities (excluding CBLO and Reverse Repos) purchased and sold (including matured) during the financial year 2016 - 2017 (excluding accretion of discount) is Rs. 1877656 and 11,112,687 respectively being 2.07% and 12.26% of the average daily net assets.
1.8 Non-Traded securities in the portfolios as at March 31, 2018 and March 31, 2017 are NIL.
2 Disclosure Under Regulation 25(8) of the Securities and Exchange Board of India (Mutual Funds) Regulations, 1996 as amended
Commission paid to Sponsor / AMC and its associates / related parties / group companies
Name of Sponsor / AMC and its associates / related parties / group companies
Nature of Association / Nature of
Relation
Period Covered
Business Given [Rs. In Crores]
% of Total Business
received by the Fund
Commission paid [Rs.]
% of Total commission paid by the
Fund
The Hongkong and Shanghai Banking Corporation Limited
Associate of Investment Manager
2017-2018 0.01 0.32 86,097.44 17.50
Name of Sponsor / AMC and its associates / related parties / group companies
Nature of Association / Nature of
Relation
Period Covered
Business Given [Rs. In Crores]
% of Total Business
received by the Fund
Commission paid [Rs.]
% of Total commission paid by the
Fund
The Hongkong and Shanghai Banking Corporation Limited
Associate of Investment Manager
2016-2017 0.13 30.24 101,711.63 22.21

18
Brokerage paid to Sponsor/AMC and its associates/related parties/group companies is NIL. (Previous year also NIL)
(i) Any underwriting obligations undertaken by the schemes of the mutual funds with respect to issue of securities associate companies - Nil (Previous year also Nil)
(ii) Devolvement - Nil (Previous year also Nil)
(iii) Subscription by the schemes in the issues lead managed by associate companies - Nil (Previous year also Nil)
(iv) Subscription to any issue of equity or debt on private placement basis where the sponsor or its associate companies have acted as arranger or manager - Nil. (Previous year also Nil)
3 None of the Investors held more than 25% of the total net assets of the Scheme at the year ended March 31, 2018 and March 31, 2017.
4 Unit Capital movement during the years ended March 31, 2018 and March 31, 2017:
Description
2017-2018
Opening Units Subscription Redemption Closing Units Face Value per unit (Rupees)
Regular Plan Growth Option
5,048,545.632 496,078.130 1,114,399.732 4,430,224.030 10
Regular Plan Dividend Option
2,282,850.367 57,291.737 705,759.264 1,634,382.840 10
Direct Plan - Growth Option
510,536.033 504,186.146 595,159.061 419,563.118 10
Direct Plan - Dividend Option
3,374.592 11,559.119 – 14,933.711 10
Description
2016–2017
Opening Units Subscription Redemption Closing Units Face Value per unit (Rupees)
Regular Plan Growth Option
5,569,323.787 319,549.456 840,327.611 5,048,545.632 10
Regular Plan Dividend Option
2,547,371.707 34,037.579 298,558.919 2,282,850.367 10
Direct Plan - Growth Option
497,559.401 28,559.337 15,582.705 510,536.033 10
Direct Plan - Dividend Option
3,374.592 – – 3,374.592 10
** Units held by the AMC (Seed Capital) in Direct Plan Growth Option as on March 31, 2018 is 113,484.384 and as on March 31, 2017 is 113,484.384
5 Previous year’s figures have been re-grouped / re-arranged where appropriate.
6 No contingent liabilities for the years ended March 31, 2018 and March 31, 2017.
7 Expenses other than Management Fees are Inclusive of GST / Service Tax where applicable.
Notes to Accounts – Annexure I (Contd...)To the Abridged Balance Sheet and Revenue Account for the Year ended March 31, 2018
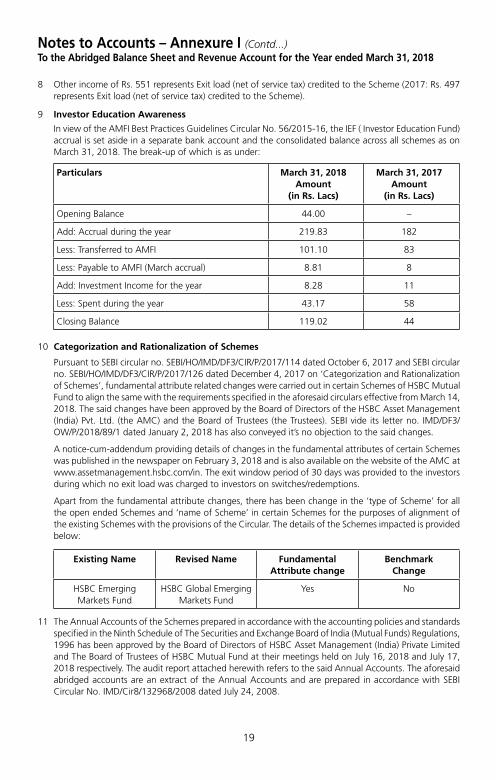
19
Notes to Accounts – Annexure I (Contd...)To the Abridged Balance Sheet and Revenue Account for the Year ended March 31, 2018
8 Other income of Rs. 551 represents Exit load (net of service tax) credited to the Scheme (2017: Rs. 497 represents Exit load (net of service tax) credited to the Scheme).
9 Investor Education Awareness
In view of the AMFI Best Practices Guidelines Circular No. 56/2015-16, the IEF ( Investor Education Fund) accrual is set aside in a separate bank account and the consolidated balance across all schemes as on March 31, 2018. The break-up of which is as under:
Particulars March 31, 2018 Amount
(in Rs. Lacs)
March 31, 2017 Amount
(in Rs. Lacs)
Opening Balance 44.00 –
Add: Accrual during the year 219.83 182
Less: Transferred to AMFI 101.10 83
Less: Payable to AMFI (March accrual) 8.81 8
Add: Investment Income for the year 8.28 11
Less: Spent during the year 43.17 58
Closing Balance 119.02 44
10 Categorization and Rationalization of Schemes
Pursuant to SEBI circular no. SEBI/HO/IMD/DF3/CIR/P/2017/114 dated October 6, 2017 and SEBI circular no. SEBI/HO/IMD/DF3/CIR/P/2017/126 dated December 4, 2017 on ‘Categorization and Rationalization of Schemes’, fundamental attribute related changes were carried out in certain Schemes of HSBC Mutual Fund to align the same with the requirements specified in the aforesaid circulars effective from March 14, 2018. The said changes have been approved by the Board of Directors of the HSBC Asset Management (India) Pvt. Ltd. (the AMC) and the Board of Trustees (the Trustees). SEBI vide its letter no. IMD/DF3/OW/P/2018/89/1 dated January 2, 2018 has also conveyed it’s no objection to the said changes.
A notice-cum-addendum providing details of changes in the fundamental attributes of certain Schemes was published in the newspaper on February 3, 2018 and is also available on the website of the AMC at www.assetmanagement.hsbc.com/in. The exit window period of 30 days was provided to the investors during which no exit load was charged to investors on switches/redemptions.
Apart from the fundamental attribute changes, there has been change in the ‘type of Scheme’ for all the open ended Schemes and ‘name of Scheme’ in certain Schemes for the purposes of alignment of the existing Schemes with the provisions of the Circular. The details of the Schemes impacted is provided below:
Existing Name Revised Name Fundamental Attribute change
Benchmark Change
HSBC Emerging Markets Fund
HSBC Global Emerging Markets Fund
Yes No
11 The Annual Accounts of the Schemes prepared in accordance with the accounting policies and standards specified in the Ninth Schedule of The Securities and Exchange Board of India (Mutual Funds) Regulations, 1996 has been approved by the Board of Directors of HSBC Asset Management (India) Private Limited and The Board of Trustees of HSBC Mutual Fund at their meetings held on July 16, 2018 and July 17, 2018 respectively. The audit report attached herewith refers to the said Annual Accounts. The aforesaid abridged accounts are an extract of the Annual Accounts and are prepared in accordance with SEBI Circular No. IMD/Cir8/132968/2008 dated July 24, 2008.

20
Voting Policy and Procedures
In view of SEBI guidelines related to “Role of Mutual Funds in Corporate Governance of Public Listed Companies”, AMIN has formulated its “Policy for Proxy Voting in Public Listed Companies”. The said policy and details of actual exercise of proxy votes along with the summary of votes cast and the auditors certification during the Financial Year 2017 – 18 is available on its website – http://www.assetmanagement.hsbc.com/in and in full Annual Report for the Financial Year 2017 – 18.
Statutory Details & DisclaimersAll returns have been sourced from Mutual Funds India Explorer software unless otherwise stated. With regard to equity schemes (including the equity component of MIPs), Fund performance is calculated on a total return basis (i.e. it includes dividends re-invested) while the benchmark is calculated on a price return basis (i.e. it does not consider dividends re-invested). This document has been prepared by HSBC Asset Management (India) Private Ltd (HSBC) for information purposes only and should not be construed as an offer or solicitation of an offer for purchase of any of the funds of HSBC Mutual Fund. All information contained in this document (including that sourced from third parties), is obtained from sources HSBC, the third party believes to be reliable but which it has not independently verified and HSBC, the third party makes no guarantee, representation or warranty and accepts no responsibility or liability as to the accuracy or completeness of such information. The information and opinions contained within the document are based upon publicly available information and rates of taxation applicable at the time of publication, which are subject to change from time to time. Expressions of opinion are those of HSBC only and are subject to change without notice. It does not have regard to specific investment objectives, financial situation and the particular needs of any specific person who may receive this document. Investors should seek financial advice regarding the appropriateness of investing in any securities or investment strategies that may have been discussed or recommended in this report and should understand that the views regarding future prospects may or may not be realized. Neither this document nor the units of HSBC Mutual Fund have been registered in any jurisdiction. The distribution of this document in certain jurisdictions may be restricted or totally prohibited and accordingly, persons who come into possession of this document are required to inform themselves about, and to observe, any such restrictions.
Investors should not invest in the Scheme solely based on the information provided in this document and should read the Scheme Information Document and Statement of Additional Information of the Fund for details. This document does not constitute an offering document.
No part of this publication may be reproduced, stored in a retrieval system, or transmitted, on any form or by any means, electronic, mechanical, photocopying, recording, or otherwise, without the prior written permission of HSBC Asset Management (India) Private Ltd.
Mutual Fund investments are subject to market risks, read all scheme related documents carefully.

HSBC Asia Pacific (Ex Japan) Dividend Yield FundAn open ended fund of fund Scheme investing in HSBC Global Investments Fund - Asia Pacific Ex Japan Equity High Dividend Fund
Abridged Annual Report 2017 - 2018

1
Dear Investor,
Globally, we are witnessing a very interesting phase. The equity markets delivered a stellar performance in 2017. However, there are worries about the impact of higher rates, global trade wars, an economic growth moderation and higher volatility.
Closer home, India has become the world’s sixth-biggest economy. India has doubled its GDP to USD 2.2 trillion within a decade. The introduction of reform measures, including demonetisation and the Goods and Services Tax (GST), had put pressure on selective parts of the economy in 2017. The impact of these measures is likely to be transitory. India’s economic growth is expected to accelerate from 6.7% in FY18 to 7.4% in the current year as per IMF forecasts.
There has been a shift in the domestic savings pool supporting the market. Domestic investors have been increasing exposure to equities and financial assets moving away from gold and real estate. Mutual funds witnessed sizable inflows on the back of the boost in liquidity within the banking system from demonetisation. The AUM of the mutual fund industry grew by 21.7% in March 2018 compared to March 2017.
With growth, comes responsibility. Last year, the regulator, Securities and Exchange Board of India (SEBI) issued a circular to rationalise and categorise mutual fund schemes in India. We are pleased to state that none of our funds needed to be redesigned. All our schemes have been defined as per the new categorisation. We believe this classification will simplify investing into mutual funds and enhance comparability within the schemes offered.
As India moves to a digital age, e-commerce platforms are becoming increasingly popular. I request you to logon to our online transaction platform. It is a quick, convenient and an efficient tool to invest into our funds and manage your investments online.
At HSBC Global Asset Management, India, we are dedicated to one goal: delivering exceptional investment management for our clients. By bringing together our

2
global investment knowledge and capabilities, we are able to offer specialised expertise across asset classes. This has helped us to become a trusted partner to our individual and institutional investors.
We remain committed to our long-term perspective and disciplined investment approach as we conduct a rigorous, fundamental analysis of investments with a strong emphasis on risk management. Although the investment landscape appears favourable, it is worth remembering that markets are dynamic and constantly evolving. Therefore, we believe active, professional investment management serves investors well. Amid changing markets and economic conditions, we are confident that investors with a well-diversified portfolio and a patient, long-term outlook should be well positioned for the years ahead.
Together we thrive.
Warm regards,
Ravi Menon
Chief Executive Officer, HSBC Global Asset Management, India

3
SPONSORHSBC Securities and Capital Markets (India) Private LimitedRegd. Office: 52/60, Mahatma Gandhi Road, Fort, Mumbai - 400 001.
TRUSTEEBoard of TrusteesOffice: 16, Veer Nariman Road, Fort, Mumbai 400 001.
ASSET MANAGEMENT COMPANYHSBC Asset Management (India) Private LimitedCorp. & Regd. Office: 16, Veer Nariman Road, Fort, Mumbai 400 001.
CUSTODIANStandard Chartered Bank (SCB)Corp. & Regd. Office: Crescenzo, Securities Services, 3rd Floor, C-38/39, G-Block, Bandra Kurla Complex, Bandra East, Mumbai – 400051.
AUDITORS TO THE SCHEMEBSR & Co. LLPChartered Accountants 5th Floor, Lodha Excelus, Apollo Mills Compound, N.M. Joshi Marg, Mahalaxmi, Mumbai 400 011.
REGISTRAR & TRANSFER AGENTSComputer Age Management Services Private Limited (CAMS)Unit: HSBC Mutual Fund ’C’ Block, 2nd Floor, Hanudev Info Park P. Ltd., SF No. 558/2, Udayampalayam Road, Nava India, Coimbatore - 641 028.
BOARD OF TRUSTEESMr. Nasser Munjee
Mr. Manu Tandon
Mr. Mehli Mistri
Mr. Dilip J. Thakkar
Ms. Jasmine Batliwalla
Mr. Pedro Bastos
BOARD OF DIRECTORSMs. Kishori J. Udeshi - Chairperson
Mr. S. P. Mustafa
Mr. Dinesh Mittal
Mr. Ravi Menon - Chief Executive Officer

4
The Trustees of HSBC Mutual Fund (“Fund”) present the Sixteenth Annual Report and the audited abridged financial statements of the schemes of the Fund for the year ended March 31, 2018.
As at March 31, 2018, the Fund offered 30 schemes across asset classes to meet the varying investment needs of the investors. Notably, three Schemes of HSBC Mutual Fund viz. HSBC Large Cap Equity Fund, HSBC Short Duration Fund and HSBC Cash Fund have completed 15 years of operations during the year.
During the year, the Fund has launched Plan(s) under Fixed Term Series and carried out merger of the existing schemes viz HSBC Dividend Yield Equity Fund merged into HSBC Multi Cap Equity Fund (HMEF), erstwhile HSBC India Opportunities Fund, as offering sub-scale fund was not in the interest of the unitholders.
Further, in order to bring uniformity in the practice across Mutual Funds and to standardize the scheme categories and characteristics of schemes, SEBI vide its circular no. SEBI/HO/IMD/DF3/CIR/P/2017/114 dated October 06, 2017, issued guidelines for categorization and rationalization of Mutual Fund schemes.
Accordingly, HSBC Large Cap Equity Fund (erstwhile HSBC Equity Fund), HSBC Small Cap Equity Fund (erstwhile HSBC Mid Cap Equity Fund) , HSBC Infrastructure Equity Fund, HSBC Global Emerging Market Fund (erstwhile HSBC Emerging Market Fund), HSBC Debt Fund (erstwhile HSBC Income Fund – Investments Plan), HSBC Short Duration Fund (erstwhile HSBC Income Fund – Short Term Plan), HSBC Low Duration Fund (erstwhile HSBC Ultra Short Term Bond Fund), HSBC Regular Savings Fund (erstwhile HSBC Monthly Income Plan), and HSBC Managed Solutions have undergone fundamental attributes changes with effective from March 14, 2018.
The Fund continues its focus on delivering consistent long term returns. The comments on the performance of the Scheme(s) is provided hereinafter. Dividends were declared under various schemes as per the provisions contained in the respective Scheme Information Documents after considering the distributable surplus available under the respective Schemes. Details of dividends declared can be viewed on our website at www.assetmanagement.hsbc.com/in.
1. Scheme Performance, future outlook and oPerationS of the SchemeS
a. Operations and Performance of the Schemes
HSBC Asia Pacific (Ex Japan) Dividend Yield Fund (HAPDF) (An open ended fund of fund Scheme investing in HSBC Global Investments Fund - Asia Pacific Ex Japan Equity High Dividend Fund)
HAPDF seeks to provide long term capital appreciation by investing predominantly in units of HSBC Global Investment Funds (HGIF) Asia Pacific Ex Japan Equity High Dividend Fund. The Scheme may, also invest a certain proportion of its corpus in money market instruments and / or units of liquid mutual fund schemes, in order to meet liquidity requirements from time to time. However, there is no assurance that the investment objective of the Scheme will be achieved.
The net assets of HAPDF amounted to Rs. 8.12 crores as on March 31, 2018 as compared to 9.79 crores as at March 31, 2017. Around 96.73 % of the net assets were invested in HSBC Global Investment Funds (HGIF) Asia Pacific Ex Japan Equity High Dividend Fund (overseas mutual fund), 3.27% of the net assets comprised of reverse repos/CBLO and net current assets as at March 31, 2018.
HAPDF underperformed its benchmark on account of the performance of its underlying fund.
Scheme Name & Benchmarks Absolute Returns
(%)
Compounded Annualized Returns (%)
Date of Inception : 24 February 2014 1 Year 3 Years Since Inception
HSBC Asia Pacific (Ex Japan) Dividend Yield Fund – Growth 15.56 8.84 7.66
MSCI AC Asia Pacific Ex Japan (Scheme Benchmark) 19.87 9.55 9.43
Nifty 50 (Standard Benchmark) 12.68 7.99 14.18
Rs. 10,000, if invested in HAPDF, would have become 11,556 12,899 13,524
Trustees’ ReportFor the year ended March 31, 2018

5
Scheme Name & Benchmarks Absolute Returns
(%)
Compounded Annualized Returns (%)
Date of Inception : 24 February 2014 1 Year 3 Years Since Inception
Rs. 10,000, if invested in MSCI AC Asia Pacific ex Japan, would have become
11,987 13,154 14,457
Rs. 10,000, if invested in Nifty 50, would have become 11,268 12,599 17,202
Past performance may or may not be sustained in future. The returns for the respective periods are provided as on last business day of March 2018 for Growth Option. Different plans shall have a different expense structure. Performance of the respective benchmark is calculated as per the Total Return Index (TRI).
b. Market Overview & Outlook (as furnished by HSBC Asset Management (India) Private Limited)
EqUITY OUTLOOKIndian equity markets continued to remain strong during fiscal year 2017-18 and posted gains of 11.76% by S&P CNX Nifty and 13.24% by BSE Midcap index respectively. Biggest drivers of the markets were, robust DII flow into equities, continued push of mega reforms – Goods and Services Tax (GST) implementation, Insolvency and Bankruptcy Code implementation, Real Estate (Regulation and Development) Act, second consecutive normal monsoon, and electoral victories of the ruling party in many state elections. On the other hand, the markets weather the storm of disruption in economy due to GST implementation, lingering impact of demonetization, muted FII flows, and rising yields in developed markets. Domestic Mutual Fund segment had their best ever year and they brought in ~USD 22 bn of net inflows in equities during the year. Even after witnessing ~USD 4.3 bn of net outflows from the domestic insurers, the net DII tally was a very impressive ~USD 17.7 bn of net inflows. There were mixed global cues well and the Foreign Institutional Investors (FIIs) net bought Indian equities worth USD 3.2 bn. The inflows by both FIIs and domestic MFs acted as a factor in the strong market performance.
Indices Returns (April 1, 2017 to March 31, 2018) 1 Year (%)
S&P BSE Sensex 12.70%
NSE CNX Nifty 11.76%
S&P BSE 100 12.12%
S&P BSE 200 12.49%
S&P BSE 500 13.21%
S&P BSE Midcap 14.31%
S&P BSE 250 Small-cap 14.13%
Source: Bloomberg (All values are total return)
Our view on the key aspects related to equity markets are presented below -
The impressive performance in equity markets during FY 2017-18 has come on the back of strong liquidity largely by domestic MFs but supported in party by FII flows, positive global growth, benign macro – both domestically and global, expectation of the continuation of favorable policy environment domestically and expectation of corporate earnings revival. Possibility of sound macro, economic reforms and implementation of existing reforms have increased, especially after continued success of the ruling party at the centre in state elections. However, after this strong performance in markets and rather long wait for earnings to be delivered has meant that the equity markets are currently trading above their historical averages.
Moving into FY 2018-19, we expect a continuation of the economic recovery process domestically, recovery in corporate earnings - led early by volume growth, and continued DII flows. Government led investment
Trustees’ ReportFor the year ended March 31, 2018 (Contd...)

6
spending and rural consumption are likely to lead with private sector investments contributing later (possibly after general elections 2019). The budget document that was presented in early February provides a good medium term policy direction for the economy. Occasionally the policy actions can serve up a few bumps and jolts but over the medium term, across different governments, there is a thread of continuity connecting many key economic policies such as in the case of this year’s union budget. We, in our investment process, prefer to take comfort in these threads of continuity and remain constructive on the India growth story. This makes us positive on the Indian equity markets over the medium to long term.
Risks are in the form of market valuations trending above historical averages, weaker than expected delivery in corporate earnings going forward, external news flows related to trade protectionism, developed market central banks raising rates prematurely, and geopolitical tensions and other eco-political events would also influence market performance going forward, as the recent rally in the markets was supported by strong FII inflows.
DEBT OUTLOOKFixed Income in Financial Year 2017-18 has seen volatility further step up in this year. Markets went to perfect storm with higher crude prices, low liquidity and pressure on currency, apart from rate hike expectations.
Inflation has followed the glide path to lower numbers towards 4% RBI target and even lower than the target number when inflation printed a lowly 1.46% in June 2018 on back of lower food prices. RBI went for a cut despite of neutral stance. This positivity continued till until crude shock came in form of higher crude process. Global prices of Brent crude saw substantial increase in second half of the year, which jeopardized the inflation path. Other worries that gathered around this time were related to GST collection and eventual impact on fiscal situation.
Government of India allowed the fiscal deficit to slip to 3.5% (budget 3.2%) and kept next year target at 3.3% (in place of earlier path of 3%). This was on back of some excise relaxation for oil products and a month less collected for GST due to implementation in the current year. The fear of fiscal slippage alongwith the announcement of higher bond issuances spooked the bond markets into higher yields. Government finally borrowed only INR 90 bln extra (in place of INR 500 bln announced initially).
On the Monetary front the year was very volatile as well. RBI changed its stance to neutral causing some worry around rate hikes. Thereafter it cut rates and again went for OMO sales operations simultaneously. This created some confusion in the market participants regarding rates direction. Finally extra supply, higher oil prices and higher inflation paved way for rates higher. RBI also held position on regulatory forbearance about spreading out losses by banks publicly. It eventually gave up the position in the end of March. However, the swift changes in stance caused lot of pressure and volatility in bonds.
Liquidity situation continuously deteriorated due to OMO sales initially and withdrawal of deposits due to remonetisation. Further liquidity was absorbed out due to portfolio outflows and reduction in reserves. Despite of defense from RBI utilizing the reserves, the currency depreciated meaningfully, which caused further jitters in foreign investor sentiments. Lack of liquidity also affected 1-3 year rates which were elevated in second half of the year.
Going forward following are key variables to watch out for:• Liquidity: Liquidity will drive short end rates and eventually drive decisions leading to market interventions
and CRR cuts. RBI has focused now on neutral liquidity stance and providing liquidity to system, which will bode well short end rates.
• Inflation: Inflation numbers will determine future course of action for RBI and remains a critical variable for policy. We expect inflation to remain at 4.7% level in the ease in second half of FY 2018-19 in line with RBI’s expectations.
• Growth: GDP growth numbers as well as industrial activity will also determine the decision on policy.
• Fiscal deficit: Fiscal deficit and government spending will determine the government borrowing and crowding out in interest rate curve. We expect prudence in government spending and prospect of spending on infrastructure to pick up which will crowd in private investment as well.
• Current Account Deficit: Current Account Deficit determines how the pressure on currency works and effective management of forex reserves.
Trustees’ ReportFor the year ended March 31, 2018 (Contd...)

7
• Currency levels: Level of INR will determine how the central bank reacts to the situation on the global crisis etc.
2. Brief Background of SPonSorS, Board of truSteeS and aSSet management comPany
a. Sponsor
HSBC Mutual Fund is sponsored by HSBC Securities and Capital Markets (India) Private Limited (HSCI). The Sponsor is the Settler of the Mutual Fund Trust. The Sponsor has entrusted a sum of Rs. 1,00,000 (Rupees One Lakh only) to the Trustee as the initial contribution towards the corpus of the Mutual Fund.
HSCI offers integrated investment banking services, securities and corporate finance & advisory. HSCI is a member of the Bombay Stock Exchange Limited and National Stock Exchange (capital and derivative market segments). HSCI holds 100% of the paid up equity share capital of HSBC Asset Management (India) Private Limited.
b. HSBC Mutual Fund
HSBC Mutual Fund (“the Mutual Fund” or “the Fund”) has been constituted as a Trust in accordance with the provisions of the Indian Trusts Act, 1882 (2 of 1882) vide a Trust Deed dated February 7, 2002 with HSBC Securities and Capital Markets (India) Private Limited, as the Sponsor and the Board of Individual Trustees. The Trustee has entered into an Investment Management Agreement dated February 7, 2002 with HSBC Asset Management (India) Private Limited (AMC) to function as the Investment Manager for all the schemes of the Fund. The Fund was registered with SEBI vide registration number MF/046/02/5 dated May 27, 2002.
The Trust has been formed for the purpose of pooling of capital from the public for collective investment in securities for the purpose of providing facilities for participation by persons as beneficiaries in such investments and in the profits/income arising therefrom.
c. Board of Trustees (the Trustees)
The Board of Trustees is the exclusive owner of the Trust Fund and holds the same in trust for the benefit of the unit holders. The Trustees have been discharging their duties and carrying out the responsibilities as provided in the SEBI (Mutual Funds) Regulations, 1996 and the Trust Deed. The Trustees seek to ensure that the Fund and the schemes floated there under are managed by the AMC in accordance with the Trust Deed, the said Regulations, directions and guidelines issued by the SEBI, the Stock Exchanges, the Association of Mutual Funds in India and other regulatory agencies.
d. Asset Management Company (the AMC)
HSBC Asset Management (India) Private Limited (the Investment Manager or the AMC) is a private limited company incorporated under the Companies Act, 1956 on December 12, 2001 having its Registered Office at 16, V. N. Road, Fort, Mumbai 400 001. HSBC Asset Management (India) Private Limited has been appointed as the Asset Management Company of HSBC Mutual Fund by the Trustee vide Investment Management Agreement (IMA) dated February 7, 2002 and executed between the Trustees and the AMC. SEBI approved the AMC to act as the Investment Manager of the Fund vide its letter No. MFD/BC/163/2002 dated May 27, 2002. The paid-up equity share capital of the AMC is Rs. 61.59 crores. The AMC is registered as a Portfolio Manager under the SEBI (Portfolio Managers) Regulations, 1993 vide registration no. INP000001322. The AMC also offers non-binding Advisory services to offshore funds under the mutual fund license.
HSBC Securities and Capital Markets (India) Private Limited holds 100% of the paid up equity share capital of the AMC.
3. inveStment oBjective of the SchemeS The investment objective of the respective schemes has been provided above under the heading “Scheme
Performance, Future Outlook and Operation of the Scheme” (Refer Section 1).
Trustees’ ReportFor the year ended March 31, 2018 (Contd...)

8
4. Significant accounting PolicieS The Significant Accounting Policies form part of the Notes to the Accounts annexed to the Balance Sheet
of the Schemes in the Full Annual Report. The accounting policies are in accordance with Securities Exchange Board of India (Mutual Funds) Regulations 1996.
5. unclaimed dividendS & redemPtionS Number of investors & corresponding amount as on March 31, 2018 is Nil.
6. inveStor ServiceSThe number of official points of acceptance of transactions is 205 locations. In addition to the offices of the Registrar & Transfer agents, the AMC has Investor Service Centres in 9 locations at its own offices - namely Mumbai, New Delhi, Kolkata, Bangaluru, Pune, Ahmedabad, Hyderabad, Chandigarh and Chennai. With a view to enhance customer convenience, the AMC has the facility of priority based servicing to key distributors through the enhancement of the Interactive Voice Reponses. The AMC has a single Toll Free number which can be dialed from anywhere in India. The call centre service is being managed by the Registrar and Transfer Agents.
On the distribution front, the number of empanelled distributors was 460 as on March 31, 2018. During the year, the AMC initiated tie-ups for online distribution of the Mutual Fund’s schemes with several channel partners taking the total number of such tie-ups to 42.
7. detailS of inveStor grievance redreSSalThe details of the redressal of investor complaints received against HSBC Mutual Fund during April 2017 - March 2018 are as follows:
2017-2018
Com- plaint Code
Type of complaint (a) No. of complaints
pending at the
beginning of the year
(b) No. of complaints received during
the year
Action on (a) and (b)
Resolved Non Actiona-
ble*
Pending
Within 30
days
30 - 60 days
60 - 180 days
Beyond 180 days
0 - 3 months
3 - 6 months
6 - 9 months
9 - 12 months
I A Non receipt of Dividend on Units
0 5 4 1 0 0 0 0 0 0 0
I B Interest on delayed payment of Dividend
0 0 0 0 0 0 0 0 0 0 0
I C Non receipt ofRedemption Proceeds
1 12 12 1 0 0 0 1 0 0 0
I D Interest on delayedp a y m e n t o f Redemption
0 1 1 0 0 0 0 0 0 0 0
II A Non receipt of Statement of Account / Unit Certificate
0 0 0 0 0 0 0 0 0 0 0
II B D i s c r e p a n c y i n Statement of Account
0 0 0 0 0 0 0 0 0 0 0
II C Data corrections in Investor details **
0 34 34 0 0 0 0 0 0 0 0
II D Non receipt of Annual Report /Abridged Summary
0 0 0 0 0 0 0 0 0 0 0
III A Wrong switch between Schemes
0 0 0 0 0 0 0 0 0 0 0
Trustees’ ReportFor the year ended March 31, 2018 (Contd...)

9
2017-2018
Com- plaint Code
Type of complaint (a) No. of complaints
pending at the
beginning of the year
(b) No. of complaints received during
the year
Action on (a) and (b)
Resolved Non Actiona-
ble*
Pending
Within 30
days
30 - 60 days
60 - 180 days
Beyond 180 days
0 - 3 months
3 - 6 months
6 - 9 months
9 - 12 months
III B Unauthorized switch between Schemes
0 0 0 0 0 0 0 0 0 0 0
III C Deviation from Scheme attributes
0 0 0 0 0 0 0 0 0 0 0
III D Wrong or excess charges / load
0 0 0 0 0 0 0 0 0 0 0
III E Non updat ion of changes viz. address, PAN, bank details, nomination, etc
0 6 6 0 0 0 0 0 0 0 0
IV Others 1 41 42 0 0 0 0 0 0 0 0
Total 2 99 99 2 0 0 0 0 0 0 0
Summary of Complaints for FY 2017-18
Particulars Count
Total complaints received 99
Total number of folios 140099
% of complaints against the folio 0.071%
# active folios** As per AMFI Best Practice Guidelines Circular No.25/2011-12 for Revisions in the Guidelines on
Standardization of Complaints/Grievances Reporting Procedure. If “Others” include a type of complaint which is more than 10% of overall complaints, then such a reason should be provided separately. Hence data corrections in Investor Details is included as a separate category
* Non actionable means the complaint is incomplete / outside the scope of the mutual fund
8. inveStor education initiativeS The Fund undertook various investor education and awareness initiatives related to investments in mutual funds throughout India in English / Hindi and Regional languages via mass media. The Fund conducted 16 roadshows at various locations in India to promote various Investor Awareness related topics including Asset Allocation, SIPs, Equity Mutual Funds and Financial Planning. The Fund has a Year-long tie-up with Mutual Fund Insights Magazine that includes 3 pages of content and advertorial publication in their monthly issue. Each issue contains a story promoting SIPs to achieve one’s various investment goals. In the month of December 2017 and January 2018 investor awareness promotion was done through Outlook and Outlook Money magazines through advertorials on various Mutual Fund topics.
9. Statutory detailSa) The Sponsors are not responsible or liable for any loss resulting from the operation of the Schemes of
the Fund beyond initial contribution of Rs. 1 lakh for setting up the Fund.
b) The price and redemption value of the units, and income from them, can go up as well as down with fluctuations in the market value of its underlying investments.
c) Full Annual Report shall be disclosed on the website at www.assetmanagement.hsbc.com/in and shall be available for inspection at the Head Office of the Mutual Fund. Present and prospective unit holders
Trustees’ ReportFor the year ended March 31, 2018 (Contd...)

10
can obtain copy of the Trust Deed, the full Annual Report of the Scheme(s), the Annual Report of HSBC Asset Management (India) Private Limited and the text of the relevant Scheme(s) at a price.
10. acknowledgementSThe Trustees wish to thank the Unit holders of the Schemes for their support throughout the year and also thank the Government of India, the Securities and Exchange Board of India (SEBI), the Reserve Bank of India (RBI) and the Association of Mutual Funds in India (AMFI) for the guidance provided by them. The Trustees also appreciate the services provided by the Registrar and Transfer Agent, Fund Accountant, Custodian, Bankers, Distributors and Brokers. The guidance and services provided by the Auditors and advocates and the ebullience, sincerity and dedication of the employees of HSBC Asset Management (India) Private Limited is also appreciated.
The Trustees look forward to the continued support of everyone.
For and on behalf of the Board of Trustees of HSBC Mutual Fund
Sd/-
Dilip Thakkar
Trustee
Mumbai
July 17, 2018.
Trustees’ ReportFor the year ended March 31, 2018 (Contd...)
11
To the Board of Trustees
HSBC Mutual Fund – HSBC Asia Pacific (Ex Japan) Dividend Yield Fund
Report on the Financial StatementsWe have audited the accompanying Financial Statements of HSBC Asia Pacific (Ex Japan) Dividend Yield Fund (the ‘Scheme’), which comprise the balance sheet as at 31 March 2018 and the related revenue account for the year then ended, and a summary of significant accounting policies and other explanatory information, annexed thereto.
Management’s responsibility for the Financial StatementsThe Board of Trustees to the HSBC Mutual Fund (the ‘Board of Trustees’) and HSBC Asset Management (India) Private Limited (the ‘AMC’), being the investment manager to HSBC Mutual Fund (the ‘Fund’) (collectively referred as ‘Management’), are responsible for the preparation of these financial statements that give a true and fair view of the financial position and financial performance of the Scheme in accordance with the accounting policies and standards specified in the Ninth Schedule of the Securities and Exchange Board of India (Mutual Funds) Regulations, 1996, as amended (the ‘Regulations’) and the accounting principles generally accepted in India. This responsibility includes maintenance of adequate accounting records for safeguarding of the assets of the Scheme and for preventing and detecting frauds and other irregularities; selection and application of appropriate accounting policies; making judgments and estimates that are reasonable and prudent; and design, implementation and maintenance of adequate internal financial controls, that were operating effectively for ensuring the accuracy and completeness of the accounting records, relevant to the preparation and presentation of the financial statements that give a true and fair view and are free from material misstatement, whether due to fraud or error.
In preparing the financial statements, management is responsible for assessing the Scheme’s ability to continue as a going concern, disclosing, as applicable, matters related to going concern and using the going concern basis of accounting unless management either intends to liquidate the Fund or to cease operations, or has no realistic alternative but to do so.
Auditor’s responsibilityOur responsibility is to express an opinion on these financial statements based on our audit. We conducted our audit in accordance with the Standards on Auditing issued by the Institute of Chartered Accountants of India (the ‘ICAI’). Those Standards require that we comply with ethical requirements and plan and perform the audit to obtain reasonable assurance about whether the financial statements are free from material misstatement.
An audit involves performing procedures to obtain audit evidence about the amounts and disclosures in the financial statements. The procedures selected depend on the auditor’s judgment, including the assessment of the risks of material misstatement of the financial statements, whether due to fraud or error. In making those risk assessments, the auditor considers internal controls relevant to preparation and fair presentation of the financial statements, of the Scheme, in order to design audit procedures that are appropriate in the circumstances, but not for the purpose of expressing an opinion on the effectiveness of the Scheme’s internal controls. An audit also includes evaluating the appropriateness of accounting policies used and the reasonableness of the accounting estimates made by Management, as well as evaluating the overall presentation of the financial statements.
We are also responsible to conclude on the appropriateness of management’s use of the going concern basis of accounting and, based on the audit evidence obtained, whether a material uncertainty exists related to events or conditions that may cast significant doubt on the Scheme’s ability to continue as a going concern. If we conclude that a material uncertainty exists, we are required to draw attention in the auditor’s report to the related disclosures in the financial statements or, if such disclosures are inadequate, to modify the opinion. Our conclusions are based on the audit evidence obtained up to the date of the auditor’s report. However, future events or conditions may cause the Scheme to cease to continue as a going concern.
We believe that the audit evidence we have obtained is sufficient and appropriate to provide a basis for our audit opinion.
Independent Auditors’ Report

12
Independent Auditors’ Report (Contd...)
OpinionIn our opinion, and to the best of our information and according to the explanations given to us, the aforesaid financial statements give the information required by the Regulations in the manner so required and give a true and fair view in conformity with the accounting principles generally accepted in India:
(i) in the case of the balance sheet, of the state of affairs of the Scheme as at 31 March 2018; and
(ii) in the case of the revenue account, of the net surplus for the year ended on that date.
Report on other Legal and Regulatory Requirements1 As required by Regulation 55(4) to the Regulations, we report that:
(a) We have obtained all information and explanations which, to the best of our knowledge and belief, were necessary for the purposes of the audit;
(b) The balance sheet and revenue account have been prepared in accordance with the accounting policies and standards specified in the Ninth Schedule of the Regulations.
2 As required by Clause 5(ii)(2) of the Eleventh Schedule of the Regulations, we report that the balance sheet and revenue account are in agreement with the books of account of the Scheme.
3 In our opinion and on the basis of information and explanations given to us, the methods used to value non - traded securities, as at 31 March 2018, as determined by the Board of Directors of AMC, are in accordance with the Regulations and other guidelines issued by the Securities and Exchange Board of India as applicable and approved by the Board of Trustees are fair and reasonable.
For B S R & Co. LLP Chartered Accountants Firm’s Registration No: 101248W/W-100022
Milind Ranade Partner Membership No: 100564
Place : Mumbai Date : July 17, 2018.

13
Abridged Balance Sheet as at March 31, 2018
Rs. in Lakhs
HSBC ASIA PACIFIC (EX JAPAN) DIVIDEND YIELD FUND
As at March 31, 2018
As at March 31, 2017
LIABILITIES1 Unit Capital 598.78 839.16 2 Reserves & Surplus2.1 Unit Premium Reserves (58.90) (46.83)2.2 Unrealised Appreciation Reserve 160.27 100.07 2.3 Other Reserves 111.95 86.23 3 Loans & Borrowings – – 4 Current Liabilities & Provisions4.1 Provision for doubtful Income/Deposits – – 4.2 Other Current Liabilities & Provisions 2.86 9.67
TOTAL 814.96 988.30
ASSETS1 Investments1.1 Listed Securities:1.1.1 Equity Shares – – 1.1.2 Preference Shares – – 1.1.3 Equity Linked Debentures – – 1.1.4 Other Debentures & Bonds – – 1.1.5 Securitised Debt securities – – 1.2 Securities Awaited Listing:1.2.1 Equity Shares – – 1.2.2 Preference Shares – – 1.2.3 Equity Linked Debentures – – 1.2.4 Other Debentures & Bonds – – 1.2.5 Securitised Debt securities – – 1.3 Unlisted Securities1.3.1 Equity Shares – – 1.3.2 Preference Shares – – 1.3.3 Equity Linked Debentures – – 1.3.4 Other Debentures & Bonds – – 1.3.5 Securitised Debt securities – – 1.4 Government Securities – – 1.5 Treasury Bills – – 1.6 Commercial Paper – – 1.7 Certificate of Deposits – – 1.8 Bill Rediscounting – – 1.9 Units of Domestic Mutual Fund – – 1.10 Foreign Securities 785.55 958.72
Total Investments 785.55 958.72
2 Deposits 0.38 0.05 3 Other Current Assets3.1 Cash & Bank Balance 2.00 0.72 3.2 CBLO/Reverse Repo Lending 27.01 28.79 3.3 Others 0.02 0.02 4 Deferred Revenue Expenditure (to the extent not written off) – –
TOTAL 814.96 988.30
Notes to Accounts – Annexure I

14
Abridged Revenue Account for the year ended March 31, 2018
Rs. in Lakhs
HSBC ASIA PACIFIC (EX JAPAN)DIVIDEND YIELD FUND
Current Year ended
March 31, 2018
Previous Year ended
March 31, 2017
1 INCOME1.1 Dividend 20.32 35.401.2 Interest 1.53 1.521.3 Realised Gain / (Loss) on Foreign Exchange Transactions (1.22) (1.44)1.4 Realised Gains / (Losses) on Interscheme sale of investments – –1.5 Realised Gains / (Losses) on External sale / redemption of
investments45.67 6.88
1.6 Realised Gains / (Losses) on Derivative Transactions – –1.7 Other Income – –
(A) 66.30 42.36
2 EXPENSES2.1 Management fees 2.67 6.132.2 GST / Service tax on Management fees 0.45 0.912.3 Transfer agents fees and expenses 0.50 0.592.4 Custodian fees 1.73 1.822.5 Trusteeship fees 0.02 0.032.6 Commission to Agents 5.46 8.042.7 Marketing & Distribution expenses – 0.022.8 Audit fees 0.20 0.202.9 Investor Education Expenses 0.16 0.222.10 Other operating expenses 0.44 0.582.11 Less: Expenses to be Reimbursed by the Investment Manager – (0.02)
(B) 11.63 18.52
3 NET REALISED GAINS / (LOSSES) FOR THE YEAR (A -B = C) 54.67 23.84
4 Change in Unrealised Depreciation in value of investments*** (D) – 57.07
5 NET GAINS / (LOSSES) FOR THE YEAR [E=(C+D)] 54.67 80.91
6 Change in unrealised appreciation in the value of investments and derivatives (F) 60.20 100.07
7 NET SURPLUS / (DEFICIT) FOR THE YEAR (E + F = G) 114.87 180.98
7.1 Add: Balance transfer from Unrealised Appreciation Reserve – –7.2 Less: Balance transfer to Unrealised Appreciation Reserve 60.20 100.077.3 Add / (Less): Equalisation (28.95) (34.96)7.4 Transfer from Reserve Fund 86.23 40.28
8 Total 111.95 86.23
9 Dividend appropriation9.1 Income Distributed during the year – –9.2 Tax on income distributed during the year – –
10 Retained Surplus / (Deficit) carried forward to Balance sheet 111.95 86.23
Notes to Accounts – Annexure I*** Includes Unrealised Depreciation in the value of Foreign Currency Transactions.
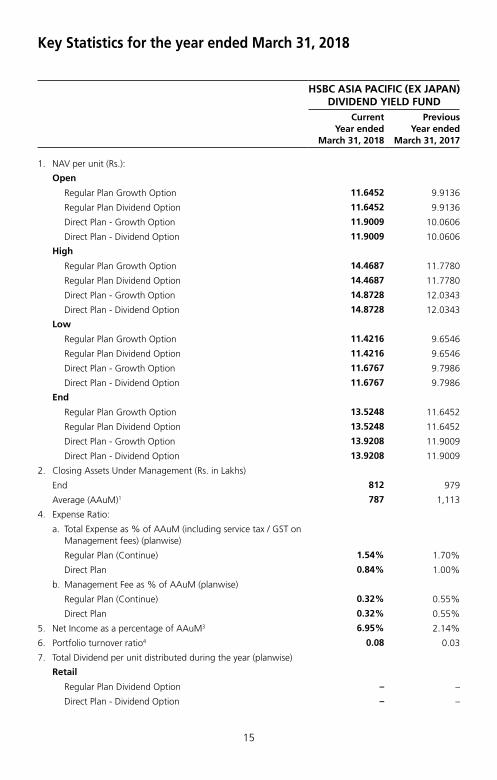
15
Key Statistics for the year ended March 31, 2018
HSBC ASIA PACIFIC (EX JAPAN)DIVIDEND YIELD FUND
Current Year ended
March 31, 2018
Previous Year ended
March 31, 2017
1. NAV per unit (Rs.):
Open
Regular Plan Growth Option 11.6452 9.9136
Regular Plan Dividend Option 11.6452 9.9136
Direct Plan - Growth Option 11.9009 10.0606
Direct Plan - Dividend Option 11.9009 10.0606
High
Regular Plan Growth Option 14.4687 11.7780
Regular Plan Dividend Option 14.4687 11.7780
Direct Plan - Growth Option 14.8728 12.0343
Direct Plan - Dividend Option 14.8728 12.0343
Low
Regular Plan Growth Option 11.4216 9.6546
Regular Plan Dividend Option 11.4216 9.6546
Direct Plan - Growth Option 11.6767 9.7986
Direct Plan - Dividend Option 11.6767 9.7986
End
Regular Plan Growth Option 13.5248 11.6452
Regular Plan Dividend Option 13.5248 11.6452
Direct Plan - Growth Option 13.9208 11.9009
Direct Plan - Dividend Option 13.9208 11.9009
2. Closing Assets Under Management (Rs. in Lakhs)
End 812 979
Average (AAuM)1 787 1,113
4. Expense Ratio:
a. Total Expense as % of AAuM (including service tax / GST on Management fees) (planwise)
Regular Plan (Continue) 1.54% 1.70%
Direct Plan 0.84% 1.00%
b. Management Fee as % of AAuM (planwise)
Regular Plan (Continue) 0.32% 0.55%
Direct Plan 0.32% 0.55%
5. Net Income as a percentage of AAuM3 6.95% 2.14%
6. Portfolio turnover ratio4 0.08 0.03
7. Total Dividend per unit distributed during the year (planwise)
Retail
Regular Plan Dividend Option – –
Direct Plan - Dividend Option – –

16
HSBC ASIA PACIFIC (EX JAPAN)DIVIDEND YIELD FUND
Current Year ended
March 31, 2018
Previous Year ended
March 31, 2017
Corporate
Regular Plan Dividend Option – –
Direct Plan - Dividend Option – –
8. Returns(%):
a. Last One Year
Scheme
Regular Plan Growth Option 15.5647 17.4669
Direct Plan - Growth Option 16.3916 18.2921
Benchmark
MSCI AC Asia Pacific ex Japan 19.8700 14.9176
b. Since Inception
Scheme
Regular Plan Growth Option 7.6642 5.0382
Direct Plan - Growth Option 8.4247 5.7770
Benchnmark
MSCI AC Asia Pacific ex Japan 9.4300 1.4566
1 AAuM=Average daily net assets2 Gross income = amount against (A) in the Revenue account i.e. Income3 Net income = amount against (C) in the Revenue account i.e. Net Realised Gains / (Losses) for the year4 Portfolio Turnover = Lower of sales or purchase divided by the Average AuM for the year5 The net asset value disclosed represents the computed NAV on March 31, 2018 (Non-business Day), and not
the last declared NAV.6 The Total management fees and other expenses charged by the mutual fund(s) in foreign countries along with
the management fee and recurring expenses charged to the domestic mutual fund is as follows:
Scheme TER charged by underlying Fund ***
TER of the domestic Fund***
Total TER ***
Maximum TER Cap as per circular ***
2017-18
HSBC Asia Pacific (Ex Japan) Dividend Yield Fund 0.65% 1.49% 2.14% 2.70%
2016-17
HSBC Asia Pacific (Ex Japan) Dividend Yield Fund 0.65% 1.63% 2.28% 2.70%
*** The TER excludes GST / Service Tax on Management fees
Key Statistics for the year ended March 31, 2018 (Contd...)

17
Notes to Accounts – Annexure ITo the Abridged Balance Sheet and Revenue Account for the Year ended March 31, 2018
HSBC ASIA PACIFIC (EX JAPAN) DIVIDEND YIELD FUND1 Investments:
1.1 It is confirmed that investments of the Scheme are registered in the name of the Trustees for the benefit of the Scheme’s unitholders.
1.2 Open Positions of derivatives as of years ended March 31, 2018 and March 31, 2017 are NIL.
1.3 Investments in Associates and Group Companies as of period ended March 31, 2018 and March 31, 2017 are NIL.
1.4 Open positions of Securities Borrowed and / or Lent by the Scheme as of the years ended March 31, 2018 and March 31, 2017 are NIL.
1.5 NPAs as at years ended March 31, 2018 and March 31, 2017 are NIL.
1.6 Aggregate Unrealised Gain / Loss as at the end of the financial years end and their percentages to net assets are as under:
Security Category Amount (Rupees)
Percentage to Net Assets
Amount (Rupees)
Percentage to Net Assets
2018 2017
Foreign Securities
– Appreciation 16,022,441 19.73% 10,002,325 10.22%
– Depreciation – – – –
1.7 The aggregate value of investments securities (excluding CBLO and Reverse Repos) purchased and sold (including matured) during the financial period 2017 - 2018 (excluding accretion of discount) is Rs. 6,540,734 and 34,445,067 respectively being 8.31% and 43.76% of the average daily net assets.
The aggregate value of investments securities (excluding CBLO and Reverse Repos) purchased and sold (including matured) during the financial period 2016- 2017 (excluding accretion of discount) is Rs. 3,540,439 and 71,549,666 respectively being 3.18% and 64.28% of the average daily net assets.
1.8 Non-Traded securities in the portfolios as at March 31, 2018 and March 31, 2017 are NIL.
2 Disclosure Under Regulation 25(8) of the Securities and Exchange Board of India (Mutual Funds) Regulations, 1996 as amended
Commission paid to Sponsor / AMC and its associates / related parties / group companies
Name of Sponsor / AMC and its associates / related parties / group companies
Nature of Association / Nature of
Relation
Period Covered
Business Given [Rs. In Crores]
% of Total Business received by the Fund
Commission paid [Rs.]
% of Total commission paid by the
Fund
The Hongkong and Shanghai Banking Corporation Limited
Associate of Investment Manager
2017-2018 1.14 67.41 415,535.38 83.34
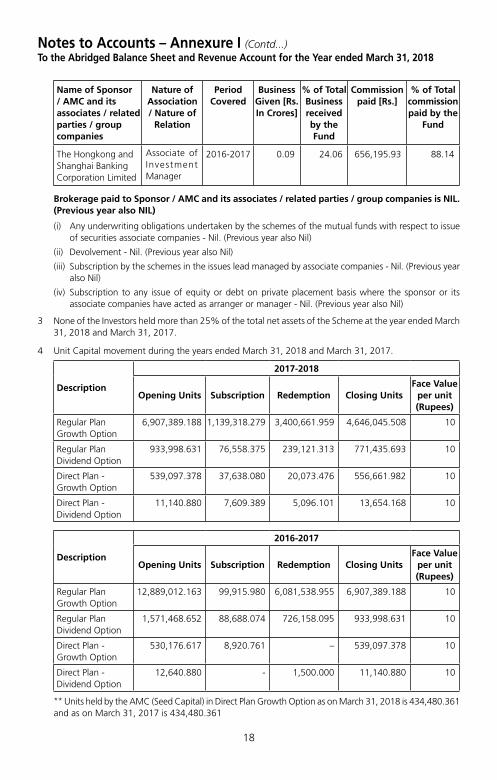
18
Name of Sponsor / AMC and its associates / related parties / group companies
Nature of Association / Nature of
Relation
Period Covered
Business Given [Rs. In Crores]
% of Total Business received by the Fund
Commission paid [Rs.]
% of Total commission paid by the
Fund
The Hongkong and Shanghai Banking Corporation Limited
Associate of Investment Manager
2016-2017 0.09 24.06 656,195.93 88.14
Brokerage paid to Sponsor / AMC and its associates / related parties / group companies is NIL. (Previous year also NIL)
(i) Any underwriting obligations undertaken by the schemes of the mutual funds with respect to issue of securities associate companies - Nil. (Previous year also Nil)
(ii) Devolvement - Nil. (Previous year also Nil)
(iii) Subscription by the schemes in the issues lead managed by associate companies - Nil. (Previous year also Nil)
(iv) Subscription to any issue of equity or debt on private placement basis where the sponsor or its associate companies have acted as arranger or manager - Nil. (Previous year also Nil)
3 None of the Investors held more than 25% of the total net assets of the Scheme at the year ended March 31, 2018 and March 31, 2017.
4 Unit Capital movement during the years ended March 31, 2018 and March 31, 2017.
Description
2017-2018
Opening Units Subscription Redemption Closing UnitsFace Value
per unit (Rupees)
Regular Plan Growth Option
6,907,389.188 1,139,318.279 3,400,661.959 4,646,045.508 10
Regular Plan Dividend Option
933,998.631 76,558.375 239,121.313 771,435.693 10
Direct Plan - Growth Option
539,097.378 37,638.080 20,073.476 556,661.982 10
Direct Plan - Dividend Option
11,140.880 7,609.389 5,096.101 13,654.168 10
Description
2016-2017
Opening Units Subscription Redemption Closing UnitsFace Value
per unit (Rupees)
Regular Plan Growth Option
12,889,012.163 99,915.980 6,081,538.955 6,907,389.188 10
Regular Plan Dividend Option
1,571,468.652 88,688.074 726,158.095 933,998.631 10
Direct Plan - Growth Option
530,176.617 8,920.761 – 539,097.378 10
Direct Plan - Dividend Option
12,640.880 - 1,500.000 11,140.880 10
** Units held by the AMC (Seed Capital) in Direct Plan Growth Option as on March 31, 2018 is 434,480.361 and as on March 31, 2017 is 434,480.361
Notes to Accounts – Annexure I (Contd...)To the Abridged Balance Sheet and Revenue Account for the Year ended March 31, 2018

19
Notes to Accounts – Annexure I (Contd...)To the Abridged Balance Sheet and Revenue Account for the Year ended March 31, 2018
5 No contingent liabilities for the years ended March 31, 2018 and March 31, 2017.
6 Expenses other than Management Fees are Inclusive of GST / Service Tax where applicable.
7 Other income credited to the Scheme is Nil ( 2017 :- NIL).
8 Investor Education Awareness
In view of the AMFI Best Practices Guidelines Circular No. 56/2015-16, the IEF ( Investor Education Fund) accrual is set aside in a separate bank account and the consolidated balance across all schemes as on March 31, 2018. The break-up of which is as under:
Particulars March 31, 2018 Amount (in Rs. Lacs)
March 31, 2017 Amount (in Rs. Lacs)
Opening Balance 44.00 –
Add: Accrual during the year 219.83 182
Less: Transferred to AMFI 101.10 83
Less: Payable to AMFI (March accrual) 8.81 8
Add: Investment Income for the year 8.28 11
Less: Spent during the year 43.17 58
Closing Balance 119.02 44
9 The Annual Accounts of the Schemes prepared in accordance with the accounting policies and standards specified in the Ninth Schedule of The Securities and Exchange Board of India (Mutual Funds) Regulations, 1996 has been approved by the Board of Directors of HSBC Asset Management (India) Private Limited and The Board of Trustees of HSBC Mutual Fund at their meetings held on July 16, 2018 and July 17, 2018 respectively. The audit report attached herewith refers to the said Annual Accounts. The aforesaid abridged accounts are an extract of the Annual Accounts and are prepared in accordance with SEBI Circular No. IMD/Cir8/132968/2008 dated July 24, 2008.

20
In view of SEBI guidelines related to “Role of Mutual Funds in Corporate Governance of Public Listed Companies”, AMIN has formulated its “Policy for Proxy Voting in Public Listed Companies”. The said policy and details of actual exercise of proxy votes along with the summary of votes cast and the auditors certification during the Financial Year 2017 – 18 is available on its website – http://www.assetmanagement.hsbc.com/in and in full Annual Report for the Financial Year 2017 – 18.
Voting Policy and Procedures

Statutory Details & DisclaimersAll returns have been sourced from Mutual Funds India Explorer software unless otherwise stated. With regard to equity schemes (including the equity component of MIPs), Fund performance is calculated on a total return basis (i.e. it includes dividends re-invested) while the benchmark is calculated on a price return basis (i.e. it does not consider dividends re-invested). This document has been prepared by HSBC Asset Management (India) Private Ltd (HSBC) for information purposes only and should not be construed as an offer or solicitation of an offer for purchase of any of the funds of HSBC Mutual Fund. All information contained in this document (including that sourced from third parties), is obtained from sources HSBC, the third party believes to be reliable but which it has not independently verified and HSBC, the third party makes no guarantee, representation or warranty and accepts no responsibility or liability as to the accuracy or completeness of such information. The information and opinions contained within the document are based upon publicly available information and rates of taxation applicable at the time of publication, which are subject to change from time to time. Expressions of opinion are those of HSBC only and are subject to change without notice. It does not have regard to specific investment objectives, financial situation and the particular needs of any specific person who may receive this document. Investors should seek financial advice regarding the appropriateness of investing in any securities or investment strategies that may have been discussed or recommended in this report and should understand that the views regarding future prospects may or may not be realized. Neither this document nor the units of HSBC Mutual Fund have been registered in any jurisdiction. The distribution of this document in certain jurisdictions may be restricted or totally prohibited and accordingly, persons who come into possession of this document are required to inform themselves about, and to observe, any such restrictions.
Investors should not invest in the Scheme solely based on the information provided in this document and should read the Scheme Information Document and Statement of Additional Information of the Fund for details. This document does not constitute an offering document.
No part of this publication may be reproduced, stored in a retrieval system, or transmitted, on any form or by any means, electronic, mechanical, photocopying, recording, or otherwise, without the prior written permission of HSBC Asset Management (India) Private Ltd.
Mutual Fund investments are subject to market risks, read all scheme related documents carefully.

HSBC Brazil FundAn open ended fund of fund Scheme investing in HSBC Global Investments Fund - Brazil Equity Fund
Abridged Annual Report 2017 - 2018

1
Dear Investor,
Globally, we are witnessing a very interesting phase. The equity markets delivered a stellar performance in 2017. However, there are worries about the impact of higher rates, global trade wars, an economic growth moderation and higher volatility.
Closer home, India has become the world’s sixth-biggest economy. India has doubled its GDP to USD 2.2 trillion within a decade. The introduction of reform measures, including demonetisation and the Goods and Services Tax (GST), had put pressure on selective parts of the economy in 2017. The impact of these measures is likely to be transitory. India’s economic growth is expected to accelerate from 6.7% in FY18 to 7.4% in the current year as per IMF forecasts.
There has been a shift in the domestic savings pool supporting the market. Domestic investors have been increasing exposure to equities and financial assets moving away from gold and real estate. Mutual funds witnessed sizable inflows on the back of the boost in liquidity within the banking system from demonetisation. The AUM of the mutual fund industry grew by 21.7% in March 2018 compared to March 2017.
With growth, comes responsibility. Last year, the regulator, Securities and Exchange Board of India (SEBI) issued a circular to rationalise and categorise mutual fund schemes in India. We are pleased to state that none of our funds needed to be redesigned. All our schemes have been defined as per the new categorisation. We believe this classification will simplify investing into mutual funds and enhance comparability within the schemes offered.
As India moves to a digital age, e-commerce platforms are becoming increasingly popular. I request you to logon to our online transaction platform. It is a quick, convenient and an efficient tool to invest into our funds and manage your investments online.
At HSBC Global Asset Management, India, we are dedicated to one goal: delivering exceptional investment management for our clients. By bringing together our

2
global investment knowledge and capabilities, we are able to offer specialised expertise across asset classes. This has helped us to become a trusted partner to our individual and institutional investors.
We remain committed to our long-term perspective and disciplined investment approach as we conduct a rigorous, fundamental analysis of investments with a strong emphasis on risk management. Although the investment landscape appears favourable, it is worth remembering that markets are dynamic and constantly evolving. Therefore, we believe active, professional investment management serves investors well. Amid changing markets and economic conditions, we are confident that investors with a well-diversified portfolio and a patient, long-term outlook should be well positioned for the years ahead.
Together we thrive.
Warm regards,
Ravi Menon
Chief Executive Officer, HSBC Global Asset Management, India

3
SPONSORHSBC Securities and Capital Markets (India) Private LimitedRegd. Office: 52/60, Mahatma Gandhi Road, Fort, Mumbai - 400 001.
TRUSTEEBoard of TrusteesOffice: 16, Veer Nariman Road, Fort, Mumbai 400 001.
ASSET MANAGEMENT COMPANYHSBC Asset Management (India) Private LimitedCorp. & Regd. Office: 16, Veer Nariman Road, Fort, Mumbai 400 001.
CUSTODIANStandard Chartered Bank (SCB)Corp. & Regd. Office: Crescenzo, Securities Services, 3rd Floor, C-38/39, G-Block, Bandra Kurla Complex, Bandra East, Mumbai – 400051.
AUDITORS TO THE SCHEMEBSR & Co. LLPChartered Accountants 5th Floor, Lodha Excelus, Apollo Mills Compound, N.M. Joshi Marg, Mahalaxmi, Mumbai 400 011.
REGISTRAR & TRANSFER AGENTSComputer Age Management Services Private Limited (CAMS)Unit: HSBC Mutual Fund ’C’ Block, 2nd Floor, Hanudev Info Park P. Ltd., SF No. 558/2, Udayampalayam Road, Nava India, Coimbatore - 641 028.
BOARD OF TRUSTEESMr. Nasser Munjee
Mr. Manu Tandon
Mr. Mehli Mistri
Mr. Dilip J. Thakkar
Ms. Jasmine Batliwalla
Mr. Pedro Bastos
BOARD OF DIRECTORSMs. Kishori J. Udeshi - Chairperson
Mr. S. P. Mustafa
Mr. Dinesh Mittal
Mr. Ravi Menon - Chief Executive Officer
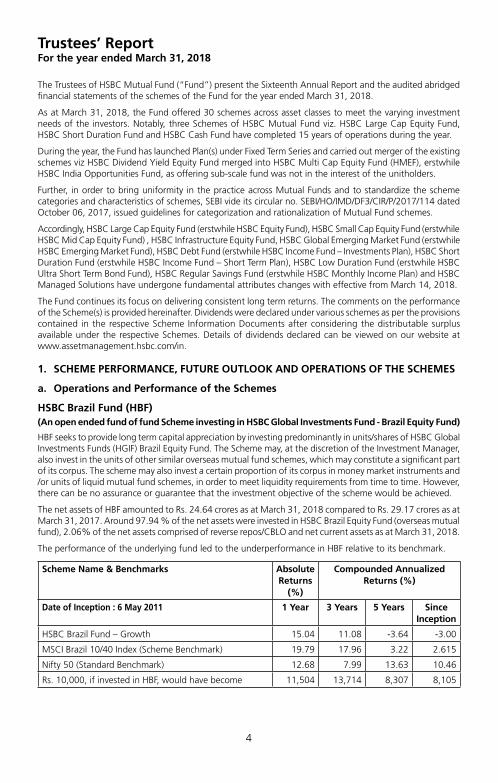
4
The Trustees of HSBC Mutual Fund (“Fund”) present the Sixteenth Annual Report and the audited abridged financial statements of the schemes of the Fund for the year ended March 31, 2018.
As at March 31, 2018, the Fund offered 30 schemes across asset classes to meet the varying investment needs of the investors. Notably, three Schemes of HSBC Mutual Fund viz. HSBC Large Cap Equity Fund, HSBC Short Duration Fund and HSBC Cash Fund have completed 15 years of operations during the year.
During the year, the Fund has launched Plan(s) under Fixed Term Series and carried out merger of the existing schemes viz HSBC Dividend Yield Equity Fund merged into HSBC Multi Cap Equity Fund (HMEF), erstwhile HSBC India Opportunities Fund, as offering sub-scale fund was not in the interest of the unitholders.
Further, in order to bring uniformity in the practice across Mutual Funds and to standardize the scheme categories and characteristics of schemes, SEBI vide its circular no. SEBI/HO/IMD/DF3/CIR/P/2017/114 dated October 06, 2017, issued guidelines for categorization and rationalization of Mutual Fund schemes.
Accordingly, HSBC Large Cap Equity Fund (erstwhile HSBC Equity Fund), HSBC Small Cap Equity Fund (erstwhile HSBC Mid Cap Equity Fund) , HSBC Infrastructure Equity Fund, HSBC Global Emerging Market Fund (erstwhile HSBC Emerging Market Fund), HSBC Debt Fund (erstwhile HSBC Income Fund – Investments Plan), HSBC Short Duration Fund (erstwhile HSBC Income Fund – Short Term Plan), HSBC Low Duration Fund (erstwhile HSBC Ultra Short Term Bond Fund), HSBC Regular Savings Fund (erstwhile HSBC Monthly Income Plan) and HSBC Managed Solutions have undergone fundamental attributes changes with effective from March 14, 2018.
The Fund continues its focus on delivering consistent long term returns. The comments on the performance of the Scheme(s) is provided hereinafter. Dividends were declared under various schemes as per the provisions contained in the respective Scheme Information Documents after considering the distributable surplus available under the respective Schemes. Details of dividends declared can be viewed on our website at www.assetmanagement.hsbc.com/in.
1. Scheme Performance, future outlook and oPerationS of the SchemeS
a. Operations and Performance of the Schemes
HSBC Brazil Fund (HBF) (An open ended fund of fund Scheme investing in HSBC Global Investments Fund - Brazil Equity Fund)
HBF seeks to provide long term capital appreciation by investing predominantly in units/shares of HSBC Global Investments Funds (HGIF) Brazil Equity Fund. The Scheme may, at the discretion of the Investment Manager, also invest in the units of other similar overseas mutual fund schemes, which may constitute a significant part of its corpus. The scheme may also invest a certain proportion of its corpus in money market instruments and /or units of liquid mutual fund schemes, in order to meet liquidity requirements from time to time. However, there can be no assurance or guarantee that the investment objective of the scheme would be achieved.
The net assets of HBF amounted to Rs. 24.64 crores as at March 31, 2018 compared to Rs. 29.17 crores as at March 31, 2017. Around 97.94 % of the net assets were invested in HSBC Brazil Equity Fund (overseas mutual fund), 2.06% of the net assets comprised of reverse repos/CBLO and net current assets as at March 31, 2018.
The performance of the underlying fund led to the underperformance in HBF relative to its benchmark.
Scheme Name & Benchmarks Absolute Returns
(%)
Compounded Annualized Returns (%)
Date of Inception : 6 May 2011 1 Year 3 Years 5 Years Since Inception
HSBC Brazil Fund – Growth 15.04 11.08 -3.64 -3.00
MSCI Brazil 10/40 Index (Scheme Benchmark) 19.79 17.96 3.22 2.615
Nifty 50 (Standard Benchmark) 12.68 7.99 13.63 10.46
Rs. 10,000, if invested in HBF, would have become 11,504 13,714 8,307 8,105
Trustees’ ReportFor the year ended March 31, 2018

5
Scheme Name & Benchmarks Absolute Returns
(%)
Compounded Annualized Returns (%)
Date of Inception : 6 May 2011 1 Year 3 Years 5 Years Since Inception
Rs. 10,000, if invested in MSCI Brazil 10/40 Index, would have become
11,979 16,428 11,718 11,950
Rs. 10,000, if invested in Nifty 50, would have become 11,268 12,599 18,950 19,863
Past performance may or may not be sustained in future. The returns for the respective periods are provided as on last business day of March 2018 for Growth Option. Different plans shall have a different expense structure. Performance of the respective benchmark is calculated as per the Total Return Index (TRI).
b. Market Overview & Outlook (as furnished by HSBC Asset Management (India) Private Limited)
EqUITY OUTLOOKIndian equity markets continued to remain strong during fiscal year 2017-18 and posted gains of 11.76% by S&P CNX Nifty and 13.24% by BSE Midcap index respectively. Biggest drivers of the markets were, robust DII flow into equities, continued push of mega reforms – Goods and Services Tax (GST) implementation, Insolvency and Bankruptcy Code implementation, Real Estate (Regulation and Development) Act, second consecutive normal monsoon, and electoral victories of the ruling party in many state elections. On the other hand, the markets weather the storm of disruption in economy due to GST implementation, lingering impact of demonetization, muted FII flows, and rising yields in developed markets. Domestic Mutual Fund segment had their best ever year and they brought in ~USD 22 bn of net inflows in equities during the year. Even after witnessing ~USD 4.3 bn of net outflows from the domestic insurers, the net DII tally was a very impressive ~USD 17.7 bn of net inflows. There were mixed global cues well and the Foreign Institutional Investors (FIIs) net bought Indian equities worth USD 3.2 bn. The inflows by both FIIs and domestic MFs acted as a factor in the strong market performance.
Indices Returns (April 1, 2017 to March 31, 2018) 1 Year (%)
S&P BSE Sensex 12.70%
NSE CNX Nifty 11.76%
S&P BSE 100 12.12%
S&P BSE 200 12.49%
S&P BSE 500 13.21%
S&P BSE Midcap 14.31%
S&P BSE 250 Small-cap 14.13%
Source: Bloomberg (All values are total return)
Our view on the key aspects related to equity markets are presented below -
The impressive performance in equity markets during FY 2017-18 has come on the back of strong liquidity largely by domestic MFs but supported in party by FII flows, positive global growth, benign macro – both domestically and global, expectation of the continuation of favorable policy environment domestically and expectation of corporate earnings revival. Possibility of sound macro, economic reforms and implementation of existing reforms have increased, especially after continued success of the ruling party at the centre in state elections. However, after this strong performance in markets and rather long wait for earnings to be delivered has meant that the equity markets are currently trading above their historical averages.
Moving into FY 2018-19, we expect a continuation of the economic recovery process domestically, recovery in corporate earnings - led early by volume growth, and continued DII flows. Government led investment
Trustees’ ReportFor the year ended March 31, 2018 (Contd...)

6
spending and rural consumption are likely to lead with private sector investments contributing later (possibly after general elections 2019). The budget document that was presented in early February provides a good medium term policy direction for the economy. Occasionally the policy actions can serve up a few bumps and jolts but over the medium term, across different governments, there is a thread of continuity connecting many key economic policies such as in the case of this year’s union budget. We, in our investment process, prefer to take comfort in these threads of continuity and remain constructive on the India growth story. This makes us positive on the Indian equity markets over the medium to long term.
Risks are in the form of market valuations trending above historical averages, weaker than expected delivery in corporate earnings going forward, external news flows related to trade protectionism, developed market central banks raising rates prematurely, and geopolitical tensions and other eco-political events would also influence market performance going forward, as the recent rally in the markets was supported by strong FII inflows.
DEBT OUTLOOKFixed Income in Financial Year 2017-18 has seen volatility further step up in this year. Markets went to perfect storm with higher crude prices, low liquidity and pressure on currency, apart from rate hike expectations.
Inflation has followed the glide path to lower numbers towards 4% RBI target and even lower than the target number when inflation printed a lowly 1.46% in June 2018 on back of lower food prices. RBI went for a cut despite of neutral stance. This positivity continued till until crude shock came in form of higher crude process. Global prices of Brent crude saw substantial increase in second half of the year, which jeopardized the inflation path. Other worries that gathered around this time were related to GST collection and eventual impact on fiscal situation.
Government of India allowed the fiscal deficit to slip to 3.5% (budget 3.2%) and kept next year target at 3.3% (in place of earlier path of 3%). This was on back of some excise relaxation for oil products and a month less collected for GST due to implementation in the current year. The fear of fiscal slippage alongwith the announcement of higher bond issuances spooked the bond markets into higher yields. Government finally borrowed only INR 90 bln extra (in place of INR 500 bln announced initially).
On the Monetary front the year was very volatile as well. RBI changed its stance to neutral causing some worry around rate hikes. Thereafter it cut rates and again went for OMO sales operations simultaneously. This created some confusion in the market participants regarding rates direction. Finally extra supply, higher oil prices and higher inflation paved way for rates higher. RBI also held position on regulatory forbearance about spreading out losses by banks publicly. It eventually gave up the position in the end of March. However, the swift changes in stance caused lot of pressure and volatility in bonds.
Liquidity situation continuously deteriorated due to OMO sales initially and withdrawal of deposits due to remonetisation. Further liquidity was absorbed out due to portfolio outflows and reduction in reserves. Despite of defense from RBI utilizing the reserves, the currency depreciated meaningfully, which caused further jitters in foreign investor sentiments. Lack of liquidity also affected 1-3 year rates which were elevated in second half of the year.
Going forward following are key variables to watch out for:• Liquidity: Liquidity will drive short end rates and eventually drive decisions leading to market interventions
and CRR cuts. RBI has focused now on neutral liquidity stance and providing liquidity to system, which will bode well short end rates.
• Inflation: Inflation numbers will determine future course of action for RBI and remains a critical variable for policy. We expect inflation to remain at 4.7% level in the ease in second half of FY 2018-19 in line with RBI’s expectations.
• Growth: GDP growth numbers as well as industrial activity will also determine the decision on policy.
• Fiscal deficit: Fiscal deficit and government spending will determine the government borrowing and crowding out in interest rate curve. We expect prudence in government spending and prospect of spending on infrastructure to pick up which will crowd in private investment as well.
• Current Account Deficit: Current Account Deficit determines how the pressure on currency works and effective management of forex reserves.
• Currency levels: Level of INR will determine how the central bank reacts to the situation on the global crisis etc.
Trustees’ ReportFor the year ended March 31, 2018 (Contd...)

7
2. Brief Background of SPonSorS, Board of truSteeS and aSSet management comPany
a. Sponsor
HSBC Mutual Fund is sponsored by HSBC Securities and Capital Markets (India) Private Limited (HSCI). The Sponsor is the Settler of the Mutual Fund Trust. The Sponsor has entrusted a sum of Rs. 1,00,000 (Rupees One Lakh only) to the Trustee as the initial contribution towards the corpus of the Mutual Fund.
HSCI offers integrated investment banking services, securities and corporate finance & advisory. HSCI is a member of the Bombay Stock Exchange Limited and National Stock Exchange (capital and derivative market segments). HSCI holds 100% of the paid up equity share capital of HSBC Asset Management (India) Private Limited.
b. HSBC Mutual Fund
HSBC Mutual Fund (“the Mutual Fund” or “the Fund”) has been constituted as a Trust in accordance with the provisions of the Indian Trusts Act, 1882 (2 of 1882) vide a Trust Deed dated February 7, 2002 with HSBC Securities and Capital Markets (India) Private Limited, as the Sponsor and the Board of Individual Trustees. The Trustee has entered into an Investment Management Agreement dated February 7, 2002 with HSBC Asset Management (India) Private Limited (AMC) to function as the Investment Manager for all the schemes of the Fund. The Fund was registered with SEBI vide registration number MF/046/02/5 dated May 27, 2002.
The Trust has been formed for the purpose of pooling of capital from the public for collective investment in securities for the purpose of providing facilities for participation by persons as beneficiaries in such investments and in the profits/income arising therefrom.
c. Board of Trustees (the Trustees)
The Board of Trustees is the exclusive owner of the Trust Fund and holds the same in trust for the benefit of the unit holders. The Trustees have been discharging their duties and carrying out the responsibilities as provided in the SEBI (Mutual Funds) Regulations, 1996 and the Trust Deed. The Trustees seek to ensure that the Fund and the schemes floated there under are managed by the AMC in accordance with the Trust Deed, the said Regulations, directions and guidelines issued by the SEBI, the Stock Exchanges, the Association of Mutual Funds in India and other regulatory agencies.
d. Asset Management Company (the AMC)
HSBC Asset Management (India) Private Limited (the Investment Manager or the AMC) is a private limited company incorporated under the Companies Act, 1956 on December 12, 2001 having its Registered Office at 16, V. N. Road, Fort, Mumbai 400 001. HSBC Asset Management (India) Private Limited has been appointed as the Asset Management Company of HSBC Mutual Fund by the Trustee vide Investment Management Agreement (IMA) dated February 7, 2002 and executed between the Trustees and the AMC. SEBI approved the AMC to act as the Investment Manager of the Fund vide its letter No. MFD/BC/163/2002 dated May 27, 2002. The paid-up equity share capital of the AMC is Rs. 61.59 crores. The AMC is registered as a Portfolio Manager under the SEBI (Portfolio Managers) Regulations, 1993 vide registration no. INP000001322. The AMC also offers non-binding Advisory services to offshore funds under the mutual fund license.
HSBC Securities and Capital Markets (India) Private Limited holds 100% of the paid up equity share capital of the AMC.
3. inveStment oBjective of the SchemeS The investment objective of the respective schemes has been provided above under the heading “Scheme
Performance, Future Outlook and Operation of the Scheme” (Refer Section 1).
4. Significant accounting PolicieS The Significant Accounting Policies form part of the Notes to the Accounts annexed to the Balance Sheet
of the Schemes in the Full Annual Report. The accounting policies are in accordance with Securities Exchange Board of India (Mutual Funds) Regulations 1996.
Trustees’ ReportFor the year ended March 31, 2018 (Contd...)

8
5. unclaimed dividendS & redemPtionS Summary of number of investors & corresponding amount Scheme-wise as on March 31, 2018.
SchemeUnclaimed Dividend Unclaimed Redemption
Amount (Rs.) No. of Investors
Amount (Rs.) No. of Investors
HSBC Brazil Fund – – 933,017.59 5
6. inveStor ServiceSThe number of official points of acceptance of transactions is 205 locations. In addition to the offices of the Registrar & Transfer agents, the AMC has Investor Service Centres in 9 locations at its own offices - namely Mumbai, New Delhi, Kolkata, Bangaluru, Pune, Ahmedabad, Hyderabad, Chandigarh and Chennai. With a view to enhance customer convenience, the AMC has the facility of priority based servicing to key distributors through the enhancement of the Interactive Voice Reponses. The AMC has a single Toll Free number which can be dialed from anywhere in India. The call centre service is being managed by the Registrar and Transfer Agents.
On the distribution front, the number of empanelled distributors was 460 as on March 31, 2018. During the year, the AMC initiated tie-ups for online distribution of the Mutual Fund’s schemes with several channel partners taking the total number of such tie-ups to 42.
7. detailS of inveStor grievance redreSSalThe details of the redressal of investor complaints received against HSBC Mutual Fund during April 2017 - March 2018 are as follows:
2017-2018
Com- plaint Code
Type of complaint (a) No. of complaints
pending at the
beginning of the year
(b) No. of complaints received during
the year
Action on (a) and (b)
Resolved Non Actiona-
ble*
Pending
Within 30
days
30 - 60 days
60 - 180 days
Beyond 180 days
0 - 3 months
3 - 6 months
6 - 9 months
9 - 12 months
I A Non receipt of Dividend on Units
0 5 4 1 0 0 0 0 0 0 0
I B Interest on delayed payment of Dividend
0 0 0 0 0 0 0 0 0 0 0
I C Non receipt ofRedemption Proceeds
1 12 12 1 0 0 0 1 0 0 0
I D Interest on delayedp a y m e n t o f Redemption
0 1 1 0 0 0 0 0 0 0 0
II A Non receipt of Statement of Account / Unit Certificate
0 0 0 0 0 0 0 0 0 0 0
II B D i s c r e p a n c y i n Statement of Account
0 0 0 0 0 0 0 0 0 0 0
II C Data corrections in Investor details **
0 34 34 0 0 0 0 0 0 0 0
II D Non receipt of Annual Report /Abridged Summary
0 0 0 0 0 0 0 0 0 0 0
Trustees’ ReportFor the year ended March 31, 2018 (Contd...)

9
2017-2018
Com- plaint Code
Type of complaint (a) No. of complaints
pending at the
beginning of the year
(b) No. of complaints received during
the year
Action on (a) and (b)
Resolved Non Actiona-
ble*
Pending
Within 30
days
30 - 60 days
60 - 180 days
Beyond 180 days
0 - 3 months
3 - 6 months
6 - 9 months
9 - 12 months
III A Wrong switch between Schemes
0 0 0 0 0 0 0 0 0 0 0
III B Unauthorized switch between Schemes
0 0 0 0 0 0 0 0 0 0 0
III C Deviation from Scheme attributes
0 0 0 0 0 0 0 0 0 0 0
III D Wrong or excess charges / load
0 0 0 0 0 0 0 0 0 0 0
III E Non updat ion of changes viz. address, PAN, bank details, nomination, etc
0 6 6 0 0 0 0 0 0 0 0
IV Others 1 41 42 0 0 0 0 0 0 0 0
Total 2 99 99 2 0 0 0 0 0 0 0
Summary of Complaints for FY 2017-18
Particulars Count
Total complaints received 99
Total number of folios 140099
% of complaints against the folio 0.071%
# active folios** As per AMFI Best Practice Guidelines Circular No.25/2011-12 for Revisions in the Guidelines on
Standardization of Complaints/Grievances Reporting Procedure. If “Others” include a type of complaint which is more than 10% of overall complaints, then such a reason should be provided separately. Hence data corrections in Investor Details is included as a separate category
* Non actionable means the complaint is incomplete / outside the scope of the mutual fund
8. inveStor education initiativeS The Fund undertook various investor education and awareness initiatives related to investments in mutual funds throughout India in English / Hindi and Regional languages via mass media. The Fund conducted 16 roadshows at various locations in India to promote various Investor Awareness related topics including Asset Allocation, SIPs, Equity Mutual Funds and Financial Planning. The Fund has a Year-long tie-up with Mutual Fund Insights Magazine that includes 3 pages of content and advertorial publication in their monthly issue. Each issue contains a story promoting SIPs to achieve one’s various investment goals. In the month of December 2017 and January 2018 investor awareness promotion was done through Outlook and Outlook Money magazines through advertorials on various Mutual Fund topics.
9. Statutory detailSa) The Sponsors are not responsible or liable for any loss resulting from the operation of the Schemes of
the Fund beyond initial contribution of Rs. 1 lakh for setting up the Fund.
b) The price and redemption value of the units, and income from them, can go up as well as down with fluctuations in the market value of its underlying investments.
Trustees’ ReportFor the year ended March 31, 2018 (Contd...)

10
c) Full Annual Report shall be disclosed on the website at www.assetmanagement.hsbc.com/in and shall be available for inspection at the Head Office of the Mutual Fund. Present and prospective unit holders can obtain copy of the Trust Deed, the full Annual Report of the Scheme(s), the Annual Report of HSBC Asset Management (India) Private Limited and the text of the relevant Scheme(s) at a price.
10. acknowledgementSThe Trustees wish to thank the Unit holders of the Schemes for their support throughout the year and also thank the Government of India, the Securities and Exchange Board of India (SEBI), the Reserve Bank of India (RBI) and the Association of Mutual Funds in India (AMFI) for the guidance provided by them. The Trustees also appreciate the services provided by the Registrar and Transfer Agent, Fund Accountant, Custodian, Bankers, Distributors and Brokers. The guidance and services provided by the Auditors and advocates and the ebullience, sincerity and dedication of the employees of HSBC Asset Management (India) Private Limited is also appreciated.
The Trustees look forward to the continued support of everyone.
For and on behalf of the Board of Trustees of HSBC Mutual Fund
Sd/-
Dilip Thakkar
Trustee
Mumbai
July 17, 2018.
Trustees’ ReportFor the year ended March 31, 2018 (Contd...)

11
To the Board of Trustees
HSBC Mutual Fund – HSBC Brazil Fund
Report on the Financial StatementsWe have audited the accompanying Financial Statements of HSBC Brazil Fund (the ‘Scheme’), which comprise the balance sheet as at 31 March 2018 and the related revenue account for the year then ended, and a summary of significant accounting policies and other explanatory information, annexed thereto.
Management’s responsibility for the Financial StatementsThe Board of Trustees to the HSBC Mutual Fund (the ‘Board of Trustees’) and HSBC Asset Management (India) Private Limited (the ‘AMC’), being the investment manager to HSBC Mutual Fund (the ‘Fund’) (collectively referred as ‘Management’), are responsible for the preparation of these financial statements that give a true and fair view of the financial position and financial performance of the Scheme in accordance with the accounting policies and standards specified in the Ninth Schedule of the Securities and Exchange Board of India (Mutual Funds) Regulations, 1996, as amended (the ‘Regulations’) and the accounting principles generally accepted in India. This responsibility includes maintenance of adequate accounting records for safeguarding of the assets of the Scheme and for preventing and detecting frauds and other irregularities; selection and application of appropriate accounting policies; making judgments and estimates that are reasonable and prudent; and design, implementation and maintenance of adequate internal financial controls, that were operating effectively for ensuring the accuracy and completeness of the accounting records, relevant to the preparation and presentation of the financial statements that give a true and fair view and are free from material misstatement, whether due to fraud or error.
In preparing the financial statements, management is responsible for assessing the Scheme’s ability to continue as a going concern, disclosing, as applicable, matters related to going concern and using the going concern basis of accounting unless management either intends to liquidate the Fund or to cease operations, or has no realistic alternative but to do so.
Auditor’s responsibilityOur responsibility is to express an opinion on these financial statements based on our audit. We conducted our audit in accordance with the Standards on Auditing issued by the Institute of Chartered Accountants of India (the ‘ICAI’). Those Standards require that we comply with ethical requirements and plan and perform the audit to obtain reasonable assurance about whether the financial statements are free from material misstatement.
An audit involves performing procedures to obtain audit evidence about the amounts and disclosures in the financial statements. The procedures selected depend on the auditor’s judgment, including the assessment of the risks of material misstatement of the financial statements, whether due to fraud or error. In making those risk assessments, the auditor considers internal controls relevant to preparation and fair presentation of the financial statements, of the Scheme, in order to design audit procedures that are appropriate in the circumstances, but not for the purpose of expressing an opinion on the effectiveness of the Scheme’s internal controls. An audit also includes evaluating the appropriateness of accounting policies used and the reasonableness of the accounting estimates made by Management, as well as evaluating the overall presentation of the financial statements.
We are also responsible to conclude on the appropriateness of management’s use of the going concern basis of accounting and, based on the audit evidence obtained, whether a material uncertainty exists related to events or conditions that may cast significant doubt on the Scheme’s ability to continue as a going concern. If we conclude that a material uncertainty exists, we are required to draw attention in the auditor’s report to the related disclosures in the financial statements or, if such disclosures are inadequate, to modify the opinion. Our conclusions are based on the audit evidence obtained up to the date of the auditor’s report. However, future events or conditions may cause the Scheme to cease to continue as a going concern.
We believe that the audit evidence we have obtained is sufficient and appropriate to provide a basis for our audit opinion.
Independent Auditors’ Report

12
Independent Auditors’ Report (Contd...)
OpinionIn our opinion, and to the best of our information and according to the explanations given to us, the aforesaid financial statements give the information required by the Regulations in the manner so required and give a true and fair view in conformity with the accounting principles generally accepted in India:
(i) in the case of the balance sheet, of the state of affairs of the Scheme as at 31 March 2018; and
(ii) in the case of the revenue account, of the net surplus for the year ended on that date.
Report on other Legal and Regulatory Requirements1 As required by Regulation 55(4) to the Regulations, we report that:
(a) We have obtained all information and explanations which, to the best of our knowledge and belief, were necessary for the purposes of the audit;
(b) The balance sheet and revenue account have been prepared in accordance with the accounting policies and standards specified in the Ninth Schedule of the Regulations.
2 As required by Clause 5(ii)(2) of the Eleventh Schedule of the Regulations, we report that the balance sheet and revenue account are in agreement with the books of account of the Scheme.
3 In our opinion and on the basis of information and explanations given to us, the methods used to value non - traded securities, as at 31 March 2018, as determined by the Board of Directors of AMC, are in accordance with the Regulations and other guidelines issued by the Securities and Exchange Board of India as applicable and approved by the Board of Trustees are fair and reasonable.
For B S R & Co. LLP Chartered Accountants Firm’s Registration No: 101248W/W-100022
Milind Ranade Partner Membership No: 100564
Place : Mumbai Date : July 17, 2018.

13
Abridged Balance Sheet as at March 31, 2018
Rs. in Lakhs
HSBC BRAZIL FUNDAs at
March 31, 2018As at
March 31, 2017
LIABILITIES1 Unit Capital 3,035.79 4,151.33 2 Reserves & Surplus2.1 Unit Premium Reserves (11.33) (13.11)2.2 Unrealised Appreciation Reserve – – 2.3 Other Reserves (560.30) (1,220.34)3 Loans & Borrowings – – 4 Current Liabilities & Provisions4.1 Provision for doubtful Income/Deposits – – 4.2 Other Current Liabilities & Provisions 41.87 42.99
TOTAL 2,506.03 2,960.87
ASSETS1 Investments1.1 Listed Securities:1.1.1 Equity Shares – – 1.1.2 Preference Shares – – 1.1.3 Equity Linked Debentures – – 1.1.4 Other Debentures & Bonds – – 1.1.5 Securitised Debt securities – – 1.2 Securities Awaited Listing:1.2.1 Equity Shares – – 1.2.2 Preference Shares – – 1.2.3 Equity Linked Debentures – – 1.2.4 Other Debentures & Bonds – – 1.2.5 Securitised Debt securities – – 1.3 Unlisted Securities1.3.1 Equity Shares – – 1.3.2 Preference Shares – – 1.3.3 Equity Linked Debentures – – 1.3.4 Other Debentures & Bonds – – 1.3.5 Securitised Debt securities – – 1.4 Government Securities – – 1.5 Treasury Bills – – 1.6 Commercial Paper – – 1.7 Certificate of Deposits – – 1.8 Bill Rediscounting – – 1.9 Units of Domestic Mutual Fund – – 1.10 Foreign Securities 2,413.48 2,864.69
Total Investments 2,413.48 2,864.69
2 Deposits 0.74 0.55 3 Other Current Assets3.1 Cash & Bank Balance 0.06 3.62 3.2 CBLO/Reverse Repo Lending 82.34 84.96 3.3 Others 9.41 7.05 4 Deferred Revenue Expenditure (to the extent not written off) – –
TOTAL 2,506.03 2,960.87
Notes to Accounts – Annexure I

14
Abridged Revenue Account for the year ended March 31, 2018
Rs. in Lakhs
HSBC BRAZIL FUNDCurrent
Year ended March 31, 2018
Previous Year ended
March 31, 2017
1 INCOME1.1 Dividend 53.69 58.491.2 Interest 4.82 7.421.3 Realised Gain / (Loss) on Foreign Exchange Transactions (2.27) (5.86)1.4 Realised Gains / (Losses) on Interscheme sale of investments – –1.5 Realised Gains / (Losses) on External sale / redemption of
investments(216.21) (639.97)
1.6 Realised Gains / (Losses) on Derivative Transactions – –1.7 Other Income 0.01 0.03
(A) (159.96) (579.89)
2 EXPENSES2.1 Management fees 27.42 28.232.2 GST / Service tax on Management fees 4.74 4.212.3 Transfer agents fees and expenses 1.66 1.672.4 Custodian fees 1.87 1.962.5 Trusteeship fees 0.05 0.062.6 Commission to Agents 13.61 19.252.7 Marketing & Distribution expenses – 0.412.8 Audit fees 0.20 0.202.9 Investor Education Expenses 0.53 0.602.10 Other operating expenses 1.96 1.782.11 Less: Expenses to be Reimbursed by the Investment Manager – –
(B) 52.04 58.37
3 NET REALISED GAINS / (LOSSES) FOR THE YEAR (A -B = C) (212.00) (638.26)
4 Change in Unrealised Depreciation in value of investments*** (D) 581.04 1,456.69
5 NET GAINS / (LOSSES) FOR THE YEAR [E=(C+D)] 369.04 818.43
6 Change in unrealised appreciation in the value of investments and derivatives (F) – –
7 NET SURPLUS / (DEFICIT) FOR THE YEAR (E + F = G) 369.04 818.43
7.1 Add: Balance transfer from Unrealised Appreciation Reserve – –7.2 Less: Balance transfer to Unrealised Appreciation Reserve – –7.3 Add / (Less): Equalisation 291.00 619.16
7.4 Transfer from Reserve Fund (1,220.34) (2,657.93)
8 Total (560.30) (1,220.34)
9 Dividend appropriation9.1 Income Distributed during the year – –9.2 Tax on income distributed during the year – –
10 Retained Surplus / (Deficit) carried forward to Balance sheet (560.30) (1,220.34)
Notes to Accounts – Annexure I
*** Includes Unrealised Depreciation in the value of Foreign Currency Transactions.

15
Key Statistics for the year ended March 31, 2018
HSBC BRAZIL FUNDCurrent
Year ended March 31, 2018
Previous Year ended
March 31, 2017
1. NAV per unit (Rs.):
Open
Regular Plan Growth Option 7.0201 5.2601
Regular Plan Dividend Option 7.0201 5.2601
Direct Plan - Growth Option 7.2373 5.3850
Direct Plan - Dividend Option 7.2373 5.3850
High
Regular Plan Growth Option 8.6439 7.9177
Regular Plan Dividend Option 8.6439 7.9177
Direct Plan - Growth Option 8.9691 8.1569
Direct Plan - Dividend Option 8.9691 8.1569
Low
Regular Plan Growth Option 6.2924 4.8980
Regular Plan Dividend Option 6.2924 4.8980
Direct Plan - Growth Option 6.4973 5.0149
Direct Plan - Dividend Option 6.4973 5.0149
End
Regular Plan Growth Option 8.1022 7.0201
Regular Plan Dividend Option 8.1022 7.0201
Direct Plan - Growth Option 8.4129 7.2373
Direct Plan - Dividend Option 8.4129 7.2373
2. Closing Assets Under Management (Rs. in Lakhs)
End 2,464 2,917
Average (AAuM)1 2,638 2,990
3. Gross income as % of AAuM2 –6.06% –19.39%
4. Expense Ratio:
a. Total Expense as % of AAuM (including service tax / GST on Management fees) (planwise)
Regular Plan (Continue) 2.00% 1.98%
Direct Plan 1.29% 1.27%
b. Management Fee as % of AAuM (planwise)
Regular Plan (Continue) 1.04% 0.94%
Direct Plan 1.04% 0.94%
5. Net Income as a percentage of AAuM3 –8.04% –21.35%
6. Portfolio turnover ratio4 0.02 0.22

16
HSBC BRAZIL FUNDCurrent
Year ended March 31, 2018
Previous Year ended
March 31, 2017
7. Total Dividend per unit distributed during the year (planwise)
Retail
Regular Plan Dividend Option – –
Direct Plan - Dividend Option – –
Corporate
Regular Plan Dividend Option – –
Direct Plan - Dividend Option – –
8. Returns (%):
a. Last One Year
Scheme
Regular Plan Growth Option 15.0428 33.4594
Direct Plan - Growth Option 15.8688 34.3974
Benchmark
MSCI Brazil 10/40 Index 19.7900 37.5570
b. Since Inception
Scheme
Regular Plan Growth Option (3.0023) (5.8139)
Direct Plan - Growth Option (3.2875) (7.3859)
Benchmark
MSCI Brazil 10/40 Index 2.6148 (9.5690)
1 AAuM=Average daily net assets2 Gross income = amount against (A) in the Revenue account i.e. Income3 Net income = amount against (C) in the Revenue account i.e. Net Realised Gains / (Losses) for the year4 Portfolio Turnover = Lower of sales or purchase divided by the Average AuM for the year5 The net asset value disclosed represents the computed NAV on March 31, 2018 (Non-business Day), and not
the last declared NAV.6 The Total management fees and other expenses charged by the underlying fund along with the management
fee and recurring expenses charged by the domestic Mutual Fund is as follows:
Scheme TER charged by underlying Fund ***
TER of the domestic Fund***
Total TER *** Maximum TER Cap as per circular ***
2017-18
HSBC Brazil Fund 0.85% 1.82% 2.67% 2.70%
2016-17
HSBC Brazil Fund 0.85% 1.83% 2.68% 2.70%
*** The TER excludes GST / Service Tax on Management fees
Key Statistics for the year ended March 31, 2018 (Contd...)

17
Notes to Accounts - Annexure ITo the Abridged Balance Sheet and Revenue Account for the Year ended March 31, 2018
HSBC BRAZIL FUND1 Investments:
1.1 It is confirmed that investments of the Scheme are registered in the name of the Trustees for the benefit of the Scheme’s unitholders.
1.2 Open Positions of derivatives as of years ended March 31, 2018 and March 31, 2017 are NIL.
1.3 Investments in Associates and Group Companies as of period ended March 31, 2018 and March 31, 2017 are NIL.
1.4 Open positions of Securities Borrowed and / or Lent by the Scheme as of the years ended March 31, 2018 and March 31, 2017 are NIL.
1.5 NPAs as at years ended March 31, 2018 and March 31, 2017 are NIL.
1.6 Aggregate Unrealised Gain / Loss as at the end of the financial years end and their percentages to net assets are as under:
Security Category Amount (Rupees)
Percentage to Net Assets (%)
Amount (Rupees)
Percentage to Net Assets (%)
2018 2017
Foreign Securities
– Appreciation – – – –
– Depreciation 34,499,188 14.00 92,603,581 31.75
1.7 The aggregate value of investments securities (excluding CBLO and Reverse Repos) purchased and sold (including matured) during the financial year 2017 - 2018 (excluding accretion of discount) is Rs. 5,368,859 and Rs. 86,976,210 respectively being 2.04% and 32.97% of the average daily net assets.
The aggregate value of investments securities (excluding CBLO and Reverse Repos) purchased and sold (including matured) during the financial year 2016 - 2017 (excluding accretion of discount) is Rs. 64,376,138 and Rs. 120,785,705 respectively being 21.53% and 40.39% of the average daily net assets.
1.8 Non-Traded securities in the portfolios as at March 31, 2018 and March 31, 2017 are NIL.
2 Disclosure Under Regulation 25(8) of the Securities and Exchange Board of India (Mutual Funds) Regulations, 1996 as amended
Commission paid to Sponsor / AMC and its associates / related parties / group companies
Name of Sponsor / AMC and its associates / related parties / group companies
Nature of Association / Nature of
Relation
Period Covered
Business Given [Rs. In Crores]
% of Total Business
received by the Fund
Commission paid [Rs.]
% of Total commission paid by the
Fund
The Hongkong and Shanghai Banking Corporation Limited
Associate of Investment Manager
2017-2018 0.00 0.12 653,632 46.45
Name of Sponsor / AMC and its associates / related parties / group companies
Nature of Association / Nature of
Relation
Period Covered
Business Given [Rs. In Crores]
% of Total Business
received by the Fund
Commission paid [Rs.]
% of Total commission paid by the
Fund
The Hongkong and Shanghai Banking Corporation Limited
Associate of Investment Manager
2016-2017 3.46 35.12 940,613 54.54

18
Brokerage paid to Sponsor/AMC and its associates/related parties/group companies is NIL. (Previous year also NIL)
(i) Any underwriting obligations undertaken by the schemes of the mutual funds with respect to issue of securities associate companies - Nil. (Previous year also Nil)
(ii) Devolvement - Nil. (Previous year also Nil)
(iii) Subscription by the schemes in the issues lead managed by associate companies - Nil. (Previous year also Nil)
(iv) Subscription to any issue of equity or debt on private placement basis where the sponsor or its associate companies have acted as arranger or manager - Nil. (Previous year also Nil)
3 None of the Investors held more than 25% of the total net assets of the Scheme at the year ended March 31, 2018 and March 31, 2017.
4 Unit Capital movement during the years ended March 31, 2018 and March 31, 2017:
Description
2017-2018
Opening Units Subscription Redemption Closing Units Face Value per unit (Rs.)
Regular Plan Growth Option
31,332,667.046 2,005,208.323 9,393,049.972 23,944,825.397 10
Regular Plan Dividend Option
8,530,505.861 167,614.248 3,730,622.595 4,967,497.514 10
Direct Plan - Growth Option
1,539,033.245 825,331.360 945,563.071 1,418,801.534 10
Direct Plan - Dividend Option
111,090.551 33,829.697 118,180.467 26,739.781 10
Description
2016-2017
Opening Units Subscription Redemption Closing Units Face Value per unit (Rs.)
Regular Plan Growth Option
43,145,354.299 10,976,827.343 22,789,514.596 31,332,667.046 10
Regular Plan Dividend Option
12,155,653.078 626,765.345 4,251,912.562 8,530,505.861 10
Direct Plan - Growth Option
1,352,163.735 1,869,262.627 1,682,393.117 1,539,033.245 10
Direct Plan - Dividend Option
13,156.078 97,934.473 - 111,090.551 10
** Units held by the AMC (Seed Capital) in Direct Plan Growth Option as on March 31, 2018 is 701,095.111 & as on March 31, 2017 is 701,095.111.
5 No contingent liabilities for the years ended March 31, 2018 and March 31, 2017.
6 Expenses other than Management Fees are Inclusive of GST / Service Tax where applicable.
Notes to Accounts – Annexure I (Contd...)To the Abridged Balance Sheet and Revenue Account for the Year ended March 31, 2018

19
Notes to Accounts – Annexure I (Contd...)To the Abridged Balance Sheet and Revenue Account for the Year ended March 31, 2018
7 Other income of Rs. 991/- represents Exit load (net of GST / service tax) credited to the Scheme (2017: Rs. 2,839 represents Exit load (net of service tax) credited to the Scheme).
8 Investor Education Awareness
In view of the AMFI Best Practices Guidelines Circular No. 56/2015-16, the IEF ( Investor Education Fund) accrual is set aside in a separate bank account and the consolidated balance across all schemes as on March 31, 2018. The break-up of which is as under:
Particulars March 31, 2018 Amount (in Rs. Lacs)
March 31, 2017 Amount (in Rs. Lacs)
Opening Balance 44.00 –
Add: Accrual during the year 219.83 182
Less: Transferred to AMFI 101.10 83
Less: Payable to AMFI (March accrual) 8.81 8
Add: Investment Income for the year 8.28 11
Less: Spent during the year 43.17 58
Closing Balance 119.02 44
9 The Annual Accounts of the Schemes prepared in accordance with the accounting policies and standards specified in the Ninth Schedule of The Securities and Exchange Board of India (Mutual Funds) Regulations, 1996 has been approved by the Board of Directors of HSBC Asset Management (India) Private Limited and The Board of Trustees of HSBC Mutual Fund at their meetings held on July 16, 2018 and July 17, 2018 respectively. The audit report attached herewith refers to the said Annual Accounts. The aforesaid abridged accounts are an extract of the Annual Accounts and are prepared in accordance with SEBI Circular No. IMD/Cir8/132968/2008 dated July 24, 2008.

20
Voting Policy and Procedures
In view of SEBI guidelines related to “Role of Mutual Funds in Corporate Governance of Public Listed Companies”, AMIN has formulated its “Policy for Proxy Voting in Public Listed Companies”. The said policy and details of actual exercise of proxy votes along with the summary of votes cast and the auditors certification during the Financial Year 2017 – 18 is available on its website – http://www.assetmanagement.hsbc.com/in and in full Annual Report for the Financial Year 2017 – 18.

Statutory Details & DisclaimersAll returns have been sourced from Mutual Funds India Explorer software unless otherwise stated. With regard to equity schemes (including the equity component of MIPs), Fund performance is calculated on a total return basis (i.e. it includes dividends re-invested) while the benchmark is calculated on a price return basis (i.e. it does not consider dividends re-invested). This document has been prepared by HSBC Asset Management (India) Private Ltd (HSBC) for information purposes only and should not be construed as an offer or solicitation of an offer for purchase of any of the funds of HSBC Mutual Fund. All information contained in this document (including that sourced from third parties), is obtained from sources HSBC, the third party believes to be reliable but which it has not independently verified and HSBC, the third party makes no guarantee, representation or warranty and accepts no responsibility or liability as to the accuracy or completeness of such information. The information and opinions contained within the document are based upon publicly available information and rates of taxation applicable at the time of publication, which are subject to change from time to time. Expressions of opinion are those of HSBC only and are subject to change without notice. It does not have regard to specific investment objectives, financial situation and the particular needs of any specific person who may receive this document. Investors should seek financial advice regarding the appropriateness of investing in any securities or investment strategies that may have been discussed or recommended in this report and should understand that the views regarding future prospects may or may not be realized. Neither this document nor the units of HSBC Mutual Fund have been registered in any jurisdiction. The distribution of this document in certain jurisdictions may be restricted or totally prohibited and accordingly, persons who come into possession of this document are required to inform themselves about, and to observe, any such restrictions.
Investors should not invest in the Scheme solely based on the information provided in this document and should read the Scheme Information Document and Statement of Additional Information of the Fund for details. This document does not constitute an offering document.
No part of this publication may be reproduced, stored in a retrieval system, or transmitted, on any form or by any means, electronic, mechanical, photocopying, recording, or otherwise, without the prior written permission of HSBC Asset Management (India) Private Ltd.
Mutual Fund investments are subject to market risks, read all scheme related documents carefully.

HSBC Global Consumer Opportunities Fund – Benefiting From China’s Growing Consumption PowerAn open ended fund of fund Scheme investing in HSBC Global Investments Fund - China Consumer Opportunities Fund
Abridged Annual Report 2017 - 2018

1
Dear Investor,
Globally, we are witnessing a very interesting phase. The equity markets delivered a stellar performance in 2017. However, there are worries about the impact of higher rates, global trade wars, an economic growth moderation and higher volatility.
Closer home, India has become the world’s sixth-biggest economy. India has doubled its GDP to USD 2.2 trillion within a decade. The introduction of reform measures, including demonetisation and the Goods and Services Tax (GST), had put pressure on selective parts of the economy in 2017. The impact of these measures is likely to be transitory. India’s economic growth is expected to accelerate from 6.7% in FY18 to 7.4% in the current year as per IMF forecasts.
There has been a shift in the domestic savings pool supporting the market. Domestic investors have been increasing exposure to equities and financial assets moving away from gold and real estate. Mutual funds witnessed sizable inflows on the back of the boost in liquidity within the banking system from demonetisation. The AUM of the mutual fund industry grew by 21.7% in March 2018 compared to March 2017.
With growth, comes responsibility. Last year, the regulator, Securities and Exchange Board of India (SEBI) issued a circular to rationalise and categorise mutual fund schemes in India. We are pleased to state that none of our funds needed to be redesigned. All our schemes have been defined as per the new categorisation. We believe this classification will simplify investing into mutual funds and enhance comparability within the schemes offered.
As India moves to a digital age, e-commerce platforms are becoming increasingly popular. I request you to logon to our online transaction platform. It is a quick, convenient and an efficient tool to invest into our funds and manage your investments online.
At HSBC Global Asset Management, India, we are dedicated to one goal: delivering exceptional investment management for our clients. By bringing together our

2
global investment knowledge and capabilities, we are able to offer specialised expertise across asset classes. This has helped us to become a trusted partner to our individual and institutional investors.
We remain committed to our long-term perspective and disciplined investment approach as we conduct a rigorous, fundamental analysis of investments with a strong emphasis on risk management. Although the investment landscape appears favourable, it is worth remembering that markets are dynamic and constantly evolving. Therefore, we believe active, professional investment management serves investors well. Amid changing markets and economic conditions, we are confident that investors with a well-diversified portfolio and a patient, long-term outlook should be well positioned for the years ahead.
Together we thrive.
Warm regards,
Ravi Menon
Chief Executive Officer, HSBC Global Asset Management, India

3
SPONSORHSBC Securities and Capital Markets (India) Private LimitedRegd. Office: 52/60, Mahatma Gandhi Road, Fort, Mumbai - 400 001.
TRUSTEEBoard of TrusteesOffice: 16, Veer Nariman Road, Fort, Mumbai 400 001.
ASSET MANAGEMENT COMPANYHSBC Asset Management (India) Private LimitedCorp. & Regd. Office: 16, Veer Nariman Road, Fort, Mumbai 400 001.
CUSTODIANStandard Chartered Bank (SCB)Corp. & Regd. Office: Crescenzo, Securities Services, 3rd Floor, C-38/39, G-Block, Bandra Kurla Complex, Bandra East, Mumbai – 400051.
AUDITORS TO THE SCHEMEBSR & Co. LLPChartered Accountants 5th Floor, Lodha Excelus, Apollo Mills Compound, N.M. Joshi Marg, Mahalaxmi, Mumbai 400 011.
REGISTRAR & TRANSFER AGENTSComputer Age Management Services Private Limited (CAMS)Unit: HSBC Mutual Fund ’C’ Block, 2nd Floor, Hanudev Info Park P. Ltd., SF No. 558/2, Udayampalayam Road, Nava India, Coimbatore - 641 028.
BOARD OF TRUSTEESMr. Nasser Munjee
Mr. Manu Tandon
Mr. Mehli Mistri
Mr. Dilip J. Thakkar
Ms. Jasmine Batliwalla
Mr. Pedro Bastos
BOARD OF DIRECTORSMs. Kishori J. Udeshi - Chairperson
Mr. S. P. Mustafa
Mr. Dinesh Mittal
Mr. Ravi Menon - Chief Executive Officer

4
The Trustees of HSBC Mutual Fund (“Fund”) present the Sixteenth Annual Report and the audited abridged financial statements of the schemes of the Fund for the year ended March 31, 2018.
As at March 31, 2018, the Fund offered 30 schemes across asset classes to meet the varying investment needs of the investors. Notably, three Schemes of HSBC Mutual Fund viz. HSBC Large Cap Equity Fund, HSBC Short Duration Fund and HSBC Cash Fund have completed 15 years of operations during the year.
During the year, the Fund has launched Plan(s) under Fixed Term Series and carried out merger of the existing schemes viz HSBC Dividend Yield Equity Fund merged into HSBC Multi Cap Equity Fund (HMEF), erstwhile HSBC India Opportunities Fund, as offering sub-scale fund was not in the interest of the unitholders.
Further, in order to bring uniformity in the practice across Mutual Funds and to standardize the scheme categories and characteristics of schemes, SEBI vide its circular no. SEBI/HO/IMD/DF3/CIR/P/2017/114 dated October 06, 2017, issued guidelines for categorization and rationalization of Mutual Fund schemes.
Accordingly, HSBC Large Cap Equity Fund (erstwhile HSBC Equity Fund), HSBC Small Cap Equity Fund (erstwhile HSBC Mid Cap Equity Fund) , HSBC Infrastructure Equity Fund, HSBC Global Emerging Market Fund (erstwhile HSBC Emerging Market Fund), HSBC Debt Fund (erstwhile HSBC Income Fund – Investments Plan), HSBC Short Duration Fund (erstwhile HSBC Income Fund – Short Term Plan), HSBC Low Duration Fund (erstwhile HSBC Ultra Short Term Bond Fund), HSBC Regular Savings Fund (erstwhile HSBC Monthly Income Plan) and HSBC Managed Solutions have undergone fundamental attributes changes with effective from March 14, 2018.
The Fund continues its focus on delivering consistent long term returns. The comments on the performance of the Scheme(s) is provided hereinafter. Dividends were declared under various schemes as per the provisions contained in the respective Scheme Information Documents after considering the distributable surplus available under the respective Schemes. Details of dividends declared can be viewed on our website at www.assetmanagement.hsbc.com/in.
1. Scheme Performance, future outlook and oPerationS of the SchemeS
a. Operations and Performance of the Schemes
HSBC Global Consumer Opportunities Fund (HGCOF) – Benefiting from China’s Growing Consumption Power (HGCOF)
(An open ended fund of fund Scheme investing in HSBC Global Investments Fund - China Consumer Opportunities Fund)
HGCOF seeks to provide long term capital appreciation by investing predominantly in units of HSBC Global Investment Funds (HGIF) China Consumer Opportunities Fund. The Scheme may also invest a certain proportion of its corpus in money market instruments and/or units of liquid mutual fund schemes, in order to meet liquidity requirements from time to time. However, there can be no assurance or guarantee that the investment objective of the scheme would be achieved.
The net assets of HGCOF amounted to Rs.4.12 crores as at March 31, 2018 as compared to 5.20 crores as on March 31, 2017. Around 95.45 % of the net assets were invested in HSBC Global Consumer Opportunities Fund (overseas mutual fund) and 4.55% of the net assets comprised of reverse repos/CBLO and net current assets as at March 31, 2018.
The performance of the underlying fund led to the outperformance in HGCOF relative to its benchmark.
Scheme Name & Benchmarks Absolute Returns
(%)
Compounded Annualized Returns (%)
Date of Inception : 24 February 2015 1 Year 3 Years Since Inception
HSBC Global Consumer Opportunities Fund -– Growth 18.62 7.54 6.83
MSCI AC World Index (Scheme Benchmark) 13.66 9.21 8.68
Nifty 50 (Standard Benchmark) 12.68 7.99 6.15
Trustees’ ReportFor the year ended March 31, 2018

5
Scheme Name & Benchmarks Absolute Returns
(%)
Compounded Annualized Returns (%)
Date of Inception : 24 February 2015 1 Year 3 Years Since Inception
Rs. 10,000, if invested in HGCOF, would have become 11,862 12,442 12,267
Rs. 10,000, if invested in MSCI AC World Index, would have become 11,366 13,032 12,936
Rs. 10,000, if invested in Nifty 50, would have become 11,268 12,599 12,027
Past performance may or may not be sustained in future. The returns for the respective periods are provided as on last business day of March 2018 for Growth Option. Different plans shall have a different expense structure. Performance of the respective benchmark is calculated as per the Total Return Index (TRI).
b. Market Overview & Outlook (as furnished by HSBC Asset Management (India) Private Limited)
EqUITY OUTLOOKIndian equity markets continued to remain strong during fiscal year 2017-18 and posted gains of 11.76% by S&P CNX Nifty and 13.24% by BSE Midcap index respectively. Biggest drivers of the markets were, robust DII flow into equities, continued push of mega reforms – Goods and Services Tax (GST) implementation, Insolvency and Bankruptcy Code implementation, Real Estate (Regulation and Development) Act, second consecutive normal monsoon, and electoral victories of the ruling party in many state elections. On the other hand, the markets weather the storm of disruption in economy due to GST implementation, lingering impact of demonetization, muted FII flows, and rising yields in developed markets. Domestic Mutual Fund segment had their best ever year and they brought in ~USD 22 bn of net inflows in equities during the year. Even after witnessing ~USD 4.3 bn of net outflows from the domestic insurers, the net DII tally was a very impressive ~USD 17.7 bn of net inflows. There were mixed global cues well and the Foreign Institutional Investors (FIIs) net bought Indian equities worth USD 3.2 bn. The inflows by both FIIs and domestic MFs acted as a factor in the strong market performance.
Indices Returns (April 1, 2017 to March 31, 2018) 1 Year (%)
S&P BSE Sensex 12.70%
NSE CNX Nifty 11.76%
S&P BSE 100 12.12%
S&P BSE 200 12.49%
S&P BSE 500 13.21%
S&P BSE Midcap 14.31%
S&P BSE 250 Small-cap 14.13%
Source: Bloomberg (All values are total return)
Our view on the key aspects related to equity markets are presented below -
The impressive performance in equity markets during FY 2017-18 has come on the back of strong liquidity largely by domestic MFs but supported in party by FII flows, positive global growth, benign macro – both domestically and global, expectation of the continuation of favorable policy environment domestically and expectation of corporate earnings revival. Possibility of sound macro, economic reforms and implementation of existing reforms have increased, especially after continued success of the ruling party at the centre in state elections. However, after this strong performance in markets and rather long wait for earnings to be delivered has meant that the equity markets are currently trading above their historical averages.
Moving into FY 2018-19, we expect a continuation of the economic recovery process domestically, recovery in corporate earnings - led early by volume growth, and continued DII flows. Government led investment
Trustees’ ReportFor the year ended March 31, 2018 (Contd...)

6
spending and rural consumption are likely to lead with private sector investments contributing later (possibly after general elections 2019). The budget document that was presented in early February provides a good medium term policy direction for the economy. Occasionally the policy actions can serve up a few bumps and jolts but over the medium term, across different governments, there is a thread of continuity connecting many key economic policies such as in the case of this year’s union budget. We, in our investment process, prefer to take comfort in these threads of continuity and remain constructive on the India growth story. This makes us positive on the Indian equity markets over the medium to long term.
Risks are in the form of market valuations trending above historical averages, weaker than expected delivery in corporate earnings going forward, external news flows related to trade protectionism, developed market central banks raising rates prematurely, and geopolitical tensions and other eco-political events would also influence market performance going forward, as the recent rally in the markets was supported by strong FII inflows.
DEBT OUTLOOKFixed Income in Financial Year 2017-18 has seen volatility further step up in this year. Markets went to perfect storm with higher crude prices, low liquidity and pressure on currency, apart from rate hike expectations.
Inflation has followed the glide path to lower numbers towards 4% RBI target and even lower than the target number when inflation printed a lowly 1.46% in June 2018 on back of lower food prices. RBI went for a cut despite of neutral stance. This positivity continued till until crude shock came in form of higher crude process. Global prices of Brent crude saw substantial increase in second half of the year, which jeopardized the inflation path. Other worries that gathered around this time were related to GST collection and eventual impact on fiscal situation.
Government of India allowed the fiscal deficit to slip to 3.5% (budget 3.2%) and kept next year target at 3.3% (in place of earlier path of 3%). This was on back of some excise relaxation for oil products and a month less collected for GST due to implementation in the current year. The fear of fiscal slippage alongwith the announcement of higher bond issuances spooked the bond markets into higher yields. Government finally borrowed only INR 90 bln extra (in place of INR 500 bln announced initially).
On the Monetary front the year was very volatile as well. RBI changed its stance to neutral causing some worry around rate hikes. Thereafter it cut rates and again went for OMO sales operations simultaneously. This created some confusion in the market participants regarding rates direction. Finally extra supply, higher oil prices and higher inflation paved way for rates higher. RBI also held position on regulatory forbearance about spreading out losses by banks publicly. It eventually gave up the position in the end of March. However, the swift changes in stance caused lot of pressure and volatility in bonds.
Liquidity situation continuously deteriorated due to OMO sales initially and withdrawal of deposits due to remonetisation. Further liquidity was absorbed out due to portfolio outflows and reduction in reserves. Despite of defense from RBI utilizing the reserves, the currency depreciated meaningfully, which caused further jitters in foreign investor sentiments. Lack of liquidity also affected 1-3 year rates which were elevated in second half of the year.
Going forward following are key variables to watch out for:• Liquidity: Liquidity will drive short end rates and eventually drive decisions leading to market interventions
and CRR cuts. RBI has focused now on neutral liquidity stance and providing liquidity to system, which will bode well short end rates.
• Inflation: Inflation numbers will determine future course of action for RBI and remains a critical variable for policy. We expect inflation to remain at 4.7% level in the ease in second half of FY 2018-19 in line with RBI’s expectations.
• Growth: GDP growth numbers as well as industrial activity will also determine the decision on policy.
• Fiscal deficit: Fiscal deficit and government spending will determine the government borrowing and crowding out in interest rate curve. We expect prudence in government spending and prospect of spending on infrastructure to pick up which will crowd in private investment as well.
• Current Account Deficit: Current Account Deficit determines how the pressure on currency works and effective management of forex reserves.
Trustees’ ReportFor the year ended March 31, 2018 (Contd...)

7
• Currency levels: Level of INR will determine how the central bank reacts to the situation on the global crisis etc.
2. Brief Background of SPonSorS, Board of truSteeS and aSSet management comPany
a. Sponsor
HSBC Mutual Fund is sponsored by HSBC Securities and Capital Markets (India) Private Limited (HSCI). The Sponsor is the Settler of the Mutual Fund Trust. The Sponsor has entrusted a sum of Rs. 1,00,000 (Rupees One Lakh only) to the Trustee as the initial contribution towards the corpus of the Mutual Fund.
HSCI offers integrated investment banking services, securities and corporate finance & advisory. HSCI is a member of the Bombay Stock Exchange Limited and National Stock Exchange (capital and derivative market segments). HSCI holds 100% of the paid up equity share capital of HSBC Asset Management (India) Private Limited.
b. HSBC Mutual Fund
HSBC Mutual Fund (“the Mutual Fund” or “the Fund”) has been constituted as a Trust in accordance with the provisions of the Indian Trusts Act, 1882 (2 of 1882) vide a Trust Deed dated February 7, 2002 with HSBC Securities and Capital Markets (India) Private Limited, as the Sponsor and the Board of Individual Trustees. The Trustee has entered into an Investment Management Agreement dated February 7, 2002 with HSBC Asset Management (India) Private Limited (AMC) to function as the Investment Manager for all the schemes of the Fund. The Fund was registered with SEBI vide registration number MF/046/02/5 dated May 27, 2002.
The Trust has been formed for the purpose of pooling of capital from the public for collective investment in securities for the purpose of providing facilities for participation by persons as beneficiaries in such investments and in the profits/income arising therefrom.
c. Board of Trustees (the Trustees)
The Board of Trustees is the exclusive owner of the Trust Fund and holds the same in trust for the benefit of the unit holders. The Trustees have been discharging their duties and carrying out the responsibilities as provided in the SEBI (Mutual Funds) Regulations, 1996 and the Trust Deed. The Trustees seek to ensure that the Fund and the schemes floated there under are managed by the AMC in accordance with the Trust Deed, the said Regulations, directions and guidelines issued by the SEBI, the Stock Exchanges, the Association of Mutual Funds in India and other regulatory agencies.
d. Asset Management Company (the AMC)
HSBC Asset Management (India) Private Limited (the Investment Manager or the AMC) is a private limited company incorporated under the Companies Act, 1956 on December 12, 2001 having its Registered Office at 16, V. N. Road, Fort, Mumbai 400 001. HSBC Asset Management (India) Private Limited has been appointed as the Asset Management Company of HSBC Mutual Fund by the Trustee vide Investment Management Agreement (IMA) dated February 7, 2002 and executed between the Trustees and the AMC. SEBI approved the AMC to act as the Investment Manager of the Fund vide its letter No. MFD/BC/163/2002 dated May 27, 2002. The paid-up equity share capital of the AMC is Rs. 61.59 crores. The AMC is registered as a Portfolio Manager under the SEBI (Portfolio Managers) Regulations, 1993 vide registration no. INP000001322. The AMC also offers non-binding Advisory services to offshore funds under the mutual fund license.
HSBC Securities and Capital Markets (India) Private Limited holds 100% of the paid up equity share capital of the AMC.
3. inveStment oBjective of the SchemeS The investment objective of the respective schemes has been provided above under the heading “Scheme
Performance, Future Outlook and Operation of the Scheme” (Refer Section 1).
Trustees’ ReportFor the year ended March 31, 2018 (Contd...)

8
4. Significant accounting PolicieS The Significant Accounting Policies form part of the Notes to the Accounts annexed to the Balance Sheet
of the Schemes in the Full Annual Report. The accounting policies are in accordance with Securities Exchange Board of India (Mutual Funds) Regulations 1996.
5. unclaimed dividendS & redemPtionS Summary of number of investors & corresponding amount Scheme-wise as on March 31, 2018.
SchemeUnclaimed Dividend Unclaimed Redemption
Amount (Rs.) No. of Investors
Amount (Rs.) No. of Investors
HSBC Global Consumer Opportunities Fund
8,314.13 13 – –
6. inveStor ServiceSThe number of official points of acceptance of transactions is 205 locations. In addition to the offices of the Registrar & Transfer agents, the AMC has Investor Service Centres in 9 locations at its own offices - namely Mumbai, New Delhi, Kolkata, Bangaluru, Pune, Ahmedabad, Hyderabad, Chandigarh and Chennai. With a view to enhance customer convenience, the AMC has the facility of priority based servicing to key distributors through the enhancement of the Interactive Voice Reponses. The AMC has a single Toll Free number which can be dialed from anywhere in India. The call centre service is being managed by the Registrar and Transfer Agents.
On the distribution front, the number of empanelled distributors was 460 as on March 31, 2018. During the year, the AMC initiated tie-ups for online distribution of the Mutual Fund’s schemes with several channel partners taking the total number of such tie-ups to 42.
7. detailS of inveStor grievance redreSSalThe details of the redressal of investor complaints received against HSBC Mutual Fund during April 2017 - March 2018 are as follows:
2017-2018
Com- plaint Code
Type of complaint (a) No. of complaints
pending at the
beginning of the year
(b) No. of complaints received during
the year
Action on (a) and (b)
Resolved Non Actiona-
ble*
Pending
Within 30
days
30 - 60 days
60 - 180 days
Beyond 180 days
0 - 3 months
3 - 6 months
6 - 9 months
9 - 12 months
I A Non receipt of Dividend on Units
0 5 4 1 0 0 0 0 0 0 0
I B Interest on delayed payment of Dividend
0 0 0 0 0 0 0 0 0 0 0
I C Non receipt ofRedemption Proceeds
1 12 12 1 0 0 0 1 0 0 0
I D Interest on delayedpayment of Redemption
0 1 1 0 0 0 0 0 0 0 0
II A Non receipt of Statement of Account / Unit Certificate
0 0 0 0 0 0 0 0 0 0 0
II B Discrepancy in Statement of Account
0 0 0 0 0 0 0 0 0 0 0
Trustees’ ReportFor the year ended March 31, 2018 (Contd...)

9
2017-2018
Com- plaint Code
Type of complaint (a) No. of complaints
pending at the
beginning of the year
(b) No. of complaints received during
the year
Action on (a) and (b)
Resolved Non Actiona-
ble*
Pending
Within 30
days
30 - 60 days
60 - 180 days
Beyond 180 days
0 - 3 months
3 - 6 months
6 - 9 months
9 - 12 months
II C Data corrections in Investor details **
0 34 34 0 0 0 0 0 0 0 0
II D Non receipt of Annual Report /Abridged Summary
0 0 0 0 0 0 0 0 0 0 0
III A Wrong switch between Schemes
0 0 0 0 0 0 0 0 0 0 0
III B Unauthorized switch between Schemes
0 0 0 0 0 0 0 0 0 0 0
III C Deviation from Scheme attributes
0 0 0 0 0 0 0 0 0 0 0
III D Wrong or excess charges / load
0 0 0 0 0 0 0 0 0 0 0
III E Non updat ion of changes viz. address, PAN, bank details, nomination, etc
0 6 6 0 0 0 0 0 0 0 0
IV Others 1 41 42 0 0 0 0 0 0 0 0
Total 2 99 99 2 0 0 0 0 0 0 0
Summary of Complaints for FY 2017-18
Particulars Count
Total complaints received 99
Total number of folios 140099
% of complaints against the folio 0.071%
# active folios** As per AMFI Best Practice Guidelines Circular No.25/2011-12 for Revisions in the Guidelines on
Standardization of Complaints/Grievances Reporting Procedure. If “Others” include a type of complaint which is more than 10% of overall complaints, then such a reason should be provided separately. Hence data corrections in Investor Details is included as a separate category
* Non actionable means the complaint is incomplete / outside the scope of the mutual fund
8. inveStor education initiativeS The Fund undertook various investor education and awareness initiatives related to investments in mutual funds throughout India in English / Hindi and Regional languages via mass media. The Fund conducted 16 roadshows at various locations in India to promote various Investor Awareness related topics including Asset Allocation, SIPs, Equity Mutual Funds and Financial Planning. The Fund has a Year-long tie-up with Mutual Fund Insights Magazine that includes 3 pages of content and advertorial publication in their monthly issue. Each issue contains a story promoting SIPs to achieve one’s various investment goals. In the month of December 2017 and January 2018 investor awareness promotion was done through Outlook and Outlook Money magazines through advertorials on various Mutual Fund topics.
Trustees’ ReportFor the year ended March 31, 2018 (Contd...)

10
9. Statutory detailSa) The Sponsors are not responsible or liable for any loss resulting from the operation of the Schemes of
the Fund beyond initial contribution of Rs. 1 lakh for setting up the Fund.
b) The price and redemption value of the units, and income from them, can go up as well as down with fluctuations in the market value of its underlying investments.
c) Full Annual Report shall be disclosed on the website at www.assetmanagement.hsbc.com/in and shall be available for inspection at the Head Office of the Mutual Fund. Present and prospective unit holders can obtain copy of the Trust Deed, the full Annual Report of the Scheme(s), the Annual Report of HSBC Asset Management (India) Private Limited and the text of the relevant Scheme(s) at a price.
10. acknowledgementSThe Trustees wish to thank the Unit holders of the Schemes for their support throughout the year and also thank the Government of India, the Securities and Exchange Board of India (SEBI), the Reserve Bank of India (RBI) and the Association of Mutual Funds in India (AMFI) for the guidance provided by them. The Trustees also appreciate the services provided by the Registrar and Transfer Agent, Fund Accountant, Custodian, Bankers, Distributors and Brokers. The guidance and services provided by the Auditors and advocates and the ebullience, sincerity and dedication of the employees of HSBC Asset Management (India) Private Limited is also appreciated.
The Trustees look forward to the continued support of everyone.
For and on behalf of the Board of Trustees of HSBC Mutual Fund
Sd/-
Dilip Thakkar
Trustee
Mumbai
July 17, 2018.
Trustees’ ReportFor the year ended March 31, 2018 (Contd...)

11
To the Board of Trustees
HSBC Mutual Fund – HSBC Global Consumer Opportunities Fund
Report on the Financial StatementsWe have audited the accompanying Financial Statements of HSBC Global Consumer Opportunities Fund (the ‘Scheme’), which comprise the balance sheet as at 31 March 2018 and the related revenue account for the year then ended, and a summary of significant accounting policies and other explanatory information, annexed thereto.
Management’s responsibility for the Financial StatementsThe Board of Trustees to the HSBC Mutual Fund (the ‘Board of Trustees’) and HSBC Asset Management (India) Private Limited (the ‘AMC’), being the investment manager to HSBC Mutual Fund (the ‘Fund’) (collectively referred as ‘Management’), are responsible for the preparation of these financial statements that give a true and fair view of the financial position and financial performance of the Scheme in accordance with the accounting policies and standards specified in the Ninth Schedule of the Securities and Exchange Board of India (Mutual Funds) Regulations, 1996, as amended (the ‘Regulations’) and the accounting principles generally accepted in India. This responsibility includes maintenance of adequate accounting records for safeguarding of the assets of the Scheme and for preventing and detecting frauds and other irregularities; selection and application of appropriate accounting policies; making judgments and estimates that are reasonable and prudent; and design, implementation and maintenance of adequate internal financial controls, that were operating effectively for ensuring the accuracy and completeness of the accounting records, relevant to the preparation and presentation of the financial statements that give a true and fair view and are free from material misstatement, whether due to fraud or error.
In preparing the financial statements, management is responsible for assessing the Scheme’s ability to continue as a going concern, disclosing, as applicable, matters related to going concern and using the going concern basis of accounting unless management either intends to liquidate the Fund or to cease operations, or has no realistic alternative but to do so.
Auditor’s responsibilityOur responsibility is to express an opinion on these financial statements based on our audit. We conducted our audit in accordance with the Standards on Auditing issued by the Institute of Chartered Accountants of India (the ‘ICAI’). Those Standards require that we comply with ethical requirements and plan and perform the audit to obtain reasonable assurance about whether the financial statements are free from material misstatement.
An audit involves performing procedures to obtain audit evidence about the amounts and disclosures in the financial statements. The procedures selected depend on the auditor’s judgment, including the assessment of the risks of material misstatement of the financial statements, whether due to fraud or error. In making those risk assessments, the auditor considers internal controls relevant to preparation and fair presentation of the financial statements, of the Scheme, in order to design audit procedures that are appropriate in the circumstances, but not for the purpose of expressing an opinion on the effectiveness of the Scheme’s internal controls. An audit also includes evaluating the appropriateness of accounting policies used and the reasonableness of the accounting estimates made by Management, as well as evaluating the overall presentation of the financial statements.
We are also responsible to conclude on the appropriateness of management’s use of the going concern basis of accounting and, based on the audit evidence obtained, whether a material uncertainty exists related to events or conditions that may cast significant doubt on the Scheme’s ability to continue as a going concern. If we conclude that a material uncertainty exists, we are required to draw attention in the auditor’s report to the related disclosures in the financial statements or, if such disclosures are inadequate, to modify the opinion. Our conclusions are based on the audit evidence obtained up to the date of the auditor’s report. However, future events or conditions may cause the Scheme to cease to continue as a going concern.
We believe that the audit evidence we have obtained is sufficient and appropriate to provide a basis for our audit opinion.
Independent Auditors’ Report

12
Independent Auditors’ Report (Contd...)
OpinionIn our opinion, and to the best of our information and according to the explanations given to us, the aforesaid financial statements give the information required by the Regulations in the manner so required and give a true and fair view in conformity with the accounting principles generally accepted in India:
(i) in the case of the balance sheet, of the state of affairs of the Scheme as at 31 March 2018; and
(ii) in the case of the revenue account, of the net surplus for the year ended on that date.
Report on other Legal and Regulatory Requirements1 As required by Regulation 55(4) to the Regulations, we report that:
(a) We have obtained all information and explanations which, to the best of our knowledge and belief, were necessary for the purposes of the audit;
(b) The balance sheet and revenue account have been prepared in accordance with the accounting policies and standards specified in the Ninth Schedule of the Regulations.
2 As required by Clause 5(ii)(2) of the Eleventh Schedule of the Regulations, we report that the balance sheet and revenue account are in agreement with the books of account of the Scheme.
3 In our opinion and on the basis of information and explanations given to us, the methods used to value non - traded securities, as at 31 March 2018, as determined by the Board of Directors of AMC, are in accordance with the Regulations and other guidelines issued by the Securities and Exchange Board of India as applicable and approved by the Board of Trustees are fair and reasonable.
For B S R & Co. LLP Chartered Accountants Firm’s Registration No: 101248W/W-100022
Milind Ranade Partner Membership No: 100564
Place : Mumbai Date : July 17, 2018.

13
Abridged Balance Sheet as at March 31, 2018
Rs. in Lakhs
HSBC GLOBAL CONSUMER OPPORTUNITIES FUND – BENEFITING FROM CHINA’S GROWING CONSUMPTION POWER
As at March 31, 2018
As at March 31, 2017
LIABILITIES1 Unit Capital 334.93 505.85 2 Reserves & Surplus2.1 Unit Premium Reserves (23.99) (6.49)2.2 Unrealised Appreciation Reserve 87.62 28.07 2.3 Other Reserves 13.01 (7.35)3 Loans & Borrowings – – 4 Current Liabilities & Provisions4.1 Provision for doubtful Income/Deposits – – 4.2 Other Current Liabilities & Provisions 1.54 6.82
TOTAL 413.11 526.90
ASSETS1 Investments1.1 Listed Securities:1.1.1 Equity Shares – – 1.1.2 Preference Shares – – 1.1.3 Equity Linked Debentures – – 1.1.4 Other Debentures & Bonds – – 1.1.5 Securitised Debt securities – – 1.2 Securities Awaited Listing:1.2.1 Equity Shares – – 1.2.2 Preference Shares – – 1.2.3 Equity Linked Debentures – – 1.2.4 Other Debentures & Bonds – – 1.2.5 Securitised Debt securities – – 1.3 Unlisted Securities1.3.1 Equity Shares – – 1.3.2 Preference Shares – – 1.3.3 Equity Linked Debentures – – 1.3.4 Other Debentures & Bonds – – 1.3.5 Securitised Debt securities – – 1.4 Government Securities – – 1.5 Treasury Bills – – 1.6 Commercial Paper – – 1.7 Certificate of Deposits – – 1.8 Bill Rediscounting – – 1.9 Units of Domestic Mutual Fund – – 1.10 Foreign Securities 392.82 510.82
Total Investments 392.82 510.82
2 Deposits 0.18 0.05 3 Other Current Assets3.1 Cash & Bank Balance 0.04 0.40 3.2 CBLO/Reverse Repo Lending 19.89 15.61 3.3 Others 0.18 0.02 4 Deferred Revenue Expenditure (to the extent not written off) – –
TOTAL 413.11 526.90
Notes to Accounts – Annexure I

14
Abridged Revenue Account for the year ended March 31, 2018
Rs. in Lakhs
HSBC GLOBAL CONSUMER OPPORTUNITIES FUND
– BENEFITING FROM CHINA’S GROWING CONSUMPTION POWER
Current Year ended
March 31, 2018
Previous Year ended
March 31, 2017
1 INCOME1.1 Dividend – –1.2 Interest 0.88 1.251.3 Realised Gain / (Loss) on Foreign Exchange Transactions (0.54) (1.37)1.4 Realised Gains / (Losses) on Interscheme sale of investments – –1.5 Realised Gains / (Losses) on External sale / redemption of
investments27.98 (9.33)
1.6 Realised Gains / (Losses) on Derivative Transactions – –1.7 Other Income – –
(A) 28.32 (9.45)
2 EXPENSES2.1 Management fees 1.58 3.812.2 GST / Service tax on Management fees 0.27 0.572.3 Transfer agents fees and expenses 0.28 0.382.4 Custodian fees 1.73 1.842.5 Trusteeship fees 0.01 0.022.6 Commission to Agents 3.05 4.822.7 Marketing & Distribution expenses – 0.012.8 Audit fees 0.20 0.202.9 Investor Education Expenses 0.09 0.152.10 Other operating expenses 0.30 0.522.11 Less: Expenses to be Reimbursed by the Investment Manager (0.03) –
(B) 7.48 12.32
3 NET REALISED GAINS / (LOSSES) FOR THE YEAR (A -B = C) 20.84 (21.77)
4 Change in Unrealised Depreciation in value of investments*** (D) (0.06) 48.36
5 NET GAINS / (LOSSES) FOR THE YEAR [E=(C+D)] 20.78 26.59
6 Change in unrealised appreciation in the value of investments and derivatives (F) 59.55 28.07
7 NET SURPLUS / (DEFICIT) FOR THE YEAR (E + F = G) 80.33 54.66
7.1 Add: Balance transfer from Unrealised Appreciation Reserve – –7.2 Less: Balance transfer to Unrealised Appreciation Reserve 59.55 28.077.3 Add / (Less): Equalisation (0.42) 22.987.4 Transfer from Reserve Fund (7.35) (56.92)
8 Total 13.01 (7.35)
9 Dividend appropriation9.1 Income Distributed during the year – –9.2 Tax on income distributed during the year – –10 Retained Surplus / (Deficit) carried forward to
Balance sheet 13.01 (7.35)
Notes to Accounts - Annexure I

15
Key Statistics for the year ended March 31, 2018
HSBC GLOBAL CONSUMER OPPORTUNITIES FUND
– BENEFITING FROM CHINA’S GROWING CONSUMPTION POWER
Current Year ended
March 31, 2018
Previous Year ended
March 31, 2017
1. NAV per unit (Rs.):
Open
Regular Plan Growth Option 10.2734 9.4719
Regular Plan Dividend Option – –
Direct Plan - Growth Option 10.4257 9.5452
Direct Plan - Dividend Option – –
High
Regular Plan Growth Option 12.8120 10.4370
Regular Plan Dividend Option – –
Direct Plan - Growth Option 13.0768 10.5889
Direct Plan - Dividend Option – –
Low
Regular Plan Growth Option 10.1196 8.9271
Regular Plan Dividend Option – –
Direct Plan - Growth Option 10.2732 9.0114
Direct Plan - Dividend Option – –
End
Regular Plan Growth Option 12.2644 10.2734
Regular Plan Dividend Option – –
Direct Plan - Growth Option 12.5376 10.4257
Direct Plan - Dividend Option – –
2. Closing Assets Under Management (Rs. in Lakhs)
End 412 520
Average (AAuM)1 449 731
3. Gross income as % of AAuM2 6.31% –1.29%
4. Expense Ratio:
a. Total Expense as % of AAuM (including service tax / GST on Management fees) (planwise)
Regular Plan (Continue) 1.71% 1.71%
Direct Plan 0.99% 1.00%
b. Management Fee as % of AAuM (planwise)
Regular Plan (Continue) 0.35% 0.52%
Direct Plan 0.35% 0.52%
5. Net Income as a percentage of AAuM3 4.64% –2.98%
6. Portfolio turnover ratio4 – –

16
Key Statistics for the year ended March 31, 2018 (Contd...)
HSBC GLOBAL CONSUMER OPPORTUNITIES FUND
– BENEFITING FROM CHINA’S GROWING CONSUMPTION POWER
Current Year ended
March 31, 2018
Previous Year ended
March 31, 2017
7. Total Dividend per unit distributed during the year (planwise)
Retail
Regular Plan Dividend Option – –
Direct Plan - Dividend Option – –
Corporate
Regular Plan Dividend Option – –
Direct Plan - Dividend Option – –
8. Returns (%):
a. Last One Year Scheme
Regular Plan Growth Option 18.6173 8.4619
Direct Plan - Growth Option 19.4852 9.2245
Benchmark
MSCI AC World Index 13.6600 12.7078
b. Since Inception Scheme
Regular Plan Growth Option 6.8263 1.2919
Direct Plan - Growth Option 7.5871 2.0037
Benchmark
MSCI AC World Index 8.6800 1.8824
1. AAuM=Average daily net assets
2. Gross income = amount against (A) in the Revenue account i.e. Income3. Net income = amount against (C) in the Revenue account i.e. Net Realised Gains / (Losses) for the year4. Portfolio Turnover = Lower of sales or purchase divided by the Average AuM for the year5 The net asset value disclosed represents the computed NAV on March 31, 2018 (Non-business Day), and
not the last declared NAV.6 The Total management fees and other expenses charged by the underlying fund along with the
management fee and recurring expenses charged by the domestic Mutual Fund is as follows:
Scheme TER charged by underlying Fund ***
TER of the domestic Fund***
Total TER ***
Maximum TER Cap as per
circular***
2017-18
HSBC Global Consumer Opportunities Fund – Benefiting From China’s Growing Consumption Power
0.70% 1.65% 2.35% 2.70%
2016-17
HSBC Global Consumer Opportunities Fund – Benefiting From China’s Growing Consumption Power
0.70% 1.63% 2.33% 2.70%
*** The TER excludes GST / Service Tax on Management fees

17
Notes to Accounts – Annexure ITo the Abridged Balance Sheet and Revenue Account for the Year ended March 31, 2018
HSBC GLOBAL CONSUMER OPPORTUNITIES FUND – BENEFITING FROM CHINA’S GROWING CONSUMPTION POWER
1 Investments:
1.1 It is confirmed that investments of the Scheme are registered in the name of the Trustees for the benefit of the Scheme’s unitholders.
1.2 Open Positions of derivatives as of year ended March 31, 2018 & March 31, 2017 are NIL
1.3 Investments in Associates and Group Companies as of year ended March 31, 2018 & March 31, 2017 are NIL.
1.4 Open positions of Securities Borrowed and / or Lent by the Scheme as of the year ended March 31, 2018 & March 31, 2017 are NIL.
1.5 NPA as at year ended March 31, 2018 & March 31, 2017 are NIL.
1.6 Aggregate Unrealised Gain / Loss as at the end of the financial period and percentage to net assets.
Security Category Amount (Rupees)
Percentage to Net Assets
Amount (Rupees)
Percentage to Net Assets
2018 2017
Foreign Securities
– Appreciation 8,761,510 21.29 2,806,628 5.40
– Depreciation – – – –
1.7 The aggregate value of investments securities (excluding CBLO and Reverse Repos) purchased and sold (including matured) during the financial period 2017-2018 (excluding accretion of discount) is Nil and 20,553,911 respectively being Nil and 45.80% of the average daily net assets.
The aggregate value of investments securities (excluding CBLO and Reverse Repos) purchased and sold (including matured) during the financial period 2016-2017 (excluding accretion of discount) is Nil and 59,362,253 respectively being Nil and 81.16% of the average daily net assets.
1.8 Non -Traded securities in the portfolios as at March 31, 2018 and period ended March 31,2017 are NIL.
2 Disclosure Under Regulation 25(8) of the Securities and Exchange Board of India (Mutual Funds) Regulations, 1996 as amended
Commission paid to Sponsor / AMC and its associates / related parties / group companies
Name of Sponsor / AMC and its associates / related parties / group companies
Nature of Association / Nature of
Relation
Period Covered
Business Given [Rs. In Crores]
% of Total Business received by the Fund
Commission paid [Rs.]
% of Total commission paid by the
Fund
The Hongkong and Shanghai Banking Corporation Limited
Associate of Investment Manager
2017-2018 0.31 28.38 213,162.49 76.74

18
Name of Sponsor / AMC and its associates / related parties / group companies
Nature of Association / Nature of
Relation
Period Covered
Business Given [Rs. In Crores]
% of Total Business
received by the Fund
Commission paid [Rs.]
% of Total commission paid by the
Fund
The Hongkong and Shanghai Banking Corporation Limited
Associate of Investment Manager
2016-2017 0.01 3.56 385,884.60 85.37
Brokerage paid to Sponsor/AMC and its associates/related parties/group companies is NIL. (Previous year also NIL)
(i) Any underwriting obligations undertaken by the schemes of the mutual funds with respect to issue of securities associate companies - Nil (Previous year also Nil).
(ii) Devolvement - Nil. (Previous year also Nil)
(iii) Subscription by the schemes in the issues lead managed by associate companies - Nil (Previous year also Nil).
(iv) Subscription to any issue of equity or debt on private placement basis where the sponsor or its associate companies have acted as arranger or manager - Nil (Previous year also Nil).
3 None of the Investors held more than 25% of the total net assets of the Scheme at the years ended March 31, 2018 and March 31, 2017.
4 Unit Capital movement during the year ended March 31, 2018:
Description 2017-2018
Opening Units Subscription Redemption Closing Units Face Value per unit (Rupees)
Regular Plan Growth Option
4,803,191.184 587,429.771 2,330,031.273 3,060,589.682 10
Direct Plan - Growth Option
255,300.885 142,732.820 109,339.765 288,693.940 10
Description 2016-2017
Opening Units Subscription Redemption Closing Units Face Value per unit (Rupees)
Regular Plan Growth Option
10,825,774.705 43,032.929 6,065,616.450 4,803,191.184 10
Direct Plan - Growth Option
269,518.254 3,012.443 17,229.812 255,300.885 10
** Units held by the AMC (Seed Capital) in Direct Plan Growth Option as on March 31, 2018 is 244,572.037 & as on March 31, 2017 is 244,572.037
5 No contingent liabilities for the years ended March 31, 2018 and March 31, 2017.
6 Expenses other than Management Fees are Inclusive of GST / Service Tax where applicable.
7 Other income credited to the Scheme is Nil (Previous year also Nil).
Notes to Accounts – Annexure I (Contd...)To the Abridged Balance Sheet and Revenue Account for the Year ended March 31, 2018

19
Notes to Accounts – Annexure I (Contd...)To the Abridged Balance Sheet and Revenue Account for the Year ended March 31, 2018
8 Investor Education Awareness
In view of the AMFI Best Practices Guidelines Circular No. 56/2015-16, the IEF ( Investor Education Fund) accrual is set aside in a separate bank account and the consolidated balance across all schemes as on March 31, 2018. The break-up of which is as under:
Particulars March 31, 2018 Amount (in Rs. Lacs)
March 31, 2017 Amount (in Rs. Lacs)
Opening Balance 44.00 –
Add: Accrual during the year 219.83 182
Less: Transferred to AMFI 101.10 83
Less: Payable to AMFI (March accrual) 8.81 8
Add: Investment Income for the year 8.28 11
Less: Spent during the year 43.17 58
Closing Balance 119.02 44
9 The Annual Accounts of the Schemes prepared in accordance with the accounting policies and standards specified in the Ninth Schedule of The Securities and Exchange Board of India (Mutual Funds) Regulations, 1996 has been approved by the Board of Directors of HSBC Asset Management (India) Private Limited and The Board of Trustees of HSBC Mutual Fund at their meetings held on July 16, 2018 and July 17, 2018 respectively. The audit report attached herewith refers to the said Annual Accounts. The aforesaid abridged accounts are an extract of the Annual Accounts and are prepared in accordance with SEBI Circular No. IMD/Cir8/132968/2008 dated July 24, 2008.

20
Voting Policy and Procedures
In view of SEBI guidelines related to “Role of Mutual Funds in Corporate Governance of Public Listed Companies”, AMIN has formulated its “Policy for Proxy Voting in Public Listed Companies”. The said policy and details of actual exercise of proxy votes along with the summary of votes cast and the auditors certification during the Financial Year 2017 – 18 is available on its website – http://www.assetmanagement.hsbc.com/in and in full Annual Report for the Financial Year 2017 – 18.

Statutory Details & Disclaimers
All returns have been sourced from Mutual Funds India Explorer software unless otherwise stated. With regard to equity schemes (including the equity component of MIPs), Fund performance is calculated on a total return basis (i.e. it includes dividends re-invested) while the benchmark is calculated on a price return basis (i.e. it does not consider dividends re-invested). This document has been prepared by HSBC Asset Management (India) Private Ltd (HSBC) for information purposes only and should not be construed as an offer or solicitation of an offer for purchase of any of the funds of HSBC Mutual Fund. All information contained in this document (including that sourced from third parties), is obtained from sources HSBC, the third party believes to be reliable but which it has not independently verified and HSBC, the third party makes no guarantee, representation or warranty and accepts no responsibility or liability as to the accuracy or completeness of such information. The information and opinions contained within the document are based upon publicly available information and rates of taxation applicable at the time of publication, which are subject to change from time to time. Expressions of opinion are those of HSBC only and are subject to change without notice. It does not have regard to specific investment objectives, financial situation and the particular needs of any specific person who may receive this document. Investors should seek financial advice regarding the appropriateness of investing in any securities or investment strategies that may have been discussed or recommended in this report and should understand that the views regarding future prospects may or may not be realized. Neither this document nor the units of HSBC Mutual Fund have been registered in any jurisdiction. The distribution of this document in certain jurisdictions may be restricted or totally prohibited and accordingly, persons who come into possession of this document are required to inform themselves about, and to observe, any such restrictions.
Investors should not invest in the Scheme solely based on the information provided in this document and should read the Scheme Information Document and Statement of Additional Information of the Fund for details. This document does not constitute an offering document.
No part of this publication may be reproduced, stored in a retrieval system, or transmitted, on any form or by any means, electronic, mechanical, photocopying, recording, or otherwise, without the prior written permission of HSBC Asset Management (India) Private Ltd.
Mutual Fund investments are subject to market risks, read all scheme related documents carefully.

HSBC Regular Savings Fund (erstwhile HSBC Monthly Income Plan)An open ended hybrid Scheme investing predominantly in debt instruments
Abridged Annual Report 2017 - 2018

1
Dear Investor,
Globally, we are witnessing a very interesting phase. The equity markets delivered a stellar performance in 2017. However, there are worries about the impact of higher rates, global trade wars, an economic growth moderation and higher volatility.
Closer home, India has become the world’s sixth-biggest economy. India has doubled its GDP to USD 2.2 trillion within a decade. The introduction of reform measures, including demonetisation and the Goods and Services Tax (GST), had put pressure on selective parts of the economy in 2017. The impact of these measures is likely to be transitory. India’s economic growth is expected to accelerate from 6.7% in FY18 to 7.4% in the current year as per IMF forecasts.
There has been a shift in the domestic savings pool supporting the market. Domestic investors have been increasing exposure to equities and financial assets moving away from gold and real estate. Mutual funds witnessed sizable inflows on the back of the boost in liquidity within the banking system from demonetisation. The AUM of the mutual fund industry grew by 21.7% in March 2018 compared to March 2017.
With growth, comes responsibility. Last year, the regulator, Securities and Exchange Board of India (SEBI) issued a circular to rationalise and categorise mutual fund schemes in India. We are pleased to state that none of our funds needed to be redesigned. All our schemes have been defined as per the new categorisation. We believe this classification will simplify investing into mutual funds and enhance comparability within the schemes offered.
As India moves to a digital age, e-commerce platforms are becoming increasingly popular. I request you to logon to our online transaction platform. It is a quick, convenient and an efficient tool to invest into our funds and manage your investments online.
At HSBC Global Asset Management, India, we are dedicated to one goal: delivering exceptional investment management for our clients. By bringing together our

2
global investment knowledge and capabilities, we are able to offer specialised expertise across asset classes. This has helped us to become a trusted partner to our individual and institutional investors.
We remain committed to our long-term perspective and disciplined investment approach as we conduct a rigorous, fundamental analysis of investments with a strong emphasis on risk management. Although the investment landscape appears favourable, it is worth remembering that markets are dynamic and constantly evolving. Therefore, we believe active, professional investment management serves investors well. Amid changing markets and economic conditions, we are confident that investors with a well-diversified portfolio and a patient, long-term outlook should be well positioned for the years ahead.
Together we thrive.
Warm regards,
Ravi Menon
Chief Executive Officer, HSBC Global Asset Management, India
3
SPONSORHSBC Securities and Capital Markets (India) Private LimitedRegd. Office: 52/60, Mahatma Gandhi Road, Fort, Mumbai - 400 001.
TRUSTEEBoard of TrusteesOffice: 16, Veer Nariman Road, Fort, Mumbai 400 001.
ASSET MANAGEMENT COMPANYHSBC Asset Management (India) Private LimitedCorp. & Regd. Office: 16, Veer Nariman Road, Fort, Mumbai 400 001.
CUSTODIANStandard Chartered Bank (SCB)Corp. & Regd. Office: Crescenzo, Securities Services, 3rd Floor, C-38/39, G-Block, Bandra Kurla Complex, Bandra East, Mumbai – 400051.
AUDITORS TO THE SCHEMEBSR & Co. LLPChartered Accountants 5th Floor, Lodha Excelus, Apollo Mills Compound, N.M. Joshi Marg, Mahalaxmi, Mumbai 400 011.
REGISTRAR & TRANSFER AGENTSComputer Age Management Services Private Limited (CAMS)Unit: HSBC Mutual Fund ’C’ Block, 2nd Floor, Hanudev Info Park P. Ltd., SF No. 558/2, Udayampalayam Road, Nava India, Coimbatore - 641 028.
BOARD OF TRUSTEESMr. Nasser Munjee
Mr. Manu Tandon
Mr. Mehli Mistri
Mr. Dilip J. Thakkar
Ms. Jasmine Batliwalla
Mr. Pedro Bastos
BOARD OF DIRECTORSMs. Kishori J. Udeshi - Chairperson
Mr. S. P. Mustafa
Mr. Dinesh Mittal
Mr. Ravi Menon - Chief Executive Officer

4
The Trustees of HSBC Mutual Fund (“Fund”) present the Sixteenth Annual Report and the audited abridged financial statements of the schemes of the Fund for the year ended March 31, 2018.
As at March 31, 2018, the Fund offered 30 schemes across asset classes to meet the varying investment needs of the investors. Notably, three Schemes of HSBC Mutual Fund viz. HSBC Large Cap Equity Fund, HSBC Short Duration Fund and HSBC Cash Fund have completed 15 years of operations during the year.
During the year, the Fund has launched Plan(s) under Fixed Term Series and carried out merger of the existing schemes viz HSBC Dividend Yield Equity Fund merged into HSBC Multi Cap Equity Fund (HMEF), erstwhile HSBC India Opportunities Fund, as offering sub-scale fund was not in the interest of the unitholders.
Further, in order to bring uniformity in the practice across Mutual Funds and to standardize the scheme categories and characteristics of schemes, SEBI vide its circular no. SEBI/HO/IMD/DF3/CIR/P/2017/114 dated October 06, 2017, issued guidelines for categorization and rationalization of Mutual Fund schemes.
Accordingly, HSBC Large Cap Equity Fund (erstwhile HSBC Equity Fund), HSBC Small Cap Equity Fund (erstwhile HSBC Mid Cap Equity Fund) , HSBC Infrastructure Equity Fund, HSBC Global Emerging Market Fund (erstwhile HSBC Emerging Market Fund), HSBC Debt Fund (erstwhile HSBC Income Fund – Investments Plan), HSBC Short Duration Fund (erstwhile HSBC Income Fund – Short Term Plan), HSBC Low Duration Fund (erstwhile HSBC Ultra Short Term Bond Fund), HSBC Regular Savings Fund (erstwhile HSBC Monthly Income Plan) and HSBC Managed Solutions have undergone fundamental attributes changes with effective from March 14, 2018.
The Fund continues its focus on delivering consistent long term returns. The comments on the performance of the Scheme(s) is provided hereinafter. Dividends were declared under various schemes as per the provisions contained in the respective Scheme Information Documents after considering the distributable surplus available under the respective Schemes. Details of dividends declared can be viewed on our website at www.assetmanagement.hsbc.com/in.
1. Scheme Performance, future outlook and oPerationS of the SchemeS
a. Operations and Performance of the Schemes
HSBC Regular Savings Fund (HRSF) (erstwhile HSBC Monthly Income Plan) (An open-ended hybrid Scheme investing predominantly in debt instruments)
HRSF seeks to generate reasonable returns through investments in Debt and Money Market Instruments. The secondary objective of the scheme is to invest in equity and equity related instruments to seek capital appreciation. However, there can be no assurance or guarantee that the investment objective of the scheme would be achieved.
The net assets of HRSF amounted to Rs. 227.08 crores as at March 31, 2018 as compared to Rs. 290.82 crores as at March 31, 2017. Around 74.78% of the net assets were invested in debt and money market instruments, 24.71% of the net assets were invested in equities and 0.51% were in net current assets as at March 31, 2018.
HRSF underperformed the index due to equity under-performance during the period, as well as pressure on yields. Markets went to perfect storm with higher crude prices, low liquidity and pressure on currency, apart from rate hike expectations.
Scheme Name & Benchmarks Absolute Returns
(%)
Compounded Annualized Returns (%)
Date of Inception : 24 February 2004 1 Year 3 Years 5 Years Since Inception
HSBC Regular Savings Fund - Growth 4.06 6.37 9.19 9.26
CRISIL Hybrid 85+15 - Conservative Index 6.54 8.59 9.78 8.21
CRISIL 1 Year T-Bill Index (Standard Benchmark) 5.89 7.00 7.05 5.99
CRISIL 10 Year Gilt Index (Standard Benchmark) -0.25 6.45 6.42 5.37
Rs. 10,000, if invested in HRSF, would have become 10,407 12,039 15,525 34,854
Trustees’ ReportFor the year ended March 31, 2018

5
Scheme Name & Benchmarks Absolute Returns
(%)
Compounded Annualized Returns (%)
Date of Inception : 24 February 2004 1 Year 3 Years 5 Years Since Inception
HSBC Regular Savings Fund - Growth 4.06 6.37 9.19 9.26
Rs. 10,000, if invested in CRISIL Hybrid 85+15 - Conservative Index, would have become
10,656 12,810 15,949 30,417
Rs. 10,000, if invested in CRISIL 1 Year T-Bill Index, would have become
10,591 12,255 14,061 22,709
Rs. 10,000, if invested in CRISIL 10 Year Gilt Index, would have become
9,975 12,067 13,652 20,906
Past performance may or may not be sustained in future. The returns for the respective periods are provided as on last business day of March 2018 for Growth Option. Different plans shall have a different expense structure. Performance of the respective benchmark is calculated as per the Total Return Index (TRI).
b. Market Overview & Outlook (as furnished by HSBC Asset Management (India) Private Limited)
EqUITY OUTLOOKIndian equity markets continued to remain strong during fiscal year 2017-18 and posted gains of 11.76% by S&P CNX Nifty and 13.24% by BSE Midcap index respectively. Biggest drivers of the markets were, robust DII flow into equities, continued push of mega reforms – Goods and Services Tax (GST) implementation, Insolvency and Bankruptcy Code implementation, Real Estate (Regulation and Development) Act, second consecutive normal monsoon, and electoral victories of the ruling party in many state elections. On the other hand, the markets weather the storm of disruption in economy due to GST implementation, lingering impact of demonetization, muted FII flows, and rising yields in developed markets. Domestic Mutual Fund segment had their best ever year and they brought in ~USD 22 bn of net inflows in equities during the year. Even after witnessing ~USD 4.3 bn of net outflows from the domestic insurers, the net DII tally was a very impressive ~USD 17.7 bn of net inflows. There were mixed global cues well and the Foreign Institutional Investors (FIIs) net bought Indian equities worth USD 3.2 bn. The inflows by both FIIs and domestic MFs acted as a factor in the strong market performance.
Indices Returns (April 1, 2017 to March 31, 2018) 1 Year (%)
S&P BSE Sensex 12.70%
NSE CNX Nifty 11.76%
S&P BSE 100 12.12%
S&P BSE 200 12.49%
S&P BSE 500 13.21%
S&P BSE Midcap 14.31%
S&P BSE 250 Small-cap 14.13%
Source: Bloomberg (All values are total return)
Our view on the key aspects related to equity markets are presented below -
The impressive performance in equity markets during FY 2017-18 has come on the back of strong liquidity largely by domestic MFs but supported in party by FII flows, positive global growth, benign macro – both domestically and global, expectation of the continuation of favorable policy environment domestically and expectation of corporate earnings revival. Possibility of sound macro, economic reforms and implementation of existing reforms have increased, especially after continued success of the ruling party at the centre in state
Trustees’ ReportFor the year ended March 31, 2018 (Contd...)

6
elections. However, after this strong performance in markets and rather long wait for earnings to be delivered has meant that the equity markets are currently trading above their historical averages.
Moving into FY 2018-19, we expect a continuation of the economic recovery process domestically, recovery in corporate earnings - led early by volume growth, and continued DII flows. Government led investment spending and rural consumption are likely to lead with private sector investments contributing later (possibly after general elections 2019). The budget document that was presented in early February provides a good medium term policy direction for the economy. Occasionally the policy actions can serve up a few bumps and jolts but over the medium term, across different governments, there is a thread of continuity connecting many key economic policies such as in the case of this year’s union budget. We, in our investment process, prefer to take comfort in these threads of continuity and remain constructive on the India growth story. This makes us positive on the Indian equity markets over the medium to long term.
Risks are in the form of market valuations trending above historical averages, weaker than expected delivery in corporate earnings going forward, external news flows related to trade protectionism, developed market central banks raising rates prematurely, and geopolitical tensions and other eco-political events would also influence market performance going forward, as the recent rally in the markets was supported by strong FII inflows.
DEBT OUTLOOKFixed Income in Financial Year 2017-18 has seen volatility further step up in this year. Markets went to perfect storm with higher crude prices, low liquidity and pressure on currency, apart from rate hike expectations.
Inflation has followed the glide path to lower numbers towards 4% RBI target and even lower than the target number when inflation printed a lowly 1.46% in June 2018 on back of lower food prices. RBI went for a cut despite of neutral stance. This positivity continued till until crude shock came in form of higher crude process. Global prices of Brent crude saw substantial increase in second half of the year, which jeopardized the inflation path. Other worries that gathered around this time were related to GST collection and eventual impact on fiscal situation.
Government of India allowed the fiscal deficit to slip to 3.5% (budget 3.2%) and kept next year target at 3.3% (in place of earlier path of 3%). This was on back of some excise relaxation for oil products and a month less collected for GST due to implementation in the current year. The fear of fiscal slippage alongwith the announcement of higher bond issuances spooked the bond markets into higher yields. Government finally borrowed only INR 90 bln extra (in place of INR 500 bln announced initially).
On the Monetary front the year was very volatile as well. RBI changed its stance to neutral causing some worry around rate hikes. Thereafter it cut rates and again went for OMO sales operations simultaneously. This created some confusion in the market participants regarding rates direction. Finally extra supply, higher oil prices and higher inflation paved way for rates higher. RBI also held position on regulatory forbearance about spreading out losses by banks publicly. It eventually gave up the position in the end of March. However, the swift changes in stance caused lot of pressure and volatility in bonds.
Liquidity situation continuously deteriorated due to OMO sales initially and withdrawal of deposits due to remonetisation. Further liquidity was absorbed out due to portfolio outflows and reduction in reserves. Despite of defense from RBI utilizing the reserves, the currency depreciated meaningfully, which caused further jitters in foreign investor sentiments. Lack of liquidity also affected 1-3 year rates which were elevated in second half of the year.
Going forward following are key variables to watch out for:• Liquidity: Liquidity will drive short end rates and eventually drive decisions leading to market interventions
and CRR cuts. RBI has focused now on neutral liquidity stance and providing liquidity to system, which will bode well short end rates.
• Inflation: Inflation numbers will determine future course of action for RBI and remains a critical variable for policy. We expect inflation to remain at 4.7% level in the ease in second half of FY 2018-19 in line with RBI’s expectations.
• Growth: GDP growth numbers as well as industrial activity will also determine the decision on policy.
• Fiscal deficit: Fiscal deficit and government spending will determine the government borrowing and crowding out in interest rate curve. We expect prudence in government spending and prospect of spending on infrastructure to pick up which will crowd in private investment as well.
Trustees’ ReportFor the year ended March 31, 2018 (Contd...)

7
• Current Account Deficit: Current Account Deficit determines how the pressure on currency works and effective management of forex reserves.
• Currency levels: Level of INR will determine how the central bank reacts to the situation on the global crisis etc.
2. Brief Background of SPonSorS, Board of truSteeS and aSSet management comPany
a. Sponsor
HSBC Mutual Fund is sponsored by HSBC Securities and Capital Markets (India) Private Limited (HSCI). The Sponsor is the Settler of the Mutual Fund Trust. The Sponsor has entrusted a sum of Rs. 1,00,000 (Rupees One Lakh only) to the Trustee as the initial contribution towards the corpus of the Mutual Fund.
HSCI offers integrated investment banking services, securities and corporate finance & advisory. HSCI is a member of the Bombay Stock Exchange Limited and National Stock Exchange (capital and derivative market segments). HSCI holds 100% of the paid up equity share capital of HSBC Asset Management (India) Private Limited.
b. HSBC Mutual Fund
HSBC Mutual Fund (“the Mutual Fund” or “the Fund”) has been constituted as a Trust in accordance with the provisions of the Indian Trusts Act, 1882 (2 of 1882) vide a Trust Deed dated February 7, 2002 with HSBC Securities and Capital Markets (India) Private Limited, as the Sponsor and the Board of Individual Trustees. The Trustee has entered into an Investment Management Agreement dated February 7, 2002 with HSBC Asset Management (India) Private Limited (AMC) to function as the Investment Manager for all the schemes of the Fund. The Fund was registered with SEBI vide registration number MF/046/02/5 dated May 27, 2002.
The Trust has been formed for the purpose of pooling of capital from the public for collective investment in securities for the purpose of providing facilities for participation by persons as beneficiaries in such investments and in the profits/income arising therefrom.
c. Board of Trustees (the Trustees)
The Board of Trustees is the exclusive owner of the Trust Fund and holds the same in trust for the benefit of the unit holders. The Trustees have been discharging their duties and carrying out the responsibilities as provided in the SEBI (Mutual Funds) Regulations, 1996 and the Trust Deed. The Trustees seek to ensure that the Fund and the schemes floated there under are managed by the AMC in accordance with the Trust Deed, the said Regulations, directions and guidelines issued by the SEBI, the Stock Exchanges, the Association of Mutual Funds in India and other regulatory agencies.
d. Asset Management Company (the AMC)
HSBC Asset Management (India) Private Limited (the Investment Manager or the AMC) is a private limited company incorporated under the Companies Act, 1956 on December 12, 2001 having its Registered Office at 16, V. N. Road, Fort, Mumbai 400 001. HSBC Asset Management (India) Private Limited has been appointed as the Asset Management Company of HSBC Mutual Fund by the Trustee vide Investment Management Agreement (IMA) dated February 7, 2002 and executed between the Trustees and the AMC. SEBI approved the AMC to act as the Investment Manager of the Fund vide its letter No. MFD/BC/163/2002 dated May 27, 2002. The paid-up equity share capital of the AMC is Rs. 61.59 crores. The AMC is registered as a Portfolio Manager under the SEBI (Portfolio Managers) Regulations, 1993 vide registration no. INP000001322. The AMC also offers non-binding Advisory services to offshore funds under the mutual fund license.
HSBC Securities and Capital Markets (India) Private Limited holds 100% of the paid up equity share capital of the AMC.
3. inveStment oBjective of the SchemeS The investment objective of the respective schemes has been provided above under the heading “Scheme
Performance, Future Outlook and Operation of the Scheme” (Refer Section 1).
Trustees’ ReportFor the year ended March 31, 2018 (Contd...)

8
4. Significant accounting PolicieS The Significant Accounting Policies form part of the Notes to the Accounts annexed to the Balance Sheet
of the Schemes in the Full Annual Report. The accounting policies are in accordance with Securities Exchange Board of India (Mutual Funds) Regulations 1996.
5. unclaimed dividendS & redemPtionS Summary of number of investors & corresponding amount Scheme-wise as on March 31, 2018.
SchemeUnclaimed Dividend Unclaimed Redemption
Amount (Rs.) No. of Investors
Amount (Rs.) No. of Investors
HSBC Regular Savings Fund 2,499,791.71 499 930,181.86 26
6. inveStor ServiceSThe number of official points of acceptance of transactions is 205 locations. In addition to the offices of the Registrar & Transfer agents, the AMC has Investor Service Centres in 9 locations at its own offices - namely Mumbai, New Delhi, Kolkata, Bangaluru, Pune, Ahmedabad, Hyderabad, Chandigarh and Chennai. With a view to enhance customer convenience, the AMC has the facility of priority based servicing to key distributors through the enhancement of the Interactive Voice Reponses. The AMC has a single Toll Free number which can be dialed from anywhere in India. The call centre service is being managed by the Registrar and Transfer Agents.
On the distribution front, the number of empanelled distributors was 460 as on March 31, 2018. During the year, the AMC initiated tie-ups for online distribution of the Mutual Fund’s schemes with several channel partners taking the total number of such tie-ups to 42.
7. detailS of inveStor grievance redreSSalThe details of the redressal of investor complaints received against HSBC Mutual Fund during April 2017 - March 2018 are as follows:
2017-2018
Com- plaint Code
Type of complaint (a) No. of complaints
pending at the
beginning of the year
(b) No. of complaints received during
the year
Action on (a) and (b)
Resolved Non Actiona-
ble*
Pending
Within 30
days
30 - 60 days
60 - 180 days
Beyond 180 days
0 - 3 months
3 - 6 months
6 - 9 months
9 - 12 months
I A Non receipt of Dividend on Units
0 5 4 1 0 0 0 0 0 0 0
I B Interest on delayed payment of Dividend
0 0 0 0 0 0 0 0 0 0 0
I C Non receipt ofRedemption Proceeds
1 12 12 1 0 0 0 1 0 0 0
I D Interest on delayedp a y m e n t o f Redemption
0 1 1 0 0 0 0 0 0 0 0
II A Non receipt of Statement of Account / Unit Certificate
0 0 0 0 0 0 0 0 0 0 0
II B D i s c r e p a n c y i n Statement of Account
0 0 0 0 0 0 0 0 0 0 0
Trustees’ ReportFor the year ended March 31, 2018 (Contd...)

9
2017-2018
Com- plaint Code
Type of complaint (a) No. of complaints
pending at the
beginning of the year
(b) No. of complaints received during
the year
Action on (a) and (b)
Resolved Non Actiona-
ble*
Pending
Within 30
days
30 - 60 days
60 - 180 days
Beyond 180 days
0 - 3 months
3 - 6 months
6 - 9 months
9 - 12 months
II C Data corrections in Investor details **
0 34 34 0 0 0 0 0 0 0 0
II D Non receipt of Annual Report /Abridged Summary
0 0 0 0 0 0 0 0 0 0 0
III A Wrong switch between Schemes
0 0 0 0 0 0 0 0 0 0 0
III B Unauthorized switch between Schemes
0 0 0 0 0 0 0 0 0 0 0
III C Deviation from Scheme attributes
0 0 0 0 0 0 0 0 0 0 0
III D Wrong or excess charges / load
0 0 0 0 0 0 0 0 0 0 0
III E Non updat ion of changes viz. address, PAN, bank details, nomination, etc
0 6 6 0 0 0 0 0 0 0 0
IV Others 1 41 42 0 0 0 0 0 0 0 0
Total 2 99 99 2 0 0 0 0 0 0 0
Summary of Complaints for FY 2017-18
Particulars Count
Total complaints received 99
Total number of folios 140099
% of complaints against the folio 0.071%
# active folios** As per AMFI Best Practice Guidelines Circular No.25/2011-12 for Revisions in the Guidelines on
Standardization of Complaints/Grievances Reporting Procedure. If “Others” include a type of complaint which is more than 10% of overall complaints, then such a reason should be provided separately. Hence data corrections in Investor Details is included as a separate category
* Non actionable means the complaint is incomplete / outside the scope of the mutual fund
8. inveStor education initiativeS The Fund undertook various investor education and awareness initiatives related to investments in mutual funds throughout India in English / Hindi and Regional languages via mass media. The Fund conducted 16 roadshows at various locations in India to promote various Investor Awareness related topics including Asset Allocation, SIPs, Equity Mutual Funds and Financial Planning. The Fund has a Year-long tie-up with Mutual Fund Insights Magazine that includes 3 pages of content and advertorial publication in their monthly issue. Each issue contains a story promoting SIPs to achieve one’s various investment goals. In the month of December 2017 and January 2018 investor awareness promotion was done through Outlook and Outlook Money magazines through advertorials on various Mutual Fund topics.
Trustees’ ReportFor the year ended March 31, 2018 (Contd...)

10
9. Statutory detailSa) The Sponsors are not responsible or liable for any loss resulting from the operation of the Schemes of
the Fund beyond initial contribution of Rs. 1 lakh for setting up the Fund.
b) The price and redemption value of the units, and income from them, can go up as well as down with fluctuations in the market value of its underlying investments.
c) Full Annual Report shall be disclosed on the website at www.assetmanagement.hsbc.com/in and shall be available for inspection at the Head Office of the Mutual Fund. Present and prospective unit holders can obtain copy of the Trust Deed, the full Annual Report of the Scheme(s), the Annual Report of HSBC Asset Management (India) Private Limited and the text of the relevant Scheme(s) at a price.
10. acknowledgementSThe Trustees wish to thank the Unit holders of the Schemes for their support throughout the year and also thank the Government of India, the Securities and Exchange Board of India (SEBI), the Reserve Bank of India (RBI) and the Association of Mutual Funds in India (AMFI) for the guidance provided by them. The Trustees also appreciate the services provided by the Registrar and Transfer Agent, Fund Accountant, Custodian, Bankers, Distributors and Brokers. The guidance and services provided by the Auditors and advocates and the ebullience, sincerity and dedication of the employees of HSBC Asset Management (India) Private Limited is also appreciated.
The Trustees look forward to the continued support of everyone.
For and on behalf of the Board of Trustees of HSBC Mutual Fund
Sd/-
Dilip Thakkar
Trustee
Mumbai
July 17, 2018.
Trustees’ ReportFor the year ended March 31, 2018 (Contd...)

11
Independent Auditors’ Report
To the Board of Trustees
HSBC Mutual Fund – HSBC Regular Savings Fund (Formerly known as HSBC Monthly Income Plan)
Report on the Financial StatementsWe have audited the accompanying Financial Statements of HSBC Regular Savings Fund (formerly known as HSBC Monthly Income Plan) (the ‘Scheme’), which comprise the balance sheet as at 31 March 2018 and the related revenue account for the year then ended, and a summary of significant accounting policies and other explanatory information, annexed thereto.
Management’s responsibility for the Financial StatementsThe Board of Trustees to the HSBC Mutual Fund (the ‘Board of Trustees’) and HSBC Asset Management (India) Private Limited (the ‘AMC’), being the investment manager to HSBC Mutual Fund (the ‘Fund’) (collectively referred as ‘Management’), are responsible for the preparation of these financial statements that give a true and fair view of the financial position and financial performance of the Scheme in accordance with the accounting policies and standards specified in the Ninth Schedule of the Securities and Exchange Board of India (Mutual Funds) Regulations, 1996, as amended (the ‘Regulations’) and the accounting principles generally accepted in India. This responsibility includes maintenance of adequate accounting records for safeguarding of the assets of the Scheme and for preventing and detecting frauds and other irregularities; selection and application of appropriate accounting policies; making judgments and estimates that are reasonable and prudent; and design, implementation and maintenance of adequate internal financial controls, that were operating effectively for ensuring the accuracy and completeness of the accounting records, relevant to the preparation and presentation of the financial statements that give a true and fair view and are free from material misstatement, whether due to fraud or error.
In preparing the financial statements, management is responsible for assessing the Scheme’s ability to continue as a going concern, disclosing, as applicable, matters related to going concern and using the going concern basis of accounting unless management either intends to liquidate the Fund or to cease operations, or has no realistic alternative but to do so.
Auditor’s responsibilityOur responsibility is to express an opinion on these financial statements based on our audit. We conducted our audit in accordance with the Standards on Auditing issued by the Institute of Chartered Accountants of India (the ‘ICAI’). Those Standards require that we comply with ethical requirements and plan and perform the audit to obtain reasonable assurance about whether the financial statements are free from material misstatement.
An audit involves performing procedures to obtain audit evidence about the amounts and disclosures in the financial statements. The procedures selected depend on the auditor’s judgment, including the assessment of the risks of material misstatement of the financial statements, whether due to fraud or error. In making those risk assessments, the auditor considers internal controls relevant to preparation and fair presentation of the financial statements, of the Scheme, in order to design audit procedures that are appropriate in the circumstances, but not for the purpose of expressing an opinion on the effectiveness of the Scheme’s internal controls. An audit also includes evaluating the appropriateness of accounting policies used and the reasonableness of the accounting estimates made by Management, as well as evaluating the overall presentation of the financial statements.
We are also responsible to conclude on the appropriateness of management’s use of the going concern basis of accounting and, based on the audit evidence obtained, whether a material uncertainty exists related to events or conditions that may cast significant doubt on the Scheme’s ability to continue as a going concern. If we conclude that a material uncertainty exists, we are required to draw attention in the auditor’s report to the related disclosures in the financial statements or, if such disclosures are inadequate, to modify the opinion. Our conclusions are based on the audit evidence obtained up to the date of the auditor’s report. However, future events or conditions may cause the Scheme to cease to continue as a going concern.

12
We believe that the audit evidence we have obtained is sufficient and appropriate to provide a basis for our audit opinion.
OpinionIn our opinion, and to the best of our information and according to the explanations given to us, the aforesaid financial statements give the information required by the Regulations in the manner so required and give a true and fair view in conformity with the accounting principles generally accepted in India:
(i) in the case of the balance sheet, of the state of affairs of the Scheme as at 31 March 2018; and
(ii) in the case of the revenue account, of the net surplus for the year ended on that date.
Report on other Legal and Regulatory Requirements1 As required by Regulation 55(4) to the Regulations, we report that:
(a) We have obtained all information and explanations which, to the best of our knowledge and belief, were necessary for the purposes of the audit;
(b) The balance sheet and revenue account have been prepared in accordance with the accounting policies and standards specified in the Ninth Schedule of the Regulations.
2 As required by Clause 5(ii)(2) of the Eleventh Schedule of the Regulations, we report that the balance sheet and revenue account are in agreement with the books of account of the Scheme.
3 In our opinion and on the basis of information and explanations given to us, the methods used to value non - traded securities, as at 31 March 2018, as determined by the Board of Directors of AMC, are in accordance with the Regulations and other guidelines issued by the Securities and Exchange Board of India as applicable and approved by the Board of Trustees are fair and reasonable.
For B S R & Co. LLP Chartered Accountants Firm’s Registration No: 101248W/W-100022
Sd/-
Milind Ranade Partner Membership No: 100564
Place : Mumbai Date : 17 July 2018.
Independent Auditors’ Report (Contd...)

13
Abridged Balance Sheet as at March 31, 2018
Rs. in Lakhs
HSBC REGULAR SAVINGS FUNDAs at
March 31, 2018As at
March 31, 2017
LIABILITIES1 Unit Capital 11,714.22 14,259.772 Reserves & Surplus2.1 Unit Premium Reserves 980.04 1,560.892.2 Unrealised Appreciation Reserve 1,218.94 1,320.482.3 Other Reserves 8,794.96 11,954.223 Loans & Borrowings – –4 Current Liabilities & Provisions4.1 Provision for doubtful Income/Deposits – –4.2 Other Current Liabilities & Provisions 304.27 188.05
TOTAL 23,012.43 29,283.41
ASSETS1 Investments1.1 Listed Securities:1.1.1 Equity Shares 5,615.60 6,898.661.1.2 Preference Shares – –1.1.3 Equity Linked Debentures – –1.1.4 Other Debentures & Bonds 7,379.95 8,740.901.1.5 Securitised Debt securities – –1.2 Securities Awaited Listing:1.2.1 Equity Shares – –1.2.2 Preference Shares – –1.2.3 Equity Linked Debentures – –1.2.4 Other Debentures & Bonds – –1.2.5 Securitised Debt securities – –1.3 Unlisted Securities1.3.1 Equity Shares – –1.3.2 Preference Shares – –1.3.3 Equity Linked Debentures – –1.3.4 Other Debentures & Bonds 847.55 501.701.3.5 Securitised Debt securities – –1.4 Government Securities 7,526.08 11,455.681.5 Treasury Bills – –1.6 Commercial Paper – –1.7 Certificate of Deposits 753.26 –1.8 Bill Rediscounting – –1.9 Units of Domestic Mutual Fund – –1.10 Foreign Securities – –
Total Investments 22,122.44 27,596.94
2 Deposits 21.35 12.593 Other Current Assets3.1 Cash & Bank Balance 2.02 47.663.2 CBLO/Reverse Repo Lending 480.29 679.163.3 Others 386.33 947.064 Deferred Revenue Expenditure (to the extent not written off) – –
TOTAL 23,012.43 29,283.41
Notes to Accounts - Annexure I
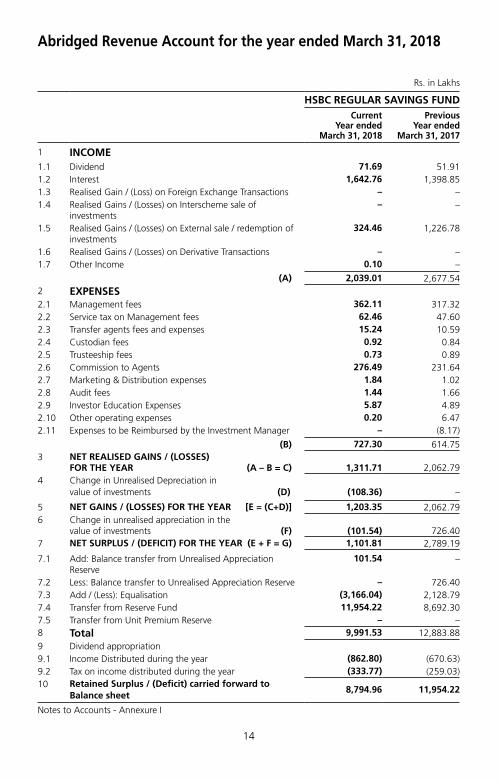
14
Rs. in Lakhs
HSBC REGULAR SAVINGS FUNDCurrent
Year ended March 31, 2018
Previous Year ended
March 31, 2017
1 INCOME1.1 Dividend 71.69 51.911.2 Interest 1,642.76 1,398.851.3 Realised Gain / (Loss) on Foreign Exchange Transactions – –1.4 Realised Gains / (Losses) on Interscheme sale of
investments– –
1.5 Realised Gains / (Losses) on External sale / redemption of investments
324.46 1,226.78
1.6 Realised Gains / (Losses) on Derivative Transactions – –1.7 Other Income 0.10 –
(A) 2,039.01 2,677.542 EXPENSES2.1 Management fees 362.11 317.322.2 Service tax on Management fees 62.46 47.602.3 Transfer agents fees and expenses 15.24 10.592.4 Custodian fees 0.92 0.842.5 Trusteeship fees 0.73 0.892.6 Commission to Agents 276.49 231.642.7 Marketing & Distribution expenses 1.84 1.022.8 Audit fees 1.44 1.662.9 Investor Education Expenses 5.87 4.892.10 Other operating expenses 0.20 6.472.11 Expenses to be Reimbursed by the Investment Manager – (8.17)
(B) 727.30 614.753 NET REALISED GAINS / (LOSSES)
FOR THE YEAR (A – B = C) 1,311.71 2,062.794 Change in Unrealised Depreciation in
value of investments (D) (108.36) –
5 NET GAINS / (LOSSES) FOR THE YEAR [E = (C+D)] 1,203.35 2,062.796 Change in unrealised appreciation in the
value of investments (F) (101.54) 726.407 NET SURPLUS / (DEFICIT) FOR THE YEAR (E + F = G) 1,101.81 2,789.19
7.1 Add: Balance transfer from Unrealised Appreciation Reserve
101.54 –
7.2 Less: Balance transfer to Unrealised Appreciation Reserve – 726.407.3 Add / (Less): Equalisation (3,166.04) 2,128.797.4 Transfer from Reserve Fund 11,954.22 8,692.307.5 Transfer from Unit Premium Reserve – –8 Total 9,991.53 12,883.88
9 Dividend appropriation9.1 Income Distributed during the year (862.80) (670.63)9.2 Tax on income distributed during the year (333.77) (259.03)10 Retained Surplus / (Deficit) carried forward to
Balance sheet8,794.96 11,954.22
Notes to Accounts - Annexure I
Abridged Revenue Account for the year ended March 31, 2018

15
Key Statistics for the year ended March 31, 2018
HSBC REGULAR SAVINGS FUNDCurrent
Year ended March 31, 2018
Previous Year ended
March 31, 2017
1. NAV per unit (Rs.):
Open
Growth Option 33.6465 29.7774
Monthly Dividend Option 13.4002 12.9427
Quarterly Dividend Option 13.3254 12.8672
Direct Plan - Growth Option 34.4244 30.3022
Direct Plan - Monthly Dividend Option 15.9969 14.0813
Direct Plan - Quarterly Dividend Option 14.1874 13.5589
High
Growth Option 35.7294 33.6465
Monthly Dividend Option 13.6918 13.6821
Quarterly Dividend Option 13.8190 13.7529
Direct Plan - Growth Option 36.7079 34.4244
Direct Plan - Monthly Dividend Option 16.6676 15.9969
Direct Plan - Quarterly Dividend Option 14.7294 14.5463
Low
Growth Option 33.5088 29.6570
Monthly Dividend Option 12.6137 12.8904
Quarterly Dividend Option 12.6527 12.8152
Direct Plan - Growth Option 34.2870 30.1817
Direct Plan - Monthly Dividend Option 15.7459 14.0253
Direct Plan - Quarterly Dividend Option 13.6191 13.5050
End
Growth Option 34.8488 33.6465
Monthly Dividend Option 12.6799 13.4002
Quarterly Dividend Option 12.6555 13.3254
Direct Plan - Growth Option 35.8400 34.4244
Direct Plan - Monthly Dividend Option 15.8556 15.9969
Direct Plan - Quarterly Dividend Option 13.6223 14.1874
2. Closing Assets Under Management (Rs. in Lakhs)
End 22,708 29,082
Average (AAuM)1 29,331 24,456
3. Gross income as % of AAuM2 6.95% 10.95%
4. Expense Ratio:
a. Total Expense as % of AAuM (including Service Tax / GST on Management fees) (planwise)
Growth Option 2.51% 2.52%
Direct Plan - Growth Option 1.96% 1.98%

16
Key Statistics for the year ended March 31, 2018 (Contd...)
HSBC REGULAR SAVINGS FUNDCurrent
Year ended March 31, 2018
Previous Year ended
March 31, 2017
b. Management Fee as % of AAuM (planwise)
Growth Option 1.18% 1.30%
Direct Plan - Growth Option 1.18% 1.30%
5. Net Income as a percentage of AAuM3 4.47% 8.43%
6. Portfolio turnover ratio4 – –
7. Total Dividend per unit distributed during the year (planwise)
Retail
Monthly Dividend Option 0.8667 0.8414
Quarterly Dividend Option 0.8306 0.8379
Direct Plan - Monthly Dividend Option 0.5778 –
Direct Plan - Quarterly Dividend Option 0.8306 0.8379
Corporate
Monthly Dividend Option 0.8030 0.7796
Quarterly Dividend Option 0.7695 0.7762
Direct Plan - Monthly Dividend Option 0.5353 –
Direct Plan - Quarterly Dividend Option 0.7695 0.7762
8. Returns(%):
a. Last One Year
Scheme
Growth Option 4.0636 12.9934
Direct Plan - Growth Option 4.6076 13.6036
Benchmark
CRISIL Hybrid 85+15 - Conservative Index 6.5400 12.2956
b. Since Inception
Scheme
Growth Option 9.2572 9.6992
Direct Plan - Growth Option 9.1486 10.3648
Benchmark
CRISIL Hybrid 85+15 - Conservative Index 8.2100 8.0827
1. AAuM=Average daily net assets
2. Gross income = amount against (A) in the Revenue account i.e. Income
3. Net income = amount against (C) in the Revenue account i.e. Net Realised Gains / (Losses) for the year
4 Portfolio Turnover = Lower of sales or purchase divided by the Average AuM for the year
5 The net asset value disclosed represents the computed NAV on March 31, 2018 (Non-business Day), and not the last declared NAV

17
Notes to Accounts – Annexure ITo the Abridged Balance Sheet and Revenue Account for the year ended March 31, 2018
hSBc regular Savings fund
1 Investments:
1.1. It is confirmed that investments of the Scheme are registered in the name of the Trustees for the benefit of the Scheme’s unitholders.
1.2. Open Positions of derivatives as of year ended March 31, 2018 is NIL. Open Positions of derivatives as of year ended March 31, 2017 is NIL.
1.3. Investments in Associates and Group Companies as of years ended March 31, 2018 and March 31, 2017:
(Rupees)
Issuer Instrument Type
Amount Aggregate Investments
by all schemes
Amount Aggregate Investments by
all schemes
March 31 ,2018 March 31 ,2017
Shriram Transport Finance Company Ltd.
Corporate Bonds / Debentures
5,000,000 651,317,500 50,270,700 1,452,436,300
Equities – – – 94,659,583
Bharti Airtel Ltd. Equities 14,767,464 369,136,950 – 1,025,985
Balrampur Chini Mills Ltd.
Equities 12,512,760 125,227,938 – –
1.4. Open position of Securities Borrowed and / or Lent by the Scheme as of financial years ended March 31, 2018 and March 31, 2017 are NIL.
1.5. NPAs as on March 31, 2018 and March 31, 2017 are NIL.
1.6. Aggregate Unrealised Gain / Loss as at the end of the financial years 2018 and 2017 and their percentage to net assets are as under :
Security Category MARCH 31, 2018 MARCH 31, 2017
Amount (Rs.)
Percentage to Net Assets (%)
Amount (Rs.)
Percentage to Net Assets (%)
Equity Shares
– Appreciation 149,685,424 6.59 165,536,178 5.69
– Depreciation 27,853,527 1.23 40,313,592 1.39
Non Convertible Debentures and Bonds Listed / Awaiting Listing
– Appreciation 3,661,124 0.16 7,847,368 0.27
– Depreciation 3,889,718 0.17 2,197,380 0.08
Government Securities
– Appreciation 1,689,894.37 0.07 4,791,784 0.16
– Depreciation 12,296,951.55 0.54 3,616,778.14 0.12
Commercial Paper / Certificate of Deposit
– Appreciation 62,052.00 ~0.00 – –
– Depreciation – – – –
~ Indicates less than 0.01

18
1.7. The aggregate value of investment securities (excluding CBLO and Reverse Repos) purchased and sold (including matured) during the financial year 2017-18 (excluding accretion of discount) are Rs. 7,958,485,448 and Rs. 8,517,624,155 being 271.34% and 290.40% of the average daily net assets.
The aggregate value of investment securities (excluding CBLO and Reverse Repos) purchased and sold (including matured) during the financial year 2016-17 (excluding accretion of discount) are Rs. 4,635,146,230 and Rs. 4,917,390,745 being 189.53% and 201.07% of the average daily net assets.
1.8. Non-Traded securities in the portfolio: Aggregate Value of Equity, Debt & Money Market Instruments and percentage to net assets is as under :
Security Category Amount (Rs.)
Percentage to Net Assets (%)
Amount (Rs.)
Percentage to Net Assets (%)
2018 2017
Equities – – – –
Debt Instruments 822,749,222 28.05% 753,503,467 25.91%
Money Market Instruments 75,325,840 2.57% – –
Total 898,075,062 30.62% 753,503,467 25.91%
2 Disclosure Under Regulation 25(8) of the Securities and Exchange Board of India (Mutual Funds) Regulations, 1996 as amended
Details of amounts paid to associates in terms of Regulation 25 (8) are as follows :
Commission paid to Sponsor/AMC and its associates/related parties/group companies
Name of Sponsor/AMC and its associates/related parties/group companies
Nature of Association / Nature of
Relation
Period Covered
Business Given [Rs. In Crores]
% of Total Business
received by the Fund
Commission paid [Rupees]
% of Total commission paid by the
Fund
The Hongkong and Shanghai Banking Corporation Limited
Associate of Investment Manager
2017-2018 57.61 45.95 9,616,273 36.94
Name of Sponsor/AMC and its associates/related parties/group companies
Nature of Association / Nature of
Relation
Period Covered
Business Given [Rs. In Crores]
% of Total Business
received by the Fund
Commission paid [Rupees]
% of Total commission paid by the
Fund
The Hongkong and Shanghai Banking Corporation Limited
Associate of Investment Manager
2016-2017 88.04 43.24 6,549,074 31.81
Brokerage paid to Sponsor/AMC and its associates/related parties/group companies
Name of Sponsor/AMC and its associates/related parties/group companies
Nature of Association /Nature of
relation
Period Covered
Value of Transactions
[Rs. In Crores]
% of total value of
transaction of the fund
Brokerage paid [Rs.]
% of total brokerage
paid by the fund
HSBC Securities and Capital Market (India) Private Limited
Sponsor 2017-2018 3.01 4.60 36,111 4.74
Notes to Accounts – Annexure I (Contd...)To the Abridged Balance Sheet and Revenue Account for the year ended March 31, 2018

19
Name of Sponsor/AMC and its associates/related parties/group companies
Nature of Association /Nature of
relation
Period Covered
Value of Transactions
[Rs. In Crores]
% of total value of
transaction of the fund
Brokerage paid [Rs.]
% of total brokerage
paid by the fund
HSBC Securities and Capital Market (India) Private Limited
Sponsor 2016-2017 – – – –
The brokerage paid was at rates similar to those offered to other brokers / distributors. The Commission/Brokerage paid to related party includes both upfront and trail and hence not comparable with the % of business brought and % of commission paid.
Further, The Hongkong and Shanghai Banking Corporation Limited, an associate of the Sponsor, is on the panel of bankers with whom HSBC Mutual Fund places money on fixed deposits and enters into reverse repo transactions from time to time at competitive rates.
(i) Any underwriting obligations undertaken by the schemes of the mutual funds with respect to issue of securities associate companies - Nil. (Previous year also Nil)
(ii) Devolvement - Nil. (Previous year also Nil)
(iii) Subscription by the schemes in the issues lead managed by associate companies - Nil. (Previous year also Nil)
(iv) Subscription to any issue of equity or debt on private placement basis where the sponsor or its associate companies have acted as arranger or manager - Nil. (Previous year also Nil)
3 None of the Investors held more than 25% of the total net assets of the Scheme at the years ended March 31, 2018 and March 31, 2017.
4 Unit Capital movement during the years ended March 31, 2018 and March 31, 2017:
Description Opening Units Subscription Redemption Closing Units Face Value per unit (Rs.)
2017–2018
Growth Option 48,862,051.360 13,117,077.021 27,072,501.910 34,906,626.471 10
Monthly Dividend Option
70,608,370.164 54,655,986.155 63,459,010.495 61,805,345.824 10
Quarterly Dividend Option
22,513,690.115 3,573,312.000 6,281,125.704 19,805,876.411 10
Direct Plan - Growth Option
517,567.150 59,247.441 68,776.891 508,037.700 10
Direct Plan - Monthy Dividend Option
85,160.336 63,860.333 44,627.759 104,392.910 10
Direct Plan - Quarterly Dividend Option
10,897.265 1,053.176 – 11,950.441 10
Notes to Accounts – Annexure I (Contd...)To the Abridged Balance Sheet and Revenue Account for the year ended March 31, 2018

20
Description Opening Units Subscription Redemption Closing Units Face Value per unit (Rs.)
2016–2017
Growth Option 40,691,714.524 33,559,634.111 25,389,297.275 48,862,051.360 10
Monthly Dividend Option
52,399,045.765 57,771,010.165 39,561,685.766 70,608,370.164 10
Quarterly Dividend Option
18,925,865.373 9,776,699.579 6,188,874.837 22,513,690.115 10
Direct Plan - Growth Option
386,315.422 233,932.920 102,681.192 517,567.150 10
Direct Plan - Monthy Dividend Option
62,168.782 51,861.554 28,870.000 85,160.336 10
Direct Plan - Quarterly Dividend Option
11,885.441 693.583 1,681.759 10,897.265 10
** Units held by the AMC (Seed Capital) in Direct Plan Growth Option as on March 31, 2018 is 339,032.989 and as on March 31, 2017 is 339,032.989
5 Prior year amounts have been re-grouped / re-arranged where necessary.
6 No contingent liabilities for Regular Plan and Savings Plan for the years ended March 31, 2018 and March 31, 2017.
7 Expenses other than Management Fees are Inclusive of GST / Service Tax where applicable.
8 Other income Rs. 10,305/- (2017: Nil represents reversal of excess brokerage charged on trades.)
9 Investor Education Awareness In view of the AMFI Best Practices Guidelines Circular No. 56/2015-16, the IEF (Investor Education Fund)
accrual is set aside in a separate bank account and the consolidated balance across all schemes as on March 31, 2018. The break-up of which is as under:
March 31, 2018 March 31, 2017
Particulars Amount (in Rs. Lacs) Amount (in Rs. Lacs)
Opening Balance 44.00 –
Add: Accrual during the year 219.83 182
Less: Transferred to AMFI 101.10 83
Less: Payable to AMFI (March accrual) 8.81 8
Add: Investment Income for the year 8.28 11
Less: Spent during the year 43.17 58
Closing Balance 119.02 44
10 Categorization and Rationalization of Schemes
Pursuant to SEBI circular no. SEBI/HO/IMD/DF3/CIR/P/2017/114 dated October 6, 2017 and SEBI circular no. SEBI/HO/IMD/DF3/CIR/P/2017/126 dated December 4, 2017 on ‘Categorization and Rationalization of schemes’, fundamental attribute related changes were carried out in certain schemes of HSBC Mutual Fund to align the same with the requirements specified in the aforesaid circulars effective from March 14, 2018. The said changes have been approved by the Board of Directors of the HSBC Asset Management
Notes to Accounts – Annexure I (Contd...)To the Abridged Balance Sheet and Revenue Account for the year ended March 31, 2018

21
(India) Pvt. Ltd. (the AMC) and the Board of Trustees (the Trustees). SEBI vide its letter no. IMD/DF3/OW/P/2018/89/1 dated January 2, 2018 has also conveyed it’s no objection to the said changes.
A notice-cum-addendum providing details of changes in the fundamental attributes of certain schemes was published in the newspaper on February 3, 2018 and is also available on the website of the AMC at www.assetmanagement.hsbc.com/in. The exit window period of 30 days was provided to the investors during which no exit load was charged to investors on switches/redemptions.
Apart from the fundamental attribute changes, there has been change in the ‘type of Scheme’ for all the open ended schemes and ‘name of Scheme’ in certain schemes for the purposes of alignment of the existing schemes with the provisions of the Circular. The details of the schemes impacted is provided below:
Existing Name Revised Name Fundamental Attribute change
Benchmark Change
HSBC Monthly Income Plan
HSBC Regular Savings Fund
Yes CRISIL Hybrid 85+15 - Conservative Index (previous named as MIP
Blended Fund Index)
11 The Annual Accounts of the Schemes prepared in accordance with the accounting policies and standards specified in the Ninth Schedule of The Securities and Exchange Board of India (Mutual Funds) Regulations, 1996 has been approved by the Board of Directors of HSBC Asset Management (India) Private Limited and The Board of Trustees of HSBC Mutual Fund at their meetings held on July 16, 2018 and July 17, 2018 respectively. The audit report attached herewith refers to the said Annual Accounts. The aforesaid abridged accounts are an extract of the Annual Accounts and are prepared in accordance with SEBI Circular No. IMD/Cir8/132968/2008 dated July 24, 2008.
Notes to Accounts – Annexure I (Contd...)To the Abridged Balance Sheet and Revenue Account for the year ended March 31, 2018

22
Voting Policy and Procedures
In view of SEBI guidelines related to “Role of Mutual Funds in Corporate Governance of Public Listed Companies”, AMIN has formulated its “Policy for Proxy Voting in Public Listed Companies”. The said policy and details of actual exercise of proxy votes along with the summary of votes cast and the auditors certification during the Financial Year 2017 – 18 is available on its website – http://www.assetmanagement.hsbc.com/in and in full Annual Report for the Financial Year 2017 – 18.

23
Statutory Details & Disclaimers
All returns have been sourced from Mutual Funds India Explorer software unless otherwise stated. With regard to equity schemes (including the equity component of MIPs), Fund performance is calculated on a total return basis (i.e. it includes dividends re-invested) while the benchmark is calculated on a price return basis (i.e. it does not consider dividends re-invested). This document has been prepared by HSBC Asset Management (India) Private Ltd (HSBC) for information purposes only and should not be construed as an offer or solicitation of an offer for purchase of any of the funds of HSBC Mutual Fund. All information contained in this document (including that sourced from third parties), is obtained from sources HSBC, the third party believes to be reliable but which it has not independently verified and HSBC, the third party makes no guarantee, representation or warranty and accepts no responsibility or liability as to the accuracy or completeness of such information. The information and opinions contained within the document are based upon publicly available information and rates of taxation applicable at the time of publication, which are subject to change from time to time. Expressions of opinion are those of HSBC only and are subject to change without notice. It does not have regard to specific investment objectives, financial situation and the particular needs of any specific person who may receive this document. Investors should seek financial advice regarding the appropriateness of investing in any securities or investment strategies that may have been discussed or recommended in this report and should understand that the views regarding future prospects may or may not be realized. Neither this document nor the units of HSBC Mutual Fund have been registered in any jurisdiction. The distribution of this document in certain jurisdictions may be restricted or totally prohibited and accordingly, persons who come into possession of this document are required to inform themselves about, and to observe, any such restrictions.
Investors should not invest in the Scheme solely based on the information provided in this document and should read the Scheme Information Document and Statement of Additional Information of the Fund for details. This document does not constitute an offering document.
No part of this publication may be reproduced, stored in a retrieval system, or transmitted, on any form or by any means, electronic, mechanical, photocopying, recording, or otherwise, without the prior written permission of HSBC Asset Management (India) Private Ltd.
Mutual Fund investments are subject to market risks, read all scheme related documents carefully.

HSBC Short Duration Fund (erstwhile HSBC Income Fund – Short Term Plan)An open ended short term debt Scheme investing in instruments such that the Macaulay duration of the portfolio is between 1 year to 3 years
Abridged Annual Report 2017 - 2018

1
Dear Investor,
Globally, we are witnessing a very interesting phase. The equity markets delivered a stellar performance in 2017. However, there are worries about the impact of higher rates, global trade wars, an economic growth moderation and higher volatility.
Closer home, India has become the world’s sixth-biggest economy. India has doubled its GDP to USD 2.2 trillion within a decade. The introduction of reform measures, including demonetisation and the Goods and Services Tax (GST), had put pressure on selective parts of the economy in 2017. The impact of these measures is likely to be transitory. India’s economic growth is expected to accelerate from 6.7% in FY18 to 7.4% in the current year as per IMF forecasts.
There has been a shift in the domestic savings pool supporting the market. Domestic investors have been increasing exposure to equities and financial assets moving away from gold and real estate. Mutual funds witnessed sizable inflows on the back of the boost in liquidity within the banking system from demonetisation. The AUM of the mutual fund industry grew by 21.7% in March 2018 compared to March 2017.
With growth, comes responsibility. Last year, the regulator, Securities and Exchange Board of India (SEBI) issued a circular to rationalise and categorise mutual fund schemes in India. We are pleased to state that none of our funds needed to be redesigned. All our schemes have been defined as per the new categorisation. We believe this classification will simplify investing into mutual funds and enhance comparability within the schemes offered.
As India moves to a digital age, e-commerce platforms are becoming increasingly popular. I request you to logon to our online transaction platform. It is a quick, convenient and an efficient tool to invest into our funds and manage your investments online.
At HSBC Global Asset Management, India, we are dedicated to one goal: delivering exceptional investment management for our clients. By bringing together our

2
global investment knowledge and capabilities, we are able to offer specialised expertise across asset classes. This has helped us to become a trusted partner to our individual and institutional investors.
We remain committed to our long-term perspective and disciplined investment approach as we conduct a rigorous, fundamental analysis of investments with a strong emphasis on risk management. Although the investment landscape appears favourable, it is worth remembering that markets are dynamic and constantly evolving. Therefore, we believe active, professional investment management serves investors well. Amid changing markets and economic conditions, we are confident that investors with a well-diversified portfolio and a patient, long-term outlook should be well positioned for the years ahead.
Together we thrive.
Warm regards,
Ravi Menon
Chief Executive Officer, HSBC Global Asset Management, India
3
SPONSORHSBC Securities and Capital Markets (India) Private LimitedRegd. Office: 52/60, Mahatma Gandhi Road, Fort, Mumbai - 400 001.
TRUSTEEBoard of TrusteesOffice: 16, Veer Nariman Road, Fort, Mumbai 400 001.
ASSET MANAGEMENT COMPANYHSBC Asset Management (India) Private LimitedCorp. & Regd. Office: 16, Veer Nariman Road, Fort, Mumbai 400 001.
CUSTODIANStandard Chartered Bank (SCB)Corp. & Regd. Office: Crescenzo, Securities Services, 3rd Floor, C-38/39, G-Block, Bandra Kurla Complex, Bandra East, Mumbai – 400051.
AUDITORS TO THE SCHEMEBSR & Co. LLPChartered Accountants 5th Floor, Lodha Excelus, Apollo Mills Compound, N.M. Joshi Marg, Mahalaxmi, Mumbai 400 011.
REGISTRAR & TRANSFER AGENTSComputer Age Management Services Private Limited (CAMS)Unit: HSBC Mutual Fund ’C’ Block, 2nd Floor, Hanudev Info Park P. Ltd., SF No. 558/2, Udayampalayam Road, Nava India, Coimbatore - 641 028.
BOARD OF TRUSTEESMr. Nasser Munjee
Mr. Manu Tandon
Mr. Mehli Mistri
Mr. Dilip J. Thakkar
Ms. Jasmine Batliwalla
Mr. Pedro Bastos
BOARD OF DIRECTORSMs. Kishori J. Udeshi - Chairperson
Mr. S. P. Mustafa
Mr. Dinesh Mittal
Mr. Ravi Menon - Chief Executive Officer

4
The Trustees of HSBC Mutual Fund (“Fund”) present the Sixteenth Annual Report and the audited abridged financial statements of the schemes of the Fund for the year ended March 31, 2018.
As at March 31, 2018, the Fund offered 30 schemes across asset classes to meet the varying investment needs of the investors. Notably, three Schemes of HSBC Mutual Fund viz. HSBC Large Cap Equity Fund, HSBC Short Duration Fund and HSBC Cash Fund have completed 15 years of operations during the year.
During the year, the Fund has launched Plan(s) under Fixed Term Series and carried out merger of the existing schemes viz HSBC Dividend Yield Equity Fund merged into HSBC Multi Cap Equity Fund (HMEF), erstwhile HSBC India Opportunities Fund, as offering sub-scale fund was not in the interest of the unitholders.
Further, in order to bring uniformity in the practice across Mutual Funds and to standardize the scheme categories and characteristics of schemes, SEBI vide its circular no. SEBI/HO/IMD/DF3/CIR/P/2017/114 dated October 06, 2017, issued guidelines for categorization and rationalization of Mutual Fund schemes.
Accordingly, HSBC Large Cap Equity Fund (erstwhile HSBC Equity Fund), HSBC Small Cap Equity Fund (erstwhile HSBC Mid Cap Equity Fund) , HSBC Infrastructure Equity Fund, HSBC Global Emerging Market Fund (erstwhile HSBC Emerging Market Fund), HSBC Debt Fund (erstwhile HSBC Income Fund – Investments Plan), HSBC Short Duration Fund (erstwhile HSBC Income Fund – Short Term Plan), HSBC Low Duration Fund (erstwhile HSBC Ultra Short Term Bond Fund), HSBC Regular Savings Fund (erstwhile HSBC Monthly Income Plan) and HSBC Managed Solutions have undergone fundamental attributes changes with effective from March 14, 2018.
The Fund continues its focus on delivering consistent long term returns. The comments on the performance of the Scheme(s) is provided hereinafter. Dividends were declared under various schemes as per the provisions contained in the respective Scheme Information Documents after considering the distributable surplus available under the respective Schemes. Details of dividends declared can be viewed on our website at www.assetmanagement.hsbc.com/in.
1. Scheme Performance, future outlook and oPerationS of the SchemeS
a. Operations and Performance of the Schemes
HSBC Short Duration Fund (HSDF) (erstwhile HSBC Income Fund – Short Term Plan)(an open ended short term debt Scheme investing in instruments such that the Macaulay duration of the portfolio is between 1 year to 3 years)
HSDF seeks to provide reasonable income through a diversified portfolio of fixed income securities such that the Macaulay duration of the portfolio is between 1 year to 3 years. However, there can be no assurance or guarantee that the investment objective of the scheme would be achieved.
The net assets of HSBC Short Duration Fund amounted to Rs. 1,418.65 crores as at March 31, 2018 as compared to Rs. 1,990.87 crores as at March 31, 2017. Around 97.26% of the net assets were invested in debt and money market instruments and 2.74% of the net assets comprised of reverse repos/CBLO and net current assets as at March 31, 2018.
HSDF underperformed its scheme’s benchmark due to very high volatility and expectation that the valuations were reasonable. However, markets went to perfect storm with higher crude prices, low liquidity and pressure on currency, apart from rate hike expectations.
Scheme Name & Benchmarks Absolute Returns
(%)
Compounded Annualized Returns (%)
Date of Inception : 10 December 2002 1 Year 3 Years 5 Years Since Inception
HSBC Short Duration Fund - Growth 5.69 7.15 7.71 7.06
CRISIL Short Term Bond Fund Index (Scheme Benchmark) 6.21 7.97 8.56 7.12
CRISIL 1 Year T-Bill Index (Standard Benchmark) 5.89 7.00 7.05 5.94
Rs. 10,000, if invested in HSDF, would have become 10,571 12,307 14,500 28,412
Trustees’ ReportFor the year ended March 31, 2018

5
Scheme Name & Benchmarks Absolute Returns
(%)
Compounded Annualized Returns (%)
Date of Inception : 10 December 2002 1 Year 3 Years 5 Years Since Inception
Rs. 10,000, if invested in CRISIL Short Term Bond Fund Index, would have become
10,623 12,592 15,082 28,657
Rs. 10,000, if invested in CRISIL 1 Year T-Bill Index, would have become
10,591 12,255 14,061 24,187
Past performance may or may not be sustained in future. The returns for the respective periods are provided as on last business day of March 2018 for Growth Option. Different plans shall have a different expense structure. Performance of the respective benchmark is calculated as per the Total Return Index (TRI).
b. Market Overview & Outlook (as furnished by HSBC Asset Management (India) Private Limited)
EqUITY OUTLOOKIndian equity markets continued to remain strong during fiscal year 2017-18 and posted gains of 11.76% by S&P CNX Nifty and 13.24% by BSE Midcap index respectively. Biggest drivers of the markets were, robust DII flow into equities, continued push of mega reforms – Goods and Services Tax (GST) implementation, Insolvency and Bankruptcy Code implementation, Real Estate (Regulation and Development) Act, second consecutive normal monsoon, and electoral victories of the ruling party in many state elections. On the other hand, the markets weather the storm of disruption in economy due to GST implementation, lingering impact of demonetization, muted FII flows, and rising yields in developed markets. Domestic Mutual Fund segment had their best ever year and they brought in ~USD 22 bn of net inflows in equities during the year. Even after witnessing ~USD 4.3 bn of net outflows from the domestic insurers, the net DII tally was a very impressive ~USD 17.7 bn of net inflows. There were mixed global cues well and the Foreign Institutional Investors (FIIs) net bought Indian equities worth USD 3.2 bn. The inflows by both FIIs and domestic MFs acted as a factor in the strong market performance.
Indices Returns (April 1, 2017 to March 31, 2018) 1 Year (%)
S&P BSE Sensex 12.70%
NSE CNX Nifty 11.76%
S&P BSE 100 12.12%
S&P BSE 200 12.49%
S&P BSE 500 13.21%
S&P BSE Midcap 14.31%
S&P BSE 250 Small-cap 14.13%
Source: Bloomberg (All values are total return)
Our view on the key aspects related to equity markets are presented below -
The impressive performance in equity markets during FY 2017-18 has come on the back of strong liquidity largely by domestic MFs but supported in party by FII flows, positive global growth, benign macro – both domestically and global, expectation of the continuation of favorable policy environment domestically and expectation of corporate earnings revival. Possibility of sound macro, economic reforms and implementation of existing reforms have increased, especially after continued success of the ruling party at the centre in state elections. However, after this strong performance in markets and rather long wait for earnings to be delivered has meant that the equity markets are currently trading above their historical averages.
Trustees’ ReportFor the year ended March 31, 2018 (Contd...)

6
Moving into FY 2018-19, we expect a continuation of the economic recovery process domestically, recovery in corporate earnings - led early by volume growth, and continued DII flows. Government led investment spending and rural consumption are likely to lead with private sector investments contributing later (possibly after general elections 2019). The budget document that was presented in early February provides a good medium term policy direction for the economy. Occasionally the policy actions can serve up a few bumps and jolts but over the medium term, across different governments, there is a thread of continuity connecting many key economic policies such as in the case of this year’s union budget. We, in our investment process, prefer to take comfort in these threads of continuity and remain constructive on the India growth story. This makes us positive on the Indian equity markets over the medium to long term.
Risks are in the form of market valuations trending above historical averages, weaker than expected delivery in corporate earnings going forward, external news flows related to trade protectionism, developed market central banks raising rates prematurely, and geopolitical tensions and other eco-political events would also influence market performance going forward, as the recent rally in the markets was supported by strong FII inflows.
DEBT OUTLOOKFixed Income in Financial Year 2017-18 has seen volatility further step up in this year. Markets went to perfect storm with higher crude prices, low liquidity and pressure on currency, apart from rate hike expectations.
Inflation has followed the glide path to lower numbers towards 4% RBI target and even lower than the target number when inflation printed a lowly 1.46% in June 2018 on back of lower food prices. RBI went for a cut despite of neutral stance. This positivity continued till until crude shock came in form of higher crude process. Global prices of Brent crude saw substantial increase in second half of the year, which jeopardized the inflation path. Other worries that gathered around this time were related to GST collection and eventual impact on fiscal situation.
Government of India allowed the fiscal deficit to slip to 3.5% (budget 3.2%) and kept next year target at 3.3% (in place of earlier path of 3%). This was on back of some excise relaxation for oil products and a month less collected for GST due to implementation in the current year. The fear of fiscal slippage alongwith the announcement of higher bond issuances spooked the bond markets into higher yields. Government finally borrowed only INR 90 bln extra (in place of INR 500 bln announced initially).
On the Monetary front the year was very volatile as well. RBI changed its stance to neutral causing some worry around rate hikes. Thereafter it cut rates and again went for OMO sales operations simultaneously. This created some confusion in the market participants regarding rates direction. Finally extra supply, higher oil prices and higher inflation paved way for rates higher. RBI also held position on regulatory forbearance about spreading out losses by banks publicly. It eventually gave up the position in the end of March. However, the swift changes in stance caused lot of pressure and volatility in bonds.
Liquidity situation continuously deteriorated due to OMO sales initially and withdrawal of deposits due to remonetisation. Further liquidity was absorbed out due to portfolio outflows and reduction in reserves. Despite of defense from RBI utilizing the reserves, the currency depreciated meaningfully, which caused further jitters in foreign investor sentiments. Lack of liquidity also affected 1-3 year rates which were elevated in second half of the year.
Going forward following are key variables to watch out for:• Liquidity: Liquidity will drive short end rates and eventually drive decisions leading to market interventions
and CRR cuts. RBI has focused now on neutral liquidity stance and providing liquidity to system, which will bode well short end rates.
• Inflation: Inflation numbers will determine future course of action for RBI and remains a critical variable for policy. We expect inflation to remain at 4.7% level in the ease in second half of FY 2018-19 in line with RBI’s expectations.
• Growth: GDP growth numbers as well as industrial activity will also determine the decision on policy.
• Fiscal deficit: Fiscal deficit and government spending will determine the government borrowing and crowding out in interest rate curve. We expect prudence in government spending and prospect of spending on infrastructure to pick up which will crowd in private investment as well.
Trustees’ ReportFor the year ended March 31, 2018 (Contd...)

7
• Current Account Deficit: Current Account Deficit determines how the pressure on currency works and effective management of forex reserves.
• Currency levels: Level of INR will determine how the central bank reacts to the situation on the global crisis etc.
2. Brief Background of SPonSorS, Board of truSteeS and aSSet management comPany
a. Sponsor
HSBC Mutual Fund is sponsored by HSBC Securities and Capital Markets (India) Private Limited (HSCI). The Sponsor is the Settler of the Mutual Fund Trust. The Sponsor has entrusted a sum of Rs. 1,00,000 (Rupees One Lakh only) to the Trustee as the initial contribution towards the corpus of the Mutual Fund.
HSCI offers integrated investment banking services, securities and corporate finance & advisory. HSCI is a member of the Bombay Stock Exchange Limited and National Stock Exchange (capital and derivative market segments). HSCI holds 100% of the paid up equity share capital of HSBC Asset Management (India) Private Limited.
b. HSBC Mutual Fund
HSBC Mutual Fund (“the Mutual Fund” or “the Fund”) has been constituted as a Trust in accordance with the provisions of the Indian Trusts Act, 1882 (2 of 1882) vide a Trust Deed dated February 7, 2002 with HSBC Securities and Capital Markets (India) Private Limited, as the Sponsor and the Board of Individual Trustees. The Trustee has entered into an Investment Management Agreement dated February 7, 2002 with HSBC Asset Management (India) Private Limited (AMC) to function as the Investment Manager for all the schemes of the Fund. The Fund was registered with SEBI vide registration number MF/046/02/5 dated May 27, 2002.
The Trust has been formed for the purpose of pooling of capital from the public for collective investment in securities for the purpose of providing facilities for participation by persons as beneficiaries in such investments and in the profits/income arising therefrom.
c. Board of Trustees (the Trustees)
The Board of Trustees is the exclusive owner of the Trust Fund and holds the same in trust for the benefit of the unit holders. The Trustees have been discharging their duties and carrying out the responsibilities as provided in the SEBI (Mutual Funds) Regulations, 1996 and the Trust Deed. The Trustees seek to ensure that the Fund and the schemes floated there under are managed by the AMC in accordance with the Trust Deed, the said Regulations, directions and guidelines issued by the SEBI, the Stock Exchanges, the Association of Mutual Funds in India and other regulatory agencies.
d. Asset Management Company (the AMC)
HSBC Asset Management (India) Private Limited (the Investment Manager or the AMC) is a private limited company incorporated under the Companies Act, 1956 on December 12, 2001 having its Registered Office at 16, V. N. Road, Fort, Mumbai 400 001. HSBC Asset Management (India) Private Limited has been appointed as the Asset Management Company of HSBC Mutual Fund by the Trustee vide Investment Management Agreement (IMA) dated February 7, 2002 and executed between the Trustees and the AMC. SEBI approved the AMC to act as the Investment Manager of the Fund vide its letter No. MFD/BC/163/2002 dated May 27, 2002. The paid-up equity share capital of the AMC is Rs. 61.59 crores. The AMC is registered as a Portfolio Manager under the SEBI (Portfolio Managers) Regulations, 1993 vide registration no. INP000001322. The AMC also offers non-binding Advisory services to offshore funds under the mutual fund license.
HSBC Securities and Capital Markets (India) Private Limited holds 100% of the paid up equity share capital of the AMC.
3. inveStment oBjective of the SchemeS The investment objective of the respective schemes has been provided above under the heading “Scheme
Performance, Future Outlook and Operation of the Scheme” (Refer Section 1).
Trustees’ ReportFor the year ended March 31, 2018 (Contd...)

8
4. Significant accounting PolicieS The Significant Accounting Policies form part of the Notes to the Accounts annexed to the Balance Sheet
of the Schemes in the Full Annual Report. The accounting policies are in accordance with Securities Exchange Board of India (Mutual Funds) Regulations 1996.
5. unclaimed dividendS & redemPtionS Summary of number of investors & corresponding amount Scheme-wise as on March 31, 2018.
SchemeUnclaimed Dividend Unclaimed Redemption
Amount (Rs.) No. of Investors
Amount (Rs.) No. of Investors
HSBC Short Duration Fund 701,549.60 23 1,205,751.44 3
6. inveStor ServiceSThe number of official points of acceptance of transactions is 205 locations. In addition to the offices of the Registrar & Transfer agents, the AMC has Investor Service Centres in 9 locations at its own offices - namely Mumbai, New Delhi, Kolkata, Bangaluru, Pune, Ahmedabad, Hyderabad, Chandigarh and Chennai. With a view to enhance customer convenience, the AMC has the facility of priority based servicing to key distributors through the enhancement of the Interactive Voice Reponses. The AMC has a single Toll Free number which can be dialed from anywhere in India. The call centre service is being managed by the Registrar and Transfer Agents.
On the distribution front, the number of empanelled distributors was 460 as on March 31, 2018. During the year, the AMC initiated tie-ups for online distribution of the Mutual Fund’s schemes with several channel partners taking the total number of such tie-ups to 42.
7. detailS of inveStor grievance redreSSalThe details of the redressal of investor complaints received against HSBC Mutual Fund during April 2017 - March 2018 are as follows:
2017-2018
Com- plaint Code
Type of complaint (a) No. of complaints
pending at the
beginning of the year
(b) No. of complaints received during
the year
Action on (a) and (b)
Resolved Non Actiona-
ble*
Pending
Within 30
days
30 - 60 days
60 - 180 days
Beyond 180 days
0 - 3 months
3 - 6 months
6 - 9 months
9 - 12 months
I A Non receipt of Dividend on Units
0 5 4 1 0 0 0 0 0 0 0
I B Interest on delayed payment of Dividend
0 0 0 0 0 0 0 0 0 0 0
I C Non receipt ofRedemption Proceeds
1 12 12 1 0 0 0 1 0 0 0
I D Interest on delayedp a y m e n t o f Redemption
0 1 1 0 0 0 0 0 0 0 0
II A Non receipt of Statement of Account / Unit Certificate
0 0 0 0 0 0 0 0 0 0 0
II B D i s c r e p a n c y i n Statement of Account
0 0 0 0 0 0 0 0 0 0 0
II C Data corrections in Investor details **
0 34 34 0 0 0 0 0 0 0 0
Trustees’ ReportFor the year ended March 31, 2018 (Contd...)

9
2017-2018
Com- plaint Code
Type of complaint (a) No. of complaints
pending at the
beginning of the year
(b) No. of complaints received during
the year
Action on (a) and (b)
Resolved Non Actiona-
ble*
Pending
Within 30
days
30 - 60 days
60 - 180 days
Beyond 180 days
0 - 3 months
3 - 6 months
6 - 9 months
9 - 12 months
II D Non receipt of Annual Report /Abridged Summary
0 0 0 0 0 0 0 0 0 0 0
III A Wrong switch between Schemes
0 0 0 0 0 0 0 0 0 0 0
III B Unauthorized switch between Schemes
0 0 0 0 0 0 0 0 0 0 0
III C Deviation from Scheme attributes
0 0 0 0 0 0 0 0 0 0 0
III D Wrong or excess charges / load
0 0 0 0 0 0 0 0 0 0 0
III E Non updat ion of changes viz. address, PAN, bank details, nomination, etc
0 6 6 0 0 0 0 0 0 0 0
IV Others 1 41 42 0 0 0 0 0 0 0 0
Total 2 99 99 2 0 0 0 0 0 0 0
Summary of Complaints for FY 2017-18
Particulars Count
Total complaints received 99
Total number of folios 140099
% of complaints against the folio 0.071%
# active folios** As per AMFI Best Practice Guidelines Circular No.25/2011-12 for Revisions in the Guidelines on
Standardization of Complaints/Grievances Reporting Procedure. If “Others” include a type of complaint which is more than 10% of overall complaints, then such a reason should be provided separately. Hence data corrections in Investor Details is included as a separate category
* Non actionable means the complaint is incomplete / outside the scope of the mutual fund
8. inveStor education initiativeS The Fund undertook various investor education and awareness initiatives related to investments in mutual funds throughout India in English / Hindi and Regional languages via mass media. The Fund conducted 16 roadshows at various locations in India to promote various Investor Awareness related topics including Asset Allocation, SIPs, Equity Mutual Funds and Financial Planning. The Fund has a Year-long tie-up with Mutual Fund Insights Magazine that includes 3 pages of content and advertorial publication in their monthly issue. Each issue contains a story promoting SIPs to achieve one’s various investment goals. In the month of December 2017 and January 2018 investor awareness promotion was done through Outlook and Outlook Money magazines through advertorials on various Mutual Fund topics.
9. Statutory detailSa) The Sponsors are not responsible or liable for any loss resulting from the operation of the Schemes of
the Fund beyond initial contribution of Rs. 1 lakh for setting up the Fund.
Trustees’ ReportFor the year ended March 31, 2018 (Contd...)

10
b) The price and redemption value of the units, and income from them, can go up as well as down with fluctuations in the market value of its underlying investments.
c) Full Annual Report shall be disclosed on the website at www.assetmanagement.hsbc.com/in and shall be available for inspection at the Head Office of the Mutual Fund. Present and prospective unit holders can obtain copy of the Trust Deed, the full Annual Report of the Scheme(s), the Annual Report of HSBC Asset Management (India) Private Limited and the text of the relevant Scheme(s) at a price.
10. acknowledgementSThe Trustees wish to thank the Unit holders of the Schemes for their support throughout the year and also thank the Government of India, the Securities and Exchange Board of India (SEBI), the Reserve Bank of India (RBI) and the Association of Mutual Funds in India (AMFI) for the guidance provided by them. The Trustees also appreciate the services provided by the Registrar and Transfer Agent, Fund Accountant, Custodian, Bankers, Distributors and Brokers. The guidance and services provided by the Auditors and advocates and the ebullience, sincerity and dedication of the employees of HSBC Asset Management (India) Private Limited is also appreciated.
The Trustees look forward to the continued support of everyone.
For and on behalf of the Board of Trustees of HSBC Mutual Fund
Sd/-
Dilip Thakkar
Trustee
Mumbai
July 17, 2018.
Trustees’ ReportFor the year ended March 31, 2018 (Contd...)

11
Independent Auditors’ Report
To the Board of Trustees of
HSBC Mutual Fund – HSBC Short Duration Fund(Formerly known as HSBC Income Fund - Short Term Plan)
Report on the Financial StatementsWe have audited the accompanying Financial Statements of HSBC Short Duration Fund (formerly known as HSBC Income Fund - Short Term Plan) (the ‘Scheme’), which comprise the balance sheet as at 31 March 2018, the related revenue account and the cash flow statement for the year then ended, and a summary of significant accounting policies and other explanatory information, annexed thereto.
Management’s responsibility for the Financial StatementsThe Board of Trustees to the HSBC Mutual Fund (the ‘Board of Trustees’) and HSBC Asset Management (India) Private Limited (the ‘AMC’), being the investment manager to HSBC Mutual Fund (the ‘Fund’) (collectively referred as ‘Management’), are responsible for the preparation of these financial statements that give a true and fair view of the financial position and financial performance of the Scheme in accordance with the accounting policies and standards specified in the Ninth Schedule of the Securities and Exchange Board of India (Mutual Funds) Regulations, 1996, as amended (the ‘Regulations’) and the accounting principles generally accepted in India. This responsibility includes maintenance of adequate accounting records for safeguarding of the assets of the Scheme and for preventing and detecting frauds and other irregularities; selection and application of appropriate accounting policies; making judgments and estimates that are reasonable and prudent; and design, implementation and maintenance of adequate internal financial controls, that were operating effectively for ensuring the accuracy and completeness of the accounting records, relevant to the preparation and presentation of the financial statements that give a true and fair view and are free from material misstatement, whether due to fraud or error.
In preparing the financial statements, management is responsible for assessing the Scheme’s ability to continue as a going concern, disclosing, as applicable, matters related to going concern and using the going concern basis of accounting unless management either intends to liquidate the Fund or to cease operations, or has no realistic alternative but to do so.
Auditor’s responsibilityOur responsibility is to express an opinion on these financial statements based on our audit. We conducted our audit in accordance with the Standards on Auditing issued by the Institute of Chartered Accountants of India (the ‘ICAI’). Those Standards require that we comply with ethical requirements and plan and perform the audit to obtain reasonable assurance about whether the financial statements are free from material misstatement.
An audit involves performing procedures to obtain audit evidence about the amounts and disclosures in the financial statements. The procedures selected depend on the auditor’s judgment, including the assessment of the risks of material misstatement of the financial statements, whether due to fraud or error. In making those risk assessments, the auditor considers internal controls relevant to preparation and fair presentation of the financial statements, of the Scheme, in order to design audit procedures that are appropriate in the circumstances, but not for the purpose of expressing an opinion on the effectiveness of the Scheme’s internal controls. An audit also includes evaluating the appropriateness of accounting policies used and the reasonableness of the accounting estimates made by Management, as well as evaluating the overall presentation of the financial statements.
We are also responsible to conclude on the appropriateness of management’s use of the going concern basis of accounting and, based on the audit evidence obtained, whether a material uncertainty exists related to events or conditions that may cast significant doubt on the Scheme’s ability to continue as a going concern. If we conclude that a material uncertainty exists, we are required to draw attention in the auditor’s report to the related disclosures in the financial statements or, if such disclosures are inadequate, to modify the opinion. Our conclusions are based on the audit evidence obtained up to the date of the auditor’s report. However, future events or conditions may cause the Scheme to cease to continue as a going concern.
We believe that the audit evidence we have obtained is sufficient and appropriate to provide a basis for our audit opinion.

12
OpinionIn our opinion, and to the best of our information and according to the explanations given to us, the aforesaid financial statements give the information required by the Regulations in the manner so required and give a true and fair view in conformity with the accounting principles generally accepted in India:
(i) in the case of the balance sheet, of the state of affairs of the Scheme as at 31 March 2018;
(ii) in the case of the revenue account, of the net surplus for the year ended on that date; and
(iii) in the case of the cash flow statement, of the cash flows of the Scheme for the year ended on that date.
Report on other Legal and Regulatory Requirements1 As required by Regulation 55(4) to the Regulations, we report that:
(a) We have obtained all information and explanations which, to the best of our knowledge and belief, were necessary for the purposes of the audit;
(b) The balance sheet and revenue account have been prepared in accordance with the accounting policies and standards specified in the Ninth Schedule of the Regulations.
2 As required by Clause 5(ii)(2) of the Eleventh Schedule of the Regulations, we report that the balance sheet and revenue account are in agreement with the books of account of the Scheme.
3 In our opinion and on the basis of information and explanations given to us, the methods used to value non - traded securities, as at 31 March 2018, as determined by the Board of Directors of AMC, are in accordance with the Regulations and other guidelines issued by the Securities and Exchange Board of India as applicable and approved by the Board of Trustees are fair and reasonable.
For B S R & Co. LLP Chartered Accountants Firm’s Registration No: 101248W/W-100022
Sd/-
Milind Ranade Partner Membership No: 100564
Place : Mumbai Date : July 17, 2018.
Independent Auditors’ Report (Contd...)

13
Rs. in Lakhs
HSBC SHORT DURATION FUND
As at March 31, 2018
As at March 31, 2017
LIABILITIES1 Unit Capital 65,760.81 97,385.88 2 Reserves & Surplus2.1 Unit Premium Reserves 6,906.47 10,515.38 2.2 Unrealised Appreciation Reserve 131.20 632.32 2.3 Other Reserves 69,066.41 91,533.26 3 Loans & Borrowings – – 4 Current Liabilities & Provisions4.1 Provision for doubtful Income/Deposits – – 4.2 Other Current Liabilities & Provisions 805.35 564.14
TOTAL 142,670.24 200,630.98
ASSETS1 Investments1.1 Listed Securities: – – 1.1.1 Equity Shares – – 1.1.2 Preference Shares – – 1.1.3 Equity Linked Debentures – – 1.1.4 Other Debentures & Bonds 118,683.87 169,323.14 1.1.5 Securitised Debt securities – – 1.2 Securities Awaited Listing:1.2.1 Equity Shares – – 1.2.2 Preference Shares – – 1.2.3 Equity Linked Debentures – – 1.2.4 Other Debentures & Bonds – – 1.2.5 Securitised Debt securities – – 1.3 Unlisted Securities1.3.1 Equity Shares – – 1.3.2 Preference Shares – – 1.3.3 Equity Linked Debentures – – 1.3.4 Other Debentures & Bonds 4,520.25 4,034.72 1.3.5 Securitised Debt securities – – 1.4 Government Securities 6,271.811.5 Treasury Bills – – 1.6 Commercial Paper – 494.35 1.7 Certificate of Deposits 8,450.36 – 1.8 Bill Rediscounting – – 1.9 Units of Domestic Mutual Fund – – 1.10 Foreign Securities – –
Total Investments 137,926.29 193,417.11
2 Deposits 73.38 93.40 3 Other Current Assets3.1 Cash & Bank Balance 159.38 138.63 3.2 CBLO/Reverse Repo Lending 385.93 901.92 3.3 Others 4,125.26 6,079.92 4 Deferred Revenue Expenditure (to the extent not written off) – –
TOTAL 142,670.24 200,630.98
Notes to Accounts - Annexure I
Abridged Balance Sheet as at March 31, 2018

14
Abridged Revenue Account for the year ended March 31, 2018
Rs. in Lakhs
HSBC SHORT DURATION FUND
Current Year ended
March 31, 2018
Previous Year ended
March 31, 2017
1 INCOME1.1 Dividend – – 1.2 Interest 16,290.45 18,228.70 1.3 Realised Gain / (Loss) on Foreign Exchange Transactions – – 1.4 Realised Gains / (Losses) on Interscheme sale of investments – – 1.5 Realised Gains / (Losses) on External sale / redemption of investments (1,359.47) 1,723.64 1.6 Realised Gains / (Losses) on Derivative Transactions – – 1.7 Other Income – –
(A) 14,930.98 19,952.34
2 EXPENSES2.1 Management fees 1,029.55 897.08 2.2 GST / Service tax on Management fees 180.45 133.50 2.3 Transfer agents fees and expenses 80.55 85.23 2.4 Custodian fees 11.62 11.80 2.5 Trusteeship fees 1.14 1.73 2.6 Commission to Agents 654.47 875.82 2.7 Marketing & Distribution expenses 2.30 1.74 2.8 Audit fees 2.14 3.26 2.9 Investor Education Expenses 42.43 46.49 2.10 Other operating expenses 15.42 16.61 2.11 Less: Expenses to be Reimbursed by the Investment Manager – –
(B) 2,020.07 2,073.26
3 NET REALISED GAINS / (LOSSES) FOR THE YEAR (A–B=C) 12,910.91 17,879.08
4 Change in Unrealised Depreciation in value of investments (D) (433.95) (69.64)
5 NET GAINS / (LOSSES) FOR THE YEAR [E=(C+D)] 12,476.96 17,809.44
6 Change in unrealised appreciation in the value of investments (F) (501.12) 387.79
7 NET SURPLUS / (DEFICIT) FOR THE YEAR (E + F = G) 11,975.84 18,197.23
7.1 Add: Balance transfer from Unrealised Appreciation Reserve 501.12 –
7.2 Less: Balance transfer to Unrealised Appreciation Reserve – 387.79 7.3 Add / (Less): Equalisation (32,926.87) 13,220.02 7.4 Transfer from Reserve Fund 91,533.26 63,340.81 7.5 Transfer from Unit Premium Reserve – –
8 Total 71,083.35 94,370.27
9 Dividend Appropriation9.1 Income Distributed during the year (1,450.27) (2,036.71)9.2 Tax on income distributed during the year (566.67) (800.30)
10 Retained Surplus / (Deficit) carried forward to Balance Sheet 69,066.41 91,533.26
Notes to Accounts – Annexure I

15
Key Statistics for the year ended March 31, 2018
HSBC SHORT DURATION FUND
Current Year ended
March 31, 2018
Previous Year ended
March 31, 2017
1. NAV per unit (Rs.): Open Regular Growth Option 26.9083 24.8551 Regular Dividend Option – – Regular Quarterly Dividend Option 10.0419 – Regular Weekly Dividend Option 10.2072 10.2169 Regular Monthly Dividend Option 11.1758 – Institutional Growth Option – – Institutional Dividend Option – – Institutional Weekly Dividend Option 13.3262 13.2695 Institutional Monthly Dividend Option – – Institutional Plus Growth Option 15.9658 14.6519 Institutional Plus Weekly Dividend Option – 10.1875 Institutional Plus Monthly Dividend Option – – Direct Plan – Growth Option 27.9283 25.5527 Direct Plan – Dividend Option – – Direct Plan – Weekly Dividend Option 10.2304 10.2424 Direct Plan – Monthly Dividend Option 11.2791 11.4386 Direct Plan – Quarterly Dividend Option – – High Regular Growth Option 28.4025 26.9083 Regular Dividend Option – – Regular Quarterly Dividend Option 10.3877 10.0419 Regular Weekly Dividend Option 10.2362 10.3144 Regular Monthly Dividend Option 11.2656 11.4221 Institutional Growth Option – – Institutional Dividend Option – – Institutional Weekly Dividend Option 13.3666 13.5117 Institutional Monthly Dividend Option – – Institutional Plus Growth Option 16.0331 15.9658 Institutional Plus Weekly Dividend Option – 10.5629 Institutional Plus Monthly Dividend Option – – Direct Plan – Growth Option 29.7473 27.9283 Direct Plan – Dividend Option – – Direct Plan – Weekly Dividend Option 10.2618 10.2889 Direct Plan – Monthly Dividend Option 12.0177 12.0465 Direct Plan – Quarterly Dividend Option 10.4163 – Low Regular Growth Option 26.8966 24.9155 Regular Dividend Option – – Regular Quarterly Dividend Option 9.9757 9.9401 Regular Weekly Dividend Option 10.1666 10.1496 Regular Monthly Dividend Option 11.1080 11.1058 Institutional Growth Option – –

16
Key Statistics for the year ended March 31, 2018 (Contd...)
HSBC SHORT DURATION FUND
Current Year ended
March 31, 2018
Previous Year ended
March 31, 2017
Institutional Dividend Option – – Institutional Weekly Dividend Option 13.2568 13.2366 Institutional Monthly Dividend Option – – Institutional Plus Growth Option 15.9609 14.6885 Institutional Plus Weekly Dividend Option – 10.1609 Institutional Plus Monthly Dividend Option – – Direct Plan – Growth Option 27.9200 25.6175 Direct Plan – Dividend Option – – Direct Plan – Weekly Dividend Option 10.1964 10.1490 Direct Plan – Monthly Dividend Option 11.2763 11.1941 Direct Plan – Quarterly Dividend Option 10.0860 – End Regular Growth Option 28.4170 26.9083 Regular Dividend Option – – Regular Quarterly Dividend Option – 10.0419 Regular Weekly Dividend Option 10.2049 10.2072 Regular Monthly Dividend Option 11.1713 11.1758 Institutional Growth Option – – Institutional Dividend Option – – Institutional Weekly Dividend Option – 13.3262 Institutional Monthly Dividend Option – – Institutional Plus Growth Option – 15.9658 Institutional Plus Weekly Dividend Option – – Institutional Plus Monthly Dividend Option – – Direct Plan – Growth Option 29.7648 27.9283 Direct Plan – Dividend Option – – Direct Plan – Weekly Dividend Option 10.2299 10.2304 Direct Plan – Monthly Dividend Option 12.0248 11.2791 Direct Plan – Quarterly Dividend Option 10.1781 –2. Closing Assets Under Management (Rs. in Lakhs) End 141,865 199,087 Average (AAuM)1 212,163 232,4573. Gross income as % of AAuM2 7.04% 8.58%4. Expense Ratio: a. Total Expense as % of AAuM (including service tax / GST on Management fees) (planwise) Regular Growth Option 1.30% 1.29% Institutional Growth Option 0.75% 0.75% Institutional Plus Growth Option 0.64% 0.65% Direct Plan – Growth Option 0.35% 0.34% b. Management Fee as % of AAuM (planwise) Regular Growth Option 0.47% 0.39% Institutional Growth Option 0.47% 0.39% Institutional Plus Growth Option 0.47% 0.39% Direct Plan – Growth Option 0.47% 0.39%

17
HSBC SHORT DURATION FUND
Current Year ended
March 31, 2018
Previous Year ended
March 31, 2017
5. Net Income as a percentage of AAuM3 6.09% 7.69%6. Portfolio turnover ratio4 – – 7. Total Dividend per unit distributed during the year (planwise) Retail Regular Weekly Dividend Option 0.4036 0.5931 Regular Quarterly Dividend Option 0.1445 – Regular Monthly Dividend Option 0.4444 0.5911 Institutional Weekly Dividend Option 0.5755 0.7771 Institutional Plus Weekly Dividend Option – 0.2942 Direct Plan – Weekly Dividend Option 0.4743 0.6657 Direct Plan – Monthly Dividend Option – 0.8538 Direct Plan – Quarterly Dividend Option 0.3611 – Corporate Regular Weekly Dividend Option 0.3739 0.5495 Regular Quarterly Dividend Option 0.1338 – Regular Monthly Dividend Option 0.4117 0.5476 Institutional Weekly Dividend Option 0.5332 0.7199 Institutional Plus Weekly Dividend Option – 0.2725 Direct Plan – Weekly Dividend Option 0.4394 0.6167 Direct Plan – Monthly Dividend Option – 0.7911 Direct Plan – Quarterly Dividend Option 0.3346 – 8. Returns(%): a. Last One Year Scheme Regular Growth Option 5.6898 8.2607 Institutional Plus Growth Option N.A. 8.9674 Direct Plan – Growth Option 6.6595 9.2969 Benchmark CRISIL Short–Term Bond Fund Index 6.2100 9.1042 b. Since Inception Scheme Regular Growth Option 7.0577 7.1594 Institutional Plus Growth Option N.A. 5.9327 Direct Plan – Growth Option 8.6658 9.1621 Benchmark CRISIL Short–Term Bond Fund Index 7.1200 7.1875
1. AAuM=Average daily net assets.2. Gross income = amount against (A) in the Revenue account i.e. Income.3. Net income = amount against (C) in the Revenue account i.e. Net Realised Gains / (Losses) for the year.4. Portfolio Turnover = Lower of sales or purchase divided by the Average AuM for the year.5. The net asset value disclosed represents the computed NAV on March 31, 2018 (Non-business Day),
and not the last declared NAV
Key Statistics for the year ended March 31, 2018 (Contd...)

18
Notes to Accounts – Annexure ITo the Abridged Balance Sheet and Revenue Account for the year ended March 31, 2018
HSBC SHORT DURATION FUND
1 Investments:-
1.1. It is confirmed that investments of the Scheme are registered in the name of the Trustees for the benefit of the Scheme’s unitholders.
1.2. Open Positions of derivatives as of year ended March 31, 2018 and March 31, 2017 are NIL.
1.3. Investments in Associates and Group Companies:
(Rupees)
Issuer Instrument Type
Amount Aggregate Investments
by all schemes
Amount Aggregate Investments
by all schemes
2018 2017
Shriram Transport Finance Company Ltd.
Corporate Bonds / Debentures
500,409,000 651,317,500 850,000,000 1,452,436,300
Equities – – – 94,659,583
Bharti Airtel Ltd. Equities – 369,136,950 – 1,025,985
Balrampur Chini Mills Ltd.
Equities – 125,227,938 – –
1.4. Open position of Securities Borrowed and / or Lent by the Scheme as of the years ended March 31, 2018 and March 31, 2017 are NIL.
1.5. NPAs for the Scheme for the years ended March 31, 2018 and March 31, 2017 are NIL.
1.6. Aggregate Unrealised Gain / Loss as at the end of the financial years 2018 and 2017 and their percentages to net assets are as under :
Security Type Amount (Rs.) Percentage to Net Assets
Amount (Rs.) Percentage to Net Assets
2018 2017
Non Convertible Debentures and Bonds Listed / Awaiting Listing
– Appreciation 15,945,392 0.11 96,328,988 0.14
– Depreciation 66,305,180 0.47 33,096,914 0.11
Certificate of Deposits
– Appreciation 1,873,363 0.01 – –
– Depreciation – – – –
Government Securities
– Appreciation 11,676,120 0.08 6,446,313 0.03
– Depreciation 429,571 ~0.00 13,410,769 0.07
~ Indicates less than 0.01
1.7. The aggregate value of investments securities (excluding CBLO and Reverse Repos) purchased and sold (including matured) during the financial year 2017-18 (excluding accretion of discount) Rs. 42,326,747,222 and Rs. 47,865,790,379 respectively being 199.50% and 225.61% of the average daily net assets.

19
The aggregate value of investments securities (excluding CBLO and Reverse Repos) purchased and sold (including matured) during the financial year 2016 -17 (excluding accretion of discount) Rs. 47,429,622,469 and Rs. 42,609,787,503 respectively being 204.04% and 183.30% of the average daily net assets.
1.8. Non-Traded securities in the portfolio: Aggregate Value of Equity, Debt & Money Market Instruments and percentage to net assets are as under:
Security Category Fair Value (Rs.)
Percentage to Net Assets
Fair Value (Rs.)
Percentage to Net Assets
2018 2017
Debt Instruments 12,320,411,663 86.85 17,093,785,708 85.86
Money Market Instruments 845,035,950 5.96 49,434,645 0.25
Total 13,165,447,613 92.80 17,143,220,353 86.11
2 Disclosure Under Regulation 25(8) of the Securities and Exchange Board of India (Mutual Funds) Regulations, 1996 as amended
During the year 2017-18, The Hong Kong and Shanghai Banking Corporation Limited, an associate entity of HSBC Asset Management (India) Private Limited was paid collection/bank charges are Nil.
During the year 2016-17, The Hong Kong and Shanghai Banking Corporation Limited, an associate entity of HSBC Asset Management (India) Private Limited was paid collection/bank charges are Nil.
Details of amounts paid to associates in terms of Regulation 25 (8) are as follows :
Commission paid to Sponsor/AMC and its associates/related parties/group companies
Name of Sponsor/AMC and its associates/related parties/group companies
Nature of Association / Nature of
Relation
Period Covered
Business Given [Rs. In Crores]
% of Total Business received by the Fund
Commission paid [Rs.]
% of Total commission paid by the
Fund
The Hongkong and Shanghai Banking Corporation Limited
Associate 2017-2018 327.61 11.85 36,880,561.53 61.97
Name of Sponsor/AMC and its associates/related parties/group companies
Nature of Association / Nature of
Relation
Period Covered
Business Given [Rs. In Crores]
% of Total Business received by the Fund
Commission paid [Rs.]
% of Total commission paid by the
Fund
The Hongkong and Shanghai Banking Corporation Limited
Associate 2016-2017 772.05 19.00 33,482,489.32 39.08
The brokerage paid was at rates similar to those offered to other brokers / distributors. The Commission/Brokerage paid to related party includes both upfront and trail and hence not comparable with the % of business brought and % of commission paid.
Further, The Hong Kong and Shanghai Banking Corporation Limited, an associate of the Sponsor, is on the panel of bankers with whom HSBC Mutual Fund places money on fixed deposits and enters into reverse repo transactions from time to time at competitive rates.
Notes to Accounts - Annexure I (Contd...)To the Abridged Balance Sheet and Revenue Account for the year ended March 31, 2018

20
(i) Any underwriting obligations undertaken by the schemes of the mutual funds with respect to issue of securities associate companies - Nil (Previous year also Nil).
(ii) Devolvement - Nil (Previous year also Nil).
(iii) Subscription by the schemes in the issues lead managed by associate companies - Nil (Previous year also Nil).
(iv) Subscription to any issue of equity or debt on private placement basis where the sponsor or its associate companies have acted as arranger or manager - Nil (Previous year also Nil).
3 None of the Investors held more than 25% of the total net assets of the Scheme as at the years ended on March 31, 2018 and March 31, 2017.
4 Unit Capital movement during the years ended March 31, 2018 and March 31, 2017:
Description
2017–2018
Opening Units Subscription Redemption Closing UnitsFace Value
per unit (Rupees)
Regular Dividend Option
237,800,326.026 106,159,605.253 189,622,769.573 154,337,161.706 10
Regular Growth Option
396,929,103.775 181,038,349.267 305,994,702.004 271,972,751.038 10
Regular Quarterly Option
300,000.000 7,538,432.313 7,838,432.313 – 10
Regular Weekly Dividend Option
141,035,876.554 77,381,356.265 114,409,298.696 104,007,934.123 10
Institutional Weekly Dividend Option
599,442.020 – 599,442.020 – 10
Institutional Plus Growth Option
20,431,475.616 – 20,431,475.616 – 10
Direct Plan - Growth Option
174,212,023.727 699,800,312.679 752,692,989.560 121,319,346.846 10
Direct Plan - Dividend Option
92,189.876 17,802.456 8,913.276 101,079.056 10
Direct Plan - Weekly Dividend Option
2,458,332.799 5,166,292.167 1,907,162.203 5,717,462.763 10
Direct Plan - Quarterly Dividend Option
– 2,654,469.105 2,502,134.173 152,334.932 10
Description
2016–2017
Opening Units Subscription Redemption Closing UnitsFace Value
per unit (Rupees)
Regular Dividend Option
173,185,872.078 283,174,133.999 218,559,680.051 237,800,326.026 10
Regular Growth Option
283,130,329.022 391,286,628.634 277,487,853.881 396,929,103.775 10
Notes to Accounts – Annexure I (Contd...)To the Abridged Balance Sheet and Revenue Account for the year ended March 31, 2018

21
Description
2016–2017
Opening Units Subscription Redemption Closing UnitsFace Value
per unit (Rupees)
Regular Quarterly Option
– 305,000.000 5,000.000 300,000.000 10
Regular Weekly Dividend Option
96,697,381.334 167,480,793.308 123,142,298.088 141,035,876.554 10
Institutional Weekly Dividend Option
599,442.020 – – 599,442.020 10
Institutional Plus Growth Option
20,431,475.616 – – 20,431,475.616 10
Institutional Plus Weekly Dividend Option
20,163,437.936 – 20,163,437.936 – 10
Direct Plan – Growth Option
166,478,621.239 935,406,401.448 927,672,998.960 174,212,023.727 10
Direct Plan – Dividend Option
87,619.808 424,628.523 420,058.455 92,189.876 10
Direct Plan – Weekly Dividend Option
1,491,346.402 3,161,391.362 2,194,404.965 2,458,332.799 10
** Units held by the AMC (Seed Capital) in Direct Plan Growth Option as on March 31, 2018 is 210,860.141 and as on March 31, 2017 is 210,860.141.
5 Previous year’s figures have been re-grouped / re-arranged where appropriate.
6 No contingent liabilities for the years ended March 31, 2018 and March 31, 2017.
7 Expenses other than Management Fees are Inclusive of GST / Service Tax where applicable.
8 Other Income - Nil Exit load credited to the Scheme (2017: Rs. 19) represents Exit load (net of GST /service tax) credited to the Scheme.
9 Investor Education Awareness
In view of the AMFI Best Practices Guidelines Circular No. 56/2015-16, the IEF (Investor Education Fund) accrual is set aside in a separate bank account and the consolidated balance across all schemes as on March 31, 2018. The break-up of which is as under:
March 31, 2018 March 31, 2017
Particulars Amount (in Rs. Lacs) Amount (in Rs. Lacs)
Opening Balance 44.00 –
Add: Accrual during the year 219.83 182
Less: Transferred to AMFI 101.10 83
Less: Payable to AMFI (March accrual) 8.81 8
Add: Investment Income for the year 8.28 11
Less: Spent during the year 43.17 58
Closing Balance 119.02 44
Notes to Accounts - Annexure I (Contd...)To the Abridged Balance Sheet and Revenue Account for the year ended March 31, 2018

22
10 Categorization and Rationalization of Schemes
Pursuant to SEBI circular no. SEBI/HO/IMD/DF3/CIR/P/2017/114 dated October 6, 2017 and SEBI circular no. SEBI/HO/IMD/DF3/CIR/P/2017/126 dated December 4, 2017 on ‘Categorization and Rationalization of schemes’, fundamental attribute related changes were carried out in certain schemes of HSBC Mutual Fund to align the same with the requirements specified in the aforesaid circulars effective from March 14, 2018. The said changes have been approved by the Board of Directors of the HSBC Asset Management (India) Pvt. Ltd. (the AMC) and the Board of Trustees (the Trustees). SEBI vide its letter no. IMD/DF3/OW/P/2018/89/1 dated January 2, 2018 has also conveyed it’s no objection to the said changes.
A notice-cum-addendum providing details of changes in the fundamental attributes of certain schemes was published in the newspaper on February 3, 2018 and is also available on the website of the AMC at www.assetmanagement.hsbc.com/in. The exit window period of 30 days was provided to the investors during which no exit load was charged to investors on switches/redemptions.
Apart from the fundamental attribute changes, there has been change in the ‘type of Scheme’ for all the open ended schemes and ‘name of Scheme’ in certain schemes for the purposes of alignment of the existing schemes with the provisions of the Circular. The details of the schemes impacted is provided below:
Existing Name Revised Name Fundamental Attribute change
Benchmark Change
HSBC Income Fund - Short Term Plan
HSBC Short Duration Fund
Yes No
11 The Annual Accounts of the Schemes prepared in accordance with the accounting policies and standards specified in the Ninth Schedule of The Securities and Exchange Board of India (Mutual Funds) Regulations, 1996 has been approved by the Board of Directors of HSBC Asset Management (India) Private Limited and The Board of Trustees of HSBC Mutual Fund at their meetings held on July 16, 2018 and July 17, 2018 respectively. The audit report attached herewith refers to the said Annual Accounts. The aforesaid abridged accounts are an extract of the Annual Accounts and are prepared in accordance with SEBI Circular No. IMD/Cir8/132968/2008 dated July 24, 2008.
Notes to Accounts – Annexure I (Contd...)To the Abridged Balance Sheet and Revenue Account for the year ended March 31, 2018

23
Voting Policy and Procedures
In view of SEBI guidelines related to “Role of Mutual Funds in Corporate Governance of Public Listed Companies”, AMIN has formulated its “Policy for Proxy Voting in Public Listed Companies”. The said policy and details of actual exercise of proxy votes along with the summary of votes cast and the auditors certification during the Financial Year 2017 – 18 is available on its website – http://www.assetmanagement.hsbc.com/in and in full Annual Report for the Financial Year 2017 – 18.

24
Statutory Details & Disclaimers
All returns have been sourced from Mutual Funds India Explorer software unless otherwise stated. With regard to equity schemes (including the equity component of MIPs), Fund performance is calculated on a total return basis (i.e. it includes dividends re-invested) while the benchmark is calculated on a price return basis (i.e. it does not consider dividends re-invested). This document has been prepared by HSBC Asset Management (India) Private Ltd (HSBC) for information purposes only and should not be construed as an offer or solicitation of an offer for purchase of any of the funds of HSBC Mutual Fund. All information contained in this document (including that sourced from third parties), is obtained from sources HSBC, the third party believes to be reliable but which it has not independently verified and HSBC, the third party makes no guarantee, representation or warranty and accepts no responsibility or liability as to the accuracy or completeness of such information. The information and opinions contained within the document are based upon publicly available information and rates of taxation applicable at the time of publication, which are subject to change from time to time. Expressions of opinion are those of HSBC only and are subject to change without notice. It does not have regard to specific investment objectives, financial situation and the particular needs of any specific person who may receive this document. Investors should seek financial advice regarding the appropriateness of investing in any securities or investment strategies that may have been discussed or recommended in this report and should understand that the views regarding future prospects may or may not be realized. Neither this document nor the units of HSBC Mutual Fund have been registered in any jurisdiction. The distribution of this document in certain jurisdictions may be restricted or totally prohibited and accordingly, persons who come into possession of this document are required to inform themselves about, and to observe, any such restrictions.
Investors should not invest in the Scheme solely based on the information provided in this document and should read the Scheme Information Document and Statement of Additional Information of the Fund for details. This document does not constitute an offering document.
No part of this publication may be reproduced, stored in a retrieval system, or transmitted, on any form or by any means, electronic, mechanical, photocopying, recording, or otherwise, without the prior written permission of HSBC Asset Management (India) Private Ltd.
Mutual Fund investments are subject to market risks, read all scheme related documents carefully.

HSBC Low Duration Fund (erstwhile HSBC Ultra Short Term Bond Fund)An open ended low duration debt Scheme investing in instruments such that the Macaulay duration of the portfolio is between 6 months to 12 months
Abridged Annual Report 2017 - 2018

1
Dear Investor,
Globally, we are witnessing a very interesting phase. The equity markets delivered a stellar performance in 2017. However, there are worries about the impact of higher rates, global trade wars, an economic growth moderation and higher volatility.
Closer home, India has become the world’s sixth-biggest economy. India has doubled its GDP to USD 2.2 trillion within a decade. The introduction of reform measures, including demonetisation and the Goods and Services Tax (GST), had put pressure on selective parts of the economy in 2017. The impact of these measures is likely to be transitory. India’s economic growth is expected to accelerate from 6.7% in FY18 to 7.4% in the current year as per IMF forecasts.
There has been a shift in the domestic savings pool supporting the market. Domestic investors have been increasing exposure to equities and financial assets moving away from gold and real estate. Mutual funds witnessed sizable inflows on the back of the boost in liquidity within the banking system from demonetisation. The AUM of the mutual fund industry grew by 21.7% in March 2018 compared to March 2017.
With growth, comes responsibility. Last year, the regulator, Securities and Exchange Board of India (SEBI) issued a circular to rationalise and categorise mutual fund schemes in India. We are pleased to state that none of our funds needed to be redesigned. All our schemes have been defined as per the new categorisation. We believe this classification will simplify investing into mutual funds and enhance comparability within the schemes offered.
As India moves to a digital age, e-commerce platforms are becoming increasingly popular. I request you to logon to our online transaction platform. It is a quick, convenient and an efficient tool to invest into our funds and manage your investments online.
At HSBC Global Asset Management, India, we are dedicated to one goal: delivering exceptional investment management for our clients. By bringing together our

2
global investment knowledge and capabilities, we are able to offer specialised expertise across asset classes. This has helped us to become a trusted partner to our individual and institutional investors.
We remain committed to our long-term perspective and disciplined investment approach as we conduct a rigorous, fundamental analysis of investments with a strong emphasis on risk management. Although the investment landscape appears favourable, it is worth remembering that markets are dynamic and constantly evolving. Therefore, we believe active, professional investment management serves investors well. Amid changing markets and economic conditions, we are confident that investors with a well-diversified portfolio and a patient, long-term outlook should be well positioned for the years ahead.
Together we thrive.
Warm regards,
Ravi Menon
Chief Executive Officer, HSBC Global Asset Management, India

3
SPONSORHSBC Securities and Capital Markets (India) Private LimitedRegd. Office: 52/60, Mahatma Gandhi Road, Fort, Mumbai - 400 001.
TRUSTEEBoard of TrusteesOffice: 16, Veer Nariman Road, Fort, Mumbai 400 001.
ASSET MANAGEMENT COMPANYHSBC Asset Management (India) Private LimitedCorp. & Regd. Office: 16, Veer Nariman Road, Fort, Mumbai 400 001.
CUSTODIANStandard Chartered Bank (SCB)Corp. & Regd. Office: Crescenzo, Securities Services, 3rd Floor, C-38/39, G-Block, Bandra Kurla Complex, Bandra East, Mumbai – 400051.
AUDITORS TO THE SCHEMEBSR & Co. LLPChartered Accountants 5th Floor, Lodha Excelus, Apollo Mills Compound, N.M. Joshi Marg, Mahalaxmi, Mumbai 400 011.
REGISTRAR & TRANSFER AGENTSComputer Age Management Services Private Limited (CAMS)Unit: HSBC Mutual Fund ’C’ Block, 2nd Floor, Hanudev Info Park P. Ltd., SF No. 558/2, Udayampalayam Road, Nava India, Coimbatore - 641 028.
BOARD OF TRUSTEESMr. Nasser Munjee
Mr. Manu Tandon
Mr. Mehli Mistri
Mr. Dilip J. Thakkar
Ms. Jasmine Batliwalla
Mr. Pedro Bastos
BOARD OF DIRECTORSMs. Kishori J. Udeshi - Chairperson
Mr. S. P. Mustafa
Mr. Dinesh Mittal
Mr. Ravi Menon - Chief Executive Officer

4
The Trustees of HSBC Mutual Fund (“Fund”) present the Sixteenth Annual Report and the audited abridged financial statements of the schemes of the Fund for the year ended March 31, 2018.
As at March 31, 2018, the Fund offered 30 schemes across asset classes to meet the varying investment needs of the investors. Notably, three Schemes of HSBC Mutual Fund viz. HSBC Large Cap Equity Fund, HSBC Short Duration Fund and HSBC Cash Fund have completed 15 years of operations during the year.
During the year, the Fund has launched Plan(s) under Fixed Term Series and carried out merger of the existing schemes viz HSBC Dividend Yield Equity Fund merged into HSBC Multi Cap Equity Fund (HMEF), erstwhile HSBC India Opportunities Fund, as offering sub-scale fund was not in the interest of the unitholders.
Further, in order to bring uniformity in the practice across Mutual Funds and to standardize the scheme categories and characteristics of schemes, SEBI vide its circular no. SEBI/HO/IMD/DF3/CIR/P/2017/114 dated October 06, 2017, issued guidelines for categorization and rationalization of Mutual Fund schemes.
Accordingly, HSBC Large Cap Equity Fund (erstwhile HSBC Equity Fund), HSBC Small Cap Equity Fund (erstwhile HSBC Mid Cap Equity Fund) , HSBC Infrastructure Equity Fund, HSBC Global Emerging Market Fund (erstwhile HSBC Emerging Market Fund), HSBC Debt Fund (erstwhile HSBC Income Fund – Investments Plan), HSBC Short Duration Fund (erstwhile HSBC Income Fund – Short Term Plan), HSBC Low Duration Fund (erstwhile HSBC Ultra Short Term Bond Fund), HSBC Regular Savings Fund (erstwhile HSBC Monthly Income Plan) and HSBC Managed Solutions have undergone fundamental attributes changes with effective from March 14, 2018.
The Fund continues its focus on delivering consistent long term returns. The comments on the performance of the Scheme(s) is provided hereinafter. Dividends were declared under various schemes as per the provisions contained in the respective Scheme Information Documents after considering the distributable surplus available under the respective Schemes. Details of dividends declared can be viewed on our website at www.assetmanagement.hsbc.com/in.
1. Scheme Performance, future outlook and oPerationS of the SchemeS
a. Operations and Performance of the Schemes
HSBC Low Duration Fund (HLDF) (erstwhile HSBC Ultra Short Term Bond Fund) (An open ended low duration debt Scheme investing in instruments such that the Macaulay duration of the portfolio is between 6 months to 12 months)
HLDF seeks to provide liquidity and reasonable returns by investing primarily in a mix of debt and money market instruments such that the Macaulay duration of the portfolio is between 6 months to 12 months. However, there can be no assurance or guarantee that the investment objective of the scheme would be achieved.
The net assets of HLDF amounted to Rs. 549.27 crores as at March 31, 2018 compared to Rs. 392.65 crores as at March 31, 2017. Around 93.19% of the net assets were invested in debt and money market instruments and 6.81% comprised of reverse repos/CBLO and net current assets as at March 31, 2018.
HLDF underperformed the index on back of overweight in the duration and focus on lower end of the curve.
Scheme Name & Benchmarks Absolute Returns
(%)
Compounded Annualized Returns (%)
Date of Inception : 17 October 2006 1 Year 3 Years 5 Years Since Inception
HSBC Low Duration Fund - Growth 6.40% 7.26% 7.98% 8.00%
CRISIL Low Duration Debt Index (Scheme Benchmark)* 6.87% 8.15% 8.66% 8.69%
CRISIL 1 Year T-Bill Index (Standard Benchmark) 5.89% 7.00% 7.05% 7.16%
Rs. 10,000, if invested in HLDF, would have become 10,642 12,345 14,683 15,262
Rs. 10,000, if invested in Customised Benchmark Index, would have become
10,689 12,655 15,151 15,808
Trustees’ ReportFor the year ended March 31, 2018

5
Scheme Name & Benchmarks Absolute Returns
(%)
Compounded Annualized Returns (%)
Date of Inception : 17 October 2006 1 Year 3 Years 5 Years Since Inception
Rs. 10,000, if invested in CRISIL 1 Year T-Bill Index, would have become
10,591 12,255 14,061 14,619
Past performance may or may not be sustained in future. The returns for the respective periods are provided as on last business day of March 2018 for Growth Option. Different plans shall have a different expense structure. Performance of the respective benchmark is calculated as per the Total Return Index (TRI). Benchmark of the scheme is changed to CRISIL Ultra Short Term Debt Index effective 14 March 2018, which is now renamed to CRISIL Low Duration Debt Index.
b. Market Overview & Outlook (as furnished by HSBC Asset Management (India) Private Limited)
EqUITY OUTLOOKIndian equity markets continued to remain strong during fiscal year 2017-18 and posted gains of 11.76% by S&P CNX Nifty and 13.24% by BSE Midcap index respectively. Biggest drivers of the markets were, robust DII flow into equities, continued push of mega reforms – Goods and Services Tax (GST) implementation, Insolvency and Bankruptcy Code implementation, Real Estate (Regulation and Development) Act, second consecutive normal monsoon, and electoral victories of the ruling party in many state elections. On the other hand, the markets weather the storm of disruption in economy due to GST implementation, lingering impact of demonetization, muted FII flows, and rising yields in developed markets. Domestic Mutual Fund segment had their best ever year and they brought in ~USD 22 bn of net inflows in equities during the year. Even after witnessing ~USD 4.3 bn of net outflows from the domestic insurers, the net DII tally was a very impressive ~USD 17.7 bn of net inflows. There were mixed global cues well and the Foreign Institutional Investors (FIIs) net bought Indian equities worth USD 3.2 bn. The inflows by both FIIs and domestic MFs acted as a factor in the strong market performance.
Indices Returns (April 1, 2017 to March 31, 2018) 1 Year (%)
S&P BSE Sensex 12.70%
NSE CNX Nifty 11.76%
S&P BSE 100 12.12%
S&P BSE 200 12.49%
S&P BSE 500 13.21%
S&P BSE Midcap 14.31%
S&P BSE 250 Small-cap 14.13%
Source: Bloomberg (All values are total return)
Our view on the key aspects related to equity markets are presented below -
The impressive performance in equity markets during FY 2017-18 has come on the back of strong liquidity largely by domestic MFs but supported in party by FII flows, positive global growth, benign macro – both domestically and global, expectation of the continuation of favorable policy environment domestically and expectation of corporate earnings revival. Possibility of sound macro, economic reforms and implementation of existing reforms have increased, especially after continued success of the ruling party at the centre in state elections. However, after this strong performance in markets and rather long wait for earnings to be delivered has meant that the equity markets are currently trading above their historical averages.
Moving into FY 2018-19, we expect a continuation of the economic recovery process domestically, recovery in corporate earnings - led early by volume growth, and continued DII flows. Government led investment spending and rural consumption are likely to lead with private sector investments contributing later (possibly
Trustees’ ReportFor the year ended March 31, 2018 (Contd...)

6
after general elections 2019). The budget document that was presented in early February provides a good medium term policy direction for the economy. Occasionally the policy actions can serve up a few bumps and jolts but over the medium term, across different governments, there is a thread of continuity connecting many key economic policies such as in the case of this year’s union budget. We, in our investment process, prefer to take comfort in these threads of continuity and remain constructive on the India growth story. This makes us positive on the Indian equity markets over the medium to long term.
Risks are in the form of market valuations trending above historical averages, weaker than expected delivery in corporate earnings going forward, external news flows related to trade protectionism, developed market central banks raising rates prematurely, and geopolitical tensions and other eco-political events would also influence market performance going forward, as the recent rally in the markets was supported by strong FII inflows.
DEBT OUTLOOKFixed Income in Financial Year 2017-18 has seen volatility further step up in this year. Markets went to perfect storm with higher crude prices, low liquidity and pressure on currency, apart from rate hike expectations.
Inflation has followed the glide path to lower numbers towards 4% RBI target and even lower than the target number when inflation printed a lowly 1.46% in June 2018 on back of lower food prices. RBI went for a cut despite of neutral stance. This positivity continued till until crude shock came in form of higher crude process. Global prices of Brent crude saw substantial increase in second half of the year, which jeopardized the inflation path. Other worries that gathered around this time were related to GST collection and eventual impact on fiscal situation.
Government of India allowed the fiscal deficit to slip to 3.5% (budget 3.2%) and kept next year target at 3.3% (in place of earlier path of 3%). This was on back of some excise relaxation for oil products and a month less collected for GST due to implementation in the current year. The fear of fiscal slippage alongwith the announcement of higher bond issuances spooked the bond markets into higher yields. Government finally borrowed only INR 90 bln extra (in place of INR 500 bln announced initially).
On the Monetary front the year was very volatile as well. RBI changed its stance to neutral causing some worry around rate hikes. Thereafter it cut rates and again went for OMO sales operations simultaneously. This created some confusion in the market participants regarding rates direction. Finally extra supply, higher oil prices and higher inflation paved way for rates higher. RBI also held position on regulatory forbearance about spreading out losses by banks publicly. It eventually gave up the position in the end of March. However, the swift changes in stance caused lot of pressure and volatility in bonds.
Liquidity situation continuously deteriorated due to OMO sales initially and withdrawal of deposits due to remonetisation. Further liquidity was absorbed out due to portfolio outflows and reduction in reserves. Despite of defense from RBI utilizing the reserves, the currency depreciated meaningfully, which caused further jitters in foreign investor sentiments. Lack of liquidity also affected 1-3 year rates which were elevated in second half of the year.
Going forward following are key variables to watch out for:• Liquidity: Liquidity will drive short end rates and eventually drive decisions leading to market interventions
and CRR cuts. RBI has focused now on neutral liquidity stance and providing liquidity to system, which will bode well short end rates.
• Inflation: Inflation numbers will determine future course of action for RBI and remains a critical variable for policy. We expect inflation to remain at 4.7% level in the ease in second half of FY 2018-19 in line with RBI’s expectations.
• Growth: GDP growth numbers as well as industrial activity will also determine the decision on policy.
• Fiscal deficit: Fiscal deficit and government spending will determine the government borrowing and crowding out in interest rate curve. We expect prudence in government spending and prospect of spending on infrastructure to pick up which will crowd in private investment as well.
• Current Account Deficit: Current Account Deficit determines how the pressure on currency works and effective management of forex reserves.
• Currency levels: Level of INR will determine how the central bank reacts to the situation on the global crisis etc.
Trustees’ ReportFor the year ended March 31, 2018 (Contd...)

7
2. Brief Background of SPonSorS, Board of truSteeS and aSSet management comPany
a. Sponsor
HSBC Mutual Fund is sponsored by HSBC Securities and Capital Markets (India) Private Limited (HSCI). The Sponsor is the Settler of the Mutual Fund Trust. The Sponsor has entrusted a sum of Rs. 1,00,000 (Rupees One Lakh only) to the Trustee as the initial contribution towards the corpus of the Mutual Fund.
HSCI offers integrated investment banking services, securities and corporate finance & advisory. HSCI is a member of the Bombay Stock Exchange Limited and National Stock Exchange (capital and derivative market segments). HSCI holds 100% of the paid up equity share capital of HSBC Asset Management (India) Private Limited.
b. HSBC Mutual Fund
HSBC Mutual Fund (“the Mutual Fund” or “the Fund”) has been constituted as a Trust in accordance with the provisions of the Indian Trusts Act, 1882 (2 of 1882) vide a Trust Deed dated February 7, 2002 with HSBC Securities and Capital Markets (India) Private Limited, as the Sponsor and the Board of Individual Trustees. The Trustee has entered into an Investment Management Agreement dated February 7, 2002 with HSBC Asset Management (India) Private Limited (AMC) to function as the Investment Manager for all the schemes of the Fund. The Fund was registered with SEBI vide registration number MF/046/02/5 dated May 27, 2002.
The Trust has been formed for the purpose of pooling of capital from the public for collective investment in securities for the purpose of providing facilities for participation by persons as beneficiaries in such investments and in the profits/income arising therefrom.
c. Board of Trustees (the Trustees)
The Board of Trustees is the exclusive owner of the Trust Fund and holds the same in trust for the benefit of the unit holders. The Trustees have been discharging their duties and carrying out the responsibilities as provided in the SEBI (Mutual Funds) Regulations, 1996 and the Trust Deed. The Trustees seek to ensure that the Fund and the schemes floated there under are managed by the AMC in accordance with the Trust Deed, the said Regulations, directions and guidelines issued by the SEBI, the Stock Exchanges, the Association of Mutual Funds in India and other regulatory agencies.
d. Asset Management Company (the AMC)
HSBC Asset Management (India) Private Limited (the Investment Manager or the AMC) is a private limited company incorporated under the Companies Act, 1956 on December 12, 2001 having its Registered Office at 16, V. N. Road, Fort, Mumbai 400 001. HSBC Asset Management (India) Private Limited has been appointed as the Asset Management Company of HSBC Mutual Fund by the Trustee vide Investment Management Agreement (IMA) dated February 7, 2002 and executed between the Trustees and the AMC. SEBI approved the AMC to act as the Investment Manager of the Fund vide its letter No. MFD/BC/163/2002 dated May 27, 2002. The paid-up equity share capital of the AMC is Rs. 61.59 crores. The AMC is registered as a Portfolio Manager under the SEBI (Portfolio Managers) Regulations, 1993 vide registration no. INP000001322. The AMC also offers non-binding Advisory services to offshore funds under the mutual fund license.
HSBC Securities and Capital Markets (India) Private Limited holds 100% of the paid up equity share capital of the AMC.
3. inveStment oBjective of the SchemeS The investment objective of the respective schemes has been provided above under the heading “Scheme
Performance, Future Outlook and Operation of the Scheme” (Refer Section 1).
4. Significant accounting PolicieS The Significant Accounting Policies form part of the Notes to the Accounts annexed to the Balance Sheet
of the Schemes in the Full Annual Report. The accounting policies are in accordance with Securities Exchange Board of India (Mutual Funds) Regulations 1996.
Trustees’ ReportFor the year ended March 31, 2018 (Contd...)

8
5. unclaimed dividendS & redemPtionS Summary of number of investors & corresponding amount Scheme-wise as on March 31, 2018.
SchemeUnclaimed Dividend Unclaimed Redemption
Amount (Rs.) No. of Investors
Amount (Rs.) No. of Investors
HSBC Low Duration Fund 45,085.38 20 77,020.65 9
6. inveStor ServiceSThe number of official points of acceptance of transactions is 205 locations. In addition to the offices of the Registrar & Transfer agents, the AMC has Investor Service Centres in 9 locations at its own offices - namely Mumbai, New Delhi, Kolkata, Bangaluru, Pune, Ahmedabad, Hyderabad, Chandigarh and Chennai. With a view to enhance customer convenience, the AMC has the facility of priority based servicing to key distributors through the enhancement of the Interactive Voice Reponses. The AMC has a single Toll Free number which can be dialed from anywhere in India. The call centre service is being managed by the Registrar and Transfer Agents.
On the distribution front, the number of empanelled distributors was 460 as on March 31, 2018. During the year, the AMC initiated tie-ups for online distribution of the Mutual Fund’s schemes with several channel partners taking the total number of such tie-ups to 42.
7. detailS of inveStor grievance redreSSalThe details of the redressal of investor complaints received against HSBC Mutual Fund during April 2017 - March 2018 are as follows:
2017-2018
Com- plaint Code
Type of complaint (a) No. of complaints
pending at the
beginning of the year
(b) No. of complaints received during
the year
Action on (a) and (b)
Resolved Non Actiona-
ble*
Pending
Within 30
days
30 - 60 days
60 - 180 days
Beyond 180 days
0 - 3 months
3 - 6 months
6 - 9 months
9 - 12 months
I A Non receipt of Dividend on Units
0 5 4 1 0 0 0 0 0 0 0
I B Interest on delayed payment of Dividend
0 0 0 0 0 0 0 0 0 0 0
I C Non receipt ofRedemption Proceeds
1 12 12 1 0 0 0 1 0 0 0
I D Interest on delayedp a y m e n t o f Redemption
0 1 1 0 0 0 0 0 0 0 0
II A Non receipt of Statement of Account / Unit Certificate
0 0 0 0 0 0 0 0 0 0 0
II B D i s c r e p a n c y i n Statement of Account
0 0 0 0 0 0 0 0 0 0 0
II C Data corrections in Investor details **
0 34 34 0 0 0 0 0 0 0 0
II D Non receipt of Annual Report /Abridged Summary
0 0 0 0 0 0 0 0 0 0 0
Trustees’ ReportFor the year ended March 31, 2018 (Contd...)

9
2017-2018
Com- plaint Code
Type of complaint (a) No. of complaints
pending at the
beginning of the year
(b) No. of complaints received during
the year
Action on (a) and (b)
Resolved Non Actiona-
ble*
Pending
Within 30
days
30 - 60 days
60 - 180 days
Beyond 180 days
0 - 3 months
3 - 6 months
6 - 9 months
9 - 12 months
III A Wrong switch between Schemes
0 0 0 0 0 0 0 0 0 0 0
III B Unauthorized switch between Schemes
0 0 0 0 0 0 0 0 0 0 0
III C Deviation from Scheme attributes
0 0 0 0 0 0 0 0 0 0 0
III D Wrong or excess charges / load
0 0 0 0 0 0 0 0 0 0 0
III E Non updat ion of changes viz. address, PAN, bank details, nomination, etc
0 6 6 0 0 0 0 0 0 0 0
IV Others 1 41 42 0 0 0 0 0 0 0 0
Total 2 99 99 2 0 0 0 0 0 0 0
Summary of Complaints for FY 2017-18
Particulars Count
Total complaints received 99
Total number of folios 140099
% of complaints against the folio 0.071%
# active folios** As per AMFI Best Practice Guidelines Circular No.25/2011-12 for Revisions in the Guidelines on
Standardization of Complaints/Grievances Reporting Procedure. If “Others” include a type of complaint which is more than 10% of overall complaints, then such a reason should be provided separately. Hence data corrections in Investor Details is included as a separate category
* Non actionable means the complaint is incomplete / outside the scope of the mutual fund
8. inveStor education initiativeS The Fund undertook various investor education and awareness initiatives related to investments in mutual funds throughout India in English / Hindi and Regional languages via mass media. The Fund conducted 16 roadshows at various locations in India to promote various Investor Awareness related topics including Asset Allocation, SIPs, Equity Mutual Funds and Financial Planning. The Fund has a Year-long tie-up with Mutual Fund Insights Magazine that includes 3 pages of content and advertorial publication in their monthly issue. Each issue contains a story promoting SIPs to achieve one’s various investment goals. In the month of December 2017 and January 2018 investor awareness promotion was done through Outlook and Outlook Money magazines through advertorials on various Mutual Fund topics.
9. Statutory detailSa) The Sponsors are not responsible or liable for any loss resulting from the operation of the Schemes of
the Fund beyond initial contribution of Rs. 1 lakh for setting up the Fund.
b) The price and redemption value of the units, and income from them, can go up as well as down with fluctuations in the market value of its underlying investments.
Trustees’ ReportFor the year ended March 31, 2018 (Contd...)

10
c) Full Annual Report shall be disclosed on the website at www.assetmanagement.hsbc.com/in and shall be available for inspection at the Head Office of the Mutual Fund. Present and prospective unit holders can obtain copy of the Trust Deed, the full Annual Report of the Scheme(s), the Annual Report of HSBC Asset Management (India) Private Limited and the text of the relevant Scheme(s) at a price.
10. acknowledgementSThe Trustees wish to thank the Unit holders of the Schemes for their support throughout the year and also thank the Government of India, the Securities and Exchange Board of India (SEBI), the Reserve Bank of India (RBI) and the Association of Mutual Funds in India (AMFI) for the guidance provided by them. The Trustees also appreciate the services provided by the Registrar and Transfer Agent, Fund Accountant, Custodian, Bankers, Distributors and Brokers. The guidance and services provided by the Auditors and advocates and the ebullience, sincerity and dedication of the employees of HSBC Asset Management (India) Private Limited is also appreciated.
The Trustees look forward to the continued support of everyone.
For and on behalf of the Board of Trustees of HSBC Mutual Fund
Sd/-
Dilip Thakkar
Trustee
Mumbai
July 17, 2018.
Trustees’ ReportFor the year ended March 31, 2018 (Contd...)

11
Independent Auditors’ Report
To the Board of Trustees
HSBC Mutual Fund – HSBC Low Duration Fund (formerly known as HSBC Ultra Short Term Bond Fund)
Report on the Financial StatementsWe have audited the accompanying Financial Statements of HSBC Low Duration Fund (formerly known as HSBC Ultra Short Term Bond Fund) (the ‘Scheme’), which comprise the balance sheet as at 31 March 2018 and the related revenue account for the year then ended, and a summary of significant accounting policies and other explanatory information, annexed thereto.
Management’s responsibility for the Financial StatementsThe Board of Trustees to the HSBC Mutual Fund (the ‘Board of Trustees’) and HSBC Asset Management (India) Private Limited (the ‘AMC’), being the investment manager to HSBC Mutual Fund (the ‘Fund’) (collectively referred as ‘Management’), are responsible for the preparation of these financial statements that give a true and fair view of the financial position and financial performance of the Scheme in accordance with the accounting policies and standards specified in the Ninth Schedule of the Securities and Exchange Board of India (Mutual Funds) Regulations, 1996, as amended (the ‘Regulations’) and the accounting principles generally accepted in India. This responsibility includes maintenance of adequate accounting records for safeguarding of the assets of the Scheme and for preventing and detecting frauds and other irregularities; selection and application of appropriate accounting policies; making judgments and estimates that are reasonable and prudent; and design, implementation and maintenance of adequate internal financial controls, that were operating effectively for ensuring the accuracy and completeness of the accounting records, relevant to the preparation and presentation of the financial statements that give a true and fair view and are free from material misstatement, whether due to fraud or error.
In preparing the financial statements, management is responsible for assessing the Scheme’s ability to continue as a going concern, disclosing, as applicable, matters related to going concern and using the going concern basis of accounting unless management either intends to liquidate the Fund or to cease operations, or has no realistic alternative but to do so.
Auditor’s responsibilityOur responsibility is to express an opinion on these financial statements based on our audit. We conducted our audit in accordance with the Standards on Auditing issued by the Institute of Chartered Accountants of India (the ‘ICAI’). Those Standards require that we comply with ethical requirements and plan and perform the audit to obtain reasonable assurance about whether the financial statements are free from material misstatement.
An audit involves performing procedures to obtain audit evidence about the amounts and disclosures in the financial statements. The procedures selected depend on the auditor’s judgment, including the assessment of the risks of material misstatement of the financial statements, whether due to fraud or error. In making those risk assessments, the auditor considers internal controls relevant to preparation and fair presentation of the financial statements, of the Scheme, in order to design audit procedures that are appropriate in the circumstances, but not for the purpose of expressing an opinion on the effectiveness of the Scheme’s internal controls. An audit also includes evaluating the appropriateness of accounting policies used and the reasonableness of the accounting estimates made by Management, as well as evaluating the overall presentation of the financial statements.
We are also responsible to conclude on the appropriateness of management’s use of the going concern basis of accounting and, based on the audit evidence obtained, whether a material uncertainty exists related to events or conditions that may cast significant doubt on the Scheme’s ability to continue as a going concern. If we conclude that a material uncertainty exists, we are required to draw attention in the auditor’s report to the related disclosures in the financial statements or, if such disclosures are inadequate, to modify the opinion. Our conclusions are based on the audit evidence obtained up to the date of the auditor’s report. However, future events or conditions may cause the Scheme to cease to continue as a going concern.
We believe that the audit evidence we have obtained is sufficient and appropriate to provide a basis for our audit opinion.

12
Independent Auditors’ Report (Contd...)
OpinionIn our opinion, and to the best of our information and according to the explanations given to us, the aforesaid financial statements give the information required by the Regulations in the manner so required and give a true and fair view in conformity with the accounting principles generally accepted in India:
(i) in the case of the balance sheet, of the state of affairs of the Scheme as at 31 March 2018; and
(ii) in the case of the revenue account, of the net surplus for the year ended on that date.
Report on other Legal and Regulatory Requirements1 As required by Regulation 55(4) to the Regulations, we report that:
(a) We have obtained all information and explanations which, to the best of our knowledge and belief, were necessary for the purposes of the audit;
(b) The balance sheet and revenue account have been prepared in accordance with the accounting policies and standards specified in the Ninth Schedule of the Regulations.
2 As required by Clause 5(ii)(2) of the Eleventh Schedule of the Regulations, we report that the balance sheet and revenue account are in agreement with the books of account of the Scheme.
3 In our opinion and on the basis of information and explanations given to us, the methods used to value non - traded securities, as at 31 March 2018, as determined by the Board of Directors of AMC, are in accordance with the Regulations and other guidelines issued by the Securities and Exchange Board of India as applicable and approved by the Board of Trustees are fair and reasonable.
For B S R & Co. LLP Chartered Accountants Firm’s Registration No: 101248W/W-100022
Milind Ranade Partner Membership No: 100564
Place : Mumbai Date : July 17, 2018.

13
Rs. in Lakhs
HSBC LOW DURATION FUNDAs at
March 31, 2018As at
March 31, 2017
LIABILITIES1 Unit Capital 46,932.24 34,479.192 Reserves & Surplus2.1 Unit Premium Reserves (1.72) (27.37)2.2 Unrealised Appreciation Reserve 53.17 55.532.3 Other Reserves 7,943.23 5,394.453 Loans & Borrowings – –4 Current Liabilities & Provisions4.1 Provision for doubtful Income/Deposits – –4.2 Other Current Liabilities & Provisions 353.70 104.67
TOTAL 55,280.62 40,006.47
ASSETS1 Investments1.1 Listed Securities:1.1.1 Equity Shares – –1.1.2 Preference Shares – –1.1.3 Equity Linked Debentures – –1.1.4 Other Debentures & Bonds 24,923.43 20,863.031.1.5 Securitised Debt securities – –1.2 Securities Awaited Listing:1.2.1 Equity Shares – –1.2.2 Preference Shares – –1.2.3 Equity Linked Debentures – –1.2.4 Other Debentures & Bonds – –1.2.5 Securitised Debt securities – –1.3 Unlisted Securities1.3.1 Equity Shares – –1.3.2 Preference Shares – –1.3.3 Equity Linked Debentures – –1.3.4 Other Debentures & Bonds 2,501.29 2,518.941.3.5 Securitised Debt securities – –1.4 Government Securities – –1.5 Treasury Bills – –1.6 Commercial Paper 7,038.79 4,951.361.7 Certificate of Deposits 16,725.62 9,542.561.8 Bill Rediscounting – –1.9 Units of Domestic Mutual Fund – –1.10 Foreign Securities – –
Total Investments 51,189.13 37,875.89
2 Deposits 34.42 5.823 Other Current Assets3.1 Cash & Bank Balance 64.96 349.693.2 CBLO/Reverse Repo Lending 2,949.34 1,040.283.3 Others 1,042.77 734.794 Deferred Revenue Expenditure (to the extent not written off) – –
TOTAL 55,280.62 40,006.47
Notes to Accounts – Annexure I
Abridged Balance Sheet as at March 31, 2018

14
Abridged Revenue Account for the year ended March 31, 2018
Rs. in Lakhs
HSBC LOW DURATION FUNDCurrent
Year ended March 31, 2018
Previous Year ended
March 31, 2017
1 INCOME1.1 Dividend – –1.2 Interest 4,201.48 3,790.561.3 Realised Gain / (Loss) on Foreign Exchange Transactions – –1.4 Realised Gains / (Losses) on Interscheme sale of investments – –1.5 Realised Gains / (Losses) on External sale / redemption of
investments(216.48) 120.75
1.6 Realised Gains / (Losses) on Derivative Transactions – –1.7 Other Income – –
(A) 3,985.00 3,911.31
2 EXPENSES2.1 Management fees 213.45 191.372.2 GST / Service tax on Management fees 37.75 28.572.3 Transfer agents fees and expenses 21.27 16.962.4 Custodian fees 3.33 2.932.5 Trusteeship fees 0.27 0.442.6 Commission to Agents 227.11 187.912.7 Marketing & Distribution expenses 0.23 0.462.8 Audit fees 0.88 0.492.9 Investor Education Expenses 10.99 9.462.10 Interest on Borrowing – –2.11 Other operating expenses 5.82 4.112.12 Expenses to be Reimbursed by the Investment Manager – –
(B) 521.10 442.70
3 NET REALISED GAINS / (LOSSES) FOR THE YEAR (A - B = C) 3,463.90 3,468.61
4 Change in Unrealised Depreciation in value of investments (D) (73.36) 26.25
5 NET GAINS / (LOSSES) FOR THE YEAR [E=(C+D)] 3,390.54 3,494.86
6 Change in unrealised appreciation in the value of investments (F) (2.36) (54.84)
7 NET SURPLUS / (DEFICIT) FOR THE YEAR (E + F = G) 3,388.18 3,440.02
7.1 Add: Balance transfer from Unrealised Appreciation Reserve 2.36 54.84
7.2 Less: Balance transfer to Unrealised Appreciation Reserve – –
7.3 Add / (Less): Equalisation 1,063.45 (880.90)
7.4 Transfer from Reserve Fund 5,394.45 4,730.13
7.5 Transfer from Unit Premium Reserve – –
8 Total 9,848.44 7,344.10
9 Dividend appropriation9.1 Income Distributed during the year (1,346.25) (1,381.79)
9.2 Tax on income distributed during the year (558.96) (567.86)
10 Retained Surplus / (Deficit) carried forward to Balance sheet 7,943.23 5,394.45
Notes to Accounts – Annexure I

15
Key Statistics for the year ended March 31, 2018
Rs. in Lakhs
HSBC LOW DURATION FUNDCurrent
Year ended March 31, 2018
Previous Year ended
March 31, 2017
1. NAV per unit (Rs.):
Open
Regular Growth Option 20.8601 19.4802
Regular Daily Dividend Option 10.0021 10.0021
Regular Weekly Dividend Option 10.0084 10.0329
Regular Monthly Dividend Option – –
Institutional Growth Option 14.3570 13.3679
Institutional Daily Dividend Option 10.0524 10.0207
Institutional Weekly Dividend Option 10.0569 10.0629
Institutional Monthly Dividend Option 10.1401 10.1658
Institutional Plus Growth Option – –
Institutional Plus Daily Dividend Option 16.1556 14.9294
Institutional Plus Weekly Dividend Option – –
Institutional Plus Monthly Dividend Option – –
Direct Plan - Growth Option 14.7759 13.6479
Direct Plan - Daily Dividend Option 10.0840 10.0840
Direct Plan - Weekly Dividend Option 10.1073 10.1137
Direct Plan - Monthly Dividend Option 10.3442 –
High
Regular Growth Option 22.1082 20.8601
Regular Daily Dividend Option 10.0033 10.0021
Regular Weekly Dividend Option 10.0257 10.0524
Regular Monthly Dividend Option – –
Institutional Growth Option 15.2587 14.3570
Institutional Daily Dividend Option 10.0524 10.0524
Institutional Weekly Dividend Option 10.0747 10.0829
Institutional Monthly Dividend Option 10.1933 10.2239
Institutional Plus Growth Option – –
Institutional Plus Daily Dividend Option 17.3014 16.1556
Institutional Plus Weekly Dividend Option – –
Institutional Plus Monthly Dividend Option – –

16
Key Statistics for the year ended March 31, 2018 (Contd...)
Rs. in Lakhs
HSBC LOW DURATION FUNDCurrent
Year ended March 31, 2018
Previous Year ended
March 31, 2017
Direct Plan - Growth Option 15.8329 14.7759
Direct Plan - Daily Dividend Option 10.0846 10.0840
Direct Plan - Weekly Dividend Option 10.1263 10.1349
Direct Plan - Monthly Dividend Option 10.4051 10.4266
Low
Regular Growth Option 20.8752 19.5088
Regular Daily Dividend Option 9.9975 9.9861
Regular Weekly Dividend Option 9.9956 9.9840
Regular Monthly Dividend Option – –
Institutional Growth Option 14.3678 13.3880
Institutional Daily Dividend Option 10.0459 10.0210
Institutional Weekly Dividend Option 10.0441 10.0295
Institutional Monthly Dividend Option 10.1255 10.1236
Institutional Plus Growth Option – –
Institutional Plus Daily Dividend Option 16.1687 14.9530
Institutional Plus Weekly Dividend Option – –
Institutional Plus Monthly Dividend Option – –
Direct Plan - Growth Option 14.7879 13.6696
Direct Plan - Daily Dividend Option 10.0779 10.0685
Direct Plan - Weekly Dividend Option 10.0944 10.0814
Direct Plan - Monthly Dividend Option 10.3288 10.1814
End
Regular Growth Option 22.1193 20.8601
Regular Daily Dividend Option 10.0083 10.0021
Regular Weekly Dividend Option 10.0184 10.0084
Regular Monthly Dividend Option – –
Institutional Growth Option 15.2668 14.3570
Institutional Daily Dividend Option 10.0571 10.0524
Institutional Weekly Dividend Option 10.0670 10.0569
Institutional Monthly Dividend Option 10.1563 10.1401
Institutional Plus Growth Option – –
Institutional Plus Daily Dividend Option 17.3116 16.1556
Institutional Plus Weekly Dividend Option – –
Institutional Plus Monthly Dividend Option – –
Direct Plan - Growth Option 15.8422 14.7759
Direct Plan - Daily Dividend Option 10.0906 10.0840
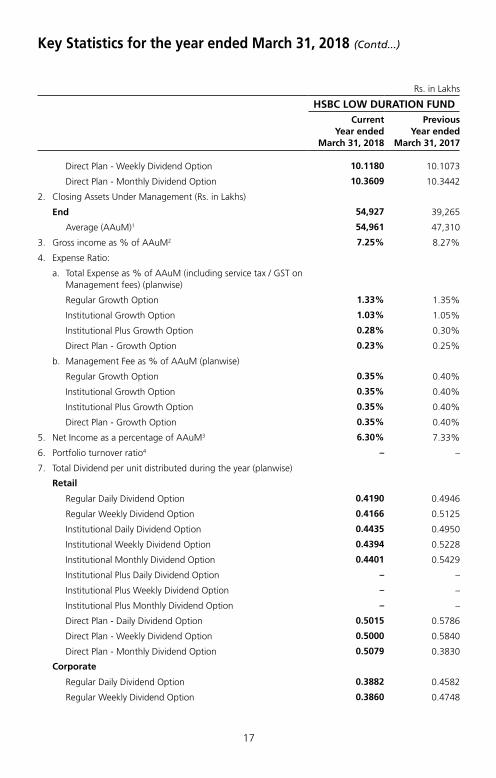
17
Rs. in Lakhs
HSBC LOW DURATION FUNDCurrent
Year ended March 31, 2018
Previous Year ended
March 31, 2017
Direct Plan - Weekly Dividend Option 10.1180 10.1073
Direct Plan - Monthly Dividend Option 10.3609 10.3442
2. Closing Assets Under Management (Rs. in Lakhs)
End 54,927 39,265
Average (AAuM)1 54,961 47,310
3. Gross income as % of AAuM2 7.25% 8.27%
4. Expense Ratio:
a. Total Expense as % of AAuM (including service tax / GST on Management fees) (planwise)
Regular Growth Option 1.33% 1.35%
Institutional Growth Option 1.03% 1.05%
Institutional Plus Growth Option 0.28% 0.30%
Direct Plan - Growth Option 0.23% 0.25%
b. Management Fee as % of AAuM (planwise)
Regular Growth Option 0.35% 0.40%
Institutional Growth Option 0.35% 0.40%
Institutional Plus Growth Option 0.35% 0.40%
Direct Plan - Growth Option 0.35% 0.40%
5. Net Income as a percentage of AAuM3 6.30% 7.33%
6. Portfolio turnover ratio4 – –
7. Total Dividend per unit distributed during the year (planwise)
Retail
Regular Daily Dividend Option 0.4190 0.4946
Regular Weekly Dividend Option 0.4166 0.5125
Institutional Daily Dividend Option 0.4435 0.4950
Institutional Weekly Dividend Option 0.4394 0.5228
Institutional Monthly Dividend Option 0.4401 0.5429
Institutional Plus Daily Dividend Option – –
Institutional Plus Weekly Dividend Option – –
Institutional Plus Monthly Dividend Option – –
Direct Plan - Daily Dividend Option 0.5015 0.5786
Direct Plan - Weekly Dividend Option 0.5000 0.5840
Direct Plan - Monthly Dividend Option 0.5079 0.3830
Corporate
Regular Daily Dividend Option 0.3882 0.4582
Regular Weekly Dividend Option 0.3860 0.4748
Key Statistics for the year ended March 31, 2018 (Contd...)
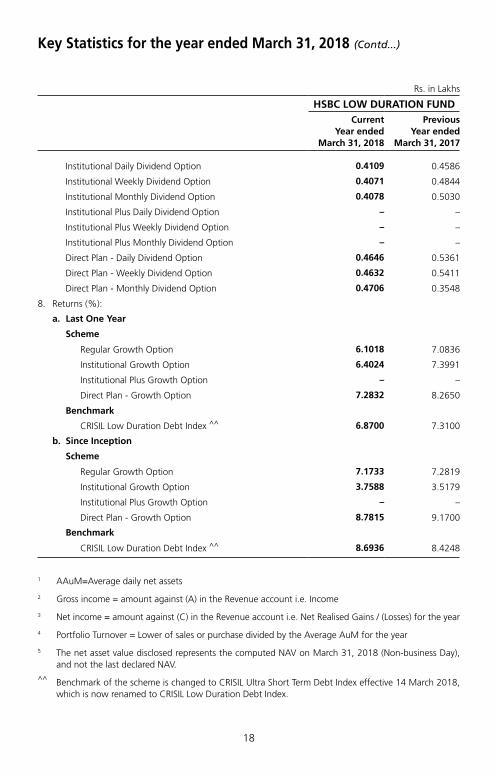
18
Rs. in Lakhs
HSBC LOW DURATION FUNDCurrent
Year ended March 31, 2018
Previous Year ended
March 31, 2017
Institutional Daily Dividend Option 0.4109 0.4586
Institutional Weekly Dividend Option 0.4071 0.4844
Institutional Monthly Dividend Option 0.4078 0.5030
Institutional Plus Daily Dividend Option – –
Institutional Plus Weekly Dividend Option – –
Institutional Plus Monthly Dividend Option – –
Direct Plan - Daily Dividend Option 0.4646 0.5361
Direct Plan - Weekly Dividend Option 0.4632 0.5411
Direct Plan - Monthly Dividend Option 0.4706 0.3548
8. Returns (%):
a. Last One Year
Scheme
Regular Growth Option 6.1018 7.0836
Institutional Growth Option 6.4024 7.3991
Institutional Plus Growth Option – –
Direct Plan - Growth Option 7.2832 8.2650
Benchmark
CRISIL Low Duration Debt Index ^^ 6.8700 7.3100
b. Since Inception
Scheme
Regular Growth Option 7.1733 7.2819
Institutional Growth Option 3.7588 3.5179
Institutional Plus Growth Option – –
Direct Plan - Growth Option 8.7815 9.1700
Benchmark
CRISIL Low Duration Debt Index ^^ 8.6936 8.4248
1 AAuM=Average daily net assets
2 Gross income = amount against (A) in the Revenue account i.e. Income
3 Net income = amount against (C) in the Revenue account i.e. Net Realised Gains / (Losses) for the year
4 Portfolio Turnover = Lower of sales or purchase divided by the Average AuM for the year
5 The net asset value disclosed represents the computed NAV on March 31, 2018 (Non-business Day), and not the last declared NAV.
^^ Benchmark of the scheme is changed to CRISIL Ultra Short Term Debt Index effective 14 March 2018, which is now renamed to CRISIL Low Duration Debt Index.
Key Statistics for the year ended March 31, 2018 (Contd...)

19
Notes to Accounts – Annexure ITo the Abridged Balance Sheet and Revenue Account for the Year ended March 31, 2018
hSBc low duration fund
1 Investments:
1.1 It is confirmed that investments of the Schemes are registered in the name of the Trustees for the benefit of the Scheme’s unitholders.
1.2 Open Positions of derivatives as of year ended March 31, 2018 is NIL. Open Positions of derivatives as of year ended March 31, 2017 is NIL.
1.3 Investments in Associates and Group Companies as of year ended March 31, 2018 and March 31, 2017:
(Rupees)
Issuer Instrument Type
Amount Aggregate Investments
by all schemes
Amount Aggregate Investments
by all schemes
2018 2017
Shriram Transport Finance Company Ltd.
Corporate Bonds / Debentures
– 651,317,500 250,541,400 1,452,436,300
Equities – – – 94,659,583
Bharti Airtel Ltd. Equities – 369,136,950 – –
Balrampur Chini Mills Ltd.
Equities – 125,227,938 – –
1.4 Open position of Securities Borrowed and / or Lent by the Scheme as of financial years ended 2018 and 2017 are NIL.
1.5 NPAs as on March 31, 2018 and March 31, 2017 are NIL.
1.6 Aggregate Unrealised Gain / Loss as at the end of the Financial years March 31, 2018 and March 31, 2017 are as under :
Company Name Amount (Rs.) Percentage to Net Assets
Amount (Rs.) Percentage to Net Assets
2018 2017
Certificate of Deposit / Commercial Paper
– Appreciation 5,317,030 0.10 1,726,265 0.04
– Depreciation – – – –
Non Convertible Debentures and Bonds Listed / Awaiting Listing
– Appreciation 1,924,043 0.04 6,190,502 0.16
– Depreciation 9,259,888 0.17 2,363,865 0.06
1.7 The aggregate value of investment securities (excluding CBLO and Reverse Repos) purchased and sold (including matured) during the financial year 2017-18 (excluding accretion of discount) are Rs. 16,332,780,115 and Rs. 15,142,993,513 respectively being 297.17% and 275.52% of the average daily net assets.
The aggregate value of investment securities (excluding CBLO and Reverse Repos) purchased and sold (including matured) during the financial year 2016 -17 (excluding accretion of discount) are Rs. 10,745,558,804 and Rs. 11,624,406,923 respectively being 227.13% and 245.71% of the average daily net assets.

20
1.8 Non-Traded securities in the portfolio :
Aggregate Value of Equity, Debt & Money Market Instruments and their percentages to Net assets are as under :
Security Category Fair Value (Rupees)
% to Net Assets
Fair Value (Rupees)
% to Net Assets
2018 2017
Debt Instruments 2,742,471,605 49.93% 2,338,197,145.00 59.55%
Money market Instruments 2,376,440,500 43.27% 1,449,392,388 36.91%
Total 5,118,912,105 93.14% 3,787,589,533 80.06%
2 Disclosure Under Regulation 25(8) of the Securities and Exchange Board of India (Mutual Funds) Regulations, 1996 as amended
Details of amounts paid to associates in terms of Regulation 25 (8) are as follows :
Commission paid to Sponsor / AMC and its associates / related parties / group companies
Name of Sponsor/AMC and its associates / related parties / group companies
Nature of Association / Nature of
Relation
Period Covered
Business Given [Rs. In Crores]
% of Total Business
received by the Fund
Commission paid [Rs.]
% of Total commission paid by the
Fund
The Hongkong and Shanghai Banking Corporation Limited
Associate 2017-2018 608.35 46.37 10,072,969 48.57
Name of Sponsor / AMC and its associates / related parties / group companies
Nature of Association / Nature of
Relation
Period Covered
Business Given [Rs. In Crores]
% of Total Business
received by the Fund
Commission paid [Rs.]
% of Total commission paid by the
Fund
The Hongkong and Shanghai Banking Corporation Limited
Associate 2016-2017 489.62 41.49 10,249,921 58.08
The brokerage paid was at rates similar to those offered to other distributors. The Commission / Brokerage paid to related party includes both upfront and trail and hence not comparable with the % of business brought and % of commission paid.
Further, The Hongkong and Shanghai Banking Corporation Limited, an associate of the Sponsor, is on the panel of bankers with whom HSBC Mutual Fund places money on fixed deposits and enters into reverse repo transactions from time to time at competitive rates.
(i) Any underwriting obligations undertaken by the Schemes of the mutual funds with respect to issue of securities associate companies - Nil (Previous year also Nil).
(ii) Devolvement - Nil (Previous year also Nil).
(iii) Subscription by the Schemes in the issues lead managed by associate companies - Nil (Previous year also Nil).
(iv) Subscription to any issue of equity or debt on private placement basis where the sponsor or its associate companies have acted as arranger or manager - Nil (Previous year also Nil).
3 None of the Investors held more than 25% of the total net assets of the Scheme at the years ended March 31, 2018 and March 31, 2017.
Notes to Accounts - Annexure I (Contd...)To the Abridged Balance Sheet and Revenue Account for the Year ended March 31, 2018

21
4 Unit Capital movement during the years ended March 31, 2018 and March 31, 2017**:
Description
2017-2018
Opening Units Subscription Redemption Closing Units Face Value per Unit (Rs.)
Regular Growth Option
800,106.746 – 82,790.077 717,316.669 10
Regular Daily Dividend Option
5,227,026.901 – 1,431,939.607 3,795,087.294 10
Regular Weekly Dividend Option
2,160,626.379 – 1,174,549.991 986,076.388 10
Institutional Growth Option
115,269,171.092 329,751,104.80 333,798,365.025 111,221,910.866 10
Institutional Daily Dividend Option
153,841,399.682 418,650,913.11 359,312,997.591 213,179,315.201 10
Institutional Weekly Dividend Option
25,223,049.222 86,939,316.52 51,014,567.430 61,147,798.311 10
Institutional Monthly Dividend Option
17,152,988.461 39,785,819.47 30,183,946.269 26,754,861.665 10
Institutional Plus Growth Option
– – – – 10
Institutional Plus Daily Dividend Option
33,942.457 – – 33,942.457 10
Institutional Plus Weekly Dividend Option
– – – – 10
Institutional Plus Monthly Dividend Option
– – – – 10
Direct Plan - Growth Option
3,458,396.36 93,227,703.01 65,508,728.572 31,177,370.802 10
Direct Plan - Daily Dividend Option
9,651,370.10 104,811,292.15 102,218,595.976 12,244,066.276 10
Direct Plan - Weekly Dividend Option
9,491,784.55 14,830,234.85 16,397,173.982 7,924,845.420 10
Direct Plan - Monthly Dividend Option
2,482,022.29 4,017,818.20 6,359,986.03 139,854.45 10
Notes to Accounts – Annexure I (Contd...)To the Abridged Balance Sheet and Revenue Account for the Year ended March 31, 2018

22
Description
2016-2017
Opening Units Subscription Redemption Closing Units Face Value per Unit (Rs.)
Regular Growth Option
846,977.339 – 46,870.593 800,106.746 10
Regular Daily Dividend Option
6,160,703.281 – 933,676.380 5,227,026.901 10
Regular Weekly Dividend Option
2,376,252.883 – 215,626.504 2,160,626.379 10
Institutional Growth Option
126,662,073.067 262,996,266.572 274,389,168.547 115,269,171.092 10
Institutional Daily Dividend Option
185,128,859.528 389,622,561.376 420,910,021.222 153,841,399.682 10
Institutional Weekly Dividend Option
29,814,574.060 54,946,443.004 59,537,967.842 25,223,049.222 10
Institutional Monthly Dividend Option
32,992,083.649 40,097,580.485 55,936,675.673 17,152,988.461 10
Institutional Plus Growth Option
– – – – 10
Institutional Plus Daily Dividend Option
200,543.261 – 166,600.80 33,942.457 10
Institutional Plus Weekly Dividend Option
– – – – 10
Institutional Plus Monthly Dividend Option
– – – – 10
Direct Plan - Growth Option
9,351,701.852 168,725,510.56 174,618,816.05 3,458,396.362 10
Direct Plan - Daily Dividend Option
4,058,074.286 53,231,912.31 47,638,616.500 9,651,370.098 10
Direct Plan - Weekly Dividend Option
10,400,628.520 9,404,324.19 10,313,168.16 9,491,784.548 10
Direct Plan - Monthly Dividend Option
– 8,405,500.57 5,923,478.28 2,482,022.29 10
** Units held by the AMC (Seed Capital) in Direct Plan Growth Option as on March 31, 2018 is 789,205.091 & as on March 31, 2017 is 395,920.436
5 Prior year amounts have been re-grouped / re-arranged where necessary.
6 No contingent liabilities for the years ended March 31, 2018 and March 31, 2017.
7 Expenses other than Management Fees are Inclusive of Service Tax where applicable.
8 Other Income of Rs. NIL (2017: NIL)
Notes to Accounts – Annexure I (Contd...)To the Abridged Balance Sheet and Revenue Account for the Year ended March 31, 2018

23
9 Investor Education Awareness
In view of the AMFI Best Practices Guidelines Circular No. 56/2015-16, the IEF ( Investor Education Fund) accrual is set aside in a separate bank account and the consolidated balance across all Schemes as on March 31, 2018. The break-up of which is as under:
Particulars March 31, 2018 Amount (in Rs. Lacs)
March 31, 2017 Amount (in Rs. Lacs)
Opening Balance 44.00 –
Add: Accrual during the year 219.83 182
Less: Transferred to AMFI 101.10 83
Less: Payable to AMFI (March accrual) 8.81 8
Add: Investment Income for the year 8.28 11
Less: Spent during the year 43.17 58
Closing Balance 119.02 44
10 Categorization and Rationalization of Schemes
Pursuant to SEBI circular no. SEBI/HO/IMD/DF3/CIR/P/2017/114 dated October 6, 2017 and SEBI circular no. SEBI/HO/IMD/DF3/CIR/P/2017/126 dated December 4, 2017 on ‘Categorization and Rationalization of Schemes’, fundamental attribute related changes were carried out in certain Schemes of HSBC Mutual Fund to align the same with the requirements specified in the aforesaid circulars effective from March 14, 2018. The said changes have been approved by the Board of Directors of the HSBC Asset Management (India) Pvt. Ltd. (the AMC) and the Board of Trustees (the Trustees). SEBI vide its letter no. IMD/DF3/OW/P/2018/89/1 dated January 2, 2018 has also conveyed it’s no objection to the said changes.
A notice-cum-addendum providing details of changes in the fundamental attributes of certain Schemes was published in the newspaper on February 3, 2018 and is also available on the website of the AMC at www.assetmanagement.hsbc.com/in. The exit window period of 30 days was provided to the investors during which no exit load was charged to investors on switches/redemptions.
Apart from the fundamental attribute changes, there has been change in the ‘type of Scheme’ for all the open ended Schemes and ‘name of Scheme’ in certain Schemes for the purposes of alignment of the existing Schemes with the provisions of the Circular. The details of the Schemes impacted is provided below:
Existing Name Revised Name Fundamental Attribute change
Benchmark Change
HSBC Ultra Short Term Bond Fund
HSBC Low Duration Fund
Yes CRISIL Low Duration Debt Index (previously named as CRISIL Ultra Short Term Debt Index) (previous benchmark CRISIL Liquid Fund Index - 90%, CRISIL Short Term Bond Fund Index (10%)
11 The Annual Accounts of the Schemes prepared in accordance with the accounting policies and standards specified in the Ninth Schedule of The Securities and Exchange Board of India (Mutual Funds) Regulations, 1996 has been approved by the Board of Directors of HSBC Asset Management (India) Private Limited and The Board of Trustees of HSBC Mutual Fund at their meetings held on July 16, 2018 and July 17, 2018 respectively. The audit report attached herewith refers to the said Annual Accounts. The aforesaid abridged accounts are an extract of the Annual Accounts and are prepared in accordance with SEBI Circular No. IMD/Cir8/132968/2008 dated July 24, 2008.
Notes to Accounts – Annexure I (Contd...)To the Abridged Balance Sheet and Revenue Account for the Year ended March 31, 2018

24
Voting Policy and Procedures
In view of SEBI guidelines related to “Role of Mutual Funds in Corporate Governance of Public Listed Companies”, AMIN has formulated its “Policy for Proxy Voting in Public Listed Companies”. The said policy and details of actual exercise of proxy votes along with the summary of votes cast and the auditors certification during the Financial Year 2017 – 18 is available on its website – http://www.assetmanagement.hsbc.com/in and in full Annual Report for the Financial Year 2017 – 18.

Statutory Details & Disclaimers
All returns have been sourced from Mutual Funds India Explorer software unless otherwise stated. With regard to equity schemes (including the equity component of MIPs), Fund performance is calculated on a total return basis (i.e. it includes dividends re-invested) while the benchmark is calculated on a price return basis (i.e. it does not consider dividends re-invested). This document has been prepared by HSBC Asset Management (India) Private Ltd (HSBC) for information purposes only and should not be construed as an offer or solicitation of an offer for purchase of any of the funds of HSBC Mutual Fund. All information contained in this document (including that sourced from third parties), is obtained from sources HSBC, the third party believes to be reliable but which it has not independently verified and HSBC, the third party makes no guarantee, representation or warranty and accepts no responsibility or liability as to the accuracy or completeness of such information. The information and opinions contained within the document are based upon publicly available information and rates of taxation applicable at the time of publication, which are subject to change from time to time. Expressions of opinion are those of HSBC only and are subject to change without notice. It does not have regard to specific investment objectives, financial situation and the particular needs of any specific person who may receive this document. Investors should seek financial advice regarding the appropriateness of investing in any securities or investment strategies that may have been discussed or recommended in this report and should understand that the views regarding future prospects may or may not be realized. Neither this document nor the units of HSBC Mutual Fund have been registered in any jurisdiction. The distribution of this document in certain jurisdictions may be restricted or totally prohibited and accordingly, persons who come into possession of this document are required to inform themselves about, and to observe, any such restrictions.
Investors should not invest in the Scheme solely based on the information provided in this document and should read the Scheme Information Document and Statement of Additional Information of the Fund for details. This document does not constitute an offering document.
No part of this publication may be reproduced, stored in a retrieval system, or transmitted, on any form or by any means, electronic, mechanical, photocopying, recording, or otherwise, without the prior written permission of HSBC Asset Management (India) Private Ltd.
Mutual Fund investments are subject to market risks, read all scheme related documents carefully.

HSBC Cash FundAn Open ended Liquid Scheme
Abridged Annual Report 2017 - 2018

1
Dear Investor,
Globally, we are witnessing a very interesting phase. The equity markets delivered a stellar performance in 2017. However, there are worries about the impact of higher rates, global trade wars, an economic growth moderation and higher volatility.
Closer home, India has become the world’s sixth-biggest economy. India has doubled its GDP to USD 2.2 trillion within a decade. The introduction of reform measures, including demonetisation and the Goods and Services Tax (GST), had put pressure on selective parts of the economy in 2017. The impact of these measures is likely to be transitory. India’s economic growth is expected to accelerate from 6.7% in FY18 to 7.4% in the current year as per IMF forecasts.
There has been a shift in the domestic savings pool supporting the market. Domestic investors have been increasing exposure to equities and financial assets moving away from gold and real estate. Mutual funds witnessed sizable inflows on the back of the boost in liquidity within the banking system from demonetisation. The AUM of the mutual fund industry grew by 21.7% in March 2018 compared to March 2017.
With growth, comes responsibility. Last year, the regulator, Securities and Exchange Board of India (SEBI) issued a circular to rationalise and categorise mutual fund schemes in India. We are pleased to state that none of our funds needed to be redesigned. All our schemes have been defined as per the new categorisation. We believe this classification will simplify investing into mutual funds and enhance comparability within the schemes offered.
As India moves to a digital age, e-commerce platforms are becoming increasingly popular. I request you to logon to our online transaction platform. It is a quick, convenient and an efficient tool to invest into our funds and manage your investments online.
At HSBC Global Asset Management, India, we are dedicated to one goal: delivering exceptional investment management for our clients. By bringing together our

2
global investment knowledge and capabilities, we are able to offer specialised expertise across asset classes. This has helped us to become a trusted partner to our individual and institutional investors.
We remain committed to our long-term perspective and disciplined investment approach as we conduct a rigorous, fundamental analysis of investments with a strong emphasis on risk management. Although the investment landscape appears favourable, it is worth remembering that markets are dynamic and constantly evolving. Therefore, we believe active, professional investment management serves investors well. Amid changing markets and economic conditions, we are confident that investors with a well-diversified portfolio and a patient, long-term outlook should be well positioned for the years ahead.
Together we thrive.
Warm regards,
Ravi Menon
Chief Executive Officer, HSBC Global Asset Management, India

3
SPONSORHSBC Securities and Capital Markets (India) Private LimitedRegd. Office: 52/60, Mahatma Gandhi Road, Fort, Mumbai - 400 001.
TRUSTEEBoard of TrusteesOffice: 16, Veer Nariman Road, Fort, Mumbai 400 001.
ASSET MANAGEMENT COMPANYHSBC Asset Management (India) Private LimitedCorp. & Regd. Office: 16, Veer Nariman Road, Fort, Mumbai 400 001.
CUSTODIANStandard Chartered Bank (SCB)Corp. & Regd. Office: Crescenzo, Securities Services, 3rd Floor, C-38/39, G-Block, Bandra Kurla Complex, Bandra East, Mumbai – 400051.
AUDITORS TO THE SCHEMEBSR & Co. LLPChartered Accountants 5th Floor, Lodha Excelus, Apollo Mills Compound, N.M. Joshi Marg, Mahalaxmi, Mumbai 400 011.
REGISTRAR & TRANSFER AGENTSComputer Age Management Services Private Limited (CAMS)Unit: HSBC Mutual Fund ’C’ Block, 2nd Floor, Hanudev Info Park P. Ltd., SF No. 558/2, Udayampalayam Road, Nava India, Coimbatore - 641 028.
BOARD OF TRUSTEESMr. Nasser Munjee
Mr. Manu Tandon
Mr. Mehli Mistri
Mr. Dilip J. Thakkar
Ms. Jasmine Batliwalla
Mr. Pedro Bastos
BOARD OF DIRECTORSMs. Kishori J. Udeshi - Chairperson
Mr. S. P. Mustafa
Mr. Dinesh Mittal
Mr. Ravi Menon - Chief Executive Officer

4
The Trustees of HSBC Mutual Fund (“Fund”) present the Sixteenth Annual Report and the audited abridged financial statements of the schemes of the Fund for the year ended March 31, 2018.
As at March 31, 2018, the Fund offered 30 schemes across asset classes to meet the varying investment needs of the investors. Notably, three Schemes of HSBC Mutual Fund viz. HSBC Large Cap Equity Fund, HSBC Short Duration Fund and HSBC Cash Fund have completed 15 years of operations during the year.
During the year, the Fund has launched Plan(s) under Fixed Term Series and carried out merger of the existing schemes viz HSBC Dividend Yield Equity Fund merged into HSBC Multi Cap Equity Fund (HMEF), erstwhile HSBC India Opportunities Fund, as offering sub-scale fund was not in the interest of the unitholders.
Further, in order to bring uniformity in the practice across Mutual Funds and to standardize the scheme categories and characteristics of schemes, SEBI vide its circular no. SEBI/HO/IMD/DF3/CIR/P/2017/114 dated October 06, 2017, issued guidelines for categorization and rationalization of Mutual Fund schemes.
Accordingly, HSBC Large Cap Equity Fund (erstwhile HSBC Equity Fund), HSBC Small Cap Equity Fund (erstwhile HSBC Mid Cap Equity Fund) , HSBC Infrastructure Equity Fund, HSBC Global Emerging Market Fund (erstwhile HSBC Emerging Market Fund), HSBC Debt Fund (erstwhile HSBC Income Fund – Investments Plan), HSBC Short Duration Fund (erstwhile HSBC Income Fund – Short Term Plan), HSBC Low Duration Fund (erstwhile HSBC Ultra Short Term Bond Fund), HSBC Regular Savings Fund (erstwhile HSBC Monthly Income Plan) and HSBC Managed Solutions have undergone fundamental attributes changes with effective from March 14, 2018.
The Fund continues its focus on delivering consistent long term returns. The comments on the performance of the Scheme(s) is provided hereinafter. Dividends were declared under various schemes as per the provisions contained in the respective Scheme Information Documents after considering the distributable surplus available under the respective Schemes. Details of dividends declared can be viewed on our website at www.assetmanagement.hsbc.com/in.
1. Scheme Performance, future outlook and oPerationS of the SchemeS
a. Operations and Performance of the Schemes
HSBC Cash Fund (HCF) (an open ended Liquid Scheme)
HCF seeks to provide reasonable returns, commensurate with low risk while providing a high level of liquidity, through a portfolio of money market and debt securities. However there can be no assurance that the Scheme’s objective can be realised.
The net assets of HCF amounted to Rs. 2,791.8 crores as at March 31, 2018 as compared to Rs. 1,850.07 crores as at March 31, 2017. The entire net asset remains invested in debt and money market instruments including reverse repos/CBLO as at March 31, 2018.
HCF performed marginally lower than its benchmark for FY 2017-2018 due to conservative investments in line with the internal group guidelines and the focus being on accruals and credit.
Scheme Name & Benchmarks
Simple Annualized Returns (%)
Absolute Returns
(%)
Compounded Annualized Returns (%)
Date of Inception : 4 December 2002
Last 7 Days as on 28 March 2018
Last 15 Days as on 28 March 2018
Last 30 Days as on 28 March 2018
1 Year 3 Years 5 Years Since Inception
HSBC Cash Fund – Growth 6.63 6.66 6.62 6.78 7.39 8.10 8.27
CRISIL Liquid Fund Index (Scheme Benchmark)
6.85 6.82 6.98 6.86 7.37 8.09 8.17
Trustees’ ReportFor the year ended March 31, 2018

5
Scheme Name & Benchmarks
Simple Annualized Returns (%)
Absolute Returns
(%)
Compounded Annualized Returns (%)
Date of Inception : 4 December 2002
Last 7 Days as on 28 March 2018
Last 15 Days as on 28 March 2018
Last 30 Days as on 28 March 2018
1 Year 3 Years 5 Years Since Inception
CRISIL 91 Day T-Bill Index (Standard Benchmark)
6.38 6.50 6.62 6.38 7.00 7.66 7.77
Rs. 10,000, if invested in HCF, would have become
10,013 10,027 10,054 10,678 12,390 14,765 17,259
Rs. 10,000, if invested in CRISIL Liquid Fund Index, would have become
10,013 10,028 10,057 10,686 12,383 14,758 17,142
Rs. 10,000, if invested in CRISIL 91 Day T-Bill Index, would have become
10,012 10,027 10,054 10,638 12,255 14,466 16,717
Past performance may or may not be sustained in future. The returns for the respective periods are provided as on last business day of March 2018 for Growth Option. Different plans shall have a different expense structure. Performance of the respective benchmark is calculated as per the Total Return Index (TRI).
b. Market Overview & Outlook (as furnished by HSBC Asset Management (India) Private Limited)
EqUITY OUTLOOKIndian equity markets continued to remain strong during fiscal year 2017-18 and posted gains of 11.76% by S&P CNX Nifty and 13.24% by BSE Midcap index respectively. Biggest drivers of the markets were, robust DII flow into equities, continued push of mega reforms – Goods and Services Tax (GST) implementation, Insolvency and Bankruptcy Code implementation, Real Estate (Regulation and Development) Act, second consecutive normal monsoon, and electoral victories of the ruling party in many state elections. On the other hand, the markets weather the storm of disruption in economy due to GST implementation, lingering impact of demonetization, muted FII flows, and rising yields in developed markets. Domestic Mutual Fund segment had their best ever year and they brought in ~USD 22 bn of net inflows in equities during the year. Even after witnessing ~USD 4.3 bn of net outflows from the domestic insurers, the net DII tally was a very impressive ~USD 17.7 bn of net inflows. There were mixed global cues well and the Foreign Institutional Investors (FIIs) net bought Indian equities worth USD 3.2 bn. The inflows by both FIIs and domestic MFs acted as a factor in the strong market performance.
Indices Returns (April 1, 2017 to March 31, 2018) 1 Year (%)
S&P BSE Sensex 12.70%
NSE CNX Nifty 11.76%
S&P BSE 100 12.12%
S&P BSE 200 12.49%
S&P BSE 500 13.21%
S&P BSE Midcap 14.31%
S&P BSE 250 Small-cap 14.13%
Source: Bloomberg (All values are total return)
Trustees’ ReportFor the year ended March 31, 2018 (Contd...)

6
Our view on the key aspects related to equity markets are presented below -
The impressive performance in equity markets during FY 2017-18 has come on the back of strong liquidity largely by domestic MFs but supported in party by FII flows, positive global growth, benign macro – both domestically and global, expectation of the continuation of favorable policy environment domestically and expectation of corporate earnings revival. Possibility of sound macro, economic reforms and implementation of existing reforms have increased, especially after continued success of the ruling party at the centre in state elections. However, after this strong performance in markets and rather long wait for earnings to be delivered has meant that the equity markets are currently trading above their historical averages.
Moving into FY 2018-19, we expect a continuation of the economic recovery process domestically, recovery in corporate earnings - led early by volume growth, and continued DII flows. Government led investment spending and rural consumption are likely to lead with private sector investments contributing later (possibly after general elections 2019). The budget document that was presented in early February provides a good medium term policy direction for the economy. Occasionally the policy actions can serve up a few bumps and jolts but over the medium term, across different governments, there is a thread of continuity connecting many key economic policies such as in the case of this year’s union budget. We, in our investment process, prefer to take comfort in these threads of continuity and remain constructive on the India growth story. This makes us positive on the Indian equity markets over the medium to long term.
Risks are in the form of market valuations trending above historical averages, weaker than expected delivery in corporate earnings going forward, external news flows related to trade protectionism, developed market central banks raising rates prematurely, and geopolitical tensions and other eco-political events would also influence market performance going forward, as the recent rally in the markets was supported by strong FII inflows.
DEBT OUTLOOKFixed Income in Financial Year 2017-18 has seen volatility further step up in this year. Markets went to perfect storm with higher crude prices, low liquidity and pressure on currency, apart from rate hike expectations.
Inflation has followed the glide path to lower numbers towards 4% RBI target and even lower than the target number when inflation printed a lowly 1.46% in June 2018 on back of lower food prices. RBI went for a cut despite of neutral stance. This positivity continued till until crude shock came in form of higher crude process. Global prices of Brent crude saw substantial increase in second half of the year, which jeopardized the inflation path. Other worries that gathered around this time were related to GST collection and eventual impact on fiscal situation.
Government of India allowed the fiscal deficit to slip to 3.5% (budget 3.2%) and kept next year target at 3.3% (in place of earlier path of 3%). This was on back of some excise relaxation for oil products and a month less collected for GST due to implementation in the current year. The fear of fiscal slippage alongwith the announcement of higher bond issuances spooked the bond markets into higher yields. Government finally borrowed only INR 90 bln extra (in place of INR 500 bln announced initially).
On the Monetary front the year was very volatile as well. RBI changed its stance to neutral causing some worry around rate hikes. Thereafter it cut rates and again went for OMO sales operations simultaneously. This created some confusion in the market participants regarding rates direction. Finally extra supply, higher oil prices and higher inflation paved way for rates higher. RBI also held position on regulatory forbearance about spreading out losses by banks publicly. It eventually gave up the position in the end of March. However, the swift changes in stance caused lot of pressure and volatility in bonds.
Liquidity situation continuously deteriorated due to OMO sales initially and withdrawal of deposits due to remonetisation. Further liquidity was absorbed out due to portfolio outflows and reduction in reserves. Despite of defense from RBI utilizing the reserves, the currency depreciated meaningfully, which caused further jitters in foreign investor sentiments. Lack of liquidity also affected 1-3 year rates which were elevated in second half of the year.
Going forward following are key variables to watch out for:• Liquidity: Liquidity will drive short end rates and eventually drive decisions leading to market interventions
and CRR cuts. RBI has focused now on neutral liquidity stance and providing liquidity to system, which will bode well short end rates.
Trustees’ ReportFor the year ended March 31, 2018 (Contd...)

7
• Inflation: Inflation numbers will determine future course of action for RBI and remains a critical variable for policy. We expect inflation to remain at 4.7% level in the ease in second half of FY 2018-19 in line with RBI’s expectations.
• Growth: GDP growth numbers as well as industrial activity will also determine the decision on policy.
• Fiscal deficit: Fiscal deficit and government spending will determine the government borrowing and crowding out in interest rate curve. We expect prudence in government spending and prospect of spending on infrastructure to pick up which will crowd in private investment as well.
• Current Account Deficit: Current Account Deficit determines how the pressure on currency works and effective management of forex reserves.
• Currency levels: Level of INR will determine how the central bank reacts to the situation on the global crisis etc.
2. Brief Background of SPonSorS, Board of truSteeS and aSSet management comPany
a. Sponsor
HSBC Mutual Fund is sponsored by HSBC Securities and Capital Markets (India) Private Limited (HSCI). The Sponsor is the Settler of the Mutual Fund Trust. The Sponsor has entrusted a sum of Rs. 1,00,000 (Rupees One Lakh only) to the Trustee as the initial contribution towards the corpus of the Mutual Fund.
HSCI offers integrated investment banking services, securities and corporate finance & advisory. HSCI is a member of the Bombay Stock Exchange Limited and National Stock Exchange (capital and derivative market segments). HSCI holds 100% of the paid up equity share capital of HSBC Asset Management (India) Private Limited.
b. HSBC Mutual Fund
HSBC Mutual Fund (“the Mutual Fund” or “the Fund”) has been constituted as a Trust in accordance with the provisions of the Indian Trusts Act, 1882 (2 of 1882) vide a Trust Deed dated February 7, 2002 with HSBC Securities and Capital Markets (India) Private Limited, as the Sponsor and the Board of Individual Trustees. The Trustee has entered into an Investment Management Agreement dated February 7, 2002 with HSBC Asset Management (India) Private Limited (AMC) to function as the Investment Manager for all the schemes of the Fund. The Fund was registered with SEBI vide registration number MF/046/02/5 dated May 27, 2002.
The Trust has been formed for the purpose of pooling of capital from the public for collective investment in securities for the purpose of providing facilities for participation by persons as beneficiaries in such investments and in the profits/income arising therefrom.
c. Board of Trustees (the Trustees)
The Board of Trustees is the exclusive owner of the Trust Fund and holds the same in trust for the benefit of the unit holders. The Trustees have been discharging their duties and carrying out the responsibilities as provided in the SEBI (Mutual Funds) Regulations, 1996 and the Trust Deed. The Trustees seek to ensure that the Fund and the schemes floated there under are managed by the AMC in accordance with the Trust Deed, the said Regulations, directions and guidelines issued by the SEBI, the Stock Exchanges, the Association of Mutual Funds in India and other regulatory agencies.
d. Asset Management Company (the AMC)
HSBC Asset Management (India) Private Limited (the Investment Manager or the AMC) is a private limited company incorporated under the Companies Act, 1956 on December 12, 2001 having its Registered Office at 16, V. N. Road, Fort, Mumbai 400 001. HSBC Asset Management (India) Private Limited has been appointed as the Asset Management Company of HSBC Mutual Fund by the Trustee vide Investment Management Agreement (IMA) dated February 7, 2002 and executed between the Trustees and the AMC. SEBI approved the AMC to act as the Investment Manager of the Fund vide its letter No. MFD/BC/163/2002 dated May 27, 2002. The paid-up equity share capital of the AMC is Rs. 61.59 crores. The AMC is registered as a Portfolio Manager under the SEBI (Portfolio Managers) Regulations, 1993 vide
Trustees’ ReportFor the year ended March 31, 2018 (Contd...)
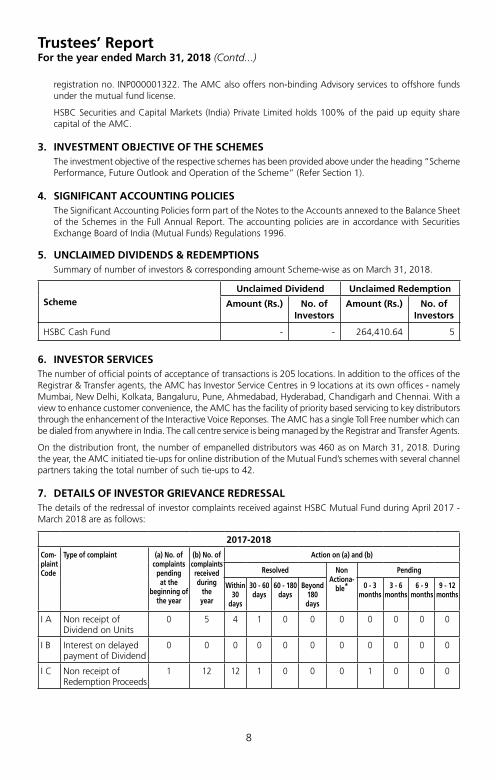
8
registration no. INP000001322. The AMC also offers non-binding Advisory services to offshore funds under the mutual fund license.
HSBC Securities and Capital Markets (India) Private Limited holds 100% of the paid up equity share capital of the AMC.
3. inveStment oBjective of the SchemeS The investment objective of the respective schemes has been provided above under the heading “Scheme
Performance, Future Outlook and Operation of the Scheme” (Refer Section 1).
4. Significant accounting PolicieS The Significant Accounting Policies form part of the Notes to the Accounts annexed to the Balance Sheet
of the Schemes in the Full Annual Report. The accounting policies are in accordance with Securities Exchange Board of India (Mutual Funds) Regulations 1996.
5. unclaimed dividendS & redemPtionS Summary of number of investors & corresponding amount Scheme-wise as on March 31, 2018.
SchemeUnclaimed Dividend Unclaimed Redemption
Amount (Rs.) No. of Investors
Amount (Rs.) No. of Investors
HSBC Cash Fund - - 264,410.64 5
6. inveStor ServiceSThe number of official points of acceptance of transactions is 205 locations. In addition to the offices of the Registrar & Transfer agents, the AMC has Investor Service Centres in 9 locations at its own offices - namely Mumbai, New Delhi, Kolkata, Bangaluru, Pune, Ahmedabad, Hyderabad, Chandigarh and Chennai. With a view to enhance customer convenience, the AMC has the facility of priority based servicing to key distributors through the enhancement of the Interactive Voice Reponses. The AMC has a single Toll Free number which can be dialed from anywhere in India. The call centre service is being managed by the Registrar and Transfer Agents.
On the distribution front, the number of empanelled distributors was 460 as on March 31, 2018. During the year, the AMC initiated tie-ups for online distribution of the Mutual Fund’s schemes with several channel partners taking the total number of such tie-ups to 42.
7. detailS of inveStor grievance redreSSalThe details of the redressal of investor complaints received against HSBC Mutual Fund during April 2017 - March 2018 are as follows:
2017-2018
Com- plaint Code
Type of complaint (a) No. of complaints
pending at the
beginning of the year
(b) No. of complaints received during
the year
Action on (a) and (b)
Resolved Non Actiona-
ble*
Pending
Within 30
days
30 - 60 days
60 - 180 days
Beyond 180 days
0 - 3 months
3 - 6 months
6 - 9 months
9 - 12 months
I A Non receipt of Dividend on Units
0 5 4 1 0 0 0 0 0 0 0
I B Interest on delayed payment of Dividend
0 0 0 0 0 0 0 0 0 0 0
I C Non receipt ofRedemption Proceeds
1 12 12 1 0 0 0 1 0 0 0
Trustees’ ReportFor the year ended March 31, 2018 (Contd...)

9
2017-2018
Com- plaint Code
Type of complaint (a) No. of complaints
pending at the
beginning of the year
(b) No. of complaints received during
the year
Action on (a) and (b)
Resolved Non Actiona-
ble*
Pending
Within 30
days
30 - 60 days
60 - 180 days
Beyond 180 days
0 - 3 months
3 - 6 months
6 - 9 months
9 - 12 months
I D Interest on delayedpayment of Redemption
0 1 1 0 0 0 0 0 0 0 0
II A Non receipt of Statement of Account / Unit Certificate
0 0 0 0 0 0 0 0 0 0 0
II B D i s c r e p a n c y i n Statement of Account
0 0 0 0 0 0 0 0 0 0 0
II C Data corrections in Investor details **
0 34 34 0 0 0 0 0 0 0 0
II D Non receipt of Annual Report /Abridged Summary
0 0 0 0 0 0 0 0 0 0 0
III A Wrong switch between Schemes
0 0 0 0 0 0 0 0 0 0 0
III B Unauthorized switch between Schemes
0 0 0 0 0 0 0 0 0 0 0
III C Deviation from Scheme attributes
0 0 0 0 0 0 0 0 0 0 0
III D Wrong or excess charges / load
0 0 0 0 0 0 0 0 0 0 0
III E Non updat ion of changes viz. address, PAN, bank details, nomination, etc
0 6 6 0 0 0 0 0 0 0 0
IV Others 1 41 42 0 0 0 0 0 0 0 0
Total 2 99 99 2 0 0 0 0 0 0 0
Summary of Complaints for FY 2017-18
Particulars Count
Total complaints received 99
Total number of folios 140099
% of complaints against the folio 0.071%
# active folios** As per AMFI Best Practice Guidelines Circular No. 25/2011-12 for Revisions in the Guidelines on
Standardization of Complaints/Grievances Reporting Procedure. If “Others” include a type of complaint which is more than 10% of overall complaints, then such a reason should be provided separately. Hence data corrections in Investor Details is included as a separate category
* Non actionable means the complaint is incomplete / outside the scope of the mutual fund
Trustees’ ReportFor the year ended March 31, 2018 (Contd...)

10
8. inveStor education initiativeS The Fund undertook various investor education and awareness initiatives related to investments in mutual funds throughout India in English / Hindi and Regional languages via mass media. The Fund conducted 16 roadshows at various locations in India to promote various Investor Awareness related topics including Asset Allocation, SIPs, Equity Mutual Funds and Financial Planning. The Fund has a Year-long tie-up with Mutual Fund Insights Magazine that includes 3 pages of content and advertorial publication in their monthly issue. Each issue contains a story promoting SIPs to achieve one’s various investment goals. In the month of December 2017 and January 2018 investor awareness promotion was done through Outlook and Outlook Money magazines through advertorials on various Mutual Fund topics.
9. Statutory detailSa) The Sponsors are not responsible or liable for any loss resulting from the operation of the Schemes of
the Fund beyond initial contribution of Rs. 1 lakh for setting up the Fund.
b) The price and redemption value of the units, and income from them, can go up as well as down with fluctuations in the market value of its underlying investments.
c) Full Annual Report shall be disclosed on the website at www.assetmanagement.hsbc.com/in and shall be available for inspection at the Head Office of the Mutual Fund. Present and prospective unit holders can obtain copy of the Trust Deed, the full Annual Report of the Scheme(s), the Annual Report of HSBC Asset Management (India) Private Limited and the text of the relevant Scheme(s) at a price.
10. acknowledgementSThe Trustees wish to thank the Unit holders of the Schemes for their support throughout the year and also thank the Government of India, the Securities and Exchange Board of India (SEBI), the Reserve Bank of India (RBI) and the Association of Mutual Funds in India (AMFI) for the guidance provided by them. The Trustees also appreciate the services provided by the Registrar and Transfer Agent, Fund Accountant, Custodian, Bankers, Distributors and Brokers. The guidance and services provided by the Auditors and advocates and the ebullience, sincerity and dedication of the employees of HSBC Asset Management (India) Private Limited is also appreciated.
The Trustees look forward to the continued support of everyone.
For and on behalf of the Board of Trustees of HSBC Mutual Fund
Sd/-
Dilip Thakkar
Trustee
Mumbai
July 17, 2018.
Trustees’ ReportFor the year ended March 31, 2018 (Contd...)

11
Independent Auditors’ Report
To the Board of Trustees of
HSBC Mutual Fund - HSBC Cash Fund
Report on the Financial StatementsWe have audited the accompanying Financial Statements of HSBC Cash Fund (the ‘Scheme’), which comprise the balance sheet as at 31 March 2018, the related revenue account and the cash flow statement for the year then ended, and a summary of significant accounting policies and other explanatory information, annexed thereto.
Management’s responsibility for the Financial StatementsThe Board of Trustees to the HSBC Mutual Fund (the ‘Board of Trustees’) and HSBC Asset Management (India) Private Limited (the ‘AMC’), being the investment manager to HSBC Mutual Fund (the ‘Fund’) (collectively referred as ‘Management’), are responsible for the preparation of these financial statements that give a true and fair view of the financial position and financial performance of the Scheme in accordance with the accounting policies and standards specified in the Ninth Schedule of the Securities and Exchange Board of India (Mutual Funds) Regulations, 1996, as amended (the ‘Regulations’) and the accounting principles generally accepted in India. This responsibility includes maintenance of adequate accounting records for safeguarding of the assets of the Scheme and for preventing and detecting frauds and other irregularities; selection and application of appropriate accounting policies; making judgments and estimates that are reasonable and prudent; and design, implementation and maintenance of adequate internal financial controls, that were operating effectively for ensuring the accuracy and completeness of the accounting records, relevant to the preparation and presentation of the financial statements that give a true and fair view and are free from material misstatement, whether due to fraud or error.
In preparing the financial statements, management is responsible for assessing the Scheme’s ability to continue as a going concern, disclosing, as applicable, matters related to going concern and using the going concern basis of accounting unless management either intends to liquidate the Fund or to cease operations, or has no realistic alternative but to do so.
Auditor’s responsibilityOur responsibility is to express an opinion on these financial statements based on our audit. We conducted our audit in accordance with the Standards on Auditing issued by the Institute of Chartered Accountants of India (the ‘ICAI’). Those Standards require that we comply with ethical requirements and plan and perform the audit to obtain reasonable assurance about whether the financial statements are free from material misstatement.
An audit involves performing procedures to obtain audit evidence about the amounts and disclosures in the financial statements. The procedures selected depend on the auditor’s judgment, including the assessment of the risks of material misstatement of the financial statements, whether due to fraud or error. In making those risk assessments, the auditor considers internal controls relevant to preparation and fair presentation of the financial statements, of the Scheme, in order to design audit procedures that are appropriate in the circumstances, but not for the purpose of expressing an opinion on the effectiveness of the Scheme’s internal controls. An audit also includes evaluating the appropriateness of accounting policies used and the reasonableness of the accounting estimates made by Management, as well as evaluating the overall presentation of the financial statements.
We are also responsible to conclude on the appropriateness of management’s use of the going concern basis of accounting and, based on the audit evidence obtained, whether a material uncertainty exists related to events or conditions that may cast significant doubt on the Scheme’s ability to continue as a going concern. If we conclude that a material uncertainty exists, we are required to draw attention in the auditor’s report to the related disclosures in the financial statements or, if such disclosures are inadequate, to modify the opinion. Our conclusions are based on the audit evidence obtained up to the date of the auditor’s report. However, future events or conditions may cause the Scheme to cease to continue as a going concern.
We believe that the audit evidence we have obtained is sufficient and appropriate to provide a basis for our audit opinion.
12
OpinionIn our opinion, and to the best of our information and according to the explanations given to us, the aforesaid financial statements give the information required by the Regulations in the manner so required and give a true and fair view in conformity with the accounting principles generally accepted in India:
(i) in the case of the balance sheet, of the state of affairs of the Scheme as at 31 March 2018;
(ii) in the case of the revenue account, of the net surplus for the year ended on that date; and
(iii) in the case of the cash flow statement, of the cash flows of the Scheme for the year ended on that date.
Report on other Legal and Regulatory Requirements1 As required by Regulation 55(4) to the Regulations, we report that:
(a) We have obtained all information and explanations which, to the best of our knowledge and belief, were necessary for the purposes of the audit;
(b) The balance sheet and revenue account have been prepared in accordance with the accounting policies and standards specified in the Ninth Schedule of the Regulations.
2 As required by Clause 5(ii)(2) of the Eleventh Schedule of the Regulations, we report that the balance sheet and revenue account are in agreement with the books of account of the Scheme.
3 In our opinion and on the basis of information and explanations given to us, the methods used to value non - traded securities, as at 31 March 2018, as determined by the Board of Directors of AMC, are in accordance with the Regulations and other guidelines issued by the Securities and Exchange Board of India as applicable and approved by the Board of Trustees are fair and reasonable.
For B S R & Co. LLP Chartered Accountants Firm’s Registration No: 101248W/W-100022
Sd/-
Milind Ranade Partner Membership No: 100564
Place : Mumbai Date : July 17, 2018.
Independent Auditors’ Report (Contd...)

13
Rs. in Lakhs
HSBC CASH FUNDAs at March
31, 2018As at March
31, 2017
LIABILITIES1 Unit Capital 205,248.21 150,672.19 2 Reserves & Surplus2.1 Unit Premium Reserves 1,881.99 1,787.34 2.2 Unrealised Appreciation Reserve 154.23 24.05
2.3 Other Reserves 71,895.83 32,540.35 3 Loans & Borrowings 31,075.00 21,500.00 4 Current Liabilities & Provisions4.1 Provision for doubtful Income/Deposits – – 4.2 Other Current Liabilities & Provisions 325.03 10,256.48
TOTAL 310,580.29 216,780.41
ASSETS1 Investments1.1 Listed Securities:1.1.1 Equity Shares – – 1.1.2 Preference Shares – – 1.1.3 Equity Linked Debentures – – 1.1.4 Other Debentures & Bonds – – 1.1.5 Securitised Debt securities – – 1.2 Securities Awaited Listing:1.2.1 Equity Shares – – 1.2.2 Preference Shares – – 1.2.3 Equity Linked Debentures – – 1.2.4 Other Debentures & Bonds – – 1.2.5 Securitised Debt securities – – 1.3 Unlisted Securities1.3.1 Equity Shares – – 1.3.2 Preference Shares – – 1.3.3 Equity Linked Debentures – – 1.3.4 Other Debentures & Bonds – – 1.3.5 Securitised Debt securities – – 1.4 Government Securities – 1.5 Treasury Bills – – 1.6 Commercial Paper 176,049.76 123,266.91 1.7 Certificate of Deposits 101,501.05 81,765.90 1.8 Bill Rediscounting – – 1.9 Units of Domestic Mutual Fund – – 1.10 Foreign Securities – –
Total Investments 277,550.81 205,032.81
2 Deposits 32,867.99 10,309.81 3 Other Current Assets3.1 Cash & Bank Balance 26.91 1,421.76 3.2 CBLO/Reverse Repo Lending 13.99 – 3.3 Others 120.59 16.03 4 Deferred Revenue Expenditure (to the extent not written off) – –
TOTAL 310,580.29 216,780.41
Notes to Accounts - Annexure I
Abridged Balance Sheet as at March 31, 2018

14
Abridged Revenue Account for the year ended March 31, 2018
Rs. in Lakhs
HSBC CASH FUNDCurrent
Year ended March 31, 2018
Previous Year ended
March 31, 2017
1 INCOME1.1 Dividend – – 1.2 Interest 28,156.62 15,866.30 1.3 Realised Gain / (Loss) on Foreign Exchange Transactions – – 1.4 Realised Gains / (Losses) on Interscheme sale of investments – – 1.5 Realised Gains / (Losses) on External sale / redemption of
investments (3.22) 14.18
1.6 Realised Gains / (Losses) on Derivative Transactions – – 1.7 Other Income – 0.66
(A) 28,153.40 15,881.14
2 EXPENSES2.1 Management fees 131.58 50.04 2.2 Service tax on Management fees 23.60 7.51 2.3 Transfer agents fees and expenses 80.08 40.92 2.4 Custodian fees 10.21 6.34 2.5 Trusteeship fees 2.05 2.28 2.6 Commission to Agents 63.01 45.87 2.7 Marketing & Distribution expenses 0.28 2.47 2.8 Audit fees 5.23 4.82 2.9 Investor Education Expenses 105.85 66.48 2.10 Interest on Borrowing 73.49 11.862.11 Other operating expenses 31.07 24.27 2.12 Expenses to be Reimbursed by the Investment Manager – –
(B) 526.45 262.86
3 NET REALISED GAINS / (LOSSES) FOR THE YEAR (A–B=C) 27,626.95 15,618.28
4 Change in Unrealised Depreciation in value of investments (D) – –
5 NET GAINS / (LOSSES) FOR THE YEAR [E=(C+D)] 27,626.95 15,618.28
6 Change in unrealised appreciation in the value of investments (F) 130.17 (51.86)
7 NET SURPLUS / (DEFICIT) FOR THE YEAR (E+F=G) 27,757.12 15,566.42
7.1 Add: Balance transfer from Unrealised Appreciation Reserve – 51.86
7.2 Less: Balance transfer to Unrealised Appreciation Reserve 130.17 – 7.3 Add / (Less): Equalisation 20,038.38 3,978.09 7.4 Transfer from Reserve Fund 32,540.35 18,613.00 7.5 Transfer from Unit Premium Reserve – –
8 Total 80,205.68 38,209.37
9 Dividend appropriation9.1 Income Distributed during the year (5,673.17) (3,847.54)9.2 Tax on income distributed during the year (2,636.68) (1,821.48)
10 Retained Surplus / (Deficit) carried forward to Balance sheet 71,895.83 32,540.35
Notes to Accounts – Annexure I

15
Key Statistics for the year ended March 31, 2018
HSBC CASH FUNDCurrent
Year ended March 31, 2018
Previous Year ended
March 31, 2017
1. NAV per unit (Rs.): Open
Regular Growth Option 2,443.1533 2,298.8714 Regular Daily Dividend Option 1,019.3000 1,019.3000 Regular Weekly Dividend Option 1,001.9877 1,002.5519 Institutional Growth Option 2,554.6040 2,388.1672 Institutional Daily Dividend Option 1,202.8387 1,124.4110 Institutional Plus Growth Option 1,616.9837 1,508.3028 Institutional Plus Daily Dividend Option 1,000.5600 1,000.5600 Institutional Plus Weekly Dividend Option 1,111.0123 1,111.6391 Institutional Plus Monthly Dividend Option 1,001.0652 1,001.3295 Direct Plan – Growth Option 1,620.1903 1,510.3819 Direct Plan – Daily Dividend Option 1,000.5600 1,000.5600 Direct Plan – Weekly Dividend Option 1,111.0173 1,111.6463 Direct Plan – Monthly Dividend Option 1,009.1530 1,001.5205 Unclaimed Dividend less than 3 yrs 1,067.3816 – Unclaimed Dividend more than 3 yrs 1,000.0000 – Unclaimed Redemption less than 3 yrs 1,067.3816 – Unclaimed Redemption more than 3 yrs 1,000.0000 –
highRegular Growth Option 2,584.8625 2,443.1533 Regular Daily Dividend Option 1,019.3000 1,019.3000 Regular Weekly Dividend Option 1,002.9218 1,003.6299 Institutional Growth Option 2,720.2575 2,554.6040 Institutional Daily Dividend Option 1,280.8164 1,202.8387 Institutional Plus Growth Option 1,725.5228 1,616.9837 Institutional Plus Daily Dividend Option 1,000.6702 1,000.5600 Institutional Plus Weekly Dividend Option 1,112.1786 1,112.9701 Institutional Plus Monthly Dividend Option 1,006.2660 1,006.9700 Direct Plan – Growth Option 1,729.9739 1,620.1903 Direct Plan – Daily Dividend Option 1,000.6485 1,000.5600 Direct Plan – Weekly Dividend Option 1,112.1928 1,112.9925 Direct Plan – Monthly Dividend Option 1,026.5556 1,013.4196 Unclaimed Dividend less than 3 yrs 1,118.7687 1,067.3816 Unclaimed Dividend more than 3 yrs 1,000.3613 1,000.0000 Unclaimed Redemption less than 3 yrs 1,118.7687 1,067.3816 Unclaimed Redemption more than 3 yrs 1,000.3613 1,000.0000
LowRegular Growth Option 2,443.8858 2,300.2996 Regular Daily Dividend Option 1,019.3000 1,019.3000 Regular Weekly Dividend Option 1,001.7026 1,001.6255 Institutional Growth Option 2,555.4608 2,389.7785 Institutional Daily Dividend Option 1,203.2419 1,125.1698 Institutional Plus Growth Option 1,617.5456 1,509.3503 Institutional Plus Daily Dividend Option 1,000.5600 1,000.5600 Institutional Plus Weekly Dividend Option 1,110.6701 1,110.5845

16
Key Statistics for the year ended March 31, 2018 (Contd...)
HSBC CASH FUNDCurrent
Year ended March 31, 2018
Previous Year ended
March 31, 2017
Institutional Plus Monthly Dividend Option 1,000.4140 1,000.4252 Direct Plan – Growth Option 1,620.7586 1,511.4432 Direct Plan – Daily Dividend Option 1,000.5600 1,000.5600 Direct Plan – Weekly Dividend Option 1,110.6731 1,110.5876 Direct Plan – Monthly Dividend Option 1,008.4911 1,000.7940 Unclaimed Dividend less than 3 yrs 1,067.7279 1,010.2729 Unclaimed Dividend more than 3 yrs 1,000.0000 1,000.0000 Unclaimed Redemption less than 3 yrs 1,067.7279 1,010.2729 Unclaimed Redemption more than 3 yrs 1,000.0000 1,000.0000
endRegular Growth Option 2,586.1945 2,443.1533 Regular Daily Dividend Option 1,019.8252 1,019.3000 Regular Weekly Dividend Option 1,002.6960 1,001.9877 Institutional Growth Option 2,721.8046 2,554.6040 Institutional Daily Dividend Option 1,281.5438 1,202.8387 Institutional Plus Growth Option 1,726.5340 1,616.9837 Institutional Plus Daily Dividend Option 1,001.2566 1,000.5600 Institutional Plus Weekly Dividend Option 1,111.8487 1,111.0123 Institutional Plus Monthly Dividend Option 1,001.6750 1,001.0652 Direct Plan – Growth Option 1,730.9962 1,620.1903 Direct Plan – Daily Dividend Option 1,001.2398 1,000.5600 Direct Plan – Weekly Dividend Option 1,111.8585 1,111.0173 Direct Plan – Monthly Dividend Option 1,027.1622 1,009.1530 Unclaimed Dividend less than 3 yrs 1,135.5397 1,067.3816 Unclaimed Dividend more than 3 yrs 1,000.5564 1,000.0000 Unclaimed Redemption less than 3 yrs 1,135.5397 1,067.3816 Unclaimed Redemption more than 3 yrs 1,000.5564 1,000.0000
2. Closing Assets Under Management (Rs. in Lakhs)
End 279,180 185,007 Average (AAuM)1 423,407 224,522
3. Gross income as % of AAuM2 6.65% 7.07%
4. Expense Ratio:
a. Total Expense as % of AAuM (including service tax / GST on Management fees) (planwise)Regular Plan 1.03% 1.00%Institutional Plan 0.38% 0.35%Institutional Plus Plan 0.15% 0.13%Direct Plan 0.10% 0.07%
b. Management Fee as % of AAuM (planwise) Regular Plan 0.03% 0.02% Institutional Plan 0.03% 0.02% Institutional Plus Plan 0.03% 0.02% Direct Plan 0.03% 0.02%
5. Net Income as a percentage of AAuM3 6.52% 6.96%

17
HSBC CASH FUNDCurrent
Year ended March 31, 2018
Previous Year ended
March 31, 2017
6. Portfolio turnover ratio4 – –
7. Total Dividend per unit distributed during the year (planwise) Retail Regular Daily Dividend Option 41.5182 44.8188
Regular Weekly Dividend Option 40.6784 44.4765 Institutional Plus Daily Dividend Option 46.8766 50.2851 Institutional Plus Weekly Dividend Option 52.0071 56.2965 Institutional Plus Monthly Dividend Option 47.0512 50.6109 Direct Plan – Daily Dividend Option 47.3225 50.7074 Direct Plan – Weekly Dividend Option 52.4933 56.7886 Direct Plan – Monthly Dividend Option 35.4050 45.4206
corporateRegular Daily Dividend Option 38.4658 41.5239 Regular Weekly Dividend Option 37.6878 41.2067 Institutional Plus Daily Dividend Option 43.4303 46.5882 Institutional Plus Weekly Dividend Option 48.1836 52.1577 Institutional Plus Monthly Dividend Option 43.5920 46.8900 Direct Plan – Daily Dividend Option 43.8434 46.9795 Direct Plan – Weekly Dividend Option 48.6341 52.6135 Direct Plan – Monthly Dividend Option 32.8021 42.0813
8. Returns (%):
a. Last One Year Scheme Regular Growth Option 5.8599 6.2762
Institutional Growth Option 6.7802 6.9692 Institutional Plus Growth Option 6.5502 7.2055 Direct Plan – Growth Option 6.8443 7.2702 Benchmark CRISIL Liquid Fund Index 6.8600 7.1141 b. Since Inception Scheme Regular Growth Option 6.3937 6.4314 Institutional Growth Option 4.0233 6.8293 Institutional Plus Growth Option 6.8095 3.8141 Direct Plan – Growth Option 8.1838 8.5015 Benchmark CRISIL Liquid Fund Index 8.1665 8.3914
1. AAuM=Average daily net assets2. Gross income = amount against (A) in the Revenue account i.e. Income3. Net income = amount against (C) in the Revenue account i.e. Net Realised Gains / (Losses) for the year4. Portfolio Turnover = Lower of sales or purchase divided by the Average AuM for the year5. The net asset value disclosed represents the computed NAV on March 31, 2018 (Non-business Day),
and not the last declared NAV
Key Statistics for the year ended March 31, 2018 (Contd...)

18
Notes to Accounts – Annexure ITo the Abridged Balance Sheet and Revenue Account for the year ended March 31, 2018
hSBc caSh fund
1 Investments:-
1.1. It is confirmed that investments of the Schemes are registered in the name of the Trustees for the benefit of the Scheme’s unitholders.
1.2. Open Positions of derivatives as of year ended March 31, 2018 and March 31, 2017 end are NIL.
1.3. Investments in Associates and Group Companies :
(Rupees)
Issuer Instrument Type
Amount Aggregate Investments
by all schemes
Amount Aggregate Investments by
all schemes
2018 2017
Shriram Transport Finance Company Ltd.
Corporate Bonds / Debentures
– 651,317,500 – 1,452,436,300
Equities – – – 94,659,583
Bharti Airtel Ltd. Equities – 369,136,950 – 1,025,985
Balrampur Chini Mills Ltd.
Equities – 125,227,938 – –
1.4. Open position of Securities Borrowed and / or Lent by the Scheme as of financial years ended March 31, 2018 and March 31, 2017 are NIL.
1.5. NPAs as on March 31, 2018 and March 31, 2017 are NIL.
1.6. Aggregate Unrealised Gain / Loss as at the end of the financial years March 31, 2018 and March 31, 2017 are as under:
Security Category Amount (Rs.) Percentage to Net Assets
Amount (Rs.) Percentage to Net Assets
2018 2017
Certificates of Deposit/Commercial Paper
– Appreciation 15,577,443 0.06 2,462,234 0.01
– Depreciation 154,862 ~0.00 57,060 ~0.00
~ Indicates less than 0.01
1.7. The aggregate value of investment securities (excluding CBLO and Reverse Repos) purchased and sold (including matured) during the financial year 2017-18 (excluding accretion of discount) are Rs. 331,901,783,112 and Rs. 327,157,013,727 respectively being 783.88% and 772.68% of the average daily net assets.
The aggregate value of investment securities (excluding CBLO and Reverse Repos) purchased and sold (including matured) during the financial year 2016 -17 (excluding accretion of discount) are Rs. 166,800,296,469 and Rs. 159,116,416,187 respectively being 742.91% and 708.69% of the average daily net assets.
1.8. Non-Traded securities in the portfolio: Aggregate Value of Equity, Debt & Money Market Instruments and percentage to net assets is as under:

19
Security Category Amount (Rs.)
Percentage to Net Assets
Amount (Rs.)
Percentage to Net Assets
2017 2016
Money Market Instruments
27,755,080,594 99.42 19,761,843,935 106.82
2 Disclosure Under Regulation 25(8) of the Securities and Exchange Board of India (Mutual Funds) Regulations, 1996 as amended
Details of amounts paid to associates in terms of Regulation 25 (8) are as follows :
Commission paid to Sponsor/AMC and its associates/related parties/group companies
Name of Sponsor/AMC and its associates/related parties/group companies
Nature of Association / Nature of
Relation
Period Covered
Business Given [Rs. In Crores]
% of Total Business
received by the Fund
Commission paid [Rs.]
% of Total commission paid by the
Fund
The Hongkong and Shanghai Banking Corporation Limited
Associate of Investment Manager
2017-2018 1,242.65 0.50 2,245,866 37.63
Name of Sponsor/AMC and its associates/related parties/group companies
Nature of Association / Nature of
Relation
Period Covered
Business Given [Rs. In Crores]
% of Total Business
received by the Fund
Commission paid [Rs.]
% of Total commission paid by the
Fund
The Hongkong and Shanghai Banking Corporation Limited
Associate of Investment Manager
2016-2017 1,241.42 1.28 2,473,015 61.25
The brokerage paid was at rates similar to those offered to other distributors. The Commission / Brokerage paid to related party includes both upfront and trail and hence not comparable with the % of business brought and % of commission paid.
Further, The Hongkong and Shanghai Banking Corporation Limited, an associate of the Sponsor, is on the panel of bankers with whom HSBC Mutual Fund places money on fixed deposits and enters into reverse repo transactions from time to time at competitive rates.
(i) Any underwriting obligations undertaken by the Schemes of the mutual funds with respect to issue of securities associate companies - Nil (Previous year also Nil).
(ii) Devolvement - Nil (Previous year also Nil).
(iii) Subscription by the Schemes in the issues lead managed by associate companies - Nil (Previous year also Nil).
(iv) Subscription to any issue of equity or debt on private placement basis where the sponsor or its associate companies have acted as arranger or manager - Nil (Previous year also Nil).
3 None of the Investors held more than 25% of the total net assets of the Scheme at the years ended March 31, 2018 and March 31, 2017.
Notes to Accounts - Annexure I (Contd...)To the Abridged Balance Sheet and Revenue Account for the year ended March 31, 2018

20
4 Unit Capital movement during the years ended March 31, 2018 and March 31, 2017**:
Description
2017–2018
Opening Units Subscription Redemption Closing UnitsFace Value
per unit (Rupees)
Regular Growth Option
12,721.717 – 1,487.688 11,234.029 1,000
Regular Daily Dividend Option
73,982.957 – 4,544.979 69,437.978 1,000
Regular Weekly Dividend Option
66,488.094 – 28,827.848 37,660.246 1,000
Institutional Growth Option
3,205.025 – – 3,205.025 1,000
Institutional Daily Dividend Option
38.218 – – 38.218 1,000
Institutional Plus Growth Option
2,626,575.001 626,053,996.281 624,945,877.185 3,734,694.097 1,000
Institutional Plus Daily Dividend Option
5,157,781.729 10,378,760.137 12,965,588.102 2,570,953.764 1,000
Institutional Plus Weekly Dividend Option
94,753.184 344,394.236 285,978.896 153,168.524 1,000
Institutional Plus Monthly Dividend Option
163,933.304 227,033.876 205,909.267 185,057.913 1,000
Direct Plan – Growth Option
2,854,879.083 807,030,562.563 803,597,689.101 6,287,752.545 1,000
Direct Plan – Daily Dividend Option
3,932,579.312 58,066,970.378 54,819,698.603 7,179,851.087 1,000
Direct Plan – Weekly Dividend Option
9,235.151 228,462.355 12,674.651 225,022.855 1,000
Direct Plan – Monthly Dividend Option
3,971.609 1,024.522 4,294.387 701.744 1,000
Unclaimed Plan– Dividend less than 3 years
14,891.827 3,753.504 5,868.285 12,777.046 1,000
Unclaimed Plan– Dividend more than 3 years
12,598.913 2,945.749 974.493 14,570.169 1,000
Unclaimed Plan– Redemption less than 3 years
19,188.640 11,284.519 14,565.499 15,907.660 1,000
Unclaimed Plan– R e d e m p t i o n more than 3 years
20,395.382 4,781.714 2,389.239 22,787.857 1,000
Notes to Accounts – Annexure I (Contd...)To the Abridged Balance Sheet and Revenue Account for the year ended March 31, 2018

21
Description
2016–2017
Opening Units Subscription Redemption Closing UnitsFace Value
per unit (Rupees)
Regular Growth Option
13,831.759 – 1,110.042 12,721.717 1,000
Regular Daily Dividend Option
99,872.751 – 25,889.794 73,982.957 1,000
Regular Weekly Dividend Option
69,625.861 – 3,137.767 66,488.094 1,000
Institutional Growth Option
3,205.025 – – 3,205.025 1,000
Institutional Daily Dividend Option
38.218 – – 38.218 1,000
Institutional Plus Growth Option
2,092,356.261 97,313,848.407 96,779,629.667 2,626,575.001 1,000
Institutional Plus Daily Dividend Option
4,243,212.920 17,811,086.097 16,896,517.288 5,157,781.729 1,000
Institutional Plus Weekly Dividend Option
127,327.143 277,666.314 310,240.273 94,753.184 1,000
Institutional Plus Monthly Dividend Option
163,468.562 201,825.620 201,360.878 163,933.304 1,000
Direct Plan – Growth Option
1,835,687.400 479,353,982.910
478,334,791.227 2,854,879.083 1,000
Direct Plan – Daily Dividend Option
2,883,139.976 44,383,321.281 43,333,881.945 3,932,579.312 1,000
Direct Plan – Weekly Dividend Option
16,097.054 1,719.957 8,581.860 9,235.151 1,000
Direct Plan – Monthly Dividend Option
4,885.062 842,451.733 843,365.186 3,971.609 1,000
Unclaimed Plan– Dividend less than 3 years
– 19,817.166 4,925.339 14,891.827 1,000
Unclaimed Plan– Dividend more than 3 years
– 14,747.640 2,148.727 12,598.913 1,000
Unclaimed Plan– Redemption less than 3 years
– 29,691.345 10,502.705 19,188.640 1,000
Unclaimed Plan– R e d e m p t i o n more than 3 years
– 22,706.642 2,311.260 20,395.382 1,000
** Units held by the AMC (Seed Capital) in Direct Plan Growth Option as on March 31, 2018 is 418,782.905 and as on March 31, 2017 is 323,925.038
Notes to Accounts - Annexure I (Contd...)To the Abridged Balance Sheet and Revenue Account for the year ended March 31, 2018

22
Notes to Accounts - Annexure I (Contd...)To the Abridged Balance Sheet and Revenue Account for the year ended March 31, 2018
5 Previous year’s figures have been re-grouped / re-arranged where appropriate
6 No contingent liabilities for the years ended March 31, 2018 and March 31, 2017.
7 Expenses other than Management Fees are Inclusive of GST / Service Tax where applicable.
8 Other Income :- Nil represents compensation paid by AMC. (2017: Rs. 65,971 )
9 Investor Education Awareness
In view of the AMFI Best Practices Guidelines Circular No. 56/2015-16, the IEF (Investor Education Fund) accrual is set aside in a separate bank account and the consolidated balance across all Schemes as on March 31, 2018. The break-up of which is as under:
March 31, 2018 March 31, 2017
Particulars Amount (in Rs. Lacs) Amount (in Rs. Lacs)
Opening Balance 44.00 –
Add: Accrual during the year 219.83 182
Less: Transferred to AMFI 101.10 83
Less: Payable to AMFI (March accrual) 8.81 8
Add: Investment Income for the year 8.28 11
Less: Spent during the year 43.17 58
Closing Balance 119.02 44
10 Borrowings
Details of Outstanding Borrowing Liability are as follows: -
March 31, 2018
Name of the Scheme
Date of Borrowing
Amount Borrowed
(INR crores)
Rate of Interest
Source
HSBC Cash Fund
28-Mar-18 310.75 8.15% The amount was borrowed to meet the redemption requirement by pledging Certificate of Deposit of HSBC Cash Fund. The pledged securities were released and credited to the account of the Scheme on the date of repayment i.e. April 3, 2018
As per Regulation 44(2) of SEBI (Mutual Funds) Regulations, 1996, mutual funds are permitted to borrow only to meet temporary liquidity needs of the mutual funds for the purpose of repurchase, redemption of units or payment of dividend etc. AMFI vide its Best Practice guidelines circular no. 71/2017-18 dated Mar 23, 2018 recommended that cost of borrowing made to manage redemptions to the extent of YTM/running yield of the fund as on previous day should be charged to the Scheme and any excess cost over YTM/running yield of the previous day may be borne by the AMC. Accordingly AMC has borne Rs. 2,78,847.
HSBC Mutual fund has adhered to the recommended practice from the date of the AMFI circular.
11 The Annual Accounts of the Schemes prepared in accordance with the accounting policies and standards specified in the Ninth Schedule of The Securities and Exchange Board of India (Mutual Funds) Regulations, 1996 has been approved by the Board of Directors of HSBC Asset Management (India) Private Limited and The Board of Trustees of HSBC Mutual Fund at their meetings held on July 16, 2018 and July 17, 2018 respectively. The audit report attached herewith refers to the said Annual Accounts. The aforesaid abridged accounts are an extract of the Annual Accounts and are prepared in accordance with SEBI Circular No. IMD/Cir8/132968/2008 dated July 24, 2008.

23
Voting Policy and Procedures
In view of SEBI guidelines related to “Role of Mutual Funds in Corporate Governance of Public Listed Companies”, AMIN has formulated its “Policy for Proxy Voting in Public Listed Companies”. The said policy and details of actual exercise of proxy votes along with the summary of votes cast and the auditors certification during the Financial Year 2017 – 18 is available on its website – http://www.assetmanagement.hsbc.com/in and in full Annual Report for the Financial Year 2017 – 18.

24
Statutory Details & Disclaimers
All returns have been sourced from Mutual Funds India Explorer software unless otherwise stated. With regard to equity schemes (including the equity component of MIPs), Fund performance is calculated on a total return basis (i.e. it includes dividends re-invested) while the benchmark is calculated on a price return basis (i.e. it does not consider dividends re-invested). This document has been prepared by HSBC Asset Management (India) Private Ltd (HSBC) for information purposes only and should not be construed as an offer or solicitation of an offer for purchase of any of the funds of HSBC Mutual Fund. All information contained in this document (including that sourced from third parties), is obtained from sources HSBC, the third party believes to be reliable but which it has not independently verified and HSBC, the third party makes no guarantee, representation or warranty and accepts no responsibility or liability as to the accuracy or completeness of such information. The information and opinions contained within the document are based upon publicly available information and rates of taxation applicable at the time of publication, which are subject to change from time to time. Expressions of opinion are those of HSBC only and are subject to change without notice. It does not have regard to specific investment objectives, financial situation and the particular needs of any specific person who may receive this document. Investors should seek financial advice regarding the appropriateness of investing in any securities or investment strategies that may have been discussed or recommended in this report and should understand that the views regarding future prospects may or may not be realized. Neither this document nor the units of HSBC Mutual Fund have been registered in any jurisdiction. The distribution of this document in certain jurisdictions may be restricted or totally prohibited and accordingly, persons who come into possession of this document are required to inform themselves about, and to observe, any such restrictions.
Investors should not invest in the Scheme solely based on the information provided in this document and should read the Scheme Information Document and Statement of Additional Information of the Fund for details. This document does not constitute an offering document.
No part of this publication may be reproduced, stored in a retrieval system, or transmitted, on any form or by any means, electronic, mechanical, photocopying, recording, or otherwise, without the prior written permission of HSBC Asset Management (India) Private Ltd.
Mutual Fund investments are subject to market risks, read all scheme related documents carefully.

HSBC Flexi Debt FundAn open ended dynamic debt Scheme investing across duration
Abridged Annual Report 2017 - 2018

1
Dear Investor,
Globally, we are witnessing a very interesting phase. The equity markets delivered a stellar performance in 2017. However, there are worries about the impact of higher rates, global trade wars, an economic growth moderation and higher volatility.
Closer home, India has become the world’s sixth-biggest economy. India has doubled its GDP to USD 2.2 trillion within a decade. The introduction of reform measures, including demonetisation and the Goods and Services Tax (GST), had put pressure on selective parts of the economy in 2017. The impact of these measures is likely to be transitory. India’s economic growth is expected to accelerate from 6.7% in FY18 to 7.4% in the current year as per IMF forecasts.
There has been a shift in the domestic savings pool supporting the market. Domestic investors have been increasing exposure to equities and financial assets moving away from gold and real estate. Mutual funds witnessed sizable inflows on the back of the boost in liquidity within the banking system from demonetisation. The AUM of the mutual fund industry grew by 21.7% in March 2018 compared to March 2017.
With growth, comes responsibility. Last year, the regulator, Securities and Exchange Board of India (SEBI) issued a circular to rationalise and categorise mutual fund schemes in India. We are pleased to state that none of our funds needed to be redesigned. All our schemes have been defined as per the new categorisation. We believe this classification will simplify investing into mutual funds and enhance comparability within the schemes offered.
As India moves to a digital age, e-commerce platforms are becoming increasingly popular. I request you to logon to our online transaction platform. It is a quick, convenient and an efficient tool to invest into our funds and manage your investments online.
At HSBC Global Asset Management, India, we are dedicated to one goal: delivering exceptional investment management for our clients. By bringing together our

2
global investment knowledge and capabilities, we are able to offer specialised expertise across asset classes. This has helped us to become a trusted partner to our individual and institutional investors.
We remain committed to our long-term perspective and disciplined investment approach as we conduct a rigorous, fundamental analysis of investments with a strong emphasis on risk management. Although the investment landscape appears favourable, it is worth remembering that markets are dynamic and constantly evolving. Therefore, we believe active, professional investment management serves investors well. Amid changing markets and economic conditions, we are confident that investors with a well-diversified portfolio and a patient, long-term outlook should be well positioned for the years ahead.
Together we thrive.
Warm regards,
Ravi Menon
Chief Executive Officer, HSBC Global Asset Management, India

3
SPONSORHSBC Securities and Capital Markets (India) Private LimitedRegd. Office: 52/60, Mahatma Gandhi Road, Fort, Mumbai - 400 001.
TRUSTEEBoard of TrusteesOffice: 16, Veer Nariman Road, Fort, Mumbai 400 001.
ASSET MANAGEMENT COMPANYHSBC Asset Management (India) Private LimitedCorp. & Regd. Office: 16, Veer Nariman Road, Fort, Mumbai 400 001.
CUSTODIANStandard Chartered Bank (SCB)Corp. & Regd. Office: Crescenzo, Securities Services, 3rd Floor, C-38/39, G-Block, Bandra Kurla Complex, Bandra East, Mumbai – 400051.
AUDITORS TO THE SCHEMEBSR & Co. LLPChartered Accountants 5th Floor, Lodha Excelus, Apollo Mills Compound, N.M. Joshi Marg, Mahalaxmi, Mumbai 400 011.
REGISTRAR & TRANSFER AGENTSComputer Age Management Services Private Limited (CAMS)Unit: HSBC Mutual Fund ’C’ Block, 2nd Floor, Hanudev Info Park P. Ltd., SF No. 558/2, Udayampalayam Road, Nava India, Coimbatore - 641 028.
BOARD OF TRUSTEESMr. Nasser Munjee
Mr. Manu Tandon
Mr. Mehli Mistri
Mr. Dilip J. Thakkar
Ms. Jasmine Batliwalla
Mr. Pedro Bastos
BOARD OF DIRECTORSMs. Kishori J. Udeshi - Chairperson
Mr. S. P. Mustafa
Mr. Dinesh Mittal
Mr. Ravi Menon - Chief Executive Officer

4
The Trustees of HSBC Mutual Fund (“Fund”) present the Sixteenth Annual Report and the audited abridged financial statements of the schemes of the Fund for the year ended March 31, 2018.
As at March 31, 2018, the Fund offered 30 schemes across asset classes to meet the varying investment needs of the investors. Notably, three Schemes of HSBC Mutual Fund viz. HSBC Large Cap Equity Fund, HSBC Short Duration Fund and HSBC Cash Fund have completed 15 years of operations during the year.
During the year, the Fund has launched Plan(s) under Fixed Term Series and carried out merger of the existing schemes viz HSBC Dividend Yield Equity Fund merged into HSBC Multi Cap Equity Fund (HMEF), erstwhile HSBC India Opportunities Fund, as offering sub-scale fund was not in the interest of the unitholders.
Further, in order to bring uniformity in the practice across Mutual Funds and to standardize the scheme categories and characteristics of schemes, SEBI vide its circular no. SEBI/HO/IMD/DF3/CIR/P/2017/114 dated October 06, 2017, issued guidelines for categorization and rationalization of Mutual Fund schemes.
Accordingly, HSBC Large Cap Equity Fund (erstwhile HSBC Equity Fund), HSBC Small Cap Equity Fund (erstwhile HSBC Mid Cap Equity Fund) , HSBC Infrastructure Equity Fund, HSBC Global Emerging Market Fund (erstwhile HSBC Emerging Market Fund), HSBC Debt Fund (erstwhile HSBC Income Fund – Investments Plan), HSBC Short Duration Fund (erstwhile HSBC Income Fund – Short Term Plan), HSBC Low Duration Fund (erstwhile HSBC Ultra Short Term Bond Fund), HSBC Regular Savings Fund (erstwhile HSBC Monthly Income Plan) and HSBC Managed Solutions have undergone fundamental attributes changes with effective from March 14, 2018.
The Fund continues its focus on delivering consistent long term returns. The comments on the performance of the Scheme(s) is provided hereinafter. Dividends were declared under various schemes as per the provisions contained in the respective Scheme Information Documents after considering the distributable surplus available under the respective Schemes. Details of dividends declared can be viewed on our website at www.assetmanagement.hsbc.com/in.
1. Scheme Performance, future outlook and oPerationS of the SchemeS
a. Operations and Performance of the Schemes
HSBC Flexi Debt Fund (HFDF) (An open ended dynamic debt Scheme investing across duration)
HFDF seeks to deliver returns in the form of interest income and capital gains, along with high liquidity, commensurate with the current view on the markets and the interest rate cycle, through active investment in debt and money market instruments. However, there is no assurance that the investment objective of the Scheme will be achieved.
The net assets of HFDF amounted to Rs. 231.53 crores as at March 31, 2018 as compared to Rs. 442.43 crores as at March 31, 2017. Around 91.81% of the net assets was invested in debt and money market instruments and 8.19% comprised of reverse repos/CBLO and net current assets as at March 31, 2018.
HFDF underperformed its scheme’s benchmark due to very high volatility and expectation that the valuations were reasonable. However, markets went to perfect storm with higher crude prices, low liquidity and pressure on currency, apart from rate hike expectations.
Scheme Name & Benchmarks Absolute Returns
(%)
Compounded Annualized Returns (%)
Date of Inception : 5 October 2007 1 Year 3 Years 5 Years Since Inception
HSBC Flexi Debt Fund - Growth 2.26 5.74 6.98 8.16
CRISIL Composite Bond Fund Index (Scheme Benchmark) 5.17 8.21 8.60 7.74
CRISIL 10 Year Gilt Index (Standard Benchmark) -0.25 6.45 6.42 6.57
Rs. 10,000, if invested in HFDF, would have become 10,227 11,826 14,015 22,746
Rs. 10,000, if invested in CRISIL Composite Bond Fund Index, would have become
10,518 12,676 15,109 21,838
Trustees’ ReportFor the year ended March 31, 2018

5
Scheme Name & Benchmarks Absolute Returns
(%)
Compounded Annualized Returns (%)
Date of Inception : 5 October 2007 1 Year 3 Years 5 Years Since Inception
Rs. 10,000, if invested in CRISIL 10 Year Gilt Index, would have become
9,975 12,067 13,652 19,477
Past performance may or may not be sustained in future. The returns for the respective periods are provided as on last business day of March 2018 for Growth Option. Different plans shall have a different expense structure. Performance of the respective benchmark is calculated as per the Total Return Index (TRI).
b. Market Overview & Outlook (as furnished by HSBC Asset Management (India) Private Limited)
EqUITY OUTLOOKIndian equity markets continued to remain strong during fiscal year 2017-18 and posted gains of 11.76% by S&P CNX Nifty and 13.24% by BSE Midcap index respectively. Biggest drivers of the markets were, robust DII flow into equities, continued push of mega reforms – Goods and Services Tax (GST) implementation, Insolvency and Bankruptcy Code implementation, Real Estate (Regulation and Development) Act, second consecutive normal monsoon, and electoral victories of the ruling party in many state elections. On the other hand, the markets weather the storm of disruption in economy due to GST implementation, lingering impact of demonetization, muted FII flows, and rising yields in developed markets. Domestic Mutual Fund segment had their best ever year and they brought in ~USD 22 bn of net inflows in equities during the year. Even after witnessing ~USD 4.3 bn of net outflows from the domestic insurers, the net DII tally was a very impressive ~USD 17.7 bn of net inflows. There were mixed global cues well and the Foreign Institutional Investors (FIIs) net bought Indian equities worth USD 3.2 bn. The inflows by both FIIs and domestic MFs acted as a factor in the strong market performance.
Indices Returns (April 1, 2017 to March 31, 2018) 1 Year (%)
S&P BSE Sensex 12.70%
NSE CNX Nifty 11.76%
S&P BSE 100 12.12%
S&P BSE 200 12.49%
S&P BSE 500 13.21%
S&P BSE Midcap 14.31%
S&P BSE 250 Small-cap 14.13%
Source: Bloomberg (All values are total return)
Our view on the key aspects related to equity markets are presented below -
The impressive performance in equity markets during FY 2017-18 has come on the back of strong liquidity largely by domestic MFs but supported in party by FII flows, positive global growth, benign macro – both domestically and global, expectation of the continuation of favorable policy environment domestically and expectation of corporate earnings revival. Possibility of sound macro, economic reforms and implementation of existing reforms have increased, especially after continued success of the ruling party at the centre in state elections. However, after this strong performance in markets and rather long wait for earnings to be delivered has meant that the equity markets are currently trading above their historical averages.
Moving into FY 2018-19, we expect a continuation of the economic recovery process domestically, recovery in corporate earnings - led early by volume growth, and continued DII flows. Government led investment spending and rural consumption are likely to lead with private sector investments contributing later (possibly after general elections 2019). The budget document that was presented in early February provides a good
Trustees’ ReportFor the year ended March 31, 2018 (Contd...)

6
medium term policy direction for the economy. Occasionally the policy actions can serve up a few bumps and jolts but over the medium term, across different governments, there is a thread of continuity connecting many key economic policies such as in the case of this year’s union budget. We, in our investment process, prefer to take comfort in these threads of continuity and remain constructive on the India growth story. This makes us positive on the Indian equity markets over the medium to long term.
Risks are in the form of market valuations trending above historical averages, weaker than expected delivery in corporate earnings going forward, external news flows related to trade protectionism, developed market central banks raising rates prematurely, and geopolitical tensions and other eco-political events would also influence market performance going forward, as the recent rally in the markets was supported by strong FII inflows.
DEBT OUTLOOKFixed Income in Financial Year 2017-18 has seen volatility further step up in this year. Markets went to perfect storm with higher crude prices, low liquidity and pressure on currency, apart from rate hike expectations.
Inflation has followed the glide path to lower numbers towards 4% RBI target and even lower than the target number when inflation printed a lowly 1.46% in June 2018 on back of lower food prices. RBI went for a cut despite of neutral stance. This positivity continued till until crude shock came in form of higher crude process. Global prices of Brent crude saw substantial increase in second half of the year, which jeopardized the inflation path. Other worries that gathered around this time were related to GST collection and eventual impact on fiscal situation.
Government of India allowed the fiscal deficit to slip to 3.5% (budget 3.2%) and kept next year target at 3.3% (in place of earlier path of 3%). This was on back of some excise relaxation for oil products and a month less collected for GST due to implementation in the current year. The fear of fiscal slippage alongwith the announcement of higher bond issuances spooked the bond markets into higher yields. Government finally borrowed only INR 90 bln extra (in place of INR 500 bln announced initially).
On the Monetary front the year was very volatile as well. RBI changed its stance to neutral causing some worry around rate hikes. Thereafter it cut rates and again went for OMO sales operations simultaneously. This created some confusion in the market participants regarding rates direction. Finally extra supply, higher oil prices and higher inflation paved way for rates higher. RBI also held position on regulatory forbearance about spreading out losses by banks publicly. It eventually gave up the position in the end of March. However, the swift changes in stance caused lot of pressure and volatility in bonds.
Liquidity situation continuously deteriorated due to OMO sales initially and withdrawal of deposits due to remonetisation. Further liquidity was absorbed out due to portfolio outflows and reduction in reserves. Despite of defense from RBI utilizing the reserves, the currency depreciated meaningfully, which caused further jitters in foreign investor sentiments. Lack of liquidity also affected 1-3 year rates which were elevated in second half of the year.
Going forward following are key variables to watch out for:• Liquidity: Liquidity will drive short end rates and eventually drive decisions leading to market interventions
and CRR cuts. RBI has focused now on neutral liquidity stance and providing liquidity to system, which will bode well short end rates.
• Inflation: Inflation numbers will determine future course of action for RBI and remains a critical variable for policy. We expect inflation to remain at 4.7% level in the ease in second half of FY 2018-19 in line with RBI’s expectations.
• Growth: GDP growth numbers as well as industrial activity will also determine the decision on policy.
• Fiscal deficit: Fiscal deficit and government spending will determine the government borrowing and crowding out in interest rate curve. We expect prudence in government spending and prospect of spending on infrastructure to pick up which will crowd in private investment as well.
• Current Account Deficit: Current Account Deficit determines how the pressure on currency works and effective management of forex reserves.
• Currency levels: Level of INR will determine how the central bank reacts to the situation on the global crisis etc.
Trustees’ ReportFor the year ended March 31, 2018 (Contd...)

7
2. Brief Background of SPonSorS, Board of truSteeS and aSSet management comPany
a. Sponsor
HSBC Mutual Fund is sponsored by HSBC Securities and Capital Markets (India) Private Limited (HSCI). The Sponsor is the Settler of the Mutual Fund Trust. The Sponsor has entrusted a sum of Rs. 1,00,000 (Rupees One Lakh only) to the Trustee as the initial contribution towards the corpus of the Mutual Fund.
HSCI offers integrated investment banking services, securities and corporate finance & advisory. HSCI is a member of the Bombay Stock Exchange Limited and National Stock Exchange (capital and derivative market segments). HSCI holds 100% of the paid up equity share capital of HSBC Asset Management (India) Private Limited.
b. HSBC Mutual Fund
HSBC Mutual Fund (“the Mutual Fund” or “the Fund”) has been constituted as a Trust in accordance with the provisions of the Indian Trusts Act, 1882 (2 of 1882) vide a Trust Deed dated February 7, 2002 with HSBC Securities and Capital Markets (India) Private Limited, as the Sponsor and the Board of Individual Trustees. The Trustee has entered into an Investment Management Agreement dated February 7, 2002 with HSBC Asset Management (India) Private Limited (AMC) to function as the Investment Manager for all the schemes of the Fund. The Fund was registered with SEBI vide registration number MF/046/02/5 dated May 27, 2002.
The Trust has been formed for the purpose of pooling of capital from the public for collective investment in securities for the purpose of providing facilities for participation by persons as beneficiaries in such investments and in the profits/income arising therefrom.
c. Board of Trustees (the Trustees)
The Board of Trustees is the exclusive owner of the Trust Fund and holds the same in trust for the benefit of the unit holders. The Trustees have been discharging their duties and carrying out the responsibilities as provided in the SEBI (Mutual Funds) Regulations, 1996 and the Trust Deed. The Trustees seek to ensure that the Fund and the schemes floated there under are managed by the AMC in accordance with the Trust Deed, the said Regulations, directions and guidelines issued by the SEBI, the Stock Exchanges, the Association of Mutual Funds in India and other regulatory agencies.
d. Asset Management Company (the AMC)
HSBC Asset Management (India) Private Limited (the Investment Manager or the AMC) is a private limited company incorporated under the Companies Act, 1956 on December 12, 2001 having its Registered Office at 16, V. N. Road, Fort, Mumbai 400 001. HSBC Asset Management (India) Private Limited has been appointed as the Asset Management Company of HSBC Mutual Fund by the Trustee vide Investment Management Agreement (IMA) dated February 7, 2002 and executed between the Trustees and the AMC. SEBI approved the AMC to act as the Investment Manager of the Fund vide its letter No. MFD/BC/163/2002 dated May 27, 2002. The paid-up equity share capital of the AMC is Rs. 61.59 crores. The AMC is registered as a Portfolio Manager under the SEBI (Portfolio Managers) Regulations, 1993 vide registration no. INP000001322. The AMC also offers non-binding Advisory services to offshore funds under the mutual fund license.
HSBC Securities and Capital Markets (India) Private Limited holds 100% of the paid up equity share capital of the AMC.
3. inveStment oBjective of the SchemeS The investment objective of the respective schemes has been provided above under the heading “Scheme
Performance, Future Outlook and Operation of the Scheme” (Refer Section 1).
4. Significant accounting PolicieS The Significant Accounting Policies form part of the Notes to the Accounts annexed to the Balance Sheet
of the Schemes in the Full Annual Report. The accounting policies are in accordance with Securities Exchange Board of India (Mutual Funds) Regulations 1996.
Trustees’ ReportFor the year ended March 31, 2018 (Contd...)

8
5. unclaimed dividendS & redemPtionS Summary of number of investors & corresponding amount Scheme-wise as on March 31, 2018.
SchemeUnclaimed Dividend Unclaimed Redemption
Amount (Rs.) No. of Investors
Amount (Rs.) No. of Investors
HSBC Flexi Debt Fund 157,571.79 4 162,561.98 1
6. inveStor ServiceSThe number of official points of acceptance of transactions is 205 locations. In addition to the offices of the Registrar & Transfer agents, the AMC has Investor Service Centres in 9 locations at its own offices - namely Mumbai, New Delhi, Kolkata, Bangaluru, Pune, Ahmedabad, Hyderabad, Chandigarh and Chennai. With a view to enhance customer convenience, the AMC has the facility of priority based servicing to key distributors through the enhancement of the Interactive Voice Reponses. The AMC has a single Toll Free number which can be dialed from anywhere in India. The call centre service is being managed by the Registrar and Transfer Agents.
On the distribution front, the number of empanelled distributors was 460 as on March 31, 2018. During the year, the AMC initiated tie-ups for online distribution of the Mutual Fund’s schemes with several channel partners taking the total number of such tie-ups to 42.
7. detailS of inveStor grievance redreSSalThe details of the redressal of investor complaints received against HSBC Mutual Fund during April 2017 - March 2018 are as follows:
2017-2018
Com- plaint Code
Type of complaint (a) No. of complaints
pending at the
beginning of the year
(b) No. of complaints received during
the year
Action on (a) and (b)
Resolved Non Actiona-
ble*
Pending
Within 30
days
30 - 60 days
60 - 180 days
Beyond 180 days
0 - 3 months
3 - 6 months
6 - 9 months
9 - 12 months
I A Non receipt of Dividend on Units
0 5 4 1 0 0 0 0 0 0 0
I B Interest on delayed payment of Dividend
0 0 0 0 0 0 0 0 0 0 0
I C Non receipt ofRedemption Proceeds
1 12 12 1 0 0 0 1 0 0 0
I D Interest on delayedp a y m e n t o f Redemption
0 1 1 0 0 0 0 0 0 0 0
II A Non receipt of Statement of Account / Unit Certificate
0 0 0 0 0 0 0 0 0 0 0
II B D i s c r e p a n c y i n Statement of Account
0 0 0 0 0 0 0 0 0 0 0
II C Data corrections in Investor details **
0 34 34 0 0 0 0 0 0 0 0
II D Non receipt of Annual Report /Abridged Summary
0 0 0 0 0 0 0 0 0 0 0
Trustees’ ReportFor the year ended March 31, 2018 (Contd...)

9
2017-2018
Com- plaint Code
Type of complaint (a) No. of complaints
pending at the
beginning of the year
(b) No. of complaints received during
the year
Action on (a) and (b)
Resolved Non Actiona-
ble*
Pending
Within 30
days
30 - 60 days
60 - 180 days
Beyond 180 days
0 - 3 months
3 - 6 months
6 - 9 months
9 - 12 months
III A Wrong switch between Schemes
0 0 0 0 0 0 0 0 0 0 0
III B Unauthorized switch between Schemes
0 0 0 0 0 0 0 0 0 0 0
III C Deviation from Scheme attributes
0 0 0 0 0 0 0 0 0 0 0
III D Wrong or excess charges / load
0 0 0 0 0 0 0 0 0 0 0
III E Non updat ion of changes viz. address, PAN, bank details, nomination, etc
0 6 6 0 0 0 0 0 0 0 0
IV Others 1 41 42 0 0 0 0 0 0 0 0
Total 2 99 99 2 0 0 0 0 0 0 0
Summary of Complaints for FY 2017-18
Particulars Count
Total complaints received 99
Total number of folios 140099
% of complaints against the folio 0.071%
# active folios** As per AMFI Best Practice Guidelines Circular No.25/2011-12 for Revisions in the Guidelines on
Standardization of Complaints/Grievances Reporting Procedure. If “Others” include a type of complaint which is more than 10% of overall complaints, then such a reason should be provided separately. Hence data corrections in Investor Details is included as a separate category
* Non actionable means the complaint is incomplete / outside the scope of the mutual fund
8. inveStor education initiativeS The Fund undertook various investor education and awareness initiatives related to investments in mutual funds throughout India in English / Hindi and Regional languages via mass media. The Fund conducted 16 roadshows at various locations in India to promote various Investor Awareness related topics including Asset Allocation, SIPs, Equity Mutual Funds and Financial Planning. The Fund has a Year-long tie-up with Mutual Fund Insights Magazine that includes 3 pages of content and advertorial publication in their monthly issue. Each issue contains a story promoting SIPs to achieve one’s various investment goals. In the month of December 2017 and January 2018 investor awareness promotion was done through Outlook and Outlook Money magazines through advertorials on various Mutual Fund topics.
9. Statutory detailSa) The Sponsors are not responsible or liable for any loss resulting from the operation of the Schemes of
the Fund beyond initial contribution of Rs. 1 lakh for setting up the Fund.
b) The price and redemption value of the units, and income from them, can go up as well as down with fluctuations in the market value of its underlying investments.
Trustees’ ReportFor the year ended March 31, 2018 (Contd...)

10
c) Full Annual Report shall be disclosed on the website at www.assetmanagement.hsbc.com/in and shall be available for inspection at the Head Office of the Mutual Fund. Present and prospective unit holders can obtain copy of the Trust Deed, the full Annual Report of the Scheme(s), the Annual Report of HSBC Asset Management (India) Private Limited and the text of the relevant Scheme(s) at a price.
10. acknowledgementSThe Trustees wish to thank the Unit holders of the Schemes for their support throughout the year and also thank the Government of India, the Securities and Exchange Board of India (SEBI), the Reserve Bank of India (RBI) and the Association of Mutual Funds in India (AMFI) for the guidance provided by them. The Trustees also appreciate the services provided by the Registrar and Transfer Agent, Fund Accountant, Custodian, Bankers, Distributors and Brokers. The guidance and services provided by the Auditors and advocates and the ebullience, sincerity and dedication of the employees of HSBC Asset Management (India) Private Limited is also appreciated.
The Trustees look forward to the continued support of everyone.
For and on behalf of the Board of Trustees of HSBC Mutual Fund
Sd/-
Dilip Thakkar
Trustee
Mumbai
July 17, 2018.
Trustees’ ReportFor the year ended March 31, 2018 (Contd...)

11
Independent Auditors’ Report
To the Board of Trustees
hSBc mutual fund - hSBc flexi debt fund
Report on the Financial StatementsWe have audited the accompanying Financial Statements of HSBC Flexi Debt Fund (the ‘Scheme’), which comprise the balance sheet as at 31 March 2018, the related revenue account and the cash flow statement for the year then ended, and a summary of significant accounting policies and other explanatory information, annexed thereto.
Management’s responsibility for the Financial StatementsThe Board of Trustees to the HSBC Mutual Fund (the ‘Board of Trustees’) and HSBC Asset Management (India) Private Limited (the ‘AMC’), being the investment manager to HSBC Mutual Fund (the ‘Fund’) (collectively referred as ‘Management’), are responsible for the preparation of these financial statements that give a true and fair view of the financial position and financial performance of the Scheme in accordance with the accounting policies and standards specified in the Ninth Schedule of the Securities and Exchange Board of India (Mutual Funds) Regulations, 1996, as amended (the ‘Regulations’) and the accounting principles generally accepted in India. This responsibility includes maintenance of adequate accounting records for safeguarding of the assets of the Scheme and for preventing and detecting frauds and other irregularities; selection and application of appropriate accounting policies; making judgments and estimates that are reasonable and prudent; and design, implementation and maintenance of adequate internal financial controls, that were operating effectively for ensuring the accuracy and completeness of the accounting records, relevant to the preparation and presentation of the financial statements that give a true and fair view and are free from material misstatement, whether due to fraud or error.
In preparing the financial statements, management is responsible for assessing the Scheme’s ability to continue as a going concern, disclosing, as applicable, matters related to going concern and using the going concern basis of accounting unless management either intends to liquidate the Fund or to cease operations, or has no realistic alternative but to do so.
Auditor’s ResponsibilityOur responsibility is to express an opinion on these financial statements based on our audit. We conducted our audit in accordance with the Standards on Auditing issued by the Institute of Chartered Accountants of India (the ‘ICAI’). Those Standards require that we comply with ethical requirements and plan and perform the audit to obtain reasonable assurance about whether the financial statements are free from material misstatement.
An audit involves performing procedures to obtain audit evidence about the amounts and disclosures in the financial statements. The procedures selected depend on the auditor’s judgment, including the assessment of the risks of material misstatement of the financial statements, whether due to fraud or error. In making those risk assessments, the auditor considers internal controls relevant to preparation and fair presentation of the financial statements, of the Scheme, in order to design audit procedures that are appropriate in the circumstances, but not for the purpose of expressing an opinion on the effectiveness of the Scheme’s internal controls. An audit also includes evaluating the appropriateness of accounting policies used and the reasonableness of the accounting estimates made by Management, as well as evaluating the overall presentation of the financial statements.
We are also responsible to conclude on the appropriateness of management’s use of the going concern basis of accounting and, based on the audit evidence obtained, whether a material uncertainty exists related to events or conditions that may cast significant doubt on the Scheme’s ability to continue as a going concern. If we conclude that a material uncertainty exists, we are required to draw attention in the auditor’s report to the related disclosures in the financial statements or, if such disclosures are inadequate, to modify the opinion. Our conclusions are based on the audit evidence obtained up to the date of the auditor’s report. However, future events or conditions may cause the Scheme to cease to continue as a going concern.
We believe that the audit evidence we have obtained is sufficient and appropriate to provide a basis for our audit opinion.

12
Independent Auditors’ Report (Contd...)
OpinionIn our opinion, and to the best of our information and according to the explanations given to us, the aforesaid financial statements give the information required by the Regulations in the manner so required and give a true and fair view in conformity with the accounting principles generally accepted in India:
(i) in the case of the balance sheet, of the state of affairs of the Scheme as at 31 March 2018;
(ii) in the case of the revenue account, of the net surplus for the year ended on that date; and
(iii) in the case of the cash flow statement, of the cash flows of the Scheme for the year ended on that date.
Report on other Legal and Regulatory Requirements1 As required by Regulation 55(4) to the Regulations, we report that:
(a) We have obtained all information and explanations which, to the best of our knowledge and belief, were necessary for the purposes of the audit;
(b) The balance sheet and revenue account have been prepared in accordance with the accounting policies and standards specified in the Ninth Schedule of the Regulations.
2 As required by Clause 5(ii)(2) of the Eleventh Schedule of the Regulations, we report that the balance sheet and revenue account are in agreement with the books of account of the Scheme.
3 In our opinion and on the basis of information and explanations given to us, the methods used to value non - traded securities, as at 31 March 2018, as determined by the Board of Directors of AMC, are in accordance with the Regulations and other guidelines issued by the Securities and Exchange Board of India as applicable and approved by the Board of Trustees are fair and reasonable.
For B S R & Co. LLP Chartered Accountants Firm’s Registration No: 101248W/W-100022
Milind Ranade Partner Membership No: 100564
Place : Mumbai Date : July 17, 2018.

13
Rs. in Lakhs
HSBC FLEXI DEBT FUNDAs at
March 31, 2018As at
March 31, 2017
LIABILITIES1 Unit Capital 10,458.80 20,597.672 Reserves & Surplus2.1 Unit Premium Reserves 568.72 1,545.692.2 Unrealised Appreciation Reserve – 63.232.3 Other Reserves 12,125.31 22,087.063 Loans & Borrowings – –4 Current Liabilities & Provisions4.1 Provision for doubtful Income/Deposits – –4.2 Other Current Liabilities & Provisions 250.46 138.67
TOTAL 23,403.29 44,432.32
ASSETS1 Investments1.1 Listed Securities: – –1.1.1 Equity Shares – –1.1.2 Preference Shares – –1.1.3 Equity Linked Debentures – –1.1.4 Other Debentures & Bonds 5,917.70 15,124.931.1.5 Securitised Debt securities – –1.2 Securities Awaited Listing:1.2.1 Equity Shares – –1.2.2 Preference Shares – –1.2.3 Equity Linked Debentures – –1.2.4 Other Debentures & Bonds – –1.2.5 Securitised Debt securities – –1.3 Unlisted Securities1.3.1 Equity Shares – –1.3.2 Preference Shares – –1.3.3 Equity Linked Debentures – –1.3.4 Other Debentures & Bonds 1,697.18 1,705.781.3.5 Securitised Debt securities – –1.4 Government Securities 13,639.46 23,435.401.5 Treasury Bills – –1.6 Commercial Paper – –1.7 Certificate of Deposits – –1.8 Bill Rediscounting – –1.9 Units of Domestic Mutual Fund – –1.10 Foreign Securities – –
Total Investments 21,254.34 40,266.11
2 Deposits 41.33 140.213 Other Current Assets3.1 Cash & Bank Balance 0.44 160.783.2 CBLO/Reverse Repo Lending 1,678.21 2,495.263.3 Others 428.97 1,369.964 Deferred Revenue Expenditure (to the extent not written off) – –
TOTAL 23,403.29 44,432.32
Notes to Accounts – Annexure I
Abridged Balance Sheet as at March 31, 2018

14
Abridged Revenue Account for the year ended March 31, 2018
Rs. in Lakhs
HSBC FLEXI DEBT FUNDCurrent
Year ended March 31, 2018
Previous Year ended
March 31, 2017
1 INCOME1.1 Dividend – –1.2 Interest 2,573.61 3,411.561.3 Realised Gain / (Loss) on Foreign Exchange Transactions – –1.4 Realised Gains / (Losses) on Interscheme sale of investments – –1.5 Realised Gains / (Losses) on External sale / redemption of
investments(1,007.04) 2,079.09
1.6 Realised Gains / (Losses) on Derivative Transactions – –1.7 Other Income – –
(A) 1,566.57 5,490.65
2 EXPENSES2.1 Management fees 291.61 387.992.2 GST / Service tax on Management fees 50.14 57.832.3 Transfer agents fees and expenses 13.52 16.592.4 Custodian fees 0.66 0.592.5 Trusteeship fees 0.21 0.602.6 Commission to Agents 125.41 212.462.7 Marketing & Distribution expenses 0.09 0.322.8 Audit fees 0.39 0.512.9 Investor Education Expenses 7.11 9.262.10 Other operating expenses 3.86 3.982.11 Less: Expenses to be Reimbursed by the Investment Manager – (19.37)
(B) 493.00 670.76
3 NET REALISED GAINS / (LOSSES) FOR THE YEAR (A -B = C) 1,073.57 4,819.89
4 Change in Unrealised Depreciation in value of investments (D) (72.90) (29.85)
5 NET GAINS / (LOSSES) FOR THE YEAR [E=(C+D)] 1,000.67 4,790.04
6 Change in unrealised appreciation in the value of investments (F) (63.23) (323.86)
7 NET SURPLUS / (DEFICIT) FOR THE YEAR (E + F = G) 937.44 4,466.18
7.1 Add: Balance transfer from Unrealised Appreciation Reserve 63.23 323.86
7.2 Less: Balance transfer to Unrealised Appreciation Reserve – –
7.3 Add / (Less): Equalisation (10,908.39) (2,370.44)7.4 Transfer from Reserve Fund 22,087.06 19,897.01
7.5 Transfer from Unit Premium Reserve – –
8 Total 12,179.34 22,316.61
9 Dividend Appropriation9.1 Income Distributed during the year (39.02) (165.70)9.2 Tax on income distributed during the year (15.01) (63.85)
10 Retained Surplus / (Deficit) carried forward to Balance Sheet 12,125.31 22,087.06
Notes to Accounts – Annexure I

15
Key Statistics for the year ended March 31, 2018
HSBC FLEXI DEBT FUNDCurrent
Year ended March 31, 2018
Previous Year ended
March 31, 2017
1. NAV per unit (Rs.):
Open
Regular Plan - Growth Option 21.6355 19.7448
Regular Plan - Fortnightly Dividend Option 13.9232 12.7068
Regular Plan - Monthly Dividend Option 13.6809 12.4854
Regular Plan - Quarterly Dividend Option 13.1998 12.0463
Regular Plan - Half Yearly Dividend Option 15.3021 13.9631
Growth Option **** 22.2659 20.2692
Fortnightly Dividend Option **** 10.5114 10.7645
Monthly Dividend Option **** 10.3387 10.6089
Quarterly Dividend Option **** 11.6308 11.5230
Half Yearly Dividend Option **** 11.7967 11.6594
Direct Plan - Growth Option 23.0049 20.7857
Direct Plan - Fortnightly Dividend Option – 10.0621
Direct Plan - Monthly Dividend Option – 10.7411
Direct Plan - Quarterly Dividend Option 12.0968 11.8699
Direct Plan - Half Yearly Dividend Option 11.2261 11.0590
High
Regular Plan - Growth Option 22.3538 22.2193
Regular Plan - Fortnightly Dividend Option 14.3870 14.2992
Regular Plan - Monthly Dividend Option 14.1351 14.0501
Regular Plan - Quarterly Dividend Option 13.6380 13.5560
Regular Plan - Half Yearly Dividend Option 15.8108 15.7143
Growth Option **** 23.0278 22.8466
Fortnightly Dividend Option **** 10.7592 11.0293
Monthly Dividend Option **** 10.6569 11.0545
Quarterly Dividend Option **** 11.9392 12.4499
Half Yearly Dividend Option **** 12.1998 12.6179
Direct Plan - Growth Option 23.8676 23.5436
Direct Plan - Fortnightly Dividend Option – –
Direct Plan - Monthly Dividend Option 10.0309 –
Direct Plan - Quarterly Dividend Option 12.4348 12.9054
Direct Plan - Half Yearly Dividend Option 11.6471 12.0011

16
Key Statistics for the year ended March 31, 2018 (Contd...)
HSBC FLEXI DEBT FUNDCurrent
Year ended March 31, 2018
Previous Year ended
March 31, 2017
Low
Regular Plan - Growth Option 21.5224 19.7882
Regular Plan - Fortnightly Dividend Option 13.8506 12.7347
Regular Plan - Monthly Dividend Option 13.6094 12.5128
Regular Plan - Quarterly Dividend Option 13.1308 12.0728
Regular Plan - Half Yearly Dividend Option 15.2222 13.9938
Growth Option **** 22.1505 20.3145
Fortnightly Dividend Option **** 10.2735 10.3481
Monthly Dividend Option **** 10.2630 10.1779
Quarterly Dividend Option **** 11.1957 11.5057
Half Yearly Dividend Option **** 11.1575 11.6855
Direct Plan - Growth Option 22.8890 20.8343
Direct Plan - Fortnightly Dividend Option – –
Direct Plan - Monthly Dividend Option 9.7818 –
Direct Plan - Quarterly Dividend Option 11.4436 11.8818
Direct Plan - Half Yearly Dividend Option 10.6555 11.0849
End
Regular Plan - Growth Option 22.0596 21.6355
Regular Plan - Fortnightly Dividend Option 14.2009 13.9232
Regular Plan - Monthly Dividend Option 13.9488 13.6809
Regular Plan - Quarterly Dividend Option 13.4583 13.1998
Regular Plan - Half Yearly Dividend Option 15.6039 15.3021
Growth Option **** 22.7602 22.2659
Fortnightly Dividend Option **** 10.4978 10.5114
Monthly Dividend Option **** 10.4871 10.3387
Quarterly Dividend Option **** 11.4402 11.6308
Half Yearly Dividend Option **** 11.1614 11.7967
Direct Plan - Growth Option 23.6912 23.0049
Direct Plan - Fortnightly Dividend Option – –
Direct Plan - Monthly Dividend Option 10.0030 –
Direct Plan - Quarterly Dividend Option 11.4505 12.0968
Direct Plan - Half Yearly Dividend Option 10.6599 11.2261

17
HSBC FLEXI DEBT FUNDCurrent
Year ended March 31, 2018
Previous Year ended
March 31, 2017
2. Closing Assets Under Management (Rs. in Lakhs)
End 23,153 44,243
Average (AAuM)1 35,528 46,288
3. Gross income as % of AAuM2 4.41% 11.86%
4. Expense Ratio:
a. Total Expense as % of AAuM (including service tax / GST on Management fees) (planwise)
Regular Plan - Growth Option 1.99% 1.97%
Growth Option **** 1.74% 1.72%
Direct Plan - Growth Option 0.99% 0.97%
b. Management Fee as % of AAuM (planwise)
Regular Plan - Growth Option 0.81% 0.84%
Growth Option **** 0.81% 0.84%
Direct Plan - Growth Option 0.81% 0.84%
5. Net Income as a percentage of AAuM3 3.02% 10.41%
6. Portfolio turnover ratio4 – –
7. Total Dividend per unit distributed during the year (planwise)
Retail
Regular Plan - Fortnightly Dividend Option – –
Regular Plan - Monthly Dividend Option – –
Regular Plan - Quarterly Dividend Option – –
Fortnightly Dividend Option **** 0.1790 0.9166
Monthly Dividend Option **** 0.0586 0.9268
Quarterly Dividend Option **** 0.3250 0.7222
Half Yearly Dividend Option **** 0.6500 0.7222
Direct Plan - Fortnightly Dividend Option – –
Direct Plan - Monthly Dividend Option – –
Direct Plan - Quarterly Dividend Option 0.7223 0.7295
Direct Plan - Half Yearly Dividend Option 0.6500 0.7222
Corporate
Regular Plan - Fortnightly Dividend Option – –
Regular Plan - Monthly Dividend Option – –
Key Statistics for the year ended March 31, 2018 (Contd...)
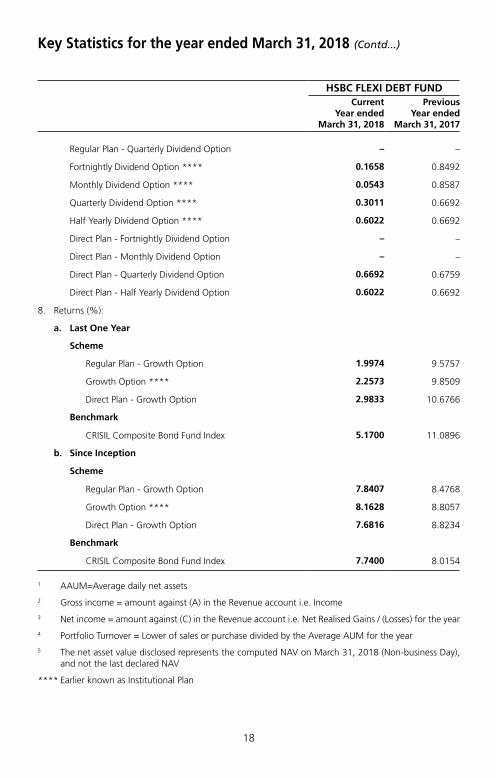
18
Key Statistics for the year ended March 31, 2018 (Contd...)
HSBC FLEXI DEBT FUNDCurrent
Year ended March 31, 2018
Previous Year ended
March 31, 2017
Regular Plan - Quarterly Dividend Option – –
Fortnightly Dividend Option **** 0.1658 0.8492
Monthly Dividend Option **** 0.0543 0.8587
Quarterly Dividend Option **** 0.3011 0.6692
Half Yearly Dividend Option **** 0.6022 0.6692
Direct Plan - Fortnightly Dividend Option – –
Direct Plan - Monthly Dividend Option – –
Direct Plan - Quarterly Dividend Option 0.6692 0.6759
Direct Plan - Half Yearly Dividend Option 0.6022 0.6692
8. Returns (%):
a. Last One Year
Scheme
Regular Plan - Growth Option 1.9974 9.5757
Growth Option **** 2.2573 9.8509
Direct Plan - Growth Option 2.9833 10.6766
Benchmark
CRISIL Composite Bond Fund Index 5.1700 11.0896
b. Since Inception
Scheme
Regular Plan - Growth Option 7.8407 8.4768
Growth Option **** 8.1628 8.8057
Direct Plan - Growth Option 7.6816 8.8234
Benchmark
CRISIL Composite Bond Fund Index 7.7400 8.0154
1 AAUM=Average daily net assets
2 Gross income = amount against (A) in the Revenue account i.e. Income
3 Net income = amount against (C) in the Revenue account i.e. Net Realised Gains / (Losses) for the year
4 Portfolio Turnover = Lower of sales or purchase divided by the Average AUM for the year
5 The net asset value disclosed represents the computed NAV on March 31, 2018 (Non-business Day), and not the last declared NAV
**** Earlier known as Institutional Plan

19
Notes to Accounts – Annexure ITo the Abridged Balance Sheet and Revenue Account for the year ended March 31, 2018
hSBc fleXi deBt fund
1 Investments:
1.1 It is confirmed that investments of the Scheme are registered in the name of the Trustees for the benefit of the Scheme’s unitholders.
1.2 Open Positions of derivatives as a % to Net Assets as of years ended March 31, 2018 and March 31, 2017 are NIL.
1.3 Investments in Associates and Group Companies:
(Rupees)
Issuer Instrument Type
Amount Aggregate Investments
by all schemes
Amount Aggregate Investments
by all schemes
2018 2017
Shriram Transport Finance Company Ltd.
Corporate Bonds / Debentures
– 651,317,500 241,299,360 1,452,436,300
Equities – – – 94,659,583
Bharti Airtel Ltd. Equities – 369,136,950 – 1,025,985
Balrampur Chini Mills Ltd.
Equities – 125,227,938 – –
1.4 Open positions of Securities Borrowed and / or Lent by the Scheme as of the years ended March 31, 2018 and March 31, 2017 are NIL.
1.5 NPAs as at years ended March 31, 2018 and March 31, 2017 are NIL.
1.6 Aggregate Unrealised Gain / Loss as at the end of the financial years and percentages to net assets are as under :
Security Category Amount (Rupees)
Percentage to Net Assets
Amount (Rupees)
Percentage to Net Assets
2018 2017
Non Convertible Debentures and Bonds Listed / Awaiting Listing
– Appreciation 3,128,000 0.14 12,769,868 0.29
– Depreciation 5,812,930 0.25 6,446,817 0.15
Government Securities
– Appreciation 7,518,325 0.32 9,473,501 0.21
– Depreciation 15,108,506 0.65 12,458,818 0.28
1.7 The aggregate value of investment securities (excluding CBLO and Reverse Repos) purchased and sold (including matured) during the financial year 2017-18 (excluding accretion of discount) are Rs. 14,486,649,897 and Rs. 16,148,072,832 respectively being 407.75% and 454.52% of the average daily net assets.
The aggregate value of investment securities (excluding CBLO and Reverse Repos) purchased and sold (including matured) during the financial year 2016 -17 (excluding accretion of discount) are Rs. 14,606,682,662 and Rs. 15,186,637,563 respectively being 315.56.% and 328.09% of the average daily net assets.

20
1.8 Non-Traded securities in the portfolio: Aggregate Value of Equity, Debt & Money Market Instruments and percentage to net assets is as under :
Security Category Fair Value (Rupees)
Percentage to Net Assets
Fair Value (Rupees)
Percentage to Net Assets
2018 2017
Debt Instruments 761,488,415 32.89 1,223,699,243 27.66
Money Market Instruments – – – –
Total 761,488,415 32.89 1,223,699,243 27.66
2 Disclosure Under Regulation 25(8) of the Securities and Exchange Board of India (Mutual Funds) Regulations, 1996 as amended
Details of amounts paid to associates in terms of Regulation 25 (8) are as follows :
Commission paid to Sponsor / AMC and its associates / related parties / group companies
Name of Sponsor / AMC and its associate / related parties / group companies
Nature of Association / Nature of
Relation
Period Covered
Business Given [Rs. In Crores]
% of Total Business
received by the Fund
Commission paid
[Rupees]
% of Total commission paid by the
Fund
The Hongkong and Shanghai Banking Corporation Limited
Associate of Investment Manager
2017-2018 6.61 14.26 7,173,669.13 61.29
Name of Sponsor / AMC and its associate / related parties / group companies
Nature of Association / Nature of
Relation
Period Covered
Business Given [Rs. In Crores]
% of Total Business
received by the Fund
Commission paid [Rupees]
% of Total commission paid by the
Fund
The Hongkong and Shanghai Banking Corporation Limited
Associate of Investment Manager
2016-2017 37.71 28.67 9,350,362.85 54.97
The brokerage paid was at rates similar to those offered to other brokers / distributors. The Commission/Brokerage paid to related party includes both upfront and trail and hence not comparable with the % of business brought and % of commission paid.
Further, The Hongkong and Shanghai Banking Corporation Limited, an associate of the Sponsor, is on the panel of bankers with whom HSBC Mutual Fund places money on fixed deposits and enters into reverse repo transactions from time to time at competitive rates.
(i) Any underwriting obligations undertaken by the Schemes of the mutual funds with respect to issue of securities associate companies - Nil (Previous year also Nil).
(ii) Devolvement - Nil (Previous year also Nil).
(iii) Subscription by the Schemes in the issues lead managed by associate companies - Nil (Previous year also Nil).
(iv) Subscription to any issue of equity or debt on private placement basis where the sponsor or its associate companies have acted as arranger or manager - Nil.
Notes to Accounts - Annexure I (Contd...)To the Abridged Balance Sheet and Revenue Account for the year ended March 31, 2018

21
3 None of the Investors held more than 25% of the total net assets of the Scheme at the years ended March 31, 2018 and March 31, 2017.
4 Unit Capital movement during the years ended March 31, 2018 and March 31, 2017** :
Description
2017-2018
Opening Units Subscription Redemption Closing Units Face Value per unit (Rupees)
Regular Plan - Growth Option
3,858,505.862 – 1,858,779.625 1,999,726.237 10
Regular Plan - Monthly Dividend Option
1,879,758.622 – 101,023.071 1,778,735.551 10
Regular Plan - Fortnightly Dividend Option
377.487 – – 377.487 10
Regular Plan - Quarterly Dividend Option
762,729.143 – 347,091.520 415,637.623 10
Regular Plan - Half Yearly Dividend Option
1,675.319 – – 1,675.319 10
Growth Option **** 102,146,825.303 3,053,441.023 57,689,141.535 47,511,124.791 10
Monthly Dividend Option ****
4,198,278.555 481,958.663 1,929,681.017 2,750,556.201 10
Fortnightly Dividend Option ****
1,250,665.508 20,492.578 372,608.359 898,549.727 10
Quarterly Dividend Option ****
11,779,859.739 208,033.693 8,480,907.337 3,506,986.095 10
Half Yearly Dividend Option ****
26,145.771 3,572.135 2,151.296 27,566.610 10
Direct Plan - Growth Option
80,051,403.479 13,355,786.172 47,862,844.943 45,544,344.708 10
Direct Plan - Fortnightly Dividend Option
– – – – 10
Direct Plan - Quarterly Dividend Option
5,018.096 85,671.445 4,345.459 86,344.082 10
Direct Plan - Monthly Dividend Option
– 50,000.000 – 50,000.000 10
Direct Plan - Half Yearly Dividend Option
15,473.861 940.584 – 16,414.445 10
Notes to Accounts – Annexure I (Contd...)To the Abridged Balance Sheet and Revenue Account for the year ended March 31, 2018

22
Description
2016-2017
Opening Units Subscription Redemption Closing Units Face Value per unit (Rupees)
Regular Plan - Growth Option
7,109,564.906 – 3,251,059.044 3,858,505.862 10
Regular Plan - Monthly Dividend Option
2,407,266.489 – 527,507.867 1,879,758.622 10
Regular Plan - Fortnightly Dividend Option
92,654.868 – 92,277.381 377.487 10
Regular Plan - Quarterly Dividend Option
1,195,506.105 – 432,776.962 762,729.143 10
Regular Plan - Half Yearly Dividend Option
1,675.319 – – 1,675.319 10
Growth Option **** 120,332,741.286 33,976,967.615 52,162,883.598 102,146,825.303 10
Monthly Dividend Option ****
6,601,113.574 3,305,056.048 5,707,891.067 4,198,278.555 10
Fortnightly Dividend Option ****
2,510,660.003 9,774,904.203 11,034,898.698 1,250,665.508 10
Quarterly Dividend Option ****
12,404,532.442 197,277.681 821,950.384 11,779,859.739 10
Half Yearly Dividend Option ****
912,478.569 – 886,332.798 26,145.771 10
Direct Plan - Growth Option
81,165,000.171 10,218,973.964 11,332,570.656 80,051,403.479 10
Direct Plan - Fortnightly Dividend Option
– – – – 10
Direct Plan - Quarterly Dividend Option
10,771.073 7,793.709 13,546.686 5,018.096 10
Direct Plan - Monthly Dividend Option
– – – – 10
Direct Plan - Half Yearly Dividend Option
14,531.582 942.279 – 15,473.861 10
** Units held by the AMC (Seed Capital) in Direct Plan Growth Option as on March 31, 2018 is 254,406.317 & as on March 31, 2017 is 254,406.317
**** Earlier known as Institutional Plan.
5 Previous year’s figures have been re-grouped / re-arranged where appropriate.
6 No contingent liabilities for the years ended March 31, 2018 and March 31, 2017.
7 Expenses other than Management Fees are Inclusive of GST / Service Tax where applicable.
8 Other Income for the year ended March 31, 2018 is Nil (2017: Nil)
Notes to Accounts – Annexure I (Contd...)To the Abridged Balance Sheet and Revenue Account for the year ended March 31, 2018

23
9 Investor Education Awareness
In view of the AMFI Best Practices Guidelines Circular No. 56/2015-16, the IEF ( Investor Education Fund) accrual is set aside in a separate bank account and the consolidated balance across all Schemes as on March 31, 2018. The break-up of which is as under:
Particulars March 31, 2018 Amount (in Rs. Lacs)
March 31, 2017 Amount (in Rs. Lacs)
Opening Balance 44.00 –
Add: Accrual during the year 219.83 182
Less: Transferred to AMFI 101.10 83
Less: Payable to AMFI (March accrual) 8.81 8
Add: Investment Income for the year 8.28 11
Less: Spent during the year 43.17 58
Closing Balance 119.02 44
10 The Annual Accounts of the Schemes prepared in accordance with the accounting policies and standards specified in the Ninth Schedule of The Securities and Exchange Board of India (Mutual Funds) Regulations, 1996 has been approved by the Board of Directors of HSBC Asset Management (India) Private Limited and The Board of Trustees of HSBC Mutual Fund at their meetings held on July 16, 2018 and July 17, 2018 respectively. The audit report attached herewith refers to the said Annual Accounts. The aforesaid abridged accounts are an extract of the Annual Accounts and are prepared in accordance with SEBI Circular No. IMD/Cir8/132968/2008 dated July 24, 2008.
Notes to Accounts – Annexure I (Contd...)To the Abridged Balance Sheet and Revenue Account for the year ended March 31, 2018

24
Voting Policy and Procedures
In view of SEBI guidelines related to “Role of Mutual Funds in Corporate Governance of Public Listed Companies”, AMIN has formulated its “Policy for Proxy Voting in Public Listed Companies”. The said policy and details of actual exercise of proxy votes along with the summary of votes cast and the auditors certification during the Financial Year 2017 – 18 is available on its website – http://www.assetmanagement.hsbc.com/in and in full Annual Report for the Financial Year 2017 – 18.

Statutory Details & Disclaimers
All returns have been sourced from Mutual Funds India Explorer software unless otherwise stated. With regard to equity schemes (including the equity component of MIPs), Fund performance is calculated on a total return basis (i.e. it includes dividends re-invested) while the benchmark is calculated on a price return basis (i.e. it does not consider dividends re-invested). This document has been prepared by HSBC Asset Management (India) Private Ltd (HSBC) for information purposes only and should not be construed as an offer or solicitation of an offer for purchase of any of the funds of HSBC Mutual Fund. All information contained in this document (including that sourced from third parties), is obtained from sources HSBC, the third party believes to be reliable but which it has not independently verified and HSBC, the third party makes no guarantee, representation or warranty and accepts no responsibility or liability as to the accuracy or completeness of such information. The information and opinions contained within the document are based upon publicly available information and rates of taxation applicable at the time of publication, which are subject to change from time to time. Expressions of opinion are those of HSBC only and are subject to change without notice. It does not have regard to specific investment objectives, financial situation and the particular needs of any specific person who may receive this document. Investors should seek financial advice regarding the appropriateness of investing in any securities or investment strategies that may have been discussed or recommended in this report and should understand that the views regarding future prospects may or may not be realized. Neither this document nor the units of HSBC Mutual Fund have been registered in any jurisdiction. The distribution of this document in certain jurisdictions may be restricted or totally prohibited and accordingly, persons who come into possession of this document are required to inform themselves about, and to observe, any such restrictions.
Investors should not invest in the Scheme solely based on the information provided in this document and should read the Scheme Information Document and Statement of Additional Information of the Fund for details. This document does not constitute an offering document.
No part of this publication may be reproduced, stored in a retrieval system, or transmitted, on any form or by any means, electronic, mechanical, photocopying, recording, or otherwise, without the prior written permission of HSBC Asset Management (India) Private Ltd.
Mutual Fund investments are subject to market risks, read all scheme related documents carefully.
HSBC Debt Fund (erstwhile HSBC Income Fund – Investments Plan)An open ended medium to long term debt Scheme investing in instruments such that the Macaulay duration of the portfolio is between 4 years to 7 years
Abridged Annual Report 2017 - 2018
1
Dear Investor,
Globally, we are witnessing a very interesting phase. The equity markets delivered a stellar performance in 2017. However, there are worries about the impact of higher rates, global trade wars, an economic growth moderation and higher volatility.
Closer home, India has become the world’s sixth-biggest economy. India has doubled its GDP to USD 2.2 trillion within a decade. The introduction of reform measures, including demonetisation and the Goods and Services Tax (GST), had put pressure on selective parts of the economy in 2017. The impact of these measures is likely to be transitory. India’s economic growth is expected to accelerate from 6.7% in FY18 to 7.4% in the current year as per IMF forecasts.
There has been a shift in the domestic savings pool supporting the market. Domestic investors have been increasing exposure to equities and financial assets moving away from gold and real estate. Mutual funds witnessed sizable inflows on the back of the boost in liquidity within the banking system from demonetisation. The AUM of the mutual fund industry grew by 21.7% in March 2018 compared to March 2017.
With growth, comes responsibility. Last year, the regulator, Securities and Exchange Board of India (SEBI) issued a circular to rationalise and categorise mutual fund schemes in India. We are pleased to state that none of our funds needed to be redesigned. All our schemes have been defined as per the new categorisation. We believe this classification will simplify investing into mutual funds and enhance comparability within the schemes offered.
As India moves to a digital age, e-commerce platforms are becoming increasingly popular. I request you to logon to our online transaction platform. It is a quick, convenient and an efficient tool to invest into our funds and manage your investments online.
At HSBC Global Asset Management, India, we are dedicated to one goal: delivering exceptional investment management for our clients. By bringing together our

2
global investment knowledge and capabilities, we are able to offer specialised expertise across asset classes. This has helped us to become a trusted partner to our individual and institutional investors.
We remain committed to our long-term perspective and disciplined investment approach as we conduct a rigorous, fundamental analysis of investments with a strong emphasis on risk management. Although the investment landscape appears favourable, it is worth remembering that markets are dynamic and constantly evolving. Therefore, we believe active, professional investment management serves investors well. Amid changing markets and economic conditions, we are confident that investors with a well-diversified portfolio and a patient, long-term outlook should be well positioned for the years ahead.
Together we thrive.
Warm regards,
Ravi Menon
Chief Executive Officer, HSBC Global Asset Management, India

3
SPONSORHSBC Securities and Capital Markets (India) Private LimitedRegd. Office: 52/60, Mahatma Gandhi Road, Fort, Mumbai - 400 001.
TRUSTEEBoard of TrusteesOffice: 16, Veer Nariman Road, Fort, Mumbai 400 001.
ASSET MANAGEMENT COMPANYHSBC Asset Management (India) Private LimitedCorp. & Regd. Office: 16, Veer Nariman Road, Fort, Mumbai 400 001.
CUSTODIANStandard Chartered Bank (SCB)Corp. & Regd. Office: Crescenzo, Securities Services, 3rd Floor, C-38/39, G-Block, Bandra Kurla Complex, Bandra East, Mumbai – 400051.
AUDITORS TO THE SCHEMEBSR & Co. LLPChartered Accountants 5th Floor, Lodha Excelus, Apollo Mills Compound, N.M. Joshi Marg, Mahalaxmi, Mumbai 400 011.
REGISTRAR & TRANSFER AGENTSComputer Age Management Services Private Limited (CAMS)Unit: HSBC Mutual Fund ’C’ Block, 2nd Floor, Hanudev Info Park P. Ltd., SF No. 558/2, Udayampalayam Road, Nava India, Coimbatore - 641 028.
BOARD OF TRUSTEESMr. Nasser Munjee
Mr. Manu Tandon
Mr. Mehli Mistri
Mr. Dilip J. Thakkar
Ms. Jasmine Batliwalla
Mr. Pedro Bastos
BOARD OF DIRECTORSMs. Kishori J. Udeshi - Chairperson
Mr. S. P. Mustafa
Mr. Dinesh Mittal
Mr. Ravi Menon - Chief Executive Officer

4
The Trustees of HSBC Mutual Fund (“Fund”) present the Sixteenth Annual Report and the audited abridged financial statements of the schemes of the Fund for the year ended March 31, 2018.
As at March 31, 2018, the Fund offered 30 schemes across asset classes to meet the varying investment needs of the investors. Notably, three Schemes of HSBC Mutual Fund viz. HSBC Large Cap Equity Fund, HSBC Short Duration Fund and HSBC Cash Fund have completed 15 years of operations during the year.
During the year, the Fund has launched Plan(s) under Fixed Term Series and carried out merger of the existing schemes viz HSBC Dividend Yield Equity Fund merged into HSBC Multi Cap Equity Fund (HMEF), erstwhile HSBC India Opportunities Fund, as offering sub-scale fund was not in the interest of the unitholders.
Further, in order to bring uniformity in the practice across Mutual Funds and to standardize the scheme categories and characteristics of schemes, SEBI vide its circular no. SEBI/HO/IMD/DF3/CIR/P/2017/114 dated October 06, 2017, issued guidelines for categorization and rationalization of Mutual Fund schemes.
Accordingly, HSBC Large Cap Equity Fund (erstwhile HSBC Equity Fund), HSBC Small Cap Equity Fund (erstwhile HSBC Mid Cap Equity Fund) , HSBC Infrastructure Equity Fund, HSBC Global Emerging Market Fund (erstwhile HSBC Emerging Market Fund), HSBC Debt Fund (erstwhile HSBC Income Fund – Investments Plan), HSBC Short Duration Fund (erstwhile HSBC Income Fund – Short Term Plan), HSBC Low Duration Fund (erstwhile HSBC Ultra Short Term Bond Fund), HSBC Regular Savings Fund (erstwhile HSBC Monthly Income Plan) and HSBC Managed Solutions have undergone fundamental attributes changes with effective from March 14, 2018.
The Fund continues its focus on delivering consistent long term returns. The comments on the performance of the Scheme(s) is provided hereinafter. Dividends were declared under various schemes as per the provisions contained in the respective Scheme Information Documents after considering the distributable surplus available under the respective Schemes. Details of dividends declared can be viewed on our website at www.assetmanagement.hsbc.com/in.
1. Scheme Performance, future outlook and oPerationS of the SchemeS
a. Operations and Performance of the Schemes
HSBC Debt Fund (HDF) erstwhile HSBC Income Fund – Investments Plan(An open ended medium to long term debt Scheme investing in instruments such that the Macaulay duration of the portfolio is between 4 years to 7 years)
HDF seeks to provide reasonable income through a diversified portfolio of fixed income securities such that the Macaulay duration of the portfolio is between 4 years to 7 years. However, there can be no assurance or guarantee that the investment objective of the scheme would be achieved.
The net assets of HSBC Debt Fund amounted to Rs. 43.84 crores as at March 31, 2018 as compared to Rs. 56.72 crores as at March 31, 2017. Around 92.89% of the net assets was invested in debt and money market instruments and 7.11% of the net assets comprised of reverse repos/CBLO and net current assets as at March 31, 2018.
HDF underperformed its scheme’s benchmark due to very high volatility and expectation that the valuations were reasonable. However, markets went to perfect storm with higher crude prices, low liquidity and pressure on currency, apart from rate hike expectations.
Scheme Name & Benchmarks Absolute Returns
(%)
Compounded Annualized Returns (%)
Date of Inception : 10 December 2002 1 Year 3 Years 5 Years Since Inception
HSBC Debt Fund – Growth 1.73 5.29 6.38 6.88
CRISIL Composite Bond Fund Index (Scheme Benchmark) 5.17 8.21 8.60 6.75
CRISIL 10 Year Gilt Index (Standard Benchmark) -0.25 6.45 6.42 5.89
Rs. 10,000, if invested in HDF, would have become 10,173 11,676 13,626 27,689
Trustees’ ReportFor the year ended March 31, 2018

5
Scheme Name & Benchmarks Absolute Returns
(%)
Compounded Annualized Returns (%)
Date of Inception : 10 December 2002 1 Year 3 Years 5 Years Since Inception
Rs. 10,000, if invested in CRISIL Composite Bond Fund Index, would have become
10,518 12,676 15,109 27,178
Rs. 10,000, if invested in CRISIL 10 Year Gilt Index, would have become
9,975 12,067 13,652 24,013
Past performance may or may not be sustained in future. The returns for the respective periods are provided as on last business day of March 2018 for Growth Option. Different plans shall have a different expense structure. Performance of the respective benchmark is calculated as per the Total Return Index (TRI).
b. Market Overview & Outlook (as furnished by HSBC Asset Management (India) Private Limited)
EqUITY OUTLOOKIndian equity markets continued to remain strong during fiscal year 2017-18 and posted gains of 11.76% by S&P CNX Nifty and 13.24% by BSE Midcap index respectively. Biggest drivers of the markets were, robust DII flow into equities, continued push of mega reforms – Goods and Services Tax (GST) implementation, Insolvency and Bankruptcy Code implementation, Real Estate (Regulation and Development) Act, second consecutive normal monsoon, and electoral victories of the ruling party in many state elections. On the other hand, the markets weather the storm of disruption in economy due to GST implementation, lingering impact of demonetization, muted FII flows, and rising yields in developed markets. Domestic Mutual Fund segment had their best ever year and they brought in ~USD 22 bn of net inflows in equities during the year. Even after witnessing ~USD 4.3 bn of net outflows from the domestic insurers, the net DII tally was a very impressive ~USD 17.7 bn of net inflows. There were mixed global cues well and the Foreign Institutional Investors (FIIs) net bought Indian equities worth USD 3.2 bn. The inflows by both FIIs and domestic MFs acted as a factor in the strong market performance.
Indices Returns (April 1, 2017 to March 31, 2018) 1 Year (%)
S&P BSE Sensex 12.70%
NSE CNX Nifty 11.76%
S&P BSE 100 12.12%
S&P BSE 200 12.49%
S&P BSE 500 13.21%
S&P BSE Midcap 14.31%
S&P BSE 250 Small-cap 14.13%
Source: Bloomberg (All values are total return)
Our view on the key aspects related to equity markets are presented below -
The impressive performance in equity markets during FY 2017-18 has come on the back of strong liquidity largely by domestic MFs but supported in party by FII flows, positive global growth, benign macro – both domestically and global, expectation of the continuation of favorable policy environment domestically and expectation of corporate earnings revival. Possibility of sound macro, economic reforms and implementation of existing reforms have increased, especially after continued success of the ruling party at the centre in state elections. However, after this strong performance in markets and rather long wait for earnings to be delivered has meant that the equity markets are currently trading above their historical averages.
Trustees’ ReportFor the year ended March 31, 2018 (Contd...)

6
Moving into FY 2018-19, we expect a continuation of the economic recovery process domestically, recovery in corporate earnings - led early by volume growth, and continued DII flows. Government led investment spending and rural consumption are likely to lead with private sector investments contributing later (possibly after general elections 2019). The budget document that was presented in early February provides a good medium term policy direction for the economy. Occasionally the policy actions can serve up a few bumps and jolts but over the medium term, across different governments, there is a thread of continuity connecting many key economic policies such as in the case of this year’s union budget. We, in our investment process, prefer to take comfort in these threads of continuity and remain constructive on the India growth story. This makes us positive on the Indian equity markets over the medium to long term.
Risks are in the form of market valuations trending above historical averages, weaker than expected delivery in corporate earnings going forward, external news flows related to trade protectionism, developed market central banks raising rates prematurely, and geopolitical tensions and other eco-political events would also influence market performance going forward, as the recent rally in the markets was supported by strong FII inflows.
DEBT OUTLOOKFixed Income in Financial Year 2017-18 has seen volatility further step up in this year. Markets went to perfect storm with higher crude prices, low liquidity and pressure on currency, apart from rate hike expectations.
Inflation has followed the glide path to lower numbers towards 4% RBI target and even lower than the target number when inflation printed a lowly 1.46% in June 2018 on back of lower food prices. RBI went for a cut despite of neutral stance. This positivity continued till until crude shock came in form of higher crude process. Global prices of Brent crude saw substantial increase in second half of the year, which jeopardized the inflation path. Other worries that gathered around this time were related to GST collection and eventual impact on fiscal situation.
Government of India allowed the fiscal deficit to slip to 3.5% (budget 3.2%) and kept next year target at 3.3% (in place of earlier path of 3%). This was on back of some excise relaxation for oil products and a month less collected for GST due to implementation in the current year. The fear of fiscal slippage alongwith the announcement of higher bond issuances spooked the bond markets into higher yields. Government finally borrowed only INR 90 bln extra (in place of INR 500 bln announced initially).
On the Monetary front the year was very volatile as well. RBI changed its stance to neutral causing some worry around rate hikes. Thereafter it cut rates and again went for OMO sales operations simultaneously. This created some confusion in the market participants regarding rates direction. Finally extra supply, higher oil prices and higher inflation paved way for rates higher. RBI also held position on regulatory forbearance about spreading out losses by banks publicly. It eventually gave up the position in the end of March. However, the swift changes in stance caused lot of pressure and volatility in bonds.
Liquidity situation continuously deteriorated due to OMO sales initially and withdrawal of deposits due to remonetisation. Further liquidity was absorbed out due to portfolio outflows and reduction in reserves. Despite of defense from RBI utilizing the reserves, the currency depreciated meaningfully, which caused further jitters in foreign investor sentiments. Lack of liquidity also affected 1-3 year rates which were elevated in second half of the year.
Going forward following are key variables to watch out for:• Liquidity: Liquidity will drive short end rates and eventually drive decisions leading to market interventions
and CRR cuts. RBI has focused now on neutral liquidity stance and providing liquidity to system, which will bode well short end rates.
• Inflation: Inflation numbers will determine future course of action for RBI and remains a critical variable for policy. We expect inflation to remain at 4.7% level in the ease in second half of FY 2018-19 in line with RBI’s expectations.
• Growth: GDP growth numbers as well as industrial activity will also determine the decision on policy.
• Fiscal deficit: Fiscal deficit and government spending will determine the government borrowing and crowding out in interest rate curve. We expect prudence in government spending and prospect of spending on infrastructure to pick up which will crowd in private investment as well.
Trustees’ ReportFor the year ended March 31, 2018 (Contd...)

7
• Current Account Deficit: Current Account Deficit determines how the pressure on currency works and effective management of forex reserves.
• Currency levels: Level of INR will determine how the central bank reacts to the situation on the global crisis etc.
2. Brief Background of SPonSorS, Board of truSteeS and aSSet management comPany
a. Sponsor
HSBC Mutual Fund is sponsored by HSBC Securities and Capital Markets (India) Private Limited (HSCI). The Sponsor is the Settler of the Mutual Fund Trust. The Sponsor has entrusted a sum of Rs. 1,00,000 (Rupees One Lakh only) to the Trustee as the initial contribution towards the corpus of the Mutual Fund.
HSCI offers integrated investment banking services, securities and corporate finance & advisory. HSCI is a member of the Bombay Stock Exchange Limited and National Stock Exchange (capital and derivative market segments). HSCI holds 100% of the paid up equity share capital of HSBC Asset Management (India) Private Limited.
b. HSBC Mutual Fund
HSBC Mutual Fund (“the Mutual Fund” or “the Fund”) has been constituted as a Trust in accordance with the provisions of the Indian Trusts Act, 1882 (2 of 1882) vide a Trust Deed dated February 7, 2002 with HSBC Securities and Capital Markets (India) Private Limited, as the Sponsor and the Board of Individual Trustees. The Trustee has entered into an Investment Management Agreement dated February 7, 2002 with HSBC Asset Management (India) Private Limited (AMC) to function as the Investment Manager for all the schemes of the Fund. The Fund was registered with SEBI vide registration number MF/046/02/5 dated May 27, 2002.
The Trust has been formed for the purpose of pooling of capital from the public for collective investment in securities for the purpose of providing facilities for participation by persons as beneficiaries in such investments and in the profits/income arising therefrom.
c. Board of Trustees (the Trustees)
The Board of Trustees is the exclusive owner of the Trust Fund and holds the same in trust for the benefit of the unit holders. The Trustees have been discharging their duties and carrying out the responsibilities as provided in the SEBI (Mutual Funds) Regulations, 1996 and the Trust Deed. The Trustees seek to ensure that the Fund and the schemes floated there under are managed by the AMC in accordance with the Trust Deed, the said Regulations, directions and guidelines issued by the SEBI, the Stock Exchanges, the Association of Mutual Funds in India and other regulatory agencies.
d. Asset Management Company (the AMC)
HSBC Asset Management (India) Private Limited (the Investment Manager or the AMC) is a private limited company incorporated under the Companies Act, 1956 on December 12, 2001 having its Registered Office at 16, V. N. Road, Fort, Mumbai 400 001. HSBC Asset Management (India) Private Limited has been appointed as the Asset Management Company of HSBC Mutual Fund by the Trustee vide Investment Management Agreement (IMA) dated February 7, 2002 and executed between the Trustees and the AMC. SEBI approved the AMC to act as the Investment Manager of the Fund vide its letter No. MFD/BC/163/2002 dated May 27, 2002. The paid-up equity share capital of the AMC is Rs. 61.59 crores. The AMC is registered as a Portfolio Manager under the SEBI (Portfolio Managers) Regulations, 1993 vide registration no. INP000001322. The AMC also offers non-binding Advisory services to offshore funds under the mutual fund license.
HSBC Securities and Capital Markets (India) Private Limited holds 100% of the paid up equity share capital of the AMC.
Trustees’ ReportFor the year ended March 31, 2018 (Contd...)

8
3. inveStment oBjective of the SchemeS The investment objective of the respective schemes has been provided above under the heading “Scheme
Performance, Future Outlook and Operation of the Scheme” (Refer Section 1).
4. Significant accounting PolicieS The Significant Accounting Policies form part of the Notes to the Accounts annexed to the Balance Sheet
of the Schemes in the Full Annual Report. The accounting policies are in accordance with Securities Exchange Board of India (Mutual Funds) Regulations 1996.
5. unclaimed dividendS & redemPtionS Summary of number of investors & corresponding amount Scheme-wise as on March 31, 2018.
SchemeUnclaimed Dividend Unclaimed Redemption
Amount (Rs.) No. of Investors
Amount (Rs.) No. of Investors
HSBC Debt Fund 893,382.18 205 1,757,472.68 27
6. inveStor ServiceSThe number of official points of acceptance of transactions is 205 locations. In addition to the offices of the Registrar & Transfer agents, the AMC has Investor Service Centres in 9 locations at its own offices - namely Mumbai, New Delhi, Kolkata, Bangaluru, Pune, Ahmedabad, Hyderabad, Chandigarh and Chennai. With a view to enhance customer convenience, the AMC has the facility of priority based servicing to key distributors through the enhancement of the Interactive Voice Reponses. The AMC has a single Toll Free number which can be dialed from anywhere in India. The call centre service is being managed by the Registrar and Transfer Agents.
On the distribution front, the number of empanelled distributors was 460 as on March 31, 2018. During the year, the AMC initiated tie-ups for online distribution of the Mutual Fund’s schemes with several channel partners taking the total number of such tie-ups to 42.
7. detailS of inveStor grievance redreSSalThe details of the redressal of investor complaints received against HSBC Mutual Fund during April 2017 - March 2018 are as follows:
2017-2018
Com- plaint Code
Type of complaint (a) No. of complaints
pending at the
beginning of the year
(b) No. of complaints received during
the year
Action on (a) and (b)
Resolved Non Actiona-
ble*
Pending
Within 30
days
30 - 60 days
60 - 180 days
Beyond 180 days
0 - 3 months
3 - 6 months
6 - 9 months
9 - 12 months
I A Non receipt of Dividend on Units
0 5 4 1 0 0 0 0 0 0 0
I B Interest on delayed payment of Dividend
0 0 0 0 0 0 0 0 0 0 0
I C Non receipt ofRedemption Proceeds
1 12 12 1 0 0 0 1 0 0 0
I D Interest on delayedp a y m e n t o f Redemption
0 1 1 0 0 0 0 0 0 0 0
II A Non receipt of Statement of Account / Unit Certificate
0 0 0 0 0 0 0 0 0 0 0
Trustees’ ReportFor the year ended March 31, 2018 (Contd...)

9
2017-2018
Com- plaint Code
Type of complaint (a) No. of complaints
pending at the
beginning of the year
(b) No. of complaints received during
the year
Action on (a) and (b)
Resolved Non Actiona-
ble*
Pending
Within 30
days
30 - 60 days
60 - 180 days
Beyond 180 days
0 - 3 months
3 - 6 months
6 - 9 months
9 - 12 months
II B D i s c r e p a n c y i n Statement of Account
0 0 0 0 0 0 0 0 0 0 0
II C Data corrections in Investor details **
0 34 34 0 0 0 0 0 0 0 0
II D Non receipt of Annual Report /Abridged Summary
0 0 0 0 0 0 0 0 0 0 0
III A Wrong switch between Schemes
0 0 0 0 0 0 0 0 0 0 0
III B Unauthorized switch between Schemes
0 0 0 0 0 0 0 0 0 0 0
III C Deviation from Scheme attributes
0 0 0 0 0 0 0 0 0 0 0
III D Wrong or excess charges / load
0 0 0 0 0 0 0 0 0 0 0
III E Non updat ion of changes viz. address, PAN, bank details, nomination, etc
0 6 6 0 0 0 0 0 0 0 0
IV Others 1 41 42 0 0 0 0 0 0 0 0
Total 2 99 99 2 0 0 0 0 0 0 0
Summary of Complaints for FY 2017-18
Particulars Count
Total complaints received 99
Total number of folios 140099
% of complaints against the folio 0.071%
# active folios** As per AMFI Best Practice Guidelines Circular No.25/2011-12 for Revisions in the Guidelines on
Standardization of Complaints/Grievances Reporting Procedure. If “Others” include a type of complaint which is more than 10% of overall complaints, then such a reason should be provided separately. Hence data corrections in Investor Details is included as a separate category
* Non actionable means the complaint is incomplete / outside the scope of the mutual fund
8. inveStor education initiativeS The Fund undertook various investor education and awareness initiatives related to investments in mutual funds throughout India in English / Hindi and Regional languages via mass media. The Fund conducted 16 roadshows at various locations in India to promote various Investor Awareness related topics including Asset Allocation, SIPs, Equity Mutual Funds and Financial Planning. The Fund has a Year-long tie-up with Mutual Fund Insights Magazine that includes 3 pages of content and advertorial publication in their monthly issue. Each issue contains a story promoting SIPs to achieve one’s various investment goals. In the month of
Trustees’ ReportFor the year ended March 31, 2018 (Contd...)

10
December 2017 and January 2018 investor awareness promotion was done through Outlook and Outlook Money magazines through advertorials on various Mutual Fund topics.
9. Statutory detailSa) The Sponsors are not responsible or liable for any loss resulting from the operation of the Schemes of
the Fund beyond initial contribution of Rs. 1 lakh for setting up the Fund.
b) The price and redemption value of the units, and income from them, can go up as well as down with fluctuations in the market value of its underlying investments.
c) Full Annual Report shall be disclosed on the website at www.assetmanagement.hsbc.com/in and shall be available for inspection at the Head Office of the Mutual Fund. Present and prospective unit holders can obtain copy of the Trust Deed, the full Annual Report of the Scheme(s), the Annual Report of HSBC Asset Management (India) Private Limited and the text of the relevant Scheme(s) at a price.
10. acknowledgementSThe Trustees wish to thank the Unit holders of the Schemes for their support throughout the year and also thank the Government of India, the Securities and Exchange Board of India (SEBI), the Reserve Bank of India (RBI) and the Association of Mutual Funds in India (AMFI) for the guidance provided by them. The Trustees also appreciate the services provided by the Registrar and Transfer Agent, Fund Accountant, Custodian, Bankers, Distributors and Brokers. The guidance and services provided by the Auditors and advocates and the ebullience, sincerity and dedication of the employees of HSBC Asset Management (India) Private Limited is also appreciated.
The Trustees look forward to the continued support of everyone.
For and on behalf of the Board of Trustees of HSBC Mutual Fund
Sd/-
Dilip Thakkar
Trustee
Mumbai
July 17, 2018.
Trustees’ ReportFor the year ended March 31, 2018 (Contd...)

11
Independent Auditors’ Report
To the Board of Trustees of
HSBC Mutual Fund – HSBC Debt Fund(Formerly known as HSBC Income Fund - Investment Plan)
Report on the Financial StatementsWe have audited the accompanying Financial Statements of HSBC Debt Fund (formerly known as HSBC Income Fund - Investment Plan) (the ‘Scheme’), which comprise the balance sheet as at 31 March 2018 and the related revenue account for the year then ended, and a summary of significant accounting policies and other explanatory information, annexed thereto.
Management’s responsibility for the Financial StatementsThe Board of Trustees to the HSBC Mutual Fund (the ‘Board of Trustees’) and HSBC Asset Management (India) Private Limited (the ‘AMC’), being the investment manager to HSBC Mutual Fund (the ‘Fund’) (collectively referred as ‘Management’), are responsible for the preparation of these financial statements that give a true and fair view of the financial position and financial performance of the Scheme in accordance with the accounting policies and standards specified in the Ninth Schedule of the Securities and Exchange Board of India (Mutual Funds) Regulations, 1996, as amended (the ‘Regulations’) and the accounting principles generally accepted in India. This responsibility includes maintenance of adequate accounting records for safeguarding of the assets of the Scheme and for preventing and detecting frauds and other irregularities; selection and application of appropriate accounting policies; making judgments and estimates that are reasonable and prudent; and design, implementation and maintenance of adequate internal financial controls, that were operating effectively for ensuring the accuracy and completeness of the accounting records, relevant to the preparation and presentation of the financial statements that give a true and fair view and are free from material misstatement, whether due to fraud or error.
In preparing the financial statements, management is responsible for assessing the Scheme’s ability to continue as a going concern, disclosing, as applicable, matters related to going concern and using the going concern basis of accounting unless management either intends to liquidate the Fund or to cease operations, or has no realistic alternative but to do so.
Auditor’s responsibilityOur responsibility is to express an opinion on these financial statements based on our audit. We conducted our audit in accordance with the Standards on Auditing issued by the Institute of Chartered Accountants of India (the ‘ICAI’). Those Standards require that we comply with ethical requirements and plan and perform the audit to obtain reasonable assurance about whether the financial statements are free from material misstatement.
An audit involves performing procedures to obtain audit evidence about the amounts and disclosures in the financial statements. The procedures selected depend on the auditor’s judgment, including the assessment of the risks of material misstatement of the financial statements, whether due to fraud or error. In making those risk assessments, the auditor considers internal controls relevant to preparation and fair presentation of the financial statements, of the Scheme, in order to design audit procedures that are appropriate in the circumstances, but not for the purpose of expressing an opinion on the effectiveness of the Scheme’s internal controls. An audit also includes evaluating the appropriateness of accounting policies used and the reasonableness of the accounting estimates made by Management, as well as evaluating the overall presentation of the financial statements.
We are also responsible to conclude on the appropriateness of management’s use of the going concern basis of accounting and, based on the audit evidence obtained, whether a material uncertainty exists related to events or conditions that may cast significant doubt on the Scheme’s ability to continue as a going concern. If we conclude that a material uncertainty exists, we are required to draw attention in the auditor’s report to the related disclosures in the financial statements or, if such disclosures are inadequate, to modify the opinion. Our conclusions are based on the audit evidence obtained up to the date of the auditor’s report. However, future events or conditions may cause the Scheme to cease to continue as a going concern.
We believe that the audit evidence we have obtained is sufficient and appropriate to provide a basis for our audit opinion.

12
OpinionIn our opinion, and to the best of our information and according to the explanations given to us, the aforesaid financial statements give the information required by the Regulations in the manner so required and give a true and fair view in conformity with the accounting principles generally accepted in India:
(i) in the case of the balance sheet, of the state of affairs of the Scheme as at 31 March 2018; and
(ii) in the case of the revenue account, of the net surplus for the year ended on that date.
Report on other Legal and Regulatory Requirements1 As required by Regulation 55(4) to the Regulations, we report that:
(a) We have obtained all information and explanations which, to the best of our knowledge and belief, were necessary for the purposes of the audit;
(b) The balance sheet and revenue account have been prepared in accordance with the accounting policies and standards specified in the Ninth Schedule of the Regulations.
2 As required by Clause 5(ii)(2) of the Eleventh Schedule of the Regulations, we report that the balance sheet and revenue account are in agreement with the books of account of the Scheme.
3 In our opinion and on the basis of information and explanations given to us, the methods used to value non - traded securities, as at 31 March 2018, as determined by the Board of Directors of AMC, are in accordance with the Regulations and other guidelines issued by the Securities and Exchange Board of India as applicable and approved by the Board of Trustees are fair and reasonable.
For B S R & Co. LLP Chartered Accountants Firm’s Registration No: 101248W/W-100022
Sd/-
Milind Ranade Partner Membership No: 100564
Place : Mumbai Date : July 17, 2018.
Independent Auditors’ Report (Contd...)

13
Rs. in Lakhs
HSBC DEBT FUNDAs at March
31, 2018As at March
31, 2017
LIABILITIES1 Unit Capital 1,723.90 2,327.772 Reserves & Surplus2.1 Unit Premium Reserves (517.63) (493.80)
2.2 Unrealised Appreciation Reserve 0.16 53.722.3 Other Reserves 3,177.77 3,783.833 Loans & Borrowings – –4 Current Liabilities & Provisions4.1 Provision for doubtful Income/Deposits – –4.2 Other Current Liabilities & Provisions 337.90 34.18
TOTAL 4,722.10 5,705.70
ASSETS1 Investments1.1 Listed Securities: – –1.1.1 Equity Shares – –1.1.2 Preference Shares – –1.1.3 Equity Linked Debentures – –1.1.4 Other Debentures & Bonds 797.22 1,975.421.1.5 Securitised Debt securities – –1.2 Securities Awaited Listing:1.2.1 Equity Shares – –1.2.2 Preference Shares – –1.2.3 Equity Linked Debentures – –1.2.4 Other Debentures & Bonds – –1.2.5 Securitised Debt securities – –1.3 Unlisted Securities1.3.1 Equity Shares – –1.3.2 Preference Shares – –1.3.3 Equity Linked Debentures – –1.3.4 Other Debentures & Bonds 299.50 301.021.3.5 Securitised Debt securities – –1.4 Government Securities 2,786.78 2,978.671.5 Treasury Bills – –1.6 Commercial Paper – –1.7 Certificate of Deposits 188.31 –1.8 Bill Rediscounting – –1.9 Units of Domestic Mutual Fund – –1.10 Foreign Securities – –
Total Investments 4,071.81 5,255.112 Deposits 7.80 3.963 Other Current Assets3.1 Cash & Bank Balance 0.71 5.333.2 CBLO/Reverse Repo Lending 551.20 201.443.3 Others 90.58 239.864 Deferred Revenue Expenditure (to the extent not written off) – –
TOTAL 4,722.10 5,705.70
Notes to Accounts - Annexure I
Abridged Balance Sheet as at March 31, 2018

14
Abridged Revenue Account for the year ended March 31, 2018
Rs. in Lakhs
HSBC DEBT FUNDCurrent
Year ended March 31, 2018
Previous Year ended
March 31, 2017
1 INCOME1.1 Dividend – –1.2 Interest 396.79 498.911.3 Realised Gain / (Loss) on Foreign Exchange Transactions – –1.4 Realised Gains / (Losses) on Interscheme sale of investments – –1.5 Realised Gains / (Losses) on External sale / redemption of
investments(136.59) 316.75
1.6 Realised Gains / (Losses) on Derivative Transactions – –1.7 Other Income – –
(A) 260.20 815.66
2 EXPENSES2.1 Management fees 59.89 71.222.2 GST / Service tax on Management fees 10.35 10.622.3 Transfer agents fees and expenses 2.10 2.362.4 Custodian fees 0.09 0.112.5 Trusteeship fees 0.03 0.092.6 Commission to Agents 12.48 23.012.7 Marketing & Distribution expenses 0.03 0.042.8 Audit fees 0.20 0.202.9 Investor Education Expenses 1.10 1.342.10 Other operating expenses 0.83 0.642.11 Less: Expenses to be Reimbursed by the Investment Manager – –
(B) 87.10 109.63
3 NET REALISED GAINS / (LOSSES) FOR THE YEAR (A–B=C) 173.10 706.03
4 Change in Unrealised Depreciation in value of investments (D) (4.49) (1.36)
5 NET GAINS / (LOSSES) FOR THE YEAR [E=(C+D)] 168.61 704.67
6 Change in unrealised appreciation in the value of investments (F) (53.57) (55.66)
7 NET SURPLUS / (DEFICIT) FOR THE YEAR (E+F=G) 115.04 649.01
7.1 Add: Balance transfer from Unrealised Appreciation Reserve 53.57 55.66
7.2 Less: Balance transfer to Unrealised Appreciation Reserve – –7.3 Add / (Less): Equalisation (751.25) (1,698.18)7.4 Transfer from Reserve Fund 3,783.83 4,814.377.5 Transfer from Unit Premium Reserve – –
8 Total 3,201.19 3,820.86
9 Dividend Appropriation9.1 Income Distributed during the year (16.90) (26.73)9.2 Tax on income distributed during the year (6.52) (10.30)
10 Retained Surplus / (Deficit) carried forward to Balance Sheet 3,177.77 3,783.83
Notes to Accounts – Annexure I

15
Key Statistics for the year ended March 31, 2018
HSBC DEBT FUNDCurrent
Year ended March 31, 2018
Previous Year ended
March 31, 2017
1. NAV per unit (Rs.): Open Regular Growth Option 27.2545 24.9657 Regular Dividend Option – – Regular Quarterly Dividend Option 11.0019 10.9417 Regular Weekly Dividend Option – – Regular Monthly Dividend Option – – Institutional Growth Option – – Institutional Dividend Option – – Institutional Weekly Dividend Option – – Institutional Monthly Dividend Option – – Institutional Plus Growth Option – – Institutional Plus Weekly Dividend Option – – Institutional Plus Monthly Dividend Option – – Direct Plan - Growth Option 28.1815 25.6219 Direct Plan - Dividend Option – – Direct Plan - Weekly Dividend Option – – Direct Plan - Monthly Dividend Option – – Direct Plan - Quarterly Dividend Option – – High Regular Growth Option 28.1648 28.0149 Regular Dividend Option – – Regular Quarterly Dividend Option 11.2857 11.7630 Regular Weekly Dividend Option – – Regular Monthly Dividend Option – – Institutional Growth Option – – Institutional Dividend Option – – Institutional Weekly Dividend Option – – Institutional Monthly Dividend Option – – Institutional Plus Growth Option – – Institutional Plus Weekly Dividend Option – – Institutional Plus Monthly Dividend Option – – Direct Plan - Growth Option 29.1976 28.8923 Direct Plan - Dividend Option – – Direct Plan - Weekly Dividend Option – – Direct Plan - Monthly Dividend Option – – Direct Plan - Quarterly Dividend Option – – Low Regular Growth Option 27.0801 25.0235 Regular Dividend Option – – Regular Quarterly Dividend Option 10.3476 10.9182 Regular Weekly Dividend Option – – Regular Monthly Dividend Option – – Institutional Growth Option – – Institutional Dividend Option – –

16
Key Statistics for the year ended March 31, 2018 (Contd...)
HSBC DEBT FUNDCurrent
Year ended March 31, 2018
Previous Year ended
March 31, 2017
Institutional Weekly Dividend Option – – Institutional Monthly Dividend Option – – Institutional Plus Growth Option – – Institutional Plus Weekly Dividend Option – – Institutional Plus Monthly Dividend Option – – Direct Plan - Growth Option 28.0352 25.6839 Direct Plan - Dividend Option – – Direct Plan - Weekly Dividend Option – – Direct Plan - Monthly Dividend Option – – Direct Plan - Quarterly Dividend Option – – End Regular Growth Option 27.7088 27.2545 Regular Dividend Option – – Regular Quarterly Dividend Option 10.5878 11.0019 Regular Weekly Dividend Option – – Regular Monthly Dividend Option – – Institutional Growth Option – – Institutional Dividend Option – – Institutional Weekly Dividend Option – – Institutional Monthly Dividend Option – – Institutional Plus Growth Option – – Institutional Plus Weekly Dividend Option – – Institutional Plus Monthly Dividend Option – – Direct Plan - Growth Option 28.8667 28.1815 Direct Plan - Dividend Option – – Direct Plan - Weekly Dividend Option – – Direct Plan - Monthly Dividend Option – – Direct Plan - Quarterly Dividend Option – –2. Closing Assets Under Management (Rs. in Lakhs) End 4,384 5,672 Average (AAuM)1 5,481 6,6773. Gross income as % of AAuM2 4.75% 12.22%4. Expense Ratio: a. Total Expense as % of AAuM (including service tax / GST on Management fees) (planwise) Regular Growth Option 2.02% 1.99% Institutional Growth Option – – Institutional Plus Growth Option – – Direct Plan - Growth Option 1.27% 1.25% b. Management Fee as % of AAuM (planwise) Regular Growth Option 1.04% 1.07% Institutional Growth Option – – Institutional Plus Growth Option – – Direct Plan - Growth Option 1.04% 1.07%

17
HSBC DEBT FUNDCurrent
Year ended March 31, 2018
Previous Year ended
March 31, 2017
5. Net Income as a percentage of AAuM3 3.16% 10.57%6. Portfolio turnover ratio4 – –7. Total Dividend per unit distributed during the year (planwise) Retail Regular Weekly Dividend Option – – Regular Quarterly Dividend Option 0.4334 0.6645 Regular Monthly Dividend Option – – Institutional Weekly Dividend Option – – Institutional Plus Weekly Dividend Option – – Direct Plan - Weekly Dividend Option – – Direct Plan - Monthly Dividend Option – – Direct Plan - Quarterly Dividend Option – – Corporate Regular Weekly Dividend Option – – Regular Quarterly Dividend Option 0.4015 0.6156 Regular Monthly Dividend Option – – Institutional Weekly Dividend Option – – Institutional Plus Weekly Dividend Option – – Direct Plan - Weekly Dividend Option – – Direct Plan - Monthly Dividend Option – – Direct Plan - Quarterly Dividend Option – –8. Returns(%): a. Last One Year Scheme Regular Growth Option 1.7254 9.1678 Institutional Plus Growth Option N.A. N.A. Direct Plan - Growth Option 2.4910 9.9899 Benchmark CRISIL Composite Bond Fund Index 5.1700 11.0896 b. Since Inception Scheme Regular Growth Option 6.8826 7.2552 Institutional Plus Growth Option N.A. N.A. Direct Plan - Growth Option 7.2331 8.3958 Benchmark CRISIL Composite Bond Fund Index 6.7500 6.8606
1. AAuM=Average daily net assets.2. Gross income = amount against (A) in the Revenue account i.e. Income.3. Net income = amount against (C) in the Revenue account i.e. Net Realised Gains / (Losses) for the year.4. Portfolio Turnover = Lower of sales or purchase divided by the Average AuM for the year.5. The net asset value disclosed represents the computed NAV on March 31, 2018 (Non-business Day),
and not the last declared NAV
Key Statistics for the year ended March 31, 2018 (Contd...)

18
Notes to Accounts – Annexure ITo the Abridged Balance Sheet and Revenue Account for the year ended March 31, 2018
hSBc deBt fund
1 Investments:-
1.1. It is confirmed that investments of the Scheme are registered in the name of the Trustees for the benefit of the Scheme’s unitholders.
1.2. Open Positions of derivatives as of year ended March 31, 2018 and March 31, 2017 are NIL.
1.3. Investments in Associates and Group Companies:
(Rupees)
Issuer Instrument Type
Amount Aggregate Investments
by all schemes
Amount Aggregate Investments
by all schemes
2018 2017
Shriram Transport Finance Company Ltd.
Corporate Bonds / Debentures
– 651,317,500 40,216,560 1,452,436,300
Equities – – – 94,659,583
Bharti Airtel Ltd. Equities – 369,136,950 – 1,025,985
Balrampur Chini Mills Ltd.
Equities – 125,227,938 – –
1.4. Open position of Securities Borrowed and / or Lent by the Scheme as of the years ended March 31, 2018 and March 31, 2017 are NIL.
1.5. NPAs for the Scheme for the years ended March 31, 2018 and March 31, 2017 are NIL.
1.6. Aggregate Unrealised Gain / Loss as at the end of the financial years 2018 and 2017 and their percentages to net assets are as under :
Security Type Amount (Rs.) Percentage to Net Assets
Amount (Rs.) Percentage to Net Assets
2018 2017
Non Convertible Debentures and Bonds Listed / Awaiting Listing
– Appreciation 500,480 0.11 5,988,462 1.06
– Depreciation 744,000 0.17 616,080 0.11
Certificate of Deposits
– Appreciation 15,513 ~0.00 – –
– Depreciation – – – –
Government Securities
– Appreciation 970,602 0.22 1,193,193 0.21
– Depreciation 1,330,830 0.30 1,347,573 0.24
~ Indicates less than 0.01
1.7. The aggregate value of investments securities (excluding CBLO and Reverse Repos) purchased and sold (including matured) during the financial year 2017-18 (excluding accretion of discount) are Rs. 2,408,932,606 and Rs. 2,487,735,016 respectively being 439.49% and 453.86% of the average daily net assets.

19
The aggregate value of investments securities (excluding CBLO and Reverse Repos) purchased and sold (including matured) during the financial year 2016-17 (excluding accretion of discount) are Rs. 1,974,710,593 and Rs. 2,214,714,439 respectively being 295.73% and 331.68% of the average daily net assets.
1.8. Non-Traded securities in the portfolio: Aggregate Value of Equity, Debt & Money Market Instruments and percentage to net assets are as under:
Security Category Fair Value (Rs.)
Percentage to Net Assets
Fair Value (Rs.)
Percentage to Net Assets
2018 2017
Debt Instruments 109,672,480 25.02 207,918,917 36.66
Money Market Instruments 18,831,460 4.30 – –
Total 128,503,940 29.31 207,918,917 36.66
2 Disclosure Under Regulation 25(8) of the Securities and Exchange Board of India (Mutual Funds) Regulations, 1996 as amended
During the year 2017 - 18, The Hong Kong and Shanghai Banking Corporation Limited, an associate entity of HSBC Asset Management (India) Private Limited was paid collection/bank charges are Nil.
During the year 2016 - 17, The Hong Kong and Shanghai Banking Corporation Limited, an associate entity of HSBC Asset Management (India) Private Limited was paid collection/bank charges are Nil.
Details of amounts paid to associates in terms of Regulation 25 (8) are as follows :
Commission paid to Sponsor/AMC and its associates/related parties/group companies
Name of Sponsor/AMC and its associates/related parties/group companies
Nature of Association / Nature of
Relation
Period Covered
Business Given [Rs. In Crores]
% of Total Business
received by the Fund
Commission paid [Rs.]
% of Total commission paid by the
Fund
The Hongkong and Shanghai Banking Corporation Limited
Associate 2017-2018 2.18 34.83 771,056.36 66.11
Name of Sponsor/AMC and its associates/related parties/group companies
Nature of Association / Nature of
Relation
Period Covered
Business Given [Rs. In Crores]
% of Total Business
received by the Fund
Commission paid [Rs.]
% of Total commission paid by the
Fund
The Hongkong and Shanghai Banking Corporation Limited
Associate 2016-2017 12.79 65.50 797,837.46 37.38
The brokerage paid was at rates similar to those offered to other brokers / distributors. The Commission/Brokerage paid to related party includes both upfront and trail and hence not comparable with the % of business brought and % of commission paid.
Further, The Hong Kong and Shanghai Banking Corporation Limited, an associate of the Sponsor, is on the panel of bankers with whom HSBC Mutual Fund places money on fixed deposits and enters into reverse repo transactions from time to time at competitive rates.
(i) Any underwriting obligations undertaken by the schemes of the mutual funds with respect to issue of securities associate companies - Nil (Previous year also Nil).
Notes to Accounts - Annexure I (Contd...)To the Abridged Balance Sheet and Revenue Account for the year ended March 31, 2018

20
(ii) Devolvement - Nil (Previous year also Nil).
(iii) Subscription by the Schemes in the issues lead managed by associate companies - Nil (Previous year also Nil).
(iv) Subscription to any issue of equity or debt on private placement basis where the sponsor or its associate companies have acted as arranger or manager - Nil (Previous year also Nil).
3 None of the Investors held more than 25% of the total net assets of the Scheme as at the years ended on March 31, 2018 and March 31, 2017.
4 Unit Capital movement during the years ended March 31, 2018 and March 31, 2017:
Description
2017–2018
Opening Units Subscription Redemption Closing UnitsFace Value
per unit (Rupees)
Regular Dividend Option
4,748,048.625 423,008.801 2,273,106.220 2,897,951.206 10
Regular Growth Option
7,852,515.511 947,912.971 3,409,187.531 5,391,240.951 10
Direct Plan - Growth Option
10,677,150.567 1,057,459.920 2,784,821.128 8,949,789.359 10
Description
2016–2017
Opening Units Subscription Redemption Closing UnitsFace Value
per unit (Rupees)
Regular Dividend Option
3,024,737.783 6,311,517.880 4,588,207.038 4,748,048.625 10
Regular Growth Option
16,780,873.098 3,294,869.957 12,223,227.544 7,852,515.511 10
Direct Plan - Growth Option
12,661,792.774 257,390.970 2,242,033.177 10,677,150.567 10
** Units held by the AMC (Seed Capital) in Direct Plan Growth Option as on March 31, 2018 is 206,147.313 and as on March 31, 2017 is 206,147.313.
5 Previous year’s figures have been re-grouped / re-arranged where appropriate.
6 No contingent liabilities for the years ended March 31, 2018 and March 31, 2017.
7 Expenses other than Management Fees are Inclusive of GST / Service Tax where applicable.
8 Other Income - Nil Exit load credited to the Scheme (2017 : Rs. 4) represents Exit load (net of GST / service tax) credited to the Scheme.
9 Investor Education Awareness
In view of the AMFI Best Practices Guidelines Circular No. 56/2015-16, the IEF (Investor Education Fund) accrual is set aside in a separate bank account and the consolidated balance across all Schemes as on March 31, 2018. The break-up of which is as under:
March 31, 2018 March 31, 2017
Particulars Amount (in Rs. Lacs) Amount (in Rs. Lacs)
Opening Balance 44.00 –
Add: Accrual during the year 219.83 182
Notes to Accounts – Annexure I (Contd...)To the Abridged Balance Sheet and Revenue Account for the year ended March 31, 2018
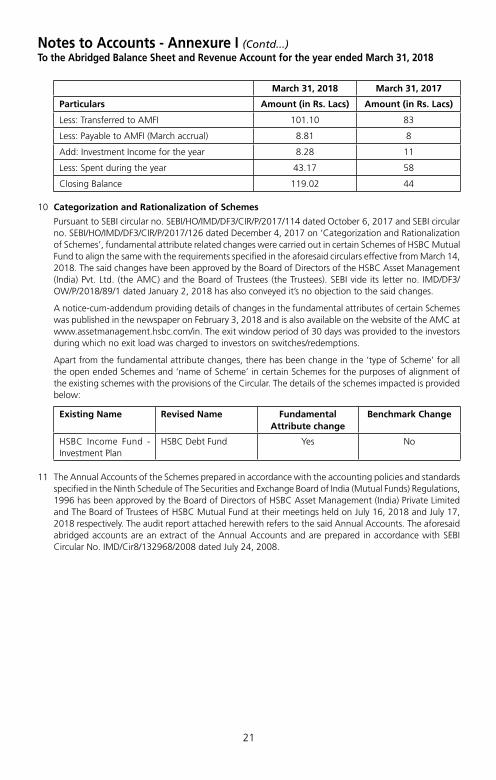
21
March 31, 2018 March 31, 2017
Particulars Amount (in Rs. Lacs) Amount (in Rs. Lacs)
Less: Transferred to AMFI 101.10 83
Less: Payable to AMFI (March accrual) 8.81 8
Add: Investment Income for the year 8.28 11
Less: Spent during the year 43.17 58
Closing Balance 119.02 44
10 Categorization and Rationalization of Schemes
Pursuant to SEBI circular no. SEBI/HO/IMD/DF3/CIR/P/2017/114 dated October 6, 2017 and SEBI circular no. SEBI/HO/IMD/DF3/CIR/P/2017/126 dated December 4, 2017 on ‘Categorization and Rationalization of Schemes’, fundamental attribute related changes were carried out in certain Schemes of HSBC Mutual Fund to align the same with the requirements specified in the aforesaid circulars effective from March 14, 2018. The said changes have been approved by the Board of Directors of the HSBC Asset Management (India) Pvt. Ltd. (the AMC) and the Board of Trustees (the Trustees). SEBI vide its letter no. IMD/DF3/OW/P/2018/89/1 dated January 2, 2018 has also conveyed it’s no objection to the said changes.
A notice-cum-addendum providing details of changes in the fundamental attributes of certain Schemes was published in the newspaper on February 3, 2018 and is also available on the website of the AMC at www.assetmanagement.hsbc.com/in. The exit window period of 30 days was provided to the investors during which no exit load was charged to investors on switches/redemptions.
Apart from the fundamental attribute changes, there has been change in the ‘type of Scheme’ for all the open ended Schemes and ‘name of Scheme’ in certain Schemes for the purposes of alignment of the existing schemes with the provisions of the Circular. The details of the schemes impacted is provided below:
Existing Name Revised Name Fundamental Attribute change
Benchmark Change
HSBC Income Fund - Investment Plan
HSBC Debt Fund Yes No
11 The Annual Accounts of the Schemes prepared in accordance with the accounting policies and standards specified in the Ninth Schedule of The Securities and Exchange Board of India (Mutual Funds) Regulations, 1996 has been approved by the Board of Directors of HSBC Asset Management (India) Private Limited and The Board of Trustees of HSBC Mutual Fund at their meetings held on July 16, 2018 and July 17, 2018 respectively. The audit report attached herewith refers to the said Annual Accounts. The aforesaid abridged accounts are an extract of the Annual Accounts and are prepared in accordance with SEBI Circular No. IMD/Cir8/132968/2008 dated July 24, 2008.
Notes to Accounts - Annexure I (Contd...)To the Abridged Balance Sheet and Revenue Account for the year ended March 31, 2018

22
Voting Policy and Procedures
In view of SEBI guidelines related to “Role of Mutual Funds in Corporate Governance of Public Listed Companies”, AMIN has formulated its “Policy for Proxy Voting in Public Listed Companies”. The said policy and details of actual exercise of proxy votes along with the summary of votes cast and the auditors certification during the Financial Year 2017 – 18 is available on its website – http://www.assetmanagement.hsbc.com/in and in full Annual Report for the Financial Year 2017 – 18.

23
Statutory Details & Disclaimers
All returns have been sourced from Mutual Funds India Explorer software unless otherwise stated. With regard to equity schemes (including the equity component of MIPs), Fund performance is calculated on a total return basis (i.e. it includes dividends re-invested) while the benchmark is calculated on a price return basis (i.e. it does not consider dividends re-invested). This document has been prepared by HSBC Asset Management (India) Private Ltd (HSBC) for information purposes only and should not be construed as an offer or solicitation of an offer for purchase of any of the funds of HSBC Mutual Fund. All information contained in this document (including that sourced from third parties), is obtained from sources HSBC, the third party believes to be reliable but which it has not independently verified and HSBC, the third party makes no guarantee, representation or warranty and accepts no responsibility or liability as to the accuracy or completeness of such information. The information and opinions contained within the document are based upon publicly available information and rates of taxation applicable at the time of publication, which are subject to change from time to time. Expressions of opinion are those of HSBC only and are subject to change without notice. It does not have regard to specific investment objectives, financial situation and the particular needs of any specific person who may receive this document. Investors should seek financial advice regarding the appropriateness of investing in any securities or investment strategies that may have been discussed or recommended in this report and should understand that the views regarding future prospects may or may not be realized. Neither this document nor the units of HSBC Mutual Fund have been registered in any jurisdiction. The distribution of this document in certain jurisdictions may be restricted or totally prohibited and accordingly, persons who come into possession of this document are required to inform themselves about, and to observe, any such restrictions.
Investors should not invest in the Scheme solely based on the information provided in this document and should read the Scheme Information Document and Statement of Additional Information of the Fund for details. This document does not constitute an offering document.
No part of this publication may be reproduced, stored in a retrieval system, or transmitted, on any form or by any means, electronic, mechanical, photocopying, recording, or otherwise, without the prior written permission of HSBC Asset Management (India) Private Ltd.
Mutual Fund investments are subject to market risks, read all scheme related documents carefully.

HSBC Capital Protection Oriented FundA close ended Capital Protection Oriented Scheme
Abridged Annual Report 2017 - 2018

1
Dear Investor,
Globally, we are witnessing a very interesting phase. The equity markets delivered a stellar performance in 2017. However, there are worries about the impact of higher rates, global trade wars, an economic growth moderation and higher volatility.
Closer home, India has become the world’s sixth-biggest economy. India has doubled its GDP to USD 2.2 trillion within a decade. The introduction of reform measures, including demonetisation and the Goods and Services Tax (GST), had put pressure on selective parts of the economy in 2017. The impact of these measures is likely to be transitory. India’s economic growth is expected to accelerate from 6.7% in FY18 to 7.4% in the current year as per IMF forecasts.
There has been a shift in the domestic savings pool supporting the market. Domestic investors have been increasing exposure to equities and financial assets moving away from gold and real estate. Mutual funds witnessed sizable inflows on the back of the boost in liquidity within the banking system from demonetisation. The AUM of the mutual fund industry grew by 21.7% in March 2018 compared to March 2017.
With growth, comes responsibility. Last year, the regulator, Securities and Exchange Board of India (SEBI) issued a circular to rationalise and categorise mutual fund schemes in India. We are pleased to state that none of our funds needed to be redesigned. All our schemes have been defined as per the new categorisation. We believe this classification will simplify investing into mutual funds and enhance comparability within the schemes offered.
As India moves to a digital age, e-commerce platforms are becoming increasingly popular. I request you to logon to our online transaction platform. It is a quick, convenient and an efficient tool to invest into our funds and manage your investments online.
At HSBC Global Asset Management, India, we are dedicated to one goal: delivering exceptional investment management for our clients. By bringing together our

2
global investment knowledge and capabilities, we are able to offer specialised expertise across asset classes. This has helped us to become a trusted partner to our individual and institutional investors.
We remain committed to our long-term perspective and disciplined investment approach as we conduct a rigorous, fundamental analysis of investments with a strong emphasis on risk management. Although the investment landscape appears favourable, it is worth remembering that markets are dynamic and constantly evolving. Therefore, we believe active, professional investment management serves investors well. Amid changing markets and economic conditions, we are confident that investors with a well-diversified portfolio and a patient, long-term outlook should be well positioned for the years ahead.
Together we thrive.
Warm regards,
Ravi Menon
Chief Executive Officer, HSBC Global Asset Management, India

3
SPONSORHSBC Securities and Capital Markets (India) Private LimitedRegd. Office: 52/60, Mahatma Gandhi Road, Fort, Mumbai - 400 001.
TRUSTEEBoard of TrusteesOffice: 16, Veer Nariman Road, Fort, Mumbai 400 001.
ASSET MANAGEMENT COMPANYHSBC Asset Management (India) Private LimitedCorp. & Regd. Office: 16, Veer Nariman Road, Fort, Mumbai 400 001.
CUSTODIANStandard Chartered Bank (SCB)Corp. & Regd. Office: Crescenzo, Securities Services, 3rd Floor, C-38/39, G-Block, Bandra Kurla Complex, Bandra East, Mumbai – 400051.
AUDITORS TO THE SCHEMEBSR & Co. LLPChartered Accountants 5th Floor, Lodha Excelus, Apollo Mills Compound, N.M. Joshi Marg, Mahalaxmi, Mumbai 400 011.
REGISTRAR & TRANSFER AGENTSComputer Age Management Services Private Limited (CAMS)Unit: HSBC Mutual Fund ’C’ Block, 2nd Floor, Hanudev Info Park P. Ltd., SF No. 558/2, Udayampalayam Road, Nava India, Coimbatore - 641 028.
BOARD OF TRUSTEESMr. Nasser Munjee
Mr. Manu Tandon
Mr. Mehli Mistri
Mr. Dilip J. Thakkar
Ms. Jasmine Batliwalla
Mr. Pedro Bastos
BOARD OF DIRECTORSMs. Kishori J. Udeshi - Chairperson
Mr. S. P. Mustafa
Mr. Dinesh Mittal
Mr. Ravi Menon - Chief Executive Officer

4
The Trustees of HSBC Mutual Fund (“Fund”) present the Sixteenth Annual Report and the audited abridged financial statements of the schemes of the Fund for the year ended March 31, 2018.
As at March 31, 2018, the Fund offered 30 schemes across asset classes to meet the varying investment needs of the investors. Notably, three Schemes of HSBC Mutual Fund viz. HSBC Large Cap Equity Fund, HSBC Short Duration Fund and HSBC Cash Fund have completed 15 years of operations during the year.
During the year, the Fund has launched Plan(s) under Fixed Term Series and carried out merger of the existing schemes viz HSBC Dividend Yield Equity Fund merged into HSBC Multi Cap Equity Fund (HMEF), erstwhile HSBC India Opportunities Fund, as offering sub-scale fund was not in the interest of the unitholders.
Further, in order to bring uniformity in the practice across Mutual Funds and to standardize the scheme categories and characteristics of schemes, SEBI vide its circular no. SEBI/HO/IMD/DF3/CIR/P/2017/114 dated October 06, 2017, issued guidelines for categorization and rationalization of Mutual Fund schemes.
Accordingly, HSBC Large Cap Equity Fund (erstwhile HSBC Equity Fund), HSBC Small Cap Equity Fund (erstwhile HSBC Mid Cap Equity Fund) , HSBC Infrastructure Equity Fund, HSBC Global Emerging Market Fund (erstwhile HSBC Emerging Market Fund), HSBC Debt Fund (erstwhile HSBC Income Fund – Investments Plan), HSBC Short Duration Fund (erstwhile HSBC Income Fund – Short Term Plan), HSBC Low Duration Fund (erstwhile HSBC Ultra Short Term Bond Fund), HSBC Regular Savings Fund (erstwhile HSBC Monthly Income Plan) and HSBC Managed Solutions have undergone fundamental attributes changes with effective from March 14, 2018.
The Fund continues its focus on delivering consistent long term returns. The comments on the performance of the Scheme(s) is provided hereinafter. Dividends were declared under various schemes as per the provisions contained in the respective Scheme Information Documents after considering the distributable surplus available under the respective Schemes. Details of dividends declared can be viewed on our website at www.assetmanagement.hsbc.com/in.
1. Scheme Performance, future outlook and oPerationS of the SchemeS
a. Operations and Performance of the Schemes
HSBC Capital Protection Oriented Fund – a close ended Capital Protection Oriented Scheme The scheme seeks protection of capital by investing a portion of the portfolio in high quality debt securities and money market instruments and also to provide capital appreciation by investing in equities through NIFTY (Index) Call Options. Currently, the Fund has two capital protection oriented funds viz. HSBC Capital Protection Oriented Fund – Series II – Plan I and Plan II.
The performance of the Plans which are in existence for more than a year as on March 31, 2018 is provided below:
Fund / BenchmarkAbsolute
Returns (%)Compounded Annualized
Returns (%)Inception
Date
1 Year 3 Years Since Inception
Amount (Rs.)
Returns (%)
Amount (Rs.)
Returns (%)
Amount (Rs.)
Returns (%)
HSBC CPO Fund - Series II - Plan I - Regular - Growth
10,743 7.49 11,596 5.07 11,778 5.59 26-Mar-15
Scheme Benchmark (CRISIL Hybrid 85+15 - Conservative Index)
10,621 6.26 12,739 8.42 12,820 8.61 26-Mar-15
HSBC CPO Fund - Series II - Plan II - Regular - Growth
10,689 6.95 NA NA 11,540 4.98 17-Apr-15
Scheme Benchmark (CRISIL Hybrid 85+15 - Conservative Index)
10,621 6.26 NA NA 12,688 8.41 17-Apr-15
Trustees’ ReportFor the year ended March 31, 2018
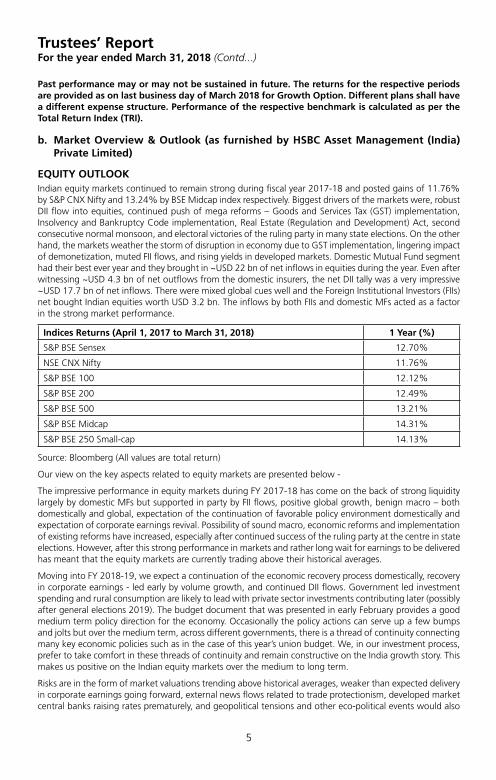
5
Past performance may or may not be sustained in future. The returns for the respective periods are provided as on last business day of March 2018 for Growth Option. Different plans shall have a different expense structure. Performance of the respective benchmark is calculated as per the Total Return Index (TRI).
b. Market Overview & Outlook (as furnished by HSBC Asset Management (India) Private Limited)
EqUITY OUTLOOKIndian equity markets continued to remain strong during fiscal year 2017-18 and posted gains of 11.76% by S&P CNX Nifty and 13.24% by BSE Midcap index respectively. Biggest drivers of the markets were, robust DII flow into equities, continued push of mega reforms – Goods and Services Tax (GST) implementation, Insolvency and Bankruptcy Code implementation, Real Estate (Regulation and Development) Act, second consecutive normal monsoon, and electoral victories of the ruling party in many state elections. On the other hand, the markets weather the storm of disruption in economy due to GST implementation, lingering impact of demonetization, muted FII flows, and rising yields in developed markets. Domestic Mutual Fund segment had their best ever year and they brought in ~USD 22 bn of net inflows in equities during the year. Even after witnessing ~USD 4.3 bn of net outflows from the domestic insurers, the net DII tally was a very impressive ~USD 17.7 bn of net inflows. There were mixed global cues well and the Foreign Institutional Investors (FIIs) net bought Indian equities worth USD 3.2 bn. The inflows by both FIIs and domestic MFs acted as a factor in the strong market performance.
Indices Returns (April 1, 2017 to March 31, 2018) 1 Year (%)
S&P BSE Sensex 12.70%
NSE CNX Nifty 11.76%
S&P BSE 100 12.12%
S&P BSE 200 12.49%
S&P BSE 500 13.21%
S&P BSE Midcap 14.31%
S&P BSE 250 Small-cap 14.13%
Source: Bloomberg (All values are total return)
Our view on the key aspects related to equity markets are presented below -
The impressive performance in equity markets during FY 2017-18 has come on the back of strong liquidity largely by domestic MFs but supported in party by FII flows, positive global growth, benign macro – both domestically and global, expectation of the continuation of favorable policy environment domestically and expectation of corporate earnings revival. Possibility of sound macro, economic reforms and implementation of existing reforms have increased, especially after continued success of the ruling party at the centre in state elections. However, after this strong performance in markets and rather long wait for earnings to be delivered has meant that the equity markets are currently trading above their historical averages.
Moving into FY 2018-19, we expect a continuation of the economic recovery process domestically, recovery in corporate earnings - led early by volume growth, and continued DII flows. Government led investment spending and rural consumption are likely to lead with private sector investments contributing later (possibly after general elections 2019). The budget document that was presented in early February provides a good medium term policy direction for the economy. Occasionally the policy actions can serve up a few bumps and jolts but over the medium term, across different governments, there is a thread of continuity connecting many key economic policies such as in the case of this year’s union budget. We, in our investment process, prefer to take comfort in these threads of continuity and remain constructive on the India growth story. This makes us positive on the Indian equity markets over the medium to long term.
Risks are in the form of market valuations trending above historical averages, weaker than expected delivery in corporate earnings going forward, external news flows related to trade protectionism, developed market central banks raising rates prematurely, and geopolitical tensions and other eco-political events would also
Trustees’ ReportFor the year ended March 31, 2018 (Contd...)
6
influence market performance going forward, as the recent rally in the markets was supported by strong FII inflows.
DEBT OUTLOOKFixed Income in Financial Year 2017-18 has seen volatility further step up in this year. Markets went to perfect storm with higher crude prices, low liquidity and pressure on currency, apart from rate hike expectations.
Inflation has followed the glide path to lower numbers towards 4% RBI target and even lower than the target number when inflation printed a lowly 1.46% in June 2018 on back of lower food prices. RBI went for a cut despite of neutral stance. This positivity continued till until crude shock came in form of higher crude process. Global prices of Brent crude saw substantial increase in second half of the year, which jeopardized the inflation path. Other worries that gathered around this time were related to GST collection and eventual impact on fiscal situation.
Government of India allowed the fiscal deficit to slip to 3.5% (budget 3.2%) and kept next year target at 3.3% (in place of earlier path of 3%). This was on back of some excise relaxation for oil products and a month less collected for GST due to implementation in the current year. The fear of fiscal slippage alongwith the announcement of higher bond issuances spooked the bond markets into higher yields. Government finally borrowed only INR 90 bln extra (in place of INR 500 bln announced initially).
On the Monetary front the year was very volatile as well. RBI changed its stance to neutral causing some worry around rate hikes. Thereafter it cut rates and again went for OMO sales operations simultaneously. This created some confusion in the market participants regarding rates direction. Finally extra supply, higher oil prices and higher inflation paved way for rates higher. RBI also held position on regulatory forbearance about spreading out losses by banks publicly. It eventually gave up the position in the end of March. However, the swift changes in stance caused lot of pressure and volatility in bonds.
Liquidity situation continuously deteriorated due to OMO sales initially and withdrawal of deposits due to remonetisation. Further liquidity was absorbed out due to portfolio outflows and reduction in reserves. Despite of defense from RBI utilizing the reserves, the currency depreciated meaningfully, which caused further jitters in foreign investor sentiments. Lack of liquidity also affected 1-3 year rates which were elevated in second half of the year.
Going forward following are key variables to watch out for:
• Liquidity: Liquidity will drive short end rates and eventually drive decisions leading to market interventions and CRR cuts. RBI has focused now on neutral liquidity stance and providing liquidity to system, which will bode well short end rates.
• Inflation: Inflation numbers will determine future course of action for RBI and remains a critical variable for policy. We expect inflation to remain at 4.7% level in the ease in second half of FY 2018-19 in line with RBI’s expectations.
• Growth: GDP growth numbers as well as industrial activity will also determine the decision on policy.
• Fiscal deficit: Fiscal deficit and government spending will determine the government borrowing and crowding out in interest rate curve. We expect prudence in government spending and prospect of spending on infrastructure to pick up which will crowd in private investment as well.
• Current Account Deficit: Current Account Deficit determines how the pressure on currency works and effective management of forex reserves.
• Currency levels: Level of INR will determine how the central bank reacts to the situation on the global crisis etc.
2. Brief Background of SPonSorS, Board of truSteeS and aSSet management comPany
a. Sponsor
HSBC Mutual Fund is sponsored by HSBC Securities and Capital Markets (India) Private Limited (HSCI). The Sponsor is the Settler of the Mutual Fund Trust. The Sponsor has entrusted a sum of Rs. 1,00,000 (Rupees One Lakh only) to the Trustee as the initial contribution towards the corpus of the Mutual Fund.
Trustees’ ReportFor the year ended March 31, 2018 (Contd...)

7
HSCI offers integrated investment banking services, securities and corporate finance & advisory. HSCI is a member of the Bombay Stock Exchange Limited and National Stock Exchange (capital and derivative market segments). HSCI holds 100% of the paid up equity share capital of HSBC Asset Management (India) Private Limited.
b. HSBC Mutual Fund HSBC Mutual Fund (“the Mutual Fund” or “the Fund”) has been constituted as a Trust in accordance with
the provisions of the Indian Trusts Act, 1882 (2 of 1882) vide a Trust Deed dated February 7, 2002 with HSBC Securities and Capital Markets (India) Private Limited, as the Sponsor and the Board of Individual Trustees. The Trustee has entered into an Investment Management Agreement dated February 7, 2002 with HSBC Asset Management (India) Private Limited (AMC) to function as the Investment Manager for all the schemes of the Fund. The Fund was registered with SEBI vide registration number MF/046/02/5 dated May 27, 2002.
The Trust has been formed for the purpose of pooling of capital from the public for collective investment in securities for the purpose of providing facilities for participation by persons as beneficiaries in such investments and in the profits/income arising therefrom.
c. Board of Trustees (the Trustees) The Board of Trustees is the exclusive owner of the Trust Fund and holds the same in trust for the benefit
of the unit holders. The Trustees have been discharging their duties and carrying out the responsibilities as provided in the SEBI (Mutual Funds) Regulations, 1996 and the Trust Deed. The Trustees seek to ensure that the Fund and the schemes floated there under are managed by the AMC in accordance with the Trust Deed, the said Regulations, directions and guidelines issued by the SEBI, the Stock Exchanges, the Association of Mutual Funds in India and other regulatory agencies.
d. Asset Management Company (the AMC) HSBC Asset Management (India) Private Limited (the Investment Manager or the AMC) is a private limited
company incorporated under the Companies Act, 1956 on December 12, 2001 having its Registered Office at 16, V. N. Road, Fort, Mumbai 400 001. HSBC Asset Management (India) Private Limited has been appointed as the Asset Management Company of HSBC Mutual Fund by the Trustee vide Investment Management Agreement (IMA) dated February 7, 2002 and executed between the Trustees and the AMC. SEBI approved the AMC to act as the Investment Manager of the Fund vide its letter No. MFD/BC/163/2002 dated May 27, 2002. The paid-up equity share capital of the AMC is Rs. 61.59 crores. The AMC is registered as a Portfolio Manager under the SEBI (Portfolio Managers) Regulations, 1993 vide registration no. INP000001322. The AMC also offers non-binding Advisory services to offshore funds under the mutual fund license.
HSBC Securities and Capital Markets (India) Private Limited holds 100% of the paid up equity share capital of the AMC.
3. inveStment oBjective of the SchemeS The investment objective of the respective schemes has been provided above under the heading “Scheme
Performance, Future Outlook and Operation of the Scheme” (Refer Section 1).
4. Significant accounting PolicieS The Significant Accounting Policies form part of the Notes to the Accounts annexed to the Balance Sheet
of the Schemes in the Full Annual Report. The accounting policies are in accordance with Securities Exchange Board of India (Mutual Funds) Regulations 1996.
5. unclaimed dividendS & redemPtionS Summary of number of investors & corresponding amount Scheme-wise as on March 31, 2018.
SchemeUnclaimed Dividend Unclaimed Redemption
Amount (Rs.) No. of Investors
Amount (Rs.) No. of Investors
HSBC Capital Protection Oriented Fund – – 2,896,951.92 1
Trustees’ ReportFor the year ended March 31, 2018 (Contd...)

8
6. inveStor ServiceSThe number of official points of acceptance of transactions is 205 locations. In addition to the offices of the Registrar & Transfer agents, the AMC has Investor Service Centres in 9 locations at its own offices - namely Mumbai, New Delhi, Kolkata, Bangaluru, Pune, Ahmedabad, Hyderabad, Chandigarh and Chennai. With a view to enhance customer convenience, the AMC has the facility of priority based servicing to key distributors through the enhancement of the Interactive Voice Reponses. The AMC has a single Toll Free number which can be dialed from anywhere in India. The call centre service is being managed by the Registrar and Transfer Agents.
On the distribution front, the number of empanelled distributors was 460 as on March 31, 2018. During the year, the AMC initiated tie-ups for online distribution of the Mutual Fund’s schemes with several channel partners taking the total number of such tie-ups to 42.
7. detailS of inveStor grievance redreSSalThe details of the redressal of investor complaints received against HSBC Mutual Fund during April 2017 - March 2018 are as follows:
2017–2018
Com- plaint Code
Type of complaint (a) No. of complaints
pending at the
beginning of the year
(b) No. of complaints received during
the year
Action on (a) and (b)
Resolved Non Actiona-
ble*
Pending
Within 30
days
30 - 60 days
60 - 180 days
Beyond 180 days
0 - 3 months
3 - 6 months
6 - 9 months
9 - 12 months
I A Non receipt of Dividend on Units
0 5 4 1 0 0 0 0 0 0 0
I B Interest on delayed payment of Dividend
0 0 0 0 0 0 0 0 0 0 0
I C Non receipt ofRedemption Proceeds
1 12 12 1 0 0 0 1 0 0 0
I D Interest on delayedp a y m e n t o f Redemption
0 1 1 0 0 0 0 0 0 0 0
II A Non receipt of Statement of Account / Unit Certificate
0 0 0 0 0 0 0 0 0 0 0
II B D i s c r e p a n c y i n Statement of Account
0 0 0 0 0 0 0 0 0 0 0
II C Data corrections in Investor details **
0 34 34 0 0 0 0 0 0 0 0
II D Non receipt of Annual Report /Abridged Summary
0 0 0 0 0 0 0 0 0 0 0
III A Wrong switch between Schemes
0 0 0 0 0 0 0 0 0 0 0
III B Unauthorized switch between Schemes
0 0 0 0 0 0 0 0 0 0 0
III C Deviation from Scheme attributes
0 0 0 0 0 0 0 0 0 0 0
III D Wrong or excess charges / load
0 0 0 0 0 0 0 0 0 0 0
Trustees’ ReportFor the year ended March 31, 2018 (Contd...)

9
2017–2018
Com- plaint Code
Type of complaint (a) No. of complaints
pending at the
beginning of the year
(b) No. of complaints received during
the year
Action on (a) and (b)
Resolved Non Actiona-
ble*
Pending
Within 30
days
30 - 60 days
60 - 180 days
Beyond 180 days
0 - 3 months
3 - 6 months
6 - 9 months
9 - 12 months
III E Non updat ion of changes viz. address, PAN, bank details, nomination, etc.
0 6 6 0 0 0 0 0 0 0 0
IV Others 1 41 42 0 0 0 0 0 0 0 0
Total 2 99 99 2 0 0 0 0 0 0 0
Summary of Complaints for FY 2017–18
Particulars Count
Total complaints received 99
Total number of folios 140099
% of complaints against the folio 0.071%
# active folios** As per AMFI Best Practice Guidelines Circular No. 25/2011-12 for Revisions in the Guidelines on
Standardization of Complaints/Grievances Reporting Procedure. If “Others” include a type of complaint which is more than 10% of overall complaints, then such a reason should be provided separately. Hence data corrections in Investor Details is included as a separate category
* Non actionable means the complaint is incomplete / outside the scope of the mutual fund
8. inveStor education initiativeS The Fund undertook various investor education and awareness initiatives related to investments in mutual funds throughout India in English / Hindi and Regional languages via mass media. The Fund conducted 16 roadshows at various locations in India to promote various Investor Awareness related topics including Asset Allocation, SIPs, Equity Mutual Funds and Financial Planning. The Fund has a Year-long tie-up with Mutual Fund Insights Magazine that includes 3 pages of content and advertorial publication in their monthly issue. Each issue contains a story promoting SIPs to achieve one’s various investment goals. In the month of December 2017 and January 2018 investor awareness promotion was done through Outlook and Outlook Money magazines through advertorials on various Mutual Fund topics.
9. Statutory detailSa) The Sponsors are not responsible or liable for any loss resulting from the operation of the Schemes of
the Fund beyond initial contribution of Rs. 1 lakh for setting up the Fund.
b) The price and redemption value of the units, and income from them, can go up as well as down with fluctuations in the market value of its underlying investments.
c) Full Annual Report shall be disclosed on the website at www.assetmanagement.hsbc.com/in and shall be available for inspection at the Head Office of the Mutual Fund. Present and prospective unit holders can obtain copy of the Trust Deed, the full Annual Report of the Scheme(s), the Annual Report of HSBC Asset Management (India) Private Limited and the text of the relevant Scheme(s) at a price.
10. acknowledgementSThe Trustees wish to thank the Unit holders of the Schemes for their support throughout the year and also thank the Government of India, the Securities and Exchange Board of India (SEBI), the Reserve Bank of India
Trustees’ ReportFor the year ended March 31, 2018 (Contd...)

10
(RBI) and the Association of Mutual Funds in India (AMFI) for the guidance provided by them. The Trustees also appreciate the services provided by the Registrar and Transfer Agent, Fund Accountant, Custodian, Bankers, Distributors and Brokers. The guidance and services provided by the Auditors and advocates and the ebullience, sincerity and dedication of the employees of HSBC Asset Management (India) Private Limited is also appreciated.
The Trustees look forward to the continued support of everyone.
For and on behalf of the Board of Trustees of HSBC Mutual Fund
Sd/-
Dilip Thakkar
Trustee
Mumbai
July 17, 2018.
Trustees’ ReportFor the year ended March 31, 2018 (Contd...)

11
Independent Auditors’ Report
To the Board of Trustees of
HSBC Mutual Fund – HSBC Capital Protection Oriented Fund Series II – Plan I
Report on the Financial StatementsWe have audited the accompanying Financial Statements of HSBC Capital Protection Fund Series II Plan I (the ‘Scheme’), which comprise the balance sheet as at 31 March 2018, the related revenue account and the cash flow statement for the year then ended, and a summary of significant accounting policies and other explanatory information, annexed thereto.
Management’s responsibility for the Financial StatementsThe Board of Trustees to the HSBC Mutual Fund (the ‘Board of Trustees’) and HSBC Asset Management (India) Private Limited (the ‘AMC’), being the investment manager to HSBC Mutual Fund (the ‘Fund’) (collectively referred as ‘Management’), are responsible for the preparation of these financial statements that give a true and fair view of the financial position and financial performance of the Scheme in accordance with the accounting policies and standards specified in the Ninth Schedule of the Securities and Exchange Board of India (Mutual Funds) Regulations, 1996, as amended (the ‘Regulations’) and the accounting principles generally accepted in India. This responsibility includes maintenance of adequate accounting records for safeguarding of the assets of the Scheme and for preventing and detecting frauds and other irregularities; selection and application of appropriate accounting policies; making judgments and estimates that are reasonable and prudent; and design, implementation and maintenance of adequate internal financial controls, that were operating effectively for ensuring the accuracy and completeness of the accounting records, relevant to the preparation and presentation of the financial statements that give a true and fair view and are free from material misstatement, whether due to fraud or error.
In preparing the financial statements, management is responsible for assessing the Scheme’s ability to continue as a going concern, disclosing, as applicable, matters related to going concern and using the going concern basis of accounting unless management either intends to liquidate the Fund or to cease operations, or has no realistic alternative but to do so.
Auditor’s responsibilityOur responsibility is to express an opinion on these financial statements based on our audit. We conducted our audit in accordance with the Standards on Auditing issued by the Institute of Chartered Accountants of India (the ‘ICAI’). Those Standards require that we comply with ethical requirements and plan and perform the audit to obtain reasonable assurance about whether the financial statements are free from material misstatement.
An audit involves performing procedures to obtain audit evidence about the amounts and disclosures in the financial statements. The procedures selected depend on the auditor’s judgment, including the assessment of the risks of material misstatement of the financial statements, whether due to fraud or error. In making those risk assessments, the auditor considers internal controls relevant to preparation and fair presentation of the financial statements, of the Scheme, in order to design audit procedures that are appropriate in the circumstances, but not for the purpose of expressing an opinion on the effectiveness of the Scheme’s internal controls. An audit also includes evaluating the appropriateness of accounting policies used and the reasonableness of the accounting estimates made by Management, as well as evaluating the overall presentation of the financial statements.
We are also responsible to conclude on the appropriateness of management’s use of the going concern basis of accounting and, based on the audit evidence obtained, whether a material uncertainty exists related to events or conditions that may cast significant doubt on the Scheme’s ability to continue as a going concern. If we conclude that a material uncertainty exists, we are required to draw attention in the auditor’s report to the related disclosures in the financial statements or, if such disclosures are inadequate, to modify the opinion. Our conclusions are based on the audit evidence obtained up to the date of the auditor’s report. However, future events or conditions may cause the Scheme to cease to continue as a going concern.
We believe that the audit evidence we have obtained is sufficient and appropriate to provide a basis for our audit opinion.

12
Independent Auditors’ Report (Contd...)
OpinionIn our opinion, and to the best of our information and according to the explanations given to us, the aforesaid financial statements give the information required by the Regulations in the manner so required and give a true and fair view in conformity with the accounting principles generally accepted in India:
(i) in the case of the balance sheet, of the state of affairs of the Scheme as at 31 March 2018;
(ii) in the case of the revenue account, of the net surplus for the year ended on that date; and
(iii) in the case of the cash flow statement, of the cash flows of the Scheme for the year ended on that date.
Report on other Legal and Regulatory Requirements1 As required by Regulation 55(4) to the Regulations, we report that:
(a) We have obtained all information and explanations which, to the best of our knowledge and belief, were necessary for the purposes of the audit;
(b) The balance sheet and revenue account have been prepared in accordance with the accounting policies and standards specified in the Ninth Schedule of the Regulations.
2 As required by Clause 5(ii)(2) of the Eleventh Schedule of the Regulations, we report that the balance sheet and revenue account are in agreement with the books of account of the Scheme.
3 In our opinion and on the basis of information and explanations given to us, the methods used to value non - traded securities, as at 31 March 2018, as determined by the Board of Directors of AMC, are in accordance with the Regulations and other guidelines issued by the Securities and Exchange Board of India as applicable and approved by the Board of Trustees are fair and reasonable.
For B S R & Co. LLP Chartered Accountants Firm’s Registration No: 101248W/W-100022
Sd/-
Milind Ranade Partner Membership No: 100564
Place : Mumbai Date : July 17, 2018.

13
Independent Auditors’ Report (Contd...)
To the Board of Trustees of
HSBC Mutual Fund – HSBC Capital Protection Oriented Fund Series II – Plan II
Report on the Financial StatementsWe have audited the accompanying Financial Statements of HSBC Capital Protection Fund Series II Plan II (the ‘Scheme’), which comprise the balance sheet as at 31 March 2018, the related revenue account and the cash flow statement for the year then ended, and a summary of significant accounting policies and other explanatory information, annexed thereto.
Management’s responsibility for the Financial StatementsThe Board of Trustees to the HSBC Mutual Fund (the ‘Board of Trustees’) and HSBC Asset Management (India) Private Limited (the ‘AMC’), being the investment manager to HSBC Mutual Fund (the ‘Fund’) (collectively referred as ‘Management’), are responsible for the preparation of these financial statements that give a true and fair view of the financial position and financial performance of the Scheme in accordance with the accounting policies and standards specified in the Ninth Schedule of the Securities and Exchange Board of India (Mutual Funds) Regulations, 1996, as amended (the ‘Regulations’) and the accounting principles generally accepted in India. This responsibility includes maintenance of adequate accounting records for safeguarding of the assets of the Scheme and for preventing and detecting frauds and other irregularities; selection and application of appropriate accounting policies; making judgments and estimates that are reasonable and prudent; and design, implementation and maintenance of adequate internal financial controls, that were operating effectively for ensuring the accuracy and completeness of the accounting records, relevant to the preparation and presentation of the financial statements that give a true and fair view and are free from material misstatement, whether due to fraud or error.
In preparing the financial statements, management is responsible for assessing the Scheme’s ability to continue as a going concern, disclosing, as applicable, matters related to going concern and using the going concern basis of accounting unless management either intends to liquidate the Fund or to cease operations, or has no realistic alternative but to do so.
Auditor’s responsibilityOur responsibility is to express an opinion on these financial statements based on our audit. We conducted our audit in accordance with the Standards on Auditing issued by the Institute of Chartered Accountants of India (the ‘ICAI’). Those Standards require that we comply with ethical requirements and plan and perform the audit to obtain reasonable assurance about whether the financial statements are free from material misstatement.
An audit involves performing procedures to obtain audit evidence about the amounts and disclosures in the financial statements. The procedures selected depend on the auditor’s judgment, including the assessment of the risks of material misstatement of the financial statements, whether due to fraud or error. In making those risk assessments, the auditor considers internal controls relevant to preparation and fair presentation of the financial statements, of the Scheme, in order to design audit procedures that are appropriate in the circumstances, but not for the purpose of expressing an opinion on the effectiveness of the Scheme’s internal controls. An audit also includes evaluating the appropriateness of accounting policies used and the reasonableness of the accounting estimates made by Management, as well as evaluating the overall presentation of the financial statements.
We are also responsible to conclude on the appropriateness of management’s use of the going concern basis of accounting and, based on the audit evidence obtained, whether a material uncertainty exists related to events or conditions that may cast significant doubt on the Scheme’s ability to continue as a going concern. If we conclude that a material uncertainty exists, we are required to draw attention in the auditor’s report to the related disclosures in the financial statements or, if such disclosures are inadequate, to modify the opinion. Our conclusions are based on the audit evidence obtained up to the date of the auditor’s report. However, future events or conditions may cause the Scheme to cease to continue as a going concern.
We believe that the audit evidence we have obtained is sufficient and appropriate to provide a basis for our audit opinion.

14
OpinionIn our opinion, and to the best of our information and according to the explanations given to us, the aforesaid financial statements give the information required by the Regulations in the manner so required and give a true and fair view in conformity with the accounting principles generally accepted in India:
(i) in the case of the balance sheet, of the state of affairs of the Scheme as at 31 March 2018;
(ii) in the case of the revenue account, of the net surplus for the year ended on that date; and
(iii) in the case of the cash flow statement, of the cash flows of the Scheme for the year ended on that date.
Report on other Legal and Regulatory Requirements1 As required by Regulation 55(4) to the Regulations, we report that:
(a) We have obtained all information and explanations which, to the best of our knowledge and belief, were necessary for the purposes of the audit;
(b) The balance sheet and revenue account have been prepared in accordance with the accounting policies and standards specified in the Ninth Schedule of the Regulations.
2 As required by Clause 5(ii)(2) of the Eleventh Schedule of the Regulations, we report that the balance sheet and revenue account are in agreement with the books of account of the Scheme.
3 In our opinion and on the basis of information and explanations given to us, the methods used to value non - traded securities, as at 31 March 2018, as determined by the Board of Directors of AMC, are in accordance with the Regulations and other guidelines issued by the Securities and Exchange Board of India as applicable and approved by the Board of Trustees are fair and reasonable.
For B S R & Co. LLP Chartered Accountants Firm’s Registration No: 101248W/W-100022
Sd/-
Milind Ranade Partner Membership No: 100564
Place : Mumbai Date : July 17, 2018.
Independent Auditors’ Report (Contd...)

15
Abridged Balance Sheet as at March 31, 2018
Rs. in Lakhs
HSBC CAPITAL PROTECTION ORIENTED FUND SERIES II – PLAN I
As at March 31, 2018
As at March 31, 2017
LIABILITIES1 Unit Capital 6,967.57 6,967.57 2 Reserves & Surplus2.1 Unit Premium Reserves – – 2.2 Unrealised Appreciation Reserve 23.24 94.48 2.3 Other Reserves 1,219.20 577.25 3 Loans & Borrowings – – 4 Current Liabilities & Provisions4.1 Provision for doubtful Income/Deposits – – 4.2 Other Current Liabilities & Provisions 10.63 9.45
TOTAL 8,220.64 7,648.75
ASSETS1 Investments1.1 Listed Securities:1.1.1 Equity Shares – – 1.1.2 Preference Shares – – 1.1.3 Equity Linked Debentures – – 1.1.4 Other Debentures & Bonds 6,284.80 6,356.38 1.1.5 Securitised Debt securities – – 1.2 Securities Awaited Listing:1.2.1 Equity Shares – – 1.2.2 Preference Shares – – 1.2.3 Equity Linked Debentures – – 1.2.4 Other Debentures & Bonds – – 1.2.5 Securitised Debt securities – – 1.3 Unlisted Securities1.3.1 Equity Shares – – 1.3.2 Preference Shares – – 1.3.3 Equity Linked Debentures – – 1.3.4 Other Debentures & Bonds – – 1.3.5 Securitised Debt securities – – 1.4 Government Securities – – 1.5 Treasury Bills – – 1.6 Commercial Paper – – 1.7 Certificate of Deposits 616.27 – 1.8 Bill Rediscounting – – 1.9 Units of Domestic Mutual Fund – – 1.10 Foreign Securities – –
Total Investments 6,901.07 6,356.38
2 Deposits 3.36 0.14 3 Other Current Assets3.1 Cash & Bank Balance 0.62 9.18 3.2 CBLO / Reverse Repo Lending 172.29 376.65 3.3 Others 1,143.30 906.40 4 Deferred Revenue Expenditure (to the extent not written off) – –
TOTAL 8,220.64 7,648.75
Notes to Accounts – Annexure I

16
Abridged Balance Sheet as at March 31, 2018 (Contd...)
Rs. in Lakhs
HSBC CAPITAL PROTECTION ORIENTED FUND SERIES II – PLAN II
As at March 31, 2018
As at March 31, 2017
LIABILITIES1 Unit Capital 5,761.20 5,761.20 2 Reserves & Surplus2.1 Unit Premium Reserves – – 2.2 Unrealised Appreciation Reserve 0.40 17.50 2.3 Other Reserves 890.43 442.03 3 Loans & Borrowings – – 4 Current Liabilities & Provisions4.1 Provision for doubtful Income/Deposits – – 4.2 Other Current Liabilities & Provisions 7.15 6.96
TOTAL 6,659.18 6,227.69
ASSETS1 Investments1.1 Listed Securities:1.1.1 Equity Shares – – 1.1.2 Preference Shares – – 1.1.3 Equity Linked Debentures – – 1.1.4 Other Debentures & Bonds 5,290.23 5,308.68 1.1.5 Securitised Debt securities – – 1.2 Securities Awaited Listing:1.2.1 Equity Shares – – 1.2.2 Preference Shares – – 1.2.3 Equity Linked Debentures – – 1.2.4 Other Debentures & Bonds – – 1.2.5 Securitised Debt securities – – 1.3 Unlisted Securities1.3.1 Equity Shares – – 1.3.2 Preference Shares – – 1.3.3 Equity Linked Debentures – – 1.3.4 Other Debentures & Bonds – – 1.3.5 Securitised Debt securities – – 1.4 Government Securities – – 1.5 Treasury Bills – – 1.6 Commercial Paper – – 1.7 Certificate of Deposits 616.31 – 1.8 Bill Rediscounting – – 1.9 Units of Domestic Mutual Fund – – 1.10 Foreign Securities – –
Total Investments 5,906.54 5,308.68
2 Deposits 0.67 0.13 3 Other Current Assets3.1 Cash & Bank Balance 1.40 8.20 3.2 CBLO / Reverse Repo Lending 48.73 297.23 3.3 Others 701.84 613.45 4 Deferred Revenue Expenditure (to the extent not written off) – –
TOTAL 6,659.18 6,227.69
Notes to Accounts – Annexure I

17
Abridged Revenue Account for the year ended March 31, 2018
Rs. in Lakhs
HSBC CAPITAL PROTECTIONORIENTED FUND SERIES II – PLAN I
Current Year ended
March 31, 2018
Previous Year ended
March 31, 2017
1 INCOME1.1 Dividend – – 1.2 Interest 565.50 530.50 1.3 Realised Gain / (Loss) on Foreign Exchange Transactions – – 1.4 Realised Gains / (Losses) on Interscheme sale of investments – – 1.5 Realised Gains / (Losses) on External sale / redemption of
investments(4.51) (0.04)
1.6 Realised Gains / (Losses) on Derivative Transactions – – 1.7 Other Income – –
(A) 560.99 530.46
2 EXPENSES2.1 Management fees 42.53 36.57 2.2 GST / Service tax on Management fees 7.39 5.46 2.3 Transfer agents fees and expenses 1.77 1.67 2.4 Custodian fees 0.35 0.33 2.5 Trusteeship fees – – 2.6 Commission to Agents 33.28 31.81 2.7 Marketing & Distribution expenses 0.08 – 2.8 Audit fees 0.20 0.20 2.9 Investor Education Expenses 1.62 1.46 2.10 Other operating expenses 1.29 1.33 2.11 Less : Expenses to be Reimbursed by the Investment Manager (0.30) (0.23)
(B) 88.21 78.60
3 NET REALISED GAINS / (LOSSES) FOR THE PERIOD (A–B=C) 472.78 451.86
4 Change in Unrealised Depreciation in value of investments (D) 169.17 56.46
5 NET GAINS / (LOSSES) FOR THE PERIOD [E=(C+D)] 641.95 508.32
6 Change in unrealised appreciation in the value of investments (F) (71.24) 57.61
7 NET SURPLUS / (DEFICIT) FOR THE PERIOD (E + F = G) 570.71 565.93
7.1 Add: Balance transfer from Unrealised Appreciation Reserve 71.24 – 7.2 Less: Balance transfer to Unrealised Appreciation Reserve – 57.61 7.3 Add / (Less): Equalisation – – 7.4 Transfer from Reserve Fund 577.25 68.93 7.5 Transfer from Unit Premium Reserve – –
8 Total 1,219.20 577.25
9 Dividend appropriation9.1 Income Distributed during the period – – 9.2 Tax on income distributed during the period – –
10 Retained Surplus / (Deficit) carried forward to Balance sheet 1,219.20 577.25
Notes to Accounts – Annexure I

18
Abridged Revenue Account for the period ended March 31, 2018 (Contd...)
Rs. in Lakhs
HSBC CAPITAL PROTECTION ORIENTED FUND SERIES II – PLAN II
Current Year ended
March 31, 2018
Previous Year ended
March 31, 2017
1 INCOME1.1 Dividend – – 1.2 Interest 476.25 453.29 1.3 Realised Gain / (Loss) on Foreign Exchange Transactions – – 1.4 Realised Gains / (Losses) on Interscheme sale of investments – – 1.5 Realised Gains / (Losses) on External sale / redemption of
investments(0.63) (0.04)
1.6 Realised Gains / (Losses) on Derivative Transactions – – 1.7 Other Income – –
(A) 475.62 453.25
2 EXPENSES2.1 Management fees 28.25 24.21 2.2 GST / Service tax on Management fees 4.90 3.61 2.3 Transfer agents fees and expenses 1.49 1.36 2.4 Custodian fees 0.29 0.49 2.5 Trusteeship fees – – 2.6 Commission to Agents 23.16 21.73 2.7 Marketing & Distribution expenses 0.08 – 2.8 Audit fees 0.20 0.20 2.9 Investor Education Expenses 1.31 1.19 2.10 Other operating expenses 1.27 1.47 2.11 Less : Expenses to be Reimbursed by the Investment Manager (0.17) –
(B) 60.78 54.26
3 NET REALISED GAINS / (LOSSES) FOR THE PERIOD (A–B=C) 414.84 398.99
4 Change in Unrealised Depreciation in value of investments (D) 33.56 34.37
5 NET GAINS / (LOSSES) FOR THE PERIOD [E=(C+D)] 448.40 433.36
6 Change in unrealised appreciation in the value of investments (F) (17.11) 17.50
7 NET SURPLUS / (DEFICIT) FOR THE PERIOD (E+F=G) 431.29 450.86
7.1 Add: Balance transfer from Unrealised Appreciation Reserve 17.11 – 7.2 Less: Balance transfer to Unrealised Appreciation Reserve – 17.50 7.3 Add / (Less): Equalisation – – 7.4 Transfer from Reserve Fund 442.03 8.67 7.5 Transfer from Unit Premium Reserve – –
8 Total 890.43 442.03
9 Dividend appropriation9.1 Income Distributed during the period – – 9.2 Tax on income distributed during the period – – 10 Retained Surplus / (Deficit) carried forward to
Balance sheet 890.43 442.03
Notes to Accounts – Annexure I

19
Key Statistics for the year ended March 31, 2018
HSBC CAPITAL PROTECTION ORIENTED FUND SERIES II – PLAN I
Current Year ended
March 31, 2018
Previous Year ended
March 31, 2017
1. NAV per unit (Rs.):
Open
Growth Option 10.9641 10.1518
Dividend Option 10.9641 10.1518
Direct Plan – Growth Option – –
Direct Plan – Dividend Option – –
High
Growth Option 12.3502 10.9641
Dividend Option 12.3502 10.9641
Direct Plan – Growth Option – –
Direct Plan – Dividend Option – –
Low
Growth Option 10.9170 9.9893
Dividend Option 10.9170 9.9893
Direct Plan – Growth Option – –
Direct Plan – Dividend Option – –
End
Growth Option 11.7832 10.9641
Dividend Option 11.7832 10.9641
Direct Plan – Growth Option – –
Direct Plan – Dividend Option – –
2. Closing Assets Under Management (Rs. in Lakhs)
End 8,210 7,639
Average (AAuM)1 8,080 7,314
3. Gross income as % of AAuM2 * 6.94% 7.25%
4. Expense Ratio:
a. Total Expense as % of AAuM (including service tax / GST on Management fees) (planwise) *
Regular Growth Option 1.09% 1.07%
b. Management Fee as % of AAuM (planwise) *
Regular Growth Option 0.53% 0.50%
5. Net Income as a percentage of AAuM3 * 5.85% 6.18%
6. Portfolio turnover ratio4 – –

20
HSBC CAPITAL PROTECTION ORIENTED FUND SERIES II – PLAN I
Current Year ended
March 31, 2018
Previous Year ended
March 31, 2017
7. Total Dividend per unit distributed during the period (planwise)
Retail
Regular Dividend Option – –
Direct Plan - Dividend Option – –
Corporate
Regular Dividend Option – –
Direct Plan - Dividend Option – –
8. Returns(%):
a. Last One Year
Scheme
Regular Growth Option 8.1863 8.0015
Direct Plan – Growth Option N.A N.A
Benchmark
CRISIL MIP Blended Index 6.4503 12.2956
b. Since Inception
Scheme
Regular Growth Option 5.5916 4.6703
Direct Plan – Growth Option N.A N.A
Benchmark
CRISIL MIP Blended Index 8.6052 8.6693
1. AAuM=Average daily net assets2. Gross income = amount against (A) in the Revenue account i.e. Income3. Net income = amount against (C) in the Revenue account i.e. Net Realised Gains / (Losses) for the period4. Portfolio Turnover = Lower of sales or purchase divided by the Average AuM for the period5. The net asset value disclosed represents the computed NAV on March 31, 2018 (Non-business Day),
and not the last declared NAV
* Indicates annualised value
Key Statistics for the year ended March 31, 2018 (Contd...)

21
Key Statistics for the period ended March 31, 2018 (Contd...)
HSBC CAPITAL PROTECTION ORIENTED FUND SERIES II – PLAN II
Current Year ended
March 31, 2018
Previous Year ended
March 31, 2017
1. NAV per unit (Rs.):
Open
Growth Option 10.7976 10.0150
Dividend Option 10.7976 10.0150
Direct Plan – Growth Option – –
Direct Plan – Dividend Option – –
High
Growth Option 12.1464 10.7976
Dividend Option 12.1464 10.7976
Direct Plan – Growth Option – –
Direct Plan – Dividend Option – –
Low
Growth Option 10.7520 9.8598
Dividend Option 10.7520 9.8598
Direct Plan – Growth Option – –
Direct Plan – Dividend Option – –
End
Growth Option 11.5463 10.7976
Dividend Option 11.5463 10.7976
Direct Plan – Growth Option – –
Direct Plan – Dividend Option – –
2. Closing Assets Under Management (Rs. in Lakhs)
End 6,652 6,221
Average (AAuM)1 6,574 5,965
3. Gross income as % of AAuM2 * 7.23% 7.60%
4. Expense Ratio:
a. Total Expense as % of AAuM (including service tax / GST on Management fees) (planwise) *
Regular Growth Option 0.92% 0.91%
b. Management Fee as % of AAuM (planwise) *
Regular Growth Option 0.43% 0.41%
5. Net Income as a percentage of AAuM3 * 6.31% 6.69%
6. Portfolio turnover ratio4 – –

22
Key Statistics for the period ended March 31, 2018 (Contd...)
HSBC CAPITAL PROTECTION ORIENTED FUND SERIES II – PLAN II
Current Year ended
March 31, 2018
Previous Year ended
March 31, 2017
7. Total Dividend per unit distributed during the period (planwise)
Retail
Regular Dividend Option – –
Direct Plan - Dividend Option – –
Corporate
Regular Dividend Option – –
Direct Plan - Dividend Option – –
8. Returns(%):
a. Last One Year
Scheme
Regular Growth Option 7.5895 7.8143
Direct Plan – Growth Option N.A N.A
Benchmark
CRISIL MIP Blended Index 6.4503 12.2956
b. Since Inception
Scheme
Regular Growth Option 4.9825 4.0009
Direct Plan – Growth Option N.A N.A
Benchmark
CRISIL MIP Blended Index 8.4146 8.6693
1. AAuM=Average daily net assets2. Gross income = amount against (A) in the Revenue account i.e. Income3. Net income = amount against (C) in the Revenue account i.e. Net Realised Gains / (Losses) for the period4. Portfolio Turnover = Lower of sales or purchase divided by the Average AuM for the period5. The net asset value disclosed represents the computed NAV on March 31, 2018 (Non-business Day),
and not the last declared NAV
* Indicates annualised value
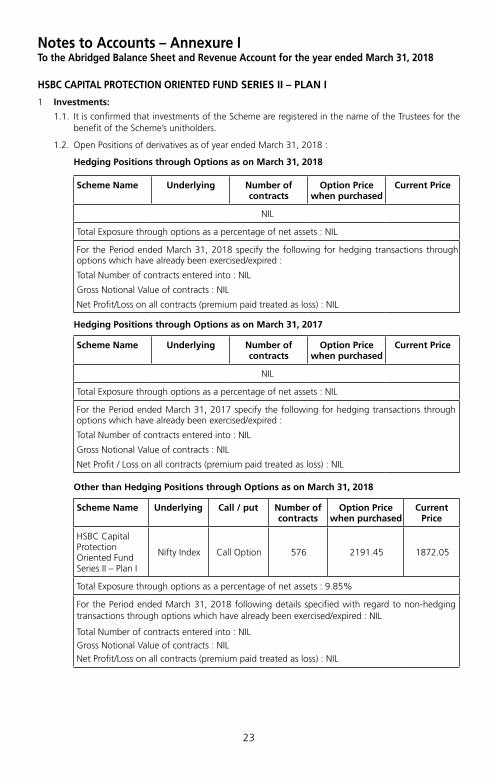
23
Notes to Accounts – Annexure ITo the Abridged Balance Sheet and Revenue Account for the year ended March 31, 2018
HSBC CAPITAL PROTECTION ORIENTED FUND SERIES II – PLAN I
1 Investments:
1.1. It is confirmed that investments of the Scheme are registered in the name of the Trustees for the benefit of the Scheme’s unitholders.
1.2. Open Positions of derivatives as of year ended March 31, 2018 :
Hedging Positions through Options as on March 31, 2018
Scheme Name Underlying Number of contracts
Option Price when purchased
Current Price
NIL
Total Exposure through options as a percentage of net assets : NIL
For the Period ended March 31, 2018 specify the following for hedging transactions through options which have already been exercised/expired :
Total Number of contracts entered into : NIL
Gross Notional Value of contracts : NIL
Net Profit/Loss on all contracts (premium paid treated as loss) : NIL
Hedging Positions through Options as on March 31, 2017
Scheme Name Underlying Number of contracts
Option Price when purchased
Current Price
NIL
Total Exposure through options as a percentage of net assets : NIL
For the Period ended March 31, 2017 specify the following for hedging transactions through options which have already been exercised/expired :
Total Number of contracts entered into : NIL
Gross Notional Value of contracts : NIL
Net Profit / Loss on all contracts (premium paid treated as loss) : NIL
Other than Hedging Positions through Options as on March 31, 2018
Scheme Name Underlying Call / put Number of contracts
Option Price when purchased
Current Price
HSBC Capital Protection Oriented Fund Series II – Plan I
Nifty Index Call Option 576 2191.45 1872.05
Total Exposure through options as a percentage of net assets : 9.85%
For the Period ended March 31, 2018 following details specified with regard to non-hedging transactions through options which have already been exercised/expired : NIL
Total Number of contracts entered into : NIL
Gross Notional Value of contracts : NIL
Net Profit/Loss on all contracts (premium paid treated as loss) : NIL

24
Notes to Accounts – Annexure I (Contd...)To the Abridged Balance Sheet and Revenue Account for the year ended March 31, 2018
Other than Hedging Positions through Options as on March 31, 2017
Scheme Name Underlying Call / put Number of contracts
Option Price when purchased
Current Price
HSBC Capital Protection Oriented Fund Series II – Plan I
Nifty Index Call Option 576 2191.45 1480.45
Total Exposure through options as a percentage of net assets : 8.37%
For the Period ended March 31, 2017 following details specified with regard to non-hedging transactions through options which have already been exercised/expired : NIL
Total Number of contracts entered into : NIL
Gross Notional Value of contracts : NIL
Net Profit/Loss on all contracts (premium paid treated as loss) : NIL
1.3. Investments in Associates and Group Companies as of period ended March 31, 2018 is NIL.
1.4. Open positions of Securities Borrowed and / or Lent by the Scheme as of the year ended March 31, 2018 is NIL.
1.5. NPA as at year ended March 31, 2018 is NIL.
1.6. Aggregate Unrealised Gain / Loss as at the end of the financial period and percentage to net assets.
Security Category Amount (Rupees)
Percentage to Net Assets
Amount (Rupees)
Percentage to Net Assets
2018 2017
Non Convertible Debentures and Bonds Listed / Awaiting Listing
– Appreciation 2,724,174 0.33 9,448,169 1.24
– Depreciation 434,863 0.05 – –
Derivatives (Options)
– Appreciation – – – –
– Depreciation 13,824,000 1.68 30,741,120 4.02
Certificate of Deposits
– Appreciation 35,179 0.00 – –
– Depreciation – – – –
1.7. The aggregate value of investment securities (excluding CBLO and Reverse Repos) purchased and sold (including matured) during the financial year 2017 -18 (excluding accretion of discount) are Rs. 106,885,435 and Rs. 45,000,000 respectively being 13.23% and 5.57% of the average daily net assets.
The aggregate value of investment securities (excluding CBLO and Reverse Repos) purchased and sold (including matured) during the financial year 2016 -17 (excluding accretion of discount) are Rs. 45,157,832 and Rs. 7,000,000 respectively being 6.17% and 0.96% of the average daily net assets.

25
Notes to Accounts – Annexure I (Contd...)To the Abridged Balance Sheet and Revenue Account for the year ended March 31, 2018
1.8. Non -Traded securities in the portfolio: Aggregate Value of Equity, Debt & Money Market Instruments and percentages to net assets are as under :
Security Category Amount (Rupees)
Percentage to Net Assets
Amount (Rupees)
Percentage to Net Assets
2018 2017
Debt Instruments 628,479,505 76.55 635,638,363 83
Money Market Instruments 61,627,438 7.51 – –
Total 690,106,942 84.06 635,638,363 83
2 Disclosure Under Regulation 25(8) of the Securities and Exchange Board of India (Mutual Funds) Regulations, 1996 as amended
Commission paid to Sponsor/AMC and its associates/related parties/group companies
Name of Sponsor / AMC and its associates / related parties / group companies
Nature of Association / Nature of
Relation
Period Covered
Business Given [Rs. In Crores]
% of Total Business received by the Fund
Commission paid
[Rupees]
% of Total commission paid by the
Fund
The Hongkong and Shanghai Banking Corporation Limited
Associate 2017-2018 – – 2,784,050 91.41
Name of Sponsor/AMC and its associates / related parties / group companies
Nature of Association / Nature of
Relation
Period Covered
Business Given [Rs. In Crores]
% of Total Business received by the Fund
Commission paid
[Rupees]
% of Total commission paid by the
Fund
The Hongkong and Shanghai Banking Corporation Limited
Associate 2016-2017 – – 2,673,369.53 91.76
Brokerage paid to Sponsor/AMC and its associates/related parties/group companies is NIL (Previous year also NIL).
(i) Any underwriting obligations undertaken by the schemes of the mutual funds with respect to issue of securities associate companies - Nil (Previous year also Nil).
(ii) Devolvement - Nil (Previous year also Nil).
(iii) Subscription by the schemes in the issues lead managed by associate companies - Nil (Previous year also Nil).
(iv) Subscription to any issue of equity or debt on private placement basis where the sponsor or its associate companies have acted as arranger or manager - Nil (Previous year also Nil).
3 None of the Investors held more than 25% of the total net assets of the Scheme as at the years ended on March 31, 2018 and March 31, 2017.

26
Notes to Accounts – Annexure I (Contd...)To the Abridged Balance Sheet and Revenue Account for the year ended March 31, 2018
4 Unit Capital movement during the years ended March 31, 2018 and March 31, 2017:
Description 2017–2018
Opening Units Subscription Redemption Closing Units Face Value per unit (Rupees)
Growth Option 68,645,883.086 – – 68,645,883.086 10
Dividend Option 1,029,852.818 – – 1,029,852.818 10
Description 2016–2017
Opening Units Subscription Redemption Closing Units Face Value per unit (Rupees)
Growth Option 68,645,883.086 – – 68,645,883.086 10
Dividend Option 1,029,852.818 – – 1,029,852.818 10
5 No contingent liabilities for the years ended March 31, 2018 and March 31, 2017.
6 Expenses other than Management Fees are Inclusive of GST / Service Tax where applicable.
7 Investor Education Awareness
In view of the AMFI Best Practices Guidelines Circular No. 56/2015-16, the IEF (Investor Education Fund) accrual is set aside in a separate bank account and the consolidated balance across all schemes as on March 31, 2018. The break-up of which is as under:
Particulars March 31, 2018 March 31, 2017
Amount (in Rs. Lacs) Amount (in Rs. Lacs)
Opening Balance 44.00 –
Add: Accrual during the year 219.83 182
Less: Transferred to AMFI 101.10 83
Less: Payable to AMFI (March accrual) 8.81 8
Add: Investment Income for the year 8.28 11
Less: Spent during the year 43.17 58
Closing Balance 119.02 44
8 The Annual Accounts of the Schemes prepared in accordance with the accounting policies and standards specified in the Ninth Schedule of The Securities and Exchange Board of India (Mutual Funds) Regulations, 1996 has been approved by the Board of Directors of HSBC Asset Management (India) Private Limited and The Board of Trustees of HSBC Mutual Fund at their meetings held on July 16, 2018 and July 17, 2018 respectively. The audit report attached herewith refers to the said Annual Accounts. The aforesaid abridged accounts are an extract of the Annual Accounts and are prepared in accordance with SEBI Circular No. IMD/Cir8/132968/2008 dated July 24, 2008.

27
Notes to Accounts – Annexure I (Contd...)To the Abridged Balance Sheet and Revenue Account for the period ended March 31, 2018
HSBC CAPITAL PROTECTION ORIENTED FUND SERIES II – PLAN II
1 Investments:
1.1. It is confirmed that investments of the Scheme are registered in the name of the Trustees for the benefit of the Scheme’s unitholders.
1.2. Open Positions of derivatives as of year ended March 31, 2018 :
Hedging Positions through Options as on March 31, 2018
Scheme Name Underlying Number of contracts
Option Price when purchased
Current Price
NIL
Total Exposure through options as a percentage of net assets : NIL
For the Period ended March 31, 2018 specify the following for hedging transactions through options which have already been exercised/expired :
Total Number of contracts entered into : NIL
Gross Notional Value of contracts : NIL
Net Profit/Loss on all contracts (premium paid treated as loss) : NIL
Hedging Positions through Options as on March 31, 2017
Scheme Name Underlying Number of contracts
Option Price when purchased
Current Price
NIL
Total Exposure through options as a percentage of net assets : NIL
For the Period ended March 31, 2017 specify the following for hedging transactions through options which have already been exercised/expired :
Total Number of contracts entered into : NIL
Gross Notional Value of contracts : NIL
Net Profit / Loss on all contracts (premium paid treated as loss) : NIL
Other than Hedging Positions through Options as on March 31, 2018
Scheme Name Underlying Call / put Number of contracts
Option Price when purchased
Current Price
HSBC Capital Protection Oriented Fund Series II – Plan II
Nifty Index Call Option 460 2250.20 1571.00
Total Exposure through options as a percentage of net assets : 8.15%
For the Period ended March 31, 2018 following details specified with regard to non-hedging transactions through options which have already been exercised/expired : NIL
Total Number of contracts entered into : NIL
Gross Notional Value of contracts :NIL
Net Profit/Loss on all contracts (premium paid treated as loss) : NIL

28
Notes to Accounts – Annexure I (Contd...)To the Abridged Balance Sheet and Revenue Account for the period ended March 31, 2018
Other than Hedging Positions through Options as on March 31, 2017
Scheme Name Underlying Call / put Number of contracts
Option Price when purchased
Current Price
HSBC Capital Protection Oriented Fund Series II – Plan II
Nifty Index Call Option 460 2250.20 1316.20
Total Exposure through options as a percentage of net assets : 7.30%
For the Period ended March 31, 2017 following details specified with regard to non-hedging transactions through options which have already been exercised/expired : NIL
Total Number of contracts entered into : NIL
Gross Notional Value of contracts : NIL
Net Profit/Loss on all contracts (premium paid treated as loss) : NIL
1.3. Investments in Associates and Group Companies as of period ended March 31, 2018 is NIL.
1.4. Open positions of Securities Borrowed and / or Lent by the Scheme as of the years ended March 31, 2018 and March 31, 2017 are NIL.
1.5. NPAs as at years ended March 31, 2018 and March 31, 2017 are NIL.
1.6. Aggregate Unrealised Gain / Loss as at the end of the financial period and percentage to net assets:
Security Category Amount (Rupees)
Percentage to Net Assets
Amount (Rupees)
Percentage to Net Assets
2018 2017
Non Convertible Debentures and Bonds Listed / Awaiting Listing
– Appreciation – – 2,874,083 0.46
– Depreciation 5,434,111 0.82 1,123,734 0.18
Derivatives (Options)
– Appreciation – – – –
– Depreciation 23,453,100 3.53 32,243,700 5.18
Derivatives (Options)
– Appreciation 39,725 0.01 – –
– Depreciation – – – –
1.7. The aggregate value of investments securities (excluding CBLO and Reverse Repos) purchased and sold (including matured) during the financial period 2017 - 2018 (excluding accretion of discount) is Rs. 65,911,235 and Rs. 5,000,000 respectively being 10.03% and 0.76% of the average daily net assets.
The aggregate value of investments securities (excluding CBLO and Reverse Repos) purchased and sold (including matured) during the financial period 2016 - 2017 (excluding accretion of discount) is Rs. 50,013,603 and Rs. 11,000,000 respectively being 8.38% and 1.84% of the average daily net assets.
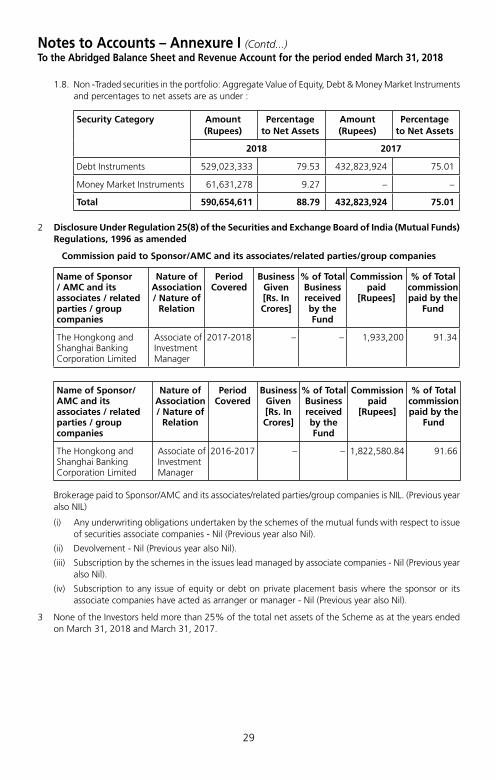
29
Notes to Accounts – Annexure I (Contd...)To the Abridged Balance Sheet and Revenue Account for the period ended March 31, 2018
1.8. Non -Traded securities in the portfolio: Aggregate Value of Equity, Debt & Money Market Instruments and percentages to net assets are as under :
Security Category Amount (Rupees)
Percentage to Net Assets
Amount (Rupees)
Percentage to Net Assets
2018 2017
Debt Instruments 529,023,333 79.53 432,823,924 75.01
Money Market Instruments 61,631,278 9.27 – –
Total 590,654,611 88.79 432,823,924 75.01
2 Disclosure Under Regulation 25(8) of the Securities and Exchange Board of India (Mutual Funds) Regulations, 1996 as amended
Commission paid to Sponsor/AMC and its associates/related parties/group companies
Name of Sponsor / AMC and its associates / related parties / group companies
Nature of Association / Nature of
Relation
Period Covered
Business Given [Rs. In Crores]
% of Total Business received by the Fund
Commission paid
[Rupees]
% of Total commission paid by the
Fund
The Hongkong and Shanghai Banking Corporation Limited
Associate of Investment Manager
2017-2018 – – 1,933,200 91.34
Name of Sponsor/AMC and its associates / related parties / group companies
Nature of Association / Nature of
Relation
Period Covered
Business Given [Rs. In Crores]
% of Total Business received by the Fund
Commission paid
[Rupees]
% of Total commission paid by the
Fund
The Hongkong and Shanghai Banking Corporation Limited
Associate of Investment Manager
2016-2017 – – 1,822,580.84 91.66
Brokerage paid to Sponsor/AMC and its associates/related parties/group companies is NIL. (Previous year also NIL)
(i) Any underwriting obligations undertaken by the schemes of the mutual funds with respect to issue of securities associate companies - Nil (Previous year also Nil).
(ii) Devolvement - Nil (Previous year also Nil).
(iii) Subscription by the schemes in the issues lead managed by associate companies - Nil (Previous year also Nil).
(iv) Subscription to any issue of equity or debt on private placement basis where the sponsor or its associate companies have acted as arranger or manager - Nil (Previous year also Nil).
3 None of the Investors held more than 25% of the total net assets of the Scheme as at the years ended on March 31, 2018 and March 31, 2017.

30
4 Unit Capital movement during the years ended March 31, 2018 and March 31, 2017:
Description 2017–2018
Opening Units Subscription Redemption Closing Units Face Value per unit (Rupees)
Growth Option 56,437,012.044 – – 56,437,012.044 10
Dividend Option 1,175,000.000 – – 1,175,000.000 10
Description 2016–2017
Opening Units Subscription Redemption Closing Units Face Value per unit (Rupees)
Growth Option 56,437,012.044 – – 56,437,012.044 10
Dividend Option 1,175,000.000 – – 1,175,000.000 10
5 No contingent liabilities for the years ended March 31, 2018 and March 31, 2017.
6 Expenses other than Management Fees are Inclusive of GST / Service Tax where applicable.
7 Investor Education Awareness
In view of the AMFI Best Practices Guidelines Circular No. 56/2015-16, the IEF (Investor Education Fund) accrual is set aside in a separate bank account and the consolidated balance across all schemes as on March 31, 2018. The break-up of which is as under:
Particulars March 31, 2018 March 31, 2017
Amount (in Rs. Lacs) Amount (in Rs. Lacs)
Opening Balance 44.00 –
Add: Accrual during the year 219.83 182
Less: Transferred to AMFI 101.10 83
Less: Payable to AMFI (March accrual) 8.81 8
Add: Investment Income for the year 8.28 11
Less: Spent during the year 43.17 58
Closing Balance 119.02 44
8 The Annual Accounts of the Schemes prepared in accordance with the accounting policies and standards specified in the Ninth Schedule of The Securities and Exchange Board of India (Mutual Funds) Regulations, 1996 has been approved by the Board of Directors of HSBC Asset Management (India) Private Limited and The Board of Trustees of HSBC Mutual Fund at their meetings held on July 16, 2018 and July 17, 2018 respectively. The audit report attached herewith refers to the said Annual Accounts. The aforesaid abridged accounts are an extract of the Annual Accounts and are prepared in accordance with SEBI Circular No. IMD/Cir8/132968/2008 dated July 24, 2008.
Notes to Accounts – Annexure I (Contd...)To the Abridged Balance Sheet and Revenue Account for the period ended March 31, 2018

31
Voting Policy and Procedures
In view of SEBI guidelines related to “Role of Mutual Funds in Corporate Governance of Public Listed Companies”, AMIN has formulated its “Policy for Proxy Voting in Public Listed Companies”. The said policy and details of actual exercise of proxy votes along with the summary of votes cast and the auditors certification during the Financial Year 2017 – 18 is available on its website – http://www.assetmanagement.hsbc.com/in and in full Annual Report for the Financial Year 2017 – 18.

32
Statutory Details & Disclaimers
All returns have been sourced from Mutual Funds India Explorer software unless otherwise stated. With regard to equity schemes (including the equity component of MIPs), Fund performance is calculated on a total return basis (i.e. it includes dividends re-invested) while the benchmark is calculated on a price return basis (i.e. it does not consider dividends re-invested). This document has been prepared by HSBC Asset Management (India) Private Ltd (HSBC) for information purposes only and should not be construed as an offer or solicitation of an offer for purchase of any of the funds of HSBC Mutual Fund. All information contained in this document (including that sourced from third parties), is obtained from sources HSBC, the third party believes to be reliable but which it has not independently verified and HSBC, the third party makes no guarantee, representation or warranty and accepts no responsibility or liability as to the accuracy or completeness of such information. The information and opinions contained within the document are based upon publicly available information and rates of taxation applicable at the time of publication, which are subject to change from time to time. Expressions of opinion are those of HSBC only and are subject to change without notice. It does not have regard to specific investment objectives, financial situation and the particular needs of any specific person who may receive this document. Investors should seek financial advice regarding the appropriateness of investing in any securities or investment strategies that may have been discussed or recommended in this report and should understand that the views regarding future prospects may or may not be realized. Neither this document nor the units of HSBC Mutual Fund have been registered in any jurisdiction. The distribution of this document in certain jurisdictions may be restricted or totally prohibited and accordingly, persons who come into possession of this document are required to inform themselves about, and to observe, any such restrictions.
Investors should not invest in the Scheme solely based on the information provided in this document and should read the Scheme Information Document and Statement of Additional Information of the Fund for details. This document does not constitute an offering document.
No part of this publication may be reproduced, stored in a retrieval system, or transmitted, on any form or by any means, electronic, mechanical, photocopying, recording, or otherwise, without the prior written permission of HSBC Asset Management (India) Private Ltd.
Mutual Fund investments are subject to market risks, read all scheme related documents carefully.

HSBC Fixed Term SeriesA close ended income Schemes
Abridged Annual Report 2017 - 2018

1
Dear Investor,
Globally, we are witnessing a very interesting phase. The equity markets delivered a stellar performance in 2017. However, there are worries about the impact of higher rates, global trade wars, an economic growth moderation and higher volatility.
Closer home, India has become the world’s sixth-biggest economy. India has doubled its GDP to USD 2.2 trillion within a decade. The introduction of reform measures, including demonetisation and the Goods and Services Tax (GST), had put pressure on selective parts of the economy in 2017. The impact of these measures is likely to be transitory. India’s economic growth is expected to accelerate from 6.7% in FY18 to 7.4% in the current year as per IMF forecasts.
There has been a shift in the domestic savings pool supporting the market. Domestic investors have been increasing exposure to equities and financial assets moving away from gold and real estate. Mutual funds witnessed sizable inflows on the back of the boost in liquidity within the banking system from demonetisation. The AUM of the mutual fund industry grew by 21.7% in March 2018 compared to March 2017.
With growth, comes responsibility. Last year, the regulator, Securities and Exchange Board of India (SEBI) issued a circular to rationalise and categorise mutual fund schemes in India. We are pleased to state that none of our funds needed to be redesigned. All our schemes have been defined as per the new categorisation. We believe this classification will simplify investing into mutual funds and enhance comparability within the schemes offered.
As India moves to a digital age, e-commerce platforms are becoming increasingly popular. I request you to logon to our online transaction platform. It is a quick, convenient and an efficient tool to invest into our funds and manage your investments online.
At HSBC Global Asset Management, India, we are dedicated to one goal: delivering exceptional investment management for our clients. By bringing together our

2
global investment knowledge and capabilities, we are able to offer specialised expertise across asset classes. This has helped us to become a trusted partner to our individual and institutional investors.
We remain committed to our long-term perspective and disciplined investment approach as we conduct a rigorous, fundamental analysis of investments with a strong emphasis on risk management. Although the investment landscape appears favourable, it is worth remembering that markets are dynamic and constantly evolving. Therefore, we believe active, professional investment management serves investors well. Amid changing markets and economic conditions, we are confident that investors with a well-diversified portfolio and a patient, long-term outlook should be well positioned for the years ahead.
Together we thrive.
Warm regards,
Ravi Menon
Chief Executive Officer, HSBC Global Asset Management, India

3
SPONSORHSBC Securities and Capital Markets (India) Private LimitedRegd. Office: 52/60, Mahatma Gandhi Road, Fort, Mumbai - 400 001.
TRUSTEEBoard of TrusteesOffice: 16, Veer Nariman Road, Fort, Mumbai 400 001.
ASSET MANAGEMENT COMPANYHSBC Asset Management (India) Private LimitedCorp. & Regd. Office: 16, Veer Nariman Road, Fort, Mumbai 400 001.
CUSTODIANStandard Chartered Bank (SCB)Corp. & Regd. Office: Crescenzo, Securities Services, 3rd Floor, C-38/39, G-Block, Bandra Kurla Complex, Bandra East, Mumbai – 400051.
AUDITORS TO THE SCHEMEBSR & Co. LLPChartered Accountants 5th Floor, Lodha Excelus, Apollo Mills Compound, N.M. Joshi Marg, Mahalaxmi, Mumbai 400 011.
REGISTRAR & TRANSFER AGENTSComputer Age Management Services Private Limited (CAMS)Unit: HSBC Mutual Fund ’C’ Block, 2nd Floor, Hanudev Info Park P. Ltd., SF No. 558/2, Udayampalayam Road, Nava India, Coimbatore - 641 028.
BOARD OF TRUSTEESMr. Nasser Munjee
Mr. Manu Tandon
Mr. Mehli Mistri
Mr. Dilip J. Thakkar
Ms. Jasmine Batliwalla
Mr. Pedro Bastos
BOARD OF DIRECTORSMs. Kishori J. Udeshi - Chairperson
Mr. S. P. Mustafa
Mr. Dinesh Mittal
Mr. Ravi Menon - Chief Executive Officer

4
The Trustees of HSBC Mutual Fund (“Fund”) present the Sixteenth Annual Report and the audited abridged financial statements of the schemes of the Fund for the year ended March 31, 2018.
As at March 31, 2018, the Fund offered 30 schemes across asset classes to meet the varying investment needs of the investors. Notably, three Schemes of HSBC Mutual Fund viz. HSBC Large Cap Equity Fund, HSBC Short Duration Fund and HSBC Cash Fund have completed 15 years of operations during the year.
During the year, the Fund has launched Plan(s) under Fixed Term Series and carried out merger of the existing schemes viz HSBC Dividend Yield Equity Fund merged into HSBC Multi Cap Equity Fund (HMEF), erstwhile HSBC India Opportunities Fund, as offering sub-scale fund was not in the interest of the unitholders.
Further, in order to bring uniformity in the practice across Mutual Funds and to standardize the scheme categories and characteristics of schemes, SEBI vide its circular no. SEBI/HO/IMD/DF3/CIR/P/2017/114 dated October 06, 2017, issued guidelines for categorization and rationalization of Mutual Fund schemes.
Accordingly, HSBC Large Cap Equity Fund (erstwhile HSBC Equity Fund), HSBC Small Cap Equity Fund (erstwhile HSBC Mid Cap Equity Fund) , HSBC Infrastructure Equity Fund, HSBC Global Emerging Market Fund (erstwhile HSBC Emerging Market Fund), HSBC Debt Fund (erstwhile HSBC Income Fund – Investments Plan), HSBC Short Duration Fund (erstwhile HSBC Income Fund – Short Term Plan), HSBC Low Duration Fund (erstwhile HSBC Ultra Short Term Bond Fund), HSBC Regular Savings Fund (erstwhile HSBC Monthly Income Plan) and HSBC Managed Solutions have undergone fundamental attributes changes with effective from March 14, 2018.
The Fund continues its focus on delivering consistent long term returns. The comments on the performance of the Scheme(s) is provided hereinafter. Dividends were declared under various schemes as per the provisions contained in the respective Scheme Information Documents after considering the distributable surplus available under the respective Schemes. Details of dividends declared can be viewed on our website at www.assetmanagement.hsbc.com/in.
1. Scheme Performance, future outlook and oPerationS of the SchemeS
a. Operations and Performance of the Schemes
HSBC Fixed Term Series – close ended income Schemes These are closed-ended income schemes that seek to generate return by investing in a portfolio of fixed income instruments which mature on or before maturity date of the respective Plan(s). Each Plan is managed as a separate portfolio. The Fixed Term Series under the respective Series with different tenures have performed in line with the yields prevailing for the relevant tenures at the time of launch, however, the Plan(s) does not assure or guarantee any returns.
Details of Scheme launched since last annual report is as under:
Scheme Name Date of Launch
HSBC Fixed Term Series 130 December 22, 2017HSBC Fixed Term Series 131 March 21, 2018HSBC Fixed Term Series 132 March 12, 2018HSBC Fixed Term Series 133 March 27, 2018HSBC Fixed Term Series 134 June 1, 2018HSBC Fixed Term Series 135 June 29, 2018
The performance of Fixed Term Series which are in existence for more than a year as on March 31, 2018 is provided below:
Fund / BenchmarkAbsolute
Returns (%)Compounded Annualized
Returns (%)Inception
Date1 Year 3 Years Since Inception
Amount (Rs.)
Returns (%)
Amount (Rs.)
Returns (%)
Amount (Rs.)
Returns (%)
HSBC Fixed Term Series 125 - Regular - Growth
10,667 6.73 NA NA 11,639 7.92 31-Mar-16
Scheme Benchmark (CRISIL Composite Bond Fund Index)
10,506 5.10 NA NA 11,672 8.07
Trustees’ ReportFor the year ended March 31, 2018

5
Fund / BenchmarkAbsolute
Returns (%)Compounded Annualized
Returns (%)Inception
Date1 Year 3 Years Since Inception
Amount (Rs.)
Returns (%)
Amount (Rs.)
Returns (%)
Amount (Rs.)
Returns (%)
HSBC Fixed Term Series 126 - Regular - Growth
10,643 6.48 NA NA 11,455 7.60 20-May-16
Scheme Benchmark (CRISIL Composite Bond Fund Index)
10,506 5.10 NA NA 11,523 7.94
HSBC Fixed Term Series 94 - Regular - Growth
10,648 6.54 12,325 7.23 14,456 8.33 20-Aug-13
Scheme Benchmark (CRISIL Short Term Bond Fund Index)
10,612 6.17 12,557 7.90 14,897 9.04
HSBC Fixed Term Series 96 - Regular - Growth
10,628 6.33 12,284 7.11 14,345 8.22 3-Sep-13
Scheme Benchmark (CRISIL Short Term Bond Fund Index)
10,612 6.17 12,557 7.90 14,779 8.93
HSBC Fixed Term Series 98 - Regular - Growth
10,636 6.41 12,304 7.17 13,982 7.83 17-Oct-13
Scheme Benchmark (CRISIL Short Term Bond Fund Index)
10,612 6.17 12,557 7.90 14,444 8.62
Past performance may or may not be sustained in future. The returns for the respective periods are provided as on last business day of March 2018 for Growth Option. Different plans shall have a different expense structure. Performance of the respective benchmark is calculated as per the Total Return Index (TRI). NA means not available.
b. Market Overview & Outlook (as furnished by HSBC Asset Management (India) Private Limited)
EqUITY OUTLOOKIndian equity markets continued to remain strong during fiscal year 2017-18 and posted gains of 11.76% by S&P CNX Nifty and 13.24% by BSE Midcap index respectively. Biggest drivers of the markets were, robust DII flow into equities, continued push of mega reforms – Goods and Services Tax (GST) implementation, Insolvency and Bankruptcy Code implementation, Real Estate (Regulation and Development) Act, second consecutive normal monsoon, and electoral victories of the ruling party in many state elections. On the other hand, the markets weather the storm of disruption in economy due to GST implementation, lingering impact of demonetization, muted FII flows, and rising yields in developed markets. Domestic Mutual Fund segment had their best ever year and they brought in ~USD 22 bn of net inflows in equities during the year. Even after witnessing ~USD 4.3 bn of net outflows from the domestic insurers, the net DII tally was a very impressive ~USD 17.7 bn of net inflows. There were mixed global cues well and the Foreign Institutional Investors (FIIs) net bought Indian equities worth USD 3.2 bn. The inflows by both FIIs and domestic MFs acted as a factor in the strong market performance.
Indices Returns (April 1, 2017 to March 31, 2018) 1 Year (%)S&P BSE Sensex 12.70%
NSE CNX Nifty 11.76%
S&P BSE 100 12.12%
S&P BSE 200 12.49%
S&P BSE 500 13.21%
S&P BSE Midcap 14.31%
S&P BSE 250 Small-cap 14.13%
Trustees’ ReportFor the year ended March 31, 2018 (Contd...)

6
Source: Bloomberg (All values are total return)
Our view on the key aspects related to equity markets are presented below -
The impressive performance in equity markets during FY 2017-18 has come on the back of strong liquidity largely by domestic MFs but supported in party by FII flows, positive global growth, benign macro – both domestically and global, expectation of the continuation of favorable policy environment domestically and expectation of corporate earnings revival. Possibility of sound macro, economic reforms and implementation of existing reforms have increased, especially after continued success of the ruling party at the centre in state elections. However, after this strong performance in markets and rather long wait for earnings to be delivered has meant that the equity markets are currently trading above their historical averages.
Moving into FY 2018-19, we expect a continuation of the economic recovery process domestically, recovery in corporate earnings - led early by volume growth, and continued DII flows. Government led investment spending and rural consumption are likely to lead with private sector investments contributing later (possibly after general elections 2019). The budget document that was presented in early February provides a good medium term policy direction for the economy. Occasionally the policy actions can serve up a few bumps and jolts but over the medium term, across different governments, there is a thread of continuity connecting many key economic policies such as in the case of this year’s union budget. We, in our investment process, prefer to take comfort in these threads of continuity and remain constructive on the India growth story. This makes us positive on the Indian equity markets over the medium to long term.
Risks are in the form of market valuations trending above historical averages, weaker than expected delivery in corporate earnings going forward, external news flows related to trade protectionism, developed market central banks raising rates prematurely, and geopolitical tensions and other eco-political events would also influence market performance going forward, as the recent rally in the markets was supported by strong FII inflows.
DEBT OUTLOOKFixed Income in Financial Year 2017-18 has seen volatility further step up in this year. Markets went to perfect storm with higher crude prices, low liquidity and pressure on currency, apart from rate hike expectations.
Inflation has followed the glide path to lower numbers towards 4% RBI target and even lower than the target number when inflation printed a lowly 1.46% in June 2018 on back of lower food prices. RBI went for a cut despite of neutral stance. This positivity continued till until crude shock came in form of higher crude process. Global prices of Brent crude saw substantial increase in second half of the year, which jeopardized the inflation path. Other worries that gathered around this time were related to GST collection and eventual impact on fiscal situation.
Government of India allowed the fiscal deficit to slip to 3.5% (budget 3.2%) and kept next year target at 3.3% (in place of earlier path of 3%). This was on back of some excise relaxation for oil products and a month less collected for GST due to implementation in the current year. The fear of fiscal slippage alongwith the announcement of higher bond issuances spooked the bond markets into higher yields. Government finally borrowed only INR 90 bln extra (in place of INR 500 bln announced initially).
On the Monetary front the year was very volatile as well. RBI changed its stance to neutral causing some worry around rate hikes. Thereafter it cut rates and again went for OMO sales operations simultaneously. This created some confusion in the market participants regarding rates direction. Finally extra supply, higher oil prices and higher inflation paved way for rates higher. RBI also held position on regulatory forbearance about spreading out losses by banks publicly. It eventually gave up the position in the end of March. However, the swift changes in stance caused lot of pressure and volatility in bonds.
Liquidity situation continuously deteriorated due to OMO sales initially and withdrawal of deposits due to remonetisation. Further liquidity was absorbed out due to portfolio outflows and reduction in reserves. Despite of defense from RBI utilizing the reserves, the currency depreciated meaningfully, which caused further jitters in foreign investor sentiments. Lack of liquidity also affected 1-3 year rates which were elevated in second half of the year.
Going forward following are key variables to watch out for:
• Liquidity: Liquidity will drive short end rates and eventually drive decisions leading to market interventions and CRR cuts. RBI has focused now on neutral liquidity stance and providing liquidity to system, which will bode well short end rates.
Trustees’ ReportFor the year ended March 31, 2018 (Contd...)

7
• Inflation: Inflation numbers will determine future course of action for RBI and remains a critical variable for policy. We expect inflation to remain at 4.7% level in the ease in second half of FY 2018-19 in line with RBI’s expectations.
• Growth: GDP growth numbers as well as industrial activity will also determine the decision on policy.
• Fiscal deficit: Fiscal deficit and government spending will determine the government borrowing and crowding out in interest rate curve. We expect prudence in government spending and prospect of spending on infrastructure to pick up which will crowd in private investment as well.
• Current Account Deficit: Current Account Deficit determines how the pressure on currency works and effective management of forex reserves.
• Currency levels: Level of INR will determine how the central bank reacts to the situation on the global crisis etc.
2. Brief Background of SPonSorS, Board of truSteeS and aSSet management comPany
a. Sponsor
HSBC Mutual Fund is sponsored by HSBC Securities and Capital Markets (India) Private Limited (HSCI). The Sponsor is the Settler of the Mutual Fund Trust. The Sponsor has entrusted a sum of Rs. 1,00,000 (Rupees One Lakh only) to the Trustee as the initial contribution towards the corpus of the Mutual Fund.
HSCI offers integrated investment banking services, securities and corporate finance & advisory. HSCI is a member of the Bombay Stock Exchange Limited and National Stock Exchange (capital and derivative market segments). HSCI holds 100% of the paid up equity share capital of HSBC Asset Management (India) Private Limited.
b. HSBC Mutual Fund
HSBC Mutual Fund (“the Mutual Fund” or “the Fund”) has been constituted as a Trust in accordance with the provisions of the Indian Trusts Act, 1882 (2 of 1882) vide a Trust Deed dated February 7, 2002 with HSBC Securities and Capital Markets (India) Private Limited, as the Sponsor and the Board of Individual Trustees. The Trustee has entered into an Investment Management Agreement dated February 7, 2002 with HSBC Asset Management (India) Private Limited (AMC) to function as the Investment Manager for all the schemes of the Fund. The Fund was registered with SEBI vide registration number MF/046/02/5 dated May 27, 2002.
The Trust has been formed for the purpose of pooling of capital from the public for collective investment in securities for the purpose of providing facilities for participation by persons as beneficiaries in such investments and in the profits/income arising therefrom.
c. Board of Trustees (the Trustees)
The Board of Trustees is the exclusive owner of the Trust Fund and holds the same in trust for the benefit of the unit holders. The Trustees have been discharging their duties and carrying out the responsibilities as provided in the SEBI (Mutual Funds) Regulations, 1996 and the Trust Deed. The Trustees seek to ensure that the Fund and the schemes floated there under are managed by the AMC in accordance with the Trust Deed, the said Regulations, directions and guidelines issued by the SEBI, the Stock Exchanges, the Association of Mutual Funds in India and other regulatory agencies.
d. Asset Management Company (the AMC)
HSBC Asset Management (India) Private Limited (the Investment Manager or the AMC) is a private limited company incorporated under the Companies Act, 1956 on December 12, 2001 having its Registered Office at 16, V. N. Road, Fort, Mumbai 400 001. HSBC Asset Management (India) Private Limited has been appointed as the Asset Management Company of HSBC Mutual Fund by the Trustee vide Investment Management Agreement (IMA) dated February 7, 2002 and executed between the Trustees and the AMC. SEBI approved the AMC to act as the Investment Manager of the Fund vide its letter No. MFD/BC/163/2002 dated May 27, 2002. The paid-up equity share capital of the AMC is Rs. 61.59 crores. The AMC is registered as a Portfolio Manager under the SEBI (Portfolio Managers) Regulations, 1993 vide
Trustees’ ReportFor the year ended March 31, 2018 (Contd...)

8
registration no. INP000001322. The AMC also offers non-binding Advisory services to offshore funds under the mutual fund license.
HSBC Securities and Capital Markets (India) Private Limited holds 100% of the paid up equity share capital of the AMC.
3. inveStment oBjective of the SchemeS The investment objective of the respective schemes has been provided above under the heading “Scheme
Performance, Future Outlook and Operation of the Scheme” (Refer Section 1).
4. Significant accounting PolicieS The Significant Accounting Policies form part of the Notes to the Accounts annexed to the Balance Sheet
of the Schemes in the Full Annual Report. The accounting policies are in accordance with Securities Exchange Board of India (Mutual Funds) Regulations 1996.
5. unclaimed dividendS & redemPtionS Summary of number of investors & corresponding amount Scheme-wise as on March 31, 2018.
SchemeUnclaimed Dividend Unclaimed Redemption
Amount (Rs.) No. of Investors
Amount (Rs.) No. of Investors
HSBC Fixed Term Series 89 – – 668,840.00 1
6. inveStor ServiceSThe number of official points of acceptance of transactions is 205 locations. In addition to the offices of the Registrar & Transfer agents, the AMC has Investor Service Centres in 9 locations at its own offices - namely Mumbai, New Delhi, Kolkata, Bangaluru, Pune, Ahmedabad, Hyderabad, Chandigarh and Chennai. With a view to enhance customer convenience, the AMC has the facility of priority based servicing to key distributors through the enhancement of the Interactive Voice Reponses. The AMC has a single Toll Free number which can be dialed from anywhere in India. The call centre service is being managed by the Registrar and Transfer Agents.
On the distribution front, the number of empanelled distributors was 460 as on March 31, 2018. During the year, the AMC initiated tie-ups for online distribution of the Mutual Fund’s schemes with several channel partners taking the total number of such tie-ups to 42.
7. detailS of inveStor grievance redreSSalThe details of the redressal of investor complaints received against HSBC Mutual Fund during April 2017 - March 2018 are as follows:
2017-2018
Com- plaint Code
Type of complaint (a) No. of complaints pending at
the beginning of the year
(b) No. of complaints
received during
the year
Action on (a) and (b)
Resolved Non Actiona-
ble*
Pending
Within 30
days
30 - 60 days
60 - 180 days
Beyond 180 days
0 - 3 months
3 - 6 months
6 - 9 months
9 - 12 months
I A Non receipt of Dividend on Units
0 5 4 1 0 0 0 0 0 0 0
I B Interest on delayed payment of Dividend
0 0 0 0 0 0 0 0 0 0 0
I C Non receipt ofRedemption Proceeds
1 12 12 1 0 0 0 1 0 0 0
Trustees’ ReportFor the year ended March 31, 2018 (Contd...)

9
2017-2018
Com- plaint Code
Type of complaint (a) No. of complaints pending at
the beginning of the year
(b) No. of complaints
received during
the year
Action on (a) and (b)
Resolved Non Actiona-
ble*
Pending
Within 30
days
30 - 60 days
60 - 180 days
Beyond 180 days
0 - 3 months
3 - 6 months
6 - 9 months
9 - 12 months
I D Interest on delayedp a y m e n t o f Redemption
0 1 1 0 0 0 0 0 0 0 0
II A N o n r e c e i p t o f Statement of Account / Unit Certificate
0 0 0 0 0 0 0 0 0 0 0
II B D i s c r e p a n c y i n Statement of Account
0 0 0 0 0 0 0 0 0 0 0
II C Data corrections in Investor details **
0 34 34 0 0 0 0 0 0 0 0
II D Non receipt of Annual Report /Abridged Summary
0 0 0 0 0 0 0 0 0 0 0
III A Wrong switch between Schemes
0 0 0 0 0 0 0 0 0 0 0
III B Unauthorized switch between Schemes
0 0 0 0 0 0 0 0 0 0 0
III C Deviation from Scheme attributes
0 0 0 0 0 0 0 0 0 0 0
III D Wrong or excess charges / load
0 0 0 0 0 0 0 0 0 0 0
III E Non updat ion of changes viz. address, PAN, bank details, nomination, etc.
0 6 6 0 0 0 0 0 0 0 0
IV Others 1 41 42 0 0 0 0 0 0 0 0
Total 2 99 99 2 0 0 0 0 0 0 0
Summary of Complaints for FY 2017-18
Particulars Count
Total complaints received 99
Total number of folios 140099
% of complaints against the folio 0.071%
# active folios** As per AMFI Best Practice Guidelines Circular No. 25/2011-12 for Revisions in the Guidelines on
Standardization of Complaints/Grievances Reporting Procedure. If “Others” include a type of complaint which is more than 10% of overall complaints, then such a reason should be provided separately. Hence data corrections in Investor Details is included as a separate category
* Non actionable means the complaint is incomplete / outside the scope of the mutual fund
Trustees’ ReportFor the year ended March 31, 2018 (Contd...)

10
8. inveStor education initiativeS The Fund undertook various investor education and awareness initiatives related to investments in mutual funds throughout India in English / Hindi and Regional languages via mass media. The Fund conducted 16 roadshows at various locations in India to promote various Investor Awareness related topics including Asset Allocation, SIPs, Equity Mutual Funds and Financial Planning. The Fund has a Year-long tie-up with Mutual Fund Insights Magazine that includes 3 pages of content and advertorial publication in their monthly issue. Each issue contains a story promoting SIPs to achieve one’s various investment goals. In the month of December 2017 and January 2018 investor awareness promotion was done through Outlook and Outlook Money magazines through advertorials on various Mutual Fund topics.
9. Statutory detailSa) The Sponsors are not responsible or liable for any loss resulting from the operation of the Schemes of
the Fund beyond initial contribution of Rs. 1 lakh for setting up the Fund.
b) The price and redemption value of the units, and income from them, can go up as well as down with fluctuations in the market value of its underlying investments.
c) Full Annual Report shall be disclosed on the website at www.assetmanagement.hsbc.com/in and shall be available for inspection at the Head Office of the Mutual Fund. Present and prospective unit holders can obtain copy of the Trust Deed, the full Annual Report of the Scheme(s), the Annual Report of HSBC Asset Management (India) Private Limited and the text of the relevant Scheme(s) at a price.
10. acknowledgementSThe Trustees wish to thank the Unit holders of the Schemes for their support throughout the year and also thank the Government of India, the Securities and Exchange Board of India (SEBI), the Reserve Bank of India (RBI) and the Association of Mutual Funds in India (AMFI) for the guidance provided by them. The Trustees also appreciate the services provided by the Registrar and Transfer Agent, Fund Accountant, Custodian, Bankers, Distributors and Brokers. The guidance and services provided by the Auditors and advocates and the ebullience, sincerity and dedication of the employees of HSBC Asset Management (India) Private Limited is also appreciated.
The Trustees look forward to the continued support of everyone.
For and on behalf of the Board of Trustees of HSBC Mutual Fund
Sd/-
Dilip Thakkar
Trustee
Mumbai
July 17, 2018.
Trustees’ ReportFor the year ended March 31, 2018 (Contd...)

11
Independent Auditors’ Report
To the Board of Trustees of
hSBc mutual fund – hSBc fixed term Series 94
Report on the Financial StatementsWe have audited the accompanying Financial Statements of HSBC Fixed Term Series 94 (the ‘Scheme’), which comprise the balance sheet as at 31 March 2018, the related revenue account and the cash flow statement for the year then ended, and a summary of significant accounting policies and other explanatory information, annexed thereto.
Management’s responsibility for the Financial StatementsThe Board of Trustees to the HSBC Mutual Fund (the ‘Board of Trustees’) and HSBC Asset Management (India) Private Limited (the ‘AMC’), being the investment manager to HSBC Mutual Fund (the ‘Fund’) (collectively referred as ‘Management’), are responsible for the preparation of these financial statements that give a true and fair view of the financial position and financial performance of the Scheme in accordance with the accounting policies and standards specified in the Ninth Schedule of the Securities and Exchange Board of India (Mutual Funds) Regulations, 1996, as amended (the ‘Regulations’) and the accounting principles generally accepted in India. This responsibility includes maintenance of adequate accounting records for safeguarding of the assets of the Scheme and for preventing and detecting frauds and other irregularities; selection and application of appropriate accounting policies; making judgments and estimates that are reasonable and prudent; and design, implementation and maintenance of adequate internal financial controls, that were operating effectively for ensuring the accuracy and completeness of the accounting records, relevant to the preparation and presentation of the financial statements that give a true and fair view and are free from material misstatement, whether due to fraud or error.
In preparing the financial statements, management is responsible for assessing the Scheme’s ability to continue as a going concern, disclosing, as applicable, matters related to going concern and using the going concern basis of accounting unless management either intends to liquidate the Fund or to cease operations, or has no realistic alternative but to do so.
Auditor’s responsibilityOur responsibility is to express an opinion on these financial statements based on our audit. We conducted our audit in accordance with the Standards on Auditing issued by the Institute of Chartered Accountants of India (the ‘ICAI’). Those Standards require that we comply with ethical requirements and plan and perform the audit to obtain reasonable assurance about whether the financial statements are free from material misstatement.
An audit involves performing procedures to obtain audit evidence about the amounts and disclosures in the financial statements. The procedures selected depend on the auditor’s judgment, including the assessment of the risks of material misstatement of the financial statements, whether due to fraud or error. In making those risk assessments, the auditor considers internal controls relevant to preparation and fair presentation of the financial statements, of the Scheme, in order to design audit procedures that are appropriate in the circumstances, but not for the purpose of expressing an opinion on the effectiveness of the Scheme’s internal controls. An audit also includes evaluating the appropriateness of accounting policies used and the reasonableness of the accounting estimates made by Management, as well as evaluating the overall presentation of the financial statements.
We are also responsible to conclude on the appropriateness of management’s use of the going concern basis of accounting and, based on the audit evidence obtained, whether a material uncertainty exists related to events or conditions that may cast significant doubt on the Scheme’s ability to continue as a going concern. If we conclude that a material uncertainty exists, we are required to draw attention in the auditor’s report to the related disclosures in the financial statements or, if such disclosures are inadequate, to modify the opinion. Our conclusions are based on the audit evidence obtained up to the date of the auditor’s report. However, future events or conditions may cause the Scheme to cease to continue as a going concern.
We believe that the audit evidence we have obtained is sufficient and appropriate to provide a basis for our audit opinion.

12
OpinionIn our opinion, and to the best of our information and according to the explanations given to us, the aforesaid financial statements give the information required by the Regulations in the manner so required and give a true and fair view in conformity with the accounting principles generally accepted in India:
(i) in the case of the balance sheet, of the state of affairs of the Scheme as at 31 March 2018;
(ii) in the case of the revenue account, of the net surplus for the year ended on that date; and
(iii) in the case of the cash flow statement, of the cash flows of the Scheme for the year ended on that date.
Report on other Legal and Regulatory Requirements1 As required by Regulation 55(4) to the Regulations, we report that:
(a) We have obtained all information and explanations which, to the best of our knowledge and belief, were necessary for the purposes of the audit;
(b) The balance sheet and revenue account have been prepared in accordance with the accounting policies and standards specified in the Ninth Schedule of the Regulations.
2 As required by Clause 5(ii)(2) of the Eleventh Schedule of the Regulations, we report that the balance sheet and revenue account are in agreement with the books of account of the Scheme.
3 In our opinion and on the basis of information and explanations given to us, the methods used to value non - traded securities, as at 31 March 2018, as determined by the Board of Directors of AMC, are in accordance with the Regulations and other guidelines issued by the Securities and Exchange Board of India as applicable and approved by the Board of Trustees are fair and reasonable.
For B S R & Co. LLP Chartered Accountants Firm’s Registration No: 101248W/W-100022
Sd/-
Milind Ranade Partner Membership No: 100564
Place : Mumbai Date : July 17, 2018.
Independent Auditors’ Report (Contd...)

13
To the Board of Trustees of
hSBc mutual fund – hSBc fixed term Series 96
Report on the Financial StatementsWe have audited the accompanying Financial Statements of HSBC Fixed Term Series 96 (the ‘Scheme’), which comprise the balance sheet as at 31 March 2018, the related revenue account and the cash flow statement for the year then ended, and a summary of significant accounting policies and other explanatory information, annexed thereto.
Management’s responsibility for the Financial StatementsThe Board of Trustees to the HSBC Mutual Fund (the ‘Board of Trustees’) and HSBC Asset Management (India) Private Limited (the ‘AMC’), being the investment manager to HSBC Mutual Fund (the ‘Fund’) (collectively referred as ‘Management’), are responsible for the preparation of these financial statements that give a true and fair view of the financial position and financial performance of the Scheme in accordance with the accounting policies and standards specified in the Ninth Schedule of the Securities and Exchange Board of India (Mutual Funds) Regulations, 1996, as amended (the ‘Regulations’) and the accounting principles generally accepted in India. This responsibility includes maintenance of adequate accounting records for safeguarding of the assets of the Scheme and for preventing and detecting frauds and other irregularities; selection and application of appropriate accounting policies; making judgments and estimates that are reasonable and prudent; and design, implementation and maintenance of adequate internal financial controls, that were operating effectively for ensuring the accuracy and completeness of the accounting records, relevant to the preparation and presentation of the financial statements that give a true and fair view and are free from material misstatement, whether due to fraud or error.
In preparing the financial statements, management is responsible for assessing the Scheme’s ability to continue as a going concern, disclosing, as applicable, matters related to going concern and using the going concern basis of accounting unless management either intends to liquidate the Fund or to cease operations, or has no realistic alternative but to do so.
Auditor’s responsibilityOur responsibility is to express an opinion on these financial statements based on our audit. We conducted our audit in accordance with the Standards on Auditing issued by the Institute of Chartered Accountants of India (the ‘ICAI’). Those Standards require that we comply with ethical requirements and plan and perform the audit to obtain reasonable assurance about whether the financial statements are free from material misstatement.
An audit involves performing procedures to obtain audit evidence about the amounts and disclosures in the financial statements. The procedures selected depend on the auditor’s judgment, including the assessment of the risks of material misstatement of the financial statements, whether due to fraud or error. In making those risk assessments, the auditor considers internal controls relevant to preparation and fair presentation of the financial statements, of the Scheme, in order to design audit procedures that are appropriate in the circumstances, but not for the purpose of expressing an opinion on the effectiveness of the Scheme’s internal controls. An audit also includes evaluating the appropriateness of accounting policies used and the reasonableness of the accounting estimates made by Management, as well as evaluating the overall presentation of the financial statements.
We are also responsible to conclude on the appropriateness of management’s use of the going concern basis of accounting and, based on the audit evidence obtained, whether a material uncertainty exists related to events or conditions that may cast significant doubt on the Scheme’s ability to continue as a going concern. If we conclude that a material uncertainty exists, we are required to draw attention in the auditor’s report to the related disclosures in the financial statements or, if such disclosures are inadequate, to modify the opinion. Our conclusions are based on the audit evidence obtained up to the date of the auditor’s report. However, future events or conditions may cause the Scheme to cease to continue as a going concern.
We believe that the audit evidence we have obtained is sufficient and appropriate to provide a basis for our audit opinion.
Independent Auditors’ Report (Contd...)

14
OpinionIn our opinion, and to the best of our information and according to the explanations given to us, the aforesaid financial statements give the information required by the Regulations in the manner so required and give a true and fair view in conformity with the accounting principles generally accepted in India:
(i) in the case of the balance sheet, of the state of affairs of the Scheme as at 31 March 2018;
(ii) in the case of the revenue account, of the net surplus for the year ended on that date; and
(iii) in the case of the cash flow statement, of the cash flows of the Scheme for the year ended on that date.
Report on other Legal and Regulatory Requirements1 As required by Regulation 55(4) to the Regulations, we report that:
(a) We have obtained all information and explanations which, to the best of our knowledge and belief, were necessary for the purposes of the audit;
(b) The balance sheet and revenue account have been prepared in accordance with the accounting policies and standards specified in the Ninth Schedule of the Regulations.
2 As required by Clause 5(ii)(2) of the Eleventh Schedule of the Regulations, we report that the balance sheet and revenue account are in agreement with the books of account of the Scheme.
3 In our opinion and on the basis of information and explanations given to us, the methods used to value non - traded securities, as at 31 March 2018, as determined by the Board of Directors of AMC, are in accordance with the Regulations and other guidelines issued by the Securities and Exchange Board of India as applicable and approved by the Board of Trustees are fair and reasonable.
For B S R & Co. LLP Chartered Accountants Firm’s Registration No: 101248W/W-100022
Sd/-
Milind Ranade Partner Membership No: 100564
Place : Mumbai Date : July 17, 2018.
Independent Auditors’ Report (Contd...)

15
To the Board of Trustees of
hSBc mutual fund – hSBc fixed term Series 98
Report on the Financial StatementsWe have audited the accompanying Financial Statements of HSBC Fixed Term Series 98 (the ‘Scheme’), which comprise the balance sheet as at 31 March 2018, the related revenue account and the cash flow statement for the year then ended, and a summary of significant accounting policies and other explanatory information, annexed thereto.
Management’s responsibility for the Financial StatementsThe Board of Trustees to the HSBC Mutual Fund (the ‘Board of Trustees’) and HSBC Asset Management (India) Private Limited (the ‘AMC’), being the investment manager to HSBC Mutual Fund (the ‘Fund’) (collectively referred as ‘Management’), are responsible for the preparation of these financial statements that give a true and fair view of the financial position and financial performance of the Scheme in accordance with the accounting policies and standards specified in the Ninth Schedule of the Securities and Exchange Board of India (Mutual Funds) Regulations, 1996, as amended (the ‘Regulations’) and the accounting principles generally accepted in India. This responsibility includes maintenance of adequate accounting records for safeguarding of the assets of the Scheme and for preventing and detecting frauds and other irregularities; selection and application of appropriate accounting policies; making judgments and estimates that are reasonable and prudent; and design, implementation and maintenance of adequate internal financial controls, that were operating effectively for ensuring the accuracy and completeness of the accounting records, relevant to the preparation and presentation of the financial statements that give a true and fair view and are free from material misstatement, whether due to fraud or error.
In preparing the financial statements, management is responsible for assessing the Scheme’s ability to continue as a going concern, disclosing, as applicable, matters related to going concern and using the going concern basis of accounting unless management either intends to liquidate the Fund or to cease operations, or has no realistic alternative but to do so.
Auditor’s responsibilityOur responsibility is to express an opinion on these financial statements based on our audit. We conducted our audit in accordance with the Standards on Auditing issued by the Institute of Chartered Accountants of India (the ‘ICAI’). Those Standards require that we comply with ethical requirements and plan and perform the audit to obtain reasonable assurance about whether the financial statements are free from material misstatement.
An audit involves performing procedures to obtain audit evidence about the amounts and disclosures in the financial statements. The procedures selected depend on the auditor’s judgment, including the assessment of the risks of material misstatement of the financial statements, whether due to fraud or error. In making those risk assessments, the auditor considers internal controls relevant to preparation and fair presentation of the financial statements, of the Scheme, in order to design audit procedures that are appropriate in the circumstances, but not for the purpose of expressing an opinion on the effectiveness of the Scheme’s internal controls. An audit also includes evaluating the appropriateness of accounting policies used and the reasonableness of the accounting estimates made by Management, as well as evaluating the overall presentation of the financial statements.
We are also responsible to conclude on the appropriateness of management’s use of the going concern basis of accounting and, based on the audit evidence obtained, whether a material uncertainty exists related to events or conditions that may cast significant doubt on the Scheme’s ability to continue as a going concern. If we conclude that a material uncertainty exists, we are required to draw attention in the auditor’s report to the related disclosures in the financial statements or, if such disclosures are inadequate, to modify the opinion. Our conclusions are based on the audit evidence obtained up to the date of the auditor’s report. However, future events or conditions may cause the Scheme to cease to continue as a going concern.
We believe that the audit evidence we have obtained is sufficient and appropriate to provide a basis for our audit opinion.
Independent Auditors’ Report (Contd...)

16
OpinionIn our opinion, and to the best of our information and according to the explanations given to us, the aforesaid financial statements give the information required by the Regulations in the manner so required and give a true and fair view in conformity with the accounting principles generally accepted in India:
(i) in the case of the balance sheet, of the state of affairs of the Scheme as at 31 March 2018;
(ii) in the case of the revenue account, of the net surplus for the year ended on that date; and
(iii) in the case of the cash flow statement, of the cash flows of the Scheme for the year ended on that date.
Report on other Legal and Regulatory Requirements1 As required by Regulation 55(4) to the Regulations, we report that:
(a) We have obtained all information and explanations which, to the best of our knowledge and belief, were necessary for the purposes of the audit;
(b) The balance sheet and revenue account have been prepared in accordance with the accounting policies and standards specified in the Ninth Schedule of the Regulations.
2 As required by Clause 5(ii)(2) of the Eleventh Schedule of the Regulations, we report that the balance sheet and revenue account are in agreement with the books of account of the Scheme.
3 In our opinion and on the basis of information and explanations given to us, the methods used to value non - traded securities, as at 31 March 2018, as determined by the Board of Directors of AMC, are in accordance with the Regulations and other guidelines issued by the Securities and Exchange Board of India as applicable and approved by the Board of Trustees are fair and reasonable.
For B S R & Co. LLP Chartered Accountants Firm’s Registration No: 101248W/W-100022
Sd/-
Milind Ranade Partner Membership No: 100564
Place : Mumbai Date : July 17, 2018.
Independent Auditors’ Report (Contd...)

17
Independent Auditors’ Report (Contd...)
To the Board of Trustees of
hSBc mutual fund – hSBc fixed term Series 125
Report on the Financial StatementsWe have audited the accompanying Financial Statements of HSBC Fixed Term Series 125 (the ‘Scheme’), which comprise the balance sheet as at 31 March 2018, the related revenue account and the cash flow statement for the year then ended, and a summary of significant accounting policies and other explanatory information, annexed thereto.
Management’s responsibility for the Financial StatementsThe Board of Trustees to the HSBC Mutual Fund (the ‘Board of Trustees’) and HSBC Asset Management (India) Private Limited (the ‘AMC’), being the investment manager to HSBC Mutual Fund (the ‘Fund’) (collectively referred as ‘Management’), are responsible for the preparation of these financial statements that give a true and fair view of the financial position and financial performance of the Scheme in accordance with the accounting policies and standards specified in the Ninth Schedule of the Securities and Exchange Board of India (Mutual Funds) Regulations, 1996, as amended (the ‘Regulations’) and the accounting principles generally accepted in India. This responsibility includes maintenance of adequate accounting records for safeguarding of the assets of the Scheme and for preventing and detecting frauds and other irregularities; selection and application of appropriate accounting policies; making judgments and estimates that are reasonable and prudent; and design, implementation and maintenance of adequate internal financial controls, that were operating effectively for ensuring the accuracy and completeness of the accounting records, relevant to the preparation and presentation of the financial statements that give a true and fair view and are free from material misstatement, whether due to fraud or error.
In preparing the financial statements, management is responsible for assessing the Scheme’s ability to continue as a going concern, disclosing, as applicable, matters related to going concern and using the going concern basis of accounting unless management either intends to liquidate the Fund or to cease operations, or has no realistic alternative but to do so.
Auditor’s responsibilityOur responsibility is to express an opinion on these financial statements based on our audit. We conducted our audit in accordance with the Standards on Auditing issued by the Institute of Chartered Accountants of India (the ‘ICAI’). Those Standards require that we comply with ethical requirements and plan and perform the audit to obtain reasonable assurance about whether the financial statements are free from material misstatement.
An audit involves performing procedures to obtain audit evidence about the amounts and disclosures in the financial statements. The procedures selected depend on the auditor’s judgment, including the assessment of the risks of material misstatement of the financial statements, whether due to fraud or error. In making those risk assessments, the auditor considers internal controls relevant to preparation and fair presentation of the financial statements, of the Scheme, in order to design audit procedures that are appropriate in the circumstances, but not for the purpose of expressing an opinion on the effectiveness of the Scheme’s internal controls. An audit also includes evaluating the appropriateness of accounting policies used and the reasonableness of the accounting estimates made by Management, as well as evaluating the overall presentation of the financial statements.
We are also responsible to conclude on the appropriateness of management’s use of the going concern basis of accounting and, based on the audit evidence obtained, whether a material uncertainty exists related to events or conditions that may cast significant doubt on the Scheme’s ability to continue as a going concern. If we conclude that a material uncertainty exists, we are required to draw attention in the auditor’s report to the related disclosures in the financial statements or, if such disclosures are inadequate, to modify the opinion. Our conclusions are based on the audit evidence obtained up to the date of the auditor’s report. However, future events or conditions may cause the Scheme to cease to continue as a going concern.
We believe that the audit evidence we have obtained is sufficient and appropriate to provide a basis for our audit opinion.
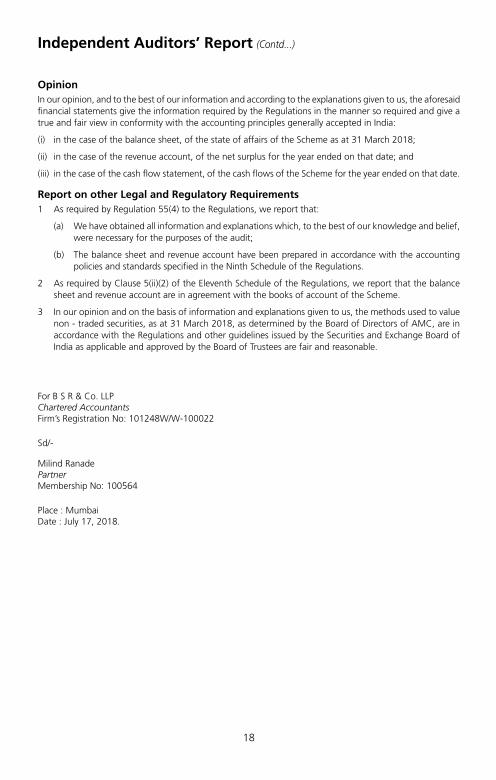
18
Independent Auditors’ Report (Contd...)
OpinionIn our opinion, and to the best of our information and according to the explanations given to us, the aforesaid financial statements give the information required by the Regulations in the manner so required and give a true and fair view in conformity with the accounting principles generally accepted in India:
(i) in the case of the balance sheet, of the state of affairs of the Scheme as at 31 March 2018;
(ii) in the case of the revenue account, of the net surplus for the year ended on that date; and
(iii) in the case of the cash flow statement, of the cash flows of the Scheme for the year ended on that date.
Report on other Legal and Regulatory Requirements1 As required by Regulation 55(4) to the Regulations, we report that:
(a) We have obtained all information and explanations which, to the best of our knowledge and belief, were necessary for the purposes of the audit;
(b) The balance sheet and revenue account have been prepared in accordance with the accounting policies and standards specified in the Ninth Schedule of the Regulations.
2 As required by Clause 5(ii)(2) of the Eleventh Schedule of the Regulations, we report that the balance sheet and revenue account are in agreement with the books of account of the Scheme.
3 In our opinion and on the basis of information and explanations given to us, the methods used to value non - traded securities, as at 31 March 2018, as determined by the Board of Directors of AMC, are in accordance with the Regulations and other guidelines issued by the Securities and Exchange Board of India as applicable and approved by the Board of Trustees are fair and reasonable.
For B S R & Co. LLP Chartered Accountants Firm’s Registration No: 101248W/W-100022
Sd/-
Milind Ranade Partner Membership No: 100564
Place : Mumbai Date : July 17, 2018.

19
Independent Auditors’ Report (Contd...)
To the Board of Trustees of
hSBc mutual fund - hSBc fixed term Series 126
Report on the Financial StatementsWe have audited the accompanying Financial Statements of HSBC Fixed Term Series 126 (the ‘Scheme’), which comprise the balance sheet as at 31 March 2018, the related revenue account and the cash flow statement for the year then ended, and a summary of significant accounting policies and other explanatory information, annexed thereto.
Management’s responsibility for the Financial StatementsThe Board of Trustees to the HSBC Mutual Fund (the ‘Board of Trustees’) and HSBC Asset Management (India) Private Limited (the ‘AMC’), being the investment manager to HSBC Mutual Fund (the ‘Fund’) (collectively referred as ‘Management’), are responsible for the preparation of these financial statements that give a true and fair view of the financial position and financial performance of the Scheme in accordance with the accounting policies and standards specified in the Ninth Schedule of the Securities and Exchange Board of India (Mutual Funds) Regulations, 1996, as amended (the ‘Regulations’) and the accounting principles generally accepted in India. This responsibility includes maintenance of adequate accounting records for safeguarding of the assets of the Scheme and for preventing and detecting frauds and other irregularities; selection and application of appropriate accounting policies; making judgments and estimates that are reasonable and prudent; and design, implementation and maintenance of adequate internal financial controls, that were operating effectively for ensuring the accuracy and completeness of the accounting records, relevant to the preparation and presentation of the financial statements that give a true and fair view and are free from material misstatement, whether due to fraud or error.
In preparing the financial statements, management is responsible for assessing the Scheme’s ability to continue as a going concern, disclosing, as applicable, matters related to going concern and using the going concern basis of accounting unless management either intends to liquidate the Fund or to cease operations, or has no realistic alternative but to do so.
Auditor’s responsibilityOur responsibility is to express an opinion on these financial statements based on our audit. We conducted our audit in accordance with the Standards on Auditing issued by the Institute of Chartered Accountants of India (the ‘ICAI’). Those Standards require that we comply with ethical requirements and plan and perform the audit to obtain reasonable assurance about whether the financial statements are free from material misstatement.
An audit involves performing procedures to obtain audit evidence about the amounts and disclosures in the financial statements. The procedures selected depend on the auditor’s judgment, including the assessment of the risks of material misstatement of the financial statements, whether due to fraud or error. In making those risk assessments, the auditor considers internal controls relevant to preparation and fair presentation of the financial statements, of the Scheme, in order to design audit procedures that are appropriate in the circumstances, but not for the purpose of expressing an opinion on the effectiveness of the Scheme’s internal controls. An audit also includes evaluating the appropriateness of accounting policies used and the reasonableness of the accounting estimates made by Management, as well as evaluating the overall presentation of the financial statements.
We are also responsible to conclude on the appropriateness of management’s use of the going concern basis of accounting and, based on the audit evidence obtained, whether a material uncertainty exists related to events or conditions that may cast significant doubt on the Scheme’s ability to continue as a going concern. If we conclude that a material uncertainty exists, we are required to draw attention in the auditor’s report to the related disclosures in the financial statements or, if such disclosures are inadequate, to modify the opinion. Our conclusions are based on the audit evidence obtained up to the date of the auditor’s report. However, future events or conditions may cause the Scheme to cease to continue as a going concern.
We believe that the audit evidence we have obtained is sufficient and appropriate to provide a basis for our audit opinion.

20
Independent Auditors’ Report (Contd...)
OpinionIn our opinion, and to the best of our information and according to the explanations given to us, the aforesaid financial statements give the information required by the Regulations in the manner so required and give a true and fair view in conformity with the accounting principles generally accepted in India:
(i) in the case of the balance sheet, of the state of affairs of the Scheme as at 31 March 2018;
(ii) in the case of the revenue account, of the net surplus for the year ended on that date; and
(iii) in the case of the cash flow statement, of the cash flows of the Scheme for the year ended on that date.
Report on other Legal and Regulatory Requirements1 As required by Regulation 55(4) to the Regulations, we report that:
(a) We have obtained all information and explanations which, to the best of our knowledge and belief, were necessary for the purposes of the audit;
(b) The balance sheet and revenue account have been prepared in accordance with the accounting policies and standards specified in the Ninth Schedule of the Regulations.
2 As required by Clause 5(ii)(2) of the Eleventh Schedule of the Regulations, we report that the balance sheet and revenue account are in agreement with the books of account of the Scheme.
3 In our opinion and on the basis of information and explanations given to us, the methods used to value non - traded securities, as at 31 March 2018, as determined by the Board of Directors of AMC, are in accordance with the Regulations and other guidelines issued by the Securities and Exchange Board of India as applicable and approved by the Board of Trustees are fair and reasonable.
For B S R & Co. LLP Chartered Accountants Firm’s Registration No: 101248W/W-100022
Sd/-
Milind Ranade Partner Membership No: 100564
Place : Mumbai Date : July 17, 2018.

21
Independent Auditors’ Report (Contd...)
To the Board of Trustees of
hSBc mutual fund - hSBc fixed term Series 128
Report on the Financial StatementsWe have audited the accompanying Financial Statements of HSBC Fixed Term Series 128 (the ‘Scheme’), which comprise the balance sheet as at 31 March 2018, the related revenue account and the cash flow statement for the year then ended, and a summary of significant accounting policies and other explanatory information, annexed thereto.
Management’s responsibility for the Financial StatementsThe Board of Trustees to the HSBC Mutual Fund (the ‘Board of Trustees’) and HSBC Asset Management (India) Private Limited (the ‘AMC’), being the investment manager to HSBC Mutual Fund (the ‘Fund’) (collectively referred as ‘Management’), are responsible for the preparation of these financial statements that give a true and fair view of the financial position and financial performance of the Scheme in accordance with the accounting policies and standards specified in the Ninth Schedule of the Securities and Exchange Board of India (Mutual Funds) Regulations, 1996, as amended (the ‘Regulations’) and the accounting principles generally accepted in India. This responsibility includes maintenance of adequate accounting records for safeguarding of the assets of the Scheme and for preventing and detecting frauds and other irregularities; selection and application of appropriate accounting policies; making judgments and estimates that are reasonable and prudent; and design, implementation and maintenance of adequate internal financial controls, that were operating effectively for ensuring the accuracy and completeness of the accounting records, relevant to the preparation and presentation of the financial statements that give a true and fair view and are free from material misstatement, whether due to fraud or error.
In preparing the financial statements, management is responsible for assessing the Scheme’s ability to continue as a going concern, disclosing, as applicable, matters related to going concern and using the going concern basis of accounting unless management either intends to liquidate the Fund or to cease operations, or has no realistic alternative but to do so.
Auditor’s responsibilityOur responsibility is to express an opinion on these financial statements based on our audit. We conducted our audit in accordance with the Standards on Auditing issued by the Institute of Chartered Accountants of India (the ‘ICAI’). Those Standards require that we comply with ethical requirements and plan and perform the audit to obtain reasonable assurance about whether the financial statements are free from material misstatement.
An audit involves performing procedures to obtain audit evidence about the amounts and disclosures in the financial statements. The procedures selected depend on the auditor’s judgment, including the assessment of the risks of material misstatement of the financial statements, whether due to fraud or error. In making those risk assessments, the auditor considers internal controls relevant to preparation and fair presentation of the financial statements, of the Scheme, in order to design audit procedures that are appropriate in the circumstances, but not for the purpose of expressing an opinion on the effectiveness of the Scheme’s internal controls. An audit also includes evaluating the appropriateness of accounting policies used and the reasonableness of the accounting estimates made by Management, as well as evaluating the overall presentation of the financial statements.
We are also responsible to conclude on the appropriateness of management’s use of the going concern basis of accounting and, based on the audit evidence obtained, whether a material uncertainty exists related to events or conditions that may cast significant doubt on the Scheme’s ability to continue as a going concern. If we conclude that a material uncertainty exists, we are required to draw attention in the auditor’s report to the related disclosures in the financial statements or, if such disclosures are inadequate, to modify the opinion. Our conclusions are based on the audit evidence obtained up to the date of the auditor’s report. However, future events or conditions may cause the Scheme to cease to continue as a going concern.
We believe that the audit evidence we have obtained is sufficient and appropriate to provide a basis for our audit opinion.

22
OpinionIn our opinion, and to the best of our information and according to the explanations given to us, the aforesaid financial statements give the information required by the Regulations in the manner so required and give a true and fair view in conformity with the accounting principles generally accepted in India:
(i) in the case of the balance sheet, of the state of affairs of the Scheme as at 31 March 2018;
(ii) in the case of the revenue account, of the net surplus for the year ended on that date; and
(iii) in the case of the cash flow statement, of the cash flows of the Scheme for the year ended on that date.
Report on other Legal and Regulatory Requirements1 As required by Regulation 55(4) to the Regulations, we report that:
(a) We have obtained all information and explanations which, to the best of our knowledge and belief, were necessary for the purposes of the audit;
(b) The balance sheet and revenue account have been prepared in accordance with the accounting policies and standards specified in the Ninth Schedule of the Regulations.
2 As required by Clause 5(ii)(2) of the Eleventh Schedule of the Regulations, we report that the balance sheet and revenue account are in agreement with the books of account of the Scheme.
3 In our opinion and on the basis of information and explanations given to us, the methods used to value non - traded securities, as at 31 March 2018, as determined by the Board of Directors of AMC, are in accordance with the Regulations and other guidelines issued by the Securities and Exchange Board of India as applicable and approved by the Board of Trustees are fair and reasonable.
For B S R & Co. LLP Chartered Accountants Firm’s Registration No: 101248W/W-100022
Sd/-
Milind Ranade Partner Membership No: 100564
Place : Mumbai Date : July 17, 2018.
Independent Auditors’ Report (Contd...)

23
Independent Auditors’ Report (Contd...)
To the Board of Trustees of
hSBc mutual fund – hSBc fixed term Series 129
Report on the Financial StatementsWe have audited the accompanying Financial Statements of HSBC Fixed Term Series 129 (the ‘Scheme’), which comprise the balance sheet as at 31 March 2018, the related revenue account and the cash flow statement for the year then ended, and a summary of significant accounting policies and other explanatory information, annexed thereto.
Management’s responsibility for the Financial StatementsThe Board of Trustees to the HSBC Mutual Fund (the ‘Board of Trustees’) and HSBC Asset Management (India) Private Limited (the ‘AMC’), being the investment manager to HSBC Mutual Fund (the ‘Fund’) (collectively referred as ‘Management’), are responsible for the preparation of these financial statements that give a true and fair view of the financial position and financial performance of the Scheme in accordance with the accounting policies and standards specified in the Ninth Schedule of the Securities and Exchange Board of India (Mutual Funds) Regulations, 1996, as amended (the ‘Regulations’) and the accounting principles generally accepted in India. This responsibility includes maintenance of adequate accounting records for safeguarding of the assets of the Scheme and for preventing and detecting frauds and other irregularities; selection and application of appropriate accounting policies; making judgments and estimates that are reasonable and prudent; and design, implementation and maintenance of adequate internal financial controls, that were operating effectively for ensuring the accuracy and completeness of the accounting records, relevant to the preparation and presentation of the financial statements that give a true and fair view and are free from material misstatement, whether due to fraud or error.
In preparing the financial statements, management is responsible for assessing the Scheme’s ability to continue as a going concern, disclosing, as applicable, matters related to going concern and using the going concern basis of accounting unless management either intends to liquidate the Fund or to cease operations, or has no realistic alternative but to do so.
Auditor’s responsibilityOur responsibility is to express an opinion on these financial statements based on our audit. We conducted our audit in accordance with the Standards on Auditing issued by the Institute of Chartered Accountants of India (the ‘ICAI’). Those Standards require that we comply with ethical requirements and plan and perform the audit to obtain reasonable assurance about whether the financial statements are free from material misstatement.
An audit involves performing procedures to obtain audit evidence about the amounts and disclosures in the financial statements. The procedures selected depend on the auditor’s judgment, including the assessment of the risks of material misstatement of the financial statements, whether due to fraud or error. In making those risk assessments, the auditor considers internal controls relevant to preparation and fair presentation of the financial statements, of the Scheme, in order to design audit procedures that are appropriate in the circumstances, but not for the purpose of expressing an opinion on the effectiveness of the Scheme’s internal controls. An audit also includes evaluating the appropriateness of accounting policies used and the reasonableness of the accounting estimates made by Management, as well as evaluating the overall presentation of the financial statements.
We are also responsible to conclude on the appropriateness of management’s use of the going concern basis of accounting and, based on the audit evidence obtained, whether a material uncertainty exists related to events or conditions that may cast significant doubt on the Scheme’s ability to continue as a going concern. If we conclude that a material uncertainty exists, we are required to draw attention in the auditor’s report to the related disclosures in the financial statements or, if such disclosures are inadequate, to modify the opinion. Our conclusions are based on the audit evidence obtained up to the date of the auditor’s report. However, future events or conditions may cause the Scheme to cease to continue as a going concern.
We believe that the audit evidence we have obtained is sufficient and appropriate to provide a basis for our audit opinion.

24
OpinionIn our opinion, and to the best of our information and according to the explanations given to us, the aforesaid financial statements give the information required by the Regulations in the manner so required and give a true and fair view in conformity with the accounting principles generally accepted in India:
(i) in the case of the balance sheet, of the state of affairs of the Scheme as at 31 March 2018;
(ii) in the case of the revenue account, of the net surplus for the year ended on that date; and
(iii) in the case of the cash flow statement, of the cash flows of the Scheme for the year ended on that date.
Report on other Legal and Regulatory Requirements1 As required by Regulation 55(4) to the Regulations, we report that:
(a) We have obtained all information and explanations which, to the best of our knowledge and belief, were necessary for the purposes of the audit;
(b) The balance sheet and revenue account have been prepared in accordance with the accounting policies and standards specified in the Ninth Schedule of the Regulations.
2 As required by Clause 5(ii)(2) of the Eleventh Schedule of the Regulations, we report that the balance sheet and revenue account are in agreement with the books of account of the Scheme.
3 In our opinion and on the basis of information and explanations given to us, the methods used to value non - traded securities, as at 31 March 2018, as determined by the Board of Directors of AMC, are in accordance with the Regulations and other guidelines issued by the Securities and Exchange Board of India as applicable and approved by the Board of Trustees are fair and reasonable.
For B S R & Co. LLP Chartered Accountants Firm’s Registration No: 101248W/W-100022
Sd/-
Milind Ranade Partner Membership No: 100564
Place : Mumbai Date : July 17, 2018.
Independent Auditors’ Report (Contd...)

25
Independent Auditors’ Report (Contd...)
To the Board of Trustees of
hSBc mutual fund – hSBc fixed term Series 130
Report on the Financial StatementsWe have audited the accompanying Financial Statements of HSBC Fixed Term Series 130 (the ‘Scheme’), which comprise the balance sheet as at 31 March 2018, the related revenue account and the cash flow statement for the year then ended, and a summary of significant accounting policies and other explanatory information, annexed thereto.
Management’s responsibility for the Financial StatementsThe Board of Trustees to the HSBC Mutual Fund (the ‘Board of Trustees’) and HSBC Asset Management (India) Private Limited (the ‘AMC’), being the investment manager to HSBC Mutual Fund (the ‘Fund’) (collectively referred as ‘Management’), are responsible for the preparation of these financial statements that give a true and fair view of the financial position and financial performance of the Scheme in accordance with the accounting policies and standards specified in the Ninth Schedule of the Securities and Exchange Board of India (Mutual Funds) Regulations, 1996, as amended (the ‘Regulations’) and the accounting principles generally accepted in India. This responsibility includes maintenance of adequate accounting records for safeguarding of the assets of the Scheme and for preventing and detecting frauds and other irregularities; selection and application of appropriate accounting policies; making judgments and estimates that are reasonable and prudent; and design, implementation and maintenance of adequate internal financial controls, that were operating effectively for ensuring the accuracy and completeness of the accounting records, relevant to the preparation and presentation of the financial statements that give a true and fair view and are free from material misstatement, whether due to fraud or error.
In preparing the financial statements, management is responsible for assessing the Scheme’s ability to continue as a going concern, disclosing, as applicable, matters related to going concern and using the going concern basis of accounting unless management either intends to liquidate the Fund or to cease operations, or has no realistic alternative but to do so.
Auditor’s responsibilityOur responsibility is to express an opinion on these financial statements based on our audit. We conducted our audit in accordance with the Standards on Auditing issued by the Institute of Chartered Accountants of India (the ‘ICAI’). Those Standards require that we comply with ethical requirements and plan and perform the audit to obtain reasonable assurance about whether the financial statements are free from material misstatement.
An audit involves performing procedures to obtain audit evidence about the amounts and disclosures in the financial statements. The procedures selected depend on the auditor’s judgment, including the assessment of the risks of material misstatement of the financial statements, whether due to fraud or error. In making those risk assessments, the auditor considers internal controls relevant to preparation and fair presentation of the financial statements, of the Scheme, in order to design audit procedures that are appropriate in the circumstances, but not for the purpose of expressing an opinion on the effectiveness of the Scheme’s internal controls. An audit also includes evaluating the appropriateness of accounting policies used and the reasonableness of the accounting estimates made by Management, as well as evaluating the overall presentation of the financial statements.
We are also responsible to conclude on the appropriateness of management’s use of the going concern basis of accounting and, based on the audit evidence obtained, whether a material uncertainty exists related to events or conditions that may cast significant doubt on the Scheme’s ability to continue as a going concern. If we conclude that a material uncertainty exists, we are required to draw attention in the auditor’s report to the related disclosures in the financial statements or, if such disclosures are inadequate, to modify the opinion. Our conclusions are based on the audit evidence obtained up to the date of the auditor’s report. However, future events or conditions may cause the Scheme to cease to continue as a going concern.
We believe that the audit evidence we have obtained is sufficient and appropriate to provide a basis for our audit opinion.
26
Independent Auditors’ Report (Contd...)
OpinionIn our opinion, and to the best of our information and according to the explanations given to us, the aforesaid financial statements give the information required by the Regulations in the manner so required and give a true and fair view in conformity with the accounting principles generally accepted in India:
(i) in the case of the balance sheet, of the state of affairs of the Scheme as at 31 March 2018;
(ii) in the case of the revenue account, of the net surplus for the year ended on that date; and
(iii) in the case of the cash flow statement, of the cash flows of the Scheme for the year ended on that date.
Report on other Legal and Regulatory Requirements1 As required by Regulation 55(4) to the Regulations, we report that:
(a) We have obtained all information and explanations which, to the best of our knowledge and belief, were necessary for the purposes of the audit;
(b) The balance sheet and revenue account have been prepared in accordance with the accounting policies and standards specified in the Ninth Schedule of the Regulations.
2 As required by Clause 5(ii)(2) of the Eleventh Schedule of the Regulations, we report that the balance sheet and revenue account are in agreement with the books of account of the Scheme.
3 In our opinion and on the basis of information and explanations given to us, the methods used to value non - traded securities, as at 31 March 2018, as determined by the Board of Directors of AMC, are in accordance with the Regulations and other guidelines issued by the Securities and Exchange Board of India as applicable and approved by the Board of Trustees are fair and reasonable.
For B S R & Co. LLP Chartered Accountants Firm’s Registration No: 101248W/W-100022
Sd/-
Milind Ranade Partner Membership No: 100564
Place : Mumbai Date : July 17, 2018.

27
Independent Auditors’ Report (Contd...)
To the Board of Trustees of
hSBc mutual fund – hSBc fixed term Series 131
Report on the Financial StatementsWe have audited the accompanying Financial Statements of HSBC Fixed Term Series 131 (the ‘Scheme’), which comprise the balance sheet as at 31 March 2018, the related revenue account and the cash flow statement for the year then ended, and a summary of significant accounting policies and other explanatory information, annexed thereto.
Management’s responsibility for the Financial StatementsThe Board of Trustees to the HSBC Mutual Fund (the ‘Board of Trustees’) and HSBC Asset Management (India) Private Limited (the ‘AMC’), being the investment manager to HSBC Mutual Fund (the ‘Fund’) (collectively referred as ‘Management’), are responsible for the preparation of these financial statements that give a true and fair view of the financial position and financial performance of the Scheme in accordance with the accounting policies and standards specified in the Ninth Schedule of the Securities and Exchange Board of India (Mutual Funds) Regulations, 1996, as amended (the ‘Regulations’) and the accounting principles generally accepted in India. This responsibility includes maintenance of adequate accounting records for safeguarding of the assets of the Scheme and for preventing and detecting frauds and other irregularities; selection and application of appropriate accounting policies; making judgments and estimates that are reasonable and prudent; and design, implementation and maintenance of adequate internal financial controls, that were operating effectively for ensuring the accuracy and completeness of the accounting records, relevant to the preparation and presentation of the financial statements that give a true and fair view and are free from material misstatement, whether due to fraud or error.
In preparing the financial statements, management is responsible for assessing the Scheme’s ability to continue as a going concern, disclosing, as applicable, matters related to going concern and using the going concern basis of accounting unless management either intends to liquidate the Fund or to cease operations, or has no realistic alternative but to do so.
Auditor’s responsibilityOur responsibility is to express an opinion on these financial statements based on our audit. We conducted our audit in accordance with the Standards on Auditing issued by the Institute of Chartered Accountants of India (the ‘ICAI’). Those Standards require that we comply with ethical requirements and plan and perform the audit to obtain reasonable assurance about whether the financial statements are free from material misstatement.
An audit involves performing procedures to obtain audit evidence about the amounts and disclosures in the financial statements. The procedures selected depend on the auditor’s judgment, including the assessment of the risks of material misstatement of the financial statements, whether due to fraud or error. In making those risk assessments, the auditor considers internal controls relevant to preparation and fair presentation of the financial statements, of the Scheme, in order to design audit procedures that are appropriate in the circumstances, but not for the purpose of expressing an opinion on the effectiveness of the Scheme’s internal controls. An audit also includes evaluating the appropriateness of accounting policies used and the reasonableness of the accounting estimates made by Management, as well as evaluating the overall presentation of the financial statements.
We are also responsible to conclude on the appropriateness of management’s use of the going concern basis of accounting and, based on the audit evidence obtained, whether a material uncertainty exists related to events or conditions that may cast significant doubt on the Scheme’s ability to continue as a going concern. If we conclude that a material uncertainty exists, we are required to draw attention in the auditor’s report to the related disclosures in the financial statements or, if such disclosures are inadequate, to modify the opinion. Our conclusions are based on the audit evidence obtained up to the date of the auditor’s report. However, future events or conditions may cause the Scheme to cease to continue as a going concern.
We believe that the audit evidence we have obtained is sufficient and appropriate to provide a basis for our audit opinion.

28
Independent Auditors’ Report (Contd...)
OpinionIn our opinion, and to the best of our information and according to the explanations given to us, the aforesaid financial statements give the information required by the Regulations in the manner so required and give a true and fair view in conformity with the accounting principles generally accepted in India:
(i) in the case of the balance sheet, of the state of affairs of the Scheme as at 31 March 2018;
(ii) in the case of the revenue account, of the net surplus for the year ended on that date; and
(iii) in the case of the cash flow statement, of the cash flows of the Scheme for the year ended on that date.
Report on other Legal and Regulatory Requirements
1 As required by Regulation 55(4) to the Regulations, we report that:
(a) We have obtained all information and explanations which, to the best of our knowledge and belief, were necessary for the purposes of the audit;
(b) The balance sheet and revenue account have been prepared in accordance with the accounting policies and standards specified in the Ninth Schedule of the Regulations.
2 As required by Clause 5(ii)(2) of the Eleventh Schedule of the Regulations, we report that the balance sheet and revenue account are in agreement with the books of account of the Scheme.
3 In our opinion and on the basis of information and explanations given to us, the methods used to value non - traded securities, as at 31 March 2018, as determined by the Board of Directors of AMC, are in accordance with the Regulations and other guidelines issued by the Securities and Exchange Board of India as applicable and approved by the Board of Trustees are fair and reasonable.
For B S R & Co. LLP Chartered Accountants Firm’s Registration No: 101248W/W-100022
Sd/-
Milind Ranade Partner Membership No: 100564
Place : Mumbai Date : July 17, 2018.

29
Independent Auditors’ Report (Contd...)
To the Board of Trustees of
hSBc mutual fund – hSBc fixed term Series 132
Report on the Financial StatementsWe have audited the accompanying Financial Statements of HSBC Fixed Term Series 132 (the ‘Scheme’), which comprise the balance sheet as at 31 March 2018, the related revenue account and the cash flow statement for the year then ended, and a summary of significant accounting policies and other explanatory information, annexed thereto.
Management’s responsibility for the Financial StatementsThe Board of Trustees to the HSBC Mutual Fund (the ‘Board of Trustees’) and HSBC Asset Management (India) Private Limited (the ‘AMC’), being the investment manager to HSBC Mutual Fund (the ‘Fund’) (collectively referred as ‘Management’), are responsible for the preparation of these financial statements that give a true and fair view of the financial position and financial performance of the Scheme in accordance with the accounting policies and standards specified in the Ninth Schedule of the Securities and Exchange Board of India (Mutual Funds) Regulations, 1996, as amended (the ‘Regulations’) and the accounting principles generally accepted in India. This responsibility includes maintenance of adequate accounting records for safeguarding of the assets of the Scheme and for preventing and detecting frauds and other irregularities; selection and application of appropriate accounting policies; making judgments and estimates that are reasonable and prudent; and design, implementation and maintenance of adequate internal financial controls, that were operating effectively for ensuring the accuracy and completeness of the accounting records, relevant to the preparation and presentation of the financial statements that give a true and fair view and are free from material misstatement, whether due to fraud or error.
In preparing the financial statements, management is responsible for assessing the Scheme’s ability to continue as a going concern, disclosing, as applicable, matters related to going concern and using the going concern basis of accounting unless management either intends to liquidate the Fund or to cease operations, or has no realistic alternative but to do so.
Auditor’s responsibilityOur responsibility is to express an opinion on these financial statements based on our audit. We conducted our audit in accordance with the Standards on Auditing issued by the Institute of Chartered Accountants of India (the ‘ICAI’). Those Standards require that we comply with ethical requirements and plan and perform the audit to obtain reasonable assurance about whether the financial statements are free from material misstatement.
An audit involves performing procedures to obtain audit evidence about the amounts and disclosures in the financial statements. The procedures selected depend on the auditor’s judgment, including the assessment of the risks of material misstatement of the financial statements, whether due to fraud or error. In making those risk assessments, the auditor considers internal controls relevant to preparation and fair presentation of the financial statements, of the Scheme, in order to design audit procedures that are appropriate in the circumstances, but not for the purpose of expressing an opinion on the effectiveness of the Scheme’s internal controls. An audit also includes evaluating the appropriateness of accounting policies used and the reasonableness of the accounting estimates made by Management, as well as evaluating the overall presentation of the financial statements.
We are also responsible to conclude on the appropriateness of management’s use of the going concern basis of accounting and, based on the audit evidence obtained, whether a material uncertainty exists related to events or conditions that may cast significant doubt on the Scheme’s ability to continue as a going concern. If we conclude that a material uncertainty exists, we are required to draw attention in the auditor’s report to the related disclosures in the financial statements or, if such disclosures are inadequate, to modify the opinion. Our conclusions are based on the audit evidence obtained up to the date of the auditor’s report. However, future events or conditions may cause the Scheme to cease to continue as a going concern.
We believe that the audit evidence we have obtained is sufficient and appropriate to provide a basis for our audit opinion.

30
Independent Auditors’ Report (Contd...)
OpinionIn our opinion, and to the best of our information and according to the explanations given to us, the aforesaid financial statements give the information required by the Regulations in the manner so required and give a true and fair view in conformity with the accounting principles generally accepted in India:
(i) in the case of the balance sheet, of the state of affairs of the Scheme as at 31 March 2018;
(ii) in the case of the revenue account, of the net surplus for the year ended on that date; and
(iii) in the case of the cash flow statement, of the cash flows of the Scheme for the year ended on that date.
Report on other Legal and Regulatory Requirements1 As required by Regulation 55(4) to the Regulations, we report that:
(a) We have obtained all information and explanations which, to the best of our knowledge and belief, were necessary for the purposes of the audit;
(b) The balance sheet and revenue account have been prepared in accordance with the accounting policies and standards specified in the Ninth Schedule of the Regulations.
2 As required by Clause 5(ii)(2) of the Eleventh Schedule of the Regulations, we report that ̀ are in agreement with the books of account of the Scheme.
3 In our opinion and on the basis of information and explanations given to us, the methods used to value non - traded securities, as at 31 March 2018, as determined by the Board of Directors of AMC, are in accordance with the Regulations and other guidelines issued by the Securities and Exchange Board of India as applicable and approved by the Board of Trustees are fair and reasonable.
For B S R & Co. LLP Chartered Accountants Firm’s Registration No: 101248W/W-100022
Sd/-
Milind Ranade Partner Membership No: 100564
Place : Mumbai Date : July 17, 2018.

31
Independent Auditors’ Report (Contd...)
To the Board of Trustees of
hSBc mutual fund – hSBc fixed term Series 133
Report on the Financial StatementsWe have audited the accompanying Financial Statements of HSBC Fixed Term Series 133 (the ‘Scheme’), which comprise the balance sheet as at 31 March 2018, the related revenue account and the cash flow statement for the year then ended, and a summary of significant accounting policies and other explanatory information, annexed thereto.
Management’s responsibility for the Financial StatementsThe Board of Trustees to the HSBC Mutual Fund (the ‘Board of Trustees’) and HSBC Asset Management (India) Private Limited (the ‘AMC’), being the investment manager to HSBC Mutual Fund (the ‘Fund’) (collectively referred as ‘Management’), are responsible for the preparation of these financial statements that give a true and fair view of the financial position and financial performance of the Scheme in accordance with the accounting policies and standards specified in the Ninth Schedule of the Securities and Exchange Board of India (Mutual Funds) Regulations, 1996, as amended (the ‘Regulations’) and the accounting principles generally accepted in India. This responsibility includes maintenance of adequate accounting records for safeguarding of the assets of the Scheme and for preventing and detecting frauds and other irregularities; selection and application of appropriate accounting policies; making judgments and estimates that are reasonable and prudent; and design, implementation and maintenance of adequate internal financial controls, that were operating effectively for ensuring the accuracy and completeness of the accounting records, relevant to the preparation and presentation of the financial statements that give a true and fair view and are free from material misstatement, whether due to fraud or error.
In preparing the financial statements, management is responsible for assessing the Scheme’s ability to continue as a going concern, disclosing, as applicable, matters related to going concern and using the going concern basis of accounting unless management either intends to liquidate the Fund or to cease operations, or has no realistic alternative but to do so.
Auditor’s responsibilityOur responsibility is to express an opinion on these financial statements based on our audit. We conducted our audit in accordance with the Standards on Auditing issued by the Institute of Chartered Accountants of India (the ‘ICAI’). Those Standards require that we comply with ethical requirements and plan and perform the audit to obtain reasonable assurance about whether the financial statements are free from material misstatement.
An audit involves performing procedures to obtain audit evidence about the amounts and disclosures in the financial statements. The procedures selected depend on the auditor’s judgment, including the assessment of the risks of material misstatement of the financial statements, whether due to fraud or error. In making those risk assessments, the auditor considers internal controls relevant to preparation and fair presentation of the financial statements, of the Scheme, in order to design audit procedures that are appropriate in the circumstances, but not for the purpose of expressing an opinion on the effectiveness of the Scheme’s internal controls. An audit also includes evaluating the appropriateness of accounting policies used and the reasonableness of the accounting estimates made by Management, as well as evaluating the overall presentation of the financial statements.
We are also responsible to conclude on the appropriateness of management’s use of the going concern basis of accounting and, based on the audit evidence obtained, whether a material uncertainty exists related to events or conditions that may cast significant doubt on the Scheme’s ability to continue as a going concern. If we conclude that a material uncertainty exists, we are required to draw attention in the auditor’s report to the related disclosures in the financial statements or, if such disclosures are inadequate, to modify the opinion. Our conclusions are based on the audit evidence obtained up to the date of the auditor’s report. However, future events or conditions may cause the Scheme to cease to continue as a going concern.
We believe that the audit evidence we have obtained is sufficient and appropriate to provide a basis for our audit opinion.

32
Independent Auditors’ Report (Contd...)
OpinionIn our opinion, and to the best of our information and according to the explanations given to us, the aforesaid financial statements give the information required by the Regulations in the manner so required and give a true and fair view in conformity with the accounting principles generally accepted in India:
(i) in the case of the balance sheet, of the state of affairs of the Scheme as at 31 March 2018;
(ii) in the case of the revenue account, of the net surplus for the year ended on that date; and
(iii) in the case of the cash flow statement, of the cash flows of the Scheme for the year ended on that date.
Report on other Legal and Regulatory Requirements1 As required by Regulation 55(4) to the Regulations, we report that:
(a) We have obtained all information and explanations which, to the best of our knowledge and belief, were necessary for the purposes of the audit;
(b) The balance sheet and revenue account have been prepared in accordance with the accounting policies and standards specified in the Ninth Schedule of the Regulations.
2 As required by Clause 5(ii)(2) of the Eleventh Schedule of the Regulations, we report that the balance sheet and revenue account are in agreement with the books of account of the Scheme.
3 In our opinion and on the basis of information and explanations given to us, the methods used to value non - traded securities, as at 31 March 2018, as determined by the Board of Directors of AMC, are in accordance with the Regulations and other guidelines issued by the Securities and Exchange Board of India as applicable and approved by the Board of Trustees are fair and reasonable.
For B S R & Co. LLP Chartered Accountants Firm’s Registration No: 101248W/W-100022
Sd/-
Milind Ranade Partner Membership No: 100564
Place : Mumbai Date : July 17, 2018.

33
Rs. in Lakhs
HSBC FIXED TERM SERIES 94As at
March 31, 2018As at
March 31, 2017
LIABILITIES1 Unit Capital 938.42 938.42 2 Reserves & Surplus2.1 Unit Premium Reserves (4,191.49) (4,191.49)2.2 Unrealised Appreciation Reserve 0.06 – 2.3 Other Reserves 4,610.41 4,527.23 3 Loans & Borrowings – – 4 Current Liabilities & Provisions4.1 Provision for doubtful Income/Deposits – – 4.2 Other Current Liabilities & Provisions 3.12 8.41
TOTAL 1,360.52 1,282.57
ASSETS1 Investments1.1 Listed Securities:1.1.1 Equity Shares – – 1.1.2 Preference Shares – – 1.1.3 Equity Linked Debentures – – 1.1.4 Other Debentures & Bonds 1,012.42 1,157.74 1.1.5 Securitised Debt securities – – 1.2 Securities Awaited Listing:1.2.1 Equity Shares – – 1.2.2 Preference Shares – – 1.2.3 Equity Linked Debentures – – 1.2.4 Other Debentures & Bonds – – 1.2.5 Securitised Debt securities – – 1.3 Unlisted Securities1.3.1 Equity Shares – – 1.3.2 Preference Shares – – 1.3.3 Equity Linked Debentures – – 1.3.4 Other Debentures & Bonds – – 1.3.5 Securitised Debt securities – – 1.4 Government Securities – – 1.5 Treasury Bills – – 1.6 Commercial Paper – – 1.7 Certificate of Deposits 98.60 – 1.8 Bill Rediscounting – – 1.9 Units of Domestic Mutual Fund – – 1.10 Foreign Securities – –
Total Investments 1,111.02 1,157.74
2 Deposits 1.84 0.25 3 Other Current Assets3.1 Cash & Bank Balance 0.78 1.44 3.2 CBLO / Reverse Repo Lending 184.05 58.51 3.3 Others 62.83 64.63 4 Deferred Revenue Expenditure (to the extent not written off) – –
TOTAL 1,360.52 1,282.57
Notes to Accounts - Annexure I
Abridged Balance Sheet as at March 31, 2018

34
Abridged Balance Sheet as at March 31, 2018 (Contd...)
Rs. in Lakhs
HSBC FIXED TERM SERIES 96As at
March 31, 2018As at
March 31, 2017
LIABILITIES1 Unit Capital 96.24 96.24 2 Reserves & Surplus2.1 Unit Premium Reserves (2,295.40) (2,295.40)2.2 Unrealised Appreciation Reserve – – 2.3 Other Reserves 2,337.30 2,329.08 3 Loans & Borrowings – – 4 Current Liabilities & Provisions4.1 Provision for doubtful Income/Deposits – – 4.2 Other Current Liabilities & Provisions 0.30 5.88
TOTAL 138.44 135.80
ASSETS1 Investments1.1 Listed Securities:1.1.1 Equity Shares – – 1.1.2 Preference Shares – – 1.1.3 Equity Linked Debentures – – 1.1.4 Other Debentures & Bonds 80.19 91.38 1.1.5 Securitised Debt securities – – 1.2 Securities Awaited Listing:1.2.1 Equity Shares – – 1.2.2 Preference Shares – – 1.2.3 Equity Linked Debentures – – 1.2.4 Other Debentures & Bonds – – 1.2.5 Securitised Debt securities – – 1.3 Unlisted Securities1.3.1 Equity Shares – – 1.3.2 Preference Shares – – 1.3.3 Equity Linked Debentures – – 1.3.4 Other Debentures & Bonds – – 1.3.5 Securitised Debt securities – – 1.4 Government Securities – – 1.5 Treasury Bills – – 1.6 Commercial Paper – – 1.7 Certificate of Deposits – – 1.8 Bill Rediscounting – – 1.9 Units of Domestic Mutual Fund – – 1.10 Foreign Securities – –
Total Investments 80.19 91.38
2 Deposits 0.35 0.14 3 Other Current Assets3.1 Cash & Bank Balance 0.13 1.80 3.2 CBLO / Reverse Repo Lending 52.60 37.32 3.3 Others 5.17 5.16 4 Deferred Revenue Expenditure (to the extent not written off) – –
TOTAL 138.44 135.80
Notes to Accounts - Annexure I

35
Abridged Balance Sheet as at March 31, 2018 (Contd...)
Rs. in Lakhs
HSBC FIXED TERM SERIES 98As at
March 31, 2018As at
March 31, 2017
LIABILITIES1 Unit Capital 313.95 313.95 2 Reserves & Surplus2.1 Unit Premium Reserves (2,186.84) (2,186.84)2.2 Unrealised Appreciation Reserve 0.03 – 2.3 Other Reserves 2,312.08 2,285.66 3 Loans & Borrowings – – 4 Current Liabilities & Provisions4.1 Provision for doubtful Income/Deposits – – 4.2 Other Current Liabilities & Provisions 0.62 4.74
TOTAL 439.84 417.51
ASSETS1 Investments1.1 Listed Securities:1.1.1 Equity Shares – – 1.1.2 Preference Shares – – 1.1.3 Equity Linked Debentures – – 1.1.4 Other Debentures & Bonds 290.70 335.19 1.1.5 Securitised Debt securities – – 1.2 Securities Awaited Listing:1.2.1 Equity Shares – – 1.2.2 Preference Shares – – 1.2.3 Equity Linked Debentures – – 1.2.4 Other Debentures & Bonds – – 1.2.5 Securitised Debt securities – – 1.3 Unlisted Securities1.3.1 Equity Shares – – 1.3.2 Preference Shares – – 1.3.3 Equity Linked Debentures – – 1.3.4 Other Debentures & Bonds – – 1.3.5 Securitised Debt securities – – 1.4 Government Securities – – 1.5 Treasury Bills – – 1.6 Commercial Paper – – 1.7 Certificate of Deposits 49.30 – 1.8 Bill Rediscounting – – 1.9 Units of Domestic Mutual Fund – – 1.10 Foreign Securities – –
Total Investments 340.00 335.19
2 Deposits 0.85 0.25 3 Other Current Assets3.1 Cash & Bank Balance 0.90 1.53 3.2 CBLO / Reverse Repo Lending 80.20 62.11 3.3 Others 17.89 18.43 4 Deferred Revenue Expenditure (to the extent not written off) – –
TOTAL 439.84 417.51
Notes to Accounts - Annexure I

36
Abridged Balance Sheet as at March 31, 2018 (Contd...)
Rs. in Lakhs
HSBC FIXED TERM SERIES 125As at
March 31, 2018As at
March 31, 2017
LIABILITIES1 Unit Capital 11,855.35 11,855.35 2 Reserves & Surplus2.1 Unit Premium Reserves – – 2.2 Unrealised Appreciation Reserve 0.07 110.16 2.3 Other Reserves 1,953.99 970.84 3 Loans & Borrowings – – 4 Current Liabilities & Provisions4.1 Provision for doubtful Income/Deposits – – 4.2 Other Current Liabilities & Provisions 13.92 15.63
TOTAL 13,823.33 12,951.98
ASSETS1 Investments1.1 Listed Securities: – – 1.1.1 Equity Shares – – 1.1.2 Preference Shares – – 1.1.3 Equity Linked Debentures – – 1.1.4 Other Debentures & Bonds 12,829.27 12,042.90 1.1.5 Securitised Debt securities – – 1.2 Securities Awaited Listing: – – 1.2.1 Equity Shares – – 1.2.2 Preference Shares – – 1.2.3 Equity Linked Debentures – – 1.2.4 Other Debentures & Bonds – – 1.2.5 Securitised Debt securities – – 1.3 Unlisted Securities1.3.1 Equity Shares – – 1.3.2 Preference Shares – – 1.3.3 Equity Linked Debentures – – 1.3.4 Other Debentures & Bonds – – 1.3.5 Securitised Debt securities – – 1.4 Government Securities1.5 Treasury Bills – – 1.6 Commercial Paper – – 1.7 Certificate of Deposits 98.61 – 1.8 Bill Rediscounting – – 1.9 Units of Domestic Mutual Fund – – 1.10 Foreign Securities – –
Total Investments 12,927.88 12,042.90
2 Deposits 1.57 1.02 3 Other Current Assets – – 3.1 Cash & Bank Balance 1.85 18.08 3.2 CBLO / Reverse Repo Lending 539.82 729.14 3.3 Others 352.21 160.84 4 Deferred Revenue Expenditure (to the extent not written off) – –
TOTAL 13,823.33 12,951.98
Notes to Accounts - Annexure I
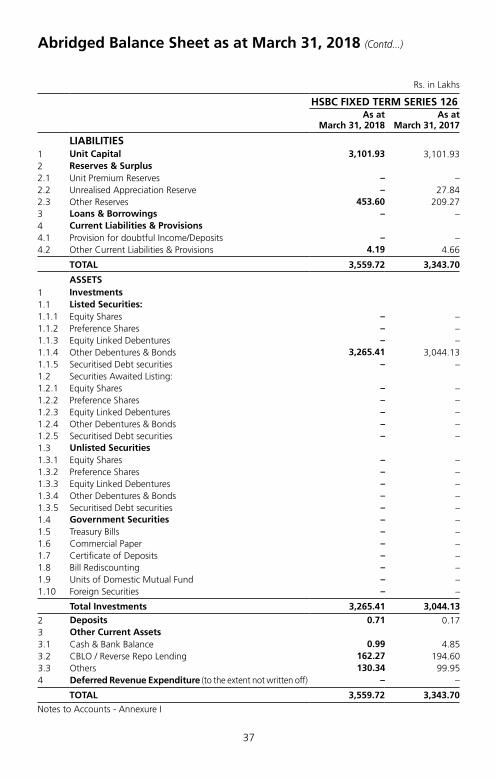
37
Abridged Balance Sheet as at March 31, 2018 (Contd...)
Rs. in Lakhs
HSBC FIXED TERM SERIES 126As at
March 31, 2018As at
March 31, 2017
LIABILITIES1 Unit Capital 3,101.93 3,101.93 2 Reserves & Surplus2.1 Unit Premium Reserves – – 2.2 Unrealised Appreciation Reserve – 27.84 2.3 Other Reserves 453.60 209.27 3 Loans & Borrowings – – 4 Current Liabilities & Provisions4.1 Provision for doubtful Income/Deposits – – 4.2 Other Current Liabilities & Provisions 4.19 4.66
TOTAL 3,559.72 3,343.70
ASSETS1 Investments1.1 Listed Securities:1.1.1 Equity Shares – – 1.1.2 Preference Shares – – 1.1.3 Equity Linked Debentures – – 1.1.4 Other Debentures & Bonds 3,265.41 3,044.13 1.1.5 Securitised Debt securities – – 1.2 Securities Awaited Listing:1.2.1 Equity Shares – – 1.2.2 Preference Shares – – 1.2.3 Equity Linked Debentures – – 1.2.4 Other Debentures & Bonds – – 1.2.5 Securitised Debt securities – – 1.3 Unlisted Securities1.3.1 Equity Shares – – 1.3.2 Preference Shares – – 1.3.3 Equity Linked Debentures – – 1.3.4 Other Debentures & Bonds – – 1.3.5 Securitised Debt securities – – 1.4 Government Securities – – 1.5 Treasury Bills – – 1.6 Commercial Paper – – 1.7 Certificate of Deposits – – 1.8 Bill Rediscounting – – 1.9 Units of Domestic Mutual Fund – – 1.10 Foreign Securities – –
Total Investments 3,265.41 3,044.13
2 Deposits 0.71 0.17 3 Other Current Assets3.1 Cash & Bank Balance 0.99 4.85 3.2 CBLO / Reverse Repo Lending 162.27 194.60 3.3 Others 130.34 99.95 4 Deferred Revenue Expenditure (to the extent not written off) – –
TOTAL 3,559.72 3,343.70
Notes to Accounts - Annexure I

38
Abridged Balance Sheet as at March 31, 2018 (Contd...)
Rs. in Lakhs
HSBC FIXED TERM SERIES 128#
As at March 31, 2018
LIABILITIES1 Unit Capital 6,508.74 2 Reserves & Surplus2.1 Unit Premium Reserves – 2.2 Unrealised Appreciation Reserve – 2.3 Other Reserves 396.87 3 Loans & Borrowings – 4 Current Liabilities & Provisions4.1 Provision for doubtful Income/Deposits – 4.2 Other Current Liabilities & Provisions 6.20
TOTAL 6,911.81
ASSETS1 Investments1.1 Listed Securities:1.1.1 Equity Shares – 1.1.2 Preference Shares – 1.1.3 Equity Linked Debentures – 1.1.4 Other Debentures & Bonds 5,903.10 1.1.5 Securitised Debt securities – 1.2 Securities Awaited Listing:1.2.1 Equity Shares – 1.2.2 Preference Shares – 1.2.3 Equity Linked Debentures – 1.2.4 Other Debentures & Bonds – 1.2.5 Securitised Debt securities – 1.3 Unlisted Securities1.3.1 Equity Shares – 1.3.2 Preference Shares – 1.3.3 Equity Linked Debentures – 1.3.4 Other Debentures & Bonds – 1.3.5 Securitised Debt securities – 1.4 Government Securities 509.21 1.5 Treasury Bills – 1.6 Commercial Paper – 1.7 Certificate of Deposits – 1.8 Bill Rediscounting – 1.9 Units of Domestic Mutual Fund – 1.10 Foreign Securities –
Total Investments 6,412.31
2 Deposits 0.67 3 Other Current Assets3.1 Cash & Bank Balance 40.57 3.2 CBLO / Reverse Repo Lending 249.42 3.3 Others 208.84 4 Deferred Revenue Expenditure (to the extent not written off) –
TOTAL 6,911.81 # Scheme launched during the current financial yearNotes to Accounts - Annexure I

39
Abridged Balance Sheet as at March 31, 2018 (Contd...)
Rs. in Lakhs
HSBC FIXED TERM SERIES 129#
As at March 31, 2018
LIABILITIES1 Unit Capital 5,009.43 2 Reserves & Surplus2.1 Unit Premium Reserves – 2.2 Unrealised Appreciation Reserve – 2.3 Other Reserves 249.31 3 Loans & Borrowings – 4 Current Liabilities & Provisions4.1 Provision for doubtful Income/Deposits – 4.2 Other Current Liabilities & Provisions 3.92
TOTAL 5,262.66
ASSETS1 Investments1.1 Listed Securities:1.1.1 Equity Shares – 1.1.2 Preference Shares – 1.1.3 Equity Linked Debentures – 1.1.4 Other Debentures & Bonds 4,720.57 1.1.5 Securitised Debt securities – 1.2 Securities Awaited Listing:1.2.1 Equity Shares – 1.2.2 Preference Shares – 1.2.3 Equity Linked Debentures – 1.2.4 Other Debentures & Bonds – 1.2.5 Securitised Debt securities – 1.3 Unlisted Securities1.3.1 Equity Shares – 1.3.2 Preference Shares – 1.3.3 Equity Linked Debentures – 1.3.4 Other Debentures & Bonds – 1.3.5 Securitised Debt securities – 1.4 Government Securities 257.78 1.5 Treasury Bills – 1.6 Commercial Paper – 1.7 Certificate of Deposits – 1.8 Bill Rediscounting – 1.9 Units of Domestic Mutual Fund – 1.10 Foreign Securities –
Total Investments 4,978.35
2 Deposits 0.57 3 Other Current Assets3.1 Cash & Bank Balance 0.71 3.2 CBLO / Reverse Repo Lending 82.93 3.3 Others 200.10 4 Deferred Revenue Expenditure (to the extent not written off) –
TOTAL 5,262.66 # Scheme launched during the current financial yearNotes to Accounts - Annexure I

40
Abridged Balance Sheet as at March 31, 2018 (Contd...)
Rs. in Lakhs
HSBC FIXED TERM SERIES 130#
As at March 31, 2018
LIABILITIES1 Unit Capital 2,296.23 2 Reserves & Surplus2.1 Unit Premium Reserves – 2.2 Unrealised Appreciation Reserve – 2.3 Other Reserves 40.74 3 Loans & Borrowings – 4 Current Liabilities & Provisions4.1 Provision for doubtful Income/Deposits – 4.2 Other Current Liabilities & Provisions 0.84
TOTAL 2,337.81
ASSETS 1 Investments1.1 Listed Securities:1.1.1 Equity Shares – 1.1.2 Preference Shares – 1.1.3 Equity Linked Debentures – 1.1.4 Other Debentures & Bonds 1,758.21 1.1.5 Securitised Debt securities – 1.2 Securities Awaited Listing:1.2.1 Equity Shares – 1.2.2 Preference Shares – 1.2.3 Equity Linked Debentures – 1.2.4 Other Debentures & Bonds – 1.2.5 Securitised Debt securities – 1.3 Unlisted Securities1.3.1 Equity Shares – 1.3.2 Preference Shares – 1.3.3 Equity Linked Debentures – 1.3.4 Other Debentures & Bonds 248.11 1.3.5 Securitised Debt securities – 1.4 Government Securities 220.38 1.5 Treasury Bills – 1.6 Commercial Paper – 1.7 Certificate of Deposits – 1.8 Bill Rediscounting – 1.9 Units of Domestic Mutual Fund – 1.10 Foreign Securities –
Total Investments 2,226.70
2 Deposits 0.17 3 Other Current Assets3.1 Cash & Bank Balance 0.03 3.2 CBLO / Reverse Repo Lending 70.26 3.3 Others 40.65 4 Deferred Revenue Expenditure (to the extent not written off) –
TOTAL 2,337.81 # Scheme launched during the current financial yearNotes to Accounts - Annexure I

41
Abridged Balance Sheet as at March 31, 2018 (Contd...)
Rs. in Lakhs
HSBC FIXED TERM SERIES 131#
As at March 31, 2018
LIABILITIES1 Unit Capital 4,030.36 2 Reserves & Surplus2.1 Unit Premium Reserves – 2.2 Unrealised Appreciation Reserve 7.82 2.3 Other Reserves 8.62 3 Loans & Borrowings – 4 Current Liabilities & Provisions4.1 Provision for doubtful Income/Deposits – 4.2 Other Current Liabilities & Provisions 0.49
TOTAL 4,047.29
ASSETS
1 Investments1.1 Listed Securities:1.1.1 Equity Shares – 1.1.2 Preference Shares – 1.1.3 Equity Linked Debentures – 1.1.4 Other Debentures & Bonds 3,069.37 1.1.5 Securitised Debt securities – 1.2 Securities Awaited Listing:1.2.1 Equity Shares – 1.2.2 Preference Shares – 1.2.3 Equity Linked Debentures – 1.2.4 Other Debentures & Bonds – 1.2.5 Securitised Debt securities – 1.3 Unlisted Securities1.3.1 Equity Shares – 1.3.2 Preference Shares – 1.3.3 Equity Linked Debentures – 1.3.4 Other Debentures & Bonds 401.06 1.3.5 Securitised Debt securities – 1.4 Government Securities 502.23 1.5 Treasury Bills – 1.6 Commercial Paper – 1.7 Certificate of Deposits – 1.8 Bill Rediscounting – 1.9 Units of Domestic Mutual Fund – 1.10 Foreign Securities –
Total Investments 3,972.66
2 Deposits – 3 Other Current Assets3.1 Cash & Bank Balance 0.02 3.2 CBLO / Reverse Repo Lending 27.33 3.3 Others 47.28 4 Deferred Revenue Expenditure (to the extent not written off) –
TOTAL 4,047.29
# Scheme launched during the current financial yearNotes to Accounts - Annexure I

42
Abridged Balance Sheet as at March 31, 2018 (Contd...)
Rs. in Lakhs
HSBC FIXED TERM SERIES 132#
As at March 31, 2018
LIABILITIES1 Unit Capital 12,322.58 2 Reserves & Surplus2.1 Unit Premium Reserves – 2.2 Unrealised Appreciation Reserve 43.65 2.3 Other Reserves 61.95 3 Loans & Borrowings – 4 Current Liabilities & Provisions4.1 Provision for doubtful Income/Deposits – 4.2 Other Current Liabilities & Provisions 2.29
TOTAL 12,430.47
ASSETS1 Investments1.1 Listed Securities:1.1.1 Equity Shares – 1.1.2 Preference Shares – 1.1.3 Equity Linked Debentures – 1.1.4 Other Debentures & Bonds 10,365.05 1.1.5 Securitised Debt securities – 1.2 Securities Awaited Listing:1.2.1 Equity Shares – 1.2.2 Preference Shares – 1.2.3 Equity Linked Debentures – 1.2.4 Other Debentures & Bonds – 1.2.5 Securitised Debt securities – 1.3 Unlisted Securities1.3.1 Equity Shares – 1.3.2 Preference Shares – 1.3.3 Equity Linked Debentures – 1.3.4 Other Debentures & Bonds 1,200.35 1.3.5 Securitised Debt securities – 1.4 Government Securities 625.27 1.5 Treasury Bills – 1.6 Commercial Paper – 1.7 Certificate of Deposits – 1.8 Bill Rediscounting – 1.9 Units of Domestic Mutual Fund – 1.10 Foreign Securities –
Total Investments 12,190.67
2 Deposits – 3 Other Current Assets3.1 Cash & Bank Balance 0.01 3.2 CBLO / Reverse Repo Lending 6.57 3.3 Others 233.22 4 Deferred Revenue Expenditure (to the extent not written off) –
TOTAL 12,430.47
# Scheme launched during the current financial yearNotes to Accounts - Annexure I

43
Abridged Balance Sheet as at March 31, 2018 (Contd...)
Rs. in Lakhs
HSBC FIXED TERM SERIES 133#
As at March 31, 2018
LIABILITIES1 Unit Capital 9,639.72 2 Reserves & Surplus2.1 Unit Premium Reserves – 2.2 Unrealised Appreciation Reserve 19.13 2.3 Other Reserves 11.27 3 Loans & Borrowings – 4 Current Liabilities & Provisions4.1 Provision for doubtful Income/Deposits – 4.2 Other Current Liabilities & Provisions 958.74
TOTAL 10,628.86
ASSETS1 Investments1.1 Listed Securities:1.1.1 Equity Shares – 1.1.2 Preference Shares – 1.1.3 Equity Linked Debentures – 1.1.4 Other Debentures & Bonds 5,870.63 1.1.5 Securitised Debt securities – 1.2 Securities Awaited Listing:1.2.1 Equity Shares – 1.2.2 Preference Shares – 1.2.3 Equity Linked Debentures – 1.2.4 Other Debentures & Bonds – 1.2.5 Securitised Debt securities – 1.3 Unlisted Securities1.3.1 Equity Shares – 1.3.2 Preference Shares – 1.3.3 Equity Linked Debentures – 1.3.4 Other Debentures & Bonds 767.44 1.3.5 Securitised Debt securities – 1.4 Government Securities 953.28 1.5 Treasury Bills – 1.6 Commercial Paper – 1.7 Certificate of Deposits – 1.8 Bill Rediscounting – 1.9 Units of Domestic Mutual Fund – 1.10 Foreign Securities –
Total Investments 7,591.35
2 Deposits – 3 Other Current Assets3.1 Cash & Bank Balance 7.62 3.2 CBLO / Reverse Repo Lending 3,001.12 3.3 Others 28.77 4 Deferred Revenue Expenditure (to the extent not written off) –
TOTAL 10,628.86
# Scheme launched during the current financial yearNotes to Accounts - Annexure I

44
Abridged Revenue Account for the year ended March 31, 2018
Rs. in Lakhs
HSBC FIXED TERM SERIES 94
Current Year ended
March 31, 2018
Previous Year ended
March 31, 2017
1 INCOME1.1 Dividend – –
1.2 Interest 105.52 539.87
1.3 Realised Gain / (Loss) on Foreign Exchange Transactions – –
1.4 Realised Gains / (Losses) on Interscheme sale of investments – –
1.5 Realised Gains / (Losses) on External sale / redemption of investments
(2.80) (57.54)
1.6 Realised Gains / (Losses) on Derivative Transactions – –
1.7 Other Income – –
(A) 102.72 482.33
2 EXPENSES2.1 Management fees 5.15 24.04
2.2 Service tax on Management fees 0.91 3.60
2.3 Transfer agents fees and expenses 0.15 0.72
2.4 Custodian fees 0.05 0.22
2.5 Trusteeship fees – –
2.6 Commission to Agents – –
2.7 Marketing & Distribution expenses – 0.11
2.8 Audit fees 0.20 0.20
2.9 Investor Education Expenses 0.26 1.27
2.10 Other operating expenses 0.24 0.06
2.11 Less : Expenses to be Reimbursed by the Investment Manager – –
(B) 6.96 30.22 3 NET REALISED GAINS / (LOSSES)
FOR THE PERIOD (A–B=C) 95.76 452.11 4 Change in Unrealised Depreciation
in value of investments (D) (12.58) 6.92
5 NET GAINS / (LOSSES) FOR THE PERIOD [E=(C+D)] 83.18 459.03
6 Change in unrealised appreciation in the value of investments (F) 0.06 –
7 NET SURPLUS / (DEFICIT) FOR THE PERIOD (E+F=G) 83.24 459.03
7.1 Add: Balance transfer from Unrealised Appreciation Reserve (0.06) – 7.2 Less: Balance transfer to Unrealised Appreciation Reserve – – 7.3 Add / (Less): Equalisation – – 7.4 Transfer from Reserve Fund 4,527.23 4,068.52 7.5 Transfer from Unit Premium Reserve – –
8 TOTAL 4,610.41 4,527.55
9 Dividend appropriation9.1 Income Distributed during the period – 0.23 9.2 Tax on income distributed during the period – 0.09
10 Retained Surplus / (Deficit) carried forward to Balance sheet 4,610.41 4,527.23
Notes to Accounts - Annexure I

45
Abridged Revenue Account for the year ended March 31, 2018 (Contd...)
Rs. in Lakhs
HSBC FIXED TERM SERIES 96
Current Year ended
March 31, 2018
Previous Year ended
March 31, 2017
1 INCOME1.1 Dividend – –
1.2 Interest 10.13 255.56
1.3 Realised Gain / (Loss) on Foreign Exchange Transactions – –
1.4 Realised Gains / (Losses) on Interscheme sale of investments – –
1.5 Realised Gains / (Losses) on External sale / redemption of investments
(0.23) (6.51)
1.6 Realised Gains / (Losses) on Derivative Transactions – –
1.7 Other Income – –
(A) 9.90 249.05
2 EXPENSES2.1 Management fees 0.21 7.06
2.2 GST / Service tax on Management fees 0.04 1.06
2.3 Transfer agents fees and expenses 0.01 0.35
2.4 Custodian fees – 0.11
2.5 Trusteeship fees – –
2.6 Commission to Agents 0.12 3.31
2.7 Marketing & Distribution expenses – 0.11
2.8 Audit fees 0.20 0.20
2.9 Investor Education Expenses 0.03 0.62
2.10 Other operating expenses 0.23 1.51
2.11 Less : Expenses to be Reimbursed by the Investment Manager (0.14) –
(B) 0.70 14.33
3 NET REALISED GAINS / (LOSSES) FOR THE PERIOD (A–B=C) 9.20 234.72
4 Change in Unrealised Depreciation in value of investments (D) (0.98) (0.37)
5 NET GAINS / (LOSSES) FOR THE PERIOD [E=(C+D)] 8.22 234.35
6 Change in unrealised appreciation in the value of investments (F) – (10.02)
7 NET SURPLUS / (DEFICIT) FOR THE PERIOD (E+F=G) 8.22 224.33
7.1 Add: Balance transfer from Unrealised Appreciation Reserve – 10.02
7.2 Less: Balance transfer to Unrealised Appreciation Reserve – –
7.3 Add / (Less): Equalisation – –
7.4 Transfer from Reserve Fund 2,329.08 2,094.88
7.5 Transfer from Unit Premium Reserve – –
8 Total 2,337.30 2,329.23
9 Dividend appropriation
9.1 Income Distributed during the period – 0.11
9.2 Tax on income distributed during the period – 0.04
10 Retained Surplus / (Deficit) carried forward to Balance sheet 2,337.30 2,329.08
Notes to Accounts - Annexure I

46
Rs. in Lakhs
HSBC FIXED TERM SERIES 98
Current Year ended
March 31, 2018
Previous Year ended
March 31, 2017
1 INCOME1.1 Dividend – – 1.2 Interest 33.21 290.96 1.3 Realised Gain / (Loss) on Foreign Exchange Transactions – – 1.4 Realised Gains / (Losses) on Interscheme sale of
investments– –
1.5 Realised Gains / (Losses) on External sale / redemption of investments
(0.88) (19.28)
1.6 Realised Gains / (Losses) on Derivative Transactions – – 1.7 Other Income – –
(A) 32.33 271.68 2 EXPENSES2.1 Management fees 0.98 10.80 2.2 GST / Service tax on Management fees 0.17 1.62 2.3 Transfer agents fees and expenses 0.05 0.40 2.4 Custodian fees 0.02 0.08 2.5 Trusteeship fees – – 2.6 Commission to Agents 0.55 4.01 2.7 Marketing & Distribution expenses – 0.11 2.8 Audit fees 0.20 0.20 2.9 Investor Education Expenses 0.09 0.70 2.10 Other operating expenses 0.21 0.07 2.11 Less : Expenses to be Reimbursed by the Investment Manager – –
(B) 2.27 17.99 3 NET REALISED GAINS / (LOSSES)
FOR THE PERIOD (A–B=C) 30.06 253.69 4 Change in Unrealised Depreciation
in value of investments (D) (3.64) 8.57
5 NET GAINS / (LOSSES) FOR THE PERIOD [E=(C+D)] 26.42 262.26
6 Change in unrealised appreciation in the value of investments (F) 0.03 (12.87)
7 NET SURPLUS / (DEFICIT) FOR THE PERIOD (E+F=G) 26.45 249.39
7.1 Add: Balance transfer from Unrealised Appreciation Reserve
(0.03) 12.87
7.2 Less: Balance transfer to Unrealised Appreciation Reserve – – 7.3 Add / (Less): Equalisation – – 7.4 Transfer from Reserve Fund 2,285.66 2,029.52 7.5 Transfer from Unit Premium Reserve – –
8 TOTAL 2,312.08 2,291.78
9 Dividend appropriation9.1 Income Distributed during the period – 4.42 9.2 Tax on income distributed during the period – 1.70
10 Retained Surplus / (Deficit) carried forward to Balance sheet 2,312.08 2,285.66
Notes to Accounts - Annexure I
Abridged Revenue Account for the year ended March 31, 2018 (Contd...)
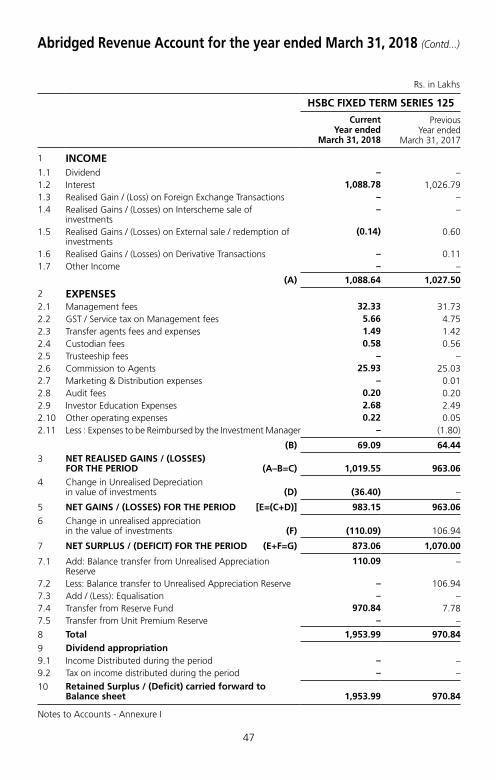
47
Rs. in Lakhs
HSBC FIXED TERM SERIES 125
Current Year ended
March 31, 2018
Previous Year ended
March 31, 2017
1 INCOME1.1 Dividend – – 1.2 Interest 1,088.78 1,026.79 1.3 Realised Gain / (Loss) on Foreign Exchange Transactions – – 1.4 Realised Gains / (Losses) on Interscheme sale of
investments– –
1.5 Realised Gains / (Losses) on External sale / redemption of investments
(0.14) 0.60
1.6 Realised Gains / (Losses) on Derivative Transactions – 0.11 1.7 Other Income – –
(A) 1,088.64 1,027.50 2 EXPENSES2.1 Management fees 32.33 31.73 2.2 GST / Service tax on Management fees 5.66 4.75 2.3 Transfer agents fees and expenses 1.49 1.42 2.4 Custodian fees 0.58 0.56 2.5 Trusteeship fees – – 2.6 Commission to Agents 25.93 25.03 2.7 Marketing & Distribution expenses – 0.01 2.8 Audit fees 0.20 0.20 2.9 Investor Education Expenses 2.68 2.49 2.10 Other operating expenses 0.22 0.05 2.11 Less : Expenses to be Reimbursed by the Investment Manager – (1.80)
(B) 69.09 64.44 3 NET REALISED GAINS / (LOSSES)
FOR THE PERIOD (A–B=C) 1,019.55 963.06 4 Change in Unrealised Depreciation
in value of investments (D) (36.40) –
5 NET GAINS / (LOSSES) FOR THE PERIOD [E=(C+D)] 983.15 963.06
6 Change in unrealised appreciation in the value of investments (F) (110.09) 106.94
7 NET SURPLUS / (DEFICIT) FOR THE PERIOD (E+F=G) 873.06 1,070.00
7.1 Add: Balance transfer from Unrealised Appreciation Reserve
110.09 –
7.2 Less: Balance transfer to Unrealised Appreciation Reserve – 106.94 7.3 Add / (Less): Equalisation – – 7.4 Transfer from Reserve Fund 970.84 7.78 7.5 Transfer from Unit Premium Reserve – –
8 Total 1,953.99 970.84
9 Dividend appropriation9.1 Income Distributed during the period – – 9.2 Tax on income distributed during the period – –
10 Retained Surplus / (Deficit) carried forward to Balance sheet 1,953.99 970.84
Notes to Accounts - Annexure I
Abridged Revenue Account for the year ended March 31, 2018 (Contd...)

48
Rs. in Lakhs
HSBC FIXED TERM SERIES 126
Current Year ended
March 31, 2018
Previous Year ended
March 31, 2017
1 INCOME1.1 Dividend – – 1.2 Interest 271.35 224.16 1.3 Realised Gain / (Loss) on Foreign Exchange Transactions – – 1.4 Realised Gains / (Losses) on Interscheme sale of investments – – 1.5 Realised Gains / (Losses) on External sale / redemption of
investments(0.09) (0.05)
1.6 Realised Gains / (Losses) on Derivative Transactions – – 1.7 Other Income – –
(A) 271.26 224.11 2 EXPENSES2.1 Management fees 8.19 6.95 2.2 GST / Service tax on Management fees 1.43 1.04 2.3 Transfer agents fees and expenses 0.38 0.34 2.4 Custodian fees 0.14 0.12 2.5 Trusteeship fees – – 2.6 Commission to Agents 6.96 5.82 2.7 Marketing & Distribution expenses – 0.01 2.8 Audit fees 0.20 0.20 2.9 Investor Education Expenses 0.69 0.56 2.10 Other operating expenses 0.22 0.10 2.11 Less : Expenses to be Reimbursed by the Investment Manager – (0.30)
(B) 18.21 14.84 3 NET REALISED GAINS / (LOSSES)
FOR THE PERIOD (A–B=C) 253.05 209.27 4 Change in Unrealised Depreciation
in value of investments (D) (8.72) –
5 NET GAINS / (LOSSES) FOR THE PERIOD [E=(C+D)] 244.33 209.27
6 Change in unrealised appreciation in the value of investments (F) (27.84) 27.84
7 NET SURPLUS / (DEFICIT) FOR THE PERIOD (E+F=G) 216.49 237.11
7.1 Add: Balance transfer from Unrealised Appreciation Reserve 27.84 – 7.2 Less: Balance transfer to Unrealised Appreciation Reserve – 27.84 7.3 Add / (Less): Equalisation – – 7.4 Transfer from Reserve Fund 209.27 – 7.5 Transfer from Unit Premium Reserve – –
8 Total 453.60 209.27
9 Dividend appropriation9.1 Income Distributed during the period – – 9.2 Tax on income distributed during the period – –
10 Retained Surplus / (Deficit) carried forward to Balance sheet 453.60 209.27
Notes to Accounts - Annexure I
Abridged Revenue Account for the year ended March 31, 2018 (Contd...)

49
Rs. in Lakhs
HSBC FIXED TERM SERIES 128#
Current period ended
March 31, 2018
1 INCOME1.1 Dividend – 1.2 Interest 483.91 1.3 Realised Gain / (Loss) on Foreign Exchange Transactions – 1.4 Realised Gains / (Losses) on Interscheme sale of investments – 1.5 Realised Gains / (Losses) on External sale / redemption of
investments(0.08)
1.6 Realised Gains / (Losses) on Derivative Transactions – 1.7 Other Income –
(A) 483.83 2 EXPENSES2.1 Management fees 13.23 2.2 GST / Service tax on Management fees 2.32 2.3 Transfer agents fees and expenses 0.71 2.4 Custodian fees 0.27 2.5 Trusteeship fees – 2.6 Commission to Agents 11.92 2.7 Marketing & Distribution expenses – 2.8 Audit fees 0.20 2.9 Investor Education Expenses 1.27 2.10 Other operating expenses 0.43 2.11 Less : Expenses to be Reimbursed by the Investment Manager –
(B) 30.35 3 NET REALISED GAINS / (LOSSES)
FOR THE PERIOD (A–B=C) 453.48 4 Change in Unrealised Depreciation
in value of investments (D) (56.61)
5 NET GAINS / (LOSSES) FOR THE PERIOD [E=(C+D)] 396.87
6 Change in unrealised appreciation in the value of investments (F) –
7 NET SURPLUS / (DEFICIT) FOR THE PERIOD (E+F=G) 396.87
7.1 Add: Balance transfer from Unrealised Appreciation Reserve – 7.2 Less: Balance transfer to Unrealised Appreciation Reserve – 7.3 Add / (Less): Equalisation – 7.4 Transfer from Reserve Fund – 7.5 Transfer from Unit Premium Reserve –
8 Total 396.87
9 Dividend appropriation9.1 Income Distributed during the period – 9.2 Tax on income distributed during the period – 10 Retained Surplus / (Deficit) carried forward to
Balance sheet 396.87
# Scheme launched during the current financial year
Notes to Accounts - Annexure I
Abridged Revenue Account for the period ended March 31, 2018 (Contd...)

50
Abridged Revenue Account for the period ended March 31, 2018 (Contd...)
Rs. in Lakhs
HSBC FIXED TERM SERIES 129#
Current period ended
March 31, 2018
1 INCOME1.1 Dividend – 1.2 Interest 330.87 1.3 Realised Gain / (Loss) on Foreign Exchange Transactions – 1.4 Realised Gains / (Losses) on Interscheme sale of investments – 1.5 Realised Gains / (Losses) on External sale / redemption of
investments(0.10)
1.6 Realised Gains / (Losses) on Derivative Transactions – 1.7 Other Income –
(A) 330.77
2 EXPENSES2.1 Management fees 6.89 2.2 GST / Service tax on Management fees 1.23 2.3 Transfer agents fees and expenses 0.47 2.4 Custodian fees 0.18 2.5 Trusteeship fees – 2.6 Commission to Agents 4.07 2.7 Marketing & Distribution expenses – 2.8 Audit fees 0.20 2.9 Investor Education Expenses 0.84 2.10 Other operating expenses 0.31 2.11 Less : Expenses to be Reimbursed by the Investment Manager –
(B) 14.19 3 NET REALISED GAINS / (LOSSES)
FOR THE PERIOD (A–B=C) 316.58 4 Change in Unrealised Depreciation
in value of investments (D) (67.27)
5 NET GAINS / (LOSSES) FOR THE PERIOD [E=(C+D)] 249.31
6 Change in unrealised appreciation in the value of investments (F) –
7 NET SURPLUS / (DEFICIT) FOR THE PERIOD (E+F=G) 249.31
7.1 Add: Balance transfer from Unrealised Appreciation Reserve – 7.2 Less: Balance transfer to Unrealised Appreciation Reserve – 7.3 Add / (Less): Equalisation – 7.4 Transfer from Reserve Fund – 7.5 Transfer from Unit Premium Reserve –
8 Total 249.31
9 Dividend appropriation9.1 Income Distributed during the period – 9.2 Tax on income distributed during the period – 10 Retained Surplus / (Deficit) carried forward to
Balance sheet 249.31
# Scheme launched during the current financial yearNotes to Accounts - Annexure I

51
Abridged Revenue Account for the period ended March 31, 2018 (Contd...)
Rs. in Lakhs
HSBC FIXED TERM SERIES 130#
Current period ended
March 31, 2018
1 INCOME1.1 Dividend – 1.2 Interest 46.53 1.3 Realised Gain / (Loss) on Foreign Exchange Transactions – 1.4 Realised Gains / (Losses) on Interscheme sale of investments – 1.5 Realised Gains / (Losses) on External sale / redemption of
investments(0.02)
1.6 Realised Gains / (Losses) on Derivative Transactions – 1.7 Other Income –
(A) 46.51 2 EXPENSES2.1 Management fees 0.63 2.2 GST / Service tax on Management fees 0.11 2.3 Transfer agents fees and expenses 0.07 2.4 Custodian fees 0.03 2.5 Trusteeship fees – 2.6 Commission to Agents 0.47 2.7 Marketing & Distribution expenses – 2.8 Audit fees 0.20 2.9 Investor Education Expenses 0.13 2.10 Other operating expenses 0.06 2.11 Less : Expenses to be Reimbursed by the Investment Manager (0.18)
(B) 1.52 3 NET REALISED GAINS / (LOSSES)
FOR THE PERIOD (A–B=C) 44.99 4 Change in Unrealised Depreciation
in value of investments (D) (4.25)
5 NET GAINS / (LOSSES) FOR THE PERIOD [E=(C+D)] 40.74
6 Change in unrealised appreciation in the value of investments (F) –
7 NET SURPLUS / (DEFICIT) FOR THE PERIOD (E+F=G) 40.74
7.1 Add: Balance transfer from Unrealised Appreciation Reserve – 7.2 Less: Balance transfer to Unrealised Appreciation Reserve – 7.3 Add / (Less): Equalisation – 7.4 Transfer from Reserve Fund – 7.5 Transfer from Unit Premium Reserve –
8 Total 40.74
9 Dividend appropriation9.1 Income Distributed during the period – 9.2 Tax on income distributed during the period – 10 Retained Surplus / (Deficit) carried forward to
Balance sheet 40.74
# Scheme launched during the current financial year
Notes to Accounts - Annexure I

52
Abridged Revenue Account for the period ended March 31, 2018 (Contd...)
Rs. in Lakhs
HSBC FIXED TERM SERIES 131#
Current period ended March 31, 2018
1 INCOME1.1 Dividend – 1.2 Interest 8.75 1.3 Realised Gain / (Loss) on Foreign Exchange Transactions – 1.4 Realised Gains / (Losses) on Interscheme sale of investments – 1.5 Realised Gains / (Losses) on External sale / redemption of
investments(0.02)
1.6 Realised Gains / (Losses) on Derivative Transactions – 1.7 Other Income –
(A) 8.73
2 EXPENSES2.1 Management fees – 2.2 GST / Service tax on Management fees – 2.3 Transfer agents fees and expenses 0.04 2.4 Custodian fees – 2.5 Trusteeship fees – 2.6 Commission to Agents 0.09 2.7 Marketing & Distribution expenses – 2.8 Audit fees 0.20 2.9 Investor Education Expenses 0.02 2.10 Other operating expenses 0.09 2.11 Less : Expenses to be Reimbursed by the Investment Manager (0.33)
(B) 0.11 3 NET REALISED GAINS / (LOSSES)
FOR THE PERIOD (A–B=C) 8.62 4 Change in Unrealised Depreciation
in value of investments (D) –
5 NET GAINS / (LOSSES) FOR THE PERIOD [E=(C+D)] 8.62
6 Change in unrealised appreciation in the value of investments (F) 7.82
7 NET SURPLUS / (DEFICIT) FOR THE PERIOD (E+F=G) 16.44
7.1 Add: Balance transfer from Unrealised Appreciation Reserve – 7.2 Less: Balance transfer to Unrealised Appreciation Reserve 7.82 7.3 Add / (Less): Equalisation – 7.4 Transfer from Reserve Fund – 7.5 Transfer from Unit Premium Reserve –
8 Total 8.62
9 Dividend appropriation9.1 Income Distributed during the period – 9.2 Tax on income distributed during the period –
10 Retained Surplus / (Deficit) carried forward to Balance sheet 8.62
# Scheme launched during the current financial year
Notes to Accounts - Annexure I

53
Abridged Revenue Account for the period ended March 31, 2018 (Contd...)
Rs. in Lakhs
HSBC FIXED TERM SERIES 132#
Current period ended March 31, 2018
1 INCOME1.1 Dividend – 1.2 Interest 64.18 1.3 Realised Gain / (Loss) on Foreign Exchange Transactions – 1.4 Realised Gains / (Losses) on Interscheme sale of investments – 1.5 Realised Gains / (Losses) on External sale / redemption of
investments(0.11)
1.6 Realised Gains / (Losses) on Derivative Transactions – 1.7 Other Income –
(A) 64.07
2 EXPENSES2.1 Management fees 0.68 2.2 GST / Service tax on Management fees 0.12 2.3 Transfer agents fees and expenses 0.12 2.4 Custodian fees 0.03 2.5 Trusteeship fees – 2.6 Commission to Agents 0.80 2.7 Marketing & Distribution expenses – 2.8 Audit fees 0.20 2.9 Investor Education Expenses 0.14 2.10 Other operating expenses 0.08 2.11 Less : Expenses to be Reimbursed by the Investment Manager (0.05)
(B) 2.12 3 NET REALISED GAINS / (LOSSES)
FOR THE PERIOD (A–B=C) 61.95 4 Change in Unrealised Depreciation
in value of investments (D) –
5 NET GAINS / (LOSSES) FOR THE PERIOD [E=(C+D)] 61.95
6 Change in unrealised appreciation in the value of investments (F) 43.65
7 NET SURPLUS / (DEFICIT) FOR THE PERIOD (E+F=G) 105.60
7.1 Add: Balance transfer from Unrealised Appreciation Reserve – 7.2 Less: Balance transfer to Unrealised Appreciation Reserve 43.65 7.3 Add / (Less): Equalisation – 7.4 Transfer from Reserve Fund – 7.5 Transfer from Unit Premium Reserve –
8 Total 61.95
9 Dividend appropriation9.1 Income Distributed during the period – 9.2 Tax on income distributed during the period – 10 Retained Surplus / (Deficit) carried forward to
Balance sheet 61.95
# Scheme launched during the current financial year
Notes to Accounts - Annexure I

54
Abridged Revenue Account for the period ended March 31, 2018 (Contd...)
Rs. in Lakhs
HSBC FIXED TERM SERIES 133#
Current period ended March 31, 2018
1 INCOME1.1 Dividend – 1.2 Interest 12.43 1.3 Realised Gain / (Loss) on Foreign Exchange Transactions – 1.4 Realised Gains / (Losses) on Interscheme sale of investments – 1.5 Realised Gains / (Losses) on External sale / redemption of
investments(0.04)
1.6 Realised Gains / (Losses) on Derivative Transactions – 1.7 Other Income –
(A) 12.39
2 EXPENSES2.1 Management fees 0.13 2.2 GST / Service tax on Management fees 0.02 2.3 Transfer agents fees and expenses 0.09 2.4 Custodian fees – 2.5 Trusteeship fees – 2.6 Commission to Agents 0.24 2.7 Marketing & Distribution expenses – 2.8 Audit fees 0.20 2.9 Investor Education Expenses 0.03 2.10 Other operating expenses 0.06 2.11 Less : Expenses to be Reimbursed by the Investment Manager (0.40)
(B) 0.373 NET REALISED GAINS / (LOSSES)
FOR THE PERIOD (A–B=C) 12.02 4 Change in Unrealised Depreciation
in value of investments (D) (0.75)
5 NET GAINS / (LOSSES) FOR THE PERIOD [E=(C+D)] 11.27
6 Change in unrealised appreciation in the value of investments (F) 19.13
7 NET SURPLUS / (DEFICIT) FOR THE PERIOD (E+F=G) 30.40
7.1 Add: Balance transfer from Unrealised Appreciation Reserve – 7.2 Less: Balance transfer to Unrealised Appreciation Reserve 19.13 7.3 Add / (Less): Equalisation – 7.4 Transfer from Reserve Fund – 7.5 Transfer from Unit Premium Reserve –
8 Total 11.27
9 Dividend appropriation9.1 Income Distributed during the period – 9.2 Tax on income distributed during the period – 10 Retained Surplus / (Deficit) carried forward to
Balance sheet 11.27
# Scheme launched during the current financial year
Notes to Accounts - Annexure I

55
Key Statistics for the year ended March 31, 2018
HSBC FIXED TERM SERIES 94
Current Year ended
March 31, 2018
Previous Year ended
March 31, 2017
1. NAV per unit (Rs.):
Open
Growth Option 13.5778 12.6714
Dividend Option – 11.4599
Direct Plan – Growth Option 13.6531 12.7861
Direct Plan – Dividend Option – –
High
Growth Option 14.4578 13.5778
Dividend Option – 11.9471
Direct Plan – Growth Option 14.5854 13.6531
Direct Plan – Dividend Option – –
Low
Growth Option 13.5871 12.6875
Dividend Option – 11.4744
Direct Plan – Growth Option 13.6634 12.8029
Direct Plan – Dividend Option – –
End
Growth Option 14.4648 13.5778
Dividend Option – –
Direct Plan – Growth Option 14.5929 13.6531
Direct Plan – Dividend Option – –
2. Closing Assets Under Management (Rs. in Lakhs)
End 1,357 1,274
Average (AAuM)1 1,316 6,356
3. Gross income as % of AAuM2 * 7.81% 7.59%
4. Expense Ratio:
a. Total Expense as % of AAuM (including service tax / GST on Management fees) (planwise) *
Regular Growth Option 0.53% 0.51%
Direct Plan – Growth Option 0.19% 0.11%
b. Management Fee as % of AAuM (planwise) *
Regular Growth Option 0.22% 0.38%
Direct Plan – Growth Option 0.22% 0.38%
5. Net Income as a percentage of AAuM3 * 7.28% 7.11%
6. Portfolio turnover ratio4 * – –
7. Total Dividend per unit distributed during the period (planwise)
Retail
Regular Dividend Option – 1.4063
Direct Plan – Dividend Option – –
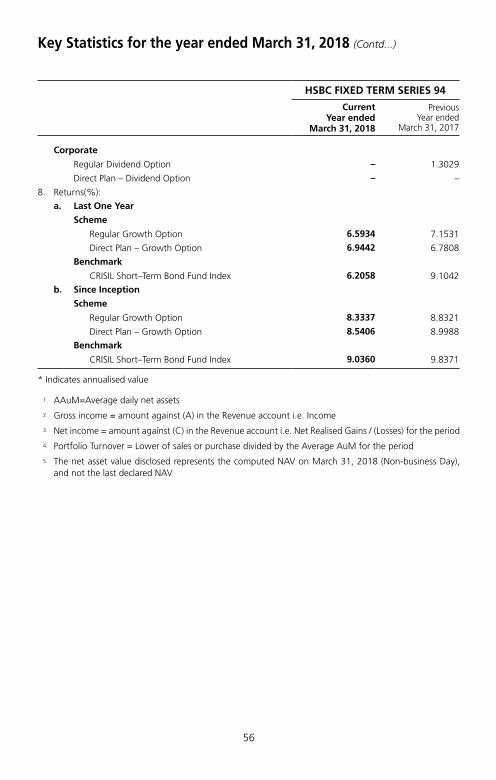
56
HSBC FIXED TERM SERIES 94
Current Year ended
March 31, 2018
Previous Year ended
March 31, 2017
Corporate
Regular Dividend Option – 1.3029
Direct Plan – Dividend Option – –
8. Returns(%):
a. Last One Year
Scheme
Regular Growth Option 6.5934 7.1531
Direct Plan – Growth Option 6.9442 6.7808
Benchmark
CRISIL Short–Term Bond Fund Index 6.2058 9.1042
b. Since Inception
Scheme
Regular Growth Option 8.3337 8.8321
Direct Plan – Growth Option 8.5406 8.9988
Benchmark
CRISIL Short–Term Bond Fund Index 9.0360 9.8371
* Indicates annualised value
1. AAuM=Average daily net assets
2. Gross income = amount against (A) in the Revenue account i.e. Income
3. Net income = amount against (C) in the Revenue account i.e. Net Realised Gains / (Losses) for the period
4. Portfolio Turnover = Lower of sales or purchase divided by the Average AuM for the period
5. The net asset value disclosed represents the computed NAV on March 31, 2018 (Non-business Day), and not the last declared NAV
Key Statistics for the year ended March 31, 2018 (Contd...)

57
Key Statistics for the year ended March 31, 2018 (Contd...)
HSBC FIXED TERM SERIES 96
Current Year ended
March 31, 2018
Previous Year ended
March 31, 2017
1. NAV per unit (Rs.):
Open
Growth Option 13.4961 12.6057
Dividend Option – 11.4158
Direct Plan – Growth Option 13.6860 12.7185
Direct Plan – Dividend Option – –
High
Growth Option 14.3425 13.4961
Dividend Option – 11.8969
Direct Plan – Growth Option 14.5935 13.6860
Direct Plan – Dividend Option – –
Low
Growth Option 13.5069 12.6220
Dividend Option – 11.4306
Direct Plan – Growth Option 13.6979 12.7355
Direct Plan – Dividend Option – –
End
Growth Option 14.3493 13.4961
Dividend Option – –
Direct Plan – Growth Option 14.6008 13.6860
Direct Plan – Dividend Option – –
2. Closing Assets Under Management (Rs. in Lakhs)
End 138 130
Average (AAuM)1 134 3,101
3. Gross income as % of AAuM2 * 7.39% 8.03%
4. Expense Ratio:
a. Total Expense as % of AAuM (including service tax / GST on Management fees) (planwise) *
Regular Growth Option 0.53% 0.51%
Direct Plan – Growth Option 0.19% 0.11%
b. Management Fee as % of AAuM (planwise) *
Regular Growth Option 0.16% 0.23%
Direct Plan – Growth Option 0.16% 0.23%
5. Net Income as a percentage of AAuM3 * 6.87% 7.57%
6. Portfolio turnover ratio4 – –
7. Total Dividend per unit distributed during the period (planwise)
Retail
Regular Dividend Option – 1.3699
Direct Plan – Dividend Option – –

58
HSBC FIXED TERM SERIES 96
Current Year ended
March 31, 2018
Previous Year ended
March 31, 2017
Corporate
Regular Dividend Option – 1.2692
Direct Plan – Dividend Option – –
8. Returns(%):
a. Last One Year
Scheme
Regular Growth Option 6.3707 7.0635
Direct Plan – Growth Option 6.7333 7.6070
Benchmark
CRISIL Short–Term Bond Fund Index 6.2058 9.1042
b. Since Inception
Scheme
Regular Growth Option 8.2166 8.7473
Direct Plan – Growth Option 8.6285 9.1731
Benchmark
CRISIL Short–Term Bond Fund Index 8.9320 9.7119
* Indicates annualised value
1. AAuM=Average daily net assets2. Gross income = amount against (A) in the Revenue account i.e. Income3. Net income = amount against (C) in the Revenue account i.e. Net Realised Gains / (Losses) for the period4. Portfolio Turnover = Lower of sales or purchase divided by the Average AuM for the period5. The net asset value disclosed represents the computed NAV on March 31, 2018 (Non-business Day),
and not the last declared NAV
Key Statistics for the year ended March 31, 2018 (Contd...)

59
Key Statistics for the year ended March 31, 2018 (Contd...)
HSBC FIXED TERM SERIES 98
Current Year ended
March 31, 2018
Previous Year ended
March 31, 2017
1. NAV per unit (Rs.):
Open
Growth Option 13.1478 12.2838
Dividend Option – 11.2782
Direct Plan – Growth Option – 12.3863
Direct Plan – Dividend Option – –
High
Growth Option 13.9836 13.1478
Dividend Option – 11.7481
Direct Plan – Growth Option – 12.9318
Direct Plan – Dividend Option – –
Low
Growth Option 13.1572 12.2998
Dividend Option – 11.2929
Direct Plan – Growth Option – 12.4030
Direct Plan – Dividend Option – –
End
Growth Option 13.9902 13.1478
Dividend Option – –
Direct Plan – Growth Option – –
Direct Plan – Dividend Option – –
2. Closing Assets Under Management (Rs. in Lakhs)
End 439 413
Average (AAuM)1 426 3,521
3. Gross income as % of AAuM2 7.59% 7.72%
4. Expense Ratio:
a. Total Expense as % of AAuM (including service tax / GST on Management fees) (planwise) *
Regular Growth Option 0.53% 0.51%
Direct Plan – Growth Option NA 0.11%
b. Management Fee as % of AAuM (planwise) *
Regular Growth Option 0.19% 0.31%
Direct Plan – Growth Option NA 0.31%
5. Net Income as a percentage of AAuM3 * 7.06% 7.20%
6. Portfolio turnover ratio4 – –
7. Total Dividend per unit distributed during the period (planwise)
Retail
Regular Dividend Option – 1.2625
Direct Plan – Dividend Option – –
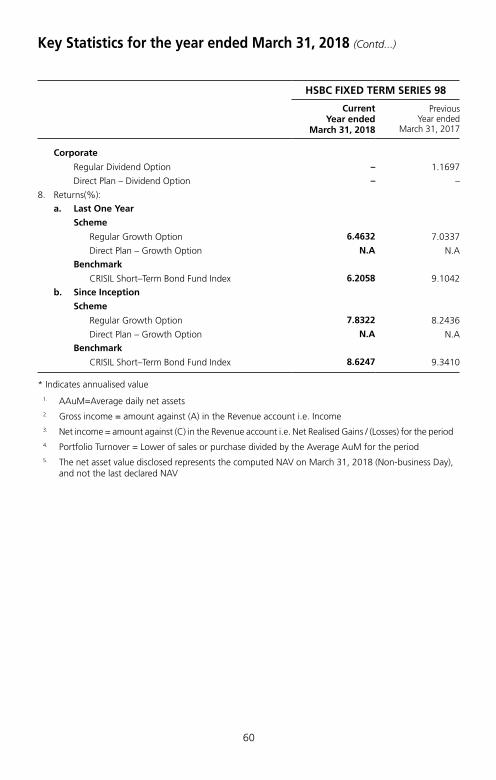
60
HSBC FIXED TERM SERIES 98
Current Year ended
March 31, 2018
Previous Year ended
March 31, 2017
Corporate
Regular Dividend Option – 1.1697
Direct Plan – Dividend Option – –
8. Returns(%):
a. Last One Year
Scheme
Regular Growth Option 6.4632 7.0337
Direct Plan – Growth Option N.A N.A
Benchmark
CRISIL Short–Term Bond Fund Index 6.2058 9.1042
b. Since Inception
Scheme
Regular Growth Option 7.8322 8.2436
Direct Plan – Growth Option N.A N.A
Benchmark
CRISIL Short–Term Bond Fund Index 8.6247 9.3410
* Indicates annualised value
1. AAuM=Average daily net assets2. Gross income = amount against (A) in the Revenue account i.e. Income3. Net income = amount against (C) in the Revenue account i.e. Net Realised Gains / (Losses) for the period4. Portfolio Turnover = Lower of sales or purchase divided by the Average AuM for the period5. The net asset value disclosed represents the computed NAV on March 31, 2018 (Non-business Day),
and not the last declared NAV
Key Statistics for the year ended March 31, 2018 (Contd...)

61
Key Statistics for the year ended March 31, 2018 (Contd...)
HSBC FIXED TERM SERIES 125
Current Year ended
March 31, 2018
Previous Year ended
March 31, 2017
1. NAV per unit (Rs.):
Open
Growth Option 10.9106 –
Dividend Option 10.9106 –
Direct Plan – Growth Option 10.9478 –
Direct Plan – Dividend Option – –
High
Growth Option 11.6391 10.9106
Dividend Option 11.6391 10.9106
Direct Plan – Growth Option 11.7183 10.9478
Direct Plan – Dividend Option – –
Low
Growth Option 10.9146 10.0263
Dividend Option 10.9146 10.0263
Direct Plan – Growth Option 10.9526 10.0267
Direct Plan – Dividend Option – –
End
Growth Option 11.6456 10.9106
Dividend Option 11.6456 10.9106
Direct Plan – Growth Option 11.7251 10.9478
Direct Plan – Dividend Option – –
2. Closing Assets Under Management (Rs. in Lakhs)
End 13,809 12,936
Average (AAuM)1 13,389 12,449
3. Gross income as % of AAuM2 * 8.13% 4.17%
4. Expense Ratio:
a. Total Expense as % of AAuM (including service tax / GST on Management fees) (planwise) *
Regular Growth Option 0.53% 0.53%
Direct Plan – Growth Option 0.19% 0.19%
b. Management Fee as % of AAuM (planwise) *
Regular Growth Option 0.20% 0.25%
Direct Plan – Growth Option 0.20% 0.25%
5. Net Income as a percentage of AAuM3 * 7.61% 7.73%
6. Portfolio turnover ratio4 – –
7. Total Dividend per unit distributed during the period (planwise)
Retail
Regular Dividend Option – –
Direct Plan - Dividend Option – –

62
HSBC FIXED TERM SERIES 125
Current Year ended
March 31, 2018
Previous Year ended
March 31, 2017
Corporate
Regular Dividend Option – –
Direct Plan - Dividend Option – –
8. Returns(%):
a. Last One Year
Scheme
Regular Growth Option 6.7759 N.A
Direct Plan – Growth Option 7.1398 N.A
Benchmark
CRISIL Composite Bond Fund Index 5.1666 N.A
b. Since Inception
Scheme
Regular Growth Option 7.9185 9.1060
Direct Plan – Growth Option 8.2865 9.4780
Benchmark
CRISIL Composite Bond Fund Index 8.0651 11.0896
* Indicates annualised value
1. AAuM=Average daily net assets2. Gross income = amount against (A) in the Revenue account i.e. Income3. Net income = amount against (C) in the Revenue account i.e. Net Realised Gains / (Losses) for the period4. Portfolio Turnover = Lower of sales or purchase divided by the Average AuM for the period5. The net asset value disclosed represents the computed NAV on March 31, 2018 (Non-business Day),
and not the last declared NAV
Key Statistics for the year ended March 31, 2018 (Contd...)

63
Key Statistics for the year ended March 31, 2018 (Contd...)
HSBC FIXED TERM SERIES 126
Current Year ended
March 31, 2018
Previous Year ended
March 31, 2017
1. NAV per unit (Rs.):
Open
Growth Option 10.7644 N.A.
Dividend Option 10.7644 N.A.
Direct Plan – Growth Option 10.7962 N.A.
Direct Plan – Dividend Option – N.A.
High
Growth Option 11.4559 10.7644
Dividend Option 11.4559 10.7644
Direct Plan – Growth Option 11.5285 10.7962
Direct Plan – Dividend Option – –
Low
Growth Option 10.7685 9.9994
Dividend Option 10.7685 9.9994
Direct Plan – Growth Option 10.8009 10.0000
Direct Plan – Dividend Option – –
End
Growth Option 11.4623 10.7644
Dividend Option 11.4623 10.7644
Direct Plan – Growth Option 11.5353 10.7962
Direct Plan – Dividend Option – –
2. Closing Assets Under Management (Rs. in Lakhs)
End 3,556 3,339
Average (AAuM)1 3,453 3,235
3. Gross income as % of AAuM2 * 7.86% 6.93%
4. Expense Ratio:
a. Total Expense as % of AAuM (including service tax / GST on Management fees) (planwise) *
Regular Growth Option 0.53% 0.53%
Direct Plan – Growth Option 0.19% 0.19%
b. Management Fee as % of AAuM (planwise) *
Regular Growth Option 0.18% 0.21%
Direct Plan – Growth Option 0.18% 0.21%
5. Net Income as a percentage of AAuM3 * 7.06% 6.47%
6. Portfolio turnover ratio4 – –
7. Total Dividend per unit distributed during the period (planwise)
Retail
Regular Dividend Option – –
Direct Plan - Dividend Option – –

64
HSBC FIXED TERM SERIES 126
Current Year ended
March 31, 2018
Previous Year ended
March 31, 2017
Corporate
Regular Dividend Option – –
Direct Plan - Dividend Option – –
8. Returns(%):
a. Last One Year
Scheme
Regular Growth Option 6.5515 N.A
Direct Plan – Growth Option 6.9146 N.A
Benchmark
CRISIL Composite Bond Fund Index 5.1666 N.A
b. Since Inception
Scheme
Regular Growth Option 7.6032 7.6440
Direct Plan – Growth Option 7.9703 7.9620
Benchmark
CRISIL Composite Bond Fund Index 7.9450 9.6890
* Indicates annualised value
1. AAuM=Average daily net assets2. Gross income = amount against (A) in the Revenue account i.e. Income3. Net income = amount against (C) in the Revenue account i.e. Net Realised Gains / (Losses) for the period4. Portfolio Turnover = Lower of sales or purchase divided by the Average AuM for the period5. The net asset value disclosed represents the computed NAV on March 31, 2018 (Non-business Day),
and not the last declared NAV
Key Statistics for the year ended March 31, 2018 (Contd...)
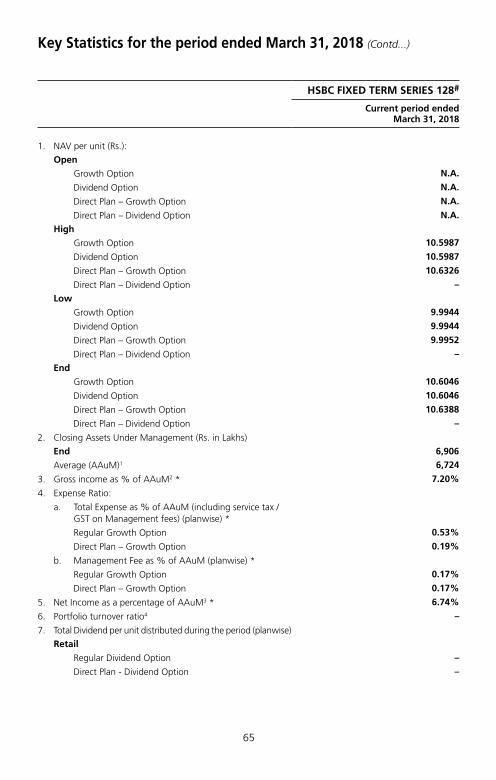
65
Key Statistics for the period ended March 31, 2018 (Contd...)
HSBC FIXED TERM SERIES 128#
Current period ended March 31, 2018
1. NAV per unit (Rs.):
Open
Growth Option N.A.
Dividend Option N.A.
Direct Plan – Growth Option N.A.
Direct Plan – Dividend Option N.A.
High
Growth Option 10.5987
Dividend Option 10.5987
Direct Plan – Growth Option 10.6326
Direct Plan – Dividend Option –
Low
Growth Option 9.9944
Dividend Option 9.9944
Direct Plan – Growth Option 9.9952
Direct Plan – Dividend Option –
End
Growth Option 10.6046
Dividend Option 10.6046
Direct Plan – Growth Option 10.6388
Direct Plan – Dividend Option –
2. Closing Assets Under Management (Rs. in Lakhs)
End 6,906
Average (AAuM)1 6,724
3. Gross income as % of AAuM2 * 7.20%
4. Expense Ratio:
a. Total Expense as % of AAuM (including service tax / GST on Management fees) (planwise) *
Regular Growth Option 0.53%
Direct Plan – Growth Option 0.19%
b. Management Fee as % of AAuM (planwise) *
Regular Growth Option 0.17%
Direct Plan – Growth Option 0.17%
5. Net Income as a percentage of AAuM3 * 6.74%
6. Portfolio turnover ratio4 –
7. Total Dividend per unit distributed during the period (planwise)
Retail
Regular Dividend Option –
Direct Plan - Dividend Option –

66
HSBC FIXED TERM SERIES 128#
Current period ended March 31, 2018
Corporate
Regular Dividend Option –
Direct Plan - Dividend Option –
8. Returns(%):
a. Last One Year Scheme
Regular Growth Option N.A
Direct Plan – Growth Option N.A
Benchmark
CRISIL Composite Bond Fund Index N.A
b. Since Inception Scheme
Regular Growth Option 5.9870
Direct Plan – Growth Option 6.3260
Benchmark
CRISIL Composite Bond Fund Index 4.8184
# Scheme launched during the current financial year
* Indicates annualised value
1. AAuM=Average daily net assets2. Gross income = amount against (A) in the Revenue account i.e. Income3. Net income = amount against (C) in the Revenue account i.e. Net Realised Gains / (Losses) for the period4. Portfolio Turnover = Lower of sales or purchase divided by the Average AuM for the period5. The net asset value disclosed represents the computed NAV on March 31, 2018 (Non-business Day),
and not the last declared NAV
Key Statistics for the period ended March 31, 2018 (Contd...)

67
Key Statistics for the period ended March 31, 2018 (Contd...)
HSBC FIXED TERM SERIES 129#
Current period ended March 31, 2018
1. NAV per unit (Rs.):
Open
Growth Option N.A.
Dividend Option N.A.
Direct Plan – Growth Option N.A.
Direct Plan – Dividend Option N.A.
High
Growth Option 10.4890
Dividend Option 10.4890
Direct Plan – Growth Option 10.5102
Direct Plan – Dividend Option –
Low
Growth Option 10.0213
Dividend Option 10.0213
Direct Plan – Growth Option 10.0217
Direct Plan – Dividend Option –
End
Growth Option 10.4951
Dividend Option 10.4951
Direct Plan – Growth Option 10.5165
Direct Plan – Dividend Option –
2. Closing Assets Under Management (Rs. in Lakhs)
End 5,259
Average (AAuM)1 5,145
3. Gross income as % of AAuM2 * 6.43%
4. Expense Ratio:
a. Total Expense as % of AAuM (including service tax / GST on Management fees) (planwise) *
Regular Growth Option 0.37%
Direct Plan – Growth Option 0.12%
b. Management Fee as % of AAuM (planwise) *
Regular Growth Option 0.12%
Direct Plan – Growth Option 0.12%
5. Net Income as a percentage of AAuM3 * 6.15%
6. Portfolio turnover ratio4 –
7. Total Dividend per unit distributed during the period (planwise)
Retail
Regular Dividend Option –
Direct Plan - Dividend option –

68
Key Statistics for the period ended March 31, 2018 (Contd...)
HSBC FIXED TERM SERIES 129#
Current period ended March 31, 2018
Corporate
Regular Dividend Option –
Direct Plan - Dividend option –
8. Returns(%):
a. Last One Year Scheme
Regular Growth Option N.A
Direct Plan – Growth Option N.A
Benchmark
CRISIL Composite Bond Fund Index N.A
b. Since Inception Scheme
Regular Growth Option 4.8900
Direct Plan – Growth Option 5.1020
Benchmark
CRISIL Composite Bond Fund Index 2.8277
# Scheme launched during the current financial year
* Indicates annualised value
1. AAuM=Average daily net assets2. Gross income = amount against (A) in the Revenue account i.e. Income3. Net income = amount against (C) in the Revenue account i.e. Net Realised Gains / (Losses) for the period4. Portfolio Turnover = Lower of sales or purchase divided by the Average AuM for the period5. The net asset value disclosed represents the computed NAV on March 31, 2018 (Non-business Day),
and not the last declared NAV

69
Key Statistics for the period ended March 31, 2018 (Contd...)
HSBC FIXED TERM SERIES 130#
Current period ended March 31, 2018
1. NAV per unit (Rs.):
Open
Growth Option N.A.
Dividend Option N.A.
Direct Plan – Growth Option N.A.
Direct Plan – Dividend Option N.A.
High
Growth Option 10.1696
Dividend Option 10.1696
Direct Plan – Growth Option 10.1750
Direct Plan – Dividend Option –
Low
Growth Option 9.9817
Dividend Option 9.9817
Direct Plan – Growth Option 9.9820
Direct Plan – Dividend Option –
End
Growth Option 10.1753
Dividend Option 10.1753
Direct Plan – Growth Option 10.1809
Direct Plan – Dividend Option –
2. Closing Assets Under Management (Rs. in Lakhs)
End 2,337
Average (AAuM)1 2,308
3. Gross income as % of AAuM2 * 2.02%
4. Expense Ratio:
a. Total Expense as % of AAuM (including service tax / GST on Management fees) (planwise) *
Regular Growth Option 0.32%
Direct Plan – Growth Option 0.12%
b. Management Fee as % of AAuM (planwise) *
Regular Growth Option 0.10%
Direct Plan – Growth Option 0.10%
5. Net Income as a percentage of AAuM3 * 1.95%
6. Portfolio turnover ratio4 –
7. Total Dividend per unit distributed during the period (planwise)
Retail
Regular Dividend Option –
Direct Plan - Dividend option –

70
Key Statistics for the period ended March 31, 2018 (Contd...)
HSBC FIXED TERM SERIES 130#
Current period ended March 31, 2018
Corporate
Regular Dividend Option –
Direct Plan - Dividend option –
8. Returns(%):
a. Last One Year Scheme
Regular Growth Option N.A
Direct Plan – Growth Option N.A
Benchmark
CRISIL Composite Bond Fund Index N.A
b. Since Inception Scheme
Regular Growth Option 1.6960
Direct Plan – Growth Option 1.7500
Benchmark
CRISIL Composite Bond Fund Index 1.0133
# Scheme launched during the current financial year
* Indicates annualised value
1. AAuM=Average daily net assets2. Gross income = amount against (A) in the Revenue account i.e. Income3. Net income = amount against (C) in the Revenue account i.e. Net Realised Gains / (Losses) for the period4. Portfolio Turnover = Lower of sales or purchase divided by the Average AuM for the period5. The net asset value disclosed represents the computed NAV on March 31, 2018 (Non-business Day),
and not the last declared NAV

71
Key Statistics for the period ended March 31, 2018 (Contd...)
HSBC FIXED TERM SERIES 131#
Current period ended March 31, 2018
1. NAV per unit (Rs.):
Open
Growth Option N.A.
Dividend Option N.A.
Direct Plan – Growth Option N.A.
Direct Plan – Dividend Option N.A.
High
Growth Option 10.0345
Dividend Option 10.0345
Direct Plan – Growth Option 10.0350
Direct Plan – Dividend Option –
Low
Growth Option 10.0010
Dividend Option 10.0010
Direct Plan – Growth Option 10.0015
Direct Plan – Dividend Option –
End
Growth Option 10.0402
Dividend Option 10.0402
Direct Plan – Growth Option 10.0409
Direct Plan – Dividend Option –
2. Closing Assets Under Management (Rs. in Lakhs)
End 4,047
Average (AAuM)1 4,038
3. Gross income as % of AAuM2 * 0.22%
4. Expense Ratio:
a. Total Expense as % of AAuM (including service tax / GST on Management fees) (planwise) *
Regular Growth Option 0.30%
Direct Plan – Growth Option 0.05%
b. Management Fee as % of AAuM (planwise) *
Regular Growth Option 0.00%
Direct Plan – Growth Option 0.00%
5. Net Income as a percentage of AAuM3 * 0.21%
6. Portfolio turnover ratio4 –
7. Total Dividend per unit distributed during the period (planwise)
Retail
Regular Dividend Option –
Direct Plan - Dividend option –

72
HSBC FIXED TERM SERIES 131#
Current period ended March 31, 2018
Corporate
Regular Dividend Option –
Direct Plan - Dividend option –
8. Returns(%):
a. Last One Year Scheme
Regular Growth Option N.A
Direct Plan – Growth Option N.A
Benchmark
CRISIL Composite Bond Fund Index N.A
b. Since Inception Scheme
Regular Growth Option 0.3450
Direct Plan – Growth Option 0.3500
Benchmark
CRISIL Composite Bond Fund Index 1.0777
# Scheme launched during the current financial year
* Indicates annualised value
1. AAuM=Average daily net assets2. Gross income = amount against (A) in the Revenue account i.e. Income3. Net income = amount against (C) in the Revenue account i.e. Net Realised Gains / (Losses) for the period4. Portfolio Turnover = Lower of sales or purchase divided by the Average AuM for the period5. The net asset value disclosed represents the computed NAV on March 31, 2018 (Non-business Day),
and not the last declared NAV
Key Statistics for the period ended March 31, 2018 (Contd...)

73
Key Statistics for the period ended March 31, 2018 (Contd...)
HSBC FIXED TERM SERIES 132#
Current period ended March 31, 2018
1. NAV per unit (Rs.):
Open
Growth Option N.A.
Dividend Option N.A.
Direct Plan – Growth Option N.A.
Direct Plan – Dividend Option N.A.
High
Growth Option 10.0795
Dividend Option 10.0795
Direct Plan – Growth Option 10.0805
Direct Plan – Dividend Option 10.0805
Low
Growth Option 10.0361
Dividend Option 10.0361
Direct Plan – Growth Option 10.0367
Direct Plan – Dividend Option 10.0367
End
Growth Option 10.0857
Dividend Option 10.0857
Direct Plan – Growth Option 10.0868
Direct Plan – Dividend Option 10.0868
2. Closing Assets Under Management (Rs. in Lakhs)
End 12,428
Average (AAuM)1 12,379
3. Gross income as % of AAuM2 * 0.52%
4. Expense Ratio:
a. Total Expense as % of AAuM (including service tax / GST on Management fees) (planwise) *
Regular Growth Option 0.32%
Direct Plan – Growth Option 0.12%
b. Management Fee as % of AAuM (planwise) *
Regular Growth Option 0.10%
Direct Plan – Growth Option 0.10%
5. Net Income as a percentage of AAuM3 * 0.50%
6. Portfolio turnover ratio4 –
7. Total Dividend per unit distributed during the period (planwise)
Retail
Regular Dividend Option –
Direct Plan - Dividend Option –

74
HSBC FIXED TERM SERIES 132#
Current period ended March 31, 2018
Corporate
Regular Dividend Option –
Direct Plan - Dividend Option –
8. Returns(%):
a. Last One Year Scheme
Regular Growth Option N.A
Direct Plan – Growth Option N.A
Benchmark
CRISIL Composite Bond Fund Index N.A
b. Since Inception Scheme
Regular Growth Option 0.7950
Direct Plan – Growth Option 0.8050
Benchmark
CRISIL Composite Bond Fund Index 1.5392
# Scheme launched during the current financial year
* Indicates annualised value
1. AAuM=Average daily net assets2. Gross income = amount against (A) in the Revenue account i.e. Income3. Net income = amount against (C) in the Revenue account i.e. Net Realised Gains / (Losses) for the period4. Portfolio Turnover = Lower of sales or purchase divided by the Average AuM for the period5. The net asset value disclosed represents the computed NAV on March 31, 2018 (Non-business Day),
and not the last declared NAV
Key Statistics for the period ended March 31, 2018 (Contd...)

75
Key Statistics for the period ended March 31, 2018 (Contd...)
HSBC FIXED TERM SERIES 133#
Current period ended March 31, 2018
1. NAV per unit (Rs.):
Open
Growth Option N.A.
Dividend Option N.A.
Direct Plan – Growth Option N.A.
Direct Plan – Dividend Option N.A.
High
Growth Option 10.0315
Dividend Option 10.0315
Direct Plan – Growth Option 10.0318
Direct Plan – Dividend Option 10.0318
Low
Growth Option 10.0114
Dividend Option 10.0114
Direct Plan – Growth Option 10.0115
Direct Plan – Dividend Option 10.0115
End
Growth Option 10.0315
Dividend Option 10.0315
Direct Plan – Growth Option 10.0318
Direct Plan – Dividend Option 10.0318
2. Closing Assets Under Management (Rs. in Lakhs)
End 9,670
Average (AAuM)1 9,664
3. Gross income as % of AAuM2 * 0.13%
4. Expense Ratio:
a. Total Expense as % of AAuM (including service tax / GST on Management fees) (planwise) *
Regular Growth Option 0.32%
Direct Plan – Growth Option 0.12%
b. Management Fee as % of AAuM (planwise) *
Regular Growth Option 0.10%
Direct Plan – Growth Option 0.10%
5. Net Income as a percentage of AAuM3 * 0.12%
6. Portfolio turnover ratio4 –
7. Total Dividend per unit distributed during the period (planwise)
Retail
Regular Dividend Option –
Direct Plan - Dividend Option –
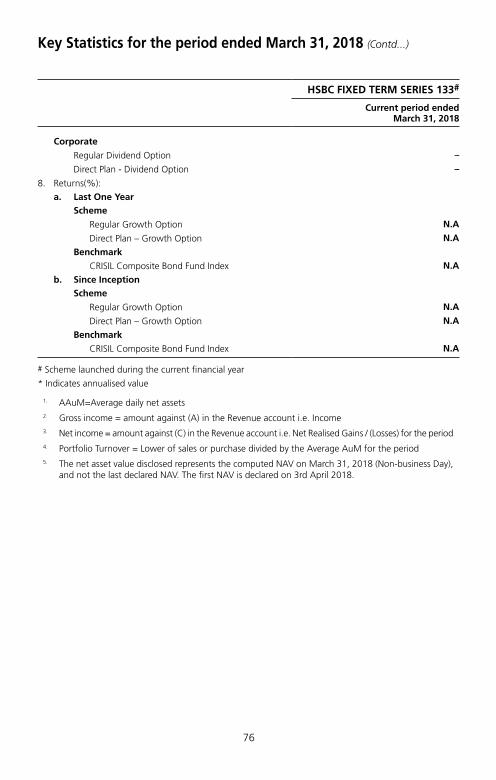
76
HSBC FIXED TERM SERIES 133#
Current period ended March 31, 2018
Corporate
Regular Dividend Option –
Direct Plan - Dividend Option –
8. Returns(%):
a. Last One Year Scheme
Regular Growth Option N.A
Direct Plan – Growth Option N.A
Benchmark
CRISIL Composite Bond Fund Index N.A
b. Since Inception Scheme
Regular Growth Option N.A
Direct Plan – Growth Option N.A
Benchmark
CRISIL Composite Bond Fund Index N.A
# Scheme launched during the current financial year
* Indicates annualised value
1. AAuM=Average daily net assets2. Gross income = amount against (A) in the Revenue account i.e. Income3. Net income = amount against (C) in the Revenue account i.e. Net Realised Gains / (Losses) for the period4. Portfolio Turnover = Lower of sales or purchase divided by the Average AuM for the period5. The net asset value disclosed represents the computed NAV on March 31, 2018 (Non-business Day),
and not the last declared NAV. The first NAV is declared on 3rd April 2018.
Key Statistics for the period ended March 31, 2018 (Contd...)

77
Notes to Accounts – Annexure ITo the Abridged Balance Sheet and Revenue Account for the year ended March 31, 2018
HSBC FIXED TERM SERIES 94
1 Investments: –
1.1. It is confirmed that investments of the Scheme are registered in the name of the Trustees for the benefit of the Scheme’s unitholders.
1.2. Open Positions of derivatives as of year ended March 31, 2018 and March 31, 2017 are NIL
1.3. Investments in Associates and Group Companies as of period ended March 31, 2018 and March 31, 2017 are NIL.
1.4. Open positions of Securities Borrowed and / or Lent by the Scheme as of the years ended March 31, 2018 and March 31, 2017 are NIL.
1.5. NPAs as at years ended March 31, 2018 and March 31, 2017 are NIL.
1.6. Aggregate Unrealised Gain / Loss as at the end of the financial period and percentage to net assets.
Security Category Amount (Rs.)
Percentage to Net Assets
Amount (Rs.)
Percentage to Net Assets
2018 2017
Non Convertible Debentures and Bonds Listed / Awaiting Listing
– Appreciation – – 18,227 0.01
– Depreciation 1,737,417 1.28 498,037.0000 0.39
Certificates of Deposit/Commercial Paper
– Appreciation 5,629 ~0.00 – –
– Depreciation – – – –
~ Less than 0.01
1.7. The aggregate value of investment securities (excluding CBLO and Reverse Repos) purchased and sold (including matured) during the financial year 2017-2018 (excluding accretion of discount) is Rs. 9,831,160 and Rs. 13,000,000 respectively being 7.47% and 9.87% of the average daily net assets.
The aggregate value of investment securities (excluding CBLO and Reverse Repos) purchased and sold (including matured) during the financial year 2016-2017 (excluding accretion of discount) is Rs. 124,046,481 and Rs. 950,789,335 respectively being 19.52% and 149.59% of the average daily net assets.
1.8. Non-Traded securities in the portfolio: Aggregate Value of Equity, Debt & Money Market Instruments and percentage to net assets is as under :
Security Category Fair Value (Rupees)
% to Net Assets
Fair Value (Rupees)
% to Net Assets
2018 2017
Debt Instruments 101,242,195 74.59 115,774,479.00 90.86
Money Market Insruments 9,860,390 7.26 – –
Total 111,102,585 81.85 115,774,479.00 90.86
2 Disclosure Under Regulation 25(8) of the Securities and Exchange Board of India (Mutual Funds) Regulations, 1996 as amended
Commission paid to Sponsor/AMC and its associates/related parties/group companies is NIL (Previous year also NIL).

78
Notes to Accounts – Annexure I (Contd...)To the Abridged Balance Sheet and Revenue Account for the year ended March 31, 2018
Brokerage paid to Sponsor/AMC and its associates/related parties/group companies is NIL (Previous year also NIL).
(i) Any underwriting obligations undertaken by the schemes of the mutual funds with respect to issue of securities associate companies - NIL (Previous year also NIL).
(ii) Devolvement - NIL (Previous year also NIL).
(iii) Subscription by the schemes in the issues lead managed by associate companies - NIL (Previous year also NIL).
(iv) Subscription to any issue of equity or debt on private placement basis where the sponsor or its associate companies have acted as arranger or manager - NIL (Previous year also NIL).
3 None of the Investors held more than 25% of the total net assets of the Scheme at the year ended March 31, 2018.
4 Unit Capital movement during the years ended March 31, 2018 and March 31, 2017.
Description 2017 – 2018
Opening Units Subscription Redemption Closing Units Face Value per unit (Rupees)
Growth Option 9,383,206.776 – – 9,383,206.776 10
Dividend Option 0.000 – – 0.000 10
Direct Plan – Growth Option
1,000.000 – – 1,000.000 10
Description 2016 – 2017
Opening Units Subscription Redemption Closing Units Face Value per unit (Rupees)
Growth Option 70,871,574.397 – 61,488,367.621 9,383,206.776 10
Dividend Option 16,500.000 – 16,500.000 0.000 10
Direct Plan – Growth Option
7,445,500.471 – 7,444,500.471 1,000.000 10
5 No contingent liabilities for the years ended March 31, 2018 and March 31, 2017.
6 Expenses other than Management Fees are Inclusive of GST / Service Tax where applicable.
7 Investor Education Awareness
In view of the AMFI Best Practices Guidelines Circular No. 56/2015-16, the IEF (Investor Education Fund) accrual is set aside in a separate bank account and the consolidated balance across all schemes as on March 31, 2018. The break-up of which is as under:
Particulars March 31, 2018 March 31, 2017
Amount (Rs. in Lakhs) Amount (Rs. in Lakhs)
Opening Balance 44.00 –
Add: Accrual during the year 219.83 182
Less: Transferred to AMFI 101.10 83
Less: Payable to AMFI (March accrual) 8.81 8
Add: Investment Income for the year 8.28 11

79
Notes to Accounts – Annexure I (Contd...)To the Abridged Balance Sheet and Revenue Account for the year ended March 31, 2018
Less: Spent during the year 43.17 58
Closing Balance 119.02 44
8 Rollover of Schemes:
The HSBC Asset Management (India) Private Limited (AMC) has rolled over the following close ended schemes post receipt of no-objection from SEBI. The details of rollover are as under:
Scheme Name Existing Maturity
date
Revised Maturity
date
Period of Rollover
Units on Maturity date
Units Rolled over
HSBC Fixed Term Series 94
26-Oct-16 16-Jul-18 628 days 78,333,574.868 9,384,206.776
A notice providing the rationale, terms and features of rollover of the aforesaid schemes have been published in the newspapers and is also available on the website of the AMC. All the unit holders who have not consented for the rollover in writing have been redeemed and payouts have been made.
Note: The Rollover of schemes resulted in material change in unit capital, investment activities by AMC etc.
Hence previous figures are strictly not comparable.
9 The Annual Accounts of the Schemes prepared in accordance with the accounting policies and standards specified in the Ninth Schedule of The Securities and Exchange Board of India (Mutual Funds) Regulations, 1996 has been approved by the Board of Directors of HSBC Asset Management (India) Private Limited and The Board of Trustees of HSBC Mutual Fund at their meetings held on July 16, 2018 and July 17, 2018 respectively. The audit report attached herewith refers to the said Annual Accounts. The aforesaid abridged accounts are an extract of the Annual Accounts and are prepared in accordance with SEBI Circular No. IMD/Cir8/132968/2008 dated July 24, 2008.

80
Notes to Accounts – Annexure I (Contd...)To the Abridged Balance Sheet and Revenue Account for the year ended March 31, 2018
HSBC FIXED TERM SERIES 96
1 Investments: –
1.1. It is confirmed that investments of the Scheme are registered in the name of the Trustees for the benefit of the Scheme’s unitholders.
1.2. Open Positions of derivatives as of year ended March 31, 2018 and March 31, 2017 are NIL
1.3. Investments in Associates and Group Companies as of period ended March 31, 2018 and March 31, 2017 are NIL.
1.4. Open positions of Securities Borrowed and / or Lent by the Scheme as of the years ended March 31, 2018 and March 31, 2017 are NIL.
1.5. NPAs as at years ended March 31, 2018 and March 31, 2017 are NIL.
1.6. Aggregate Unrealised Gain / Loss as at the end of the financial period and percentage to net assets.
Security Category Amount (Rs.)
Percentage to Net Assets
Amount (Rs.)
Percentage to Net Assets
2018 2017
Non Convertible Debentures and Bonds Listed / Awaiting Listing
– Appreciation – – 1,657 0.01
– Depreciation 134,539 0.97 38,547 0.2967
1.7. The aggregate value of investment securities (excluding CBLO and Reverse Repos) purchased and sold (including matured) during the financial year 2017-2018 (excluding accretion of discount) is Nil and Rs. 1,000,000 respectively being Nil and 7.46% of the average daily net assets.
The aggregate value of investment securities (excluding CBLO and Reverse Repos) purchased and sold (including matured) during the financial year 2016-2017 (excluding accretion of discount) is Rs. 34,499,382 and Rs. 500,515,225 respectively being 11.12% and 161.40% of the average daily net assets.
1.8. Non -Traded securities in the portfolio: Aggregate Value of Equity, Debt & Money Market Instruments and percentages to net assets are as under :
Security Category Amount (Rupees)
Percentage to Net Assets
Amount (Rupees)
Percentage to Net Assets
2018 2017
Debt Instruments 8,019,090 58.05 9,137,868 70.34
Total 8,019,090 58.05 9,137,868 70.34
2 Disclosure Under Regulation 25(8) of the Securities and Exchange Board of India (Mutual Funds) Regulations, 1996 as amended
Commission paid to Sponsor/AMC and its associates/related parties/group companies
Name of Sponsor/AMC and its associates/related parties/group companies
Nature of Association / Nature of
Relation
Period Covered
Business Given [Rs. In Crores]
% of Total Business received by the Fund
Commission paid
[Rupees]
% of Total commission paid by the
Fund
The Hongkong and Shanghai Banking Corporation Limited
Associate of Investment Manager
2017–2018 – – 10736.95 92.97

81
Notes to Accounts – Annexure I (Contd...)To the Abridged Balance Sheet and Revenue Account for the year ended March 31, 2018
Name of Sponsor/AMC and its associates/related parties/group companies
Nature of Association / Nature of
Relation
Period Covered
Business Given [Rs. In Crores]
% of Total Business received by the Fund
Commission paid
[Rupees]
% of Total commission paid by the
Fund
The Hongkong and Shanghai Banking Corporation Limited
Associate of Investment Manager
2016–2017 – – 329,132 99.68
Brokerage paid to Sponsor/AMC and its associates/related parties/group companies is NIL (Previous year also NIL).
(i) Any underwriting obligations undertaken by the schemes of the mutual funds with respect to issue of securities associate companies - NIL (Previous year also NIL).
(ii) Devolvement - NIL (Previous year also NIL).
(iii) Subscription by the schemes in the issues lead managed by associate companies - NIL (Previous year also NIL).
(iv) Subscription to any issue of equity or debt on private placement basis where the sponsor or its associate companies have acted as arranger or manager - NIL (Previous year also NIL).
3 None of the Investors held more than 25% of the total net assets of the scheme at the year ended March 31, 2018 and March 31, 2017.
4 Unit Capital movement during the years ended March 31, 2018 and March 31, 2017:
Description 2017 – 2018
Opening Units Subscription Redemption Closing Units Face Value per unit (Rupees)
Growth Option 949,062.515 – – 949,062.515 10
Dividend Option – – – – 10
Direct Plan – Growth Option
13,374.566 – – 13,374.566 10
Description 2016 – 2017
Opening Units Subscription Redemption Closing Units Face Value per unit (Rupees)
Growth Option 36,103,440.433 – 35,154,377.918 949,062.515 10
Dividend Option 8,000.000 – 8,000.000 – 10
Direct Plan – Growth Option
5,113,374.566 – 5,100,000.000 13,374.566 10
5 No contingent liabilities for the years ended March 31, 2018 and March 31, 2017.
6 Expenses other than Management Fees are Inclusive of GST /Service Tax where applicable.
7 Investor Education Awareness
In view of the AMFI Best Practices Guidelines Circular No. 56/2015-16, the IEF (Investor Education Fund) accrual is set aside in a separate bank account and the consolidated balance across all schemes as on March 31, 2018. The break-up of which is as under:

82
Notes to Accounts – Annexure I (Contd...)To the Abridged Balance Sheet and Revenue Account for the year ended March 31, 2018
Particulars March 31, 2018 March 31, 2017
Amount (Rs. in Lakhs) Amount (Rs. in Lakhs)
Opening Balance 44.00 –
Add: Accrual during the year 219.83 182
Less: Transferred to AMFI 101.10 83
Less: Payable to AMFI (March accrual) 8.81 8
Add: Investment Income for the year 8.28 11
Less: Spent during the year 43.17 58
Closing Balance 119.02 44
8 Rollover of Schemes:
The HSBC Asset Management (India) Private Limited (AMC) has rolled over the following close ended schemes post receipt of no-objection from SEBI. The details of rollover are as under:
Scheme Name Existing Maturity
date
Revised Maturity
date
Period of Rollover
Units on Maturity date
Units Rolled over
HSBC Fixed Term Series 96
26-Oct-16 16-Jul-18 628 days 41,224,814.999 962,437.081
A notice providing the rationale, terms and features of rollover of the aforesaid schemes have been published in the newspapers and is also available on the website of the AMC. All the unit holders who have not consented for the rollover in writing have been redeemed and payouts have been made.
Note: The Rollover of schemes resulted in material change in unit capital, investment activities by AMC etc.
Hence previous figures are strictly not comparable.
9 The Annual Accounts of the Schemes prepared in accordance with the accounting policies and standards specified in the Ninth Schedule of The Securities and Exchange Board of India (Mutual Funds) Regulations, 1996 has been approved by the Board of Directors of HSBC Asset Management (India) Private Limited and The Board of Trustees of HSBC Mutual Fund at their meetings held on July 16, 2018 and July 17, 2018 respectively. The audit report attached herewith refers to the said Annual Accounts. The aforesaid abridged accounts are an extract of the Annual Accounts and are prepared in accordance with SEBI Circular No. IMD/Cir8/132968/2008 dated July 24, 2008.

83
Notes to Accounts – Annexure I (Contd...)To the Abridged Balance Sheet and Revenue Account for the year ended March 31, 2018
HSBC FIXED TERM SERIES 98
1 Investments: –
1.1. It is confirmed that investments of the Scheme are registered in the name of the Trustees for the benefit of the Scheme’s unitholders.
1.2. Open Positions of derivatives as of year ended March 31, 2018 and March 31, 2017 are NIL.
1.3. Investments in Associates and Group Companies as of period ended March 31, 2018 and March 31, 2017 are NIL.
1.4. Open positions of Securities Borrowed and / or Lent by the Scheme as of the years ended March 31, 2018 and March 31, 2017 are NIL.
1.5. NPAs as at years ended March 31, 2018 and March 31, 2017 are NIL.
1.6. Aggregate Unrealised Gain / Loss as at the end of the financial period and percentage to net assets:
Security Category Amount (Rs.)
Percentage to Net Assets
Amount (Rs.)
Percentage to Net Assets
2018 2017
Non Convertible Debentures and Bonds Listed / Awaiting Listing
– Appreciation – – 4,971 0.01
– Depreciation 504,344 1.15 145,248 0.3519
Certificates of Deposit/Commercial Paper
– Appreciation 2,814 0.01 – –
– Depreciation – – – –
1.7. The aggregate value of investment securities (excluding CBLO and Reverse Repos) purchased and sold (including matured) during the financial year 2017-2018 (excluding accretion of discount) is Rs. 4,915,580 and Rs.4,000,000 respectively being 11.53% and 9.39% of the average daily net assets.
The aggregate value of investment securities (excluding CBLO and Reverse Repos) purchased and sold (including matured) during the financial year 2016-2017 (excluding accretion of discount) is Rs. 49,243,698 and Rs. 542,933,750 respectively being 13.98% and 154.18% of the average daily net assets.
1.8. Non -Traded securities in the portfolio: Aggregate Value of Equity, Debt & Money Market Instruments and percentages to net assets are as under :
Security Category Amount (Rupees)
Percentage to Net Assets
Amount (Rupees)
Percentage to Net Assets
2018 2017
Debt Instruments 29,070,454 66.19 33,519,037 81.20
Money Market Instruments 4,930,195 11.22 – –
Total 34,000,649 77.41 33,519,037 81.20

84
Notes to Accounts – Annexure I (Contd...)To the Abridged Balance Sheet and Revenue Account for the year ended March 31, 2018
2 Disclosure Under Regulation 25(8) of the Securities and Exchange Board of India (Mutual Funds) Regulations, 1996 as amended
Commission paid to Sponsor/AMC and its associates/related parties/group companies
Name of Sponsor/AMC and its associates/related parties/group companies
Nature of Association / Nature of
Relation
Period Covered
Business Given [Rs. In Crores]
% of Total Business received by the Fund
Commission paid
[Rupees]
% of Total commission paid by the
Fund
The Hongkong and Shanghai Banking Corporation Limited
Associate of Investment Manager
2017–2018 – – 46,138 91.41
Name of Sponsor/AMC and its associates/related parties/group companies
Nature of Association / Nature of
Relation
Period Covered
Business Given [Rs. In Crores]
% of Total Business received by the Fund
Commission paid
[Rupees]
% of Total commission paid by the
Fund
The Hongkong and Shanghai Banking Corporation Limited
Associate of Investment Manager
2016-2017 – – 392,421 98.97
Brokerage paid to Sponsor/AMC and its associates/related parties/group companies is NIL (Previous year also NIL).
(i) Any underwriting obligations undertaken by the schemes of the mutual funds with respect to issue of securities associate companies - NIL (Previous year also NIL).
(ii) Devolvement - NIL (Previous year also NIL).
(iii) Subscription by the schemes in the issues lead managed by associate companies - NIL (Previous year also NIL).
(iv) Subscription to any issue of equity or debt on private placement basis where the sponsor or its associate companies have acted as arranger or manager - NIL (Previous year also NIL).
3 None of the Investors held more than 25% of the total net assets of the scheme at the year ended March 31, 2018 and March 31, 2017.
4 Unit Capital movement during the years ended March 31, 2018 and March 31, 2017:
Description 2017 – 2018
Opening Units Subscription Redemption Closing Units Face Value per unit (Rupees)
Growth Option 3,139,475.932 – – 3,139,475.932 10
Dividend Option – – – – 10
Direct Plan – Growth Option
– – – – 10
Description 2016–2017
Opening Units Subscription Redemption Closing Units Face Value per unit (Rupees)
Growth Option 46,104,973.844 – 42,965,497.912 3,139,475.932 10
Dividend Option 350,000.000 – 350,000.000 – 10
Direct Plan – Growth Option
137,650.888 – 137,650.888 – 10

85
Notes to Accounts – Annexure I (Contd...)To the Abridged Balance Sheet and Revenue Account for the year ended March 31, 2018
5 No contingent liabilities for the years ended March 31, 2018 and March 31, 2017.
6 Expenses other than Management Fees are Inclusive of GST / Service Tax where applicable.
7 Investor Education Awareness
In view of the AMFI Best Practices Guidelines Circular No. 56/2015-16, the IEF (Investor Education Fund) accrual is set aside in a separate bank account and the consolidated balance across all schemes as on March 31, 2018. The break-up of which is as under:
Particulars March 31, 2018 March 31, 2017
Amount (Rs. in Lakhs) Amount (Rs. in Lakhs)
Opening Balance 44.00 –
Add: Accrual during the year 219.83 182
Less: Transferred to AMFI 101.10 83
Less: Payable to AMFI (March accrual) 8.81 8
Add: Investment Income for the year 8.28 11
Less: Spent during the year 43.17 58
Closing Balance 119.02 44
8 Rollover of Schemes:
The HSBC Asset Management (India) Private Limited (AMC) has rolled over the following close ended schemes post receipt of no-objection from SEBI. The details of rollover are as under:
Scheme Name Existing Maturity
date
Revised Maturity
date
Period of Rollover
Units on Maturity date
Units Rolled over
HSBC Fixed Term Series 98
26-Oct-16 16-Jul-18 628 days 46,592,624.732 3,139,475.932
A notice providing the rationale, terms and features of rollover of the aforesaid schemes have been published in the newspapers and is also available on the website of the AMC. All the unit holders who have not consented for the rollover in writing have been redeemed and payouts have been made.
Note: The Rollover of schemes resulted in material change in unit capital, investment activities by AMC etc.
Hence previous figures are strictly not comparable.
9 The Annual Accounts of the Schemes prepared in accordance with the accounting policies and standards specified in the Ninth Schedule of The Securities and Exchange Board of India (Mutual Funds) Regulations, 1996 has been approved by the Board of Directors of HSBC Asset Management (India) Private Limited and The Board of Trustees of HSBC Mutual Fund at their meetings held on July 16, 2018 and July 17, 2018 respectively. The audit report attached herewith refers to the said Annual Accounts. The aforesaid abridged accounts are an extract of the Annual Accounts and are prepared in accordance with SEBI Circular No. IMD/Cir8/132968/2008 dated July 24, 2008.

86
Notes to Accounts – Annexure I (Contd...)To the Abridged Balance Sheet and Revenue Account for the year ended March 31, 2018
HSBC FIXED TERM SERIES 125
1 Investments: –
1.1. It is confirmed that investments of the Scheme are registered in the name of the Trustees for the benefit of the Scheme’s unitholders.
1.2. Open Positions of derivatives as of year ended March 31, 2018 and March 31, 2017 are NIL
1.3. Investments in Associates and Group Companies as of period years ended March 31, 2018 and March 31 2017 is NIL.
1.4. Open positions of Securities Borrowed and / or Lent by the Scheme as of the years ended March 31, 2018 and March 31, 2017 are NIL.
1.5. NPAs as at years ended March 31, 2018 and March 31, 2017 are NIL.
1.6. Aggregate Unrealised Gain / Loss as at the end of the financial years end and their percentages to net assets are as under:
Security Category Amount (Rs.)
Percentage to Net Assets
Amount (Rs.)
Percentage to Net Assets
2018 2017
Non Convertible Debentures and Bonds Listed / Awaiting Listing
– Appreciation 2,622,656 0.19 11,023,586 0.85
– Depreciation 6,262,837 0.45 7,600 ~0.00
Certificates of Deposit/Commercial Paper
– Appreciation 6,765 ~0.00 – –
– Depreciation – – – –
~ Less than 0.01
1.7. The aggregate value of investment securities (excluding CBLO and Reverse Repos) purchased and sold (including matured) during the financial year 2017-2018 (excluding accretion of discount) is Rs. 90,151,030 and Nil respectively being 6.73% and Nil of the average daily net assets.
The aggregate value of investment securities (excluding CBLO and Reverse Repos) purchased and sold (including matured) during the financial year 2016-2017 (excluding accretion of discount) is Rs. 332,086,762 and Rs. 101,882,800 respectively being 26.68% and 8.18% of the average daily net assets.
1.8. Non -Traded securities in the portfolio: Aggregate Value of Equity, Debt & Money Market Instruments and percentages to net assets are as under :
Security Category Amount (Rupees)
Percentage to Net Assets
Amount (Rupees)
Percentage to Net Assets
2018 2017
Debt Instruments 1,282,926,551 92.90 1,204,290,438 93.09
Money Market Instruments 9,861,350 0.71 – 0.00
Total 1,292,787,901 93.62 1,204,290,438 93.09

87
2 Disclosure Under Regulation 25(8) of the Securities and Exchange Board of India (Mutual Funds) Regulations, 1996 as amended
Commission paid to Sponsor/AMC and its associates/related parties/group companies
Name of Sponsor/AMC and its associates/related parties/group companies
Nature of Association / Nature of
Relation
Period Covered
Business Given [Rs. In Crores]
% of Total Business received by the Fund
Commission paid
[Rupees]
% of Total commission paid by the
Fund
The Hongkong and Shanghai Banking Corporation Limited
Associate of Investment Manager
2017–2018 – – 2,133,018.00 89.85
Name of Sponsor/AMC and its associates/related parties/group companies
Nature of Association / Nature of
Relation
Period Covered
Business Given [Rs. In Crores]
% of Total Business received by the Fund
Commission paid
[Rupees]
% of Total commission paid by the
Fund
The Hongkong and Shanghai Banking Corporation Limited
Associate of Investment Manager
2016–2017 – – 2,035,442.46 89.11
Brokerage paid to Sponsor/AMC and its associates/related parties/group companies is NIL.
(i) Any underwriting obligations undertaken by the schemes of the mutual funds with respect to issue of securities associate companies - NIL (Previous year also NIL).
(ii) Devolvement - NIL (Previous year also NIL).
(iii) Subscription by the schemes in the issues lead managed by associate companies - NIL (Previous year also NIL).
(iv) Subscription to any issue of equity or debt on private placement basis where the sponsor or its associate companies have acted as arranger or manager - NIL (Previous year also NIL).
3 None of the Investors held more than 25% of the total net assets of the Scheme at the year ended March 31, 2018 and March 31, 2017.
4 Unit Capital movement during the years ended March 31, 2018 and March 31, 2017:
Description 2017–2018
Opening Units Subscription Redemption Closing Units Face Value per unit (Rupees)
Growth Option 113,940,623.092 – – 113,940,623.092 10
Dividend Option 602,259.015 – – 602,259.015 10
Direct Plan – Growth Option
4,010,666.600 – – 4,010,666.600 10
Description 2016–2017
Opening Units Subscription Redemption Closing Units Face Value per unit (Rupees)
Growth Option 113,940,623.092 – – 113,940,623.092 10
Dividend Option 602,259.015 – – 602,259.015 10
Notes to Accounts – Annexure I (Contd...)To the Abridged Balance Sheet and Revenue Account for the year ended March 31, 2018

88
Notes to Accounts – Annexure I (Contd...)To the Abridged Balance Sheet and Revenue Account for the year ended March 31, 2018
Description 2016–2017
Opening Units Subscription Redemption Closing Units Face Value per unit (Rupees)
Direct Plan – Growth Option
4,010,666.600 – – 4,010,666.600 10
5 No contingent liabilities for the years ended March 31, 2018 and March 31, 2017.
6 Expenses other than Management Fees are Inclusive of GST / Service Tax where applicable.
7 Investor Education Awareness
In view of the AMFI Best Practices Guidelines Circular No. 56/2015-16, the IEF (Investor Education Fund) accrual is set aside in a separate bank account and the consolidated balance across all schemes as on March 31, 2018. The break-up of which is as under:
Particulars March 31, 2018 March 31, 2017
Amount (Rs. in Lakhs) Amount (Rs. in Lakhs)
Opening Balance 44.00 –
Add: Accrual during the year 219.83 182
Less: Transferred to AMFI 101.10 83
Less: Payable to AMFI (March accrual) 8.81 8
Add: Investment Income for the year 8.28 11
Less: Spent during the year 43.17 58
Closing Balance 119.02 44
8 The Annual Accounts of the Schemes prepared in accordance with the accounting policies and standards specified in the Ninth Schedule of The Securities and Exchange Board of India (Mutual Funds) Regulations, 1996 has been approved by the Board of Directors of HSBC Asset Management (India) Private Limited and The Board of Trustees of HSBC Mutual Fund at their meetings held on July 16, 2018 and July 17, 2018 respectively. The audit report attached herewith refers to the said Annual Accounts. The aforesaid abridged accounts are an extract of the Annual Accounts and are prepared in accordance with SEBI Circular No. IMD/Cir8/132968/2008 dated July 24, 2008.

89
HSBC FIXED TERM SERIES 126
1 Investments: –
1.1. It is confirmed that investments of the Scheme are registered in the name of the Trustees for the benefit of the Scheme’s unitholders.
1.2. Open Positions of derivatives as of year ended March 31, 2018 is NIL (March 31, 2017 is NIL).
1.3. Investments in Associates and Group Companies as of period ended March 31, 2018 is NIL (March 31, 2017 is NIL).
1.4. Open positions of Securities Borrowed and / or Lent by the Scheme as of the years ended March 31, 2018 are NIL (March 31, 2017 are NIL).
1.5. NPAs as at years ended March 31, 2018 are NIL (March 31, 2017 are NIL.)
1.6. Aggregate Unrealised Gain / Loss as at the end of the financial years end and their percentages to net assets are as under:
Security Category Amount (Rs.)
Percentage to Net Assets
Amount (Rs.)
Percentage to Net Assets
2018 2017
Non Convertible Debentures and Bonds Listed / Awaiting Listing
– Appreciation 423,116 0.12 2,817,169 0.84
– Depreciation 1,294,762 0.36 33,000 0.01
1.7. The aggregate value of investment securities (excluding CBLO and Reverse Repos) purchased and sold (including matured) during the financial year 2017-2018 (excluding accretion of discount) is Rs. 20,172,260 and Nil respectively being 5.84% and Nil of the average daily net assets.
The aggregate value of investment securities (excluding CBLO and Reverse Repos) purchased and sold (including matured) during the financial year 2016-2017 (excluding accretion of discount) is Rs. 306,397,530 and Rs. 10,000,000 respectively being 94.72% and 3.09% of the average daily net assets.
1.8. Non -Traded securities in the portfolio: Aggregate Value of Equity, Debt & Money Market Instruments and percentages to net assets are as under :
Security Category Amount (Rupees)
Percentage to Net Assets
Amount (Rupees)
Percentage to Net Assets
2018 2017
Debt Instruments 326,541,439 91.84 304,413,275 91.17
Total 326,541,439 91.84 304,413,275 91.17
2 Disclosure Under Regulation 25(8) of the Securities and Exchange Board of India (Mutual Funds) Regulations, 1996 as amended
Commission paid to Sponsor/AMC and its associates/related parties/group companies
Name of Sponsor/AMC and its associates/related parties/group companies
Nature of Association / Nature of
Relation
Period Covered
Business Given [Rs. In Crores]
% of Total Business received by the Fund
Commission paid
[Rupees]
% of Total commission paid by the
Fund
The Hongkong and Shanghai Banking Corporation Limited
Associate of Investment Manager
2017–2018 – – 577,409 90.62
Notes to Accounts – Annexure I (Contd...)To the Abridged Balance Sheet and Revenue Account for the year ended March 31, 2018

90
Name of Sponsor/AMC and its associates/related parties/group companies
Nature of Association / Nature of
Relation
Period Covered
Business Given [Rs. In Crores]
% of Total Business received by the Fund
Commission paid
[Rupees]
% of Total commission paid by the
Fund
The Hongkong and Shanghai Banking Corporation Limited
Associate of the Investment Manager
2016-2017 30.64 97.40 464,888 88.86
Brokerage paid to Sponsor/AMC and its associates/related parties/group companies is NIL. (Previous year also NIL)
(i) Any underwriting obligations undertaken by the schemes of the mutual funds with respect to issue of securities associate companies - Nil (Previous year also Nil).
(ii) Devolvement - Nil (Previous year also Nil).
(iii) Subscription by the schemes in the issues lead managed by associate companies - Nil (Previous year also Nil).
(iv) Subscription to any issue of equity or debt on private placement basis where the sponsor or its associate companies have acted as arranger or manager - Nil (Previous year also Nil).
3 None of the Investors held more than 25% of the total net assets of the scheme at the year ended March 31, 2018 and March 31, 2017.
4 Unit Capital movement during the years ended March 31, 2018:
Description 2017 – 2018
Opening Units Subscription Redemption Closing Units Face Value per unit (Rupees)
Growth Option 30,079,373.552 – – 30,079,373.552 10
Dividend Option 923,968.739 – – 923,968.739 10
Direct Plan – Growth Option
16,000.000 – – 16,000.000 10
Description 2016–2017
Opening Units
Subscription Redemption Closing Units Face Value per unit (Rupees)
Growth Option – 30,079,373.552 – 30,079,373.552 10
Dividend Option – 923,968.739 – 923,968.739 10
Direct Plan – Growth Option
– 16,000.000 – 16,000.000 10
5 No contingent liabilities for the years ended March 31, 2018 and March 31, 2017.
6 Expenses other than Management Fees are Inclusive of GST / Service Tax where applicable.
7 Investor Education Awareness
In view of the AMFI Best Practices Guidelines Circular No. 56/2015-16, the IEF (Investor Education Fund) accrual is set aside in a separate bank account and the consolidated balance across all schemes as on March 31, 2018. The break-up of which is as under:
Notes to Accounts – Annexure I (Contd...)To the Abridged Balance Sheet and Revenue Account for the year ended March 31, 2018

91
Particulars March 31, 2018 March 31, 2017
Amount (Rs. in Lakhs) Amount (Rs. in Lakhs)
Opening Balance 44.00 –
Add: Accrual during the year 219.83 182
Less: Transferred to AMFI 101.10 83
Less: Payable to AMFI (March accrual) 8.81 8
Add: Investment Income for the year 8.28 11
Less: Spent during the year 43.17 58
Closing Balance 119.02 44
8 The Annual Accounts of the Schemes prepared in accordance with the accounting policies and standards specified in the Ninth Schedule of The Securities and Exchange Board of India (Mutual Funds) Regulations, 1996 has been approved by the Board of Directors of HSBC Asset Management (India) Private Limited and The Board of Trustees of HSBC Mutual Fund at their meetings held on July 16, 2018 and July 17, 2018 respectively. The audit report attached herewith refers to the said Annual Accounts. The aforesaid abridged accounts are an extract of the Annual Accounts and are prepared in accordance with SEBI Circular No. IMD/Cir8/132968/2008 dated July 24, 2008.
Notes to Accounts – Annexure I (Contd...)To the Abridged Balance Sheet and Revenue Account for the year ended March 31, 2018

92
Notes to Accounts – Annexure I (Contd...)To the Abridged Balance Sheet and Revenue Account for the period ended March 31, 2018
HSBC FIXED TERM SERIES 128#
1 Investments:
1.1. It is confirmed that investments of the Scheme are registered in the name of the Trustees for the benefit of the Scheme’s unitholders.
1.2. Open Positions of derivatives as of period ended March 31, 2018 is NIL
1.3. Investments in Associates and Group Companies:
(Rupees)
Issuer Instrument Type Amount Aggregate Investments by all schemes
2018
Shriram Transport Finance Company Ltd.
Corporate Bonds / Debentures
50,109,750 651,317,500
Bharti Airtel Ltd. Equities – 369,136,950
Balrampur Chini Mills Ltd. Equities – 125,227,938
1.4. Open positions of Securities Borrowed and / or Lent by the Scheme as of the period ended March 31, 2018 is NIL.
1.5. NPAs as at years ended March 31, 2018 are NIL.
1.6. Aggregate Unrealised Gain / Loss as at the end of the financial years end and their percentages to net assets are as under:
Security Category Amount (Rupees)
Percentage to Net Assets
2018
Non Convertible Debentures and Bonds Listed / Awaiting Listing
– Appreciation – –
– Depreciation 4,985,309 0.72
Government of India Securities
– Appreciation – –
– Depreciation 675,525 0.10
1.7. The aggregate value of investment securities (excluding CBLO and Reverse Repos) purchased and sold (including matured) during the financial year 2017-2018 (excluding accretion of discount) is Rs. 642,923,031 and Nil respectively being 100.87% and Nil of the average daily net assets.
1.8. Non -Traded securities in the portfolio: Aggregate Value of Equity, Debt & Money Market Instruments and percentages to net assets are as under :
Security Category Amount (Rupees)
Percentage to Net Assets
2018
Debt Instruments 590,310,343 85.48
Total 590,310,343 85.48

93
Notes to Accounts – Annexure I (Contd...)To the Abridged Balance Sheet and Revenue Account for the period ended March 31, 2018
2 Disclosure Under Regulation 25(8) of the Securities and Exchange Board of India (Mutual Funds) Regulations, 1996 as amended
Commission paid to Sponsor/AMC and its associates/related parties/group companies
Name of Sponsor/AMC and its associates/related parties/group companies
Nature of Association / Nature of
Relation
Period Covered
Business Given [Rs. In Crores]
% of Total Business received by the Fund
Commission paid
[Rupees]
% of Total commission paid by the
Fund
The Hongkong and Shanghai Banking Corporation Limited
Associate of Investment Manager
2017-2018 54.86 83.89 976,513.31 90.12
Brokerage paid to Sponsor/AMC and its associates/related parties/group companies is NIL.
(i) Any underwriting obligations undertaken by the schemes of the mutual funds with respect to issue of securities associate companies - Nil.
(ii) Devolvement - Nil.
(iii) Subscription by the schemes in the issues lead managed by associate companies - Nil.
(iv) Subscription to any issue of equity or debt on private placement basis where the sponsor or its associate companies have acted as arranger or manager - Nil.
3 None of the Investors held more than 25% of the total net assets of the Scheme at the period ended March 31, 2018.
4 Unit Capital movement during the period ended March 31, 2018:
Description 2017 – 2018
Opening Units
Subscription Redemption Closing Units
Face Value per unit (Rupees)
Growth Option – 54,879,860.749 – 54,879,860.749 10
Dividend Option – 357,568.032 – 357,568.032 10
Direct Plan – Growth Option
– 9,850,000.000 – 9,850,000.000 10
Direct Plan – Dividend Option
– – – – 10
5 As these are the first financial statements of the schemes since the date of launch, there are no prior period comparatives.
6 No contingent liabilities for the period ended March 31, 2018.
7 Expenses other than Management Fees are Inclusive of GST / Service Tax where applicable.
8 Investor Education Awareness
In view of the AMFI Best Practices Guidelines Circular No. 56/2015-16, the IEF (Investor Education Fund) accrual is set aside in a separate bank account and the consolidated balance across all schemes as on March 31, 2018. The break-up of which is as under:

94
Particulars March 31, 2018 March 31, 2017
Amount (Rs. in Lakhs) Amount (Rs. in Lakhs)
Opening Balance 44.00 –
Add: Accrual during the year 219.83 182
Less: Transferred to AMFI 101.10 83
Less: Payable to AMFI (March accrual) 8.81 8
Add: Investment Income for the year 8.28 11
Less: Spent during the year 43.17 58
Closing Balance 119.02 44
9 The Annual Accounts of the Schemes prepared in accordance with the accounting policies and standards specified in the Ninth Schedule of The Securities and Exchange Board of India (Mutual Funds) Regulations, 1996 has been approved by the Board of Directors of HSBC Asset Management (India) Private Limited and The Board of Trustees of HSBC Mutual Fund at their meetings held on July 16, 2018 and July 17, 2018 respectively. The audit report attached herewith refers to the said Annual Accounts. The aforesaid abridged accounts are an extract of the Annual Accounts and are prepared in accordance with SEBI Circular No. IMD/Cir8/132968/2008 dated July 24, 2008.
# Scheme launched during the current financial year
Notes to Accounts – Annexure I (Contd...)To the Abridged Balance Sheet and Revenue Account for the period ended March 31, 2018

95
Notes to Accounts – Annexure I (Contd...)To the Abridged Balance Sheet and Revenue Account for the period ended March 31, 2018
HSBC FIXED TERM SERIES 129#
1 Investments:
1.1. It is confirmed that investments of the Scheme are registered in the name of the Trustees for the benefit of the Scheme’s unitholders.
1.2. Open Positions of derivatives as of period ended March 31, 2018 is NIL
1.3. Investments in Associates and Group Companies:
(Rupees)
Issuer Instrument Type Amount Aggregate Investments by all schemes
2018
Shriram Transport Finance Company Ltd.
Corporate Bonds / Debentures
45,000,000 651,317,500
Bharti Airtel Ltd. Equities – 369,136,950
Balrampur Chini Mills Ltd. Equities – 125,227,938
1.4. Open positions of Securities Borrowed and / or Lent by the Scheme as of the period ended March 31, 2018 is NIL.
1.5. NPAs as at period ended March 31, 2018 are NIL.
1.6. Aggregate Unrealised Gain / Loss as at the end of the financial years end and their percentages to net assets are as under:
Security Category Amount (Rupees)
Percentage to Net Assets
2018
Non Convertible Debentures and Bonds Listed / Awaiting Listing
– Appreciation – –
– Depreciation 6,280,027 1.19
Government of India Securities
– Appreciation – –
– Depreciation 447,104 0.09
1.7. The aggregate value of investment securities (excluding CBLO and Reverse Repos) purchased and sold (including matured) during the financial year 2017-2018 (excluding accretion of discount) is Rs. 537,292,261 and Rs. 39,593,881 respectively being 127.90% and 9.42% of the average daily net assets.
1.8. Non -Traded securities in the portfolio: Aggregate Value of Equity, Debt & Money Market Instruments and percentages to net assets are as under :
Security Category Amount (Rupees)
Percentage to Net Assets
2018
Debt Instruments 472,056,560 89.77
Total 472,056,560 89.77

96
Notes to Accounts – Annexure I (Contd...)To the Abridged Balance Sheet and Revenue Account for the period ended March 31, 2018
2 Disclosure Under Regulation 25(8) of the Securities and Exchange Board of India (Mutual Funds) Regulations, 1996 as amended
Commission paid to Sponsor/AMC and its associates/related parties/group companies
Name of Sponsor/AMC and its associates/related parties/group companies
Nature of Association / Nature of
Relation
Period Covered
Business Given [Rs. In Crores]
% of Total Business received by the Fund
Commission paid
[Rupees]
% of Total commission paid by the
Fund
The Hongkong and Shanghai Banking Corporation Limited
Associate of Investment Manager
2017-2018 44.23 86.37 316,272.25 86.97
Brokerage paid to Sponsor/AMC and its associates/related parties/group companies is NIL.
(i) Any underwriting obligations undertaken by the schemes of the mutual funds with respect to issue of securities associate companies - Nil.
(ii) Devolvement - Nil.
(iii) Subscription by the schemes in the issues lead managed by associate companies - Nil.
(iv) Subscription to any issue of equity or debt on private placement basis where the sponsor or its associate companies have acted as arranger or manager - Nil.
3 None of the Investors held more than 25% of the total net assets of the Scheme at the period ended March 31, 2018.
4 Unit Capital movement during the period ended March 31, 2018:
Description 2017-2018
Opening Units
Subscription Redemption Closing Units
Face Value per unit (Rupees)
Growth Option – 43,556,682.824 – 43,556,682.824 10
Dividend Option – 523,657.289 – 523,657.289 10
Direct Plan – Growth Option
– 6,014,000.000 – 6,014,000.000 10
Direct Plan – Dividend Option
– – – – 10
5 As these are the first financial statements of the schemes since the date of launch, there are no prior period comparatives.
6 No contingent liabilities for the period ended March 31, 2018.
7 Expenses other than Management Fees are Inclusive of GST / Service Tax where applicable.
8 Investor Education Awareness
In view of the AMFI Best Practices Guidelines Circular No. 56/2015-16, the IEF (Investor Education Fund) accrual is set aside in a separate bank account and the consolidated balance across all schemes as on March 31, 2018. The break-up of which is as under:

97
Particulars March 31, 2018 March 31, 2017
Amount (Rs. in Lakhs) Amount (Rs. in Lakhs)
Opening Balance 44.00 –
Add: Accrual during the year 219.83 182
Less: Transferred to AMFI 101.10 83
Less: Payable to AMFI (March accrual) 8.81 8
Add: Investment Income for the year 8.28 11
Less: Spent during the year 43.17 58
Closing Balance 119.02 44
9 The Annual Accounts of the Schemes prepared in accordance with the accounting policies and standards specified in the Ninth Schedule of The Securities and Exchange Board of India (Mutual Funds) Regulations, 1996 has been approved by the Board of Directors of HSBC Asset Management (India) Private Limited and The Board of Trustees of HSBC Mutual Fund at their meetings held on July 16, 2018 and July 17, 2018 respectively. The audit report attached herewith refers to the said Annual Accounts. The aforesaid abridged accounts are an extract of the Annual Accounts and are prepared in accordance with SEBI Circular No. IMD/Cir8/132968/2008 dated July 24, 2008.
# Scheme launched during the current financial year
Notes to Accounts – Annexure I (Contd...)To the Abridged Balance Sheet and Revenue Account for the Period ended March 31, 2018

98
Notes to Accounts – Annexure I (Contd...)To the Abridged Balance Sheet and Revenue Account for the Period ended March 31, 2018
HSBC FIXED TERM SERIES 130#
1 Investments:
1.1. It is confirmed that investments of the Scheme are registered in the name of the Trustees for the benefit of the Scheme’s unitholders.
1.2. Open Positions of derivatives as of period ended March 31, 2018 is NIL.
1.3. Investments in Associates and Group Companies as of period ended March 31, 2018 is NIL.
1.4. Open positions of Securities Borrowed and / or Lent by the Scheme as of the period ended March 31, 2018 is NIL.
1.5. NPAs as at period ended March 31, 2018 is NIL.
1.6. Aggregate Unrealised Gain / Loss as at the end of the financial years end and their percentages to net assets are as under:
Security Category Amount (Rupees)
Percentage to Net Assets
2018
Non Convertible Debentures and Bonds Listed / Awaiting Listing
– Appreciation 154,872 0.07
– Depreciation 551,643 0.24
Government of India Securities
– Appreciation – –
– Depreciation 27,946 0.01
1.7. The aggregate value of investment securities (excluding CBLO and Reverse Repos) purchased and sold (including matured) during the financial year 2017-2018 (excluding accretion of discount) is Rs. 223,094,715 and Nil respectively being 352.75% and Nil of the average daily net assets.
1.8. Non -Traded securities in the portfolio: Aggregate Value of Equity, Debt & Money Market Instruments and percentages to net assets are as under :
Security Category Amount (Rupees)
Percentage to Net Assets
2018
Debt Instruments 200,631,918 85.85
Total 200,631,918 85.85
2 Disclosure Under Regulation 25(8) of the Securities and Exchange Board of India (Mutual Funds) Regulations, 1996 as amended
Commission paid to Sponsor/AMC and its associates/related parties/group companies
Name of Sponsor/AMC and its associates/related parties/group companies
Nature of Association / Nature of
Relation
Period Covered
Business Given [Rs. In Crores]
% of Total Business received by the Fund
Commission paid
[Rupees]
% of Total commission paid by the
Fund
The Hongkong and Shanghai Banking Corporation Limited
Associate of Investment Manager
2017-2018 11.79 51.31 15,981 47.67

99
Brokerage paid to Sponsor/AMC and its associates/related parties/group companies is NIL.
(i) Any underwriting obligations undertaken by the schemes of the mutual funds with respect to issue of securities associate companies - Nil.
(ii) Devolvement - Nil.
(iii) Subscription by the schemes in the issues lead managed by associate companies - Nil.
(iv) Subscription to any issue of equity or debt on private placement basis where the sponsor or its associate companies have acted as arranger or manager - Nil.
3 None of the Investors held more than 25% of the total net assets of the Scheme at the year ended March 31, 2018.
4 Unit Capital movement during the period ended March 31, 2018:
Description 2017-2018
Opening Units
Subscription Redemption Closing Units
Face Value per unit (Rupees)
Growth Option – 14,159,124.748 – 14,159,124.748 10
Dividend Option – 39,720.000 – 39,720.000 10
Direct Plan – Growth Option
– 8,763,500.000 – 8,763,500.000 10
5 As these are the first financial statements of the schemes since the date of launch, there are no prior period comparatives.
6 No contingent liabilities for the period ended March 31, 2018.
7 Expenses other than Management Fees are Inclusive of GST / Service Tax where applicable.
8 Investor Education Awareness
In view of the AMFI Best Practices Guidelines Circular No. 56/2015-16, the IEF (Investor Education Fund) accrual is set aside in a separate bank account and the consolidated balance across all schemes as on March 31, 2018. The break-up of which is as under:
Particulars March 31, 2018 March 31, 2017
Amount (Rs. in Lakhs) Amount (Rs. in Lakhs)
Opening Balance 44.00 –
Add: Accrual during the year 219.83 182
Less: Transferred to AMFI 101.10 83
Less: Payable to AMFI (March accrual) 8.81 8
Add: Investment Income for the year 8.28 11
Less: Spent during the year 43.17 58
Closing Balance 119.02 44
9 The Annual Accounts of the Schemes prepared in accordance with the accounting policies and standards specified in the Ninth Schedule of The Securities and Exchange Board of India (Mutual Funds) Regulations, 1996 has been approved by the Board of Directors of HSBC Asset Management (India) Private Limited and The Board of Trustees of HSBC Mutual Fund at their meetings held on July 16, 2018 and July 17, 2018 respectively. The audit report attached herewith refers to the said Annual Accounts. The aforesaid abridged accounts are an extract of the Annual Accounts and are prepared in accordance with SEBI Circular No. IMD/Cir8/132968/2008 dated July 24, 2008.
# Scheme launched during the current financial year
Notes to Accounts – Annexure I (Contd...)To the Abridged Balance Sheet and Revenue Account for the Period ended March 31, 2018

100
Notes to Accounts – Annexure I (Contd...)To the Abridged Balance Sheet and Revenue Account for the Period ended March 31, 2018
HSBC FIXED TERM SERIES 131#
1 Investments:
1.1. It is confirmed that investments of the Scheme are registered in the name of the Trustees for the benefit of the Scheme’s unitholders.
1.2. Open Positions of derivatives as of period ended March 31, 2018 is NIL
1.3. Investments in Associates and Group Companies as of period ended March 31, 2018 is NIL.
1.4. Open positions of Securities Borrowed and / or Lent by the Scheme as of the period ended March 31, 2018 is NIL.
1.5. NPAs as at period ended March 31, 2018 is NIL.
1.6. Aggregate Unrealised Gain / Loss as at the end of the financial years end and their percentages to net assets are as under:
Security Category Amount (Rupees)
Percentage to Net Assets
2018
Non Convertible Debentures and Bonds Listed / Awaiting Listing
– Appreciation 574,585 0.14
– Depreciation – –
Government of India Securities
– Appreciation 207,160 0.05
– Depreciation – –
1.7. The aggregate value of investment securities (excluding CBLO and Reverse Repos) purchased and sold (including matured) during the financial year 2017-2018 (excluding accretion of discount) is Rs. 396,388,997 and Nil respectively being 3,257.63% and Nil of the average daily net assets.
1.8. Non -Traded securities in the portfolio: Aggregate Value of Equity, Debt & Money Market Instruments and percentages to net assets are as under :
Security Category Amount (Rupees)
Percentage to Net Assets
2018
Debt Instruments 347,042,880 85.76
Total 347,042,880 85.76
2 Disclosure Under Regulation 25(8) of the Securities and Exchange Board of India (Mutual Funds) Regulations, 1996 as amended
Commission paid to Sponsor/AMC and its associates/related parties/group companies
Name of Sponsor/AMC and its associates/related parties/group companies
Nature of Association / Nature of
Relation
Period Covered
Business Given [Rs. In Crores]
% of Total Business received by the Fund
Commission paid
[Rupees]
% of Total commission paid by the
Fund
The Hongkong and Shanghai Banking Corporation Limited
Associate of Investment Manager
2017–2018 6.55 16.26 – –
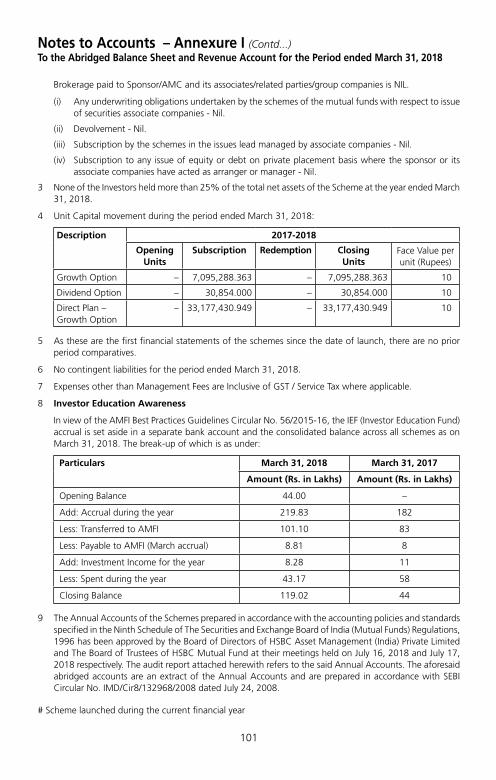
101
Notes to Accounts – Annexure I (Contd...)To the Abridged Balance Sheet and Revenue Account for the Period ended March 31, 2018
Brokerage paid to Sponsor/AMC and its associates/related parties/group companies is NIL.
(i) Any underwriting obligations undertaken by the schemes of the mutual funds with respect to issue of securities associate companies - Nil.
(ii) Devolvement - Nil.
(iii) Subscription by the schemes in the issues lead managed by associate companies - Nil.
(iv) Subscription to any issue of equity or debt on private placement basis where the sponsor or its associate companies have acted as arranger or manager - Nil.
3 None of the Investors held more than 25% of the total net assets of the Scheme at the year ended March 31, 2018.
4 Unit Capital movement during the period ended March 31, 2018:
Description 2017-2018
Opening Units
Subscription Redemption Closing Units
Face Value per unit (Rupees)
Growth Option – 7,095,288.363 – 7,095,288.363 10
Dividend Option – 30,854.000 – 30,854.000 10
Direct Plan – Growth Option
– 33,177,430.949 – 33,177,430.949 10
5 As these are the first financial statements of the schemes since the date of launch, there are no prior period comparatives.
6 No contingent liabilities for the period ended March 31, 2018.
7 Expenses other than Management Fees are Inclusive of GST / Service Tax where applicable.
8 Investor Education Awareness
In view of the AMFI Best Practices Guidelines Circular No. 56/2015-16, the IEF (Investor Education Fund) accrual is set aside in a separate bank account and the consolidated balance across all schemes as on March 31, 2018. The break-up of which is as under:
Particulars March 31, 2018 March 31, 2017
Amount (Rs. in Lakhs) Amount (Rs. in Lakhs)
Opening Balance 44.00 –
Add: Accrual during the year 219.83 182
Less: Transferred to AMFI 101.10 83
Less: Payable to AMFI (March accrual) 8.81 8
Add: Investment Income for the year 8.28 11
Less: Spent during the year 43.17 58
Closing Balance 119.02 44
9 The Annual Accounts of the Schemes prepared in accordance with the accounting policies and standards specified in the Ninth Schedule of The Securities and Exchange Board of India (Mutual Funds) Regulations, 1996 has been approved by the Board of Directors of HSBC Asset Management (India) Private Limited and The Board of Trustees of HSBC Mutual Fund at their meetings held on July 16, 2018 and July 17, 2018 respectively. The audit report attached herewith refers to the said Annual Accounts. The aforesaid abridged accounts are an extract of the Annual Accounts and are prepared in accordance with SEBI Circular No. IMD/Cir8/132968/2008 dated July 24, 2008.
# Scheme launched during the current financial year
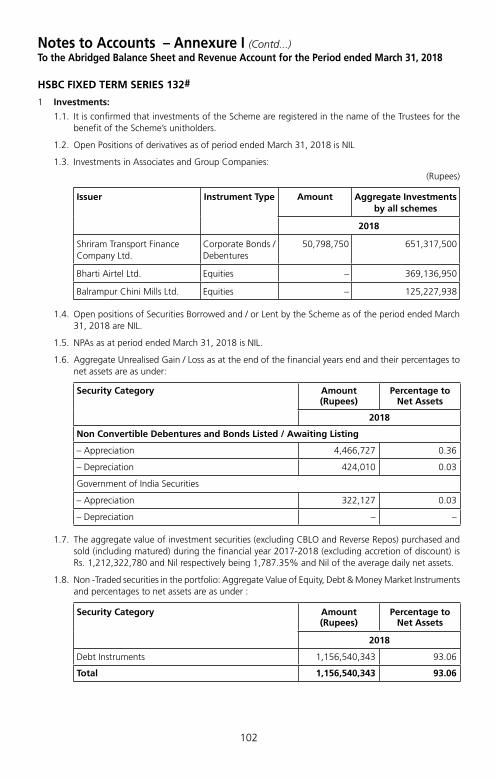
102
Notes to Accounts – Annexure I (Contd...)To the Abridged Balance Sheet and Revenue Account for the Period ended March 31, 2018
HSBC FIXED TERM SERIES 132#
1 Investments:
1.1. It is confirmed that investments of the Scheme are registered in the name of the Trustees for the benefit of the Scheme’s unitholders.
1.2. Open Positions of derivatives as of period ended March 31, 2018 is NIL
1.3. Investments in Associates and Group Companies:
(Rupees)
Issuer Instrument Type Amount Aggregate Investments by all schemes
2018
Shriram Transport Finance Company Ltd.
Corporate Bonds / Debentures
50,798,750 651,317,500
Bharti Airtel Ltd. Equities – 369,136,950
Balrampur Chini Mills Ltd. Equities – 125,227,938
1.4. Open positions of Securities Borrowed and / or Lent by the Scheme as of the period ended March 31, 2018 are NIL.
1.5. NPAs as at period ended March 31, 2018 is NIL.
1.6. Aggregate Unrealised Gain / Loss as at the end of the financial years end and their percentages to net assets are as under:
Security Category Amount (Rupees)
Percentage to Net Assets
2018
Non Convertible Debentures and Bonds Listed / Awaiting Listing
– Appreciation 4,466,727 0.36
– Depreciation 424,010 0.03
Government of India Securities
– Appreciation 322,127 0.03
– Depreciation – –
1.7. The aggregate value of investment securities (excluding CBLO and Reverse Repos) purchased and sold (including matured) during the financial year 2017-2018 (excluding accretion of discount) is Rs. 1,212,322,780 and Nil respectively being 1,787.35% and Nil of the average daily net assets.
1.8. Non -Traded securities in the portfolio: Aggregate Value of Equity, Debt & Money Market Instruments and percentages to net assets are as under :
Security Category Amount (Rupees)
Percentage to Net Assets
2018
Debt Instruments 1,156,540,343 93.06
Total 1,156,540,343 93.06

103
Notes to Accounts – Annexure I (Contd...)To the Abridged Balance Sheet and Revenue Account for the Period ended March 31, 2018
2 Disclosure Under Regulation 25(8) of the Securities and Exchange Board of India (Mutual Funds) Regulations, 1996 as amended
Commission paid to Sponsor/AMC and its associates/related parties/group companies
Name of Sponsor/AMC and its associates/related parties/group companies
Nature of Association / Nature of
Relation
Period Covered
Business Given [Rs. In Crores]
% of Total Business received by the Fund
Commission paid
[Rupees]
% of Total commission paid by the
Fund
The Hongkong and Shanghai Banking Corporation Limited
Associate of Investment Manager
2017-2018 119.68 97.12 – –
Brokerage paid to Sponsor/AMC and its associates/related parties/group companies is NIL.
(i) Any underwriting obligations undertaken by the schemes of the mutual funds with respect to issue of securities associate companies - Nil.
(ii) Devolvement - Nil.
(iii) Subscription by the schemes in the issues lead managed by associate companies - Nil.
(iv) Subscription to any issue of equity or debt on private placement basis where the sponsor or its associate companies have acted as arranger or manager - Nil.
3 None of the Investors held more than 25% of the total net assets of the Scheme at the period ended March 31, 2018.
4 Unit Capital movement during the period ended March 31, 2018:
Description 2017-2018
Opening Units
Subscription Redemption Closing Units
Face Value per unit (Rupees)
Growth Option – 118,101,370.598 – 118,101,370.598 10
Dividend Option – 2,345,689.097 – 2,345,689.097 10
Direct Plan – Growth Option
– 2,777,750.533 – 2,777,750.533 10
Direct Plan – Dividend Option
– 950.000 – 950.000 10
5 As these are the first financial statements of the schemes since the date of launch, there are no prior period comparatives.
6 No contingent liabilities for the period ended March 31, 2018.
7 Expenses other than Management Fees are Inclusive of GST / Service Tax where applicable.
8 Investor Education Awareness
In view of the AMFI Best Practices Guidelines Circular No. 56/2015-16, the IEF (Investor Education Fund) accrual is set aside in a separate bank account and the consolidated balance across all schemes as on March 31, 2018. The break-up of which is as under:
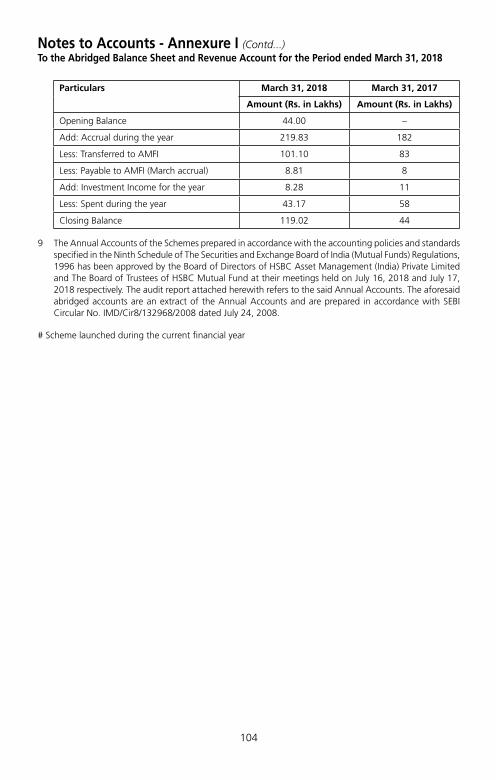
104
Particulars March 31, 2018 March 31, 2017
Amount (Rs. in Lakhs) Amount (Rs. in Lakhs)
Opening Balance 44.00 –
Add: Accrual during the year 219.83 182
Less: Transferred to AMFI 101.10 83
Less: Payable to AMFI (March accrual) 8.81 8
Add: Investment Income for the year 8.28 11
Less: Spent during the year 43.17 58
Closing Balance 119.02 44
9 The Annual Accounts of the Schemes prepared in accordance with the accounting policies and standards specified in the Ninth Schedule of The Securities and Exchange Board of India (Mutual Funds) Regulations, 1996 has been approved by the Board of Directors of HSBC Asset Management (India) Private Limited and The Board of Trustees of HSBC Mutual Fund at their meetings held on July 16, 2018 and July 17, 2018 respectively. The audit report attached herewith refers to the said Annual Accounts. The aforesaid abridged accounts are an extract of the Annual Accounts and are prepared in accordance with SEBI Circular No. IMD/Cir8/132968/2008 dated July 24, 2008.
# Scheme launched during the current financial year
Notes to Accounts - Annexure I (Contd...)To the Abridged Balance Sheet and Revenue Account for the Period ended March 31, 2018

105
Notes to Accounts – Annexure I (Contd...)To the Abridged Balance Sheet and Revenue Account for the Period ended March 31, 2018
HSBC FIXED TERM SERIES 133#
1 Investments:
1.1. It is confirmed that investments of the Scheme are registered in the name of the Trustees for the benefit of the Scheme’s unitholders.
1.2. Open Positions of derivatives as of period ended March 31, 2018 is NIL.
1.3. Investments in Associates and Group Companies as of period ended March 31, 2018 is NIL.
1.4. Open positions of Securities Borrowed and / or Lent by the Scheme as of the period ended March 31, 2018 is NIL.
1.5. NPAs as at period ended March 31, 2018 are NIL.
1.6. Aggregate Unrealised Gain / Loss as at the end of the financial years end and their percentages to net assets are as under:
Security Category Amount (Rupees)
Percentage to Net Assets
2018
Non Convertible Debentures and Bonds Listed / Awaiting Listing
– Appreciation 1,912,740 0.20
– Depreciation – –
Government of India Securities
– Appreciation – –
– Depreciation 74,753 0.01
1.7. The aggregate value of investment securities (excluding CBLO and Reverse Repos) purchased and sold (including matured) during the financial year 2017-2018 (excluding accretion of discount) is Rs. 757,100,086 and Nil respectively being 5,718.99% and Nil of the average daily net assets.
1.8. Non-Traded securities in the portfolio: Aggregate Value of Equity, Debt & Money Market Instruments and percentages to net assets are as under :
Security Category Amount (Rupees)
Percentage to Net Assets
2018
Debt Instruments 663,806,166 68.65
Total 663,806,166 68.65
2 Disclosure Under Regulation 25(8) of the Securities and Exchange Board of India (Mutual Funds) Regulations, 1996 as amended
Commission paid to Sponsor/AMC and its associates/related parties/group companies
Name of Sponsor/AMC and its associates/related parties/group companies
Nature of Association / Nature of
Relation
Period Covered
Business Given [Rs. In Crores]
% of Total Business received by the Fund
Commission paid
[Rupees]
% of Total commission paid by the
Fund
The Hongkong and Shanghai Banking Corporation Limited
Associate of Investment Manager
2017–2018 77.91 80.83 – –

106
Notes to Accounts – Annexure I (Contd...)To the Abridged Balance Sheet and Revenue Account for the Period ended March 31, 2018
Brokerage paid to Sponsor/AMC and its associates/related parties/group companies is NIL.
(i) Any underwriting obligations undertaken by the schemes of the mutual funds with respect to issue of securities associate companies - Nil.
(ii) Devolvement - Nil.
(iii) Subscription by the schemes in the issues lead managed by associate companies - Nil.
(iv) Subscription to any issue of equity or debt on private placement basis where the sponsor or its associate companies have acted as arranger or manager - Nil.
3 None of the Investors held more than 25% of the total net assets of the Scheme at the period ended March 31, 2018.
4 Unit Capital movement during the period ended March 31, 2018:
Description 2017-2018
Opening Units
Subscription Redemption Closing Units
Face Value per unit (Rupees)
Growth Option – 82,186,171.296 – 82,186,171.296 10
Dividend Option – 353,862.848 – 353,862.848 10
Direct Plan – Growth Option
– 13,836,299.100 – 13,836,299.100 10
Direct Plan – Dividend Option
– 20,847.700 – 20,847.700 10
5 As these are the first financial statements of the schemes since the date of launch, there are no prior period comparatives.
6 No contingent liabilities for the period ended March 31, 2018.
7 Expenses other than Management Fees are Inclusive of GST / Service Tax where applicable.
8 Investor Education Awareness
In view of the AMFI Best Practices Guidelines Circular No. 56/2015-16, the IEF (Investor Education Fund) accrual is set aside in a separate bank account and the consolidated balance across all schemes as on March 31, 2018. The break-up of which is as under:
Particulars March 31, 2018 March 31, 2017
Amount (Rs. in Lakhs) Amount (Rs. in Lakhs)
Opening Balance 44.00 –
Add: Accrual during the year 219.83 182
Less: Transferred to AMFI 101.10 83
Less: Payable to AMFI (March accrual) 8.81 8
Add: Investment Income for the year 8.28 11
Less: Spent during the year 43.17 58
Closing Balance 119.02 44
9 The Annual Accounts of the Schemes prepared in accordance with the accounting policies and standards specified in the Ninth Schedule of The Securities and Exchange Board of India (Mutual Funds) Regulations, 1996 has been approved by the Board of Directors of HSBC Asset Management (India) Private Limited and The Board of Trustees of HSBC Mutual Fund at their meetings held on July 16, 2018 and July 17, 2018 respectively. The audit report attached herewith refers to the said Annual Accounts. The aforesaid abridged accounts are an extract of the Annual Accounts and are prepared in accordance with SEBI Circular No. IMD/Cir8/132968/2008 dated July 24, 2008.
# Scheme launched during the current financial year

107
Voting Policy and Procedures
In view of SEBI guidelines related to “Role of Mutual Funds in Corporate Governance of Public Listed Companies”, AMIN has formulated its “Policy for Proxy Voting in Public Listed Companies”. The said policy and details of actual exercise of proxy votes along with the summary of votes cast and the auditors certification during the Financial Year 2017 – 18 is available on its website – http://www.assetmanagement.hsbc.com/in and in full Annual Report for the Financial Year 2017 – 18.

108
Statutory Details & DisclaimersAll returns have been sourced from Mutual Funds India Explorer software unless otherwise stated. With regard to equity schemes (including the equity component of MIPs), Fund performance is calculated on a total return basis (i.e. it includes dividends re-invested) while the benchmark is calculated on a price return basis (i.e. it does not consider dividends re-invested). This document has been prepared by HSBC Asset Management (India) Private Ltd (HSBC) for information purposes only and should not be construed as an offer or solicitation of an offer for purchase of any of the funds of HSBC Mutual Fund. All information contained in this document (including that sourced from third parties), is obtained from sources HSBC, the third party believes to be reliable but which it has not independently verified and HSBC, the third party makes no guarantee, representation or warranty and accepts no responsibility or liability as to the accuracy or completeness of such information. The information and opinions contained within the document are based upon publicly available information and rates of taxation applicable at the time of publication, which are subject to change from time to time. Expressions of opinion are those of HSBC only and are subject to change without notice. It does not have regard to specific investment objectives, financial situation and the particular needs of any specific person who may receive this document. Investors should seek financial advice regarding the appropriateness of investing in any securities or investment strategies that may have been discussed or recommended in this report and should understand that the views regarding future prospects may or may not be realized. Neither this document nor the units of HSBC Mutual Fund have been registered in any jurisdiction. The distribution of this document in certain jurisdictions may be restricted or totally prohibited and accordingly, persons who come into possession of this document are required to inform themselves about, and to observe, any such restrictions.
Investors should not invest in the Scheme solely based on the information provided in this document and should read the Scheme Information Document and Statement of Additional Information of the Fund for details. This document does not constitute an offering document.
No part of this publication may be reproduced, stored in a retrieval system, or transmitted, on any form or by any means, electronic, mechanical, photocopying, recording, or otherwise, without the prior written permission of HSBC Asset Management (India) Private Ltd.
Mutual Fund investments are subject to market risks, read all scheme related documents carefully.

HSBC Managed SolutionsAn open ended fund of fund Scheme investing in a basket of equity, debt, Gold and other Exchange Traded Funds
Abridged Annual Report 2017 - 2018

1
Dear Investor,
Globally, we are witnessing a very interesting phase. The equity markets delivered a stellar performance in 2017. However, there are worries about the impact of higher rates, global trade wars, an economic growth moderation and higher volatility.
Closer home, India has become the world’s sixth-biggest economy. India has doubled its GDP to USD 2.2 trillion within a decade. The introduction of reform measures, including demonetisation and the Goods and Services Tax (GST), had put pressure on selective parts of the economy in 2017. The impact of these measures is likely to be transitory. India’s economic growth is expected to accelerate from 6.7% in FY18 to 7.4% in the current year as per IMF forecasts.
There has been a shift in the domestic savings pool supporting the market. Domestic investors have been increasing exposure to equities and financial assets moving away from gold and real estate. Mutual funds witnessed sizable inflows on the back of the boost in liquidity within the banking system from demonetisation. The AUM of the mutual fund industry grew by 21.7% in March 2018 compared to March 2017.
With growth, comes responsibility. Last year, the regulator, Securities and Exchange Board of India (SEBI) issued a circular to rationalise and categorise mutual fund schemes in India. We are pleased to state that none of our funds needed to be redesigned. All our schemes have been defined as per the new categorisation. We believe this classification will simplify investing into mutual funds and enhance comparability within the schemes offered.
As India moves to a digital age, e-commerce platforms are becoming increasingly popular. I request you to logon to our online transaction platform. It is a quick, convenient and an efficient tool to invest into our funds and manage your investments online.
At HSBC Global Asset Management, India, we are dedicated to one goal: delivering exceptional investment management for our clients. By bringing together our

2
global investment knowledge and capabilities, we are able to offer specialised expertise across asset classes. This has helped us to become a trusted partner to our individual and institutional investors.
We remain committed to our long-term perspective and disciplined investment approach as we conduct a rigorous, fundamental analysis of investments with a strong emphasis on risk management. Although the investment landscape appears favourable, it is worth remembering that markets are dynamic and constantly evolving. Therefore, we believe active, professional investment management serves investors well. Amid changing markets and economic conditions, we are confident that investors with a well-diversified portfolio and a patient, long-term outlook should be well positioned for the years ahead.
Together we thrive.
Warm regards,
Ravi Menon
Chief Executive Officer, HSBC Global Asset Management, India

3
SPONSORHSBC Securities and Capital Markets (India) Private LimitedRegd. Office: 52/60, Mahatma Gandhi Road, Fort, Mumbai - 400 001.
TRUSTEEBoard of TrusteesOffice: 16, Veer Nariman Road, Fort, Mumbai 400 001.
ASSET MANAGEMENT COMPANYHSBC Asset Management (India) Private LimitedCorp. & Regd. Office: 16, Veer Nariman Road, Fort, Mumbai 400 001.
CUSTODIANStandard Chartered Bank (SCB)Corp. & Regd. Office: Crescenzo, Securities Services, 3rd Floor, C-38/39, G-Block, Bandra Kurla Complex, Bandra East, Mumbai – 400051.
AUDITORS TO THE SCHEMEBSR & Co. LLPChartered Accountants 5th Floor, Lodha Excelus, Apollo Mills Compound, N.M. Joshi Marg, Mahalaxmi, Mumbai 400 011.
REGISTRAR & TRANSFER AGENTSComputer Age Management Services Private Limited (CAMS)Unit: HSBC Mutual Fund ’C’ Block, 2nd Floor, Hanudev Info Park P. Ltd., SF No. 558/2, Udayampalayam Road, Nava India, Coimbatore - 641 028.
BOARD OF TRUSTEESMr. Nasser Munjee
Mr. Manu Tandon
Mr. Mehli Mistri
Mr. Dilip J. Thakkar
Ms. Jasmine Batliwalla
Mr. Pedro Bastos
BOARD OF DIRECTORSMs. Kishori J. Udeshi - Chairperson
Mr. S. P. Mustafa
Mr. Dinesh Mittal
Mr. Ravi Menon - Chief Executive Officer

4
The Trustees of HSBC Mutual Fund (“Fund”) present the Sixteenth Annual Report and the audited abridged financial statements of the schemes of the Fund for the year ended March 31, 2018.
As at March 31, 2018, the Fund offered 30 schemes across asset classes to meet the varying investment needs of the investors. Notably, three Schemes of HSBC Mutual Fund viz. HSBC Large Cap Equity Fund, HSBC Short Duration Fund and HSBC Cash Fund have completed 15 years of operations during the year.
During the year, the Fund has launched Plan(s) under Fixed Term Series and carried out merger of the existing schemes viz HSBC Dividend Yield Equity Fund merged into HSBC Multi Cap Equity Fund (HMEF), erstwhile HSBC India Opportunities Fund, as offering sub-scale fund was not in the interest of the unitholders.
Further, in order to bring uniformity in the practice across Mutual Funds and to standardize the scheme categories and characteristics of schemes, SEBI vide its circular no. SEBI/HO/IMD/DF3/CIR/P/2017/114 dated October 06, 2017, issued guidelines for categorization and rationalization of Mutual Fund schemes.
Accordingly, HSBC Large Cap Equity Fund (erstwhile HSBC Equity Fund), HSBC Small Cap Equity Fund (erstwhile HSBC Mid Cap Equity Fund) , HSBC Infrastructure Equity Fund, HSBC Global Emerging Market Fund (erstwhile HSBC Emerging Market Fund), HSBC Debt Fund (erstwhile HSBC Income Fund – Investments Plan), HSBC Short Duration Fund (erstwhile HSBC Income Fund – Short Term Plan), HSBC Low Duration Fund (erstwhile HSBC Ultra Short Term Bond Fund), HSBC Regular Savings Fund (erstwhile HSBC Monthly Income Plan) and HSBC Managed Solutions have undergone fundamental attributes changes with effective from March 14, 2018.
The Fund continues its focus on delivering consistent long term returns. The comments on the performance of the Scheme(s) is provided hereinafter. Dividends were declared under various schemes as per the provisions contained in the respective Scheme Information Documents after considering the distributable surplus available under the respective Schemes. Details of dividends declared can be viewed on our website at www.assetmanagement.hsbc.com/in.
1. Scheme Performance, future outlook and oPerationS of the SchemeS
a. Operations and Performance of the Schemes
HSBC Managed Solutions (HMS) (An open ended fund of fund Scheme investing in a basket of equity, debt, Gold and other Exchange Traded Funds)
HMS seeks to provide long term total return primarily by seeking capital appreciation through an active asset allocation with diversification commensurate with the risk profile of investments by investing predominantly in units of equity mutual funds as well as in a basket of debt mutual funds, gold exchange traded funds (ETFs) and other ETFs, offshore mutual funds and money market instruments.
The Scheme has three plans – Conservative Plan, Growth Plan and the Moderate Plan. The plans under the Scheme will invest predominantly in the existing and / or prospective schemes of HSBC Mutual Fund, units of third party domestic mutual funds, units of offshore equity oriented funds managed by HSBC Global Asset Management, gold ETFs and other ETFs of third parties until such time that the Fund doesn’t have such scheme offerings.
The net assets of HMS – Conservative Plan amounted to Rs. 286.23 crores as at March 31, 2018 as compared to Rs. 344.32 crores as at March 31, 2017. Around 99.47% of the net assets was invested in mutual fund schemes, 0.53% of the net assets comprised of reverse repos/CBLO and net current assets as at March 31, 2018. The net assets of HMS – Growth Plan amounted to Rs. 156.65 crores as at March 31, 2018 as compared to Rs. 140.90 crores as at March 31, 2017. Around 98.68% of the net assets were invested in Mutual fund schemes, 1.32% of the net assets comprised of reverse repos/CBLO and net current assets as at March 31, 2018. The net assets of HMS – Moderate Plan amounted to Rs. 264.35 crores as at March 31, 2018 as compared to Rs. 215.58 crores as at March 31, 2017. Around 99.01% of the net assets were invested in mutual fund schemes, 0.99% of the net assets comprised of reverse repos/CBLO and net current assets as at March 31, 2018
The performance of HMS – Growth Plan is benchmarked against Composite Index constituting 80% of BSE 200 Index and 20% of CRISIL Composite Bond Index while the performance of HMS – Moderate
Trustees’ ReportFor the year ended March 31, 2018

5
Plan is benchmarked against CRISIL Balanced Fund Index. The performance of HMS – Conservative Plan is benchmarked against Composite Index constituting of 90% into CRISIL Composite Bond Index and 10% of BSE 200 Index. All three sleeves underperformed due to allocation to fixed income which remained volatile during the year and also, equity asset class underperformed apart from volatility in fixed income market.
HSBC Managed Solutions - Growth
Scheme Name & Benchmarks Absolute Returns
(%)
Compounded Annualized Returns (%)
Date of Inception : 30 April 2014 1 Year 3 Years Since Inception
HSBC Managed Solutions - Growth - Growth 11.27 11.01 14.90
Customised Benchmark Index Fund (Scheme Benchmark)* 12.93 9.69 14.46
Nifty 50 (Standard Benchmark) 13.33 7.99 12.55
CRISIL 10 Year Gilt Index (Standard Benchmark) -0.25 6.45 8.39
Rs. 10,000, if invested in HMSG, would have become 11,130 13,688 17,218
Rs. 10,000, if invested in Customised Benchmark Index, would have become 11,297 13,204 16,962
Rs. 10,000, if invested in Nifty 50, would have become 11,337 12,599 15,881
Rs. 10,000, if invested in CRISIL 10 Year Gilt Index, would have become 9,975 12,067 13,705
*Composite index of S&P BSE 200 (80%) and CRISIL Composite Bond Fund Index (20%).
HSBC Managed Solutions - Moderate
Scheme Name & Benchmarks Absolute Returns
(%)
Compounded Annualized Returns (%)
Date of Inception : 30 April 2014 1 Year 3 Years Since Inception
HSBC Managed Solutions - Moderate - Growth 10.02 10.43 13.42
CRISIL Hybrid 35+65 - Aggressive Index (Scheme Benchmark) 11.05 9.54 13.48
Nifty 50 (Standard Benchmark) 13.33 7.99 12.55
CRISIL 10 Year Gilt Index (Standard Benchmark) -0.25 6.45 8.39
Rs. 10,000, if invested in HMSM, would have become 11,005 13,474 16,367
Rs. 10,000,if invested in CRISIL Hybrid 35+65 would have become 11,108 13,150 16,401
Rs. 10,000, if invested in Nifty 50, would have become 11,337 12,599 15,881
Rs. 10,000, if invested in CRISIL 10 Year Gilt Index, would have become 9,975 12,067 13,705
HSBC Managed Solutions - Conservative
Scheme Name & Benchmarks Absolute Returns
(%)
Compounded Annualized Returns (%)
Date of Inception : 30 April 2014 1 Year 3 Years Since Inception
HSBC Managed Solutions - Conservative - Growth 4.79 6.79 8.76
Customised Benchmark Index Fund (Scheme Benchmark)* 6.54 8.48 10.46
Nifty 50 (Standard Benchmark) 13.33 7.99 12.55
CRISIL 10 Year Gilt Index (Standard Benchmark) -0.25 6.45 8.39
Trustees’ ReportFor the year ended March 31, 2018 (Contd...)

6
Scheme Name & Benchmarks Absolute Returns
(%)
Compounded Annualized Returns (%)
Date of Inception : 30 April 2014 1 Year 3 Years Since Inception
Rs. 10,000, if invested in HMSC, would have become 10,480 12,183 13,889
Rs. 10,000, if invested in Customised Benchmark Index, would have become 10,656 12,772 14,758
Rs. 10,000, if invested in Nifty 50, would have become 11,337 12,599 15,881
Rs. 10,000, if invested in CRISIL 10 Year Gilt Index, would have become 9,975 12,067 13,705
*Composite index of CRISIL Composite Bond Fund Index (90%) and S&P BSE 200 (10%).
Past performance may or may not be sustained in future. The returns for the respective periods are provided as on last business day of March 2018 for Growth Option. Different plans shall have a different expense structure. Performance of the respective benchmark is calculated as per the Total Return Index (TRI).
b. Market Overview & Outlook (as furnished by HSBC Asset Management (India) Private Limited)
EqUITY OUTLOOKIndian equity markets continued to remain strong during fiscal year 2017-18 and posted gains of 11.76% by S&P CNX Nifty and 13.24% by BSE Midcap index respectively. Biggest drivers of the markets were, robust DII flow into equities, continued push of mega reforms – Goods and Services Tax (GST) implementation, Insolvency and Bankruptcy Code implementation, Real Estate (Regulation and Development) Act, second consecutive normal monsoon, and electoral victories of the ruling party in many state elections. On the other hand, the markets weather the storm of disruption in economy due to GST implementation, lingering impact of demonetization, muted FII flows, and rising yields in developed markets. Domestic Mutual Fund segment had their best ever year and they brought in ~USD 22 bn of net inflows in equities during the year. Even after witnessing ~USD 4.3 bn of net outflows from the domestic insurers, the net DII tally was a very impressive ~USD 17.7 bn of net inflows. There were mixed global cues well and the Foreign Institutional Investors (FIIs) net bought Indian equities worth USD 3.2 bn. The inflows by both FIIs and domestic MFs acted as a factor in the strong market performance.
Indices Returns (April 1, 2017 to March 31, 2018) 1 Year (%)
S&P BSE Sensex 12.70%
NSE CNX Nifty 11.76%
S&P BSE 100 12.12%
S&P BSE 200 12.49%
S&P BSE 500 13.21%
S&P BSE Midcap 14.31%
S&P BSE 250 Small-cap 14.13%
Source: Bloomberg (All values are total return)
Our view on the key aspects related to equity markets are presented below -
The impressive performance in equity markets during FY 2017-18 has come on the back of strong liquidity largely by domestic MFs but supported in party by FII flows, positive global growth, benign macro – both domestically and global, expectation of the continuation of favorable policy environment domestically and expectation of corporate earnings revival. Possibility of sound macro, economic reforms and implementation of existing reforms have increased, especially after continued success of the ruling party at the centre in state elections. However, after this strong performance in markets and rather long wait for earnings to be delivered has meant that the equity markets are currently trading above their historical averages.
Trustees’ ReportFor the year ended March 31, 2018 (Contd...)

7
Moving into FY 2018-19, we expect a continuation of the economic recovery process domestically, recovery in corporate earnings - led early by volume growth, and continued DII flows. Government led investment spending and rural consumption are likely to lead with private sector investments contributing later (possibly after general elections 2019). The budget document that was presented in early February provides a good medium term policy direction for the economy. Occasionally the policy actions can serve up a few bumps and jolts but over the medium term, across different governments, there is a thread of continuity connecting many key economic policies such as in the case of this year’s union budget. We, in our investment process, prefer to take comfort in these threads of continuity and remain constructive on the India growth story. This makes us positive on the Indian equity markets over the medium to long term.
Risks are in the form of market valuations trending above historical averages, weaker than expected delivery in corporate earnings going forward, external news flows related to trade protectionism, developed market central banks raising rates prematurely, and geopolitical tensions and other eco-political events would also influence market performance going forward, as the recent rally in the markets was supported by strong FII inflows.
DEBT OUTLOOKFixed Income in Financial Year 2017-18 has seen volatility further step up in this year. Markets went to perfect storm with higher crude prices, low liquidity and pressure on currency, apart from rate hike expectations.
Inflation has followed the glide path to lower numbers towards 4% RBI target and even lower than the target number when inflation printed a lowly 1.46% in June 2018 on back of lower food prices. RBI went for a cut despite of neutral stance. This positivity continued till until crude shock came in form of higher crude process. Global prices of Brent crude saw substantial increase in second half of the year, which jeopardized the inflation path. Other worries that gathered around this time were related to GST collection and eventual impact on fiscal situation.
Government of India allowed the fiscal deficit to slip to 3.5% (budget 3.2%) and kept next year target at 3.3% (in place of earlier path of 3%). This was on back of some excise relaxation for oil products and a month less collected for GST due to implementation in the current year. The fear of fiscal slippage alongwith the announcement of higher bond issuances spooked the bond markets into higher yields. Government finally borrowed only INR 90 bln extra (in place of INR 500 bln announced initially).
On the Monetary front the year was very volatile as well. RBI changed its stance to neutral causing some worry around rate hikes. Thereafter it cut rates and again went for OMO sales operations simultaneously. This created some confusion in the market participants regarding rates direction. Finally extra supply, higher oil prices and higher inflation paved way for rates higher. RBI also held position on regulatory forbearance about spreading out losses by banks publicly. It eventually gave up the position in the end of March. However, the swift changes in stance caused lot of pressure and volatility in bonds.
Liquidity situation continuously deteriorated due to OMO sales initially and withdrawal of deposits due to remonetisation. Further liquidity was absorbed out due to portfolio outflows and reduction in reserves. Despite of defense from RBI utilizing the reserves, the currency depreciated meaningfully, which caused further jitters in foreign investor sentiments. Lack of liquidity also affected 1-3 year rates which were elevated in second half of the year.
Going forward following are key variables to watch out for:
• Liquidity: Liquidity will drive short end rates and eventually drive decisions leading to market interventions and CRR cuts. RBI has focused now on neutral liquidity stance and providing liquidity to system, which will bode well short end rates.
• Inflation: Inflation numbers will determine future course of action for RBI and remains a critical variable for policy. We expect inflation to remain at 4.7% level in the ease in second half of FY 2018-19 in line with RBI’s expectations.
• Growth: GDP growth numbers as well as industrial activity will also determine the decision on policy.
• Fiscal deficit: Fiscal deficit and government spending will determine the government borrowing and crowding out in interest rate curve. We expect prudence in government spending and prospect of spending on infrastructure to pick up which will crowd in private investment as well.
Trustees’ ReportFor the year ended March 31, 2018 (Contd...)

8
• Current Account Deficit: Current Account Deficit determines how the pressure on currency works and effective management of forex reserves.
• Currency levels: Level of INR will determine how the central bank reacts to the situation on the global crisis etc.
2. Brief Background of SPonSorS, Board of truSteeS and aSSet management comPany
a. Sponsor
HSBC Mutual Fund is sponsored by HSBC Securities and Capital Markets (India) Private Limited (HSCI). The Sponsor is the Settler of the Mutual Fund Trust. The Sponsor has entrusted a sum of Rs. 1,00,000 (Rupees One Lakh only) to the Trustee as the initial contribution towards the corpus of the Mutual Fund.
HSCI offers integrated investment banking services, securities and corporate finance & advisory. HSCI is a member of the Bombay Stock Exchange Limited and National Stock Exchange (capital and derivative market segments). HSCI holds 100% of the paid up equity share capital of HSBC Asset Management (India) Private Limited.
b. HSBC Mutual Fund
HSBC Mutual Fund (“the Mutual Fund” or “the Fund”) has been constituted as a Trust in accordance with the provisions of the Indian Trusts Act, 1882 (2 of 1882) vide a Trust Deed dated February 7, 2002 with HSBC Securities and Capital Markets (India) Private Limited, as the Sponsor and the Board of Individual Trustees. The Trustee has entered into an Investment Management Agreement dated February 7, 2002 with HSBC Asset Management (India) Private Limited (AMC) to function as the Investment Manager for all the schemes of the Fund. The Fund was registered with SEBI vide registration number MF/046/02/5 dated May 27, 2002.
The Trust has been formed for the purpose of pooling of capital from the public for collective investment in securities for the purpose of providing facilities for participation by persons as beneficiaries in such investments and in the profits/income arising therefrom.
c. Board of Trustees (the Trustees)
The Board of Trustees is the exclusive owner of the Trust Fund and holds the same in trust for the benefit of the unit holders. The Trustees have been discharging their duties and carrying out the responsibilities as provided in the SEBI (Mutual Funds) Regulations, 1996 and the Trust Deed. The Trustees seek to ensure that the Fund and the schemes floated there under are managed by the AMC in accordance with the Trust Deed, the said Regulations, directions and guidelines issued by the SEBI, the Stock Exchanges, the Association of Mutual Funds in India and other regulatory agencies.
d. Asset Management Company (the AMC)
HSBC Asset Management (India) Private Limited (the Investment Manager or the AMC) is a private limited company incorporated under the Companies Act, 1956 on December 12, 2001 having its Registered Office at 16, V. N. Road, Fort, Mumbai 400 001. HSBC Asset Management (India) Private Limited has been appointed as the Asset Management Company of HSBC Mutual Fund by the Trustee vide Investment Management Agreement (IMA) dated February 7, 2002 and executed between the Trustees and the AMC. SEBI approved the AMC to act as the Investment Manager of the Fund vide its letter No. MFD/BC/163/2002 dated May 27, 2002. The paid-up equity share capital of the AMC is Rs. 61.59 crores. The AMC is registered as a Portfolio Manager under the SEBI (Portfolio Managers) Regulations, 1993 vide registration no. INP000001322. The AMC also offers non-binding Advisory services to offshore funds under the mutual fund license.
HSBC Securities and Capital Markets (India) Private Limited holds 100% of the paid up equity share capital of the AMC.
3. inveStment oBjective of the SchemeS The investment objective of the respective schemes has been provided above under the heading “Scheme
Performance, Future Outlook and Operation of the Scheme” (Refer Section 1).
Trustees’ ReportFor the year ended March 31, 2018 (Contd...)

9
4. Significant accounting PolicieS The Significant Accounting Policies form part of the Notes to the Accounts annexed to the Balance Sheet
of the Schemes in the Full Annual Report. The accounting policies are in accordance with Securities Exchange Board of India (Mutual Funds) Regulations 1996.
5. unclaimed dividendS & redemPtionS Number of investors & corresponding amount as on March 31, 2018 is Nil.
6. inveStor ServiceSThe number of official points of acceptance of transactions is 205 locations. In addition to the offices of the Registrar & Transfer agents, the AMC has Investor Service Centres in 9 locations at its own offices - namely Mumbai, New Delhi, Kolkata, Bangaluru, Pune, Ahmedabad, Hyderabad, Chandigarh and Chennai. With a view to enhance customer convenience, the AMC has the facility of priority based servicing to key distributors through the enhancement of the Interactive Voice Reponses. The AMC has a single Toll Free number which can be dialed from anywhere in India. The call centre service is being managed by the Registrar and Transfer Agents.
On the distribution front, the number of empanelled distributors was 460 as on March 31, 2018. During the year, the AMC initiated tie-ups for online distribution of the Mutual Fund’s schemes with several channel partners taking the total number of such tie-ups to 42.
7. detailS of inveStor grievance redreSSalThe details of the redressal of investor complaints received against HSBC Mutual Fund during April 2017 - March 2018 are as follows:
2017-2018
Com- plaint Code
Type of complaint (a) No. of complaints
pending at the
beginning of the year
(b) No. of complaints received during
the year
Action on (a) and (b)
Resolved Non Actiona-
ble*
Pending
Within 30
days
30 - 60 days
60 - 180 days
Beyond 180 days
0 - 3 months
3 - 6 months
6 - 9 months
9 - 12 months
I A Non receipt of Dividend on Units
0 5 4 1 0 0 0 0 0 0 0
I B Interest on delayed payment of Dividend
0 0 0 0 0 0 0 0 0 0 0
I C Non receipt ofRedemption Proceeds
1 12 12 1 0 0 0 1 0 0 0
I D Interest on delayedp a y m e n t o f Redemption
0 1 1 0 0 0 0 0 0 0 0
II A Non receipt of Statement of Account / Unit Certificate
0 0 0 0 0 0 0 0 0 0 0
II B D i s c r e p a n c y i n Statement of Account
0 0 0 0 0 0 0 0 0 0 0
II C Data corrections in Investor details **
0 34 34 0 0 0 0 0 0 0 0
II D Non receipt of Annual Report /Abridged Summary
0 0 0 0 0 0 0 0 0 0 0
III A Wrong switch between Schemes
0 0 0 0 0 0 0 0 0 0 0
Trustees’ ReportFor the year ended March 31, 2018 (Contd...)

10
2017-2018
Com- plaint Code
Type of complaint (a) No. of complaints
pending at the
beginning of the year
(b) No. of complaints received during
the year
Action on (a) and (b)
Resolved Non Actiona-
ble*
Pending
Within 30
days
30 - 60 days
60 - 180 days
Beyond 180 days
0 - 3 months
3 - 6 months
6 - 9 months
9 - 12 months
III B Unauthorized switch between Schemes
0 0 0 0 0 0 0 0 0 0 0
III C Deviation from Scheme attributes
0 0 0 0 0 0 0 0 0 0 0
III D Wrong or excess charges / load
0 0 0 0 0 0 0 0 0 0 0
III E Non updat ion of changes viz. address, PAN, bank details, nomination, etc
0 6 6 0 0 0 0 0 0 0 0
IV Others 1 41 42 0 0 0 0 0 0 0 0
Total 2 99 99 2 0 0 0 0 0 0 0
Summary of Complaints for FY 2017-18
Particulars Count
Total complaints received 99
Total number of folios 140099
% of complaints against the folio 0.071%
# active folios** As per AMFI Best Practice Guidelines Circular No.25/2011-12 for Revisions in the Guidelines on
Standardization of Complaints/Grievances Reporting Procedure. If “Others” include a type of complaint which is more than 10% of overall complaints, then such a reason should be provided separately. Hence data corrections in Investor Details is included as a separate category
* Non actionable means the complaint is incomplete / outside the scope of the mutual fund
8. inveStor education initiativeS The Fund undertook various investor education and awareness initiatives related to investments in mutual funds throughout India in English / Hindi and Regional languages via mass media. The Fund conducted 16 roadshows at various locations in India to promote various Investor Awareness related topics including Asset Allocation, SIPs, Equity Mutual Funds and Financial Planning. The Fund has a Year-long tie-up with Mutual Fund Insights Magazine that includes 3 pages of content and advertorial publication in their monthly issue. Each issue contains a story promoting SIPs to achieve one’s various investment goals. In the month of December 2017 and January 2018 investor awareness promotion was done through Outlook and Outlook Money magazines through advertorials on various Mutual Fund topics.
9. Statutory detailSa) The Sponsors are not responsible or liable for any loss resulting from the operation of the Schemes of
the Fund beyond initial contribution of Rs. 1 lakh for setting up the Fund.
b) The price and redemption value of the units, and income from them, can go up as well as down with fluctuations in the market value of its underlying investments.
c) Full Annual Report shall be disclosed on the website at www.assetmanagement.hsbc.com/in and shall be available for inspection at the Head Office of the Mutual Fund. Present and prospective unit holders
Trustees’ ReportFor the year ended March 31, 2018 (Contd...)

11
can obtain copy of the Trust Deed, the full Annual Report of the Scheme(s), the Annual Report of HSBC Asset Management (India) Private Limited and the text of the relevant Scheme(s) at a price.
10. acknowledgementSThe Trustees wish to thank the Unit holders of the Schemes for their support throughout the year and also thank the Government of India, the Securities and Exchange Board of India (SEBI), the Reserve Bank of India (RBI) and the Association of Mutual Funds in India (AMFI) for the guidance provided by them. The Trustees also appreciate the services provided by the Registrar and Transfer Agent, Fund Accountant, Custodian, Bankers, Distributors and Brokers. The guidance and services provided by the Auditors and advocates and the ebullience, sincerity and dedication of the employees of HSBC Asset Management (India) Private Limited is also appreciated.
The Trustees look forward to the continued support of everyone.
For and on behalf of the Board of Trustees of HSBC Mutual Fund
Sd/-
Dilip Thakkar
Trustee
Mumbai
July 17, 2018.
Trustees’ ReportFor the year ended March 31, 2018 (Contd...)

12
Independent Auditors’ Report
To the Board of Trustees
HSBC Mutual Fund – HSBC Managed Solution India – Growth
Report on the Financial StatementsWe have audited the accompanying Financial Statements of HSBC Managed Solution India – Growth (the ‘Scheme’), which comprise the balance sheet as at 31 March 2018 and the related revenue account for the year then ended, and a summary of significant accounting policies and other explanatory information, annexed thereto.
Management’s responsibility for the Financial StatementsThe Board of Trustees to the HSBC Mutual Fund (the ‘Board of Trustees’) and HSBC Asset Management (India) Private Limited (the ‘AMC’), being the investment manager to HSBC Mutual Fund (the ‘Fund’) (collectively referred as ‘Management’), are responsible for the preparation of these financial statements that give a true and fair view of the financial position and financial performance of the Scheme in accordance with the accounting policies and standards specified in the Ninth Schedule of the Securities and Exchange Board of India (Mutual Funds) Regulations, 1996, as amended (the ‘Regulations’) and the accounting principles generally accepted in India. This responsibility includes maintenance of adequate accounting records for safeguarding of the assets of the Scheme and for preventing and detecting frauds and other irregularities; selection and application of appropriate accounting policies; making judgments and estimates that are reasonable and prudent; and design, implementation and maintenance of adequate internal financial controls, that were operating effectively for ensuring the accuracy and completeness of the accounting records, relevant to the preparation and presentation of the financial statements that give a true and fair view and are free from material misstatement, whether due to fraud or error.
In preparing the financial statements, management is responsible for assessing the Scheme’s ability to continue as a going concern, disclosing, as applicable, matters related to going concern and using the going concern basis of accounting unless management either intends to liquidate the Fund or to cease operations, or has no realistic alternative but to do so.
Auditor’s responsibilityOur responsibility is to express an opinion on these financial statements based on our audit. We conducted our audit in accordance with the Standards on Auditing issued by the Institute of Chartered Accountants of India (the ‘ICAI’). Those Standards require that we comply with ethical requirements and plan and perform the audit to obtain reasonable assurance about whether the financial statements are free from material misstatement.
An audit involves performing procedures to obtain audit evidence about the amounts and disclosures in the financial statements. The procedures selected depend on the auditor’s judgment, including the assessment of the risks of material misstatement of the financial statements, whether due to fraud or error. In making those risk assessments, the auditor considers internal controls relevant to preparation and fair presentation of the financial statements, of the Scheme, in order to design audit procedures that are appropriate in the circumstances, but not for the purpose of expressing an opinion on the effectiveness of the Scheme’s internal controls. An audit also includes evaluating the appropriateness of accounting policies used and the reasonableness of the accounting estimates made by Management, as well as evaluating the overall presentation of the financial statements.
We are also responsible to conclude on the appropriateness of management’s use of the going concern basis of accounting and, based on the audit evidence obtained, whether a material uncertainty exists related to events or conditions that may cast significant doubt on the Scheme’s ability to continue as a going concern. If we conclude that a material uncertainty exists, we are required to draw attention in the auditor’s report to the related disclosures in the financial statements or, if such disclosures are inadequate, to modify the opinion. Our conclusions are based on the audit evidence obtained up to the date of the auditor’s report. However, future events or conditions may cause the Scheme to cease to continue as a going concern.
We believe that the audit evidence we have obtained is sufficient and appropriate to provide a basis for our audit opinion.

13
Independent Auditors’ Report (Contd...)
OpinionIn our opinion, and to the best of our information and according to the explanations given to us, the aforesaid financial statements give the information required by the Regulations in the manner so required and give a true and fair view in conformity with the accounting principles generally accepted in India:
(i) in the case of the balance sheet, of the state of affairs of the Scheme as at 31 March 2018; and
(ii) in the case of the revenue account, of the net surplus for the year ended on that date.
Report on other Legal and Regulatory Requirements1 As required by Regulation 55(4) to the Regulations, we report that:
(a) We have obtained all information and explanations which, to the best of our knowledge and belief, were necessary for the purposes of the audit;
(b) The balance sheet and revenue account have been prepared in accordance with the accounting policies and standards specified in the Ninth Schedule of the Regulations.
2 As required by Clause 5(ii)(2) of the Eleventh Schedule of the Regulations, we report that the balance sheet and revenue account are in agreement with the books of account of the Scheme.
3 In our opinion and on the basis of information and explanations given to us, the methods used to value non - traded securities, as at 31 March 2018, as determined by the Board of Directors of AMC, are in accordance with the Regulations and other guidelines issued by the Securities and Exchange Board of India as applicable and approved by the Board of Trustees are fair and reasonable.
For B S R & Co. LLP Chartered Accountants Firm’s Registration No: 101248W/W-100022
Sd/-
Milind Ranade Partner Membership No: 100564
Place : Mumbai Date : 17 July 2018.
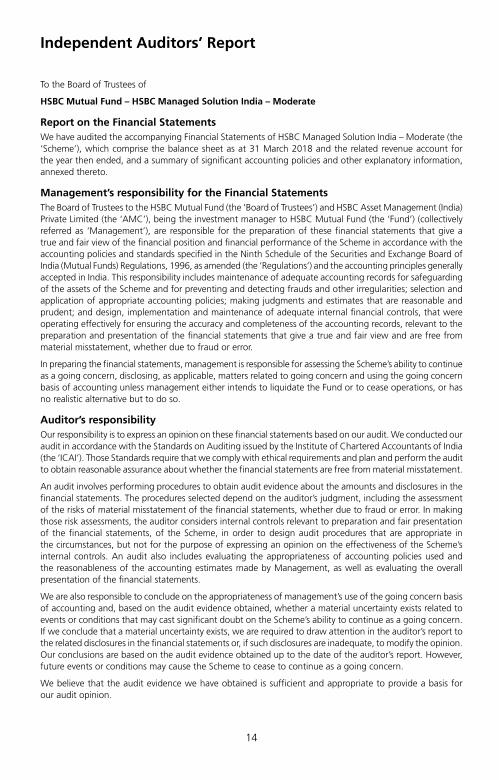
14
Independent Auditors’ Report
To the Board of Trustees of
HSBC Mutual Fund – HSBC Managed Solution India – Moderate
Report on the Financial StatementsWe have audited the accompanying Financial Statements of HSBC Managed Solution India – Moderate (the ‘Scheme’), which comprise the balance sheet as at 31 March 2018 and the related revenue account for the year then ended, and a summary of significant accounting policies and other explanatory information, annexed thereto.
Management’s responsibility for the Financial StatementsThe Board of Trustees to the HSBC Mutual Fund (the ‘Board of Trustees’) and HSBC Asset Management (India) Private Limited (the ‘AMC’), being the investment manager to HSBC Mutual Fund (the ‘Fund’) (collectively referred as ‘Management’), are responsible for the preparation of these financial statements that give a true and fair view of the financial position and financial performance of the Scheme in accordance with the accounting policies and standards specified in the Ninth Schedule of the Securities and Exchange Board of India (Mutual Funds) Regulations, 1996, as amended (the ‘Regulations’) and the accounting principles generally accepted in India. This responsibility includes maintenance of adequate accounting records for safeguarding of the assets of the Scheme and for preventing and detecting frauds and other irregularities; selection and application of appropriate accounting policies; making judgments and estimates that are reasonable and prudent; and design, implementation and maintenance of adequate internal financial controls, that were operating effectively for ensuring the accuracy and completeness of the accounting records, relevant to the preparation and presentation of the financial statements that give a true and fair view and are free from material misstatement, whether due to fraud or error.
In preparing the financial statements, management is responsible for assessing the Scheme’s ability to continue as a going concern, disclosing, as applicable, matters related to going concern and using the going concern basis of accounting unless management either intends to liquidate the Fund or to cease operations, or has no realistic alternative but to do so.
Auditor’s responsibilityOur responsibility is to express an opinion on these financial statements based on our audit. We conducted our audit in accordance with the Standards on Auditing issued by the Institute of Chartered Accountants of India (the ‘ICAI’). Those Standards require that we comply with ethical requirements and plan and perform the audit to obtain reasonable assurance about whether the financial statements are free from material misstatement.
An audit involves performing procedures to obtain audit evidence about the amounts and disclosures in the financial statements. The procedures selected depend on the auditor’s judgment, including the assessment of the risks of material misstatement of the financial statements, whether due to fraud or error. In making those risk assessments, the auditor considers internal controls relevant to preparation and fair presentation of the financial statements, of the Scheme, in order to design audit procedures that are appropriate in the circumstances, but not for the purpose of expressing an opinion on the effectiveness of the Scheme’s internal controls. An audit also includes evaluating the appropriateness of accounting policies used and the reasonableness of the accounting estimates made by Management, as well as evaluating the overall presentation of the financial statements.
We are also responsible to conclude on the appropriateness of management’s use of the going concern basis of accounting and, based on the audit evidence obtained, whether a material uncertainty exists related to events or conditions that may cast significant doubt on the Scheme’s ability to continue as a going concern. If we conclude that a material uncertainty exists, we are required to draw attention in the auditor’s report to the related disclosures in the financial statements or, if such disclosures are inadequate, to modify the opinion. Our conclusions are based on the audit evidence obtained up to the date of the auditor’s report. However, future events or conditions may cause the Scheme to cease to continue as a going concern.
We believe that the audit evidence we have obtained is sufficient and appropriate to provide a basis for our audit opinion.

15
Independent Auditors’ Report (Contd...)
OpinionIn our opinion, and to the best of our information and according to the explanations given to us, the aforesaid financial statements give the information required by the Regulations in the manner so required and give a true and fair view in conformity with the accounting principles generally accepted in India:
(i) in the case of the balance sheet, of the state of affairs of the Scheme as at 31 March 2018; and
(ii) in the case of the revenue account, of the net surplus for the year ended on that date.
Report on other Legal and Regulatory Requirements1 As required by Regulation 55(4) to the Regulations, we report that:
(a) We have obtained all information and explanations which, to the best of our knowledge and belief, were necessary for the purposes of the audit;
(b) The balance sheet and revenue account have been prepared in accordance with the accounting policies and standards specified in the Ninth Schedule of the Regulations.
2 As required by Clause 5(ii)(2) of the Eleventh Schedule of the Regulations, we report that the balance sheet and revenue account are in agreement with the books of account of the Scheme.
3 In our opinion and on the basis of information and explanations given to us, the methods used to value non - traded securities, as at 31 March 2018, as determined by the Board of Directors of AMC, are in accordance with the Regulations and other guidelines issued by the Securities and Exchange Board of India as applicable and approved by the Board of Trustees are fair and reasonable.
For B S R & Co. LLP Chartered Accountants Firm’s Registration No: 101248W/W-100022
Sd/-
Milind Ranade Partner Membership No: 100564
Place : Mumbai Date : 17 July 2018.

16
Independent Auditors’ Report
To the Board of Trustees of
HSBC Mutual Fund – HSBC Managed Solutions India – Conservative
Report on the Financial StatementsWe have audited the accompanying Financial Statements of HSBC Managed Solution India – Conservative (the ‘Scheme’), which comprise the balance sheet as at 31 March 2018 and the related revenue account for the year then ended, and a summary of significant accounting policies and other explanatory information, annexed thereto.
Management’s responsibility for the Financial StatementsThe Board of Trustees to the HSBC Mutual Fund (the ‘Board of Trustees’) and HSBC Asset Management (India) Private Limited (the ‘AMC’), being the investment manager to HSBC Mutual Fund (the ‘Fund’) (collectively referred as ‘Management’), are responsible for the preparation of these financial statements that give a true and fair view of the financial position and financial performance of the Scheme in accordance with the accounting policies and standards specified in the Ninth Schedule of the Securities and Exchange Board of India (Mutual Funds) Regulations, 1996, as amended (the ‘Regulations’) and the accounting principles generally accepted in India. This responsibility includes maintenance of adequate accounting records for safeguarding of the assets of the Scheme and for preventing and detecting frauds and other irregularities; selection and application of appropriate accounting policies; making judgments and estimates that are reasonable and prudent; and design, implementation and maintenance of adequate internal financial controls, that were operating effectively for ensuring the accuracy and completeness of the accounting records, relevant to the preparation and presentation of the financial statements that give a true and fair view and are free from material misstatement, whether due to fraud or error.
In preparing the financial statements, management is responsible for assessing the Scheme’s ability to continue as a going concern, disclosing, as applicable, matters related to going concern and using the going concern basis of accounting unless management either intends to liquidate the Fund or to cease operations, or has no realistic alternative but to do so.
Auditor’s responsibilityOur responsibility is to express an opinion on these financial statements based on our audit. We conducted our audit in accordance with the Standards on Auditing issued by the Institute of Chartered Accountants of India (the ‘ICAI’). Those Standards require that we comply with ethical requirements and plan and perform the audit to obtain reasonable assurance about whether the financial statements are free from material misstatement.
An audit involves performing procedures to obtain audit evidence about the amounts and disclosures in the financial statements. The procedures selected depend on the auditor’s judgment, including the assessment of the risks of material misstatement of the financial statements, whether due to fraud or error. In making those risk assessments, the auditor considers internal controls relevant to preparation and fair presentation of the financial statements, of the Scheme, in order to design audit procedures that are appropriate in the circumstances, but not for the purpose of expressing an opinion on the effectiveness of the Scheme’s internal controls. An audit also includes evaluating the appropriateness of accounting policies used and the reasonableness of the accounting estimates made by Management, as well as evaluating the overall presentation of the financial statements.
We are also responsible to conclude on the appropriateness of management’s use of the going concern basis of accounting and, based on the audit evidence obtained, whether a material uncertainty exists related to events or conditions that may cast significant doubt on the Scheme’s ability to continue as a going concern. If we conclude that a material uncertainty exists, we are required to draw attention in the auditor’s report to the related disclosures in the financial statements or, if such disclosures are inadequate, to modify the opinion. Our conclusions are based on the audit evidence obtained up to the date of the auditor’s report. However, future events or conditions may cause the Scheme to cease to continue as a going concern.
We believe that the audit evidence we have obtained is sufficient and appropriate to provide a basis for our audit opinion.
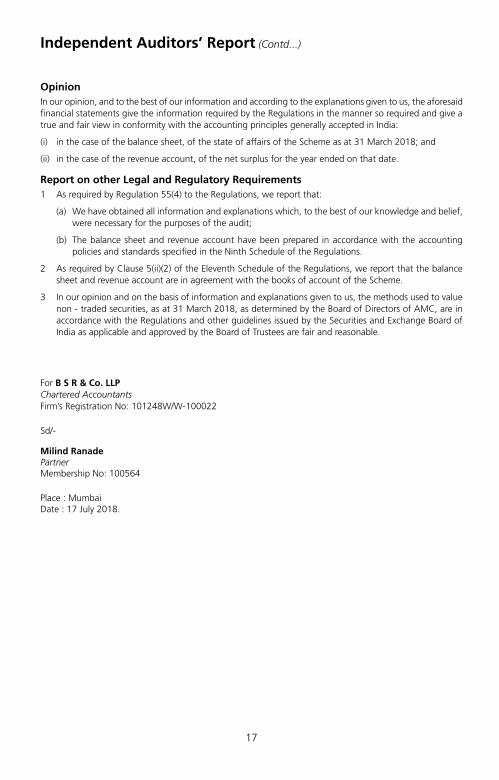
17
Independent Auditors’ Report (Contd...)
OpinionIn our opinion, and to the best of our information and according to the explanations given to us, the aforesaid financial statements give the information required by the Regulations in the manner so required and give a true and fair view in conformity with the accounting principles generally accepted in India:
(i) in the case of the balance sheet, of the state of affairs of the Scheme as at 31 March 2018; and
(ii) in the case of the revenue account, of the net surplus for the year ended on that date.
Report on other Legal and Regulatory Requirements1 As required by Regulation 55(4) to the Regulations, we report that:
(a) We have obtained all information and explanations which, to the best of our knowledge and belief, were necessary for the purposes of the audit;
(b) The balance sheet and revenue account have been prepared in accordance with the accounting policies and standards specified in the Ninth Schedule of the Regulations.
2 As required by Clause 5(ii)(2) of the Eleventh Schedule of the Regulations, we report that the balance sheet and revenue account are in agreement with the books of account of the Scheme.
3 In our opinion and on the basis of information and explanations given to us, the methods used to value non - traded securities, as at 31 March 2018, as determined by the Board of Directors of AMC, are in accordance with the Regulations and other guidelines issued by the Securities and Exchange Board of India as applicable and approved by the Board of Trustees are fair and reasonable.
For B S R & Co. LLP Chartered Accountants Firm’s Registration No: 101248W/W-100022
Sd/-
Milind Ranade Partner Membership No: 100564
Place : Mumbai Date : 17 July 2018.

18
Abridged Balance Sheet as at March 31, 2018
Rs. in Lakhs
HSBC MANAGED SOLUTIONS INDIA – GROWTH
As at March 31, 2018
As at March 31, 2017
LIABILITIES1 Unit Capital 9,092.85 8,992.86 2 Reserves & Surplus2.1 Unit Premium Reserves 742.84 690.56 2.2 Unrealised Appreciation Reserve 4,115.12 3,398.81 2.3 Other Reserves 1,713.90 1,011.08 3 Loans & Borrowings – – 4 Current Liabilities & Provisions4.1 Provision for doubtful Income/Deposits – – 4.2 Other Current Liabilities & Provisions 47.15 38.46
TOTAL 15,711.86 14,131.77
ASSETS1 Investments1.1 Listed Securities:1.1.1 Equity Shares – – 1.1.2 Preference Shares – – 1.1.3 Equity Linked Debentures – – 1.1.4 Other Debentures & Bonds – – 1.1.5 Securitised Debt securities – – 1.2 Securities Awaited Listing:1.2.1 Equity Shares – – 1.2.2 Preference Shares – – 1.2.3 Equity Linked Debentures – – 1.2.4 Other Debentures & Bonds – – 1.2.5 Securitised Debt securities – – 1.3 Unlisted Securities1.3.1 Equity Shares – – 1.3.2 Preference Shares – – 1.3.3 Equity Linked Debentures – – 1.3.4 Other Debentures & Bonds – – 1.3.5 Securitised Debt securities – – 1.4 Government Securities – – 1.5 Treasury Bills – – 1.6 Commercial Paper – – 1.7 Certificate of Deposits – – 1.8 Bill Rediscounting – – 1.9 Units of Domestic Mutual Fund 15,458.00 13,965.28 1.10 Foreign Securities – –
Total Investments 15,458.00 13,965.28
2 Deposits 1.94 0.44 3 Other Current Assets3.1 Cash & Bank Balance 0.15 3.22 3.2 CBLO/Reverse Repo Lending 185.46 129.42 3.3 Others 66.31 33.41 4 Deferred Revenue Expenditure (to the extent not written off) – –
TOTAL 15,711.86 14,131.77
Notes to Accounts – Annexure I

19
Abridged Revenue Account For the Year Ended March 31, 2018
Rs. in Lakhs
HSBC MANAGED SOLUTIONS INDIA – GROWTH
Current Year ended
March 31, 2018
Previous Year ended
March 31, 2017
1 INCOME1.1 Dividend – – 1.2 Interest 13.29 9.70 1.3 Realised Gain / (Loss) on Foreign Exchange Transactions – – 1.4 Realised Gains / (Losses) on Interscheme sale of investments – – 1.5 Realised Gains / (Losses) on External sale / redemption of
investments731.29 585.37
1.6 Realised Gains / (Losses) on Derivative Transactions – – 1.7 Other Income – –
(A) 744.58 595.07
2 EXPENSES2.1 Management fees – – 2.2 GST / Service tax on Management fees – – 2.3 Transfer agents fees and expenses 9.67 7.18 2.4 Custodian fees 1.67 1.65 2.5 Trusteeship fees 0.31 0.26 2.6 Commission to Agents 122.45 100.57 2.7 Marketing & Distribution expenses 0.24 0.32 2.8 Audit fees 0.91 0.79 2.9 Investor Education Expenses 3.02 2.61 2.10 Other operating expenses 4.51 3.27 2.11 Less: Expenses to be Reimbursed by the Investment Manager (66.18) (33.37)
(B) 76.60 83.28
3 NET REALISED GAINS / (LOSSES) FOR THE YEAR (A –B = C) 667.98 511.79
4 Change in Unrealised Depreciation in value of investments*** (D) – –
5 NET GAINS / (LOSSES) FOR THE YEAR [E=(C+D)] 667.98 511.79
6 Change in unrealised appreciation in the value of investments and derivatives (F) 716.31 2,366.22
7 NET SURPLUS / (DEFICIT) FOR THE YEAR (E + F = G) 1,384.29 2,878.01
7.1 Add: Balance transfer from Unrealised Appreciation Reserve – –
7.2 Less: Balance transfer to Unrealised Appreciation Reserve 716.31 2,366.22
7.3 Add / (Less): Equalisation 34.84 (64.33)
7.4 Transfer from Reserve Fund 1,011.08 563.62
8 Total 1,713.90 1,011.08 9 Dividend appropriation
9.1 Income Distributed during the year – –
9.2 Tax on income distributed during the year – –
10 Retained Surplus / (Deficit) carried forward to Balance sheet 1,713.90 1,011.08
Notes to Accounts – Annexure I
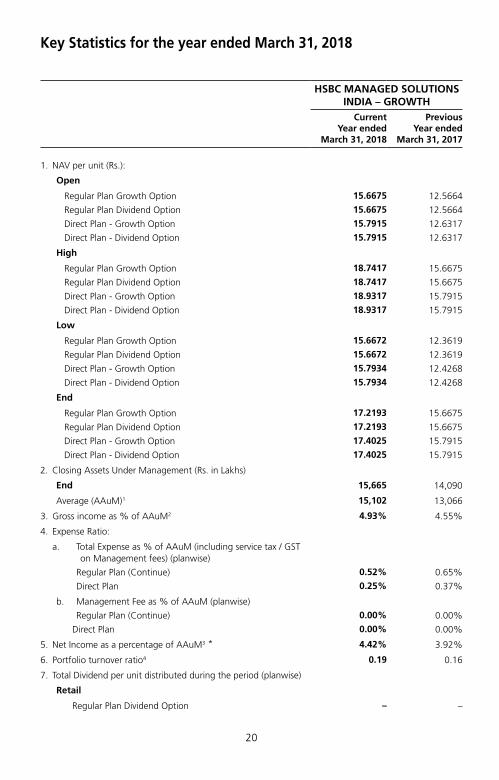
20
Key Statistics for the year ended March 31, 2018
HSBC MANAGED SOLUTIONS INDIA – GROWTH
Current Year ended
March 31, 2018
Previous Year ended
March 31, 2017
1. NAV per unit (Rs.):
Open
Regular Plan Growth Option 15.6675 12.5664
Regular Plan Dividend Option 15.6675 12.5664
Direct Plan - Growth Option 15.7915 12.6317
Direct Plan - Dividend Option 15.7915 12.6317
High
Regular Plan Growth Option 18.7417 15.6675
Regular Plan Dividend Option 18.7417 15.6675
Direct Plan - Growth Option 18.9317 15.7915
Direct Plan - Dividend Option 18.9317 15.7915
Low
Regular Plan Growth Option 15.6672 12.3619
Regular Plan Dividend Option 15.6672 12.3619
Direct Plan - Growth Option 15.7934 12.4268
Direct Plan - Dividend Option 15.7934 12.4268
End
Regular Plan Growth Option 17.2193 15.6675
Regular Plan Dividend Option 17.2193 15.6675
Direct Plan - Growth Option 17.4025 15.7915
Direct Plan - Dividend Option 17.4025 15.7915
2. Closing Assets Under Management (Rs. in Lakhs)
End 15,665 14,090
Average (AAuM)1 15,102 13,066
3. Gross income as % of AAuM2 4.93% 4.55%
4. Expense Ratio:
a. Total Expense as % of AAuM (including service tax / GST on Management fees) (planwise)
Regular Plan (Continue) 0.52% 0.65%
Direct Plan 0.25% 0.37%
b. Management Fee as % of AAuM (planwise)
Regular Plan (Continue) 0.00% 0.00%
Direct Plan 0.00% 0.00%
5. Net Income as a percentage of AAuM3 * 4.42% 3.92%
6. Portfolio turnover ratio4 0.19 0.16
7. Total Dividend per unit distributed during the period (planwise)
Retail
Regular Plan Dividend Option – –

21
Key Statistics for the year ended March 31, 2018 (Contd...)
HSBC MANAGED SOLUTIONS INDIA – GROWTH
Current Year ended
March 31, 2018
Previous Year ended
March 31, 2017
Direct Plan – Dividend Option – –
Regular Plan Dividend Option – –
Direct Plan – Dividend Option – –
8. Returns (%):
a. Last One Period
Scheme
Regular Plan Growth Option 11.2706 24.6777
Direct Plan – Growth Option 11.5719 25.0148
Benchmark
Composite Index constituting 80% of BSE 200 Index and 20% of CRISIL Composite Bond Index
12.9300 20.1964
b. Since Inception
Scheme
Regular Plan Growth Option 14.9026 16.6187
Direct Plan – Growth Option 15.2133 16.9339
Benchmark
Composite Index constituting 80% of BSE 200 Index and 20% of CRISIL Composite Bond Index
14.4600 13.8434
1. AAuM=Average daily net assets2. Gross income = amount against (A) in the Revenue account i.e. Income3. Net income = amount against (C) in the Revenue account i.e. Net Realised Gains / (Losses) for the period4. Portfolio Turnover = Lower of sales or purchase divided by the Average AuM for the period
5. The net asset value disclosed represents the computed NAV on March 31, 2018 (Non-business Day), and not the last declared NAV.
6. The total expenses charged by the scheme including TER charged by the underlying funds is as follows:
Scheme TER charged by underlying Fund ***
TER of the domestic Fund***
Total TER *** Maximum TER Cap as per circular ***
2017–18
HSBC Managed Solutions India – Growth
1.92% 0.52% 2.44% 2.70%
2016–17
HSBC Managed Solutions India – Growth
1.73% 0.65% 2.38% 2.70%
*** The TER excludes GST / Service Tax on Management fees

22
Notes to Accounts – Annexure ITo the Abridged Balance Sheet and Revenue Account for the Year ended March 31, 2018
HSBC MANAGED SOLUTIONS INDIA – GROWTH
1 Investments:
1.1. It is confirmed that investments of the Scheme are registered in the name of the Trustees for the benefit of the Scheme’s unitholders.
1.2. Open Positions of derivatives as of year ended March 31, 2018 & March 31, 2017 are NIL.
1.3. Investments in Associates and Group Companies as of period ended March 31, 2018 & March 31, 2017 are NIL.
1.4. Open positions of Securities Borrowed and / or Lent by the Scheme as of the year ended March 31, 2018 & March 31, 2017 are NIL.
1.5. NPA as at year ended March 31, 2018 & March 31, 2017 are NIL.
1.6. Aggregate Unrealised Gain / Loss as at the end of the financial period and percentage to net assets:
Security Category Amount (Rupees)
Percentage to Net Assets
Amount (Rupees)
Percentage to Net Assets
2018 2017
Units in Domestic Mutual Fund
– Appreciation 411,512,100 26.27 339,881,440 24.12
– Depreciation – – – –
1.7 The aggregate value of investments securities (excluding CBLO and Reverse Repos) purchased and sold (including matured) during the financial period 2017-2018 (excluding accretion of discount) is Rs. 293,500,000 and 286,498,145 respectively being 19.43% and 18.97% of the average daily net assets.
The aggregate value of investments securities (excluding CBLO and Reverse Repos) purchased and sold (including matured) during the financial period 2016-2017 (excluding accretion of discount) is Rs. 208,000,000 and 345,497,540 respectively being 15.92% and 26.44% of the average daily net assets.
1.8. Non-Traded securities in the portfolios as at March 31, 2018 & March 31, 2017 are NIL.
2 Disclosure Under Regulation 25(8) of the Securities and Exchange Board of India (Mutual Funds) Regulations, 1996 as amended
Commission paid to Sponsor / AMC and its associates / related parties / group companies
Name of Sponsor / AMC and its associates / related parties / group companies
Nature of Association / Nature of
Relation
Period Covered
Business Given [Rs. In Crores]
% of Total Business received by the Fund
Commission paid [Rs.]
% of Total commission paid by the
Fund
The Hongkong and Shanghai Banking Corporation Limited
Associate of the Investment Manager
2017-2018 42.08 86.00 9,538,817 85.68
Name of Sponsor / AMC and its associates / related parties / group companies
Nature of Association / Nature of
Relation
Period Covered
Business Given [Rs. In Crores]
% of Total Business received by the Fund
Commission paid [Rs.]
% of Total commission paid by the
Fund
The Hongkong and Shanghai Banking Corporation Limited
Associate of the Investment Manager
2016-2017 17.04 65.34 8,221,960 93.31

23
Brokerage paid to Sponsor/AMC and its associates/related parties/group companies is NIL. (Previous year also Nil)
(i) Any underwriting obligations undertaken by the schemes of the mutual funds with respect to issue of securities associate companies - Nil (Previous year also Nil).
(ii) Devolvement - Nil (Previous year also Nil).
(iii) Subscription by the schemes in the issues lead managed by associate companies - Nil (Previous year also Nil).
(iv) Subscription to any issue of equity or debt on private placement basis where the sponsor or its associate companies have acted as arranger or manager - Nil (Previous year also Nil).
3 None of the Investors held more than 25% of the total net assets of the Scheme at the year ended March 31, 2018 & March 31, 2017.
4 Unit Capital movement during the year ended March 31, 2018 & March 31, 2017**:
Description Opening Units Subscription Redemption Closing Units Face Value per unit (Rupees)
2017–2018
Regular Plan Growth Option
80,843,952.902 21,834,892.716 24,684,445.303 77,994,400.315 10
Regular Plan Dividend Option
6,059,421.791 4,237,324.289 1,440,200.592 8,856,545.488 10
Direct Plan - Growth Option
2,928,174.289 1,159,530.816 45,707.594 4,041,997.511 10
Direct Plan - Dividend Option
97,072.932 1,505.692 63,045.269 35,533.355 10
Description Opening Units Subscription Redemption Closing Units Face Value per unit (Rupees)
2016–2017
Regular Plan Growth Option
89,592,289.575 9,936,465.585 18,684,802.258 80,843,952.902 10
Regular Plan Dividend Option
7,354,500.200 2,401,422.284 3,696,500.693 6,059,421.791 10
Direct Plan - Growth Option
2,571,059.034 558,645.425 201,530.170 2,928,174.289 10
Direct Plan - Dividend Option
68,543.396 28,529.536 – 97,072.932 10
** Units held by the AMC (Seed Capital) in Direct Plan Growth Option as on March 31, 2018 is 377,569.065 and as on March 31, 2017 is 377,569.065.
5 No contingent liabilities for the years ended March 31, 2018 and March 31, 2017.
6 Expenses other than Management Fees are Inclusive of GST / Service Tax where applicable.
7 Other income credited to the Scheme is Nil. (2017 : Nil).
Notes to Accounts – Annexure ITo the Abridged Balance Sheet and Revenue Account for the Year ended March 31, 2018

24
Notes to Accounts – Annexure ITo the Abridged Balance Sheet and Revenue Account for the Year ended March 31, 2018
8 Investor Education Awareness
In view of the AMFI Best Practices Guidelines Circular No. 56/2015-16, the IEF (Investor Education Fund) accrual is set aside in a separate bank account and the consolidated balance across all schemes as on March 31, 2018. The break-up of which is as under:
Particulars March 31, 2018 March 31, 2017
Amount (in Rs. Lacs)
Amount (in Rs. Lacs)
Opening Balance 44.00 –
Add: Accrual during the year 219.83 182
Less: Transferred to AMFI 101.10 83
Less: Payable to AMFI (March accrual) 8.81 8
Add: Investment Income for the year 8.28 11
Less: Spent during the year 43.17 58
Closing Balance 119.02 44
9 Categorization and Rationalization of schemes
Pursuant to SEBI circular no. SEBI/HO/IMD/DF3/CIR/P/2017/114 dated October 6, 2017 and SEBI circular no. SEBI/HO/IMD/DF3/CIR/P/2017/126 dated December 4, 2017 on ‘Categorization and Rationalization of schemes’, fundamental attribute related changes were carried out in certain schemes of HSBC Mutual Fund to align the same with the requirements specified in the aforesaid circulars effective from March 14, 2018. The said changes have been approved by the Board of Directors of the HSBC Asset Management (India) Pvt. Ltd. (the AMC) and the Board of Trustees (the Trustees). SEBI vide its letter no. IMD/DF3/OW/P/2018/89/1 dated January 2, 2018 has also conveyed it’s no objection to the said changes.
A notice-cum-addendum providing details of changes in the fundamental attributes of certain schemes was published in the newspaper on February 3, 2018 and is also available on the website of the AMC at www.assetmanagement.hsbc.com/in. The exit window period of 30 days was provided to the investors during which no exit load was charged to investors on switches/redemptions.
Apart from the fundamental attribute changes, there has been change in the ‘type of Scheme’ for all the open ended schemes and ‘name of Scheme’ in certain schemes for the purposes of alignment of the existing schemes with the provisions of the Circular. The details of the schemes impacted is provided below:
Existing Name Revised Name Fundamental Attribute change
Benchmark Change
HSBC Managed Solutions India - Growth
HSBC Managed Solutions India - Growth
Yes Composite Index constituting 80% of BSE 200 Index and 20% of CRISIL Composite Bond Index
10 The Annual Accounts of the Schemes prepared in accordance with the accounting policies and standards specified in the Ninth Schedule of The Securities and Exchange Board of India (Mutual Funds) Regulations, 1996 has been approved by the Board of Directors of HSBC Asset Management (India) Private Limited and The Board of Trustees of HSBC Mutual Fund at their meetings held on July 16, 2018 and July 17, 2018 respectively. The audit report attached herewith refers to the said Annual Accounts. The aforesaid abridged accounts are an extract of the Annual Accounts and are prepared in accordance with SEBI Circular No. IMD/Cir8/132968/2008 dated July 24, 2008.

25
Abridged Balance Sheet as at March 31, 2018
Rs. in Lakhs
HSBC MANAGED SOLUTIONS INDIA – MODERATE
As at March 31, 2018
As at March 31, 2017
LIABILITIES1 Unit Capital 16,151.23 14,413.72 2 Reserves & Surplus2.1 Unit Premium Reserves 1,701.72 895.11 2.2 Unrealised Appreciation Reserve 6,065.45 4,617.66 2.3 Other Reserves 2,517.03 1,736.30 3 Loans & Borrowings – – 4 Current Liabilities & Provisions4.1 Provision for doubtful Income/Deposits – – 4.2 Other Current Liabilities & Provisions 170.75 60.16
TOTAL 26,606.18 21,722.95
ASSETS1 Investments1.1 Listed Securities:1.1.1 Equity Shares – – 1.1.2 Preference Shares – – 1.1.3 Equity Linked Debentures – – 1.1.4 Other Debentures & Bonds – – 1.1.5 Securitised Debt securities – – 1.2 Securities Awaited Listing:1.2.1 Equity Shares – – 1.2.2 Preference Shares – – 1.2.3 Equity Linked Debentures – – 1.2.4 Other Debentures & Bonds – – 1.2.5 Securitised Debt securities – – 1.3 Unlisted Securities1.3.1 Equity Shares – – 1.3.2 Preference Shares – – 1.3.3 Equity Linked Debentures – – 1.3.4 Other Debentures & Bonds – – 1.3.5 Securitised Debt securities – – 1.4 Government Securities – – 1.5 Treasury Bills – – 1.6 Commercial Paper – – 1.7 Certificate of Deposits – – 1.8 Bill Rediscounting – – 1.9 Units of Domestic Mutual Fund 26,175.27 21,401.69 1.10 Foreign Securities – –
Total Investments 26,175.27 21,401.69
2 Deposits 2.58 0.73 3 Other Current Assets3.1 Cash & Bank Balance 7.11 104.46 3.2 CBLO/Reverse Repo Lending 342.17 181.73 3.3 Others 79.05 34.34 4 Deferred Revenue Expenditure (to the extent not written off) – –
TOTAL 26,606.18 21,722.95
Notes to Accounts – Annexure I

26
Abridged Revenue Account For the Year Ended March 31, 2018
Rs. in Lakhs
HSBC MANAGED SOLUTIONS INDIA – MODERATE
Current Year ended
March 31, 2018
Previous Year ended
March 31, 2017
1 INCOME1.1 Dividend – – 1.2 Interest 22.30 13.59 1.3 Realised Gain / (Loss) on Foreign Exchange Transactions – – 1.4 Realised Gains / (Losses) on Interscheme sale of investments – – 1.5 Realised Gains / (Losses) on External sale / redemption of
investments705.61 794.55
1.6 Realised Gains / (Losses) on Derivative Transactions – – 1.7 Other Income – –
(A) 727.91 808.14
2 EXPENSES2.1 Management fees – 20.54 2.2 Service tax on Management fees – 3.08 2.3 Transfer agents fees and expenses 16.24 10.92 2.4 Custodian fees 1.73 1.71 2.5 Trusteeship fees 0.51 0.39 2.6 Commission to Agents 201.87 154.99 2.7 Marketing & Distribution expenses 0.42 0.48 2.8 Audit fees 1.56 1.21 2.9 Investor Education Expenses 5.06 3.99 2.10 Other operating expenses 7.10 4.68 2.11 Less: Expenses to be Reimbursed by the Investment Manager (78.81) (34.28)
(B) 155.68 167.71
3 NET REALISED GAINS / (LOSSES) FOR THE YEAR (A –B = C) 572.23 640.43
4 Change in Unrealised Depreciation in value of investments*** (D) – –
5 NET GAINS / (LOSSES) FOR THE YEAR [E=(C+D)] 572.23 640.43
6 Change in unrealised appreciation in the value of investments and derivatives (F) 1,447.79 3,230.16
7 NET SURPLUS / (DEFICIT) FOR THE YEAR (E + F = G) 2,020.02 3,870.59
7.1 Add: Balance transfer from Unrealised Appreciation Reserve – – 7.2 Less: Balance transfer to Unrealised Appreciation Reserve 1,447.79 3,230.16 7.3 Add / (Less): Equalisation 208.50 (89.61)
7.4 Transfer from Reserve Fund 1,736.30 1,185.48
8 Total 2,517.03 1,736.30
9 Dividend appropriation9.1 Income Distributed during the year – – 9.2 Tax on income distributed during the year – –
10 Retained Surplus/(Deficit) carried forward to Balance sheet 2,517.03 1,736.30
Notes to Accounts - Annexure I*** Includes Unrealised Depreciation in the value of Foreign Currency Transactions.

27
Key Statistics for the period ended March 31, 2018
HSBC MANAGED SOLUTIONS INDIA – MODERATE
Current Period ended
March 31, 2018
Previous Period ended
March 31, 2017
1. NAV per unit (Rs.):
Open
Regular Plan Growth Option 15.0289 12.3679
Regular Plan Dividend Option 15.0289 12.3679
Direct Plan – Growth Option 15.1390 12.4274
Direct Plan – Dividend Option – 12.2567
High
Regular Plan Growth Option 17.5017 15.0289
Regular Plan Dividend Option 17.5017 15.0289
Direct Plan – Growth Option 17.6659 15.1390
Direct Plan – Dividend Option 10.6121 –
Low
Regular Plan Growth Option 15.0321 12.2148
Regular Plan Dividend Option 15.0321 12.2148
Direct Plan – Growth Option 15.1441 12.2742
Direct Plan – Dividend Option 9.8250 –
End
Regular Plan Growth Option 16.3670 15.0289
Regular Plan Dividend Option 16.3670 15.0289
Direct Plan – Growth Option 16.5281 15.1390
Direct Plan – Dividend Option 9.9277 –
2. Closing Assets Under Management (Rs. in Lakhs)
End 26,435 21,558
Average (AAuM)1 25,284 19,934
3. Gross income as % of AAuM2 2.88% 4.05%
4. Expense Ratio:
a. Total Expense as % of AAuM (including service tax / GST on Management fees) (planwise)
Regular Plan (Continue) 0.62% 0.84%
Direct Plan 0.37% 0.59%
b. Management Fee as % of AAuM (planwise)
Regular Plan (Continue) 0.00% 0.10%
Direct Plan 0.00% 0.10%
5. Net Income as a percentage of AAuM3 * 2.26% 3.21%
6. Portfolio turnover ratio4 0.11 0.15

28
Key Statistics for the year ended March 31, 2018 (Contd...)
HSBC MANAGED SOLUTIONS INDIA – MODERATE
Current Period ended
March 31, 2018
Previous Period ended
March 31, 2017
7. Total Dividend per unit distributed during the period (planwise)
Retail
Regular Plan Dividend Option – –
Direct Plan – Dividend Option – –
Corporate
Regular Plan Dividend Option – –
Direct Plan – Dividend Option – –
8. Returns (%):
a. Last One Period
Scheme
Regular Plan Growth Option 10.0238 21.5154
Direct Plan – Growth Option 10.2986 21.8195
Benchmark
CRISIL Hybrid 35+65 - Aggressive Index 11.0500 16.0998
b. Since Inception
Scheme
Regular Plan Growth Option 13.4216 14.9688
Direct Plan – Growth Option 13.7054 15.2565
Benchmark
CRISIL Hybrid 35+65 - Aggressive Index 13.4800 11.5860
1. AAuM=Average daily net assets2. Gross income = amount against (A) in the Revenue account i.e. Income3. Net income = amount against (C) in the Revenue account i.e. Net Realised Gains / (Losses) for the period4. Portfolio Turnover = Lower of sales or purchase divided by the Average AuM for the period5. The net asset value disclosed represents the computed NAV on March 31, 2018 (Non-business Day),
and not the last declared NAV.6. The total expenses charged by the scheme including TER charged by the underlying funds is as follows:
Scheme TER charged by underlying Fund ***
TER of the domestic Fund***
Total TER ***
Maximum TER Cap as per circular ***
2017–18
HSBC Managed Solutions India-Moderate 1.68% 0.62% 2.30% 2.70%
2016–17
HSBC Managed Solutions India-Moderate 1.51% 0.83% 2.34% 2.70%
*** The TER excludes GST / Service Tax on Management fees
Notes to Accounts - Annexure I to the Abridged Balance Sheet and Revenue Account for the Year ended March 31, 2018

29
Notes to Accounts – Annexure ITo the Abridged Balance Sheet and Revenue Account for the Year ended March 31, 2018
HSBC MANAGED SOLUTIONS INDIA – MODERATE
1 Investments:
1.1. It is confirmed that investments of the Scheme are registered in the name of the Trustees for the benefit of the Scheme’s unitholders.
1.2. Open Positions of derivatives as of year ended March 31, 2018 & March 31, 2017 are NIL.
1.3. Investments in Associates and Group Companies as of period ended March 31, 2018 & March 31, 2017 are NIL.
1.4. Open positions of Securities Borrowed and / or Lent by the Scheme as of the year ended March 31, 2018 & March 31, 2017 are NIL.
1.5. NPA as at year ended March 31, 2018 & March 31, 2017 are NIL.
1.6. Aggregate Unrealised Gain / Loss as at the end of the financial period and percentage to net assets.
Security Category Amount (Rupees)
Percentage to Net Assets
Amount (Rupees)
Percentage to Net Assets
2018 2017
Units in Domestic Mutual Fund
– Appreciation 606,544,699 22.94 461,765,968 21.42
– Depreciation – – – –
The aggregate value of investments securities (excluding CBLO and Reverse Repos) purchased and sold (including matured) during the financial period 2017-2018 (excluding accretion of discount) is Rs. 548,000,000 and 268,498,605 respectively being 21.67% and 10.62% of the average daily net assets.
1.7 The aggregate value of investments securities (excluding CBLO and Reverse Repos) purchased and sold (including matured) during the financial period 2016-2017 (excluding accretion of discount) is Rs. 300,000,000 and 498,496,610 respectively being 15.05% and 25.01% of the average daily net assets.
1.8. Non -Traded securities in the portfolios as at March 31, 2018 & March 31, 2017 are NIL.
2 Disclosure Under Regulation 25(8) of the Securities and Exchange Board of India (Mutual Funds) Regulations, 1996 as amended
Commission paid to Sponsor / AMC and its associates / related parties / group companies
Name of Sponsor / AMC and its associates / related parties / group companies
Nature of Association / Nature of
Relation
Period Covered
Business Given [Rs. In Crores]
% of Total Business
received by the Fund
Commission paid [Rs.]
% of Total commission paid by the
Fund
The Hongkong and Shanghai Banking Corporation Limited
Associate of Investment Manager
2017-2018 81.42 80.57 16,144,893.55 87.44
Name of Sponsor / AMC and its associates / related parties / group companies
Nature of Association / Nature of
Relation
Period Covered
Business Given [Rs. In Crores]
% of Total Business received by the Fund
Commission paid [Rs.]
% of Total commission paid by the
Fund
The Hongkong and Shanghai Banking Corporation Limited
Associate of Inves tment Manager
2016-2017 22.77 69.67 12,888,744.86 98.28

30
Notes to Accounts – Annexure I (Contd...)To the Abridged Balance Sheet and Revenue Account for the Year ended March 31, 2018
Brokerage paid to Sponsor / AMC and its associates/related parties/group companies is NIL. (Previous year also Nil)
(i) Any underwriting obligations undertaken by the schemes of the mutual funds with respect to issue of securities associate companies - Nil (Previous year also Nil).
(ii) Devolvement - Nil (Previous year also Nil).
(iii) Subscription by the schemes in the issues lead managed by associate companies - Nil (Previous year also Nil).
(iv) Subscription to any issue of equity or debt on private placement basis where the sponsor or its associate companies have acted as arranger or manager - Nil (Previous year also Nil).
3 None of the Investors held more than 25% of the total net assets of the Scheme at the year ended March 31, 2018 & March 31,2017.
4 Unit Capital movement during the year ended March 31, 2018 & March 31, 2017**:
Description Opening Units Subscription Redemption Closing Units Face Value per unit (Rupees)
2017–2018
Regular Plan Growth Option
130,429,751.988 47,833,316.615 31,639,913.533 146,623,155.070 10
Regular Plan Dividend Option
13,216,458.766 6,404,847.634 5,202,804.099 14,418,502.301 10
Direct Plan - Growth Option
491,013.515 30,628.578 51,252.099 470,389.994 10
Direct Plan - Dividend Option
– 294.053 – 294.053 10
Description Opening Units Subscription Redemption Closing Units Face Value per unit (Rupees)
2016–2017
Regular Plan Growth Option
139,432,622.243 16,279,365.089 25,282,235.344 130,429,751.988 10
Regular Plan Dividend Option
15,794,573.484 1,286,409.291 3,864,524.009 13,216,458.766 10
Direct Plan - Growth Option
470,909.044 20,905.676 801.205 491,013.515 10
Direct Plan - Dividend Option
– – – – 10
**Units held by the AMC (Seed Capital) in Direct Plan Growth Option as on March 31, 2018 is 407,381.757 and as on March 31, 2017 is 407,381.757
5 No contingent liabilities for the years ended March 31, 2018 and March 31, 2017.
6 Expenses other than Management Fees are Inclusive of GST / Service Tax where applicable.
7 Other income credited to the Scheme is Nil (2017 : Nil).

31
Notes to Accounts – Annexure I (Contd...)To the Abridged Balance Sheet and Revenue Account for the Year ended March 31, 2018
8 Investor Education Awareness
In view of the AMFI Best Practices Guidelines Circular No. 56/2015-16, the IEF (Investor Education Fund) accrual is set aside in a separate bank account and the consolidated balance across all schemes as on March 31, 2018. The break-up of which is as under:
Particulars March 31, 2018 March 31, 2017
Amount (in Rs. Lacs)
Amount (in Rs. Lacs)
Opening Balance 44.00 –
Add: Accrual during the year 219.83 182
Less: Transferred to AMFI 101.10 83
Less: Payable to AMFI (March accrual) 8.81 8
Add: Investment Income for the year 8.28 11
Less: Spent during the year 43.17 58
Closing Balance 119.02 44
9 Categorization and Rationalization of schemes
Pursuant to SEBI circular no. SEBI/HO/IMD/DF3/CIR/P/2017/114 dated October 6, 2017 and SEBI circular no. SEBI/HO/IMD/DF3/CIR/P/2017/126 dated December 4, 2017 on ‘Categorization and Rationalization of schemes’, fundamental attribute related changes were carried out in certain schemes of HSBC Mutual Fund to align the same with the requirements specified in the aforesaid circulars effective from March 14, 2018. The said changes have been approved by the Board of Directors of the HSBC Asset Management (India) Pvt. Ltd. (the AMC) and the Board of Trustees (the Trustees). SEBI vide its letter no. IMD/DF3/OW/P/2018/89/1 dated January 2, 2018 has also conveyed it’s no objection to the said changes.
A notice-cum-addendum providing details of changes in the fundamental attributes of certain schemes was published in the newspaper on February 3, 2018 and is also available on the website of the AMC at www.assetmanagement.hsbc.com/in. The exit window period of 30 days was provided to the investors during which no exit load was charged to investors on switches/redemptions.
Apart from the fundamental attribute changes, there has been change in the ‘type of Scheme’ for all the open ended schemes and ‘name of Scheme’ in certain schemes for the purposes of alignment of the existing schemes with the provisions of the Circular. The details of the schemes impacted is provided below:
Existing Name Revised name Fundamental Attribute change
Benchmark Change
HSBC Managed Solutions India - Moderate
HSBC Managed Solutions India - Moderate
Yes CRISIL Hybrid 35 + 65 -Aggressive Index (renamed from existing CRISIL Balanced Fund – Aggressive Index)
10 The Annual Accounts of the Schemes prepared in accordance with the accounting policies and standards specified in the Ninth Schedule of The Securities and Exchange Board of India (Mutual Funds) Regulations, 1996 has been approved by the Board of Directors of HSBC Asset Management (India) Private Limited and The Board of Trustees of HSBC Mutual Fund at their meetings held on July 16, 2018 and July 17, 2018 respectively. The audit report attached herewith refers to the said Annual Accounts. The aforesaid abridged accounts are an extract of the Annual Accounts and are prepared in accordance with SEBI Circular No. IMD/Cir8/132968/2008 dated July 24, 2008.

32
Abridged Balance Sheet as at March 31, 2018
Rs. in Lakhs
HSBC MANAGED SOLUTIONS INDIA – CONSERVATIVE
As at March 31, 2018
As at March 31, 2017
LIABILITIES1 Unit Capital 20,603.38 26,010.07 2 Reserves & Surplus2.1 Unit Premium Reserves (1,376.19) (196.59)2.2 Unrealised Appreciation Reserve 5,445.96 6,104.48 2.3 Other Reserves 3,950.23 2,634.00 3 Loans & Borrowings – – 4 Current Liabilities & Provisions4.1 Provision for doubtful Income/Deposits – – 4.2 Other Current Liabilities & Provisions 136.16 60.97
TOTAL 28,759.54 34,612.93
ASSETS1 Investments1.1 Listed Securities:1.1.1 Equity Shares – – 1.1.2 Preference Shares – – 1.1.3 Equity Linked Debentures – – 1.1.4 Other Debentures & Bonds – – 1.1.5 Securitised Debt securities – – 1.2 Securities Awaited Listing:1.2.1 Equity Shares – – 1.2.2 Preference Shares – – 1.2.3 Equity Linked Debentures – – 1.2.4 Other Debentures & Bonds – – 1.2.5 Securitised Debt securities – – 1.3 Unlisted Securities1.3.1 Equity Shares – – 1.3.2 Preference Shares – – 1.3.3 Equity Linked Debentures – – 1.3.4 Other Debentures & Bonds – – 1.3.5 Securitised Debt securities – – 1.4 Government Securities – – 1.5 Treasury Bills – – 1.6 Commercial Paper – – 1.7 Certificate of Deposits – – 1.8 Bill Rediscounting – – 1.9 Units of Domestic Mutual Fund 28,469.26 34,191.95 1.10 Foreign Securities – –
Total Investments 28,469.26 34,191.95
2 Deposits 2.25 1.46 3 Other Current Assets3.1 Cash & Bank Balance 0.09 8.78 3.2 CBLO/Reverse Repo Lending 287.74 360.66 3.3 Others 0.20 50.08 4 Deferred Revenue Expenditure (to the extent not written off) – –
TOTAL 28,759.54 34,612.93
Notes to Accounts – Annexure I

33
Abridged Revenue Account For the Year Ended March 31, 2018
Rs. in Lakhs
HSBC MANAGED SOLUTIONS INDIA – CONSERVATIVE
Current Year ended
March 31, 2018
Previous Year ended
March 31, 2017
1 INCOME1.1 Dividend – – 1.2 Interest 26.50 26.82 1.3 Realised Gain / (Loss) on Foreign Exchange Transactions – – 1.4 Realised Gains / (Losses) on Interscheme sale of investments – – 1.5 Realised Gains / (Losses) on External sale / redemption of
investments2,470.63 1,275.99
1.6 Realised Gains / (Losses) on Derivative Transactions – – 1.7 Other Income – –
(A) 2,497.13 1,302.80
2 EXPENSES2.1 Management fees 81.32 80.83 2.2 GST / Service tax on Management fees 14.12 11.98 2.3 Transfer agents fees and expenses 21.08 18.07 2.4 Custodian fees 1.78 1.81 2.5 Trusteeship fees 0.67 0.66 2.6 Commission to Agents 195.15 193.80 2.7 Marketing & Distribution expenses 0.44 0.80 2.8 Audit fees 1.73 1.97 2.9 Investor Education Expenses 6.67 6.59 2.10 Other operating expenses 8.82 7.51 2.11 Less: Expenses to be Reimbursed by the Investment Manager – –
(B) 331.78 324.02
3 NET REALISED GAINS / (LOSSES) FOR THE YEAR (A –B = C) 2,165.35 978.78
4 Change in Unrealised Depreciation in value of investments*** (D) – –
5 NET GAINS / (LOSSES) FOR THE YEAR [E=(C+D)] 2,165.35 978.78
6 Change in unrealised appreciation in the value of investments and derivatives (F) (658.52) 2,251.52
7 NET SURPLUS / (DEFICIT) FOR THE YEAR (E + F = G) 1,506.83 3,230.30
7.1 Add: Balance transfer from Unrealised Appreciation Reserve 658.52 – 7.2 Less: Balance transfer to Unrealised Appreciation Reserve – 2,251.52 7.3 Add / (Less): Equalisation (849.13) 3.67 7.4 Transfer from Reserve Fund 2,634.01 1,651.55
8 Total 3,950.23 2,634.00
9 Dividend appropriation9.1 Income Distributed during the year – –
9.2 Tax on income distributed during the year – –
10 Retained Surplus/(Deficit) carried forward to Balance sheet 3,950.23 2,634.00
Notes to Accounts – Annexure I*** Includes Unrealised Depreciation in the value of Foreign Currency Transactions.

34
Key Statistics for the period ended March 31, 2018
HSBC MANAGED SOLUTIONS INDIA – CONSERVATIVE
Current Period ended
March 31, 2018
Previous Period ended
March 31, 2017
1. NAV per unit (Rs.):
Open
Regular Plan Growth Option 13.2827 12.0317
Regular Plan Dividend Option 13.2827 12.0317
Direct Plan – Growth Option 13.3800 12.0896
Direct Plan – Dividend Option – –
High
Regular Plan Growth Option 13.9117 13.2900
Regular Plan Dividend Option 13.9117 13.2900
Direct Plan – Growth Option 14.0423 13.3826
Direct Plan – Dividend Option – –
Low
Regular Plan Growth Option 13.2498 12.0354
Regular Plan Dividend Option 13.2498 12.0354
Direct Plan – Growth Option 13.3475 12.0938
Direct Plan – Dividend Option – –
End
Regular Plan Growth Option 13.8903 13.2827
Regular Plan Dividend Option 13.8903 13.2827
Direct Plan – Growth Option 14.0271 13.3800
Direct Plan – Dividend Option – –
2. Closing Assets Under Management (Rs. in Lakhs)
End 28,623 34,432
Average (AAuM)1 33,354 32,958
3. Gross income as % of AAuM2 7.49% 3.95%
4. Expense Ratio:
a. Total Expense as % of AAuM (including service tax / GST on Management fees) (planwise)
Regular Plan (Continue) 1.00% 0.99%
Direct Plan 0.75% 0.74%
b. Management Fee as % of AAuM (planwise)
Regular Plan (Continue) 0.24% 0.25%
Direct Plan 0.24% 0.25%
5. Net Income as a percentage of AAuM3 6.49% 2.97%
6. Portfolio turnover ratio4 0.17 0.21

35
Key Statistics for the year ended March 31, 2018 (Contd...)
HSBC MANAGED SOLUTIONS INDIA – CONSERVATIVE
Current Period ended
March 31, 2018
Previous Period ended
March 31, 2017
7. Total Dividend per unit distributed during the period (planwise)
Retail
Regular Plan Dividend Option – –
Direct Plan – Dividend Option – –
Corporate
Regular Plan Dividend Option – –
Direct Plan – Dividend Option – –
8. Returns (%):
a. Last One Period
Scheme
Regular Plan Growth Option 4.7865 10.3975
Direct Plan – Growth Option 5.0483 10.6736
Benchmark
Composite Index constituting of 90% into CRISIL Composite Bond Index and 10% of BSE 200 Index
6.5400 12.2280
b. Since Inception
Scheme
Regular Plan Growth Option 8.7643 10.2081
Direct Plan – Growth Option 9.0364 10.4838
Benchmark
Composite Index constituting of 90% into CRISIL Composite Bond Index and 10% of BSE 200 Index
10.4600 11.5476
1. AAuM=Average daily net assets2. Gross income = amount against (A) in the Revenue account i.e. Income3. Net income = amount against (C) in the Revenue account i.e. Net Realised Gains / (Losses) for the period4. Portfolio Turnover = Lower of sales or purchase divided by the Average AuM for the period5. The net asset value disclosed represents the computed NAV on March 31, 2018 (Non-business Day),
and not the last declared NAV.6. The total expenses charged by the scheme including TER charged by the underlying funds is as follows:
Scheme TER charged by underlying Fund ***
TER of the domestic Fund***
Total TER *** Maximum TER Cap as per circular ***
2017–18
HSBC Managed Solution India – Conservative
0.75% 0.96% 1.71% 2.70%
2016–17
HSBC Managed Solution India – Conservative
0.69% 0.95% 1.64% 2.70%
*** The TER excludes GST / Service Tax on Management fees

36
Notes to Accounts – Annexure ITo the Abridged Balance Sheet and Revenue Account for the Year ended March 31, 2018
HSBC MANAGED SOLUTIONS INDIA – CONSERVATIVE
1 Investments:
1.1. It is confirmed that investments of the Scheme are registered in the name of the Trustees for the benefit of the Scheme’s unitholders.
1.2. Open Positions of derivatives as of year ended March 31, 2018 & as on March 31, 2017 are NIL.
1.3. Investments in Associates and Group Companies as of period ended March 31, 2018 & March 31, 2017 are NIL.
1.4. Open positions of Securities Borrowed and / or Lent by the Scheme as of the year ended March 31,2018 and March 31, 2017 are NIL.
1.5. NPA as at year ended March 31, 2018 and March 31, 2017 are NIL.
1.6. Aggregate Unrealised Gain / Loss as at the end of the financial period and percentage to net assets:
Security Category Amount (Rupees)
Percentage to Net Assets
Amount (Rupees)
Percentage to Net Assets
2018 2017
Units in Domestic Mutual Fund
– Appreciation 545,649,079 19.06 611,501,023 17.76
– Depreciation – – – –
1.7 The aggregate value of investments securities (excluding CBLO and Reverse Repos) purchased and sold (including matured) during the financial period 2017- 2018 (excluding accretion of discount) is Rs. 553,000,000 and 1,283,998,845 respectively being 16.58% and 38.50% of the average daily net assets.
The aggregate value of investments securities (excluding CBLO and Reverse Repos) purchased and sold (including matured) during the financial period 2016- 2017 (excluding accretion of discount) is Rs. 681,500,000 and 714,998,140 respectively being 20.68% and 21.69% of the average daily net assets.
1.8. Non -Traded securities in the portfolios as at March 31, 2018 and March 31, 2017 are NIL.
2 Disclosure Under Regulation 25(8) of the Securities And Exchange Board Of India (Mutual Funds) Regulations, 1996 As Amended
Commission paid to Sponsor / AMC and its associates / related parties / group companies
Name of Sponsor / AMC and its associates / related parties / group companies
Nature of Association / Nature of
Relation
Period Covered
Business Given [Rs. In Crores]
% of Total Business
received by the Fund
Commission paid [Rs.]
% of Total commission paid by the
Fund
The Hongkong and Shanghai Banking Corporation Limited
Associate of Investment Manager
2017-2018 63.69 85.02 16,427,547 91.00
Name of Sponsor / AMC and its associates / related parties / group companies
Nature of Association / Nature of
Relation
Period Covered
Business Given [Rs. In Crores]
% of Total Business
received by the Fund
Commission paid [Rs.]
% of Total commission paid by the
Fund
The Hongkong and Shanghai Banking Corporation Limited
Associate of Investment Manager
2016-2017 87.89 82.13 16,160,689 91.08

37
Notes to Accounts – Annexure I (Contd...)To the Abridged Balance Sheet and Revenue Account for the Year ended March 31, 2018
Brokerage paid to Sponsor/AMC and its associates/related parties/group companies is NIL. (Previous year also NIL)
(i) Any underwriting obligations undertaken by the schemes of the mutual funds with respect to issue of securities associate companies - Nil (Previous year also Nil).
(ii) Devolvement - Nil (Previous year also Nil).
(iii) Subscription by the schemes in the issues lead managed by associate companies - Nil (Previous year also Nil).
(iv) Subscription to any issue of equity or debt on private placement basis where the sponsor or its associate companies have acted as arranger or manager - Nil (Previous year also Nil).
3 None of the Investors held more than 25% of the total net assets of the Scheme at the year ended March 31, 2018 & March 31, 2017.
4 Unit Capital movement during the year ended March 31, 2018 & March 31, 2017:
Description Opening Units Subscription Redemption Closing Units Face Value per unit (Rupees)
2017–2018
Regular Plan Growth Option
222,921,792.699 40,173,850.206 86,879,590.653 176,216,052.252 10
Regular Plan Dividend Option
33,500,039.982 8,313,999.800 15,417,069.815 26,396,969.967 10
Direct Plan - Growth Option
3,678,883.813 13,559.498 271,660.056 3,420,783.255 10
Description Opening Units Subscription Redemption Closing Units Face Value per unit (Rupees)
2016–2017
Regular Plan Growth Option
221,619,118.875 54,135,724.841 52,833,051.017 222,921,792.699 10
Regular Plan Dividend Option
34,635,446.213 15,624,642.889 16,760,049.120 33,500,039.982 10
Direct Plan - Growth Option
3,866,256.910 226.521 187,599.618 3,678,883.813 10
**Units held by the AMC (Seed Capital) in Direct Plan Growth Option as on March 31, 2018 is 434,786.389 and as on March 31, 2017 is 434,786.389.
5 No contingent liabilities for the years ended March 31, 2018 and March 31, 2017.
6 Expenses other than Management Fees are Inclusive of GST / Service Tax where applicable.
7 Other income credited to the Scheme is Nil (2017 : Nil).
8 Investor Education Awareness
In view of the AMFI Best Practices Guidelines Circular No. 56/2015-16, the IEF (Investor Education Fund) accrual is set aside in a separate bank account and the consolidated balance across all schemes as on March 31, 2018. The break-up of which is as under:

38
Notes to Accounts – Annexure I (Contd...)To the Abridged Balance Sheet and Revenue Account for the Year ended March 31, 2017
Particulars March 31, 2018 March 31, 2017
Amount (in Rs. Lacs) Amount (in Rs. Lacs)
Opening Balance 44.00 –
Add: Accrual during the year 219.83 182
Less: Transferred to AMFI 101.10 83
Less: Payable to AMFI (March accrual) 8.81 8
Add: Investment Income for the year 8.28 11
Less: Spent during the year 43.17 58
Closing Balance 119.02 44
9 Categorization and Rationalization of schemes
Pursuant to SEBI circular no. SEBI/HO/IMD/DF3/CIR/P/2017/114 dated October 6, 2017 and SEBI circular no. SEBI/HO/IMD/DF3/CIR/P/2017/126 dated December 4, 2017 on ‘Categorization and Rationalization of schemes’, fundamental attribute related changes were carried out in certain schemes of HSBC Mutual Fund to align the same with the requirements specified in the aforesaid circulars effective from March 14, 2018. The said changes have been approved by the Board of Directors of the HSBC Asset Management (India) Pvt. Ltd. (the AMC) and the Board of Trustees (the Trustees). SEBI vide its letter no. IMD/DF3/OW/P/2018/89/1 dated January 2, 2018 has also conveyed it’s no objection to the said changes.
A notice-cum-addendum providing details of changes in the fundamental attributes of certain schemes was published in the newspaper on February 3, 2018 and is also available on the website of the AMC at www.assetmanagement.hsbc.com/in. The exit window period of 30 days was provided to the investors during which no exit load was charged to investors on switches/redemptions.
Apart from the fundamental attribute changes, there has been change in the ‘type of Scheme’ for all the open ended schemes and ‘name of Scheme’ in certain schemes for the purposes of alignment of the existing schemes with the provisions of the Circular. The details of the schemes impacted is provided below:
Existing Name Revised Name Fundamental Attribute change
Benchmark Change
HSBC Managed Solutions India - Conservative
HSBC Managed Solutions India - Conservative
Yes Composite Index constituting of 90% into CRISIL Composite Bond Index and 10% of BSE 200 Index
10 The Annual Accounts of the Schemes prepared in accordance with the accounting policies and standards specified in the Ninth Schedule of The Securities and Exchange Board of India (Mutual Funds) Regulations, 1996 has been approved by the Board of Directors of HSBC Asset Management (India) Private Limited and The Board of Trustees of HSBC Mutual Fund at their meetings held on July 16, 2018 and July 17, 2018 respectively. The audit report attached herewith refers to the said Annual Accounts. The aforesaid abridged accounts are an extract of the Annual Accounts and are prepared in accordance with SEBI Circular No. IMD/Cir8/132968/2008 dated July 24, 2008.

39
Voting Policy and Procedures
In view of SEBI guidelines related to “Role of Mutual Funds in Corporate Governance of Public Listed Companies”, AMIN has formulated its “Policy for Proxy Voting in Public Listed Companies”. The said policy and details of actual exercise of proxy votes along with the summary of votes cast and the auditors certification during the Financial Year 2017 – 18 is available on its website – http://www.assetmanagement.hsbc.com/in and in full Annual Report for the Financial Year 2017 – 18.

40
Statutory Details & Disclaimers
All returns have been sourced from Mutual Funds India Explorer software unless otherwise stated. With regard to equity schemes (including the equity component of MIPs), Fund performance is calculated on a total return basis (i.e. it includes dividends re-invested) while the benchmark is calculated on a price return basis (i.e. it does not consider dividends re-invested). This document has been prepared by HSBC Asset Management (India) Private Ltd (HSBC) for information purposes only and should not be construed as an offer or solicitation of an offer for purchase of any of the funds of HSBC Mutual Fund. All information contained in this document (including that sourced from third parties), is obtained from sources HSBC, the third party believes to be reliable but which it has not independently verified and HSBC, the third party makes no guarantee, representation or warranty and accepts no responsibility or liability as to the accuracy or completeness of such information. The information and opinions contained within the document are based upon publicly available information and rates of taxation applicable at the time of publication, which are subject to change from time to time. Expressions of opinion are those of HSBC only and are subject to change without notice. It does not have regard to specific investment objectives, financial situation and the particular needs of any specific person who may receive this document. Investors should seek financial advice regarding the appropriateness of investing in any securities or investment strategies that may have been discussed or recommended in this report and should understand that the views regarding future prospects may or may not be realized. Neither this document nor the units of HSBC Mutual Fund have been registered in any jurisdiction. The distribution of this document in certain jurisdictions may be restricted or totally prohibited and accordingly, persons who come into possession of this document are required to inform themselves about, and to observe, any such restrictions.
Investors should not invest in the Scheme solely based on the information provided in this document and should read the Scheme Information Document and Statement of Additional Information of the Fund for details. This document does not constitute an offering document.
No part of this publication may be reproduced, stored in a retrieval system, or transmitted, on any form or by any means, electronic, mechanical, photocopying, recording, or otherwise, without the prior written permission of HSBC Asset Management (India) Private Ltd.
Mutual Fund investments are subject to market risks, read all scheme related documents carefully.