above all else - hca investor center...
TRANSCRIPT
2013 ANNUAL REPORT TO STOCKHOLDERS
ABOVE ALL ELSEwe are committed to the care and improvement of human life.

HCA Holdings, Inc. is one of the leading health care services companies in the United States. At December 31, 2013, we operated 165 hospitals, comprised of 159 general, acute care hospitals; five psychiatric hospitals; and one rehabilitation hospital. In addition, we operated 115 freestanding surgery centers. Our facilities are located in 20 states and England.
Company Overview
Corporate Information
The terms “HCA” or the “Company” as used in this report refer to HCA Holdings, Inc. and its affiliates, unless otherwise stated or indicated by context. The term “facilities” refers to entities owned or operated by subsidiaries or affiliates of HCA Holdings, Inc. References herein to “HCA employees” refer to employees or affiliates of HCA Management Services, L.P. or HCA Holdings, Inc.
Transfer Agent and RegistrarWells Fargo Shareowner Services P.O. Box 64874 St. Paul, Minnesota 55164-0874Toll free: 800-468-9716
Certified/Overnight Mail:Wells Fargo Shareowner Services1110 Centre Pointe Curve, Suite 101 Mendota Heights, Minnesota 55120
Independent Registered Public Accounting FirmErnst & Young LLPNashville, Tennessee
Corporate HeadquartersOne Park PlazaNashville, Tennessee 37203615-344-9551
Form 10-KThe Company has filed an annual report on Form 10-K for the year ended December 31, 2013, with the United States Securities and Exchange Commission. Stockholders may obtain a copy of this report, without charge, by writing: Investor Relations, HCA Holdings, Inc., One Park Plaza, Nashville, TN 37203 or by visiting the Company’s website at www.hcahealthcare.com.
Common Stock and Dividend InformationThe Common Stock of HCA Holdings, Inc. is listed on the New York Stock Exchange (NYSE) under the symbol “HCA”.
On February 28, 2014, the Company had a total of approximately 280 stockholders of record. The Company does not currently intend to declare or pay a regular quarterly dividend.
Annual Meeting of StockholdersThe annual meeting of stockholders will be held on April 23, 2014, at 2:00 pm local time at the HCA corporate offices located at One Park Plaza, Nashville, Tennessee. Stockholders of record as of February 28, 2014 are invited to attend.

Directors
Executive Officers
Richard M. BrackenChairman of the BoardHCA Holdings, Inc.
Robert J. DennisChairman, President and Chief Executive OfficerGenesco Inc.
Nancy-Ann DeParlePartnerConsonance Capital Partners LLC
Thomas F. Frist IIIPrincipal Frist Capital LLC
William R. FristPrincipalFrist Capital LLC
R. Milton JohnsonPresident and Chief Executive OfficerHCA Holdings, Inc.
Ann H. LamontManaging PartnerOak Investment Partners
Jay O. LightDean EmeritusHarvard Business School
Geoffrey G. MeyersExecutive Vice President, Chief Financial Officer (Retired) – Manor Care, Inc.
Michael W. MichelsonMember – KKR Management LLC
Stephen G. PagliucaManaging DirectorBain Capital Partners, LLC
Wayne J. Riley, M.D.Clinical Professor of Medicine Vanderbilt University School of Medicine Adjunct Professor of Healthcare ManagementOwen Graduate School of Management Vanderbilt University
John W. Rowe, M.D.Professor – Columbia University Mailman School of Public HealthFormer Chairman and Chief Executive Officer – Aetna, Inc.
Richard M. BrackenChairman of the Board
R. Milton JohnsonPresident and Chief Executive Officer
Samuel N. HazenPresident - Operations
William B. RutherfordExecutive Vice President andChief Financial Officer
David G. AndersonSenior Vice PresidentFinance and Treasurer
Victor L. CampbellSenior Vice President
Jana J. DavisSenior Vice PresidentCorporate Affairs
Jon M. FosterPresidentAmerican Group
Charles J. HallPresidentNational Group
A. Bruce Moore, Jr.PresidentService Line and Operations Integration
P. Martin PaslickSenior Vice President andChief Information Officer
Jonathan B. Perlin, M.D.PresidentClinical Services Group and Chief Medical Officer
Joseph A. Sowell, IIISenior Vice President and Chief Development Officer
Joseph N. SteakleySenior Vice PresidentInternal Audit Services
John M. SteeleSenior Vice President Human Resources
Donald W. StinnettSenior Vice President and Controller
Juan VallarinoSenior Vice PresidentEmployer and Payer Engagement
Robert A. WatermanSenior Vice President, General Counsel and Chief Labor Relations Officer
Alan R. YuspehSenior Vice President and Chief Ethics and Compliance Officer
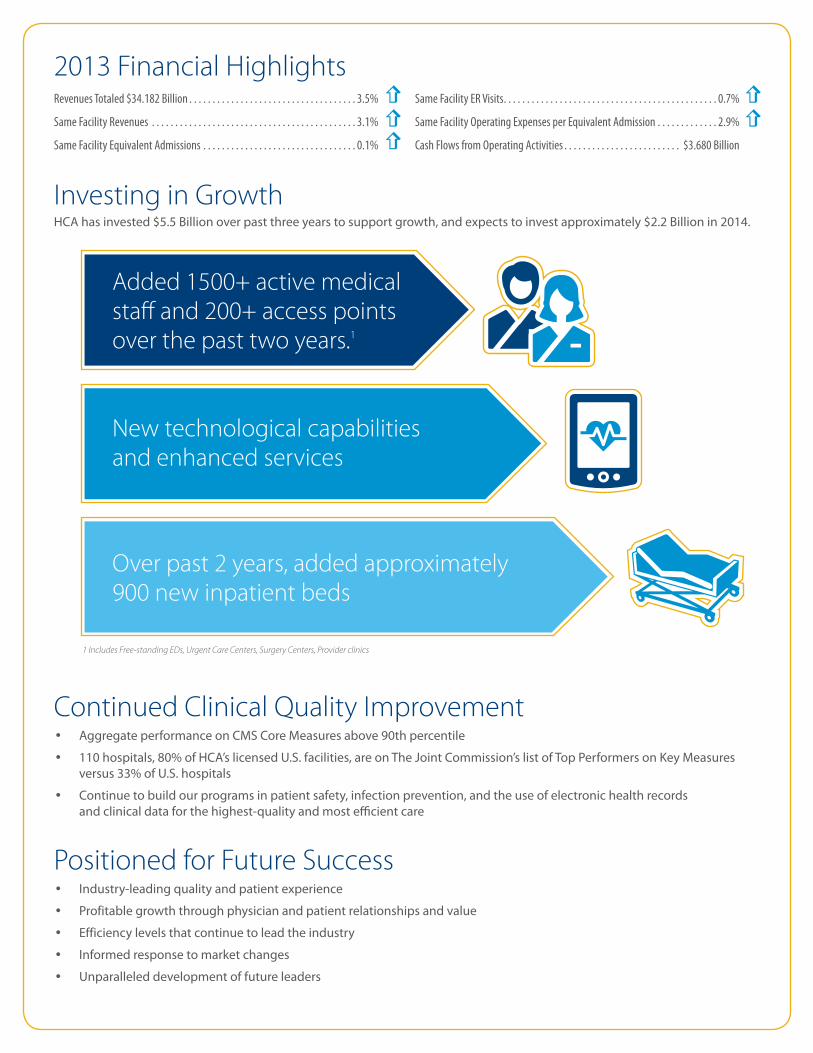
2013 Financial Highlights
Continued Clinical Quality Improvement Aggregate performance on CMS Core Measures above 90th percentile
110 hospitals, 80% of HCA’s licensed U.S. facilities, are on The Joint Commission’s list of Top Performers on Key Measures versus 33% of U.S. hospitals
Continue to build our programs in patient safety, infection prevention, and the use of electronic health records and clinical data for the highest-quality and most efficient care
Positioned for Future Success Industry-leading quality and patient experience
Profitable growth through physician and patient relationships and value
Efficiency levels that continue to lead the industry
Informed response to market changes
Unparalleled development of future leaders
Investing in Growth
Added 1500+ active medical staff and 200+ access points over the past two years.1
New technological capabilities and enhanced services
Over past 2 years, added approximately 900 new inpatient beds
1 Includes Free-standing EDs, Urgent Care Centers, Surgery Centers, Provider clinics
Revenues Totaled $34.182 Billion . . . . . . . . . . . . . . . . . . . . . . . . . . . . . . . . . . . . 3.5%
Same Facility Revenues . . . . . . . . . . . . . . . . . . . . . . . . . . . . . . . . . . . . . . . . . . . . 3.1%
Same Facility Equivalent Admissions . . . . . . . . . . . . . . . . . . . . . . . . . . . . . . . . . 0.1%
Same Facility ER Visits . . . . . . . . . . . . . . . . . . . . . . . . . . . . . . . . . . . . . . . . . . . . . . 0.7%
Same Facility Operating Expenses per Equivalent Admission . . . . . . . . . . . . . 2.9%
Cash Flows from Operating Activities . . . . . . . . . . . . . . . . . . . . . . . . . $3.680 Billion
HCA has invested $5.5 Billion over past three years to support growth, and expects to invest approximately $2.2 Billion in 2014.
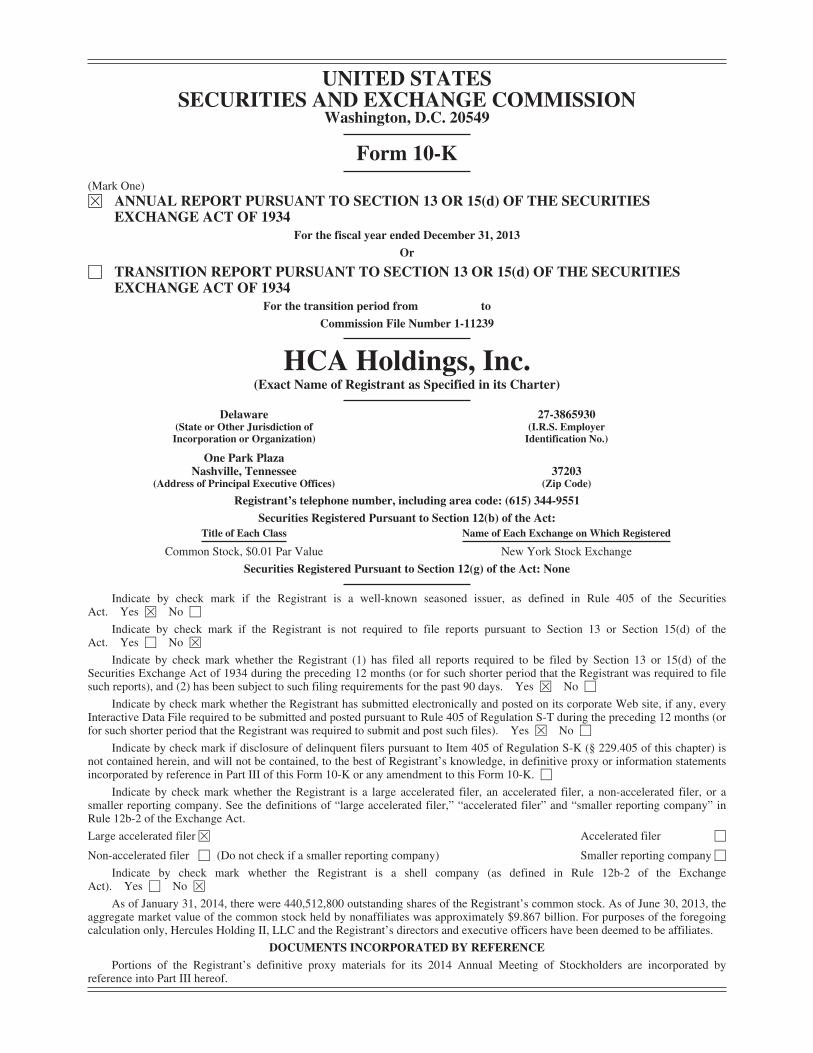
UNITED STATESSECURITIES AND EXCHANGE COMMISSION
Washington, D.C. 20549
Form 10-K(Mark One)È ANNUAL REPORT PURSUANT TO SECTION 13 OR 15(d) OF THE SECURITIES
EXCHANGE ACT OF 1934For the fiscal year ended December 31, 2013
Or
‘ TRANSITION REPORT PURSUANT TO SECTION 13 OR 15(d) OF THE SECURITIESEXCHANGE ACT OF 1934
For the transition period from to
Commission File Number 1-11239
HCA Holdings, Inc.(Exact Name of Registrant as Specified in its Charter)
Delaware 27-3865930(State or Other Jurisdiction ofIncorporation or Organization)
(I.R.S. EmployerIdentification No.)
One Park PlazaNashville, Tennessee 37203
(Address of Principal Executive Offices) (Zip Code)
Registrant’s telephone number, including area code: (615) 344-9551
Securities Registered Pursuant to Section 12(b) of the Act:Title of Each Class Name of Each Exchange on Which Registered
Common Stock, $0.01 Par Value New York Stock Exchange
Securities Registered Pursuant to Section 12(g) of the Act: None
Indicate by check mark if the Registrant is a well-known seasoned issuer, as defined in Rule 405 of the SecuritiesAct. Yes È No ‘
Indicate by check mark if the Registrant is not required to file reports pursuant to Section 13 or Section 15(d) of theAct. Yes ‘ No È
Indicate by check mark whether the Registrant (1) has filed all reports required to be filed by Section 13 or 15(d) of theSecurities Exchange Act of 1934 during the preceding 12 months (or for such shorter period that the Registrant was required to filesuch reports), and (2) has been subject to such filing requirements for the past 90 days. Yes È No ‘
Indicate by check mark whether the Registrant has submitted electronically and posted on its corporate Web site, if any, everyInteractive Data File required to be submitted and posted pursuant to Rule 405 of Regulation S-T during the preceding 12 months (orfor such shorter period that the Registrant was required to submit and post such files). Yes È No ‘
Indicate by check mark if disclosure of delinquent filers pursuant to Item 405 of Regulation S-K (§ 229.405 of this chapter) isnot contained herein, and will not be contained, to the best of Registrant’s knowledge, in definitive proxy or information statementsincorporated by reference in Part III of this Form 10-K or any amendment to this Form 10-K. ‘
Indicate by check mark whether the Registrant is a large accelerated filer, an accelerated filer, a non-accelerated filer, or asmaller reporting company. See the definitions of “large accelerated filer,” “accelerated filer” and “smaller reporting company” inRule 12b-2 of the Exchange Act.
Large accelerated filer È Accelerated filer ‘
Non-accelerated filer ‘ (Do not check if a smaller reporting company) Smaller reporting company ‘
Indicate by check mark whether the Registrant is a shell company (as defined in Rule 12b-2 of the ExchangeAct). Yes ‘ No È
As of January 31, 2014, there were 440,512,800 outstanding shares of the Registrant’s common stock. As of June 30, 2013, theaggregate market value of the common stock held by nonaffiliates was approximately $9.867 billion. For purposes of the foregoingcalculation only, Hercules Holding II, LLC and the Registrant’s directors and executive officers have been deemed to be affiliates.
DOCUMENTS INCORPORATED BY REFERENCE
Portions of the Registrant’s definitive proxy materials for its 2014 Annual Meeting of Stockholders are incorporated byreference into Part III hereof.

INDEX
PageReference
Part I
Item 1. Business . . . . . . . . . . . . . . . . . . . . . . . . . . . . . . . . . . . . . . . . . . . . . . . . . . . . . . . . . . . . . . . . . 3
Item 1A. Risk Factors . . . . . . . . . . . . . . . . . . . . . . . . . . . . . . . . . . . . . . . . . . . . . . . . . . . . . . . . . . . . . . 37
Item 1B. Unresolved Staff Comments . . . . . . . . . . . . . . . . . . . . . . . . . . . . . . . . . . . . . . . . . . . . . . . . . 50
Item 2. Properties . . . . . . . . . . . . . . . . . . . . . . . . . . . . . . . . . . . . . . . . . . . . . . . . . . . . . . . . . . . . . . . . 51
Item 3. Legal Proceedings . . . . . . . . . . . . . . . . . . . . . . . . . . . . . . . . . . . . . . . . . . . . . . . . . . . . . . . . . 51
Item 4. Mine Safety Disclosures . . . . . . . . . . . . . . . . . . . . . . . . . . . . . . . . . . . . . . . . . . . . . . . . . . . . . 53
Part II
Item 5. Market for Registrant’s Common Equity, Related Stockholder Matters and IssuerPurchases of Equity Securities . . . . . . . . . . . . . . . . . . . . . . . . . . . . . . . . . . . . . . . . . . . . . . 54
Item 6. Selected Financial Data . . . . . . . . . . . . . . . . . . . . . . . . . . . . . . . . . . . . . . . . . . . . . . . . . . . . . 56
Item 7. Management’s Discussion and Analysis of Financial Condition and Results ofOperations . . . . . . . . . . . . . . . . . . . . . . . . . . . . . . . . . . . . . . . . . . . . . . . . . . . . . . . . . . . . . 58
Item 7A. Quantitative and Qualitative Disclosures about Market Risk . . . . . . . . . . . . . . . . . . . . . . . . 82
Item 8. Financial Statements and Supplementary Data . . . . . . . . . . . . . . . . . . . . . . . . . . . . . . . . . . . 82
Item 9. Changes in and Disagreements with Accountants on Accounting and FinancialDisclosure . . . . . . . . . . . . . . . . . . . . . . . . . . . . . . . . . . . . . . . . . . . . . . . . . . . . . . . . . . . . . . 82
Item 9A. Controls and Procedures . . . . . . . . . . . . . . . . . . . . . . . . . . . . . . . . . . . . . . . . . . . . . . . . . . . . . 82
Item 9B. Other Information . . . . . . . . . . . . . . . . . . . . . . . . . . . . . . . . . . . . . . . . . . . . . . . . . . . . . . . . . . 84
Part III
Item 10. Directors, Executive Officers and Corporate Governance . . . . . . . . . . . . . . . . . . . . . . . . . . . 84
Item 11. Executive Compensation . . . . . . . . . . . . . . . . . . . . . . . . . . . . . . . . . . . . . . . . . . . . . . . . . . . . 84
Item 12. Security Ownership of Certain Beneficial Owners and Management and RelatedStockholder Matters . . . . . . . . . . . . . . . . . . . . . . . . . . . . . . . . . . . . . . . . . . . . . . . . . . . . . . 84
Item 13. Certain Relationships and Related Transactions, and Director Independence . . . . . . . . . . . . 85
Item 14. Principal Accountant Fees and Services . . . . . . . . . . . . . . . . . . . . . . . . . . . . . . . . . . . . . . . . 85
Part IV
Item 15. Exhibits and Financial Statement Schedules . . . . . . . . . . . . . . . . . . . . . . . . . . . . . . . . . . . . . 86
Signatures . . . . . . . . . . . . . . . . . . . . . . . . . . . . . . . . . . . . . . . . . . . . . . . . . . . . . . . . . . . . . . . . 98
2
PART I
Item 1. Business
General
HCA Holdings, Inc. is one of the leading health care services companies in the United States. AtDecember 31, 2013, we operated 165 hospitals, comprised of 159 general, acute care hospitals; five psychiatrichospitals; and one rehabilitation hospital. In addition, we operated 115 freestanding surgery centers. Our facilitiesare located in 20 states and England.
The terms “Company,” “HCA,” “we,” “our” or “us,” as used herein and unless otherwise stated or indicatedby context, refer to HCA Inc. and its affiliates prior to the Corporate Reorganization (as defined below) and toHCA Holdings, Inc. and its affiliates after the Corporate Reorganization. The term “affiliates” means direct andindirect subsidiaries of HCA Holdings, Inc. and partnerships and joint ventures in which such subsidiaries arepartners. The terms “facilities” or “hospitals” refer to entities owned and operated by affiliates of HCA, and theterm “employees” refers to employees of affiliates of HCA.
Our primary objective is to provide a comprehensive array of quality health care services in the most cost-effective manner possible. Our general, acute care hospitals typically provide a full range of services toaccommodate such medical specialties as internal medicine, general surgery, cardiology, oncology, neurosurgery,orthopedics and obstetrics, as well as diagnostic and emergency services. Outpatient and ancillary health careservices are provided by our general, acute care hospitals, freestanding surgery centers, diagnostic centers andrehabilitation facilities. Our psychiatric hospitals provide a full range of mental health care services throughinpatient, partial hospitalization and outpatient settings.
On November 17, 2006, HCA Inc. was acquired by a private investor group, including affiliates of or fundssponsored by Bain Capital Partners, LLC, Kohlberg Kravis Roberts & Co., BAML Capital Partners and HCAfounder, Dr. Thomas F. Frist, Jr. (collectively, the “Investors”) and by members of management and certain otherinvestors. The transaction was accounted for as a recapitalization in our financial statements, with no adjustmentsto the historical basis of our assets and liabilities.
During March 2011, we completed the initial public offering of 87,719,300 shares of our common stock.Certain of our stockholders also sold 57,410,700 shares of our common stock in this offering. During December2012, February 2013 and November 2013, certain Investors sold 32,000,000 shares, 50,000,000 shares and30,000,000 shares, respectively, of our common stock. We did not receive any proceeds from the shares sold bythe selling stockholders in any of these offerings. Our common stock is traded on the New York Stock Exchange(symbol “HCA”).
The Company was incorporated in Nevada in January 1990 and reincorporated in Delaware in September1993. Our principal executive offices are located at One Park Plaza, Nashville, Tennessee 37203, and ourtelephone number is (615) 344-9551.
Corporate Reorganization
On November 22, 2010, HCA Inc. reorganized by creating a new holding company structure (the“Corporate Reorganization”). We are the parent company, and HCA Inc. is our 100% owned direct subsidiary.As part of the Corporate Reorganization, HCA Inc.’s outstanding shares of capital stock were automaticallyconverted, on a share for share basis, into identical shares of our common stock. As a result of the CorporateReorganization, we are deemed the successor registrant to HCA Inc. under the Exchange Act. As part of theCorporate Reorganization, we became a guarantor but did not assume the debt of HCA Inc.’s outstanding securednotes.
3
Following the Corporate Reorganization, the right to receive HCA Inc.’s common stock under its variouscompensation plans and agreements automatically converted into rights for the same number of shares of ourcommon stock, with the same rights and conditions as the corresponding HCA Inc. rights prior to the CorporateReorganization.
Available Information
We file certain reports with the Securities and Exchange Commission (the “SEC”), including annual reportson Form 10-K, quarterly reports on Form 10-Q and current reports on Form 8-K. The public may read and copyany materials we file with the SEC at the SEC’s Public Reference Room at 100 F Street, N.E., Washington, DC20549. The public may obtain information on the operation of the Public Reference Room by calling the SEC at1-800-SEC-0330. We are an electronic filer, and the SEC maintains an Internet site at http://www.sec.gov thatcontains the reports, proxy and information statements and other information we file electronically. Our websiteaddress is www.hcahealthcare.com. Please note that our website address is provided as an inactive textualreference only. We make available free of charge, through our website, our annual report on Form 10-K,quarterly reports on Form 10-Q, current reports on Form 8-K and all amendments to those reports filed orfurnished pursuant to Section 13 or 15(d) of the Exchange Act, as soon as reasonably practicable after suchmaterial is electronically filed with or furnished to the SEC. The information provided on our website is not partof this report, and is therefore not incorporated by reference unless such information is specifically referencedelsewhere in this report.
Our Code of Conduct is available free of charge upon request to our Corporate Secretary, HCA Holdings,Inc., One Park Plaza, Nashville, Tennessee 37203.
Business Strategy
We are committed to providing the communities we serve with high quality, cost-effective health care whilegrowing our business, increasing our profitability and creating long-term value for our stockholders. To achievethese objectives, we align our efforts around the following growth agenda:
• grow our presence in existing markets;
• achieve industry-leading performance in clinical and satisfaction measures;
• recruit and employ physicians to meet the need for high quality health services;
• continue to leverage our scale and market positions to enhance profitability; and
• selectively pursue a disciplined development strategy.
Health Care Facilities
We currently own, manage or operate hospitals; freestanding surgery centers; diagnostic and imagingcenters; radiation and oncology therapy centers; comprehensive rehabilitation and physical therapy centers; andvarious other facilities.
At December 31, 2013, we owned and operated 159 general, acute care hospitals with 42,240 licensed beds.Most of our general, acute care hospitals provide medical and surgical services, including inpatient care,intensive care, cardiac care, diagnostic services and emergency services. The general, acute care hospitals alsoprovide outpatient services such as outpatient surgery, laboratory, radiology, respiratory therapy, cardiology andphysical therapy. Each hospital has an organized medical staff and a local board of trustees or governing board,made up of members of the local community.
Our hospitals do not typically engage in extensive medical research and education programs. However,some of our hospitals are affiliated with medical schools and may participate in the clinical rotation of medicalinterns and residents and other education programs.
4
At December 31, 2013, we operated five psychiatric hospitals with 556 licensed beds. Our psychiatrichospitals provide therapeutic programs including child, adolescent and adult psychiatric care, adult andadolescent alcohol and drug abuse treatment and counseling.
We also operate outpatient health care facilities, which include freestanding ambulatory surgery centers(“ASCs”), freestanding emergency care facilities, diagnostic and imaging centers, comprehensive outpatientrehabilitation and physical therapy centers, outpatient radiation and oncology therapy centers and various otherfacilities. These outpatient services are an integral component of our strategy to develop comprehensive healthcare networks in select communities. Most of our ASCs are operated through partnerships or limited liabilitycompanies, with majority ownership of each partnership or limited liability company typically held by a generalpartner or member that is an affiliate of HCA.
Certain of our affiliates provide a variety of management services to our health care facilities, includingpatient safety programs; ethics and compliance programs; national supply contracts; equipment purchasing andleasing contracts; accounting, financial and clinical systems; governmental reimbursement assistance;construction planning and coordination; information technology systems and solutions; legal counsel; humanresources services; and internal audit services.
Sources of Revenue
Hospital revenues depend upon inpatient occupancy levels, the medical and ancillary services ordered byphysicians and provided to patients, the volume of outpatient procedures and the charges or payment rates forsuch services. Charges and reimbursement rates for inpatient services vary significantly depending on the type ofpayer, the type of service (e.g., medical/surgical, intensive care or psychiatric) and the geographic location of thehospital. Inpatient occupancy levels fluctuate for various reasons, many of which are beyond our control.
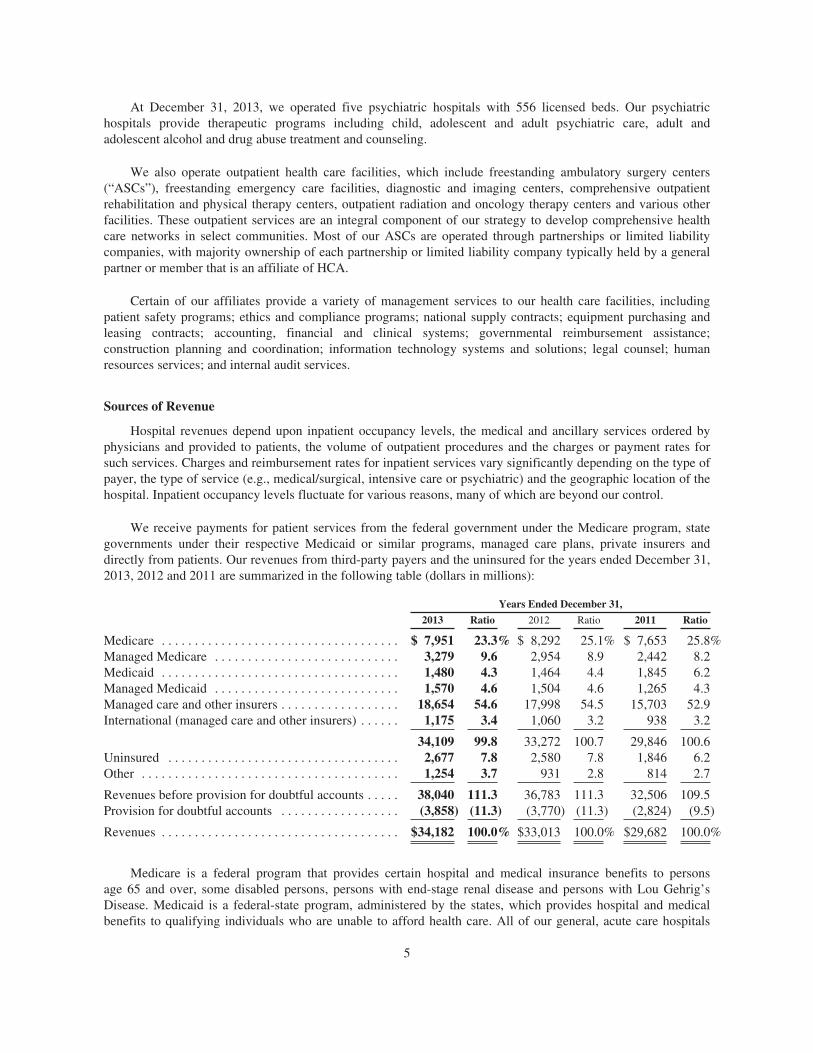
We receive payments for patient services from the federal government under the Medicare program, stategovernments under their respective Medicaid or similar programs, managed care plans, private insurers anddirectly from patients. Our revenues from third-party payers and the uninsured for the years ended December 31,2013, 2012 and 2011 are summarized in the following table (dollars in millions):
Years Ended December 31,
2013 Ratio 2012 Ratio 2011 Ratio
Medicare . . . . . . . . . . . . . . . . . . . . . . . . . . . . . . . . . . . . $ 7,951 23.3% $ 8,292 25.1% $ 7,653 25.8%Managed Medicare . . . . . . . . . . . . . . . . . . . . . . . . . . . . 3,279 9.6 2,954 8.9 2,442 8.2Medicaid . . . . . . . . . . . . . . . . . . . . . . . . . . . . . . . . . . . . 1,480 4.3 1,464 4.4 1,845 6.2Managed Medicaid . . . . . . . . . . . . . . . . . . . . . . . . . . . . 1,570 4.6 1,504 4.6 1,265 4.3Managed care and other insurers . . . . . . . . . . . . . . . . . . 18,654 54.6 17,998 54.5 15,703 52.9International (managed care and other insurers) . . . . . . 1,175 3.4 1,060 3.2 938 3.2
34,109 99.8 33,272 100.7 29,846 100.6Uninsured . . . . . . . . . . . . . . . . . . . . . . . . . . . . . . . . . . . 2,677 7.8 2,580 7.8 1,846 6.2Other . . . . . . . . . . . . . . . . . . . . . . . . . . . . . . . . . . . . . . . 1,254 3.7 931 2.8 814 2.7
Revenues before provision for doubtful accounts . . . . . 38,040 111.3 36,783 111.3 32,506 109.5Provision for doubtful accounts . . . . . . . . . . . . . . . . . . (3,858) (11.3) (3,770) (11.3) (2,824) (9.5)
Revenues . . . . . . . . . . . . . . . . . . . . . . . . . . . . . . . . . . . . $34,182 100.0% $33,013 100.0% $29,682 100.0%
Medicare is a federal program that provides certain hospital and medical insurance benefits to personsage 65 and over, some disabled persons, persons with end-stage renal disease and persons with Lou Gehrig’sDisease. Medicaid is a federal-state program, administered by the states, which provides hospital and medicalbenefits to qualifying individuals who are unable to afford health care. All of our general, acute care hospitals
5
located in the United States are eligible to participate in Medicare and Medicaid programs. Amounts receivedunder Medicare and Medicaid programs are generally significantly less than established hospital gross chargesfor the services provided.
Our hospitals generally offer discounts from established charges to certain group purchasers of health careservices, including private insurance companies, employers, health maintenance organizations (“HMOs”),preferred provider organizations (“PPOs”) and other managed care plans, including plans offered through theAmerican Health Benefit Exchanges (“Exchanges”). These discount programs generally limit our ability toincrease revenues in response to increasing costs. See Item 1, “Business — Competition.” Patients are generallynot responsible for the total difference between established hospital gross charges and amounts reimbursed forsuch services under Medicare, Medicaid, HMOs, PPOs and other managed care plans, but are responsible to theextent of any exclusions, deductibles or coinsurance features of their coverage. The amount of such exclusions,deductibles and coinsurance continues to increase. Collection of amounts due from individuals is typically moredifficult than from governmental or third-party payers. We provide discounts to uninsured patients who do notqualify for Medicaid or charity care under our charity care policy. These discounts are similar to those providedto many local managed care plans. In implementing the uninsured discount policy, we attempt to qualifyuninsured patients for Medicaid, other federal or state assistance or charity care under our charity care policy. Ifan uninsured patient does not qualify for these programs, the uninsured discount is applied.
Medicare
In addition to the reimbursement reductions and adjustments discussed below, the Budget Control Act of2011 (the “BCA”) requires automatic spending reductions to reduce the federal deficit, including Medicarespending reductions of up to 2% per fiscal year, with a uniform percentage reduction across all Medicareprograms. These automatic spending reductions began on March 1, 2013, with CMS imposing a 2% reduction onMedicare claims beginning on April 1, 2013. These reductions have been extended through 2024.
Inpatient Acute Care
Under the Medicare program, we receive reimbursement under a prospective payment system (“PPS”) forgeneral, acute care hospital inpatient services. Under the hospital inpatient PPS, fixed payment amounts perinpatient discharge are established based on the patient’s assigned Medicare severity diagnosis-related group(“MS-DRG”). MS-DRGs classify treatments for illnesses according to the estimated intensity of hospitalresources necessary to furnish care for each principal diagnosis. MS-DRG weights represent the averageresources for a given MS-DRG relative to the average resources for all MS-DRGs. MS-DRG payments areadjusted for area wage differentials. Hospitals, other than those defined as “new,” receive PPS reimbursement forinpatient capital costs based on MS-DRG weights multiplied by a geographically adjusted federal rate. When thecost to treat certain patients falls well outside the normal distribution, providers typically receive additional“outlier” payments.
MS-DRG rates are updated, and MS-DRG weights are recalibrated, using cost-relative weights each federalfiscal year (which begins October 1). The index used to update the MS-DRG rates (the “market basket”) givesconsideration to the inflation experienced by hospitals and entities outside the health care industry in purchasinggoods and services. The Patient Protection and Affordable Care Act, as amended by the Health Care andEducation Reconciliation Act of 2010 (collectively, the “Health Reform Law”), provides for annual decreases tothe market basket, including the following reductions for each of the following federal fiscal years: 0.3% in2014; 0.2% in 2015 and 2016 and 0.75% in 2017, 2018 and 2019. For each federal fiscal year, the Health ReformLaw provides for the annual market basket update to be further reduced by a productivity adjustment based onthe Bureau of Labor Statistics (“BLS”) 10-year moving average of changes in specified economy-wideproductivity. At the time of enactment, the Centers for Medicare & Medicaid Services (“CMS”) estimated thatthe combined market basket and productivity adjustments would reduce Medicare payments under the inpatientPPS by $112.6 billion from 2010 to 2019. The American Taxpayer Relief Act of 2012 requires a negative
6
documentation and coding adjustment for four years beginning in federal fiscal year 2014. It is estimated that thisdocumentation and coding adjustment will reduce Medicare inpatient PPS payments by $10.5 billion. A decreasein payment rates or an increase in rates that is below the increase in our costs may adversely affect our results ofoperations.
For federal fiscal year 2013, CMS increased the MS-DRG rate by 2.8%. This increase reflected a 2.6%market basket increase, the 0.1% reduction required by the Health Reform Law, a negative 0.7% productivityadjustment, a negative 1.9% prospective documentation and coding adjustment and a positive 2.9% retrospectivedocumentation and coding adjustment. For federal fiscal year 2014, CMS issued a final rule that results in a netincrease of 0.7%. This increase reflects a 2.5% market basket increase, the 0.3% reduction required by the HealthReform Law, a negative 0.5% productivity adjustment, a negative 0.8% prospective documentation and codingadjustment and a negative 0.2% adjustment to offset projected spending increases associated with new admissionand medical review criteria for inpatient services commonly known as the “two midnight rule.” Under the rule,Medicare beneficiaries are only to be admitted as inpatients when there is a reasonable expectation that thehospital care is medically necessary and will be required across two midnights, absent unusual circumstances.Compliance with the two midnight rule was required beginning October 1, 2013 and will become subject toRecovery Audit Contractor (“RAC”) audits beginning October 1, 2014.
CMS has implemented or is implementing a number of programs and requirements intended to transformMedicare from a passive payer to an active purchaser of quality goods and services. For example, hospitalsreceive a 2% reduction to their market basket updates if they fail to submit data for patient care quality indicatorsto the Secretary of the Department of Health and Human Services (“HHS”). Beginning in federal fiscal year2015, hospitals that do not participate will lose an additional one-quarter of the percentage increase in theirpayment updates. All of our hospitals paid under the Medicare inpatient PPS are participating in the qualityinitiative by submitting the requested quality data. While we will endeavor to comply with all data submissionrequirements as additional requirements continue to be added, our submissions may not be deemed timely orsufficient to entitle all of our hospitals to the full market basket adjustment.
Further, Medicare does not allow an inpatient hospital discharge to be assigned to a higher paying MS-DRGif a selected hospital acquired condition (“HAC”) was not present on admission. In this situation, the case is paidas though the secondary diagnosis was not present. There are currently 11 categories of conditions on the list ofHACs. In addition, CMS has established three National Coverage Determinations that prohibit Medicarereimbursement for erroneous surgical procedures performed on an inpatient or outpatient basis. The HealthReform Law provides for reduced payments based on a hospital’s HAC rates. Beginning in federal fiscal year2015, the 25% of hospitals with the worst national risk-adjusted HAC rates in the previous year will receive a 1%reduction in their total inpatient operating Medicare payments.
The Health Reform Law also provides for reduced payments to hospitals based on readmission rates.Beginning in federal fiscal year 2013 and continuing in each federal fiscal year, inpatient payments are reduced ifa hospital experiences “excess” readmissions within the 30-day time period from the date of discharge for heartattack, heart failure, pneumonia or other conditions that may be designated by CMS. Hospitals with what CMSdefines as excess readmissions for these conditions receive reduced payments for all inpatient discharges, not justdischarges relating to the conditions subject to the excess readmission standard. The amount by which paymentsare reduced is determined by comparing the hospital’s performance for each condition using three years ofdischarge data to a risk-adjusted national average, subject to a cap established by CMS. The reduction inpayments to hospitals with excess readmissions was capped at 1% for federal fiscal year 2013, but this reductionincreased to 2% for federal fiscal year 2014, and will increase to 3% for federal fiscal year 2015 and thereafter.Each hospital’s performance is publicly reported by CMS.
The Health Reform Law additionally establishes a hospital value-based purchasing program to further linkpayments to quality and efficiency. For each federal fiscal year, CMS will reduce the inpatient PPS paymentamount for all discharges by the following: 1.25% for 2014; 1.5% for 2015; 1.75% for 2016; and 2% for 2017and subsequent years. The total amount collected from these reductions is pooled and used to fund payments to
7
reward hospitals that meet certain quality performance standards established by CMS. CMS scores each hospitalbased on achievement (relative to other hospitals) and improvement ranges (relative to the hospital’s own pastperformance) for each applicable performance standard. Because the Health Reform Law provides that the poolwill be fully distributed, hospitals that meet or exceed the quality performance standards receive greaterreimbursement under the value-based purchasing program than they would have otherwise. Hospitals that do notachieve the necessary quality performance receive reduced Medicare inpatient hospital payments. Hospitals arescored based on a weighted average of patient experience scores using the Hospital Consumer Assessment ofHealthcare Providers and Systems survey and certain clinical measures. In federal fiscal year 2014, there are 17measures by which hospitals will be scored. CMS estimates that it will distribute $1.1 billion in federal fiscalyear 2014 to hospitals under the value-based purchasing program.
Historically, the Medicare program has set aside 5.10% of Medicare inpatient payments to pay for outliercases. For federal fiscal year 2013, CMS established an outlier threshold of $21,821, and for federal fiscal year2014, CMS reduced the outlier threshold to $21,748. We do not anticipate that the decrease to the outlierthreshold for federal fiscal year 2014 will have a material impact on our results of operations.
Outpatient
CMS reimburses hospital outpatient services (and certain Medicare Part B services furnished to hospitalinpatients who have no Part A coverage) on a PPS basis. CMS uses fee schedules to pay for physical,occupational and speech therapies, durable medical equipment, clinical diagnostic laboratory services,nonimplantable orthotics and prosthetics, freestanding surgery center services and services provided byindependent diagnostic testing facilities.
Hospital outpatient services paid under PPS are classified into groups called ambulatory paymentclassifications (“APCs”). Services for each APC are similar clinically and in terms of the resources they require.A payment rate is established for each APC. Depending on the services provided, a hospital may be paid formore than one APC for a patient visit. The APC payment rates are updated for each calendar year. The HealthReform Law provides for reductions to the market basket update, including the following reductions for each ofthe following calendar years: 0.3% in 2014; 0.2% in 2015 and 2016 and 0.75% in 2017, 2018 and 2019. For eachcalendar year, the Health Reform Law provides for the annual market basket update to be further reduced by aproductivity adjustment based on the BLS 10-year moving average of changes in specified economy-wideproductivity. At the time of enactment, CMS estimated that the combined market basket and productivityadjustments would reduce Medicare payments under the outpatient PPS by $26.3 billion from 2010 to 2019. Forcalendar year 2013, CMS increased APC payment rates by 1.8%, which represented the full market basket updateof 2.6%, a negative 0.7% productivity adjustment and the negative 0.1% adjustment required by the HealthReform Law. For calendar year 2014, CMS has issued a final rule that increases the APC payment rate by 1.7%,which includes the full market basket update of 2.5%, a negative 0.5% productivity adjustment and the negative0.3% adjustment required by the Health Reform Law. CMS requires hospitals to submit quality data relating tooutpatient care to avoid receiving a 2% reduction to the market basket update under the outpatient PPS.
Rehabilitation
CMS reimburses inpatient rehabilitation facilities (“IRFs”) on a PPS basis. Under the IRF PPS, patients areclassified into case mix groups based upon impairment, age, comorbidities (additional diseases or disorders fromwhich the patient suffers) and functional capability. IRFs are paid a predetermined amount per discharge thatreflects the patient’s case mix group and is adjusted for area wage levels, low-income patients, rural areas andhigh-cost outliers. The Health Reform Law also provides for reductions to the market basket update, includingthe following reductions for each of the following federal fiscal years: 0.3% in 2014; 0.2% in 2015 and 2016 and0.75% in 2017, 2018 and 2019. For each federal fiscal year, the Health Reform Law provides for the annualmarket basket update to be further reduced by a productivity adjustment based on the BLS 10-year moving
8
average of changes in specified economy-wide productivity. At the time of enactment, CMS estimated that thecombined market basket and productivity adjustments would reduce Medicare payments under the IRF PPS by$5.7 billion from 2010 to 2019. For federal fiscal year 2013, CMS updated inpatient rehabilitation rates by 1.9%,which reflected a 2.7% market basket increase, a negative 0.7% productivity adjustment and a 0.1% reductionrequired by the Health Reform Law. For federal fiscal year 2014, CMS has issued a final rule updating inpatientrehabilitation rates by 1.8%, which reflects a 2.6% market basket increase, a negative 0.5% productivityadjustment and a 0.3% reduction required by the Health Reform Law. In addition, beginning in federal fiscal year2014, IRFs are required to report quality measures to CMS or they will receive a 2% reduction to the marketbasket update.
In order to qualify for classification as an IRF, at least 60% of a facility’s inpatients during the most recent12-month CMS-defined review period must have required intensive rehabilitation services for one or more of13 specified conditions. IRFs must also meet additional coverage criteria, including patient selection and carerequirements relating to pre-admission screenings, post-admission evaluations, ongoing coordination of care andinvolvement of rehabilitation physicians. A facility that fails to meet the 60% threshold, or other criteria to beclassified as an IRF, will be paid under the acute care hospital inpatient or outpatient PPS, which generallyprovide for lower payment amounts. As of December 31, 2013, we had one rehabilitation hospital and 48hospital rehabilitation units.
Psychiatric
Inpatient hospital services furnished in psychiatric hospitals and psychiatric units of general, acute carehospitals and critical access hospitals are reimbursed under a prospective payment system (the “IPF PPS”), a perdiem payment, with adjustments to account for certain patient and facility characteristics. The IPF PPS containsan “outlier” policy for extraordinarily costly cases and an adjustment to a facility’s base payment if it maintains afull-service emergency department. CMS has established the IPF PPS payment rate in a manner intended to bebudget neutral. The rehabilitation, psychiatric and long-term care market basket update is used to update the IPFPPS. The Health Reform Law also provides for reductions to the market basket update, including the followingreductions for the following federal fiscal years: 0.1% in 2014; 0.3% in 2015, 0.2% in 2016 and 2017 and 0.75%in 2018, 2019 and 2020. For each payment year, the Health Reform Law provides for the annual market basketupdate to be further reduced by a productivity adjustment based on the BLS 10-year moving average of changesin specified economy-wide productivity. At the time of enactment, CMS estimated that the combined marketbasket and productivity adjustments would reduce Medicare payments under the IPF PPS by $4.3 billion from2010 to 2019. For federal fiscal year 2013, CMS increased inpatient psychiatric payment rates by 1.9%,including a market basket increase of 2.7%, reduced by a 0.7% productivity adjustment and a reduction of 0.1%as required by the Health Reform Law. For federal fiscal year 2014, CMS has increased inpatient psychiatricpayment rates by 2%, including a market basket increase of 2.6%, reduced by a 0.5% productivity adjustmentand 0.1% as required by the Health Reform Law. Beginning in federal fiscal year 2014, inpatient psychiatricfacilities will be required to report quality measures to CMS or will receive a 2% reduction to the market basketupdate. As of December 31, 2013, we had five psychiatric hospitals and 45 hospital psychiatric units.
Ambulatory Surgery Centers
CMS reimburses ASCs using a predetermined fee schedule. Reimbursements for ASC overhead costs arelimited to no more than the overhead costs paid to hospital outpatient departments under the Medicare hospitaloutpatient PPS for the same procedure. If CMS determines that a procedure is commonly performed in aphysician’s office, the ASC reimbursement for that procedure is limited to the reimbursement allowable underthe Medicare Part B Physician Fee Schedule, with limited exceptions. All surgical procedures, other than thosethat pose a significant safety risk or generally require an overnight stay, are payable as ASC procedures. Fromtime to time, CMS considers expanding the services that may be performed in ASCs, which may result in moreMedicare procedures that historically have been performed in hospitals being moved to ASCs, reducing surgicalvolume in our hospitals. Also, more Medicare procedures that historically have been performed in ASCs may be
9
moved to physicians’ offices. Commercial third-party payers may adopt similar policies. For each federal fiscalyear, the Health Reform Law provides for the annual market basket update to be reduced by a productivityadjustment based on the BLS 10-year moving average of changes in specified economy-wide productivity. Forcalendar year 2014, CMS has issued a final rule that provides for a 1.2% annual update to ASC payments, whichincludes the market basket update of 1.7% and a negative 0.5% productivity adjustment. In addition, CMS hasalso established a quality reporting program for ASCs under which ASCs that fail to report on specified qualitymeasures will receive a 2% reduction in reimbursement.
Physician Services
Physician services are reimbursed under the physician fee schedule (“PFS”) system, under which CMS hasassigned a national relative value unit (“RVU”) to most medical procedures and services that reflects the variousresources required by a physician to provide the services relative to all other services. Each RVU is calculatedbased on a combination of work required in terms of time and intensity of effort for the service, practice expense(overhead) attributable to the service and malpractice insurance expense attributable to the service. These threeelements are each modified by a geographic adjustment factor to account for local practice costs and are thenaggregated. The aggregated amount is multiplied by a conversion factor that accounts for inflation and targetedgrowth in Medicare expenditures (as calculated by the sustainable growth rate (“SGR”)) to arrive at the paymentamount for each service. While RVUs for various services may change in a given year, any alterations arerequired by statute to be virtually budget neutral, such that total payments made under the PFS may not differ bymore than $20 million from what payments would have been if adjustments were not made.
The PFS rates are adjusted each year, and reductions in both current and future payments are anticipated.The SGR formula, if implemented as mandated by statute, would result in significant reductions to paymentsunder the PFS. These reductions are scheduled to be effective April 1, 2014. Since 2003, the U.S. Congress haspassed multiple legislative acts delaying application of the SGR to the PFS. The most recent legislative delayprovided a 0.5% increase in payment rates through March 31, 2014. The Senate Finance Committee, the HouseWays and Means Committee, and the House Energy and Commerce Committee recently agreed upon legislationthat, if enacted, will discontinue use of the SGR formula, thereby eliminating the scheduled payment reductions.The legislation would also provide an annual payment increase of 0.5% beginning in 2014 and extending through2018 and would maintain 2018 rates through 2023. In addition, the legislation would require CMS to transitionphysician payments to a more value-based model beginning in 2018.
Other
Under PPS, the payment rates are adjusted for the area differences in wage levels by a factor (“wage index”)reflecting the relative wage level in the geographic area compared to the national average wage level and takinginto account occupational mix. The redistributive impact of wage index changes, while slightly negative in theaggregate, is not anticipated to have a material financial impact for 2014. Based on the Health Reform Law’smandate, HHS submitted recommendations on reform to the Medicare wage index system, but Congress has notyet acted on the proposed reforms.
Medicare reimburses hospitals for a portion of bad debts resulting from deductible and coinsurance amountsthat are uncollectable from Medicare beneficiaries. The Middle Class Tax Relief and Jobs Creation Act of 2012(the “Jobs Creation Act”) reduced the percentage of bad debt amounts that Medicare reimburses from 70% to65%. These reductions were intended to offset, in part, the impact of the legislative delay of the SGR reductionsin physician compensation under the PFS. The U.S. Congress is considering legislation to address the SGRreductions, but has not yet enacted it into law.
As required by the MMA, CMS has implemented contractor reform whereby CMS competitively bids theMedicare fiscal intermediary and Medicare carrier functions to 15 Medicare Administrative Contractors(“MACs”), which are geographically assigned and service both Part A and Part B providers within a given
10

jurisdiction. CMS awarded initial contracts to all 15 MAC jurisdictions, but CMS is currently engaged in aconsolidation strategy to move from 15 MAC jurisdictions to 10. While chain providers had the option of havingall hospitals use one home office MAC, we chose to use the MACs assigned to the geographic areas in which ourhospitals are located. CMS periodically re-solicits bids, and the MAC servicing a geographic area can change asa result of the bid competition. MAC transition periods can impact claims processing functions and the resultingcash flow.
Under the RAC program, CMS contracts with RACs on a contingency basis to conduct post-paymentreviews to detect and correct improper payments in the fee-for-service Medicare program. CMS has implementedthe RAC program on a permanent, nationwide basis as required by statute. The compensation for the RACs isbased on their review of claims submitted to Medicare for billing compliance, including correct coding andmedical necessity, and the amount of overpayments and underpayments they identify.
Historically, RACs have conducted their reviews on a post-payment basis. However, CMS has alsoestablished the Recovery Audit Prepayment Review (“RAPR”) demonstration, that allows RACs to performprepayment reviews. Under the RAPR demonstration, RACs conduct prepayment reviews on certain types ofclaims that historically result in high rates of improper payments, beginning with claims for short stay inpatienthospital services. These reviews focus on seven states (Florida, California, Michigan, Texas, New York,Louisiana and Illinois) with high populations of fraud and error-prone providers and four states (Pennsylvania,Ohio, North Carolina, and Missouri) with high claims volumes of short inpatient hospital stays. The RAPRdemonstration began in 2012 and runs for a three year period.
We have established policies and procedures to respond to the RAC requests and payment denials. Paymentrecoveries resulting from RAC reviews and denials are appealable through administrative and judicial processes,and we pursue reversal of adverse determinations at appropriate appeal levels. We are incurring additional costsrelated to responding to RAC requests and denials, including costs associated with responding to requests forrecords and pursuing the reversal of payment denials and losses associated with overpayments that are notreversed upon appeal. Amounts that have not been reversed upon appeal have not been significant, but thenumber and amount of claims subject to RAC review has been steadily increasing, and we expect this trend tocontinue. Further, HHS has suspended the assignment of new Medicare appeals to Administrative Law Judgesfor at least two years beginning July 16, 2013, so that HHS may work through a backlog of appeals. Thus, wewill experience a significant delay in appealing any RAC payment denials that occur during the suspensionperiod. Depending upon the growth of RAC programs and our success in appealing claims in future periods, ourcash flows and results of operations could be negatively impacted.
Managed Medicare
Under the Managed Medicare program, the federal government contracts with private health plans toprovide members with Medicare Part A, Part B and Part D benefits. Managed Medicare plans can be structuredas HMOs, PPOs or private fee-for-service plans. The Medicare program allows beneficiaries to chooseenrollment in certain managed Medicare plans. MMA increased reimbursement to managed Medicare plans andexpanded Medicare beneficiaries’ health care options. The Health Reform Law reduces, over a three year periodstarting in 2012, premium payments to managed Medicare plans such that CMS’ managed care per capitapremium payments are, on average, equal to traditional Medicare. In addition, the Health Reform Law requiresmanaged Medicare plans to keep annual administrative costs lower than 15% of annual premium revenue. TheHealth Reform Law also implements fee payment adjustments based on service benchmarks and quality ratings.The Congressional Budget Office (“CBO”) has estimated that, as a result of these changes, payments to planswill be reduced by $138 billion between 2010 and 2019, while CMS has estimated the reduction to be$145 billion. In addition, the Health Reform Law expands the RAC program to include managed Medicare plans.In light of the current economic environment and the Health Reform Law, managed Medicare plans mayexperience reduced premium payments from CMS, which may lead to increased beneficiary premiums or limitson benefits which, in turn, may cause decreased enrollment in such plans.
11
Medicaid
Medicaid programs are funded jointly by the federal government and the states and are administered bystates under approved plans. Most state Medicaid program payments are made under a PPS or are based onnegotiated payment levels with individual hospitals. Medicaid reimbursement is often less than a hospital’s costof services. Although the Health Reform Law requires states to expand Medicaid coverage to all individualsunder age 65 with incomes up to 133% of the federal poverty level (“FPL”) by 2014, states may opt out of theexpansion without losing existing federal Medicaid funding. For those states that expand Medicaid coverage, theHealth Reform Law requires states to apply a “5% income disregard” to the Medicaid eligibility standard, so thatMedicaid eligibility will effectively be extended to those with incomes up to 138% of the FPL. A number ofstates, including Texas and Florida, have opted out of the Medicaid expansion, but these states could choose toimplement the expansion at a later date. It is unclear how many states will ultimately decline to implement theMedicaid expansion provisions of the law.
Because most states must operate with balanced budgets and because the Medicaid program is often thestate’s largest program, states can be expected to adopt or consider adopting legislation designed to reduce theirMedicaid expenditures. The current economic environment has increased the budgetary pressures on most states,and these budgetary pressures have resulted and likely will continue to result in decreased spending, or decreasedspending growth, for Medicaid programs in many states.
Certain states in which we operate have adopted broad-based provider taxes to fund the non-federal share ofMedicaid programs. Many states have also adopted, or are considering, legislation designed to reduce coverage,enroll Medicaid recipients in managed care programs and/or impose additional taxes on hospitals to help financeor expand the states’ Medicaid systems. However, the Health Reform Law requires states to at least maintainMedicaid eligibility standards established prior to the enactment of the law for children until October 1, 2019.
Federal funds under the Medicaid program may not be used to reimburse providers for medical assistanceprovided to treat certain provider-preventable conditions. Each state Medicaid program must deny payments toproviders for the treatment of health care-acquired conditions designated by CMS as well as other provider-preventable conditions that may be designated by the state.
Congress has expanded the federal government’s involvement in fighting fraud, waste and abuse in theMedicaid program through the Medicaid Integrity Program. CMS employs private contractors, referred to asMedicaid Integrity Contractors (“MICs”), to perform post-payment audits of Medicaid claims and identifyoverpayments. In addition to MICs, several other contractors and state Medicaid agencies have increased theirreview activities. The Health Reform Law increases federal funding for the MIC program and expands the RACprogram’s scope to include Medicaid claims by requiring all states to enter into contracts with RACs to auditpayments to Medicaid providers.
Managed Medicaid
Managed Medicaid programs enable states to contract with one or more entities for patient enrollment, caremanagement and claims adjudication. The states usually do not relinquish program responsibilities for financing,eligibility criteria and core benefit plan design. We generally contract directly with one of the designated entities,usually a managed care organization. The provisions of these programs are state-specific.
Enrollment in managed Medicaid plans has increased in recent years, as state governments seek to controlthe cost of Medicaid programs. However, general economic conditions in the states in which we operate mayrequire reductions in premium payments to these plans and may reduce enrollment in these plans.
Accountable Care Organizations and Bundled Payment Initiatives
Pursuant to the Health Reform Law, HHS established a Medicare Shared Savings Program (“MSSP”) thatseeks to promote accountability and coordination of care through the creation of Accountable Care Organizations
12
(“ACOs”). The program allows certain providers and suppliers (including hospitals, physicians and otherdesignated professionals) to voluntarily form ACOs and work together along with other ACO participants toinvest in infrastructure and redesign delivery processes to achieve high quality and efficient delivery of services.The program is intended to produce savings as a result of improved quality and operational efficiency. ACOs thatachieve quality performance standards established by HHS are eligible to share in a portion of the amounts savedby the Medicare program. HHS has significant discretion to determine key elements of the program. Participantsmay choose between two different ACO tracks, the first of which allows ACOs to share only in the savings underthe MSSP. The second track requires ACOs to share in any savings and losses under the MSSP but offers ACOsa greater share of any savings realized under the MSSP. As authorized by the Health Reform Law, certainwaivers are available from fraud and abuse laws for ACOs. CMS has approved over 300 ACOs to participate inthe MSSP.
The Health Reform Law created the Center for Medicare & Medicaid Innovation with responsibility forestablishing demonstration projects and other initiatives in order to identify, develop, test and encourage theadoption of new methods of delivering and paying for health care that create savings under the Medicare andMedicaid programs while improving quality of care. One initiative announced by the Center for Medicare &Medicaid Innovation is a voluntary bundled payment initiative involving over 400 participants that linkspayments to participating providers for services provided during an episode of care. As required by the HealthReform Law, HHS established a separate five-year, voluntary, national pilot program on payment bundling forMedicare services. Under the program, organizations enter into payment arrangements that include financial andperformance accountability for episodes of care, and these models are intended to lead to higher quality, morecoordinated care at a lower cost to the Medicare program. Participating providers agree to receive one paymentfor services provided to Medicare patients for certain medical conditions or episodes of care. The Health ReformLaw also provides for a bundled payment demonstration project for Medicaid services, but CMS has not yetimplemented this project. HHS may select up to eight states to participate, and these state programs may targetparticular categories of beneficiaries, selected diagnoses or geographic regions of the state. The selected stateprograms will provide one payment for both hospital and physician services provided to Medicaid patients forcertain episodes of inpatient care.
Disproportionate Share Hospital Payments
In addition to making payments for services provided directly to beneficiaries, Medicare makes additionalpayments to hospitals that treat a disproportionately large number of low-income patients (Medicaid andMedicare patients eligible to receive Supplemental Security Income). DSH payments are determined annuallybased on certain statistical information required by HHS and are calculated as a percentage addition to MS-DRGpayments.
Under the Health Reform Law, beginning in federal fiscal year 2014, Medicare DSH payments are reducedto 25% of the amount they otherwise would have been absent the law. The remaining 75% of the amount thatwould otherwise be paid under Medicare DSH is effectively pooled, and this pool will be reduced further eachyear by a formula that reflects reductions in the national level of uninsured who are under 65 years of age. Thus,the greater the level of coverage for the uninsured nationally, the more the Medicare DSH payment pool will bereduced. Each DSH hospital is then to be paid, out of the reduced DSH payment pool, an amount allocated basedupon its estimated cost of providing uncompensated care. In 2013, CMS issued final rules to implement thesereductions.
Hospitals that provide care to a disproportionately high number of low-income patients may receiveMedicaid DSH payments. The federal government distributes federal Medicaid DSH funds to each state based ona statutory formula. The states then distribute the DSH funding among qualifying hospitals. States have broaddiscretion to define which hospitals qualify for Medicaid DSH payments and the amount of such payments. TheHealth Reform Law, as modified by the Bipartisan Budget Act of 2013, provides for reductions to the MedicaidDSH hospital program in federal fiscal years 2016 through 2020 by the following amounts: 2016 ($1.2 billion);2017 ($1.8 billion); 2018 ($5 billion); 2019 ($5.6 billion); and 2020 ($4 billion). The Jobs Creation Act, the
13
American Taxpayer Relief Act of 2012 and the Bipartisan Budget Act of 2013 provide for additional MedicaidDSH reductions in federal fiscal years 2021, 2022 and 2023 estimated at $4.1 billion, $4.2 billion and $4.3billion, respectively. CMS has issued a final rule establishing the methodology for allocating the cuts among thestates based on the volume of Medicaid inpatients and levels of uncompensated care in each state. States largelyretain the ability to manage the reduced allotments and to allocate these cuts among providers within the state.
TRICARE
TRICARE is the Department of Defense’s health care program for members of the armed forces. Forinpatient services, TRICARE reimburses hospitals based on a DRG system modeled on the Medicare inpatientPPS. For outpatient services, TRICARE reimburses hospitals based on a PPS that is similar to that utilized forservices furnished to Medicare beneficiaries.
Annual Cost Reports
All hospitals participating in the Medicare, Medicaid and TRICARE programs, whether paid on areasonable cost basis or under a PPS, are required to meet certain financial reporting requirements. Federal and,where applicable, state regulations require the submission of annual cost reports covering the revenues, costs andexpenses associated with the services provided by each hospital to Medicare beneficiaries and Medicaidrecipients.
Annual cost reports required under the Medicare and Medicaid programs are subject to routine audits, whichmay result in adjustments to the amounts ultimately determined to be due to us under these reimbursementprograms. These audits often require several years to reach the final determination of amounts due to or from usunder these programs. Providers also have rights of appeal, and it is common to contest issues raised in audits ofcost reports.
Managed Care and Other Discounted Plans
Most of our hospitals offer discounts from established charges to certain large group purchasers of healthcare services, including managed care plans and private insurance companies. Admissions reimbursed bycommercial managed care and other insurers were 30%, 30%, and 31% of our total admissions for the yearsended December 31, 2013, 2012 and 2011, respectively. Managed care contracts are typically negotiated forterms between one and three years. While we generally received contracted annual average increases that wereexpected to yield 4% to 6% from managed care payers during 2013, there can be no assurance that we willcontinue to receive increases in the future. It is not clear what impact, if any, the increased obligations onmanaged care payers and other health plans imposed by the Health Reform Law will have on our ability tonegotiate reimbursement increases or the impact of plans offered through the Exchanges on us.
Uninsured and Self-Pay Patients
A high percentage of our uninsured patients are initially admitted through our emergency rooms. For theyear ended December 31, 2013, approximately 83% of our admissions of uninsured patients occurred through ouremergency rooms. The Emergency Medical Treatment and Labor Act (“EMTALA”) requires any hospital thatparticipates in the Medicare program to conduct an appropriate medical screening examination of every personwho presents to the hospital’s emergency room for treatment and, if the individual is suffering from anemergency medical condition, to either stabilize that condition or make an appropriate transfer of the individualto a facility that can handle the condition. The obligation to screen and stabilize emergency medical conditionsexists regardless of an individual’s ability to pay for treatment. The Health Reform Law requires health plans toreimburse hospitals for emergency services provided to enrollees without prior authorization and without regardto whether a participating provider contract is in place. Further, the Health Reform Law contains provisions thatseek to decrease the number of uninsured individuals, including requirements and incentives, most of which
14
became effective on January 1, 2014, for individuals to obtain, and large employers to provide, insurancecoverage. These mandates may reduce the financial impact of screening for and stabilizing emergency medicalconditions. However, many factors are unknown regarding the impact of the Health Reform Law, including howmany previously uninsured individuals will obtain coverage as a result of the law, the change, if any, in thevolume of inpatient and outpatient hospital services that are sought by and provided to previously uninsuredindividuals, any changes to the payer mix and any increases in plan structures that result in higher patientresponsibility amounts.
Electronic Health Record Incentives
The American Recovery and Reinvestment Act of 2009 (“ARRA”) provides for Medicare and Medicaidincentive payments for eligible hospitals and for eligible professionals that adopt and meaningfully use certifiedelectronic health record (“EHR”) technology and provides for penalties for eligible hospitals and eligibleprofessionals that do not adopt and meaningfully use EHR technology. Through December 2013, approximately$19 billion in incentive payments have been made through the Medicare and Medicaid EHR incentive programsto eligible hospitals and eligible professionals.
Under the Medicare incentive program, eligible hospitals that demonstrate meaningful use will receiveincentive payments for up to four fiscal years. The Medicare incentive payment amount is the product of threefactors: (1) an initial amount comprised of a base amount of $2,000,000, plus $200 for each acute care inpatientdischarge, beginning with a hospital’s 1,150th discharge of the applicable year and ending with a hospital’s23,000th discharge of the applicable year; (2) the “Medicare share,” which is the sum of Medicare Part A andPart C acute care inpatient-bed-days divided by the product of the total acute care inpatient-bed-days and acharity care factor; and (3) a transition factor applicable to the payment year. In order to maximize their incentivepayments, acute care hospitals must have begun participating in the incentive program by federal fiscal year2013. Beginning in federal fiscal year 2015, acute care hospitals that have failed to demonstrate meaningful useof certified EHR technology in an applicable prior reporting period will receive reduced market basket updatesunder inpatient PPS.
Eligible professionals who demonstrate meaningful use are entitled to incentive payments for up to fivepayment years in an amount equal to 75% of their estimated Medicare allowed charges for covered professionalservices furnished during the relevant calendar year, subject to an annual limit. Eligible professionals must havebegun participating in the incentive payment program by calendar year 2012 in order to maximize their incentivepayments and must participate by calendar year 2014 in order to receive any incentive payments. Beginning incalendar year 2015, eligible professionals who have failed to demonstrate meaningful use of certified EHRtechnology in an applicable prior reporting period will face Medicare payment reductions.
The Medicaid EHR incentive program is voluntary for states to implement. For participating states, theMedicaid EHR incentive program provides incentive payments for acute care hospitals and eligible professionalsthat meet certain volume percentages of Medicaid patients, as well as children’s hospitals. Providers may onlyparticipate in a single state’s Medicaid EHR incentive program. Eligible professionals can only participate ineither the Medicaid incentive program or the Medicare incentive program and can change this election only onetime. Eligible hospitals may participate in both the Medicare and Medicaid incentive programs.
To qualify for incentive payments under the Medicaid program, providers must either adopt, implement,upgrade or demonstrate meaningful use of certified EHR technology during their first participation year orsuccessfully demonstrate meaningful use of certified EHR technology in subsequent participation years.Payments may be received for up to six participation years. For hospitals, the aggregate Medicaid EHR incentiveamount is the product of two factors: (1) the overall EHR amount, which is comprised of a base amount of$2,000,000 plus a discharge-related amount, multiplied by the Medicare share (which is set at one by statute)multiplied by a transition factor, and (2) the “Medicaid share,” which is the estimated Medicaid inpatient-beddays plus estimated Medicaid managed care inpatient bed-days, divided by the product of the estimated totalinpatient bed-days and a charity care factor. Under the Medicaid incentive program, eligible professionals may
15
receive payments based on their EHR costs, up to a total amount of $63,750, or for pediatricians, $42,500. Thereis no penalty for hospitals or professionals under Medicaid for failing to meet EHR meaningful use requirements.
Hospital Utilization
We believe the most important factors relating to the overall utilization of a hospital are the quality andmarket position of the hospital and the number and quality of physicians and other health care professionalsproviding patient care within the facility. Generally, we believe the ability of a hospital to be a market leader isdetermined by its breadth of services, level of technology, quality and condition of the facilities, emphasis onquality of care and convenience for patients and physicians. Other factors that impact utilization include thegrowth in local population, local economic conditions and market penetration of managed care programs.
The following table sets forth certain operating statistics for our health care facilities. Health care facilityoperations are subject to certain seasonal fluctuations, including decreases in patient utilization during holidayperiods and increases in the cold weather months. The data set forth in this table includes only those facilities thatare consolidated for financial reporting purposes.
Years Ended December 31,
2013 2012 2011 2010 2009
Number of hospitals at end of period(a) . . . . . . . . . 165 162 163 156 155Number of freestanding outpatient surgery centers
at end of period(b) . . . . . . . . . . . . . . . . . . . . . . . . 115 112 108 97 97Number of licensed beds at end of period(c) . . . . . 42,896 41,804 41,594 38,827 38,839Weighted average licensed beds(d) . . . . . . . . . . . . . 42,133 41,795 39,735 38,655 38,825Admissions(e) . . . . . . . . . . . . . . . . . . . . . . . . . . . . . 1,744,100 1,740,700 1,620,400 1,554,400 1,556,500Equivalent admissions(f) . . . . . . . . . . . . . . . . . . . . . 2,844,700 2,832,100 2,595,900 2,468,400 2,439,000Average length of stay (days)(g) . . . . . . . . . . . . . . . 4.8 4.7 4.8 4.8 4.8Average daily census(h) . . . . . . . . . . . . . . . . . . . . . 22,853 22,521 21,123 20,523 20,650Occupancy rate(i) . . . . . . . . . . . . . . . . . . . . . . . . . . 54% 54% 53% 53% 53%Emergency room visits(j) . . . . . . . . . . . . . . . . . . . . 6,968,100 6,912,000 6,143,500 5,706,200 5,593,500Outpatient surgeries(k) . . . . . . . . . . . . . . . . . . . . . . 881,900 873,600 799,200 783,600 794,600Inpatient surgeries(l) . . . . . . . . . . . . . . . . . . . . . . . . 508,800 506,500 484,500 487,100 494,500
(a) Excludes eight facilities in 2010 and 2009 that were not consolidated (accounted for using the equitymethod) for financial reporting purposes.
(b) Excludes one facility in 2012 and 2011, nine facilities in 2010 and eight facilities in 2009 that were notconsolidated (accounted for using the equity method) for financial reporting purposes.
(c) Licensed beds are those beds for which a facility has been granted approval to operate from the applicablestate licensing agency.
(d) Represents the average number of licensed beds, weighted based on periods owned.(e) Represents the total number of patients admitted to our hospitals and is used by management and certain
investors as a general measure of inpatient volume.(f) Equivalent admissions are used by management and certain investors as a general measure of combined
inpatient and outpatient volume. Equivalent admissions are computed by multiplying admissions (inpatientvolume) by the sum of gross inpatient revenue and gross outpatient revenue and then dividing the resultingamount by gross inpatient revenue. The equivalent admissions computation “equates” outpatient revenue tothe volume measure (admissions) used to measure inpatient volume, resulting in a general measure ofcombined inpatient and outpatient volume.
(g) Represents the average number of days admitted patients stay in our hospitals.(h) Represents the average number of patients in our hospital beds each day.(i) Represents the percentage of hospital licensed beds occupied by patients. Both average daily census and
occupancy rate provide measures of the utilization of inpatient rooms.
16
(j) Represents the number of patients treated in our emergency rooms.(k) Represents the number of surgeries performed on patients who were not admitted to our hospitals. Pain
management and endoscopy procedures are not included in outpatient surgeries.(l) Represents the number of surgeries performed on patients who have been admitted to our hospitals. Pain
management and endoscopy procedures are not included in inpatient surgeries.
Competition
Generally, other hospitals in the local communities served by most of our hospitals provide services similarto those offered by our hospitals. Additionally, in recent years the number of freestanding specialty hospitals,surgery centers, emergency departments, urgent care centers and diagnostic and imaging centers in thegeographic areas in which we operate has increased significantly. As a result, most of our hospitals operate in ahighly competitive environment. In some cases, competing hospitals are more established than our hospitals.Some competing facilities are physician-owned or are owned by tax-supported government agencies and manyothers are owned by not-for-profit entities that may be supported by endowments, charitable contributions and/ortax revenues and are exempt from sales, property and income taxes. Such exemptions and support are notavailable to our hospitals and may provide the tax-supported or not-for-profit entities an advantage in fundingcapital expenditures. In certain localities there are large teaching hospitals that provide highly specializedfacilities, equipment and services that may not be available at most of our hospitals. We also face competitionfrom specialty hospitals and from both our own and unaffiliated freestanding ASCs for market share in certainhigh margin services.
Psychiatric hospitals frequently attract patients from areas outside their immediate locale and, therefore, ourpsychiatric hospitals compete with both local and regional hospitals, including the psychiatric units of general,acute care hospitals.
Our strategies are designed to ensure our hospitals are competitive. We believe our hospitals compete withinlocal communities on the basis of many factors, including the quality of care, ability to attract and retain qualityphysicians, skilled clinical personnel and other health care professionals, location, breadth of services,technology offered, quality and condition of the facilities and prices charged. The Health Reform Law requireshospitals to publish annually a list of their standard charges for items and services. We have increased our focuson operating outpatient services with improved accessibility and more convenient service for patients, andincreased predictability and efficiency for physicians.
Two of the most significant factors to the competitive position of a hospital are the number and quality ofphysicians affiliated with or employed by the hospital. Although physicians may at any time terminate theirrelationship with a hospital we operate, our hospitals seek to retain physicians with varied specialties on thehospitals’ medical staffs and to attract other qualified physicians. We believe physicians refer patients to ahospital on the basis of the quality and scope of services it renders to patients and physicians, the quality ofphysicians on the medical staff, the location of the hospital and the quality of the hospital’s facilities, equipmentand employees. Accordingly, we strive to maintain and provide quality facilities, equipment, employees andservices for physicians and patients. Our hospitals face competition from competitors that are implementingphysician alignment strategies, such as employing physicians, acquiring physician practice groups andparticipating in ACOs or other clinical integration models.
Another major factor in the competitive position of our hospitals is our ability to negotiate service contractswith purchasers of group health care services. Managed care plans attempt to direct and control the use ofhospital services and obtain discounts from hospitals’ established gross charges. In addition, employers andtraditional health insurers continue to attempt to contain costs through negotiations with hospitals for managedcare programs and discounts from established gross charges. Generally, hospitals compete for service contractswith group health care services purchasers on the basis of price, market reputation, geographic location, qualityand range of services, quality of the medical staff and convenience. Our future success will depend, in part, on
17
our ability to retain and renew our managed care contracts and enter into new managed care contracts onfavorable terms. Other health care providers may impact our ability to enter into managed care contracts ornegotiate increases in our reimbursement and other favorable terms and conditions. For example, some of ourcompetitors may negotiate exclusivity provisions with managed care plans or otherwise restrict the ability ofmanaged care companies to contract with us. The trend toward consolidation among non-government payerstends to increase their bargaining power over fee structures. In addition, as various provisions of the HealthReform Law are implemented, including the Exchanges and limitations on rescissions of coverage and pre-existing condition exclusions, non-government payers may increasingly demand reduced fees or be unwilling tonegotiate reimbursement increases. Most of the plans offered through the Exchanges provide for narrownetworks that restrict the number of participating providers or tiered networks that impose significantly highercost sharing obligations on patients that obtain services from providers in a disfavored tier. The importance ofobtaining contracts with managed care organizations varies from community to community, depending on themarket strength of such organizations.
State certificate of need (“CON”) laws, which place limitations on a health care facility’s ability to expandservices and facilities, make capital expenditures and otherwise make changes in operations, may also have theeffect of restricting competition. We currently operate health care facilities in a number of states with CON lawsor that require other types of approvals for the establishment or expansion of certain facility types or services.Before issuing a CON or other approval, these states consider the need for additional or expanded health carefacilities or services. In those states that do not require state approval or that set relatively high levels ofexpenditures before they become reviewable by state authorities, competition in the form of new services,facilities and capital spending is more prevalent. See Item 1, “Business — Regulation and Other Factors.”
We and the health care industry as a whole face the challenge of continuing to provide quality patient carewhile dealing with rising costs and strong competition for patients. Changes in medical technology, existing andfuture legislation, regulations and interpretations and managed care contracting for provider services by privateand government payers remain ongoing challenges.
Admissions, average lengths of stay and reimbursement amounts continue to be negatively affected bypayer-required pre-admission authorization, utilization review and payer pressure to maximize outpatient andalternative health care delivery services for less acutely ill patients. The Health Reform Law expanded the use ofprepayment review by Medicare contractors by eliminating statutory restrictions on their use. Increasedcompetition, admission constraints and payer pressures are expected to continue. To meet these challenges, weintend to expand and update our facilities or acquire or construct new facilities where appropriate, to enhance theprovision of a comprehensive array of outpatient services, offer market competitive pricing to private payergroups, upgrade facilities and equipment and offer new or expanded programs and services.
Regulation and Other Factors
Licensure, Certification and Accreditation
Health care facility construction and operation are subject to numerous federal, state and local regulationsrelating to the adequacy of medical care, equipment, personnel, operating policies and procedures, maintenanceof adequate records, fire prevention, rate-setting and compliance with building codes and environmentalprotection laws. Facilities are subject to periodic inspection by governmental and other authorities to assurecontinued compliance with the various standards necessary for licensing and accreditation. We believe our healthcare facilities are properly licensed under applicable state laws. Each of our acute care hospitals located in theUnited States is eligible to participate in Medicare and Medicaid programs and is accredited by The JointCommission with the exception of three hospitals acquired in the third quarter of 2013 which are accredited byDet Norske Veritas. If any facility were to lose its Medicare or Medicaid certification, the facility would beunable to receive reimbursement from federal health care programs. If any facility were to lose accreditation, thefacility would be subject to state surveys, potentially be subject to increased scrutiny by CMS and likely losepayment from non-government payers. Management believes our facilities are in substantial compliance withcurrent applicable federal, state, local and independent review body regulations and standards.
18
The requirements for licensure, certification and accreditation are subject to change and, in order to remainqualified, it may become necessary for us to make changes in our facilities, equipment, personnel and services.The requirements for licensure, certification and accreditation also include notification or approval in the event ofthe transfer or change of ownership or certain other changes. Failure to provide required notifications or obtainnecessary approvals in these circumstances can result in the inability to complete an acquisition or change ofownership, loss of licensure, lapses in reimbursement or other penalties.
Certificates of Need
In some states where we operate hospitals and other health care facilities, the construction or expansion ofhealth care facilities, the acquisition of existing facilities, the transfer or change of ownership and the addition ofnew beds or services may be subject to review by and prior approval of, or notifications to, state regulatoryagencies under a CON program. Such laws generally require the reviewing state agency to determine the publicneed for additional or expanded health care facilities and services. Failure to provide required notifications orobtain necessary state approvals can result in the inability to expand facilities, complete an acquisition or changeownership or other penalties.
State Rate Review
Some states have adopted legislation mandating rate or budget review for hospitals or have adopted taxes onhospital revenues, assessments or licensure fees to fund indigent health care within the state. In the aggregate,indigent tax provisions have not materially, adversely affected our results of operations. Although we do notcurrently operate facilities in states that mandate rate or budget reviews, we cannot predict whether we willoperate in such states in the future, or whether the states in which we currently operate may adopt legislationmandating such reviews.
Federal Health Care Program Regulations
Participation in any federal health care program, including the Medicare and Medicaid programs, is heavilyregulated by statute and regulation. If a hospital fails to substantially comply with the numerous conditions ofparticipation in the Medicare and Medicaid programs or performs certain prohibited acts, the hospital’sparticipation in the federal health care programs may be terminated, or civil and/or criminal penalties may beimposed.
Anti-kickback Statute
A section of the Social Security Act known as the “Anti-kickback Statute” prohibits providers and othersfrom directly or indirectly soliciting, receiving, offering or paying any remuneration with the intent of generatingreferrals or orders for services or items covered by a federal health care program. Courts have interpreted thisstatute broadly and held that there is a violation of the Anti-kickback Statute if just one purpose of theremuneration is to generate referrals, even if there are other lawful purposes. Furthermore, the Health ReformLaw provides that knowledge of the law or the intent to violate the law is not required. Violations of the Anti-kickback Statute may be punished by a criminal fine of up to $25,000 for each violation or imprisonment, civilmoney penalties of up to $50,000 per violation and damages of up to three times the total amount of theremuneration and/or exclusion from participation in federal health care programs, including Medicare andMedicaid. The Health Reform Law provides that submission of a claim for services or items generated inviolation of the Anti-kickback Statute constitutes a false or fraudulent claim and may be subject to additionalpenalties under the federal False Claims Act (“FCA”).
The HHS Office of Inspector General (“OIG”), among other regulatory agencies, is responsible foridentifying and eliminating fraud, abuse and waste. The OIG carries out this mission through a nationwideprogram of audits, investigations and inspections. The OIG provides guidance to the industry through variousmethods including advisory opinions and “Special Fraud Alerts.” These Special Fraud Alerts do not have the
19
force of law, but identify features of arrangements or transactions that the government believes may cause thearrangements or transactions to violate the Anti-kickback Statute or other federal health care laws. The OIG hasidentified several incentive arrangements that constitute suspect practices, including: (a) payment of anyincentive by a hospital each time a physician refers a patient to the hospital, (b) the use of free or significantlydiscounted office space or equipment in facilities usually located close to the hospital, (c) provision of free orsignificantly discounted billing, nursing or other staff services, (d) free training for a physician’s office staff inareas such as management techniques and laboratory techniques, (e) guarantees which provide, if the physician’sincome fails to reach a predetermined level, the hospital will pay any portion of the remainder, (f) low-interest orinterest-free loans, or loans which may be forgiven if a physician refers patients to the hospital, (g) payment ofthe costs of a physician’s travel and expenses for conferences, (h) coverage on the hospital’s group healthinsurance plans at an inappropriately low cost to the physician, (i) payment for services (which may includeconsultations at the hospital) which require few, if any, substantive duties by the physician, (j) purchasing goodsor services from physicians at prices in excess of their fair market value, (k) rental of space in physician offices,at other than fair market value terms, by persons or entities to which physicians refer, and (l) physician-ownedentities (frequently referred to as physician-owned distributorships or PODs) that derive revenue from selling, orarranging for the sale of, implantable medical devices ordered by their physician-owners for use on proceduresthat physician-owners perform on their own patients at hospitals or ASCs. The OIG has encouraged personshaving information about hospitals who offer the above types of incentives to physicians to report suchinformation to the OIG.
The OIG also issues “Special Advisory Bulletins” as a means of providing guidance to health careproviders. These bulletins, along with the Special Fraud Alerts, have focused on certain arrangements that couldbe subject to heightened scrutiny by government enforcement authorities, including: (a) contractual joint venturearrangements and other joint venture arrangements between those in a position to refer business, such asphysicians, and those providing items or services for which Medicare or Medicaid pays, and (b) certain“gainsharing” arrangements, i.e., the practice of giving physicians a share of any reduction in a hospital’s costsfor patient care attributable in part to the physician’s efforts.
In addition to issuing Special Fraud Alerts and Special Advisory Bulletins, the OIG issues complianceprogram guidance for certain types of health care providers. The OIG guidance identifies a number of risk areasunder federal fraud and abuse statutes and regulations. These areas of risk include compensation arrangementswith physicians, recruitment arrangements with physicians and joint venture relationships with physicians.
As authorized by Congress, the OIG has published safe harbor regulations that outline categories ofactivities deemed protected from prosecution under the Anti-kickback Statute. Currently, there are statutoryexceptions and safe harbors for various activities, including the following: certain investment interests, spacerental, equipment rental, practitioner recruitment, personnel services and management contracts, sale of practice,referral services, warranties, discounts, employees, group purchasing organizations, waiver of beneficiarycoinsurance and deductible amounts, managed care arrangements, obstetrical malpractice insurance subsidies,investments in group practices, freestanding surgery centers, ambulance replenishing, and referral agreements forspecialty services.
The fact that conduct or a business arrangement does not fall within a safe harbor or is identified in aSpecial Fraud Alert, Special Advisory Bulletin or other guidance does not necessarily render the conduct orbusiness arrangement illegal under the Anti-kickback Statute. However, such conduct and business arrangementsmay lead to increased scrutiny by government enforcement authorities.
We have a variety of financial relationships with physicians and others who either refer or influence thereferral of patients to our hospitals, other health care facilities and employed physicians, including employmentcontracts, leases, medical director agreements and professional service agreements. We also have similarrelationships with physicians and facilities to which patients are referred from our facilities and other providers.In addition, we provide financial incentives, including minimum revenue guarantees, to recruit physicians into
20
the communities served by our hospitals. While we endeavor to comply with the applicable safe harbors, certainof our current arrangements, including joint ventures and financial relationships with physicians and otherreferral sources and persons and entities to which we refer patients, do not qualify for safe harbor protection.
Although we believe our arrangements with physicians and other referral sources and referral recipientshave been structured to comply with current law and available interpretations, there can be no assuranceregulatory authorities enforcing these laws will determine these financial arrangements comply with the Anti-kickback Statute or other applicable laws. An adverse determination could subject us to liabilities under theSocial Security Act and other laws, including criminal penalties, civil monetary penalties and exclusion fromparticipation in Medicare, Medicaid or other federal health care programs.
Stark Law
The Social Security Act also includes a provision commonly known as the “Stark Law.” The Stark Lawprohibits physicians from referring Medicare and Medicaid patients to entities with which they or any of theirimmediate family members have a financial relationship, if these entities provide certain “designated healthservices” reimbursable by Medicare or Medicaid unless an exception applies. The Stark Law also prohibitsentities that provide designated health services reimbursable by Medicare and Medicaid from billing theMedicare and Medicaid programs for any items or services that result from a prohibited referral and requires theentities to refund amounts received for items or services provided pursuant to the prohibited referral on a timelybasis. “Designated health services” include inpatient and outpatient hospital services, clinical laboratory servicesand radiology services. Sanctions for violating the Stark Law include denial of payment, civil monetary penaltiesof up to $15,000 per claim submitted and exclusion from the federal health care programs. Failure to refundamounts received as a result of a prohibited referral on a timely basis may constitute a false or fraudulent claimand may result in civil penalties and additional penalties under the FCA. The statute also provides for a penaltyof up to $100,000 for a circumvention scheme. There are exceptions to the self-referral prohibition for many ofthe customary financial arrangements between physicians and providers, including employment contracts, leasesand recruitment agreements. Unlike safe harbors under the Anti-kickback Statute with which compliance isvoluntary, a financial relationship must comply with every requirement of a Stark Law exception or thearrangement is in violation of the Stark Law. Although there is an exception for a physician’s ownership interestin an entire hospital, the Health Reform Law prohibits physician-owned hospitals established after December 31,2010 from billing for Medicare or Medicaid patients referred by their physician owners. As a result, the laweffectively prevents the formation of new physician-owned hospitals that participate in Medicare or Medicaid.While the Health Reform Law grandfathers existing physician-owned hospitals, it does not allow these hospitalsto increase the percentage of physician ownership and significantly restricts their ability to expand services.
Through a series of rulemakings, CMS has issued final regulations implementing the Stark Law. Whilethese regulations were intended to clarify the requirements of the exceptions to the Stark Law, it is unclear howthe government will interpret many of these exceptions for enforcement purposes. Further, we do not alwayshave the benefit of significant regulatory or judicial interpretation of the Stark Law and its implementingregulations. We attempt to structure our relationships to meet an exception to the Stark Law, but the regulationsimplementing the exceptions are detailed and complex, and we cannot assure that every relationship compliesfully with the Stark Law.
Similar State Laws
Many states in which we operate also have laws similar to the Anti-kickback Statute that prohibit paymentsto physicians for patient referrals and laws similar to the Stark Law that prohibit certain self-referrals. The scopeof these state laws is broad because they can often apply regardless of the source of payment for care, and littleprecedent exists for their interpretation or enforcement. These statutes typically provide for criminal and civilpenalties, as well as loss of facility licensure.
21
Other Fraud and Abuse Provisions
The Health Insurance Portability and Accountability Act of 1996 (“HIPAA”) broadened the scope of certainfraud and abuse laws by adding several criminal provisions for health care fraud offenses that apply to all healthbenefit programs. The Social Security Act also imposes criminal and civil penalties for making false claims andstatements to Medicare and Medicaid. False claims include, but are not limited to, billing for services notrendered or for misrepresenting actual services rendered in order to obtain higher reimbursement, billing forunnecessary goods and services and cost report fraud. Federal enforcement officials have the ability to excludefrom Medicare and Medicaid any investors, officers and managing employees associated with business entitiesthat have committed health care fraud, even if the officer or managing employee had no knowledge of the fraud.Criminal and civil penalties may be imposed for a number of other prohibited activities, including failure toreturn known overpayments, certain gainsharing arrangements, billing Medicare amounts that are substantially inexcess of a provider’s usual charges, offering remuneration to influence a Medicare or Medicaid beneficiary’sselection of a health care provider, contracting with an individual or entity known to be excluded from a federalhealth care program, making or accepting a payment to induce a physician to reduce or limit services, andsoliciting or receiving any remuneration in return for referring an individual for an item or service payable by afederal health care program. Like the Anti-kickback Statute, these provisions are very broad. Under the HealthReform Law, civil penalties may be imposed for the failure to report and return an overpayment within 60 daysof identifying the overpayment or by the date a corresponding cost report is due, whichever is later. To avoidliability, providers must, among other things, carefully and accurately code claims for reimbursement, promptlyreturn overpayments and accurately prepare cost reports.
Some of these provisions, including the federal Civil Monetary Penalty Law, require a lower burden ofproof than other fraud and abuse laws, including the Anti-kickback Statute. Civil monetary penalties that may beimposed under the federal Civil Monetary Penalty Law range from $10,000 to $50,000 per act, and in some casesmay result in penalties of up to three times the remuneration offered, paid, solicited or received. In addition, aviolator may be subject to exclusion from federal and state health care programs. Federal and state governmentsincreasingly use the federal Civil Monetary Penalty Law, especially where they believe they cannot meet thehigher burden of proof requirements under the Anti-kickback Statute. Further, individuals can receive up to$1,000 for providing information on Medicare fraud and abuse that leads to the recovery of at least $100 ofMedicare funds under the Medicare Integrity Program.
The Federal False Claims Act and Similar State Laws
The qui tam, or whistleblower, provisions of the FCA allow private individuals to bring actions on behalf ofthe government alleging that the defendant has defrauded the federal government. Further, the government mayuse the FCA to prosecute Medicare and other government program fraud in areas such as coding errors, billingfor services not provided and submitting false cost reports. The Health Reform Law expanded the scope of theFCA to cover payments in connection with the Exchanges created under the Health Reform Law, if thosepayments include any federal funds. When a private party brings a qui tam action under the FCA, the defendantis not made aware of the lawsuit until the government commences its own investigation or makes a determinationwhether it will intervene. If a defendant is determined by a court of law to be liable under the FCA, the defendantmay be required to pay three times the actual damages sustained by the government, plus mandatory civilpenalties of between $5,500 and $11,000 for each separate false claim. There are many potential bases forliability under the FCA, including knowingly and improperly avoiding repayment of an overpayment receivedfrom the government and the knowing failure to report and return an overpayment in a timely manner. Liabilityoften arises when an entity knowingly submits a false claim for reimbursement to the federal government. TheFCA defines the term “knowingly” broadly. Though simple negligence will not give rise to liability under theFCA, submitting a claim with reckless disregard to its truth or falsity constitutes a “knowing” submission underthe FCA and, therefore, may create liability.
The Health Reform Law provides that submission of claims for services or items generated in violation ofthe Anti-kickback Statute constitutes a false or fraudulent claim under the FCA. In some cases, whistleblowers
22
and the federal government have taken the position, and some courts have held, that providers who allegedlyhave violated other statutes, such as the Stark Law, have thereby submitted false claims under the FCA. Everyentity that receives at least $5 million annually in Medicaid payments must have written policies for allemployees, contractors or agents, providing detailed information about false claims, false statements andwhistleblower protections under certain federal laws, including the FCA, and similar state laws. In addition,federal law provides an incentive to states to enact false claims laws comparable to the FCA. A number of statesin which we operate have adopted their own false claims provisions as well as their own whistleblowerprovisions under which a private party may file a civil lawsuit in state court. We have adopted and distributedpolicies pertaining to the FCA and relevant state laws.
HIPAA Administrative Simplification and Privacy and Security Requirements
The Administrative Simplification Provisions of HIPAA and implementing regulations require the use ofuniform electronic data transmission standards for certain health care claims and payment transactions submittedor received electronically. These provisions are intended to encourage electronic commerce in the health careindustry. As required by the Health Reform Law, HHS is in the process of adopting standards for additionalelectronic transactions and establishing operating rules to promote uniformity in the implementation of eachstandardized electronic transaction. In addition, HIPAA requires that each provider use a National ProviderIdentifier. CMS has also published a final rule requiring the use of updated standard code sets for certaindiagnoses and procedures known as ICD-10 code sets. Implementing the ICD-10 code sets will requiresignificant administrative changes. Use of the ICD-10 code sets is required beginning October 1, 2014.
The privacy and security regulations promulgated pursuant to HIPAA extensively regulate the use anddisclosure of individually identifiable health information, known as “protected health information,” and requirecovered entities, including health plans and most health care providers, to implement administrative, physical andtechnical safeguards to protect the security of such information. ARRA broadened the scope of the HIPAAprivacy and security regulations. In addition, ARRA extends the application of certain provisions of the securityand privacy regulations to business associates (entities that handle protected health information on behalf ofcovered entities) and subjects business associates to civil and criminal penalties for violation of the regulations.HHS has implemented many of these ARRA provisions through a final rule that became effective March 26,2013. The final rule subjects business associates and their subcontractors to direct liability under the HIPAAprivacy and security regulations and revises the requirements for agreements with business associates. Inaddition, a covered entity may be subject to penalties as a result of a business associate violating HIPAA, if thebusiness associate is found to be an agent of the covered entity. Compliance with the final rule was requiredbeginning September 23, 2013, except that existing business associate agreements may qualify for an extendedcompliance date of September 23, 2014.
Covered entities must report breaches of unsecured protected health information to affected individualswithout unreasonable delay but not to exceed 60 days of discovery of the breach by a covered entity or its agents.Notification must also be made to HHS and, in certain situations involving large breaches, to the media. HHS isrequired to publish on its website a list of all covered entities that report a breach involving more than 500individuals. In its 2013 final rule, HHS modified this breach notification requirement by creating a presumptionthat all non-permitted uses or disclosures of unsecured protected health information are breaches unless thecovered entity or business associate establishes that there is a low probability the information has beencompromised. Various state laws and regulations may also require us to notify affected individuals in the eventof a data breach involving individually identifiable information.
Violations of the HIPAA privacy and security regulations may result in civil and criminal penalties, andARRA has strengthened the enforcement provisions of HIPAA, including requiring HHS to perform complianceaudits, which may result in increased enforcement activity. For example, ARRA broadens the applicability of thecriminal penalty provisions to employees of covered entities and requires HHS to impose penalties for violationsresulting from willful neglect. In addition, ARRA authorizes state attorneys general to bring civil actions seeking
23
either injunction or damages in response to violations of HIPAA privacy and security regulations that threatenthe privacy of state residents. ARRA also significantly increases the amount of the civil penalties, with penaltiesof up to $50,000 per violation for a maximum civil penalty of $1,500,000 in a calendar year for violations of thesame requirement. The 2013 final rule implemented many of the ARRA enforcement requirements. In the rule,HHS removed the requirement that HHS attempt to resolve HIPAA violations through informal means, such asallowing a covered entity to implement a corrective action plan, prior to imposing penalties. Instead, HHS has thediscretion to resolve violations by moving directly to impose monetary penalties. We enforce a HIPAAcompliance plan, which we believe complies with the HIPAA privacy and security regulations and under which aHIPAA compliance group monitors our compliance. The HIPAA privacy regulations and security regulationshave and will continue to impose significant costs on our facilities in order to comply with these standards.
There are numerous other laws and legislative and regulatory initiatives at the federal and state levelsaddressing privacy and security concerns. Our facilities remain subject to any federal or state privacy-relatedlaws that are more restrictive than the privacy regulations issued under HIPAA. These laws vary and couldimpose additional penalties. For example, the Federal Trade Commission uses its consumer protection authorityto initiate enforcement actions in response to data breaches.
EMTALA
All of our hospitals in the United States are subject to EMTALA. This federal law requires any hospitalparticipating in the Medicare program to conduct an appropriate medical screening examination of everyindividual who presents to the hospital’s emergency room for treatment and, if the individual is suffering from anemergency medical condition, to either stabilize the condition or make an appropriate transfer of the individual toa facility able to handle the condition. The obligation to screen and stabilize emergency medical conditions existsregardless of an individual’s ability to pay for treatment. There are severe penalties under EMTALA if a hospitalfails to screen or appropriately stabilize or transfer an individual or if the hospital delays appropriate treatment inorder to first inquire about the individual’s ability to pay. Penalties for violations of EMTALA include civilmonetary penalties and exclusion from participation in the Medicare program. In addition, an injured individual,the individual’s family or a medical facility that suffers a financial loss as a direct result of a hospital’s violationof the law can bring a civil suit against the hospital.
The government broadly interprets EMTALA to cover situations in which individuals do not actuallypresent to a hospital’s emergency room, but present for emergency examination or treatment to the hospital’scampus, generally, or to a hospital-based clinic that treats emergency medical conditions or are transported in ahospital-owned ambulance, subject to certain exceptions. At least one court has interpreted the law also to applyto a hospital that has been notified of a patient’s pending arrival in a non-hospital owned ambulance. EMTALAdoes not generally apply to individuals admitted for inpatient services. The government has expressed its intentto investigate and enforce EMTALA violations actively in the future. We believe our hospitals operate insubstantial compliance with EMTALA.
Corporate Practice of Medicine/Fee Splitting
Some of the states in which we operate have laws prohibiting corporations and other entities fromemploying physicians, practicing medicine for a profit and making certain direct and indirect payments or fee-splitting arrangements between health care providers designed to induce or encourage the referral of patients to,or the recommendation of, particular providers for medical products and services. Possible sanctions for violationof these restrictions include loss of license and civil and criminal penalties. In addition, agreements between thecorporation and the physician may be considered void and unenforceable. These statutes vary from state to state,are often vague and have seldom been interpreted by the courts or regulatory agencies.
Health Care Industry Investigations
Significant media and public attention has focused in recent years on the hospital industry. This media andpublic attention, changes in government personnel and other factors have led to increased scrutiny of the healthcare industry. Except as may be disclosed in our SEC filings, we are not aware of any material investigations of
24
the Company under federal or state health care laws or regulations. It is possible that governmental entities couldinitiate investigations or litigation in the future at facilities we operate and that such matters could result insignificant penalties, as well as adverse publicity. It is also possible that our executives and managers could beincluded in governmental investigations or litigation or named as defendants in private litigation.
Our substantial Medicare, Medicaid and other governmental billings result in heightened scrutiny of ouroperations. We continue to monitor all aspects of our business and have developed a comprehensive ethics andcompliance program that is designed to meet or exceed applicable federal guidelines and industry standards.Because the law in this area is complex and constantly evolving, governmental investigations or litigation mayresult in interpretations that are inconsistent with our or industry practices.
In public statements surrounding current investigations, governmental authorities have taken positions on anumber of issues, including some for which little official interpretation previously has been available, that appearto be inconsistent with practices that have been common within the industry and that previously have not beenchallenged in this manner. In some instances, government investigations that have in the past been conductedunder the civil provisions of federal law may now be conducted as criminal investigations.
Both federal and state government agencies have increased their focus on and coordination of civil andcriminal enforcement efforts in the health care area. The OIG and the Department of Justice (“DOJ”) have, fromtime to time, established national enforcement initiatives, targeting all hospital providers that focus on specificbilling practices or other suspected areas of abuse. The Health Reform Law includes additional federal funding of$350 million over 10 years to fight health care fraud, waste and abuse, including $40 million in federal fiscalyear 2014. In addition, governmental agencies and their agents, such as MACs, fiscal intermediaries and carriers,may conduct audits of our health care operations. Private payers may conduct similar post-payment audits, andwe also perform internal audits and monitoring.
In addition to national enforcement initiatives, federal and state investigations have addressed a wide varietyof routine health care operations such as: cost reporting and billing practices, including for Medicare outliers;financial arrangements with referral sources; physician recruitment activities; physician joint ventures; andhospital charges and collection practices for self-pay patients. We engage in many of these routine health careoperations and other activities that could be the subject of governmental investigations or inquiries. For example,we have significant Medicare and Medicaid billings, numerous financial arrangements with physicians who arereferral sources to our hospitals, and joint venture arrangements involving physician investors. Certain of ourindividual facilities have received, and other facilities may receive, government inquiries from, and may besubject to investigation by, federal and state agencies. Any additional investigations of the Company, ourexecutives or managers could result in significant liabilities or penalties to us, as well as adverse publicity.
Health Care Reform
The Health Reform Law changes how health care services are covered, delivered and reimbursed throughexpanded coverage of uninsured individuals, reduced growth in Medicare program spending, reductions inMedicare and Medicaid DSH payments, and the establishment of programs that tie reimbursement to quality andintegration. In addition, the law reforms certain aspects of health insurance, expands existing efforts to tieMedicare and Medicaid payments to performance and quality, and contains provisions intended to strengthenfraud and abuse enforcement. Most of the provisions of the Health Reform Law that seek to decrease the numberof uninsured became effective January 1, 2014.
Expanded Coverage
Based on the CBO’s February 2014 projection, by 2022, the Health Reform Law will expand coverage to25 million additional individuals. This increased coverage will occur through a combination of public programexpansion and private sector health insurance and other reforms.
25
Medicaid Expansion
The primary public program coverage expansion is occurring through changes in Medicaid, and to a lesserextent, expansion of the Children’s Health Insurance Program (“CHIP”). The most significant changes expandthe categories of individuals eligible for Medicaid coverage and permit individuals with relatively higherincomes to qualify. Although the Health Reform Law requires, as of January 1, 2014, all state Medicaidprograms to provide, and the federal government to subsidize, Medicaid coverage to virtually all adults under65 years old with incomes at or under 133% of the federal poverty level (“FPL”), states may opt out of theexpansion without losing existing federal Medicaid funding. For states that expand Medicaid coverage, theHealth Reform Law also requires those states to apply a “5% income disregard” to the Medicaid eligibilitystandard, so that Medicaid eligibility will effectively be extended to those with incomes up to 138% of the FPL.States that choose not to implement the Medicaid expansion will forego funding established by the HealthReform Law to cover most of the expansion costs. A number of states, including Texas and Florida, have chosennot to participate in the expanded Medicaid program, but these states could choose to implement the expansion ata later date. For states that do not participate, the maximum income level required for individuals and families toqualify for Medicaid varies widely from state to state. According to the CBO’s February 2014 projection, thenew eligibility requirements will expand Medicaid and CHIP coverage by an estimated 13 million personsnationwide by 2022.
As Medicaid is a joint federal and state program, the federal government provides states with “matchingfunds” in a defined percentage, known as the federal medical assistance percentage (“FMAP”). Beginning in2014, states will receive an enhanced FMAP for the individuals enrolled in Medicaid pursuant to the HealthReform Law. The FMAP percentage is as follows: 100% for calendar years 2014 through 2016; 95% for 2017;94% in 2018; 93% in 2019; and 90% in 2020 and thereafter. CMS has indicated that states that only partiallyexpand their Medicaid programs will not receive an enhanced FMAP.
The Health Reform Law also provides that the federal government will subsidize states that create non-Medicaid plans for residents whose incomes are greater than 133% of the FPL but do not exceed 200% of theFPL. Approved state plans will be eligible to receive federal funding. The amount of that funding per individualwill be equal to 95% of subsidies that would have been provided for that individual had he or she enrolled in ahealth plan offered through one of the Exchanges, as discussed below.
Historically, states often have attempted to reduce Medicaid spending by limiting benefits and tighteningMedicaid eligibility requirements. However, the Health Reform Law requires states to at least maintain Medicaideligibility standards established prior to the enactment of the law for children until October 1, 2019.
Private Sector Expansion
The expansion of health coverage through the private sector as a result of the Health Reform Law occursthrough new requirements applicable to health insurers, employers and individuals. Health insurers must keeptheir annual nonmedical costs lower than 15% of premium revenue for the group market and lower than 20% inthe small group and individual markets or rebate to enrollees the amount spent in excess of the percentage. Inaddition, health insurers are not permitted to deny coverage to children based upon a pre-existing condition andmust allow dependent care coverage for children up to 26 years old. As of January 1, 2014, health insurers areprohibited from imposing annual coverage limits, dropping coverage, excluding persons based upon pre-existingconditions or denying coverage for any individual who is willing to pay the premiums for such coverage.
Larger employers will be subject to new requirements and incentives to provide health insurance benefits totheir full time employees. Employers with 50 or more employees that do not offer health insurance will be heldsubject to a penalty if an employee obtains government-subsidized coverage through an Exchange. The employerpenalties will range from $2,000 to $3,000 per employee, subject to certain thresholds and conditions. Thisrequirement was originally effective January 1, 2014, but has been delayed until January 1, 2015. For employerswith 50 to 99 employees, this requirement has been further delayed until January 1, 2016.
26
The Health Reform Law uses various means to induce individuals who do not have health insurance toobtain coverage. Effective January 1, 2014, individuals are required to maintain health insurance for a minimumdefined set of benefits or pay a tax penalty. The penalty in most cases is the greater of $95 or 1% of income in2014, $325 or 2% of income in 2015, $695 or 2.5% of income in 2016, and indexed to a cost of living adjustmentin subsequent years. The Internal Revenue Service (“IRS”), in consultation with HHS, is responsible forenforcing the tax penalty, although the Health Reform Law limits the availability of certain IRS enforcementmechanisms. In addition, for individuals and families below 400% of the FPL, the cost of obtaining healthinsurance through the Exchanges will be subsidized by the federal government. Those with lower incomes willbe eligible to receive greater subsidies. It is anticipated that those at the lowest income levels will have themajority of their premiums subsidized by the federal government, in some cases in excess of 95% of thepremium amount.
To facilitate the purchase of health insurance by individuals and small employers, the Health Reform Lawmandated that each state establish or participate in an Exchange or default to a federally-operated Exchange byJanuary 1, 2014. Based on CBO estimates issued in May 2013, approximately 24 million individuals will obtaintheir health insurance coverage through an Exchange by 2022. This amount will include individuals who werepreviously uninsured and individuals who have switched from their prior insurance coverage to a plan obtainedthrough an Exchange. The Health Reform Law requires that the Exchanges be designed to make the process ofevaluating, comparing and acquiring coverage simple for consumers. For example, each state’s Exchange mustmaintain an internet website through which consumers may access health plan ratings that are assigned by thestate based on quality and price, view governmental health program eligibility requirements and calculate theactual cost of health coverage. Health insurers participating in an Exchange must offer a set of minimumbenefits, as defined by HHS, and may offer more benefits. Health insurers must offer at least two, and up to five,levels of plans that vary by the percentage of medical expenses that must be paid by the enrollee. These levels arereferred to as platinum, gold, silver, bronze and catastrophic plans, with gold and silver being the two mandatorylevels of plans. Each level of plan must require the enrollee to share the following percentages of medicalexpenses up to the deductible/copayment limit: platinum, 10%; gold, 20%; silver, 30%; bronze, 40%; andcatastrophic, 100%. Health insurers may establish varying deductible/copayment levels, up to the statutorymaximum ($6,250 for 2013 and $6,350 in 2014 for an individual, subject to increases in future years). The healthinsurers must cover 100% of the amount of medical expenses in excess of the deductible/copayment limit. Forexample, an individual making 100% to 200% of the FPL will have copayments and deductibles reduced to aboutone-third of the amount payable by those with the same plan with incomes at or above 400% of the FPL.
Public Program Spending
The Health Reform Law provides for Medicare, Medicaid and other federal health care program spendingreductions between 2010 and 2019. In March 2010, CMS estimated Medicare fee-for-service reductions from2010 to 2019 would be $233 billion and the Medicare and Medicaid DSH reductions would be an additional $64billion. In July 2012, the CBO estimated that from 2013 to 2022, the Health Reform Law reductions wouldinclude $415 billion in Medicare fee-for-service market basket and productivity reimbursement reductions, themajority of which will come from hospitals. The CBO estimate included an additional $56 billion in reductionsin Medicare and Medicaid DSH funding.
Payments for Hospitals and Ambulatory Surgery Centers
Inpatient Market Basket and Productivity Adjustment. Under the Medicare program, hospitals receivereimbursement under a PPS for general, acute care hospital inpatient services. CMS establishes fixed PPSpayment amounts per inpatient discharge based on the patient’s assigned MS-DRG. These MS-DRG rates areupdated each federal fiscal year, which begins October 1, using a market basket index that takes into accountinflation experienced by hospitals and other entities outside the health care industry in purchasing goods andservices.
27
The Health Reform Law provides for three types of annual reductions in the market basket. The first is ageneral reduction of a specified percentage each federal fiscal year that began in 2010 and extends through 2019.The remaining reductions are as follows: 2014 (0.3%); 2015 (0.2%); 2016 (0.2%); 2017 (0.75%); 2018 (0.75%);and 2019 (0.75%).
The second type of reduction to the market basket is a “productivity adjustment” that was implemented byHHS beginning in federal fiscal year 2012. The amount of that reduction is the projected nationwide productivitygains over the preceding 10 years. To determine the projection, HHS uses the BLS 10-year moving average ofchanges in specified economy-wide productivity. For federal fiscal year 2014, CMS has announced a negative0.5% productivity adjustment to the market basket. In 2010, CMS estimated that the combined market basket andproductivity adjustments would reduce Medicare payments under the inpatient PPS by $112.6 billion from 2010to 2019.
The third type of reduction is in connection with the value-based purchasing program discussed in moredetail below. For each federal fiscal year, CMS will reduce the inpatient PPS payment amount for all dischargesby the following: 1.25% for 2014; 1.5% for 2015; 1.75% for 2016; and 2% for 2017 and subsequent years. Foreach federal fiscal year, the total amount collected from these reductions will be pooled and used to fundpayments to hospitals that satisfy certain quality metrics. While some or all of these reductions may be recoveredif a hospital satisfies these quality metrics, the recovery amounts may be delayed.
If the aggregate of the three market basket reductions described above is more than the annual market basketadjustments made to account for inflation, there will be a reduction in the MS-DRG rates paid to hospitals.
Quality-Based Payment Adjustments and Reductions for Inpatient Services. The Health Reform Lawestablishes or expands three provisions to promote value-based purchasing and to link payments to quality andefficiency. First, in federal fiscal year 2013, HHS was directed to implement a value-based purchasing programfor inpatient hospital services. This program rewards hospitals that meet certain quality performance standardsestablished by HHS. The Health Reform Law provides HHS considerable discretion over the value-basedpurchasing program. Under the value-based purchasing program for hospital inpatient services, CMS willdistribute an estimated $1.1 billion in federal fiscal year 2014 to hospitals based on their overall performance ona set of quality measures that have been linked to improved clinical processes of care and patient satisfaction.Hospitals are scored based on a weighted average of patient experience scores using the Hospital ConsumerAssessment of Healthcare Providers and Systems survey and certain clinical measures. In federal fiscal year2014, there are 17 measures by which hospitals will be scored. CMS scores each hospital based on achievement(relative to other hospitals) and improvement ranges (relative to the hospital’s own past performance) for eachapplicable measure. Because the Health Reform Law provides that the pool will be fully distributed, hospitalsthat meet or exceed the quality performance standards set by HHS will receive greater reimbursement under thevalue-based purchasing program than they would have otherwise. Hospitals that do not achieve the necessaryquality performance will receive reduced Medicare inpatient hospital payments. CMS published the value-basedincentive payment adjustment factor for each hospital for federal fiscal year 2014 discharges on November 14,2013.
Second, beginning in federal fiscal year 2013 and continuing in each federal fiscal year, inpatient paymentsare reduced if a hospital experiences “excess readmissions” within the 30-day period from the date of dischargefor heart attack, heart failure, pneumonia or other conditions that may be designated by CMS. Hospitals withwhat CMS defines as “excess readmissions” for these conditions will receive reduced payments for all inpatientdischarges, not just discharges relating to the conditions subject to the excess readmission standard. The amountby which payments will be reduced if a hospital experiences excess readmissions is determined by comparison ofthe hospital’s readmission performance to a risk-adjusted national average and is subject to a cap established byCMS. Each hospital’s performance is publicly reported by CMS.
Third, reimbursement will be reduced based on a facility’s HAC rates. A HAC is a condition that is acquiredby a patient while admitted as an inpatient in a hospital, such as a surgical site infection. Beginning in federal
28
fiscal year 2015, the 25% of hospitals with the worst national risk-adjusted HAC rates in the previous year willreceive a 1% reduction in their total inpatient operating Medicare payments. In addition, the Health Reform Lawprohibits the use of federal funds under the Medicaid program to reimburse providers for medical servicesprovided to treat HACs. CMS implemented this prohibition for services with dates beginning July 1, 2012. Statesmay add additional provider-preventable conditions to the list of HACs for which Medicaid reimbursement willnot be allowed.
Outpatient Market Basket and Productivity Adjustment. Hospital outpatient services paid under PPS areclassified into APCs. The APC payment rates are updated each calendar year based on the market basket. Thefirst two market basket changes outlined above — the general reduction and the productivity adjustment — applyto outpatient services as well as inpatient services, although these are applied on a calendar year basis. Thepercentage changes specified in the Health Reform Law summarized above as the general reduction forinpatients — e.g., 0.2% in 2015 — are the same for outpatients.
Medicare and Medicaid DSH Payments. The Medicare DSH program provides for additional payments tohospitals that treat a disproportionate share of low-income patients. Under the Health Reform Law, beginning infederal fiscal year 2014, Medicare DSH payments are reduced to 25% of the amount they otherwise would havebeen absent the law. The remaining 75% of the amount that would otherwise be paid under Medicare DSH iseffectively pooled, and this pool will be reduced further each year by a formula that reflects reductions in thenational level of uninsured who are under 65 years of age. In other words, the greater the level of coverage forthe uninsured nationally, the more the Medicare DSH payment pool will be reduced. Each hospital is then paid,out of the reduced DSH payment pool, an amount allocated based upon its level of uncompensated care, whichwas not the basis for DSH payments prior to implementation of the Health Reform Law. In 2013, CMS issuedfinal rules to implement these reductions.
Hospitals that provide care to a disproportionately high number of low-income patients may receiveMedicaid DSH payments. The federal government distributes federal Medicaid DSH funds to each state based ona statutory formula. The states then distribute the DSH funding among qualifying hospitals. Although federalMedicaid law defines some level of hospitals that must receive Medicaid DSH funding, states have broaddiscretion to define additional hospitals that also may qualify for Medicaid DSH payments and the amount ofsuch payments. The Health Reform Law, as modified by the Bipartisan Budget Act of 2013, provides forreductions to the Medicaid DSH hospital program in federal fiscal years 2016 through 2020 by the followingamounts: 2016 ($1.2 billion); 2017 ($1.8 billion); 2018 ($5 billion); 2019 ($5.6 billion); and 2020 ($4 billion).The Jobs Creation Act and the American Taxpayer Relief Act of 2012 and the Bipartisan Budget Act of 2013provide for additional Medicaid DSH reductions in federal fiscal years 2021, 2022 and 2023 estimated at $4.1billion, $4.2 billion and $4.3 billion, respectively. CMS has issued a final rule establishing the methodology forallocating the cuts among the states based on the volume of Medicaid inpatients and levels of uncompensatedcare in each state. States largely retain the ability to manage the reduced allotments and to allocate these cutsamong providers within the state.
ACOs. Pursuant to the Health Reform Law, HHS established the MSSP, which seeks to promoteaccountability and coordination of care through the creation of ACOs. The MSSP allows certain providers andsuppliers (including hospitals, physicians and other designated professionals) to voluntarily form ACOs and worktogether along with other ACO participants to invest in infrastructure and redesign delivery processes to achievehigh quality and efficient delivery of services. The program is intended to produce savings as a result ofimproved quality and operational efficiency. ACOs that achieve quality performance standards established byHHS will be eligible to share in a portion of the amounts saved by the Medicare program. Participants maychoose between two different ACO tracks, the first of which allows ACOs to share only in the savings under theMSSP. The second track requires ACOs to share in any savings and losses under the MSSP but offers ACOs agreater share of any savings realized under the MSSP. As authorized by the Health Reform Law, certain waiversare available from fraud and abuse laws for ACOs. CMS has approved over 300 ACOs to participate in theMSSP.
29
Bundled Payment Pilot Programs. The Health Reform Law created the Center for Medicare & MedicaidInnovation with responsibility for establishing demonstration projects and other initiatives in order to identify,develop, test and encourage the adoption of new methods of delivering and paying for health care that createsavings under the Medicare and Medicaid programs while improving quality of care. One initiative announced bythe Center for Medicare & Medicaid Innovation is a voluntary bundled payment initiative involving over 400participants that will link payments to participating providers for services provided during an episode of care. Inaddition, as required by the Health Reform Law, HHS established a five-year, voluntary, national pilot programon payment bundling for Medicare services. Under the program, organizations may enter into paymentarrangements that include financial and performance accountability for episodes of care, and these models areintended to lead to higher quality, more coordinated care at a lower cost to the Medicare program. Participatingproviders agree to receive one payment for services provided to Medicare patients for certain medical conditionsor episodes of care. HHS has discretion to determine how the program will function, including what medicalconditions will be included in the program and the amount of the payment for each condition. The Health ReformLaw also provides for a five-year bundled payment pilot program for Medicaid services, but CMS has not yetimplemented this program. HHS may select up to eight states to participate based on the potential to lower costsunder the Medicaid program while improving care. State programs may target particular categories ofbeneficiaries, selected diagnoses or geographic regions of the state. The selected state programs will provide onepayment for both hospital and physician services provided to Medicaid patients for certain episodes of inpatientcare. For both pilot programs, HHS will determine the relationship between the programs and restrictions incertain existing laws, including the Civil Monetary Penalty Law, the Anti-kickback Statute, the Stark Law andthe HIPAA privacy, security and transaction standard requirements. However, the Health Reform Law does notauthorize HHS to waive other laws that may impact the ability of hospitals and other eligible participants toparticipate in the pilot programs, such as antitrust laws.
Ambulatory Surgery Centers. The Health Reform Law reduces reimbursement for ASCs through aproductivity adjustment to the market basket similar to the productivity adjustment for inpatient and outpatienthospital services. In addition, CMS has established a quality reporting program for ASCs under which ASCs thatfail to report on required quality measures will receive a 2% reduction in reimbursement beginning with thecalendar year 2014 payment determination.
Medicare Managed Care (Medicare Advantage or “MA”). Under the MA program, the federal governmentcontracts with private health plans to provide inpatient and outpatient benefits to beneficiaries who enroll in suchplans. In 2013, approximately 14.4 million Medicare beneficiaries elected to enroll in MA plans. Effective in2014, the Health Reform Law requires MA plans to keep annual administrative costs lower than 15% of annualpremium revenue. The Health Reform Law reduces, over a three year period starting in 2012, premium paymentsto the MA plans such that CMS’ managed care per capita premium payments are, on average, equal to traditionalMedicare. In addition, the Health Reform Law implements fee payment adjustments based on servicebenchmarks and quality ratings. As a result of these changes, payments to MA plans are estimated to be reducedby $138 to $145 billion between 2010 and 2019. These reductions to MA plan premium payments paid by thefederal government may cause some plans to raise beneficiary premiums or limit benefits, which in turn mightcause some Medicare beneficiaries to terminate their MA coverage and enroll in traditional Medicare.
Physician-Owned Hospital Limitations
Over the last decade, we have faced competition from hospitals that have physician ownership. The HealthReform Law prohibits newly created physician-owned hospitals from billing for Medicare patients referred bytheir physician owners. As a result, the law effectively prevents the formation of new physician-owned hospitalsthat participate in Medicare and Medicaid after December 31, 2010. While the law grandfathers existingphysician-owned hospitals, it does not allow these hospitals to increase the percentage of physician ownershipand significantly restricts their ability to expand services.
30
Program Integrity and Fraud and Abuse
The Health Reform Law makes several significant changes to health care fraud and abuse laws, providesadditional enforcement tools to the government, increases cooperation between agencies by establishingmechanisms for the sharing of information and enhances criminal and administrative penalties for non-compliance. For example, the Health Reform Law: (1) provides $350 million in increased federal funding over10 years to fight health care fraud, waste and abuse; (2) expands the scope of the RAC program to include MAplans and Medicaid; (3) authorizes HHS, in consultation with the OIG, to suspend Medicare and Medicaidpayments to a provider of services or a supplier “pending an investigation of a credible allegation of fraud;”(4) provides Medicare contractors with additional flexibility to conduct random prepayment reviews; and(5) tightens up the rules for returning overpayments made by governmental health programs and expands FCAliability to include failure to timely repay identified overpayments.
Impact of Health Reform Law on the Company
The expansion of health insurance coverage under the Health Reform Law may result in an increase in thenumber of patients using our facilities who have either private or public program coverage. In addition, theHealth Reform Law provides for initiatives that create possible sources of additional revenue, such as ACOs.However, any positive effects of the Health Reform Law could be offset, and the Company could be significantlyimpacted, by reductions to the Medicare and Medicaid programs. Substantial uncertainty remains regarding thenet effect of the Health Reform Law on the Company because the resolution of a number of material factorsremains unclear, including the following:
• how many states will ultimately implement the Medicaid expansion provisions and under what terms;
• the potential for and impact of further delays in or complications related to implementation of theHealth Reform Law (for example, there were significant problems during the initial implementation ofthe Exchanges that negatively impacted the ability of individuals to enroll in Medicaid and to purchasehealth insurance);
• the possibility of enactment of additional federal or state health care reforms and possible changes tothe Health Reform Law;
• our ability to participate in health insurance plans offered through the Exchanges and the terms of ourparticipation as well as treatment of out of network claims;
• how many previously uninsured individuals will obtain coverage as a result of the Health Reform Law(based on the CBO’s February 2014 estimates, by 2022, the Health Reform Law will expand coverageto 25 million additional individuals);
• what percentage of the newly insured patients will be covered under the Medicaid program and whatpercentage will be covered by private health insurers;
• the extent to which states will enroll new Medicaid participants in managed care programs;
• the pace at which insurance coverage expands, including the pace of different types of coverageexpansion;
• the change, if any, in the volume of inpatient and outpatient hospital services that are sought by andprovided to previously uninsured individuals;
• the rate paid to hospitals by private payers for newly covered individuals and individuals with existingcoverage, including those covered through the Exchanges and those who might be covered under theMedicaid program;
• the rate paid by state governments under the Medicaid program for newly covered individuals;
• the effect of the value-based purchasing provisions of the Health Reform Law on our hospitals’revenues and the effects of other quality programs;
31
• the percentage of individuals in the Exchanges who select the high deductible plans, since healthinsurers offering those kinds of products have traditionally sought to pay lower rates to hospitals;
• the amount of overall revenues the Company will generate from Medicare and Medicaid business whenthe reductions are implemented (42% of our revenues in 2013 were from Medicare and Medicaid);
• the size of the Health Reform Law’s annual productivity adjustment to the market basket;
• the amount of the Medicare DSH reductions and the allocation of the Medicaid DSH reductions to ourhospitals;
• how successful ACOs will be at coordinating care and reducing costs or whether they will decreasereimbursement;
• the scope and nature of potential changes to Medicare reimbursement methods, such as an emphasis onbundling payments or coordination of care programs;
• whether the Company’s revenues from Medicaid supplemental programs developed through a federallyapproved waiver program (“Waiver Program”), will be adversely affected because there may bereductions in available state and local government funding for the programs; and
• the impact of efforts to repeal or revise the Health Reform Law and remaining or new federal lawsuitschallenging its constitutionality.
General Economic and Demographic Factors
The health care industry is impacted by the overall United States economy. Budget deficits at federal, stateand local government entities have had a negative impact on spending for many health and human serviceprograms, including Medicare, Medicaid and similar programs, which represent significant payer sources for ourhospitals. The federal deficit, the growing magnitude of Medicare expenditures and the aging of the United Statespopulation will continue to place pressure on federal health care programs. Other risks we face during periods ofeconomic weakness and high unemployment include potential declines in the population covered under managedcare agreements, increased patient decisions to postpone or cancel elective and nonemergency health careprocedures, increases in the uninsured and underinsured populations, increased adoption of health plan structuresthat shift financial responsibility to patients and further difficulties in our collecting patient receivables forcopayment and deductible amounts. The Health Reform Law seeks to decrease over time the number ofuninsured individuals, but it is difficult to predict the full impact of the Health Reform Law.
Compliance Program
We maintain a comprehensive ethics and compliance program that is designed to meet or exceed applicablefederal guidelines and industry standards. The program is intended to monitor and raise awareness of variousregulatory issues among employees and to emphasize the importance of complying with governmental laws andregulations. As part of the ethics and compliance program, we provide annual ethics and compliance training toour employees and encourage all employees to report any violations to their supervisor, an ethics and complianceofficer or a toll-free telephone ethics line. The Health Reform Law requires providers to implement coreelements of compliance program criteria to be established by HHS, on a timeline to be established by HHS, as acondition of enrollment in the Medicare or Medicaid programs, and we may have to modify our complianceprograms to comply with these new criteria.
Antitrust Laws
The federal government and most states have enacted antitrust laws that prohibit certain types of conductdeemed to be anti-competitive. These laws prohibit price fixing, market allocation, bid-rigging, concerted refusalto deal, market monopolization, price discrimination, tying arrangements, acquisitions of competitors and other
32
practices that have, or may have, an adverse effect on competition. Violations of federal or state antitrust lawscan result in various sanctions, including criminal and civil penalties. Antitrust enforcement in the health careindustry is currently a priority of the Federal Trade Commission and the DOJ. We believe we are in compliancewith such federal and state laws, but courts or regulatory authorities may reach a determination in the future thatcould adversely affect our operations.
Environmental Matters
We are subject to various federal, state and local statutes and ordinances regulating the discharge ofmaterials into the environment. We do not believe that we will be required to expend any material amounts inorder to comply with these laws and regulations.
Insurance
As is typical in the health care industry, we are subject to claims and legal actions by patients in the ordinarycourse of business. Subject to a $5 million per occurrence self-insured retention, our facilities are insured by our100% owned insurance subsidiary for losses up to $50 million per occurrence. The insurance subsidiary hasobtained reinsurance for professional liability risks generally above a retention level of $15 million peroccurrence. We also maintain professional liability insurance with unrelated commercial carriers for losses inexcess of amounts insured by our insurance subsidiary.
We purchase, from unrelated insurance companies, coverage for directors and officers liability and propertyloss in amounts we believe are adequate. The directors and officers liability coverage includes a $5 millioncorporate deductible. In addition, we will continue to purchase coverage for our directors and officers on anongoing basis. The property coverage includes varying deductibles depending on the cause of the propertydamage. These deductibles range from $500,000 per claim up to 5% of the affected property values for certainflood and wind and earthquake related incidents.
Employees and Medical Staffs
At December 31, 2013, we had approximately 215,000 employees, including approximately 53,000 part-time employees. References herein to “employees” refer to employees of our affiliates. We are subject to variousstate and federal laws that regulate wages, hours, benefits and other terms and conditions relating to employment.At December 31, 2013, certain employees at 38 of our domestic hospitals are represented by various laborunions. While no elections are expected in 2014, it is possible additional hospitals may unionize in the future. Weconsider our employee relations to be good and have not experienced work stoppages that have materially,adversely affected our business or results of operations. Our hospitals, like most hospitals, have experiencedrising labor costs. In some markets, nurse and medical support personnel availability has become a significantoperating issue to health care providers. To address this challenge, we have implemented several initiatives toimprove retention, recruiting, compensation programs and productivity.
Our hospitals are staffed by licensed physicians, including both employed physicians and physicians whoare not employees of our hospitals. Some physicians provide services in our hospitals under contracts, whichgenerally describe a term of service, provide and establish the duties and obligations of such physicians, requirethe maintenance of certain performance criteria and fix compensation for such services. Any licensed physicianmay apply to be accepted to the medical staff of any of our hospitals, but the hospital’s medical staff and theappropriate governing board of the hospital, in accordance with established credentialing criteria, must approveacceptance to the staff. Members of the medical staffs of our hospitals often also serve on the medical staffs ofother hospitals and may terminate their affiliation with one of our hospitals at any time.
We may be required to continue to enhance wages and benefits to recruit and retain nurses and othermedical support personnel or to hire more expensive temporary or contract personnel. As a result, our labor costs
33
could increase. We also depend on the available labor pool of semi-skilled and unskilled employees in each ofthe markets in which we operate. Certain proposed changes in federal labor laws and the National LaborRelations Board’s (the “NLRB”) modification of its election procedures could increase the likelihood ofemployee unionization attempts. To the extent a significant portion of our employee base unionizes, our costscould increase materially. In addition, the states in which we operate could adopt mandatory nurse-staffing ratiosor could reduce mandatory nurse-staffing ratios already in place. State-mandated nurse-staffing ratios couldsignificantly affect labor costs, and have an adverse impact on revenues if we are required to limit patientadmissions in order to meet the required ratios.
Executive Officers of the Registrant
As of January 31, 2014, our executive officers were as follows:
Name Age Position(s)
Richard M. Bracken . . . . . . . 61 Chairman of the BoardR. Milton Johnson . . . . . . . . . 57 Chief Executive Officer, President and DirectorDavid G. Anderson . . . . . . . . 66 Senior Vice President — Finance and TreasurerVictor L. Campbell . . . . . . . . 67 Senior Vice PresidentJana J. Davis . . . . . . . . . . . . . 55 Senior Vice President — Corporate AffairsJon M. Foster . . . . . . . . . . . . 52 President — American GroupCharles J. Hall . . . . . . . . . . . . 60 President — National GroupSamuel N. Hazen . . . . . . . . . 53 President — OperationsA. Bruce Moore, Jr. . . . . . . . 53 President — Service Line and Operations IntegrationP. Martin Paslick . . . . . . . . . . 54 Senior Vice President and Chief Information OfficerJonathan B. Perlin, M.D. . . . . 52 President — Clinical Services Group and Chief Medical OfficerWilliam B. Rutherford . . . . . 50 Chief Financial Officer and Executive Vice PresidentJoseph A. Sowell, III . . . . . . . 57 Senior Vice President and Chief Development OfficerJoseph N. Steakley . . . . . . . . 59 Senior Vice President — Internal Audit ServicesJohn M. Steele . . . . . . . . . . . . 58 Senior Vice President — Human ResourcesDonald W. Stinnett . . . . . . . . 57 Senior Vice President and ControllerJuan Vallarino . . . . . . . . . . . . 53 Senior Vice President — Employer and Payer EngagementRobert A. Waterman . . . . . . . 60 Senior Vice President, General Counsel and Chief Labor Relations OfficerAlan R. Yuspeh . . . . . . . . . . . 64 Senior Vice President and Chief Ethics and Compliance Officer
Richard M. Bracken has served as Chairman of the Board since December 2009. Mr. Bracken served asChief Executive Officer from January 2009 through December 2013. Mr. Bracken served as President and ChiefExecutive Officer from January 2009 to December 2009. Mr. Bracken was appointed Chief Operating Officer inJuly 2001 and served as President and Chief Operating Officer from January 2002 to January 2009. Mr. Brackenserved as President — Western Group of the Company from August 1997 until July 2001. From January 1995 toAugust 1997, Mr. Bracken served as President of the Pacific Division of the Company. Prior to 1995,Mr. Bracken served in various hospital Chief Executive Officer and Administrator positions with HCA-HospitalCorporation of America.
R. Milton Johnson has served as Chief Executive Officer and President since January 1, 2014. Prior to thattime, Mr. Johnson had served as President and Chief Financial Officer of the Company since February 2011 andwas appointed as a director in December 2009. Mr. Johnson served as Executive Vice President and ChiefFinancial Officer from July 2004 to February 2011 and as Senior Vice President and Controller of the Companyfrom July 1999 until July 2004. Mr. Johnson served as Vice President and Controller of the Company fromNovember 1998 to July 1999. Prior to that time, Mr. Johnson served as Vice President — Tax of the Companyfrom April 1995 to October 1998. Prior to that time, Mr. Johnson served as Director of Tax for Healthtrust,Inc. — The Hospital Company from September 1987 to April 1995.
34

David G. Anderson has served as Senior Vice President — Finance and Treasurer of the Company sinceJuly 1999. Mr. Anderson served as Vice President — Finance of the Company from September 1993 toJuly 1999 and was appointed to the additional position of Treasurer in November 1996. From March 1993 untilSeptember 1993, Mr. Anderson served as Vice President — Finance and Treasurer of Galen Health Care, Inc.From July 1988 to March 1993, Mr. Anderson served as Vice President — Finance and Treasurer ofHumana Inc.
Victor L. Campbell has served as Senior Vice President of the Company since February 1994. Prior to thattime, Mr. Campbell served as HCA-Hospital Corporation of America’s Vice President for Investor, Corporateand Government Relations. Mr. Campbell joined HCA-Hospital Corporation of America in 1972. Mr. Campbellserves on the board of the Nashville Health Care Council, as a member of the American Hospital Association’sPresident’s Forum, and serving as Chairman of the Federation of American Hospitals from March 2013 to March2014.
Jana J. Davis was appointed Senior Vice President — Corporate Affairs of the Company inDecember 2012. Prior to that time, she served as the Company’s Senior Vice President — Communications fromFebruary 2011 to December 2012 and Vice President of Communications from November 1997 toFebruary 2011. Ms. Davis joined HCA in 1997 from Burson-Marsteller, where she was a Managing Director andserved as Corporate Practice Chair for Latin American operations. Ms. Davis also held a number of PublicAffairs positions in the George H.W. Bush and Reagan Administrations. Ms. Davis is an attorney and serves aschair of the Public Relations Committee for the Federation of American Hospitals.
Jon M. Foster was appointed President — American Group in January 2013. Prior to that, Mr. Foster servedas President — Southwest Group from February 2011 to January 2013 and as Division President for the Centraland West Texas Division from January 2006 to February 2011. Mr. Foster joined HCA in March 2001 asPresident and CEO of St. David’s HealthCare in Austin, Texas and served in that position until February 2011.Prior to joining the Company, Mr. Foster served in various executive capacities within the Baptist HealthSystem, Knoxville, Tennessee and The Methodist Hospital System in Houston, Texas.
Charles J. Hall was appointed President — National Group in February 2011. Prior to that, Mr. Hall servedas President — Eastern Group from October 2006 to February 2011. Mr. Hall had previously served theCompany as President — North Florida Division from April 2003 until October 2006, as President of the EastFlorida Division from January 1999 until April 2003, as a Market President in the East Florida Division fromJanuary 1998 until December 1998, as President of the South Florida Division from February 1996 untilDecember 1997, and as President of the Southwest Florida Division from October 1994 until February 1996, andin various other capacities since 1987.
Samuel N. Hazen was appointed President — Operations of the Company in February 2011. Mr. Hazenserved as President — Western Group from July 2001 to February 2011 and as Chief Financial Officer —Western Group of the Company from August 1995 to July 2001. Mr. Hazen served as Chief Financial Officer —North Texas Division of the Company from February 1994 to July 1995. Prior to that time, Mr. Hazen served invarious hospital and regional Chief Financial Officer positions with Humana Inc. and Galen Health Care, Inc.
A. Bruce Moore, Jr. was appointed President — Service Line and Operations Integration in February 2011.Prior to that, Mr. Moore had served as President — Outpatient Services Group since January 2006. Mr. Mooreserved as Senior Vice President and as Chief Operating Officer — Outpatient Services Group from July 2004 toJanuary 2006 and as Senior Vice President — Operations Administration from July 1999 until July 2004.Mr. Moore served as Vice President — Operations Administration of the Company from September 1997 toJuly 1999, as Vice President — Benefits from October 1996 to September 1997, and as Vice President —Compensation from March 1995 until October 1996.
P. Martin Paslick was appointed Senior Vice President and Chief Information Officer of the Company inJune 2012. Prior to that time, he served as Vice President and Chief Operating Officer of Information
35

Technology & Services from March 2010 to May 2012 and Vice President — Information Technology &Services Field Operations from September 2006 to February 2010. From January 1998 to September 2006, heserved in various Vice President roles in the Company’s Information Technology & Services department.Mr. Paslick joined the Company in 1985.
Dr. Jonathan B. Perlin was appointed President — Clinical Services Group and Chief Medical Officer inNovember 2007. Dr. Perlin had served as Chief Medical Officer and Senior Vice President — Quality of theCompany from August 2006 to November 2007. Prior to joining the Company, Dr. Perlin served as UnderSecretary for Health in the U.S. Department of Veterans Affairs since April 2004. Dr. Perlin joined the VeteransHealth Administration in November 1999 where he served in various capacities, including as Deputy UnderSecretary for Health from July 2002 to April 2004, and as Chief Quality and Performance Officer fromNovember 1999 to September 2002. He also is Chairman-elect for the American Hospital Association.
William B. Rutherford has served as the Company’s Chief Financial Officer and Executive Vice Presidentsince January 2014. Mr. Rutherford previously served as Chief Operating Officer of the Company’s Clinical andPhysician Services Group since January 2011 and Chief Financial Officer of the Company’s Outpatient ServicesGroup from November 2008 to January 2011. Prior to that time, Mr. Rutherford was employed by SummitConsulting Group of Tennessee from July 2007 to November 2008 and was Chief Operating Officer ofPsychiatric Solutions, Inc. from March 2006 to June 2007. Mr. Rutherford also previously served in variouspositions with the Company from 1986 to 2005, including Chief Financial Officer of what was then theCompany’s Eastern Group, Director of Internal Audit and Director of Operations Support.
Joseph A. Sowell, III was appointed as Senior Vice President and Chief Development Officer of theCompany in December 2009. From 1987 to 1996 and again from 1999 to 2009, Mr. Sowell was a partner at thelaw firm of Waller Lansden Dortch & Davis where he specialized in the areas of health care law, mergers andacquisitions, joint ventures, private equity financing, tax law and general corporate law. He also co-managed thefirm’s corporate and commercial transactions practice. From 1996 to 1999, Mr. Sowell served as the head ofdevelopment, and later as the Chief Operating Officer of Arcon Healthcare.
Joseph N. Steakley has served as Senior Vice President — Internal Audit Services of the Company sinceJuly 1999. Mr. Steakley served as Vice President — Internal Audit Services from November 1997 to July 1999.From October 1989 until October 1997, Mr. Steakley was a partner with Ernst & Young LLP.
John M. Steele has served as Senior Vice President — Human Resources of the Company sinceNovember 2003. Mr. Steele served as Vice President — Compensation and Recruitment of the Company fromNovember 1997 to October 2003. From March 1995 to November 1997, Mr. Steele served as Assistant VicePresident — Recruitment.
Donald W. Stinnett has served as Senior Vice President and Controller since December 2008. Mr. Stinnettserved as Chief Financial Officer — Eastern Group from October 2005 to December 2008 and Chief FinancialOfficer of the Far West Division from July 1999 to October 2005. Mr. Stinnett served as Chief Financial Officerand Vice President of Finance of Franciscan Health System of the Ohio Valley from 1995 until 1999, and servedin various capacities with Franciscan Health System of Cincinnati and Providence Hospital in Cincinnati prior tothat time.
Juan Vallarino was appointed Senior Vice President — Employer and Payer Engagement (former SeniorVice President — Strategic Pricing and Analytics) in February 2011. Prior to that time, Mr. Vallarino served asVice President — Strategic Pricing and Analytics since October 2006. Prior to that, Mr. Vallarino served as VicePresident of Managed Care for the Western Group of the Company from January 1998 to October 2006.
Robert A. Waterman has served as Senior Vice President and General Counsel of the Company sinceNovember 1997 and Chief Labor Relations Officer since March 2009. Mr. Waterman served as a partner in thelaw firm of Latham & Watkins from September 1993 to October 1997; he was Chair of the firm’s health caregroup during 1997.
36
Alan R. Yuspeh has served as Senior Vice President and Chief Ethics and Compliance Officer of theCompany since May 2007. From October 1997 to May 2007, Mr. Yuspeh served as Senior Vice President —Ethics, Compliance and Corporate Responsibility of the Company. From September 1991 until October 1997,Mr. Yuspeh was a partner with the law firm of Howrey & Simon. As a part of his law practice, Mr. Yuspehserved from 1987 to 1997 as Coordinator of the Defense Industry Initiative on Business Ethics and Conduct.
Item 1A. Risk Factors
If any of the events discussed in the following risk factors were to occur, our business, financial position,results of operations, cash flows or prospects could be materially, adversely affected. Additional risks anduncertainties not presently known, or currently deemed immaterial, may also constrain our business andoperations.
Our substantial leverage could adversely affect our ability to raise additional capital to fund our operations,limit our ability to react to changes in the economy or our industry, expose us to interest rate risk to the extentof our variable rate debt and prevent us from meeting our obligations.
We are highly leveraged. As of December 31, 2013, our total indebtedness was $28.376 billion. As ofDecember 31, 2013, we had availability of $1.942 billion under our senior secured revolving credit facility and$60 million under our asset-based revolving credit facility, after giving effect to letters of credit and borrowingbase limitations. Our high degree of leverage could have important consequences, including:
• increasing our vulnerability to downturns or adverse changes in general economic, industry orcompetitive conditions and adverse changes in government regulations;
• requiring a substantial portion of cash flow from operations to be dedicated to the payment of principaland interest on our indebtedness, therefore reducing our ability to use our cash flow to fund ouroperations, capital expenditures and future business opportunities;
• exposing us to the risk of increased interest rates as certain of our unhedged borrowings are at variablerates of interest;
• limiting our ability to make strategic acquisitions or causing us to make nonstrategic divestitures;
• limiting our ability to obtain additional financing for working capital, capital expenditures, product orservice line development, debt service requirements, acquisitions and general corporate or otherpurposes; and
• limiting our ability to adjust to changing market conditions and placing us at a competitivedisadvantage compared to our competitors who are less highly leveraged.
We and our subsidiaries have the ability to incur additional indebtedness in the future, subject to therestrictions contained in our senior secured credit facilities and the indentures governing our outstanding notes. Ifnew indebtedness is added to our current debt levels, the related risks that we now face could intensify.
We may not be able to generate sufficient cash to service all of our indebtedness and may not be able torefinance our indebtedness on favorable terms. If we are unable to do so, we may be forced to take otheractions to satisfy our obligations under our indebtedness, which may not be successful.
Our ability to make scheduled payments on or to refinance our debt obligations depends on our financialcondition and operating performance, which are subject to prevailing economic and competitive conditions andto certain financial, business and other factors beyond our control. We cannot assure you we will maintain a levelof cash flows from operating activities sufficient to permit us to pay the principal, premium, if any, and intereston our indebtedness.
37
In addition, we conduct our operations through our subsidiaries. Accordingly, repayment of ourindebtedness is dependent on the generation of cash flow by our subsidiaries and their ability to make such cashavailable to us by dividend, debt repayment or otherwise. Our subsidiaries may not be able to, or may not bepermitted to, make distributions to enable us to make payments in respect of our indebtedness. Each subsidiary isa distinct legal entity, and, under certain circumstances, legal and contractual restrictions may limit our ability toobtain cash from our subsidiaries. We may find it necessary or prudent to refinance our outstanding indebtednesswith longer-maturity debt at a higher interest rate. Our ability to refinance our indebtedness on favorable terms,or at all, is directly affected by the current global economic and financial conditions. In addition, our ability toincur secured indebtedness (which would generally enable us to achieve better pricing than the incurrence ofunsecured indebtedness) depends in part on the value of our assets, which depends, in turn, on the strength of ourcash flows and results of operations, and on economic and market conditions and other factors.
If our cash flows and capital resources are insufficient to fund our debt service obligations or we are unableto refinance our indebtedness, we may be forced to reduce or delay investments and capital expenditures, or tosell assets, seek additional capital or restructure our indebtedness. These alternative measures may not besuccessful and may not permit us to meet our scheduled debt service obligations. If our operating results andavailable cash are insufficient to meet our debt service obligations, we could face substantial liquidity problemsand might be required to dispose of material assets or operations to meet our debt service and other obligations.We may not be able to consummate those dispositions, or the proceeds from the dispositions may not beadequate to meet any debt service obligations then due.
Our debt agreements contain restrictions that limit our flexibility in operating our business.
Our senior secured credit facilities and the indentures governing our outstanding notes contain variouscovenants that limit our ability to engage in specified types of transactions. These covenants limit our and certainof our subsidiaries’ ability to, among other things:
• incur additional indebtedness or issue certain preferred shares;
• pay dividends on, repurchase or make distributions in respect of our capital stock or make otherrestricted payments;
• make certain investments;
• sell or transfer assets;
• create liens;
• consolidate, merge, sell or otherwise dispose of all or substantially all of our assets; and
• enter into certain transactions with our affiliates.
Under our asset-based revolving credit facility, when (and for as long as) the combined availability underour asset-based revolving credit facility and our senior secured revolving credit facility is less than a specifiedamount for a certain period of time or, if a payment or bankruptcy event of default has occurred and iscontinuing, funds deposited into any of our depository accounts will be transferred on a daily basis into a blockedaccount with the administrative agent and applied to prepay loans under the asset-based revolving credit facilityand to cash collateralize letters of credit issued thereunder.
Under our senior secured credit facilities, we are required to satisfy and maintain specified financial ratios.Our ability to meet those financial ratios can be affected by events beyond our control, and there can be noassurance we will continue to meet those ratios. A breach of any of these covenants could result in a defaultunder both the cash flow credit facility and the asset-based revolving credit facility. Upon the occurrence of anevent of default under the senior secured credit facilities, the lenders thereunder could elect to declare allamounts outstanding under the senior secured credit facilities to be immediately due and payable and terminate
38
all commitments to extend further credit. If we were unable to repay those amounts, the lenders under the seniorsecured credit facilities could proceed against the collateral granted to them to secure such indebtedness. Wehave pledged a significant portion of our assets under our senior secured credit facilities and that collateral is alsopledged as collateral under our first lien notes. If any of the lenders under the senior secured credit facilitiesaccelerate the repayment of borrowings, there can be no assurance there will be sufficient assets to repay thesenior secured credit facilities, the first lien notes and our other indebtedness.
Our hospitals face competition for patients from other hospitals and health care providers.
The health care business is highly competitive, and competition among hospitals and other health careproviders for patients has intensified in recent years. Generally, other hospitals in the local communities we serveprovide services similar to those offered by our hospitals. In addition, CMS publicizes on its Hospital Comparewebsite performance data related to quality measures and data on patient satisfaction surveys hospitals submit inconnection with their Medicare reimbursement. Federal law provides for the future expansion of the number ofquality measures that must be reported. Additional quality measures and future trends toward clinicaltransparency may have an unanticipated impact on our competitive position and patient volumes. Further, theHealth Reform Law requires every hospital to establish and update annually a public listing of the hospital’sstandard charges for items and services. If any of our hospitals achieve poor results (or results that are lower thanour competitors) on these quality measures or on patient satisfaction surveys or if our standard charges are higherthan our competitors, our patient volumes could decline.
In addition, the number of freestanding specialty hospitals, surgery centers, emergency departments, urgentcare centers and diagnostic and imaging centers in the geographic areas in which we operate has increasedsignificantly. As a result, most of our hospitals operate in a highly competitive environment. Some of thefacilities that compete with our hospitals are physician-owned or are owned by governmental agencies or not-for-profit corporations supported by endowments, charitable contributions and/or tax revenues and can financecapital expenditures and operations on a tax-exempt basis. Our hospitals face competition from competitors thatare implementing physician alignment strategies, such as employing physicians, acquiring physician practicegroups and participating in ACOs or other clinical integration models. Our hospitals compete with specialtyhospitals and with both our own and unaffiliated freestanding surgery centers for market share in certain highmargin services and for quality physicians and personnel. If ambulatory surgery centers are better able tocompete in this environment than our hospitals, our hospitals may experience a decline in patient volume, and wemay experience a decrease in margin, even if those patients use our ambulatory surgery centers. In states that donot require a CON or other type of approval for the purchase, construction or expansion of health care facilitiesor services, competition in the form of new services, facilities and capital spending is more prevalent. Further, ifour competitors are better able to attract patients, make capital expenditures and maintain modern andtechnologically upgraded facilities and equipment, recruit physicians, expand services or obtain favorablemanaged care contracts at their facilities than our hospitals and ambulatory surgery centers, we may experiencean overall decline in patient volume. See Item 1, “Business — Competition.”
The growth of uninsured and patient due accounts and a deterioration in the collectability of these accountscould adversely affect our results of operations.
The primary collection risks of our accounts receivable relate to the uninsured patient accounts and patientaccounts for which the primary insurance carrier has paid the amounts covered by the applicable agreement, butpatient responsibility amounts (exclusions, deductibles and copayments) remain outstanding. The provision fordoubtful accounts relates primarily to amounts due directly from patients. Although Medicare reimburseshospitals for a portion of Medicare bad debts, the Jobs Creation Act reduced the reimbursement level from 70%of eligible bad debts to 65% beginning in federal fiscal year 2013.
The amount of the provision for doubtful accounts is based upon management’s assessment of historicalwrite-offs and expected net collections, business and economic conditions, trends in federal and state
39
governmental and private employer health care coverage, the rate of growth in uninsured patient admissions andother collection indicators. At December 31, 2013, our allowance for doubtful accounts representedapproximately 93% of the $5.927 billion patient due accounts receivable balance. The sum of the provision fordoubtful accounts, uninsured discounts and charity care increased from $11.214 billion for 2011 to$13.841 billion for 2012 and to $15.565 billion for 2013.
Any increase in the amount or deterioration in the collectability of uninsured accounts receivable willadversely affect our cash flows and results of operations. Our facilities may experience growth in bad debts,uninsured discounts and charity care as a result of a number of factors, including conditions impacting the overalleconomy and continued high unemployment. The Health Reform Law seeks to decrease, over time, the numberof uninsured individuals through reforms, most of which became effective January 1, 2014, but it is difficult topredict the full impact of the Health Reform Law. For example, a number of states have opted out of theMedicaid expansion. These states could choose to implement the expansion at a later date, and it is unclear howmany states will ultimately decline to implement the Medicaid expansion provisions of the law. Further, thePresident has delayed until January 1, 2015, implementation of the employer mandate, which requires firms with50 or more full-time employees to offer health insurance or pay fines. For employers with 50 to 99 employees,this mandate has been further delayed until January 1, 2016. Even after full implementation of the Health ReformLaw, we may continue to experience bad debts and have to provide uninsured discounts and charity care forindividuals residing in states that choose not to implement the Medicaid expansion, for undocumented aliens whoare not permitted to enroll in an Exchange or government health care programs and for certain others who maynot have insurance coverage. Further, implementation of the Health Reform Law could result in some patientsterminating their current insurance plans in favor of lower cost Medicaid plans or other insurance coverage withlower reimbursement levels. We may also be adversely affected by the growth in patient responsibility accountsas a result of increases in the adoption of plan structures, including health savings accounts, narrow networks andtiered networks, which shift greater responsibility for care to individuals through greater exclusions andcopayment and deductible amounts.
Changes in government health care programs may adversely affect our revenues.
A significant portion of our patient volume is derived from government health care programs, principallyMedicare and Medicaid. Specifically, we derived 42% of our revenues from the Medicare and Medicaidprograms in 2013. Changes in government health care programs may reduce the reimbursement we receive andcould adversely affect our business and results of operations.
In recent years, legislative and regulatory changes have resulted in limitations on and, in some cases,reductions in levels of payments to health care providers for certain services under the Medicare program. TheBudget Control Act of 2011 (the “BCA”) provides for new spending on program integrity initiatives intended toreduce fraud and abuse under the Medicare program. The BCA requires automatic spending reductions of $1.2trillion for federal fiscal years 2013 through 2021, minus any deficit reductions enacted by Congress and debtservice costs. However, the percentage reduction for Medicare may not be more than 2% for a fiscal year, with auniform percentage reduction across all Medicare programs. The BCA spending reductions began on March 1,2013, with CMS imposing a 2% reduction on Medicare claims beginning on April 1, 2013. These reductionshave been extended by Congress through 2024. We are unable to predict what other deficit reduction initiativesmay be proposed by Congress or whether Congress will attempt to suspend or restructure the automatic budgetcuts. These reductions are in addition to reductions mandated by the Health Reform Law, which provides formaterial reductions in the growth of Medicare program spending, including reductions in Medicare market basketupdates and Medicare DSH funding. Further, from time to time, CMS revises the reimbursement systems used toreimburse health care providers, including changes to the MS-DRG system and other payment systems, whichmay result in reduced Medicare payments. For example, CMS has established what is referred to as the “twomidnight rule,” which provides that Medicare beneficiaries are only to be admitted as inpatients when there is areasonable expectation that the hospital care is medically necessary and will be required across two midnights
40
absent unusual circumstances. Compliance with the rule became required for admissions beginning October 1,2013 and will become subject to RAC audits beginning October 1, 2014.
Because most states must operate with balanced budgets and because the Medicaid program is often astate’s largest program, some states have enacted or may consider enacting legislation designed to reduce theirMedicaid expenditures. Further, many states have also adopted, or are considering, legislation designed to reducecoverage, enroll Medicaid recipients in managed care programs and/or impose additional taxes on hospitals tohelp finance or expand the states’ Medicaid systems. The economic downturn increased the budgetary pressureson many states, and these budgetary pressures have resulted, and likely may continue to result, in decreasedspending, or decreased spending growth, for Medicaid programs and the Children’s Health Insurance Program inmany states. Some states that provide Medicaid supplemental payments are reviewing these programs or havefiled waiver requests with CMS to replace these programs, which could result in Medicaid supplementalpayments being reduced or eliminated. CMS approved a five-year Medicaid waiver in December 2011 thatallows Texas to continue receiving supplemental Medicaid reimbursement while expanding its Medicaidmanaged care program. However, we cannot predict whether the Texas private supplemental Medicaid WaiverProgram will continue or guarantee that revenues recognized from the program will not decrease.
The Health Reform Law made changes to the Medicaid program and will likely cause additional changes inthe future. For example, the Health Reform Law provides for material reductions to Medicaid DSH funding. TheHealth Reform Law will result in increased state legislative and regulatory changes in order for states to complywith new federal mandates, such as the requirement to establish or participate in Exchanges and to participate ingrants and other incentive opportunities. A number of states have opted out of the Medicaid expansion provisionsof the Health Reform Law, but these states could choose to implement the expansion at a later date. It is unclearhow many states will ultimately decline to implement the Medicaid expansion provisions of the law.
In some cases, commercial third-party payers rely on all or portions of Medicare payment systems todetermine payment rates. Changes to government health care programs that reduce payments under theseprograms may negatively impact payments from commercial third-party payers.
Current or future health care reform and deficit reduction efforts, changes in laws or regulations regardinggovernment health care programs, other changes in the administration of government health care programs andchanges to commercial third-party payers in response to health care reform and other changes to governmenthealth care programs could have a material, adverse effect on our financial position and results of operations.
We are unable to predict the impact of the Health Reform Law, which represents a significant change to thehealth care industry.
The Health Reform Law changes how health care services are covered, delivered, and reimbursed throughexpanded coverage of uninsured individuals, reduced growth in Medicare program spending, reductions inMedicare and Medicaid DSH payments and the establishment and expansion of programs that tie reimbursementto quality and integration. In addition, the law reforms certain aspects of health insurance, contains provisionsintended to strengthen fraud and abuse enforcement and establishes ACOs and bundled payment pilot programs.The expansion of health insurance coverage under the Health Reform Law may result in an increase in thenumber of patients using our facilities who have either private or public program coverage, and our facilities maybenefit from Health Reform Law initiatives that create possible sources of additional revenue. However, anypositive effects of the Health Reform Law could be offset and the Company could be significantly impacted byreductions to the Medicare and Medicaid programs. Substantial uncertainty remains regarding the net effect ofthe Health Reform Law on the Company because the resolution of a number of material factors remains unclear,including the following:
• how many states will ultimately implement the Medicaid expansion provisions and under what terms;
• the potential for and impact of further delays in or complications related to implementation of theHealth Reform Law (for example, there were significant problems during the initial implementation of
41
the Exchanges that negatively impacted the ability of individuals to enroll in Medicaid and to purchasehealth insurance);
• the possibility of enactment of additional federal or state health care reforms and possible changes tothe Health Reform Law;
• our ability to participate in health insurance plans offered through the Exchanges and the terms of ourparticipation as well as treatment of out of network claims;
• how many previously uninsured individuals will obtain coverage as a result of the Health Reform Law(based on the CBO’s February 2014 estimates, by 2022, the Health Reform Law will expand coverageto 25 million additional individuals);
• what percentage of the newly insured patients will be covered under the Medicaid program and whatpercentage will be covered by private health insurers;
• the extent to which states will enroll new Medicaid participants in managed care programs;
• the pace at which insurance coverage expands, including the pace of different types of coverageexpansion;
• the change, if any, in the volume of inpatient and outpatient hospital services that are sought by andprovided to previously uninsured individuals;
• the rate paid to hospitals by private payers for newly covered individuals and individuals with existingcoverage including those covered through the Exchanges, and those who might be covered under theMedicaid program;
• the rate paid by state governments under the Medicaid program for newly covered individuals;
• the effect of the value-based purchasing provisions of the Health Reform Law on our hospitals’revenues and the effects of other quality programs;
• the percentage of individuals in the Exchanges who select the high deductible plans, since healthinsurers offering those kinds of products have traditionally sought to pay lower rates to hospitals;
• the amount of overall revenues the Company will generate from Medicare and Medicaid business whenthe reductions are implemented (42% of our revenues in 2013 were from Medicare and Medicaid);
• the size of the Health Reform Law’s annual productivity adjustment to the market basket;
• the amount of the Medicare DSH reductions and the allocation of the Medicaid DSH reductions to ourhospitals;
• how successful ACOs will be at coordinating care and reducing costs or whether they will decreasereimbursement;
• the scope and nature of potential changes to Medicare reimbursement methods, such as an emphasis onbundling payments or coordination of care programs;
• whether the Company’s revenues from Medicaid supplemental programs developed through a federallyapproved waiver program (“Waiver Program”), will be adversely affected because there may bereductions in available state and local government funding for the programs; and
• the impact of efforts to repeal or revise the Health Reform Law and remaining or new federal lawsuitschallenging its constitutionality.
If we are unable to retain and negotiate favorable contracts with nongovernment payers, including managedcare plans, our revenues may be reduced.
Our ability to obtain favorable contracts with nongovernment payers, including HMOs, PPOs and othermanaged care plans significantly affects the revenues and operating results of our facilities. Revenues derived
42
from these entities and other insurers (domestic only) accounted for 54.6%, 54.5% and 52.9% of our revenues for2013, 2012 and 2011, respectively. Nongovernment payers, including managed care payers, continue to demanddiscounted fee structures, and the trend toward consolidation among nongovernment payers tends to increasetheir bargaining power over fee structures. As various provisions of the Health Reform Law are implemented,including the Exchanges, nongovernment payers increasingly may demand reduced fees and utilize planstructures such as narrow networks and tiered networks that limit beneficiary provider choices or imposesignificantly higher cost sharing obligations when care is obtained from providers in a disfavored tier. Otherhealth care providers may impact our ability to enter into managed care contracts or negotiate increases in ourreimbursement and other favorable terms and conditions. For example, some of our competitors may negotiateexclusivity provisions with managed care plans or otherwise restrict the ability of managed care companies tocontract with us. Our future success will depend, in part, on our ability to retain and renew our managed carecontracts and enter into new managed care contracts on terms favorable to us. It is not clear what impact, if any,the increased obligations on managed care payers and other payers imposed by the Health Reform Law will haveon our ability to negotiate reimbursement increases and participate in plan networks on favorable terms. If we areunable to retain and negotiate favorable contracts with managed care plans or experience reductions in paymentincreases or amounts received from nongovernment payers, our revenues may be reduced.
Our performance depends on our ability to recruit and retain quality physicians.
The success of our hospitals depends in part on the number and quality of the physicians on the medicalstaffs of our hospitals, the admitting and utilization practices of those physicians, maintaining good relations withthose physicians and controlling costs related to the employment of physicians. Although we employ somephysicians, physicians are often not employees of the hospitals at which they practice and, in many of themarkets we serve, most physicians have admitting privileges at other hospitals in addition to our hospitals. Suchphysicians may terminate their affiliation with our hospitals at any time. If we are unable to provide adequatesupport personnel or technologically advanced equipment and hospital facilities that meet the needs of thosephysicians and their patients, they may be discouraged from referring patients to our facilities, admissions maydecrease and our operating performance may decline.
Our hospitals face competition for staffing, which may increase labor costs and reduce profitability.
Our operations are dependent on the efforts, abilities and experience of our management and medicalsupport personnel, such as nurses, pharmacists and lab technicians, as well as our physicians. We compete withother health care providers in recruiting and retaining qualified management and support personnel responsiblefor the daily operations of each of our hospitals, including nurses and other nonphysician health careprofessionals. In some markets, the availability of nurses and other medical support personnel has been asignificant operating issue to health care providers. We may be required to continue to enhance wages andbenefits to recruit and retain nurses and other medical support personnel or to hire more expensive temporary orcontract personnel. As a result, our labor costs could increase. We also depend on the available labor pool ofsemi-skilled and unskilled employees in each of the markets in which we operate. Certain proposed changes infederal labor laws and the NLRB’s modification of its election procedures could increase the likelihood ofemployee unionization attempts. To the extent a significant portion of our employee base unionizes, it is possibleour labor costs could increase materially. When negotiating collective bargaining agreements with unions,whether such agreements are renewals or first contracts, there is the possibility that strikes could occur during thenegotiation process, and our continued operation during any strikes could increase our labor costs. In addition,the states in which we operate could adopt mandatory nurse-staffing ratios or could reduce mandatory nursestaffing ratios already in place. State-mandated nurse-staffing ratios could significantly affect labor costs andhave an adverse impact on revenues if we are required to limit admissions in order to meet the required ratios. Ifour labor costs increase, we may not be able to raise rates to offset these increased costs. Because a significantpercentage of our revenues consists of fixed, prospective payments, our ability to pass along increased labor costsis constrained. Our failure to recruit and retain qualified management, nurses and other medical supportpersonnel, or to control labor costs, could have a material, adverse effect on our results of operations.
43
If we fail to comply with extensive laws and government regulations, we could suffer penalties or be requiredto make significant changes to our operations.
The health care industry is required to comply with extensive and complex laws and regulations at thefederal, state and local government levels relating to, among other things:
• billing and coding for services and properly handling overpayments;
• classification of level of care provided, including proper classification of inpatient admissions,observation services and outpatient care;
• relationships with physicians and other referral sources and referral recipients;
• necessity and adequacy of medical care;
• quality of medical equipment and services;
• qualifications of medical and support personnel;
• confidentiality, maintenance, data breach, identity theft and security issues associated with health-related and personal information and medical records;
• screening, stabilization and transfer of individuals who have emergency medical conditions;
• licensure and certification;
• hospital rate or budget review;
• preparing and filing of cost reports;
• operating policies and procedures;
• activities regarding competitors; and
• addition of facilities and services.
Among these laws are the federal Anti-kickback Statute, the federal Stark Law, the federal FCA and similarstate laws. We have a variety of financial relationships with physicians and others who either refer or influencethe referral of patients to our hospitals, other health care facilities and employed physicians or who are therecipients of referrals, and these laws govern those relationships. The OIG has enacted safe harbor regulationsthat outline practices deemed protected from prosecution under the Anti-kickback Statute. While we endeavor tocomply with the applicable safe harbors, certain of our current arrangements, including joint ventures andfinancial relationships with physicians and other referral sources and persons and entities to which we referpatients, do not qualify for safe harbor protection. Failure to qualify for a safe harbor does not mean thearrangement necessarily violates the Anti-kickback Statute but may subject the arrangement to greater scrutiny.However, we cannot offer assurance that practices outside of a safe harbor will not be found to violate the Anti-kickback Statute. Allegations of violations of the Anti-kickback Statute may be brought under the federal CivilMonetary Penalty Law, which requires a lower burden of proof than other fraud and abuse laws, including theAnti-kickback Statute.
Our financial relationships with referring physicians and their immediate family members must comply withthe Stark Law by meeting an exception. We attempt to structure our relationships to meet an exception to theStark Law, but the regulations implementing the exceptions are detailed and complex, and we cannot provideassurance that every relationship complies fully with the Stark Law. Unlike the Anti-kickback Statute, failure tomeet an exception under the Stark Law results in a violation of the Stark Law, even if such violation is technicalin nature.
Additionally, if we violate the Anti-kickback Statute or Stark Law, or if we improperly bill for our services,we may be found to violate the FCA, either under a suit brought by the government or by a private person undera qui tam, or “whistleblower,” suit. See Item 1, “Business — Regulation and Other Factors.”
44
We also operate health care facilities in the United Kingdom and have operations and commercialrelationships with companies in other foreign jurisdictions and, as a result, are subject to certain U.S. and foreignlaws applicable to businesses generally, including anti-corruption laws. The Foreign Corrupt Practices Actregulates U.S. companies in their dealings with foreign officials, prohibiting bribes and similar practices, andrequires that they maintain records that fairly and accurately reflect transactions and appropriate internalaccounting controls. In addition, the United Kingdom Bribery Act has wide jurisdiction over certain activitiesthat affect the United Kingdom.
If we fail to comply with the Anti-kickback Statute, the Stark Law, the FCA or other applicable laws andregulations, we could be subjected to liabilities, including civil penalties (including the loss of our licenses tooperate one or more facilities), exclusion of one or more facilities from participation in the Medicare, Medicaidand other federal and state health care programs and, for violations of certain laws and regulations, criminalpenalties.
We do not always have the benefit of significant regulatory or judicial interpretation of these laws andregulations. In the future, different interpretations or enforcement of, or amendment to, these laws andregulations could subject our current or past practices to allegations of impropriety or illegality or could requireus to make changes in our facilities, equipment, personnel, services, capital expenditure programs and operatingexpenses. A determination that we have violated these laws, or the public announcement that we are beinginvestigated for possible violations of these laws, could have a material, adverse effect on our business, financialcondition, results of operations or prospects, and our business reputation could suffer significantly. In addition,other legislation or regulations at the federal or state level may be adopted that adversely affect our business.
We have been and could become the subject of governmental investigations, claims and litigation.
Health care companies are subject to numerous investigations by various governmental agencies. Further,under the FCA, private parties have the right to bring qui tam, or “whistleblower,” suits against companies thatsubmit false claims for payments to, or improperly retain overpayments from, the government. Some states haveadopted similar state whistleblower and false claims provisions. Certain of our individual facilities have received,and other facilities may receive, government inquiries from, and may be subject to investigation by, federal andstate agencies. Depending on whether the underlying conduct in these or future inquiries or investigations couldbe considered systemic, their resolution could have a material, adverse effect on our financial position, results ofoperations and liquidity.
Governmental agencies and their agents, such as the Medicare Administrative Contractors, fiscalintermediaries and carriers, as well as the OIG, CMS and state Medicaid programs, conduct audits of our healthcare operations. Private payers may conduct similar post-payment audits, and we also perform internal audits andmonitoring. Depending on the nature of the conduct found in such audits and whether the underlying conductcould be considered systemic, the resolution of these audits could have a material, adverse effect on our financialposition, results of operations and liquidity.
CMS contracts with RACs on a contingency fee basis to conduct post-payment reviews to detect and correctimproper payments in the fee-for-service Medicare program. In February 2012, CMS initiated a RACprepayment demonstration program in 11 states. The Health Reform Law expands the RAC program’s scope toinclude managed Medicare plans and Medicaid claims. RAC denials are appealable; however, HHS has imposeda suspension of assignment of new Medicare appeals to Administrative Law Judges for at least two yearsbeginning July 16, 2013. This suspension will delay our ability to appeal RAC payment denials during thisperiod. In addition, CMS employs MICs to perform post-payment audits of Medicaid claims and identifyoverpayments. The Health Reform Law increases federal funding for the MIC program. In addition to RACs andMICs, the state Medicaid agencies and other contractors have increased their review activities.
Should we be found out of compliance with any of these laws, regulations or programs, depending on thenature of the findings, our business, our financial position and our results of operations could be negativelyimpacted.
45
Physician utilization practices and treatment methodologies or governmental or managed care controlsdesigned to reduce inpatient services or surgical procedures may reduce our revenues.
Controls imposed by Medicare, managed Medicare, Medicaid, managed Medicaid and commercial third-party payers designed to reduce admissions, intensity of services, surgical volumes and lengths of stay, in someinstances referred to as “utilization review,” have affected and are expected to continue to affect our facilities.Utilization review entails the review of the admission and course of treatment of a patient by health plans.Inpatient utilization, average lengths of stay and occupancy rates continue to be negatively affected by payer-required preadmission authorization and utilization review and by payer pressure to maximize outpatient andalternative health care delivery services for less acutely ill patients. Efforts to impose more stringent cost controlsare expected to continue. For example, the Health Reform Law expanded the use of prepayment review byMedicare contractors by eliminating statutory restrictions on their use. Although we are unable to predict theeffect these changes will have on our operations, significant limits on the scope of services reimbursed and onreimbursement rates and fees could have a material, adverse effect on our business, financial position and resultsof operations. Additionally, trends in physician treatment protocols and managed care health plan design, such asplans that shift increased costs and accountability for care to patients, could reduce our surgical volumes andadmissions in favor of lower intensity and lower cost treatment methodologies.
Our overall business results may suffer during periods of general economic weakness.
Budget deficits at federal, state and local government entities have had a negative impact on spending, andmay continue to negatively impact spending, for health and human service programs, including Medicare,Medicaid and similar programs, which represent significant payer sources for our hospitals. Other risks we faceduring periods of economic weakness and high unemployment include potential declines in the populationcovered under managed care agreements, patient decisions to postpone or cancel elective and nonemergencyhealth care procedures (including delaying surgical procedures), potential increases in the uninsured andunderinsured populations and further difficulties in our collecting patient copayment and deductible receivables.
The industry trend toward value-based purchasing may negatively impact our revenues.
There is a trend in the health care industry toward value-based purchasing of health care services. Thesevalue-based purchasing programs include both public reporting of quality data and preventable adverse eventstied to the quality and efficiency of care provided by facilities. Governmental programs including Medicarecurrently require hospitals to report certain quality data to receive full reimbursement updates. In addition,Medicare does not reimburse for care related to certain preventable adverse events (also called “never events”).The Health Reform Law also prohibits the use of federal funds under the Medicaid program to reimburseproviders for medical assistance provided to treat HACs. Beginning in federal fiscal year 2015, the 25% ofhospitals with the worst national risk-adjusted HAC rates in the previous year will receive a 1% reduction in theirtotal inpatient operating Medicare payments.
Hospitals with excess readmission rates for conditions designated by HHS will receive a reduction inoperating payments for all Medicare inpatient discharges, not just discharges relating to the conditions subject tothe excess readmission standard. The reduction in payments to hospitals with excess readmissions is capped at2% for federal fiscal year 2014 and 3% for federal fiscal year 2015 and thereafter.
As required by the Health Reform Law, HHS has implemented a value-based purchasing program forinpatient hospital services that reduces inpatient hospital payments for all discharges by 1.25% in federal fiscalyear 2014. This percentage will increase by 0.25% each fiscal year up to 2% in federal fiscal year 2017 andsubsequent years. HHS pools the amount collected from these reductions to fund payments to reward hospitalsthat meet or exceed certain quality performance standards established by HHS. HHS estimates that it willdistribute $1.1 billion to hospitals in federal fiscal year 2014 based on their achievement (relative to other
46
hospitals) and improvement ranges (relative to the hospital’s own past performance). Hospitals that meet orexceed the quality performance standards will receive greater reimbursement under the value-based purchasingprogram than they would have otherwise.
Many large commercial payers currently require hospitals to report quality data, and several commercialpayers do not reimburse hospitals for certain preventable adverse events. Further, we have implemented a policypursuant to which we do not bill patients or third-party payers for fees or expenses incurred due to certainpreventable adverse events.
We expect value-based purchasing programs, including programs that condition reimbursement on patientoutcome measures, to become more common and to involve a higher percentage of reimbursement amounts. Weare unable at this time to predict our future reductions and payments under these programs or how this trend willaffect our results of operations, but it could negatively impact our revenues.
Our operations could be impaired by a failure of our information systems.
Any system failure that causes an interruption in service or availability of our systems could adversely affectoperations or delay the collection of revenues. We have implemented multiple layers of security measuresthrough technology, processes, and our people; utilize current security technologies; and our defenses aremonitored and routinely tested internally and by external parties. Despite these efforts, threats from maliciouspersons and groups, new vulnerabilities, and advanced new attacks against information technology systemscreate risk of cyber security incidents that could impact availability of systems. The occurrence of any of theseevents could result in interruptions, delays, the loss or corruption of data, cessations in the availability of systemsor liability under privacy and security laws, all of which could have a material adverse effect on our financialposition and results of operations and harm our business reputation.
The performance of our information technology and systems is critical to our business operations. Inaddition to our shared services initiatives, our information systems are essential to a number of critical areas ofour operations, including:
• accounting and financial reporting;
• billing and collecting accounts;
• coding and compliance;
• clinical systems;
• medical records and document storage;
• inventory management;
• negotiating, pricing and administering managed care contracts and supply contracts; and
• monitoring quality of care and collecting data on quality measures necessary for full Medicare paymentupdates.
If we fail to effectively and timely implement electronic health record systems and transition to the ICD-10coding system, our operations could be adversely affected.
As required by ARRA, the Secretary of HHS has developed and implemented an incentive paymentprogram for eligible hospitals and health care professionals that adopt and meaningfully use certified EHRtechnology. HHS uses the Provider Enrollment, Chain and Ownership System (“PECOS”) to verify Medicareenrollment prior to making EHR incentive program payments. During 2013, we received Medicare and Medicaidincentive payments for being a meaningful user of certified EHR technology and recorded incentive income of$216 million for the year.
We have incurred and will continue to incur both capital costs and operating expenses in order to implementour certified EHR technology and meet meaningful use requirements. These expenses are ongoing and areprojected to continue over all stages of implementation of meaningful use. The timing of expenses will not
47

correlate with the receipt of the incentive payments and the recognition of incentive income. During 2013, weincurred $113 million of operating expenses to implement our certified EHR technology and to meet meaningfuluse. If our eligible hospitals and employed professionals are unable to meet the requirements for participation inthe incentive payment program, including having an enrollment record in PECOS, we will not be eligible toreceive incentive payments that could offset some of the costs of implementing certified EHR technology.Further, eligible providers that have failed to demonstrate meaningful use of certified EHR technology in anapplicable prior reporting period will be subject to reduced payments from Medicare, beginning in federal fiscalyear 2015 for eligible hospitals and calendar year 2015 for eligible professionals. Failure to implement andcontinue to demonstrate meaningful use of certified EHR technology could have a material, adverse effect on ourfinancial position and results of operations.
Health plans and providers, including our hospitals, are required to transition to the new ICD-10 codingsystem, which greatly expands the number and detail of billing codes used for inpatient claims. Use of the ICD-10 system is required beginning October 1, 2014. Transition to the new ICD-10 system requires significantinvestment in training of staff and physicians involved in the coding and billing process as well as investment incoding technology and software. In addition to these upfront costs of transition to ICD-10, it is possible that ourhospitals could experience disruption or delays in payment due to technical or coding errors or otherimplementation issues involving our systems or the systems and implementation efforts of health plans and theirbusiness partners. Further, the transition to the more detailed ICD-10 coding system could result in decreasedreimbursement if the use of ICD-10 codes results in conditions being reclassified to MS-DRGs or commercialpayer payment groupings with lower levels of reimbursement than assigned under the previous system.
State efforts to regulate the construction or expansion of health care facilities could impair our ability tooperate and expand our operations.
Some states, particularly in the eastern part of the country, require health care providers to obtain priorapproval, often known as a CON, for the purchase, construction or expansion of health care facilities, to makecertain capital expenditures or to make changes in services or bed capacity. In giving approval, these statesconsider the need for additional or expanded health care facilities or services. We currently operate health carefacilities in a number of states with CON laws or that require other types of approvals for the establishment orexpansion of certain facility types or services. The failure to obtain any requested CON or other requiredapproval could impair our ability to operate or expand operations. Any such failure could, in turn, adverselyaffect our ability to attract patients and physicians to our facilities and grow our revenues, which would have anadverse effect on our results of operations.
We may encounter difficulty acquiring hospitals and other health care businesses, encounter challengesintegrating the operations of acquired hospitals and other health care businesses and become liable forunknown or contingent liabilities as a result of acquisitions.
A component of our business strategy is acquiring hospitals and other health care businesses. We mayencounter difficulty acquiring new facilities as a result of competition from other purchasers that may be willingto pay purchase prices that are higher than we believe are reasonable. Some states require CONs in order toacquire a hospital or other facility or to expand facilities or services. In addition, the acquisition of health carefacilities often involves licensure approvals or reviews and complex change of ownership processes for Medicareand other payers. Further, many states have laws that restrict the conversion or sale of not-for-profit hospitals tofor-profit entities. These laws may require prior approval from the state attorney general, advance notification ofthe attorney general or other regulators and community involvement. Attorneys general in states without specificrequirements may exercise broad discretionary authority over transactions involving the sale of not-for-profitsunder their general obligations to protect the use of charitable assets. These conversion legislative andadministrative efforts often focus on the appropriate valuation of the assets divested and the use of the proceedsof the sale by the non-profit seller and may include consideration of commitments for capital improvements andcharity care by the purchaser. Also, the increasingly challenging regulatory and enforcement environment may
48

negatively impact our ability to acquire health care businesses if they are found to have material unresolvedcompliance issues, such as repayment obligations. Resolving compliance issues as well as completion ofoversight, review or approval processes could seriously delay or even prevent our ability to acquire hospitals orother businesses and increase our acquisition costs.
We may be unable to timely and effectively integrate hospitals and other businesses that we acquire withour ongoing operations, or we may experience delays implementing operating procedures and systems. Hospitalsand other health care businesses that we acquire may have unknown or contingent liabilities, including liabilitiesfor failure to comply with health care and other laws and regulations, medical and general professional liabilities,workers’ compensation liabilities and tax liabilities. Although we typically exclude significant liabilities fromour acquisition transactions and seek indemnification from the sellers for these matters, we could experiencedifficulty enforcing those obligations, experience liability in excess of any indemnification obtained or otherwiseincur material liabilities for the pre-acquisition conduct of acquired businesses. Such liabilities and related legalor other costs could harm our business and results of operations.
Our facilities are heavily concentrated in Florida and Texas, which makes us sensitive to regulatory,economic, environmental and competitive conditions and changes in those states.
We operated 165 hospitals at December 31, 2013, and 78 of those hospitals are located in Florida and Texas.Our Florida and Texas facilities’ combined revenues represented approximately 46% of our consolidatedrevenues for the year ended December 31, 2013. This concentration makes us particularly sensitive to regulatory,economic, environmental and competitive conditions and changes in those states. Any material change in thecurrent payment programs or regulatory, economic, environmental or competitive conditions in those states couldhave a disproportionate effect on our overall business results.
In addition, our hospitals in Florida, Texas and other areas across the Gulf Coast are located in hurricane-prone areas. In the past, hurricanes have had a disruptive effect on the operations of our hospitals in Florida,Texas and other coastal states and the patient populations in those states. Our business activities could be harmedby a particularly active hurricane season or even a single storm, and the property insurance we obtain may not beadequate to cover losses from future hurricanes or other natural disasters.
We may be subject to liabilities from claims by the Internal Revenue Service.
We expect the IRS Examination Division will begin an audit of HCA Holdings, Inc.’s 2011 federal incometax return in 2014.
Management believes HCA Holdings, Inc., its predecessors, subsidiaries and affiliates properly reportedtaxable income and paid taxes in accordance with applicable laws and agreements established with the IRS andfinal resolution of any disputes will not have a material, adverse effect on our results of operations or financialposition. However, if payments due upon final resolution of any issues exceed our recorded estimates, suchresolutions could have a material, adverse effect on our results of operations or financial position.
We may be subject to liabilities from claims brought against our facilities.
We are subject to litigation relating to our business practices, including claims and legal actions by patientsand others in the ordinary course of business alleging malpractice, product liability or other legal theories. Manyof these actions seek large sums of money as damages and involve significant defense costs. We insure a portionof our professional liability risks through a 100% owned subsidiary. Management believes our reserves for self-insured retentions and insurance coverage are sufficient to cover insured claims arising out of the operation ofour facilities. Our 100% owned liability insurance subsidiary has entered into certain reinsurance contracts, andthe obligations covered by the reinsurance contracts are included in its reserves for professional liability risks, asthe subsidiary remains liable to the extent that the reinsurers do not meet their obligations under the reinsurance
49
contracts. If payments for claims exceed actuarially determined estimates, are not covered by insurance, orreinsurers, if any, fail to meet their obligations, our results of operations and financial position could be adverselyaffected.
We are exposed to market risks related to changes in the market values of securities and interest rate changes.
We are exposed to market risk related to changes in market values of securities. The investments in debt andequity securities of our 100% owned insurance subsidiaries were $506 million and $4 million, respectively, atDecember 31, 2013. These investments are carried at fair value, with changes in unrealized gains and lossesbeing recorded as adjustments to other comprehensive income. At December 31, 2013, we had a net unrealizedgain of $10 million on the insurance subsidiaries’ investment securities.
We are exposed to market risk related to market illiquidity. Investments in debt and equity securities of our100% owned insurance subsidiaries could be impaired by the inability to access the capital markets. Should the100% owned insurance subsidiaries require significant amounts of cash in excess of normal cash requirements topay claims and other expenses on short notice, we may have difficulty selling these investments in a timelymanner or be forced to sell them at a price less than what we might otherwise have been able to in a normalmarket environment. We may be required to recognize other-than-temporary impairments on long-terminvestments in future periods should issuers default on interest payments or should the fair market valuations ofthe securities deteriorate due to ratings downgrades or other issue specific factors.
We are also exposed to market risk related to changes in interest rates, and we periodically enter intointerest rate swap agreements to manage our exposure to these fluctuations. Our interest rate swap agreementsinvolve the exchange of fixed and variable rate interest payments between two parties, based on commonnotional principal amounts and maturity dates. The notional amounts of the swap agreements represent balancesused to calculate the exchange of cash flows and are not our assets or liabilities.
The Investors continue to have influence over us and may have conflicts of interest with us in the future.
Through their investment in Hercules Holdings II, LLC, the Investors continue to hold a significant interestin our outstanding common stock (approximately 29% as of January 31, 2014). In addition, pursuant to ashareholders agreement we entered into with Hercules Holdings II, LLC, representatives of the Investors have thecontinued right to designate certain of the members of our Board of Directors. As a result, the Investorspotentially have the ability to influence our decisions to enter into corporate transactions (and the terms thereof)and to potentially prevent changes in the composition of our Board of Directors and any transaction that requiresstockholder approval.
Additionally, the Investors are in the business of making investments in companies and may acquire andhold interests in businesses that compete directly or indirectly with us. One or more of the Investors may alsopursue acquisition opportunities that may be complementary to our business and, as a result, those acquisitionopportunities may not be available to us.
Item 1B. Unresolved Staff Comments
None.
50
Item 2. Properties
The following table lists, by state, the number of hospitals (general, acute care, psychiatric andrehabilitation) directly or indirectly owned and operated by us as of December 31, 2013:
State Hospitals Beds
Alaska . . . . . . . . . . . . . . . . . . . . . . . . . . . . . . . . . . . . . . . . . . . 1 250California . . . . . . . . . . . . . . . . . . . . . . . . . . . . . . . . . . . . . . . . . 5 1,749Colorado . . . . . . . . . . . . . . . . . . . . . . . . . . . . . . . . . . . . . . . . . 7 2,259Florida . . . . . . . . . . . . . . . . . . . . . . . . . . . . . . . . . . . . . . . . . . . 42 11,240Georgia . . . . . . . . . . . . . . . . . . . . . . . . . . . . . . . . . . . . . . . . . . 8 1,609Idaho . . . . . . . . . . . . . . . . . . . . . . . . . . . . . . . . . . . . . . . . . . . . 2 480Indiana . . . . . . . . . . . . . . . . . . . . . . . . . . . . . . . . . . . . . . . . . . . 1 278Kansas . . . . . . . . . . . . . . . . . . . . . . . . . . . . . . . . . . . . . . . . . . . 4 1,360Kentucky . . . . . . . . . . . . . . . . . . . . . . . . . . . . . . . . . . . . . . . . . 2 384Louisiana . . . . . . . . . . . . . . . . . . . . . . . . . . . . . . . . . . . . . . . . . 5 1,161Mississippi . . . . . . . . . . . . . . . . . . . . . . . . . . . . . . . . . . . . . . . . 1 130Missouri . . . . . . . . . . . . . . . . . . . . . . . . . . . . . . . . . . . . . . . . . . 6 1,031Nevada . . . . . . . . . . . . . . . . . . . . . . . . . . . . . . . . . . . . . . . . . . . 3 1,164New Hampshire . . . . . . . . . . . . . . . . . . . . . . . . . . . . . . . . . . . . 2 295Oklahoma . . . . . . . . . . . . . . . . . . . . . . . . . . . . . . . . . . . . . . . . 2 772South Carolina . . . . . . . . . . . . . . . . . . . . . . . . . . . . . . . . . . . . . 3 794Tennessee . . . . . . . . . . . . . . . . . . . . . . . . . . . . . . . . . . . . . . . . 12 2,367Texas . . . . . . . . . . . . . . . . . . . . . . . . . . . . . . . . . . . . . . . . . . . . 36 10,664Utah . . . . . . . . . . . . . . . . . . . . . . . . . . . . . . . . . . . . . . . . . . . . . 7 928Virginia . . . . . . . . . . . . . . . . . . . . . . . . . . . . . . . . . . . . . . . . . . 10 3,132InternationalEngland . . . . . . . . . . . . . . . . . . . . . . . . . . . . . . . . . . . . . . . . . . 6 849
165 42,896
In addition to the hospitals listed in the above table, we directly or indirectly operate 115 freestandingsurgery centers. We also operate medical office buildings in conjunction with some of our hospitals. These officebuildings are primarily occupied by physicians who practice at our hospitals. Fourteen of our general, acute carehospitals and three of our other properties have been mortgaged to support our obligations under our seniorsecured cash flow credit facility and first lien secured notes.
We maintain our headquarters in approximately 1,400,000 square feet of space in the Nashville, Tennesseearea. In addition to the headquarters in Nashville, we maintain regional service centers related to our sharedservices initiatives. These service centers are located in markets in which we operate hospitals.
We believe our headquarters, hospitals and other facilities are suitable for their respective uses and are, ingeneral, adequate for our present needs. Our properties are subject to various federal, state and local statutes andordinances regulating their operation. Management does not believe that compliance with such statutes andordinances will materially affect our financial position or results of operations.
Item 3. Legal Proceedings
We operate in a highly regulated and litigious industry. As a result, various lawsuits, claims and legal andregulatory proceedings have been and can be expected to be instituted or asserted against us. The resolution ofany such lawsuits, claims or legal and regulatory proceedings could materially and adversely affect our results ofoperations and financial position in a given period.
51
Government Investigations, Claims and Litigation
Health care companies are subject to numerous investigations by various governmental agencies. Further,under the federal False Claims Act (“FCA”), private parties have the right to bring qui tam, or “whistleblower,”suits against companies that submit false claims for payments to, or improperly retain overpayments from, thegovernment. Some states have adopted similar state whistleblower and false claims provisions. Certain of ourindividual facilities have received, and from time to time, other facilities may receive, government inquiriesfrom, and may be subject to investigation by, federal and state agencies. Depending on whether the underlyingconduct in these or future inquiries or investigations could be considered systemic, their resolution could have amaterial, adverse effect on our financial position, results of operations and liquidity.
As initially disclosed in 2010, the DOJ has contacted the Company in connection with its nationwide reviewof whether, in certain cases, hospital charges to the federal government relating to implantable cardio-defibrillators (“ICDs”) met the CMS criteria. In connection with this nationwide review, the DOJ has indicatedthat it will be reviewing certain ICD billing and medical records at 95 HCA hospitals; the review covers theperiod from October 2003 to the present. In August 2012, HCA, along with non-HCA hospitals across thecountry subject to the DOJ’s review, received from the DOJ a proposed framework for resolving the DOJ’sreview of ICDs. The Company is cooperating in the review. The review could potentially give rise to claimsagainst the Company under the federal FCA or other statutes, regulations or laws. At this time, we cannot predictwhat effect, if any, this review or any resulting claims could have on the Company.
In July 2012, the Civil Division of the U.S. Attorney’s Office in Miami requested information on reviewsassessing the medical necessity of interventional cardiology services provided at any Company facility (otherthan peer reviews). The Company is cooperating with the government’s request and has produced medicalrecords associated with particular reviews at eight hospitals, located primarily in Florida. At this time, we cannotpredict what effect, if any, the request or any resulting claims, including any potential claims under the federalFCA, other statutes, regulations or laws, could have on the Company.
Securities Class Action Litigation
On October 28, 2011, a shareholder action, Schuh v. HCA Holdings, Inc. et al., was filed in the UnitedStates District Court for the Middle District of Tennessee seeking monetary relief. The case sought to include asa class all persons who acquired the Company’s stock pursuant or traceable to the Company’s RegistrationStatement issued in connection with the March 9, 2011 initial public offering. The lawsuit asserted a claim underSection 11 of the Securities Act of 1933 against the Company, certain members of the board of directors, andcertain underwriters in the offering. It further asserted a claim under Section 15 of the Securities Act of 1933against the same members of the board of directors. The action alleged various deficiencies in the Company’sdisclosures in the Registration Statement. Subsequently, two additional class action complaints, Kishtah v. HCAHoldings, Inc. et al. and Daniels v. HCA Holdings, Inc. et al., setting forth substantially similar claims againstsubstantially the same defendants were filed in the same federal court on November 16, 2011 and December 12,2011, respectively. All three of the cases were consolidated. On May 3, 2012, the court appointed New EnglandTeamsters & Trucking Industry Pension Fund as Lead Plaintiff for the consolidated action. On July 13, 2012, thelead plaintiff filed an amended complaint asserting claims under Sections 11 and 12(a)(2) of the Securities Act of1933 against the Company, certain members of the board of directors, and certain underwriters in the offering. Itfurther asserts a claim under Section 15 of the Securities Act of 1933 against the same members of the board ofdirectors and Hercules Holdings II, LLC, a majority shareholder of the Company at the time of the initial publicoffering. The consolidated complaint alleges deficiencies in the Company’s disclosures in the RegistrationStatement and Prospectus relating to: (1) the accounting for the Company’s 2006 recapitalization and 2010reorganization; (2) the Company’s failure to maintain effective internal controls relating to its accounting forsuch transactions; and (3) the Company’s Medicare and Medicaid revenue growth rates. The Company and otherdefendants moved to dismiss the amended complaint on September 11, 2012. The Court granted the motion inpart on May 28, 2013. The action is proceeding to discovery on the remaining claims.
52
In addition to the above described shareholder class actions, on December 8, 2011, a federal shareholderderivative action, Sutton v. Bracken, et al., putatively initiated in the name of the Company, was filed in theUnited States District Court for the Middle District of Tennessee against certain officers and present and formerdirectors of the Company seeking monetary relief. The action alleges breaches of fiduciary duties by the namedofficers and directors in connection with the accounting and earnings claims set forth in the shareholder classactions. Setting forth substantially similar claims against substantially the same defendants, an additional federalderivative action, Schroeder v. Bracken, et al., was filed in the United States District Court for the MiddleDistrict of Tennessee on December 16, 2011, and a state derivative action, Bagot v. Bracken, et al., was filed inTennessee state court in the Davidson County Circuit Court on December 20, 2011. The federal derivativeactions were consolidated in the Middle District of Tennessee and stayed pending developments in theshareholder class actions. The state derivative action had also been stayed pending developments in theshareholder class actions, but that stay has expired. The plaintiff in the state derivative action subsequently filedan amended complaint on September 9, 2013 that added additional allegations made in the shareholder classactions. On September 24, 2013, an additional state derivative action, Steinberg v. Bracken, et al., was filed inTennessee state court in the Davidson County Circuit Court. This action against our board of directors has beenconsolidated with the earlier filed state derivative action. The plaintiffs in the consolidated action filed aconsolidated complaint on December 4, 2013. The Company has filed a motion to again stay the state derivativeaction pending developments in the class action, but the Court has not yet acted on that motion.
Health Midwest Litigation
In October 2009, the Health Care Foundation of Greater Kansas City, a nonprofit health foundation, filedsuit against HCA Inc. in the Circuit Court of Jackson County, Missouri and alleged that HCA did not fund thelevel of capital expenditures and uncompensated care agreed to in connection with HCA’s purchase of hospitalsfrom Health Midwest in 2003. The central issue in the case was whether HCA’s construction of new hospitalscounted towards its $450 million five-year capital commitments. In addition, the plaintiff alleged that HCA didnot make its required capital expenditures in a timely fashion. On January 24, 2013, the Court ruled in favor ofthe plaintiff and awarded at least $162 million. The Court also ordered a court-supervised accounting of HCA’scapital expenditures, as well as of expenditures on charity and uncompensated care during the ten years followingthe purchase. Should the accounting fail to satisfy the Court concerning HCA’s compliance with its capital andcharity care commitments, the amount of the judgment award could substantially increase. The Court alsoindicated it would award plaintiff attorneys fees, which the parties have stipulated are about $12 million. HCArecorded $175 million of legal claim costs in the fourth quarter of 2012 related to this ruling. The accounting forHCA’s capital expenditures and charity and uncompensated care is ongoing and will likely not be concludedbefore the fourth quarter of 2014. HCA plans to appeal the trial court’s ruling on the breach of contract claim andorder for the accounting once the trial court rules on the accounting and enters final judgment.
General Liability and Other Claims
We are subject to claims for additional income taxes and related interest.
We are also subject to claims and suits arising in the ordinary course of business, including claims forpersonal injuries or for wrongful restriction of, or interference with, physicians’ staff privileges. In certain ofthese actions the claimants have asked for punitive damages against us, which may not be covered by insurance.In the opinion of management, the ultimate resolution of these pending claims and legal proceedings will nothave a material, adverse effect on our results of operations or financial position.
Item 4. Mine Safety Disclosures
None.
53
PART II
Item 5. Market for Registrant’s Common Equity, Related Stockholder Matters and Issuer Purchases ofEquity Securities
See Item 7, “Management’s Discussion and Analysis of Financial Condition and Results of Operations —Liquidity and Capital Resources — Financing Activities” for a description of the restrictions on our ability to paydividends.
During March 2011, we completed the initial public offering of 87,719,300 shares of our common stock.Our first day of trading was March 10, 2011. During September 2011, we repurchased 80,771,143 shares of ourcommon stock, beneficially owned by affiliates of Bank of America Corporation, at a purchase price of $18.61per share. The shares repurchased represented approximately 15.6% of our total shares outstanding at the time ofthe repurchase. During November 2013, we repurchased 10,656,436 shares of our common stock at a price of$46.92 per share. Our common stock is traded on the New York Stock Exchange (the “NYSE”) (symbol“HCA”).
During 2012, our Board of Directors declared three distributions to the Company’s stockholders and holdersof certain vested share-based awards. The distributions totaled $6.50 per share and vested share-based award(subject to limitations for certain awards), or $3.142 billion in the aggregate. Pursuant to the terms of our share-based award plans, the holders of nonvested stock options and SARs received $6.50 per share reductions to theexercise price of the applicable share-based awards (subject to certain limitations for certain share-based awardsthat resulted in deferred distributions for a portion of the declared distribution, which will be paid upon thevesting of the applicable share-based award). The holders of nonvested RSUs will be paid the applicabledistribution amounts upon the vesting of the applicable RSUs. There were no distributions declared during 2013.
The table below sets forth, for the calendar quarters indicated, the high and low sales prices per sharereported on the NYSE for our common stock.
Sales Price
High Low
2013First Quarter . . . . . . . . . . . . . . . . . . . . . . . . . . . . . . . $ 40.92 $ 30.65Second Quarter . . . . . . . . . . . . . . . . . . . . . . . . . . . . . 41.83 35.40Third Quarter . . . . . . . . . . . . . . . . . . . . . . . . . . . . . . . 43.11 35.20Fourth Quarter . . . . . . . . . . . . . . . . . . . . . . . . . . . . . . 49.52 42.60
2012First Quarter . . . . . . . . . . . . . . . . . . . . . . . . . . . . . . . $ 29.30 $ 20.33Second Quarter . . . . . . . . . . . . . . . . . . . . . . . . . . . . . 31.39 24.09Third Quarter . . . . . . . . . . . . . . . . . . . . . . . . . . . . . . . 33.55 23.91Fourth Quarter . . . . . . . . . . . . . . . . . . . . . . . . . . . . . . 34.32 27.92
At the close of business on January 31, 2014, there were approximately 270 holders of record of ourcommon stock.
54
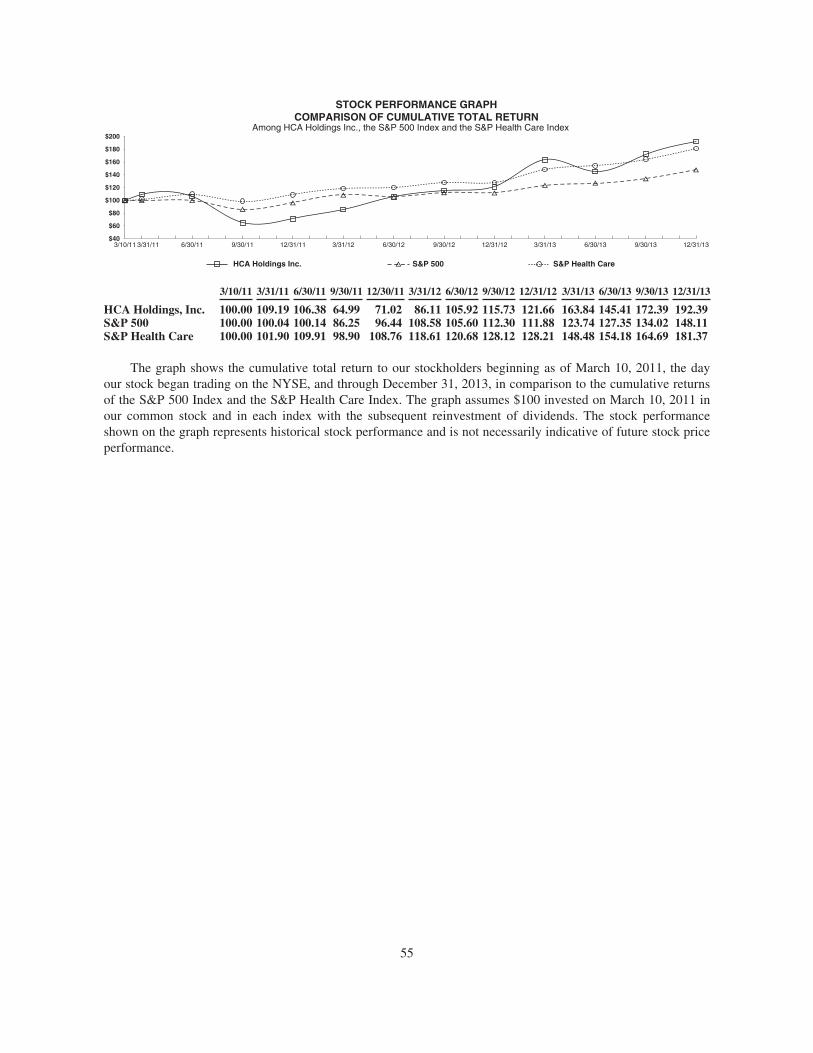
3/10/11 3/31/11 6/30/11 9/30/11 3/31/13 6/30/13 9/30/1312/31/11 3/31/12 6/30/12 9/30/12 12/31/1312/31/12$40
$60
$80
$100
$120
$140
$160
$180
$200
HCA Holdings Inc. S&P 500 S&P Health Care
STOCK PERFORMANCE GRAPHCOMPARISON OF CUMULATIVE TOTAL RETURN
Among HCA Holdings Inc., the S&P 500 Index and the S&P Health Care Index
3/10/11 3/31/11 6/30/11 9/30/11 12/30/11 3/31/12 6/30/12 9/30/12 12/31/12 3/31/13 6/30/13 9/30/13 12/31/13
HCA Holdings, Inc. 100.00 109.19 106.38 64.99 71.02 86.11 105.92 115.73 121.66 163.84 145.41 172.39 192.39S&P 500 100.00 100.04 100.14 86.25 96.44 108.58 105.60 112.30 111.88 123.74 127.35 134.02 148.11S&P Health Care 100.00 101.90 109.91 98.90 108.76 118.61 120.68 128.12 128.21 148.48 154.18 164.69 181.37
The graph shows the cumulative total return to our stockholders beginning as of March 10, 2011, the dayour stock began trading on the NYSE, and through December 31, 2013, in comparison to the cumulative returnsof the S&P 500 Index and the S&P Health Care Index. The graph assumes $100 invested on March 10, 2011 inour common stock and in each index with the subsequent reinvestment of dividends. The stock performanceshown on the graph represents historical stock performance and is not necessarily indicative of future stock priceperformance.
55
Item 6. Selected Financial Data
HCA HOLDINGS, INC.SELECTED FINANCIAL DATA
AS OF AND FOR THE YEARS ENDED DECEMBER 31(Dollars in millions, except per share amounts)
2013 2012 2011 2010 2009
Summary of Operations:Revenues before provision for doubtful accounts . . . . . . . $38,040 $36,783 $32,506 $ 30,683 $30,052Provision for doubtful accounts . . . . . . . . . . . . . . . . . . . . . 3,858 3,770 2,824 2,648 3,276
Revenues . . . . . . . . . . . . . . . . . . . . . . . . . . . . . . . . . . . . . . . 34,182 33,013 29,682 28,035 26,776
Salaries and benefits . . . . . . . . . . . . . . . . . . . . . . . . . . . . . . 15,646 15,089 13,440 12,484 11,958Supplies . . . . . . . . . . . . . . . . . . . . . . . . . . . . . . . . . . . . . . . . 5,970 5,717 5,179 4,961 4,868Other operating expenses . . . . . . . . . . . . . . . . . . . . . . . . . . 6,237 6,048 5,470 5,004 4,724Electronic health record incentive income . . . . . . . . . . . . . (216) (336) (210) — —Equity in earnings of affiliates . . . . . . . . . . . . . . . . . . . . . . (29) (36) (258) (282) (246)Depreciation and amortization . . . . . . . . . . . . . . . . . . . . . . 1,753 1,679 1,465 1,421 1,425Interest expense . . . . . . . . . . . . . . . . . . . . . . . . . . . . . . . . . . 1,848 1,798 2,037 2,097 1,987Losses (gains) on sales of facilities . . . . . . . . . . . . . . . . . . . 10 (15) (142) (4) 15Losses on retirement of debt . . . . . . . . . . . . . . . . . . . . . . . . 17 — 481 — —Legal claim costs . . . . . . . . . . . . . . . . . . . . . . . . . . . . . . . . . — 175 — — —Gain on acquisition of controlling interest in equity
investment . . . . . . . . . . . . . . . . . . . . . . . . . . . . . . . . . . . . — — (1,522) — —Impairments of long-lived assets . . . . . . . . . . . . . . . . . . . . — — — 123 43Termination of management agreement . . . . . . . . . . . . . . . — — 181 — —
31,236 30,119 26,121 25,804 24,774
Income before income taxes . . . . . . . . . . . . . . . . . . . . . . . . 2,946 2,894 3,561 2,231 2,002Provision for income taxes . . . . . . . . . . . . . . . . . . . . . . . . . 950 888 719 658 627
Net income . . . . . . . . . . . . . . . . . . . . . . . . . . . . . . . . . . . . . 1,996 2,006 2,842 1,573 1,375Net income attributable to noncontrolling interests . . . . . . 440 401 377 366 321
Net income attributable to HCA Holdings, Inc. . . . . . $ 1,556 $ 1,605 $ 2,465 $ 1,207 $ 1,054
Per common share data:Basic earnings per share . . . . . . . . . . . . . . . . . . . . . . . . . . . $ 3.50 $ 3.65 $ 5.17 $ 2.83 $ 2.48Diluted earnings per share . . . . . . . . . . . . . . . . . . . . . . . . . $ 3.37 $ 3.49 $ 4.97 $ 2.76 $ 2.44Cash dividends declared per share . . . . . . . . . . . . . . . . . . . $ — $ 6.50 $ — $ 9.43 $ —
Financial Position:Assets . . . . . . . . . . . . . . . . . . . . . . . . . . . . . . . . . . . . . . . . . $28,831 $28,075 $26,898 $ 23,852 $24,131Working capital . . . . . . . . . . . . . . . . . . . . . . . . . . . . . . . . . . 2,342 1,591 1,679 2,650 2,264Long-term debt, including amounts due within one
year . . . . . . . . . . . . . . . . . . . . . . . . . . . . . . . . . . . . . . . . . 28,376 28,930 27,052 28,225 25,670Equity securities with contingent redemption rights . . . . . — — — 141 147Noncontrolling interests . . . . . . . . . . . . . . . . . . . . . . . . . . . 1,342 1,319 1,244 1,132 1,008Stockholders’ deficit . . . . . . . . . . . . . . . . . . . . . . . . . . . . . . (6,928) (8,341) (7,014) (10,794) (7,978)
Cash Flow Data:Cash provided by operating activities . . . . . . . . . . . . . . . . . $ 3,680 $ 4,175 $ 3,933 $ 3,085 $ 2,747Cash used in investing activities . . . . . . . . . . . . . . . . . . . . . (2,346) (2,063) (2,995) (1,039) (1,035)Capital expenditures . . . . . . . . . . . . . . . . . . . . . . . . . . . . . . (1,943) (1,862) (1,679) (1,325) (1,317)Cash used in financing activities . . . . . . . . . . . . . . . . . . . . (1,625) (1,780) (976) (1,947) (1,865)
56
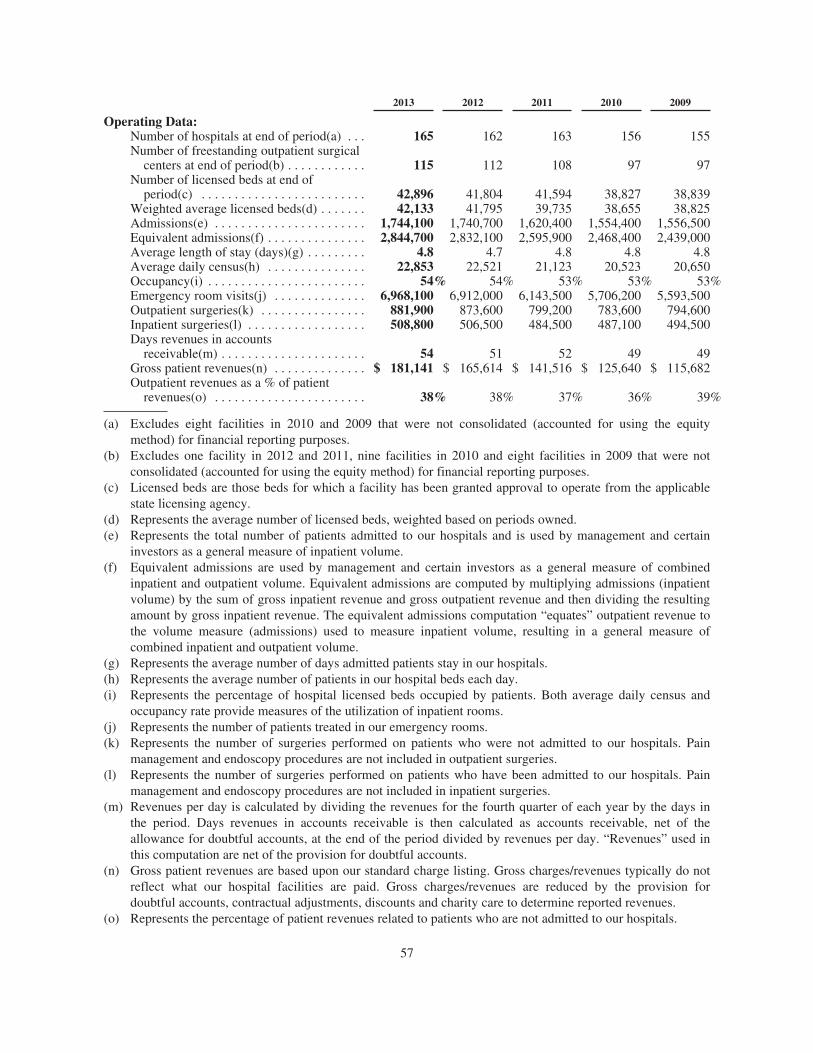
2013 2012 2011 2010 2009
Operating Data:Number of hospitals at end of period(a) . . . 165 162 163 156 155Number of freestanding outpatient surgical
centers at end of period(b) . . . . . . . . . . . . 115 112 108 97 97Number of licensed beds at end of
period(c) . . . . . . . . . . . . . . . . . . . . . . . . . 42,896 41,804 41,594 38,827 38,839Weighted average licensed beds(d) . . . . . . . 42,133 41,795 39,735 38,655 38,825Admissions(e) . . . . . . . . . . . . . . . . . . . . . . . 1,744,100 1,740,700 1,620,400 1,554,400 1,556,500Equivalent admissions(f) . . . . . . . . . . . . . . . 2,844,700 2,832,100 2,595,900 2,468,400 2,439,000Average length of stay (days)(g) . . . . . . . . . 4.8 4.7 4.8 4.8 4.8Average daily census(h) . . . . . . . . . . . . . . . 22,853 22,521 21,123 20,523 20,650Occupancy(i) . . . . . . . . . . . . . . . . . . . . . . . . 54% 54% 53% 53% 53%Emergency room visits(j) . . . . . . . . . . . . . . 6,968,100 6,912,000 6,143,500 5,706,200 5,593,500Outpatient surgeries(k) . . . . . . . . . . . . . . . . 881,900 873,600 799,200 783,600 794,600Inpatient surgeries(l) . . . . . . . . . . . . . . . . . . 508,800 506,500 484,500 487,100 494,500Days revenues in accounts
receivable(m) . . . . . . . . . . . . . . . . . . . . . . 54 51 52 49 49Gross patient revenues(n) . . . . . . . . . . . . . . $ 181,141 $ 165,614 $ 141,516 $ 125,640 $ 115,682Outpatient revenues as a % of patient
revenues(o) . . . . . . . . . . . . . . . . . . . . . . . 38% 38% 37% 36% 39%
(a) Excludes eight facilities in 2010 and 2009 that were not consolidated (accounted for using the equitymethod) for financial reporting purposes.
(b) Excludes one facility in 2012 and 2011, nine facilities in 2010 and eight facilities in 2009 that were notconsolidated (accounted for using the equity method) for financial reporting purposes.
(c) Licensed beds are those beds for which a facility has been granted approval to operate from the applicablestate licensing agency.
(d) Represents the average number of licensed beds, weighted based on periods owned.(e) Represents the total number of patients admitted to our hospitals and is used by management and certain
investors as a general measure of inpatient volume.(f) Equivalent admissions are used by management and certain investors as a general measure of combined
inpatient and outpatient volume. Equivalent admissions are computed by multiplying admissions (inpatientvolume) by the sum of gross inpatient revenue and gross outpatient revenue and then dividing the resultingamount by gross inpatient revenue. The equivalent admissions computation “equates” outpatient revenue tothe volume measure (admissions) used to measure inpatient volume, resulting in a general measure ofcombined inpatient and outpatient volume.
(g) Represents the average number of days admitted patients stay in our hospitals.(h) Represents the average number of patients in our hospital beds each day.(i) Represents the percentage of hospital licensed beds occupied by patients. Both average daily census and
occupancy rate provide measures of the utilization of inpatient rooms.(j) Represents the number of patients treated in our emergency rooms.(k) Represents the number of surgeries performed on patients who were not admitted to our hospitals. Pain
management and endoscopy procedures are not included in outpatient surgeries.(l) Represents the number of surgeries performed on patients who have been admitted to our hospitals. Pain
management and endoscopy procedures are not included in inpatient surgeries.(m) Revenues per day is calculated by dividing the revenues for the fourth quarter of each year by the days in
the period. Days revenues in accounts receivable is then calculated as accounts receivable, net of theallowance for doubtful accounts, at the end of the period divided by revenues per day. “Revenues” used inthis computation are net of the provision for doubtful accounts.
(n) Gross patient revenues are based upon our standard charge listing. Gross charges/revenues typically do notreflect what our hospital facilities are paid. Gross charges/revenues are reduced by the provision fordoubtful accounts, contractual adjustments, discounts and charity care to determine reported revenues.
(o) Represents the percentage of patient revenues related to patients who are not admitted to our hospitals.
57
HCA HOLDINGS, INC.
MANAGEMENT’S DISCUSSION AND ANALYSIS OF FINANCIAL CONDITIONAND RESULTS OF OPERATIONS
Item 7. Management’s Discussion and Analysis of Financial Condition and Results of Operations
The selected financial data and the accompanying consolidated financial statements present certaininformation with respect to the financial position, results of operations and cash flows of HCA Holdings, Inc.which should be read in conjunction with the following discussion and analysis. The terms “HCA,” “Company,”“we,” “our,” or “us,” as used herein, refer HCA Inc. and our affiliates prior to the Corporate Reorganization andto HCA Holdings, Inc. and our affiliates after the Corporate Reorganization unless otherwise stated or indicatedby context. The term “affiliates” means direct and indirect subsidiaries of HCA Holdings, Inc. and partnershipsand joint ventures in which such subsidiaries are partners.
Forward-Looking Statements
This annual report on Form 10-K includes certain disclosures which contain “forward-looking statements.”Forward-looking statements include statements regarding estimated EHR incentive income and related EHRoperating expenses, expected capital expenditures and expected net claim payments and all other statements thatdo not relate solely to historical or current facts, and can be identified by the use of words like “may,” “believe,”“will,” “expect,” “project,” “estimate,” “anticipate,” “plan,” “initiative” or “continue.” These forward-lookingstatements are based on our current plans and expectations and are subject to a number of known and unknownuncertainties and risks, many of which are beyond our control, which could significantly affect current plans andexpectations and our future financial position and results of operations. These factors include, but are not limitedto, (1) the impact of our substantial indebtedness and the ability to refinance such indebtedness on acceptableterms, (2) the effects related to the implementation of the Patient Protection and Affordable Care Act, asamended by the Health Care and Education Reconciliation Act (collectively, the “Health Reform Law”), possibledelays in or complications related to implementation of the Health Reform Law, the possible enactment ofadditional federal or state health care reforms and possible changes to the Health Reform Law and other federal,state or local laws or regulations affecting the health care industry, (3) the effects related to the continuedimplementation of the sequestration spending reductions required under the Budget Control Act of 2011 (the“BCA”) and the potential for future deficit reduction legislation that may alter BCA-mandated spendingreductions, which include cuts to Medicare payments, or create additional spending reductions, (4) increases inthe amount and risk of collectability of uninsured accounts and deductibles and copayment amounts for insuredaccounts, (5) the ability to achieve operating and financial targets, and attain expected levels of patient volumesand control the costs of providing services, (6) possible changes in the Medicare, Medicaid and other stateprograms, including Medicaid upper payment limit (“UPL”) programs or Waiver Programs, that may impactreimbursements to health care providers and insurers, (7) the highly competitive nature of the health carebusiness, (8) changes in service mix, revenue mix and surgical volumes, including potential declines in thepopulation covered under managed care agreements, the ability to enter into and renew managed care provideragreements on acceptable terms and the impact of consumer driven health plans and physician utilization trendsand practices, (9) the efforts of insurers, health care providers and others to contain health care costs, (10) theoutcome of our continuing efforts to monitor, maintain and comply with appropriate laws, regulations, policiesand procedures, (11) increases in wages and the ability to attract and retain qualified management and personnel,including affiliated physicians, nurses and medical and technical support personnel, (12) the availability andterms of capital to fund the expansion of our business and improvements to our existing facilities, (13) changes inaccounting practices, (14) changes in general economic conditions nationally and regionally in our markets,(15) future divestitures which may result in charges and possible impairments of long-lived assets, (16) changesin business strategy or development plans, (17) delays in receiving payments for services provided, (18) theoutcome of pending and any future tax audits, appeals and litigation associated with our tax positions,(19) potential adverse impact of known and unknown government investigations, litigation and other claims thatmay be made against us, (20) our ongoing ability to demonstrate meaningful use of certified EHR technology and
58
HCA HOLDINGS, INC.
MANAGEMENT’S DISCUSSION AND ANALYSIS OF FINANCIAL CONDITIONAND RESULTS OF OPERATIONS (continued)
Forward-Looking Statements (continued)
recognize income for the related Medicare or Medicaid incentive payments, and (21) other risk factors describedin this annual report on Form 10-K. As a consequence, current plans, anticipated actions and future financialposition and results of operations may differ from those expressed in any forward-looking statements made by oron behalf of HCA. You are cautioned not to unduly rely on such forward-looking statements when evaluating theinformation presented in this report.
2013 Operations Summary
Net income attributable to HCA Holdings, Inc. totaled $1.556 billion, or $3.37 per diluted share, for 2013,compared to $1.605 billion, or $3.49 per diluted share, for 2012. The 2013 results include net losses on sales offacilities of $10 million (pretax), or $0.02 per diluted share, and a loss on retirement of debt of $17 million(pretax), or $0.02 per diluted share. The 2012 results include legal claim costs of $175 million (pretax), or $0.24per diluted share, and net gains on sales of facilities of $15 million (pretax), or $0.02 per diluted share. All “perdiluted share” disclosures are based upon amounts net of the applicable income taxes. Shares used for dilutedearnings per share were 461.913 million shares and 459.403 million shares for the years ended December 31,2013 and 2012, respectively.
Revenues increased to $34.182 billion for 2013 from $33.013 billion for 2012. Revenues increased 3.5%and 3.1%, respectively, on a consolidated basis and on a same facility basis for 2013, compared to 2012. Theconsolidated revenues increase can be primarily attributed to the combined impact of a 3.1% increase in revenueper equivalent admission and a 0.4% increase in equivalent admissions. The same facility revenues increaseresulted primarily from a 3.0% increase in same facility revenue per equivalent admission and a 0.1% increase insame facility equivalent admissions.
During 2013, consolidated admissions increased 0.2% and same facility admissions increased 0.1%,compared to 2012. Inpatient surgical volumes increased 0.5% on a consolidated basis and increased 0.3% on asame facility basis during 2013, compared to 2012. Outpatient surgical volumes increased 0.9% on aconsolidated basis and declined 0.5% on a same facility basis during 2013, compared to 2012. Emergency roomvisits increased 0.8% on a consolidated basis and increased 0.7% on a same facility basis during 2013, comparedto 2012.
For 2013, the provision for doubtful accounts increased $88 million, compared to 2012. The self-payrevenue deductions for charity care and uninsured discounts increased $404 million and $1.232 billion,respectively, for 2013, compared to 2012. The sum of the provision for doubtful accounts, uninsured discountsand charity care, as a percentage of the sum of revenues, the provision for doubtful accounts, uninsured discountsand charity care, was 31.3% for 2013, compared to 29.5% for 2012. Same facility uninsured admissionsincreased 7.6% and same facility uninsured emergency room visits increased 2.2% for 2013, compared to 2012.
Interest expense totaled $1.848 billion for 2013, compared to $1.798 billion for 2012. The $50 millionincrease in interest expense for 2013 was due primarily to an increase in the average debt balance.
Cash flows from operating activities declined $495 million, from $4.175 billion for 2012 to $3.680 billionfor 2013. The decline in cash flows from operating activities was primarily related to net negative changes inworking capital items of $521 million.
59
HCA HOLDINGS, INC.
MANAGEMENT’S DISCUSSION AND ANALYSIS OF FINANCIAL CONDITIONAND RESULTS OF OPERATIONS (continued)
Business Strategy
We are committed to providing the communities we serve with high quality, cost-effective health care whilegrowing our business, increasing our profitability and creating long-term value for our stockholders. To achievethese objectives, we align our efforts around the following growth agenda:
Grow Our Presence in Existing Markets. We believe we are well positioned in a number of large andgrowing markets that will allow us the opportunity to generate long-term, attractive growth through theexpansion of our presence in these markets. We plan to continue recruiting and strategically collaborating withthe physician community and adding attractive service lines such as cardiology, emergency services, oncologyand women’s services. Additional components of our growth strategy include expanding our footprint throughdeveloping various outpatient access points, including surgery centers, rural outreach, freestanding emergencydepartments and walk-in clinics.
Achieve Industry-Leading Performance in Clinical and Satisfaction Measures. Achieving high levels ofpatient safety, patient satisfaction and clinical quality are central goals of our business model. To achieve thesegoals, we have implemented a number of initiatives including infection reduction initiatives, hospitalistprograms, advanced health information technology and evidence-based medicine programs. We routinely analyzeoperational practices from our best-performing hospitals to identify ways to implement organization-wideperformance improvements and reduce clinical variation. We believe these initiatives will continue to improvepatient care, help us achieve cost efficiencies, grow our revenues and favorably position us in an environmentwhere our constituents are increasingly focused on quality, efficacy and efficiency.
Recruit and Employ Physicians to Meet Need for High Quality Health Services. We depend on the qualityand dedication of the health care providers and other team members who serve at our facilities. We believe acritical component of our growth strategy is our ability to successfully recruit and strategically collaborate withphysicians and other professionals to provide high quality care. We attract and retain physicians by providinghigh quality, convenient facilities with advanced technology, by expanding our specialty services and by buildingour outpatient operations. We believe our continued investment in the employment, recruitment and retention ofphysicians will improve the quality of care at our facilities.
Continue to Leverage Our Scale and Market Positions to Enhance Profitability. We believe there issignificant opportunity to continue to grow the profitability of our company by fully leveraging the scale andscope of our franchise. We are currently pursuing next generation performance improvement initiatives such ascontracting for services on a multistate basis and expanding our support infrastructure for additional clinical andsupport functions, such as physician credentialing, medical transcription and electronic medical recordkeeping.We believe our centrally managed business processes and ability to leverage cost-saving practices across ourextensive network will enable us to continue to manage costs effectively. We continue to invest in our Parallonsubsidiary group to leverage key components of our support infrastructure, including revenue cycle management,health care group purchasing, supply chain management and staffing functions and are offering these services toother hospital companies.
Selectively Pursue a Disciplined Development Strategy. We continue to believe there are significant growthopportunities in our markets. We will continue to provide financial and operational resources to analyze anddevelop our in-market opportunities. To complement our in-market growth agenda, we intend to focus onselectively developing and acquiring new hospitals, outpatient facilities and other health care service providers.We believe the challenges faced by the hospital industry may spur consolidation and we believe our size, scale,national presence and access to capital will position us well to participate in any such consolidation. We have a
60
HCA HOLDINGS, INC.
MANAGEMENT’S DISCUSSION AND ANALYSIS OF FINANCIAL CONDITIONAND RESULTS OF OPERATIONS (continued)
Business Strategy (continued)
strong record of successfully acquiring and integrating hospitals and entering into joint ventures and intend tocontinue leveraging this experience.
Critical Accounting Policies and Estimates
The preparation of our consolidated financial statements requires management to make estimates andassumptions that affect the reported amounts of assets and liabilities, the disclosure of contingent liabilities andthe reported amounts of revenues and expenses. Our estimates are based on historical experience and variousother assumptions we believe are reasonable under the circumstances. We evaluate our estimates on an ongoingbasis and make changes to the estimates and related disclosures as experience develops or new informationbecomes known. Actual results may differ from these estimates.
We believe the following critical accounting policies affect our more significant judgments and estimatesused in the preparation of our consolidated financial statements.
Revenues
Revenues are recorded during the period the health care services are provided, based upon the estimatedamounts due from payers. Estimates of contractual allowances under managed care health plans are based uponthe payment terms specified in the related contractual agreements. Laws and regulations governing the Medicareand Medicaid programs are complex and subject to interpretation. The estimated reimbursement amounts aremade on a payer-specific basis and are recorded based on the best information available regarding management’sinterpretation of the applicable laws, regulations and contract terms. Management continually reviews thecontractual estimation process to consider and incorporate updates to laws and regulations and the frequentchanges in managed care contractual terms resulting from contract renegotiations and renewals. We haveinvested significant resources to refine and improve our computerized billing systems and the information systemdata used to make contractual allowance estimates. We have developed standardized calculation processes andrelated training programs to improve the utility of our patient accounting systems.
The Emergency Medical Treatment and Labor Act (“EMTALA”) requires any hospital participating in theMedicare program to conduct an appropriate medical screening examination of every person who presents to thehospital’s emergency room for treatment and, if the individual is suffering from an emergency medical condition,to either stabilize the condition or make an appropriate transfer of the individual to a facility able to handle thecondition. The obligation to screen and stabilize emergency medical conditions exists regardless of anindividual’s ability to pay for treatment. Federal and state laws and regulations, including but not limited toEMTALA, require, and our commitment to providing quality patient care encourages, the provision of services topatients who are financially unable to pay for the health care services they receive. The Health Reform Lawrequires health plans to reimburse hospitals for emergency services provided to enrollees without priorauthorization and without regard to whether a participating provider contract is in place. Further, the HealthReform Law contains provisions that seek to decrease the number of uninsured individuals, includingrequirements or incentives, which become effective during 2014, for individuals to obtain, and large employersto provide, insurance coverage. These mandates may reduce the financial impact of screening for and stabilizingemergency medical conditions. However, many factors are unknown regarding the impact of the Health ReformLaw, including how many previously uninsured individuals will obtain coverage as a result of the law, thechange, if any, in the volume of inpatient and outpatient hospital services that are sought by and provided topreviously uninsured individuals and overall changes in the payer mix.
61
HCA HOLDINGS, INC.
MANAGEMENT’S DISCUSSION AND ANALYSIS OF FINANCIAL CONDITIONAND RESULTS OF OPERATIONS (continued)
Critical Accounting Policies and Estimates (continued)
Revenues (continued)
We do not pursue collection of amounts related to patients who meet our guidelines to qualify as charity care;therefore, they are not reported in revenues. Patients treated at our hospitals for nonelective care, who have incomeat or below 200% of the federal poverty level, are eligible for charity care. The federal poverty level is establishedby the federal government and is based on income and family size. We provide discounts from our gross charges touninsured patients who do not qualify for Medicaid or charity care. These discounts are similar to those provided tomany local managed care plans. After the discounts are applied, we are still unable to collect a significant portion ofuninsured patients’ accounts, and we record significant provisions for doubtful accounts (based upon our historicalcollection experience) related to uninsured patients in the period the services are provided.
Due to the complexities involved in the classification and documentation of health care services authorizedand provided, the estimation of revenues earned and the related reimbursement are often subject to interpretationsthat could result in payments that are different from our estimates. Adjustments to estimated Medicare andMedicaid reimbursement amounts and disproportionate-share funds, which resulted in net increases to revenues,related primarily to cost reports filed during the respective year were $41 million, $50 million and $40 million in2013, 2012 and 2011, respectively. The adjustments to estimated reimbursement amounts, which resulted in netincreases to revenues, related primarily to cost reports filed during previous years were $68 million, $242 millionand $30 million in 2013, 2012 and 2011, respectively. The 2012 amount related to cost reports filed duringprevious years includes two adjustments to Medicare revenues that affected multiple annual cost report periodsfor the majority of our hospitals (the Rural Floor Provision Settlement which increased revenues byapproximately $271 million and the implementation of revised Supplemental Security Income (“SSI”) ratioswhich reduced revenues by approximately $75 million). Excluding the effect of these Medicare adjustments, the2012 amount related to previous years would have been $46 million. We expect adjustments during the next12 months related to Medicare and Medicaid cost report filings and settlements and disproportionate-share fundswill result in increases to revenues within generally similar ranges.
Provision for Doubtful Accounts and the Allowance for Doubtful Accounts
The collection of outstanding receivables from Medicare, managed care payers, other third-party payers andpatients is our primary source of cash and is critical to our operating performance. The primary collection risksrelate to uninsured patient accounts, including patient accounts for which the primary insurance carrier has paidthe amounts covered by the applicable agreement, but patient responsibility amounts (deductibles andcopayments) remain outstanding. The provision for doubtful accounts and the allowance for doubtful accountsrelate primarily to amounts due directly from patients. An estimated allowance for doubtful accounts is recordedfor all uninsured accounts, regardless of the aging of those accounts. Accounts are written off when allreasonable internal and external collection efforts have been performed. Our collection policies include a reviewof all accounts against certain standard collection criteria, upon completion of our primary internal collectionefforts. Accounts determined to possess positive collectibility attributes are forwarded to a secondary internal orexternal collection agency and the other accounts are written off. The accounts that are not collected by thesecondary collection agency are written off when secondary collection efforts are completed (usually within12 months). Writeoffs are based upon specific identification and the writeoff process requires a writeoffadjustment entry to the patient accounting system. We do not pursue collection of amounts related to patients thatmeet our guidelines to qualify as charity care.
The amount of the provision for doubtful accounts is based upon management’s assessment of historicalwriteoffs and expected net collections, business and economic conditions, trends in federal, state, and private
62
HCA HOLDINGS, INC.
MANAGEMENT’S DISCUSSION AND ANALYSIS OF FINANCIAL CONDITIONAND RESULTS OF OPERATIONS (continued)
Critical Accounting Policies and Estimates (continued)
Provision for Doubtful Accounts and the Allowance for Doubtful Accounts (continued)
employer health care coverage and other collection indicators. Management relies on the results of detailedreviews of historical writeoffs and recoveries at facilities that represent a majority of our revenues and accountsreceivable (the “hindsight analysis”) as a primary source of information in estimating the collectibility of ouraccounts receivable. We perform the hindsight analysis quarterly, utilizing rolling twelve-months accountsreceivable collection and writeoff data. We believe our quarterly updates to the estimated allowance for doubtfulaccounts at each of our hospital facilities provide reasonable valuations of our accounts receivable. Theseroutine, quarterly changes in estimates have not resulted in material adjustments to our allowance for doubtfulaccounts, provision for doubtful accounts or period-to-period comparisons of our results of operations. At bothDecember 31, 2013 and 2012, the allowance for doubtful accounts represented approximately 93%, of the$5.927 billion and $5.228 billion, respectively, patient due accounts receivable balance. The patient due accountsreceivable balance represents the estimated uninsured portion of our accounts receivable. The estimateduninsured portion of Medicaid pending and uninsured discount pending accounts is included in our patient dueaccounts receivable balance.
To quantify the total impact of and trends related to uninsured accounts, we believe it is beneficial to viewthe revenue deductions related to uninsured accounts (charity care and uninsured discounts) and provision fordoubtful accounts in combination, rather than each separately. A summary of these amounts for the years endedDecember 31, follows (dollars in millions):
2013 2012 2011
Charity care . . . . . . . . . . . . . . . . . . . . . . . . . . . . . . . . . . . . $ 3,497 $ 3,093 $ 2,683Uninsured discounts . . . . . . . . . . . . . . . . . . . . . . . . . . . . . . 8,210 6,978 5,707Provision for doubtful accounts . . . . . . . . . . . . . . . . . . . . . 3,858 3,770 2,824
Totals . . . . . . . . . . . . . . . . . . . . . . . . . . . . . . . . . . . . . $15,565 $13,841 $11,214
The sum of the provision for doubtful accounts, uninsured discounts and charity care, as a percentage of thesum of revenues, the provision for doubtful accounts, uninsured discounts and charity care increased from 27.4%for 2011, to 29.5% for 2012 and to 31.3% for 2013.
Days revenues in accounts receivable were 54 days, 51 days and 52 days at December 31, 2013, 2012 and2011, respectively. Management expects a continuation of the challenges related to the collection of the patientdue accounts. Adverse changes in the percentage of our patients having adequate health care coverage, generaleconomic conditions, patient accounting service center operations, payer mix, or trends in federal, state, andprivate employer health care coverage could affect the collection of accounts receivable, cash flows and resultsof operations.
63
HCA HOLDINGS, INC.
MANAGEMENT’S DISCUSSION AND ANALYSIS OF FINANCIAL CONDITIONAND RESULTS OF OPERATIONS (continued)
Critical Accounting Policies and Estimates (continued)
Provision for Doubtful Accounts and the Allowance for Doubtful Accounts (continued)
The approximate breakdown of accounts receivable by payer classification as of December 31, 2013 and2012 is set forth in the following table:
% of Accounts Receivable
Under 91 Days 91 — 180 Days Over 180 Days
Accounts receivable aging at December 31, 2013:Medicare and Medicaid . . . . . . . . . . . . . . . . . . . . 12% 2% 1%Managed care and other insurers . . . . . . . . . . . . . 21 4 5Uninsured . . . . . . . . . . . . . . . . . . . . . . . . . . . . . . . 20 8 27
Total . . . . . . . . . . . . . . . . . . . . . . . . . . . . . . . 53% 14% 33%
Accounts receivable aging at December 31, 2012:Medicare and Medicaid . . . . . . . . . . . . . . . . . . . . 13% 1% 1%Managed care and other insurers . . . . . . . . . . . . . 22 4 4Uninsured . . . . . . . . . . . . . . . . . . . . . . . . . . . . . . . 18 9 28
Total . . . . . . . . . . . . . . . . . . . . . . . . . . . . . . . 53% 14% 33%
Professional Liability Claims
We, along with virtually all health care providers, operate in an environment with professional liabilityrisks. Our facilities are insured by our 100% owned insurance subsidiary for losses up to $50 million peroccurrence, subject to a $5 million per occurrence self-insured retention. We purchase excess insurance on aclaims-made basis for losses in excess of $50 million per occurrence. Provisions for losses related to professionalliability risks were $314 million, $331 million and $244 million for the years ended December 31, 2013, 2012and 2011, respectively.
Reserves for professional liability risks represent the estimated ultimate cost of all reported and unreportedlosses incurred through the respective consolidated balance sheet dates. The estimated ultimate cost includesestimates of direct expenses and fees paid to outside counsel and experts, but does not include the generaloverhead costs of our insurance subsidiary or corporate office. Individual case reserves are established basedupon the particular circumstances of each reported claim and represent our estimates of the future costs that willbe paid on reported claims. Case reserves are reduced as claim payments are made and are adjusted upward ordownward as our estimates regarding the amounts of future losses are revised. Once the case reserves for knownclaims are determined, information is stratified by loss layers and retentions, accident years, reported years, andgeographic location of our hospitals. Several actuarial methods are employed to utilize this data to produceestimates of ultimate losses and reserves for incurred but not reported claims, including: paid and incurredextrapolation methods utilizing paid and incurred loss development to estimate ultimate losses; frequency andseverity methods utilizing paid and incurred claims development to estimate ultimate average frequency (numberof claims) and ultimate average severity (cost per claim); and Bornhuetter-Ferguson methods which add expecteddevelopment to actual paid or incurred experience to estimate ultimate losses. These methods use our company-specific historical claims data and other information. Company-specific claim reporting and settlement datacollected over an approximate 20-year period is used in our reserve estimation process. This company-specificdata includes information regarding our business, including historical paid losses and loss adjustment expenses,historical and current case loss reserves, actual and projected hospital statistical data, professional liabilityretentions for each policy year, geographic information and other data.
64
HCA HOLDINGS, INC.
MANAGEMENT’S DISCUSSION AND ANALYSIS OF FINANCIAL CONDITIONAND RESULTS OF OPERATIONS (continued)
Critical Accounting Policies and Estimates (continued)
Professional Liability Claims (continued)
Reserves and provisions for professional liability risks are based upon actuarially determined estimates. Theestimated reserve ranges, net of amounts receivable under reinsurance contracts, were $1.137 billion to$1.359 billion at December 31, 2013 and $1.130 billion to $1.346 billion at December 31, 2012. Our estimatedreserves for professional liability claims may change significantly if future claims differ from expected trends.We perform sensitivity analyses which model the volatility of key actuarial assumptions and monitor ourreserves for adequacy relative to all our assumptions in the aggregate. Based on our analysis, we believe theestimated professional liability reserve ranges represent the reasonably likely outcomes for ultimate losses. Weconsider the number and severity of claims to be the most significant assumptions in estimating reserves forprofessional liabilities. A 2% change in the expected frequency trend could be reasonably likely and wouldincrease the reserve estimate by $18 million or reduce the reserve estimate by $17 million. A 2% change in theexpected claim severity trend could be reasonably likely and would increase the reserve estimate by $73 millionor reduce the reserve estimate by $67 million. We believe adequate reserves have been recorded for ourprofessional liability claims; however, due to the complexity of the claims, the extended period of time to settlethe claims and the wide range of potential outcomes, our ultimate liability for professional liability claims couldchange by more than the estimated sensitivity amounts and could change materially from our current estimates.
The reserves for professional liability risks cover approximately 2,600 individual claims and 2,700individual claims at December 31, 2013 and 2012, respectively, and estimates for unreported potential claims.The time period required to resolve these claims can vary depending upon the jurisdiction and whether the claimis settled or litigated. The average time period between the occurrence and payment of final settlement for ourprofessional liability claims is approximately five years, although the facts and circumstances of each individualclaim can result in an occurrence-to-settlement timeframe that varies from this average. The estimation of thetiming of payments beyond a year can vary significantly.
Reserves for professional liability risks were $1.279 billion and $1.297 billion at December 31, 2013 and2012, respectively. The current portion of these reserves, $331 million and $324 million at December 31, 2013and 2012, respectively, is included in “other accrued expenses.” Obligations covered by reinsurance and excessinsurance contracts are included in the reserves for professional liability risks, as we remain liable to the extentreinsurers and excess insurance carriers do not meet their obligations. Reserves for professional liability risks(net of $24 million and $49 million receivable under reinsurance and excess insurance contracts at December 31,2013 and 2012, respectively) were $1.255 billion and $1.248 billion at December 31, 2013 and 2012,respectively. The estimated total net reserves for professional liability risks at December 31, 2013 and 2012 arecomprised of $710 million and $789 million, respectively, of case reserves for known claims and $545 millionand $459 million, respectively, of reserves for incurred but not reported claims.
65
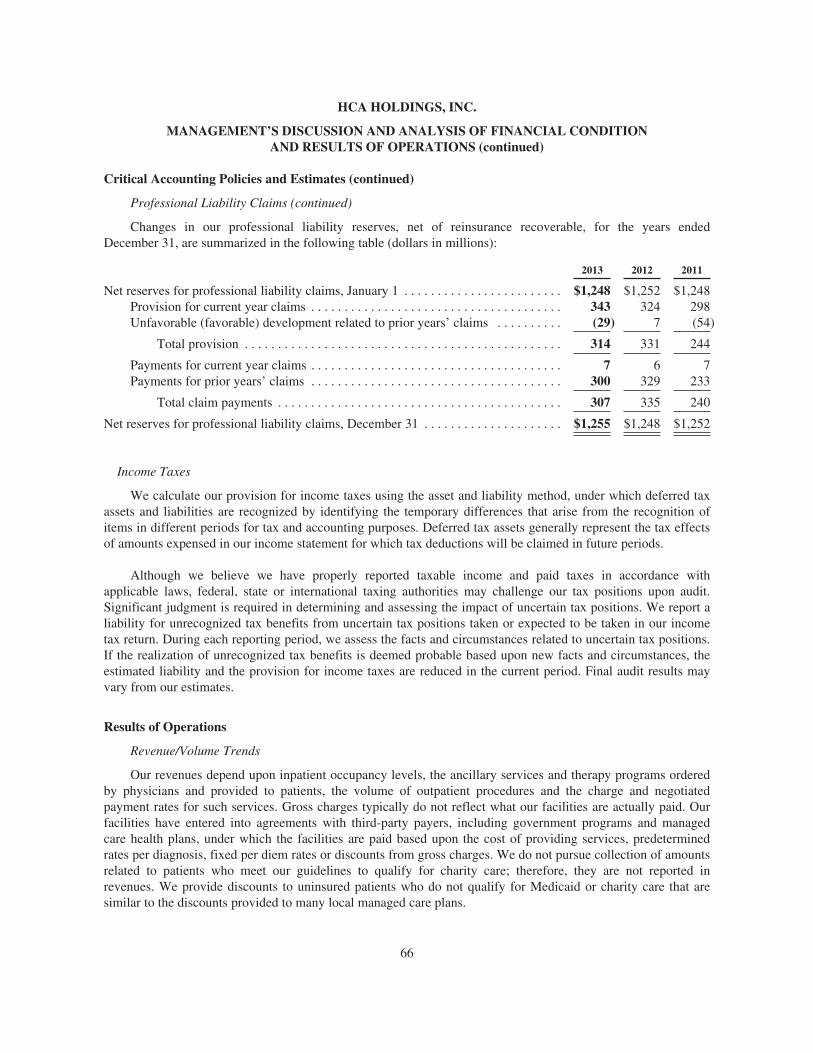
HCA HOLDINGS, INC.
MANAGEMENT’S DISCUSSION AND ANALYSIS OF FINANCIAL CONDITIONAND RESULTS OF OPERATIONS (continued)
Critical Accounting Policies and Estimates (continued)
Professional Liability Claims (continued)
Changes in our professional liability reserves, net of reinsurance recoverable, for the years endedDecember 31, are summarized in the following table (dollars in millions):
2013 2012 2011
Net reserves for professional liability claims, January 1 . . . . . . . . . . . . . . . . . . . . . . . . $1,248 $1,252 $1,248Provision for current year claims . . . . . . . . . . . . . . . . . . . . . . . . . . . . . . . . . . . . . . 343 324 298Unfavorable (favorable) development related to prior years’ claims . . . . . . . . . . (29) 7 (54)
Total provision . . . . . . . . . . . . . . . . . . . . . . . . . . . . . . . . . . . . . . . . . . . . . . . . 314 331 244
Payments for current year claims . . . . . . . . . . . . . . . . . . . . . . . . . . . . . . . . . . . . . . 7 6 7Payments for prior years’ claims . . . . . . . . . . . . . . . . . . . . . . . . . . . . . . . . . . . . . . 300 329 233
Total claim payments . . . . . . . . . . . . . . . . . . . . . . . . . . . . . . . . . . . . . . . . . . . 307 335 240
Net reserves for professional liability claims, December 31 . . . . . . . . . . . . . . . . . . . . . $1,255 $1,248 $1,252
Income Taxes
We calculate our provision for income taxes using the asset and liability method, under which deferred taxassets and liabilities are recognized by identifying the temporary differences that arise from the recognition ofitems in different periods for tax and accounting purposes. Deferred tax assets generally represent the tax effectsof amounts expensed in our income statement for which tax deductions will be claimed in future periods.
Although we believe we have properly reported taxable income and paid taxes in accordance withapplicable laws, federal, state or international taxing authorities may challenge our tax positions upon audit.Significant judgment is required in determining and assessing the impact of uncertain tax positions. We report aliability for unrecognized tax benefits from uncertain tax positions taken or expected to be taken in our incometax return. During each reporting period, we assess the facts and circumstances related to uncertain tax positions.If the realization of unrecognized tax benefits is deemed probable based upon new facts and circumstances, theestimated liability and the provision for income taxes are reduced in the current period. Final audit results mayvary from our estimates.
Results of Operations
Revenue/Volume Trends
Our revenues depend upon inpatient occupancy levels, the ancillary services and therapy programs orderedby physicians and provided to patients, the volume of outpatient procedures and the charge and negotiatedpayment rates for such services. Gross charges typically do not reflect what our facilities are actually paid. Ourfacilities have entered into agreements with third-party payers, including government programs and managedcare health plans, under which the facilities are paid based upon the cost of providing services, predeterminedrates per diagnosis, fixed per diem rates or discounts from gross charges. We do not pursue collection of amountsrelated to patients who meet our guidelines to qualify for charity care; therefore, they are not reported inrevenues. We provide discounts to uninsured patients who do not qualify for Medicaid or charity care that aresimilar to the discounts provided to many local managed care plans.
66
HCA HOLDINGS, INC.
MANAGEMENT’S DISCUSSION AND ANALYSIS OF FINANCIAL CONDITIONAND RESULTS OF OPERATIONS (continued)
Results of Operations (continued)
Revenue/Volume Trends (continued)
Revenues increased 3.5% to $34.182 billion for 2013 from $33.013 billion for 2012 and increased 11.2% for2012 from $29.682 billion for 2011. The increase in revenues in 2013 can be primarily attributed to the combinedimpact of a 3.1% increase in revenue per equivalent admission and a 0.4% increase in equivalent admissionscompared to the prior year. The increase in revenues in 2012 can be primarily attributed to the combined impactof a 2.0% increase in revenue per equivalent admission and a 9.1% increase in equivalent admissions comparedto 2011. The increase in revenues (and volume metrics) for 2012 compared to 2011 related primarily to theimpact of the financial consolidation of the HCA-HealthONE LLC venture for periods subsequent to ouracquisition of controlling interests during October 2011 (HealthONE revenues and related volume metrics are notincluded in our same facility amounts). HealthONE revenues included in our consolidated revenues increasedfrom $347 million for 2011 to $2.203 billion in 2012.
Same facility revenues increased 3.1% for the year ended December 31, 2013 compared to the year endedDecember 31, 2012 and increased 4.5% for the year ended December 31, 2012 compared to the year endedDecember 31, 2011. The 3.1% increase for 2013 can be primarily attributed to the combined impact of a 3.0%increase in same facility revenue per equivalent admission and a 0.1% increase in same facility equivalentadmissions. The 4.5% increase for 2012 can be primarily attributed to the combined impact of a 0.3% increase insame facility revenue per equivalent admission and a 4.1% increase in same facility equivalent admissions.
Consolidated admissions increased 0.2% in 2013 compared to 2012 and increased 7.4% in 2012 comparedto 2011. Consolidated inpatient surgeries increased 0.5% and consolidated outpatient surgeries increased 0.9%during 2013 compared to 2012. Consolidated inpatient surgeries increased 4.5% and consolidated outpatientsurgeries increased 9.3% during 2012 compared to 2011. Consolidated emergency room visits increased 0.8%during 2013 compared to 2012 and increased 12.5% during 2012 compared to 2011.
Same facility admissions increased 0.1% in 2013 compared to 2012 and increased 3.0% in 2012 comparedto 2011. Same facility inpatient surgeries increased 0.3% and same facility outpatient surgeries declined 0.5%during 2013 compared to 2012. Same facility inpatient surgeries declined 0.1% and same facility outpatientsurgeries increased 0.9% during 2012 compared to 2011. Same facility emergency room visits increased 0.7%during 2013 compared to 2012 and increased 8.6% during 2012 compared to 2011.
Same facility uninsured emergency room visits increased 2.2% and same facility uninsured admissionsincreased 7.6% during 2013 compared to 2012. Same facility uninsured emergency room visits increased 8.9%and same facility uninsured admissions increased 9.7% during 2012 compared to 2011.
67
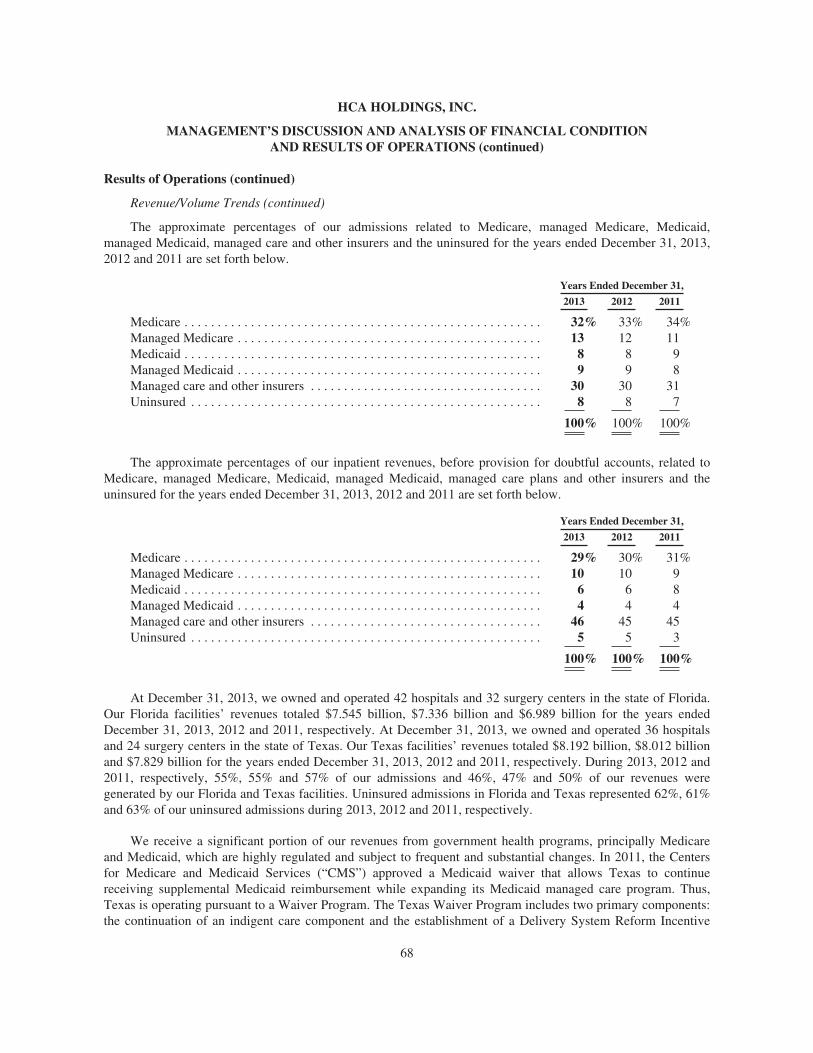
HCA HOLDINGS, INC.
MANAGEMENT’S DISCUSSION AND ANALYSIS OF FINANCIAL CONDITIONAND RESULTS OF OPERATIONS (continued)
Results of Operations (continued)
Revenue/Volume Trends (continued)
The approximate percentages of our admissions related to Medicare, managed Medicare, Medicaid,managed Medicaid, managed care and other insurers and the uninsured for the years ended December 31, 2013,2012 and 2011 are set forth below.
Years Ended December 31,
2013 2012 2011
Medicare . . . . . . . . . . . . . . . . . . . . . . . . . . . . . . . . . . . . . . . . . . . . . . . . . . . . . . 32% 33% 34%Managed Medicare . . . . . . . . . . . . . . . . . . . . . . . . . . . . . . . . . . . . . . . . . . . . . . 13 12 11Medicaid . . . . . . . . . . . . . . . . . . . . . . . . . . . . . . . . . . . . . . . . . . . . . . . . . . . . . . 8 8 9Managed Medicaid . . . . . . . . . . . . . . . . . . . . . . . . . . . . . . . . . . . . . . . . . . . . . . 9 9 8Managed care and other insurers . . . . . . . . . . . . . . . . . . . . . . . . . . . . . . . . . . . 30 30 31Uninsured . . . . . . . . . . . . . . . . . . . . . . . . . . . . . . . . . . . . . . . . . . . . . . . . . . . . . 8 8 7
100% 100% 100%
The approximate percentages of our inpatient revenues, before provision for doubtful accounts, related toMedicare, managed Medicare, Medicaid, managed Medicaid, managed care plans and other insurers and theuninsured for the years ended December 31, 2013, 2012 and 2011 are set forth below.
Years Ended December 31,
2013 2012 2011
Medicare . . . . . . . . . . . . . . . . . . . . . . . . . . . . . . . . . . . . . . . . . . . . . . . . . . . . . . 29% 30% 31%Managed Medicare . . . . . . . . . . . . . . . . . . . . . . . . . . . . . . . . . . . . . . . . . . . . . . 10 10 9Medicaid . . . . . . . . . . . . . . . . . . . . . . . . . . . . . . . . . . . . . . . . . . . . . . . . . . . . . . 6 6 8Managed Medicaid . . . . . . . . . . . . . . . . . . . . . . . . . . . . . . . . . . . . . . . . . . . . . . 4 4 4Managed care and other insurers . . . . . . . . . . . . . . . . . . . . . . . . . . . . . . . . . . . 46 45 45Uninsured . . . . . . . . . . . . . . . . . . . . . . . . . . . . . . . . . . . . . . . . . . . . . . . . . . . . . 5 5 3
100% 100% 100%
At December 31, 2013, we owned and operated 42 hospitals and 32 surgery centers in the state of Florida.Our Florida facilities’ revenues totaled $7.545 billion, $7.336 billion and $6.989 billion for the years endedDecember 31, 2013, 2012 and 2011, respectively. At December 31, 2013, we owned and operated 36 hospitalsand 24 surgery centers in the state of Texas. Our Texas facilities’ revenues totaled $8.192 billion, $8.012 billionand $7.829 billion for the years ended December 31, 2013, 2012 and 2011, respectively. During 2013, 2012 and2011, respectively, 55%, 55% and 57% of our admissions and 46%, 47% and 50% of our revenues weregenerated by our Florida and Texas facilities. Uninsured admissions in Florida and Texas represented 62%, 61%and 63% of our uninsured admissions during 2013, 2012 and 2011, respectively.
We receive a significant portion of our revenues from government health programs, principally Medicareand Medicaid, which are highly regulated and subject to frequent and substantial changes. In 2011, the Centersfor Medicare and Medicaid Services (“CMS”) approved a Medicaid waiver that allows Texas to continuereceiving supplemental Medicaid reimbursement while expanding its Medicaid managed care program. Thus,Texas is operating pursuant to a Waiver Program. The Texas Waiver Program includes two primary components:the continuation of an indigent care component and the establishment of a Delivery System Reform Incentive
68
HCA HOLDINGS, INC.
MANAGEMENT’S DISCUSSION AND ANALYSIS OF FINANCIAL CONDITIONAND RESULTS OF OPERATIONS (continued)
Results of Operations (continued)
Revenue/Volume Trends (continued)
Payment (“DSRIP”) component. Initiatives under the DSRIP program are designed to provide incentivepayments to hospitals and other providers for their investments in delivery system reforms that increase access tohealth care, improve the quality of care and enhance the health of patients and families they serve. We provideindigent care services in several communities in the state of Texas, in affiliation with other hospitals. The state ofTexas has been involved in efforts to increase the indigent care provided by private hospitals. As a result ofadditional indigent care being provided by private hospitals, public hospital districts or counties in Texas haveavailable funds that were previously devoted to indigent care. The public hospital districts or counties are underno contractual or legal obligation to provide such indigent care. The public hospital districts or counties haveelected to transfer some portion of these available funds to the state’s Medicaid program. Such action is at thesole discretion of the public hospital districts or counties. It is anticipated that these contributions to the state willbe matched with federal Medicaid funds. The state then may make supplemental payments to hospitals in thestate for Medicaid services rendered. Hospitals receiving Medicaid supplemental payments may include thosethat are providing additional indigent care services. Our Texas Medicaid revenues included $393 million ($76million DSRIP related and $317 million indigent care related), $387 million (all indigent care related) and$540 million (all indigent care related) during 2013, 2012 and 2011, respectively, of Medicaid supplementalpayments. In addition, we receive supplemental payments in several other states. We are aware thesesupplemental payment programs are currently being reviewed by certain state agencies and some states havemade waiver requests to the CMS to replace their existing supplemental payment programs. It is possible thesereviews and waiver requests will result in the restructuring of such supplemental payment programs and couldresult in the payment programs being reduced or eliminated. Because deliberations about these programs areongoing, we are unable to estimate the financial impact the program structure modifications, if any, may have onour results of operations.
Electronic Health Record Incentive Payments
The American Recovery and Reinvestment Act of 2009 provides for Medicare and Medicaid incentivepayments, beginning in 2011, for eligible hospitals and professionals that adopt and meaningfully use certifiedelectronic health record (“EHR”) technology. We recognize income related to Medicare and Medicaid incentivepayments using a gain contingency model that is based upon when our eligible hospitals have demonstratedmeaningful use of certified EHR technology for the applicable period and the cost report information for the fullcost report year that will determine the final calculation of the incentive payment is available.
During 2013, 2012 and 2011, respectively, we recognized $216 million, $336 million and $210 million ofelectronic health record incentive income related to Medicare ($183 million, $252 million and $123 million) andMedicaid ($33 million, $84 million and $87 million) incentive programs. At December 31, 2013, we have $78million of deferred EHR incentive income, which represents initial incentive payments received for which EHRincentive income has not been recognized.
We have incurred and will continue to incur both capital costs and operating expenses in order to implementour certified EHR technology and meet meaningful use requirements. These expenses are ongoing and areprojected to continue over all stages of implementation of meaningful use. The timing of recognizing theexpenses may not correlate with the receipt of the incentive payments and the recognition of incentive income.During 2013, 2012 and 2011, respectively, we incurred $113 million, $80 million and $77 million of operatingexpenses to implement our certified EHR technology and meet meaningful use.
69
HCA HOLDINGS, INC.
MANAGEMENT’S DISCUSSION AND ANALYSIS OF FINANCIAL CONDITIONAND RESULTS OF OPERATIONS (continued)
Results of Operations (continued)
Electronic Health Record Incentive Payments (continued)
For 2014, we estimate EHR incentive income will be recognized in the range of $110 million to $130million and that related EHR operating expenses will be in the range of $110 million to $130 million. Actualincentive payments and EHR operating expenses could vary from these estimates due to certain factors such asavailability of federal funding for both Medicare and Medicaid incentive payments and our ability to continue todemonstrate meaningful use of certified EHR technology. The failure of our ability to continue to demonstratemeaningful use of EHR technology could have a material, adverse effect on our results of operations.
70
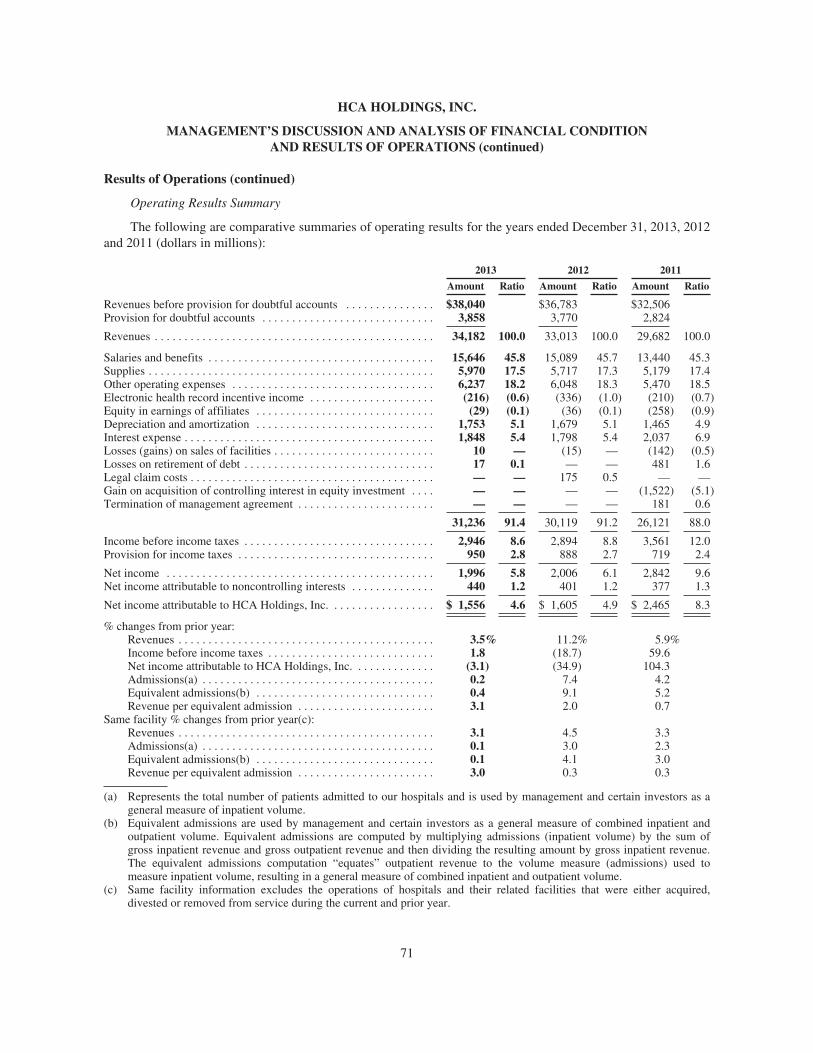
HCA HOLDINGS, INC.
MANAGEMENT’S DISCUSSION AND ANALYSIS OF FINANCIAL CONDITIONAND RESULTS OF OPERATIONS (continued)
Results of Operations (continued)
Operating Results Summary
The following are comparative summaries of operating results for the years ended December 31, 2013, 2012and 2011 (dollars in millions):
2013 2012 2011
Amount Ratio Amount Ratio Amount Ratio
Revenues before provision for doubtful accounts . . . . . . . . . . . . . . . $38,040 $36,783 $32,506Provision for doubtful accounts . . . . . . . . . . . . . . . . . . . . . . . . . . . . . 3,858 3,770 2,824
Revenues . . . . . . . . . . . . . . . . . . . . . . . . . . . . . . . . . . . . . . . . . . . . . . . 34,182 100.0 33,013 100.0 29,682 100.0
Salaries and benefits . . . . . . . . . . . . . . . . . . . . . . . . . . . . . . . . . . . . . . 15,646 45.8 15,089 45.7 13,440 45.3Supplies . . . . . . . . . . . . . . . . . . . . . . . . . . . . . . . . . . . . . . . . . . . . . . . . 5,970 17.5 5,717 17.3 5,179 17.4Other operating expenses . . . . . . . . . . . . . . . . . . . . . . . . . . . . . . . . . . 6,237 18.2 6,048 18.3 5,470 18.5Electronic health record incentive income . . . . . . . . . . . . . . . . . . . . . (216) (0.6) (336) (1.0) (210) (0.7)Equity in earnings of affiliates . . . . . . . . . . . . . . . . . . . . . . . . . . . . . . (29) (0.1) (36) (0.1) (258) (0.9)Depreciation and amortization . . . . . . . . . . . . . . . . . . . . . . . . . . . . . . 1,753 5.1 1,679 5.1 1,465 4.9Interest expense . . . . . . . . . . . . . . . . . . . . . . . . . . . . . . . . . . . . . . . . . . 1,848 5.4 1,798 5.4 2,037 6.9Losses (gains) on sales of facilities . . . . . . . . . . . . . . . . . . . . . . . . . . . 10 — (15) — (142) (0.5)Losses on retirement of debt . . . . . . . . . . . . . . . . . . . . . . . . . . . . . . . . 17 0.1 — — 481 1.6Legal claim costs . . . . . . . . . . . . . . . . . . . . . . . . . . . . . . . . . . . . . . . . . — — 175 0.5 — —Gain on acquisition of controlling interest in equity investment . . . . — — — — (1,522) (5.1)Termination of management agreement . . . . . . . . . . . . . . . . . . . . . . . — — — — 181 0.6
31,236 91.4 30,119 91.2 26,121 88.0
Income before income taxes . . . . . . . . . . . . . . . . . . . . . . . . . . . . . . . . 2,946 8.6 2,894 8.8 3,561 12.0Provision for income taxes . . . . . . . . . . . . . . . . . . . . . . . . . . . . . . . . . 950 2.8 888 2.7 719 2.4
Net income . . . . . . . . . . . . . . . . . . . . . . . . . . . . . . . . . . . . . . . . . . . . . 1,996 5.8 2,006 6.1 2,842 9.6Net income attributable to noncontrolling interests . . . . . . . . . . . . . . 440 1.2 401 1.2 377 1.3
Net income attributable to HCA Holdings, Inc. . . . . . . . . . . . . . . . . . $ 1,556 4.6 $ 1,605 4.9 $ 2,465 8.3
% changes from prior year:Revenues . . . . . . . . . . . . . . . . . . . . . . . . . . . . . . . . . . . . . . . . . . . 3.5% 11.2% 5.9%Income before income taxes . . . . . . . . . . . . . . . . . . . . . . . . . . . . 1.8 (18.7) 59.6Net income attributable to HCA Holdings, Inc. . . . . . . . . . . . . . (3.1) (34.9) 104.3Admissions(a) . . . . . . . . . . . . . . . . . . . . . . . . . . . . . . . . . . . . . . . 0.2 7.4 4.2Equivalent admissions(b) . . . . . . . . . . . . . . . . . . . . . . . . . . . . . . 0.4 9.1 5.2Revenue per equivalent admission . . . . . . . . . . . . . . . . . . . . . . . 3.1 2.0 0.7
Same facility % changes from prior year(c):Revenues . . . . . . . . . . . . . . . . . . . . . . . . . . . . . . . . . . . . . . . . . . . 3.1 4.5 3.3Admissions(a) . . . . . . . . . . . . . . . . . . . . . . . . . . . . . . . . . . . . . . . 0.1 3.0 2.3Equivalent admissions(b) . . . . . . . . . . . . . . . . . . . . . . . . . . . . . . 0.1 4.1 3.0Revenue per equivalent admission . . . . . . . . . . . . . . . . . . . . . . . 3.0 0.3 0.3
(a) Represents the total number of patients admitted to our hospitals and is used by management and certain investors as ageneral measure of inpatient volume.
(b) Equivalent admissions are used by management and certain investors as a general measure of combined inpatient andoutpatient volume. Equivalent admissions are computed by multiplying admissions (inpatient volume) by the sum ofgross inpatient revenue and gross outpatient revenue and then dividing the resulting amount by gross inpatient revenue.The equivalent admissions computation “equates” outpatient revenue to the volume measure (admissions) used tomeasure inpatient volume, resulting in a general measure of combined inpatient and outpatient volume.
(c) Same facility information excludes the operations of hospitals and their related facilities that were either acquired,divested or removed from service during the current and prior year.
71
HCA HOLDINGS, INC.
MANAGEMENT’S DISCUSSION AND ANALYSIS OF FINANCIAL CONDITIONAND RESULTS OF OPERATIONS (continued)
Results of Operations (continued)
Years Ended December 31, 2013 and 2012
Net income attributable to HCA Holdings, Inc. totaled $1.556 billion, or $3.37 per diluted share, for the yearended December 31, 2013 compared to $1.605 billion, or $3.49 per diluted share, for the year endedDecember 31, 2012. Financial results for 2013 include net losses on sales of facilities of $10 million (pretax), or$0.02 per diluted share, and a loss on retirement of debt of $17 million (pretax), or $0.02 per diluted share.Financial results for 2012 include legal claim costs of $175 million (pretax), or $0.24 per diluted share, and netgains on sales of facilities of $15 million (pretax), or $0.02 per diluted share. All “per diluted share” disclosuresare based upon amounts net of the applicable income taxes. Shares used for diluted earnings per share were461.913 million shares and 459.403 million shares for the years ended December 31, 2013 and 2012,respectively.
During 2013, consolidated admissions increased 0.2% and same facility admissions increased 0.1% for 2013compared to 2012. Consolidated inpatient surgical volumes increased 0.5%, and same facility inpatient surgeriesincreased 0.3% during 2013 compared to 2012. Consolidated outpatient surgical volumes increased 0.9%, andsame facility outpatient surgeries declined 0.5% during 2013 compared to 2012. Emergency room visitsincreased 0.8% on a consolidated basis and increased 0.7% on a same facility basis during 2013 compared to2012.
Revenues before provision for doubtful accounts increased 3.4% to $38.040 billion for 2013 from$36.783 billion for 2012. Provision for doubtful accounts increased $88 million from $3.770 billion in 2012 to$3.858 billion in 2013. The provision for doubtful accounts and the allowance for doubtful accounts relateprimarily to uninsured amounts due directly from patients, including copayment and deductible amounts forpatients who have health care coverage. The self-pay revenue deductions for charity care and uninsured discountsincreased $404 million and $1.232 billion, respectively, during 2013 compared to 2012. The sum of the provisionfor doubtful accounts, uninsured discounts and charity care, as a percentage of the sum of revenues, the provisionfor doubtful accounts, uninsured discounts and charity care, was 31.3% for 2013 compared to 29.5% for 2012. AtDecember 31, 2013, our allowance for doubtful accounts represented approximately 93% of the $5.927 billiontotal patient due accounts receivable balance, including accounts, net of estimated contractual discounts, relatedto patients for which eligibility for Medicaid coverage or uninsured discounts was being evaluated.
Revenues increased 3.5% to $34.182 billion for 2013 from $33.013 billion for 2012. The increase inrevenues was due primarily to the combined impact of a 3.1% increase in revenue per equivalent admission and a0.4% increase in equivalent admissions compared to 2012. Same facility revenues increased 3.1% due primarilyto the combined impact of a 3.0% increase in same facility revenue per equivalent admission and a 0.1% increasein same facility equivalent admissions compared to 2012.
Salaries and benefits, as a percentage of revenues, were 45.8% in 2013 and 45.7% in 2012. Salaries andbenefits per equivalent admission increased 3.2% in 2013 compared to 2012. Same facility labor rate increasesaveraged 1.8% for 2013 compared to 2012. Share-based compensation expense increased from $56 million in2012 to $113 million in 2013, and we expect the 2014 expense will increase by approximately $50 million to$60 million.
Supplies, as a percentage of revenues, were 17.5% in 2013 and 17.3% in 2012. Supply costs per equivalentadmission increased 4.0% in 2013 compared to 2012. Supply costs per equivalent admission increased 5.7% formedical devices, increased 0.3% for pharmacy supplies and 5.1% for general medical and surgical items in 2013compared to 2012.
72
HCA HOLDINGS, INC.
MANAGEMENT’S DISCUSSION AND ANALYSIS OF FINANCIAL CONDITIONAND RESULTS OF OPERATIONS (continued)
Results of Operations (continued)
Years Ended December 31, 2013 and 2012 (continued)
Other operating expenses, as a percentage of revenues, declined to 18.2% in 2013 from 18.3% in 2012.Other operating expenses are primarily comprised of contract services, professional fees, repairs andmaintenance, rents and leases, utilities, insurance (including professional liability insurance) and nonincometaxes. Provisions for losses related to professional liability risks were $314 million and $331 million for 2013 and2012, respectively.
During 2013 and 2012, respectively, we recognized $216 million and $336 million of electronic healthrecord incentive income related to Medicare ($183 million and $252 million) and Medicaid ($33 million and $84million) incentive programs. We recognize income related to Medicare and Medicaid incentive payments using again contingency model that is based upon when our eligible hospitals have demonstrated meaningful use ofcertified EHR technology for the applicable period and the cost report information for the full cost report yearthat will determine the final calculation of the incentive payment is available.
Equity in earnings of affiliates declined from $36 million for 2012 to $29 million for 2013.
Depreciation and amortization, as a percentage of revenues, was 5.1% in 2013 and 2012. Depreciationexpense was $1.733 billion for 2013 and $1.673 billion for 2012.
Interest expense increased to $1.848 billion for 2013 from $1.798 billion for 2012. The increase in interestexpense was due to an increase in the average debt balance. Our average debt balance was $28.377 billion for2013 compared to $27.397 billion for 2012. The average interest rate for our long-term debt declined from 6.6%for 2012 to 6.5% for 2013.
Net losses on sales of facilities were $10 million for 2013 and related to the sale of a hospital facility andother real estate investments. Net gains on sales of facilities were $15 million for 2012 and related to the sales ofhealth care entity investments.
During 2013, we redeemed all $201 million aggregate principal amount of our 97⁄8% senior secured secondlien notes due 2017, at a redemption price of 104.938% of the principal amount. The pretax loss on retirement ofdebt related to this redemption was $17 million.
During January 2013, a Missouri judge ruled in favor of a nonprofit health foundation in a lawsuit againstHCA. In the case, the plaintiff alleged HCA did not make the full level of capital expenditures anduncompensated care agreed to in connection with its purchase of hospitals from Health Midwest in 2003. Werecorded $175 million of legal claim costs during the fourth quarter of 2012 related to this ruling.
The effective tax rate was 37.9% and 35.6% for 2013 and 2012, respectively. The effective tax ratecomputations exclude net income attributable to noncontrolling interests as it relates to consolidated partnerships.Our provision for income taxes for 2012 was reduced by $33 million related to a reduction in interest expenserelated to taxing authority examinations. Excluding the effect of this adjustment, the effective tax rate for 2012would have been 36.9%.
Net income attributable to noncontrolling interests increased from $401 million for 2012 to $440 million for2013. The increase in net income attributable to noncontrolling interests related primarily to growth in operatingresults of a hospital joint venture in one of our Texas markets.
73
HCA HOLDINGS, INC.
MANAGEMENT’S DISCUSSION AND ANALYSIS OF FINANCIAL CONDITIONAND RESULTS OF OPERATIONS (continued)
Results of Operations (continued)
Years Ended December 31, 2012 and 2011
Net income attributable to HCA Holdings, Inc. totaled $1.605 billion, or $3.49 per diluted share, for the yearended December 31, 2012 compared to $2.465 billion, or $4.97 per diluted share, for the year endedDecember 31, 2011. Financial results for 2012 include legal claim costs of $175 million (pretax), or $0.24 perdiluted share, and net gains on sales of facilities of $15 million (pretax), or $0.02 per diluted share. Financialresults for 2011 include net gains on sales of facilities of $142 million (pretax), or $0.16 per diluted share, a gainon the acquisition of controlling interest in an equity investment of $1.522 billion (pretax), or $2.87 per dilutedshare, losses on retirement of debt of $481 million (pretax), or $0.61 per diluted share, and termination ofmanagement agreement fees of $181 million (pretax), or $0.30 per diluted share. All “per diluted share”disclosures are based upon amounts net of the applicable income taxes. Shares used for diluted earnings per sharewere 459.403 million shares and 495.943 million shares for the years ended December 31, 2012 and 2011,respectively. During March 2011, we completed the initial public offering of 87.719 million shares of ourcommon stock, and during September 2011, we repurchased 80.771 million shares of our common stock.
During 2012, consolidated admissions increased 7.4% and same facility admissions increased 3.0% for 2012,compared to 2011. Consolidated inpatient surgical volumes increased 4.5%, and same facility inpatient surgeriesdeclined 0.1% during 2012 compared to 2011. Consolidated outpatient surgical volumes increased 9.3%, and samefacility outpatient surgeries increased 0.9% during 2012 compared to 2011. Emergency room visits increased12.5% on a consolidated basis and increased 8.6% on a same facility basis during 2012 compared to 2011.
Revenues before provision for doubtful accounts increased 13.2% to $36.783 billion for 2012 from$32.506 billion for 2011. Provision for doubtful accounts increased $946 million from $2.824 billion in 2011 to$3.770 billion in 2012. The provision for doubtful accounts and the allowance for doubtful accounts relateprimarily to uninsured amounts due directly from patients, including copayment and deductible amounts forpatients who have health care coverage. The self-pay revenue deductions for charity care and uninsured discountsincreased $410 million and $1.271 billion, respectively, during 2012 compared to 2011. The sum of the provisionfor doubtful accounts, uninsured discounts and charity care, as a percentage of the sum of revenues, the provisionfor doubtful accounts, uninsured discounts and charity care, was 29.5% for 2012 compared to 27.4% for 2011. AtDecember 31, 2012, our allowance for doubtful accounts represented approximately 93% of the $5.228 billiontotal patient due accounts receivable balance, including accounts, net of estimated contractual discounts, relatedto patients for which eligibility for Medicaid coverage or uninsured discounts was being evaluated.
Revenues increased 11.2% to $33.013 billion for 2012 from $29.682 billion for 2011. The increase inrevenues was due primarily to the combined impact of a 2.0% increase in revenue per equivalent admission and a9.1% increase in equivalent admissions compared to 2011. Same facility revenues increased 4.5% due primarilyto the combined impact of a 0.3% increase in same facility revenue per equivalent admission and a 4.1% increasein same facility equivalent admissions compared to 2011. The increase in revenues (and volume metrics) for2012 compared to 2011 related primarily to the impact of the financial consolidation of the HCA-HealthONELLC venture for periods subsequent to our acquisition of controlling interests during October 2011 (HealthONErevenues and volume metrics are not included in our same facility amounts). HealthONE revenues included inour consolidated revenues increased from $347 million in 2011 to $2.203 billion in 2012. Two adjustments(Rural Floor Provision Settlement and SSI ratios) related to Medicare revenues for prior period cost reports andthe current period resulted in a net increase of $188 million to 2012 revenues.
Salaries and benefits, as a percentage of revenues, were 45.7% in 2012 and 45.3% in 2011. Salaries andbenefits per equivalent admission increased 2.9% in 2012 compared to 2011. Same facility labor rate increases
74
HCA HOLDINGS, INC.
MANAGEMENT’S DISCUSSION AND ANALYSIS OF FINANCIAL CONDITIONAND RESULTS OF OPERATIONS (continued)
Results of Operations (continued)
Years Ended December 31, 2012 and 2011 (continued)
averaged 1.7% for 2012 compared to 2011. Share-based compensation expense increased from $26 million in2011 to $56 million in 2012.
Supplies, as a percentage of revenues, were 17.3% in 2012 and 17.4% in 2011. Supply costs per equivalentadmission increased 1.2% in 2012 compared to 2011. Supply costs per equivalent admission declined 2.0% forpharmacy supplies, and increased 1.6% for medical devices and 0.1% for general medical and surgical items in2012 compared to 2011.
Other operating expenses, as a percentage of revenues, declined to 18.3% in 2012 from 18.5% in 2011.Other operating expenses are primarily comprised of contract services, professional fees, repairs andmaintenance, rents and leases, utilities, insurance (including professional liability insurance) and nonincometaxes. Other operating expenses include $234 million and $317 million of indigent care costs in certain Texasmarkets during 2012 and 2011, respectively. Provisions for losses related to professional liability risks were$331 million and $244 million for 2012 and 2011, respectively.
During 2012 and 2011, respectively, we recognized $336 million and $210 million of electronic healthrecord incentive income related to Medicare ($252 million and $123 million) and Medicaid ($84 million and $87million) incentive programs. We recognize income related to Medicare and Medicaid incentive payments using again contingency model that is based upon when our eligible hospitals have demonstrated meaningful use ofcertified EHR technology for the applicable period and the cost report information for the full cost report yearthat will determine the final calculation of the incentive payment is available.
Equity in earnings of affiliates declined from $258 million for 2011 to $36 million for 2012. Equity inearnings of affiliates during 2011 related primarily to our Denver, Colorado market joint venture, which effectiveNovember 1, 2011, we began consolidating due to our acquisition of the approximate 40% remaining ownershipinterest.
Depreciation and amortization increased, as a percentage of revenues, to 5.1% in 2012 from 4.9% in 2011.The consolidation of HealthONE for periods subsequent to November 1, 2011 represents $113 million of theincrease in depreciation and amortization. Depreciation expense was $1.673 billion for 2012 and $1.461 billionfor 2011.
Interest expense declined to $1.798 billion for 2012 from $2.037 billion for 2011. The decline in interestexpense was due to a decline in the average interest rate. Our average debt balance was $27.397 billion for 2012compared to $26.588 billion for 2011. The average interest rate for our long-term debt declined from 7.7% for2011 to 6.6% for 2012.
Net gains on sales of facilities were $15 million for 2012 and related to the sales of health care entityinvestments. Net gains on sales of facilities were $142 million for 2011 and related to the sale of a hospitalfacility and other health care entity investments.
During January 2013, a Missouri judge ruled in favor of a nonprofit health foundation in a lawsuit againstHCA. In the case, the plaintiff alleged HCA did not make the full level of capital expenditures anduncompensated care agreed to in connection with its purchase of hospitals from Health Midwest in 2003. Werecorded $175 million of legal claim costs during the fourth quarter of 2012 related to this ruling.
75
HCA HOLDINGS, INC.
MANAGEMENT’S DISCUSSION AND ANALYSIS OF FINANCIAL CONDITIONAND RESULTS OF OPERATIONS (continued)
Results of Operations (continued)
Years Ended December 31, 2012 and 2011 (continued)
During October 2011, we completed our acquisition of the Colorado Health Foundation’s (“Foundation”)approximate 40% remaining ownership interest in the HealthONE joint venture for $1.450 billion. We recorded again on the acquisition of a controlling interest in an equity investment of $1.522 billion related to theremeasurement of our previous equity investment in HealthONE based upon our acquisition of the Foundation’sownership interest and the resulting consolidation of the entire enterprise at estimated fair value.
During 2011, we recorded losses on retirement of debt of $481 million related to the redemptions of all$1.000 billion aggregate principal amount of our 91⁄8% Senior Secured Notes due 2014, at a redemption price of104.563% of the principal amount; $108 million aggregate principal amount of our 97⁄8% Senior Secured Notesdue 2017, at a redemption price of 109.875% of the principal amount; all of our outstanding $1.578 billion95⁄8%/103⁄8% second lien toggle notes due 2016, at a redemption price of 106.783% of the principal amount andall of our outstanding $3.200 billion 91⁄4% second lien notes due 2016, at a redemption price of 106.513% of theprincipal amount. There were no losses on retirement of debt during 2012.
Our Investors provided management and advisory services to the Company, pursuant to a managementagreement among HCA and the Investors executed in connection with the Investors’ acquisition of HCA inNovember 2006. In March 2011, the management agreement was terminated pursuant to its terms uponcompletion of the initial public offering of our common stock, and the Investors were paid a final fee of$181 million.
The effective tax rate was 35.6% and 22.6% for 2012 and 2011, respectively. The effective tax ratecomputations exclude net income attributable to noncontrolling interests as it relates to consolidated partnerships.Our provision for income taxes for 2012 was reduced by $33 million related to a reduction in interest expenserelated to taxing authority examinations. Our income before income taxes for 2011 included $1.255 billion ofnontaxable gain related to the reported gain on the acquisition of a controlling interest in an equity investment.Excluding the effect of these adjustments, the effective tax rate for 2012 and 2011 would have been 36.9% and37.3%, respectively.
Net income attributable to noncontrolling interests increased from $377 million for 2011 to $401 million for2012. The increase in net income attributable to noncontrolling interests related primarily to growth in operatingresults of certain surgery center joint ventures.
Liquidity and Capital Resources
Our primary cash requirements are paying our operating expenses, servicing our debt, capital expenditureson our existing properties, acquisitions of hospitals and other health care entities, repurchases of our commonstock, distributions to stockholders and distributions to noncontrolling interests. Our primary cash sources arecash flows from operating activities, issuances of debt and equity securities and dispositions of hospitals andother health care entities.
Cash provided by operating activities totaled $3.680 billion in 2013 compared to $4.175 billion in 2012 and$3.933 billion in 2011. Working capital totaled $2.342 billion at December 31, 2013 and $1.591 billion atDecember 31, 2012. The $495 million decline in cash provided by operating activities for 2013, compared to2012, was primarily related to net negative changes in working capital items of $521 million. The $242 millionincrease in cash provided by operating activities for 2012, compared to 2011, was primarily related to a positive
76
HCA HOLDINGS, INC.
MANAGEMENT’S DISCUSSION AND ANALYSIS OF FINANCIAL CONDITIONAND RESULTS OF OPERATIONS (continued)
Liquidity and Capital Resources (continued)
impact from changes in working capital items of $236 million, as cash benefits from income items were offset byincreased tax payments. Cash payments for interest and income taxes increased $185 million for 2013 comparedto 2012 and increased $610 million for 2012 compared to 2011.
Cash used in investing activities was $2.346 billion, $2.063 billion and $2.995 billion in 2013, 2012 and2011, respectively. Excluding acquisitions, capital expenditures were $1.943 billion in 2013, $1.862 billion in2012 and $1.679 billion in 2011. We expended $481 million, $258 million and $1.682 billion for acquisitions ofhospitals and health care entities during 2013, 2012 and 2011, respectively. Expenditures for acquisitions in 2013included three hospitals, expenditures for acquisitions in 2012 included one hospital and expenditures foracquisitions in 2011 included eight hospital facilities, seven of which were related to the acquisition of theremaining interests in HealthONE. Planned capital expenditures are expected to approximate $2.2 billion in2014. At December 31, 2013, there were projects under construction which had an estimated additional cost tocomplete and equip over the next five years of approximately $1.8 billion. We expect to finance capitalexpenditures with internally generated and borrowed funds.
During 2013, we received cash of $33 million from sales of a hospital, real estate investments and otherhealth care entities. We also received net cash proceeds of $36 million related to net changes in our investments.During 2012, we received cash of $30 million from sales of real estate investments and other health care entities.We also received net cash proceeds of $16 million related to net changes in our investments. During 2011, wereceived cash of $281 million from sales of one hospital, other health care entities and real estate investments.We also received net cash proceeds of $80 million related to net changes in our investments.
Cash used in financing activities totaled $1.625 billion in 2013, $1.780 billion in 2012 and $976 million in2011. During 2013, we had a decline of $692 million in our indebtedness and used cash of $500 million forrepurchases of common stock. During 2012, we had a net increase of $1.724 billion in our indebtedness. During2011, we received cash of $2.506 billion related to the issuance of common stock in conjunction with our initialpublic offering; we used cash of $1.503 billion for repurchases of common stock; and we used cash proceedsfrom issuance of common stock and available cash provided by operations to make net debt repayments of$1.589 billion. During 2013, 2012 and 2011, we paid $16 million, $3.148 billion and $31 million, respectively, indistributions to our stockholders. During 2013, 2012 and 2011, we made distributions to noncontrolling interestsof $435 million, $401 million and $378 million, respectively. We paid debt issuance costs of $5 million,$62 million and $92 million for 2013, 2012 and 2011, respectively. During 2013, 2012 and 2011, we receivedincome tax benefits of $113 million, $174 million and $63 million, respectively, for certain items (primarily thecash distributions to holders of our stock options and exercises of stock options) that were deductible expensesfor tax purposes, but were recognized as adjustments to stockholders’ deficit for financial reporting purposes. Weor our affiliates, including affiliates of the Investors, may in the future repurchase portions of our debt or equitysecurities, subject to certain limitations, from time to time in either the open market or through privatelynegotiated transactions, in accordance with applicable SEC and other legal requirements. The timing, prices, andsizes of purchases depend upon prevailing trading prices, general economic and market conditions, and otherfactors, including applicable securities laws. Funds for the repurchase of debt or equity securities have, and areexpected to, come primarily from cash generated from operations and borrowed funds.
In addition to cash flows from operations, available sources of capital include amounts available under oursenior secured credit facilities ($2.002 billion as of December 31, 2013 and $1.972 billion as of January 31,2014) and anticipated access to public and private debt and equity markets.
77
HCA HOLDINGS, INC.
MANAGEMENT’S DISCUSSION AND ANALYSIS OF FINANCIAL CONDITIONAND RESULTS OF OPERATIONS (continued)
Liquidity and Capital Resources (continued)
During 2012, our Board of Directors declared three distributions to our stockholders and holders of certainvested share-based awards. The distributions totaled $6.50 per share and vested share-based award, or$3.142 billion in the aggregate. The distributions were funded using funds available under our existing seniorsecured credit facilities and proceeds from the December 2012 issuance of $1.000 billion aggregate principalamount of 6.25% senior unsecured notes due 2021. There were no distributions declared during 2013 or 2011.
Investments of our professional liability insurance subsidiaries, to maintain statutory equity and pay claims,totaled $510 million and $570 million at December 31, 2013 and 2012, respectively. The insurance subsidiarymaintained net reserves for professional liability risks of $315 million and $352 million at December 31, 2013and 2012, respectively. Our facilities are insured by our 100% owned insurance subsidiary for losses up to$50 million per occurrence; however, this coverage is subject to a $5 million per occurrence self-insuredretention. Net reserves for the self-insured professional liability risks retained were $940 million and$896 million at December 31, 2013 and 2012, respectively. Claims payments, net of reinsurance recoveries,during the next 12 months are expected to approximate $326 million. We estimate that approximately$264 million of the expected net claim payments during the next 12 months will relate to claims subject to theself-insured retention.
Financing Activities
We are a highly leveraged company with significant debt service requirements. Our debt totaled$28.376 billion and $28.930 billion at December 31, 2013 and 2012, respectively. Our interest expense was$1.848 billion for 2013 and $1.798 billion for 2012.
During February 2012, we issued $1.350 billion aggregate principal amount of 5.875% senior secured firstlien notes due 2022. After the payment of related fees and expenses, we used the net proceeds for generalcorporate purposes.
During October 2012, we issued $2.500 billion aggregate principal amount of notes, comprised of$1.250 billion of 4.75% senior secured first lien notes due 2023 and $1.250 billion of 5.875% senior unsecurednotes due 2023. After the payment of related fees and expenses, we used the net proceeds for general corporatepurposes, which included the repayment of an existing term loan due November 2013.
During December 2012, we issued $1.000 billion aggregate principal amount of 6.25% senior unsecurednotes due 2021. After the payment of related fees and expenses, we used the net proceeds to pay a distribution toour stockholders and holders of certain vested stock awards.
During March 2013, we redeemed all $201 million aggregate principal amount of our 97⁄8% senior securedsecond lien notes due 2017, at a redemption price of 104.938% of the principal amount. The pretax loss onretirement of debt related to this redemption was $17 million.
During November 2013, our $329 million senior secured European term loan facility matured.
Management believes that cash flows from operations, amounts available under our senior secured creditfacilities and our anticipated access to public and private debt markets will be sufficient to meet expectedliquidity needs during the next twelve months.
78
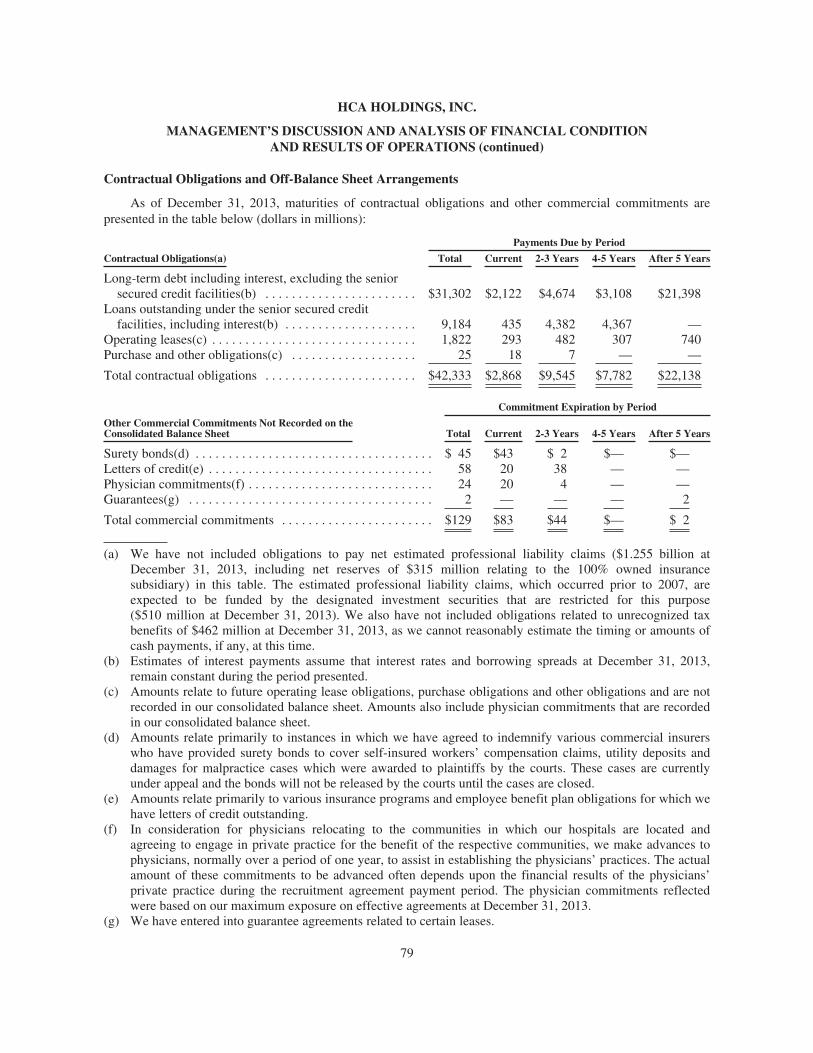
HCA HOLDINGS, INC.
MANAGEMENT’S DISCUSSION AND ANALYSIS OF FINANCIAL CONDITIONAND RESULTS OF OPERATIONS (continued)
Contractual Obligations and Off-Balance Sheet Arrangements
As of December 31, 2013, maturities of contractual obligations and other commercial commitments arepresented in the table below (dollars in millions):
Payments Due by Period
Contractual Obligations(a) Total Current 2-3 Years 4-5 Years After 5 Years
Long-term debt including interest, excluding the seniorsecured credit facilities(b) . . . . . . . . . . . . . . . . . . . . . . . $31,302 $2,122 $4,674 $3,108 $21,398
Loans outstanding under the senior secured creditfacilities, including interest(b) . . . . . . . . . . . . . . . . . . . . 9,184 435 4,382 4,367 —
Operating leases(c) . . . . . . . . . . . . . . . . . . . . . . . . . . . . . . . 1,822 293 482 307 740Purchase and other obligations(c) . . . . . . . . . . . . . . . . . . . 25 18 7 — —
Total contractual obligations . . . . . . . . . . . . . . . . . . . . . . . $42,333 $2,868 $9,545 $7,782 $22,138
Commitment Expiration by Period
Other Commercial Commitments Not Recorded on theConsolidated Balance Sheet Total Current 2-3 Years 4-5 Years After 5 Years
Surety bonds(d) . . . . . . . . . . . . . . . . . . . . . . . . . . . . . . . . . . . . $ 45 $43 $ 2 $— $—Letters of credit(e) . . . . . . . . . . . . . . . . . . . . . . . . . . . . . . . . . . 58 20 38 — —Physician commitments(f) . . . . . . . . . . . . . . . . . . . . . . . . . . . . 24 20 4 — —Guarantees(g) . . . . . . . . . . . . . . . . . . . . . . . . . . . . . . . . . . . . . 2 — — — 2
Total commercial commitments . . . . . . . . . . . . . . . . . . . . . . . $129 $83 $44 $— $ 2
(a) We have not included obligations to pay net estimated professional liability claims ($1.255 billion atDecember 31, 2013, including net reserves of $315 million relating to the 100% owned insurancesubsidiary) in this table. The estimated professional liability claims, which occurred prior to 2007, areexpected to be funded by the designated investment securities that are restricted for this purpose($510 million at December 31, 2013). We also have not included obligations related to unrecognized taxbenefits of $462 million at December 31, 2013, as we cannot reasonably estimate the timing or amounts ofcash payments, if any, at this time.
(b) Estimates of interest payments assume that interest rates and borrowing spreads at December 31, 2013,remain constant during the period presented.
(c) Amounts relate to future operating lease obligations, purchase obligations and other obligations and are notrecorded in our consolidated balance sheet. Amounts also include physician commitments that are recordedin our consolidated balance sheet.
(d) Amounts relate primarily to instances in which we have agreed to indemnify various commercial insurerswho have provided surety bonds to cover self-insured workers’ compensation claims, utility deposits anddamages for malpractice cases which were awarded to plaintiffs by the courts. These cases are currentlyunder appeal and the bonds will not be released by the courts until the cases are closed.
(e) Amounts relate primarily to various insurance programs and employee benefit plan obligations for which wehave letters of credit outstanding.
(f) In consideration for physicians relocating to the communities in which our hospitals are located andagreeing to engage in private practice for the benefit of the respective communities, we make advances tophysicians, normally over a period of one year, to assist in establishing the physicians’ practices. The actualamount of these commitments to be advanced often depends upon the financial results of the physicians’private practice during the recruitment agreement payment period. The physician commitments reflectedwere based on our maximum exposure on effective agreements at December 31, 2013.
(g) We have entered into guarantee agreements related to certain leases.
79
HCA HOLDINGS, INC.
MANAGEMENT’S DISCUSSION AND ANALYSIS OF FINANCIAL CONDITIONAND RESULTS OF OPERATIONS (continued)
Market Risk
We are exposed to market risk related to changes in market values of securities. The investments in debt andequity securities of our 100% owned insurance subsidiaries were $506 million and $4 million, respectively, atDecember 31, 2013. These investments are carried at fair value, with changes in unrealized gains and lossesbeing recorded as adjustments to other comprehensive income. At December 31, 2013, we had a net unrealizedgain of $10 million on the insurance subsidiaries’ investment securities.
We are exposed to market risk related to market illiquidity. Investments in debt and equity securities of our100% owned insurance subsidiaries could be impaired by the inability to access the capital markets. Should the100% owned insurance subsidiaries require significant amounts of cash in excess of normal cash requirements topay claims and other expenses on short notice, we may have difficulty selling these investments in a timelymanner or be forced to sell them at a price less than what we might otherwise have been able to in a normalmarket environment. We may be required to recognize other-than-temporary impairments on our investmentsecurities in future periods should issuers default on interest payments or should the fair market valuations of thesecurities deteriorate due to ratings downgrades or other issue-specific factors.
We are also exposed to market risk related to changes in interest rates, and we periodically enter intointerest rate swap agreements to manage our exposure to these fluctuations. Our interest rate swap agreementsinvolve the exchange of fixed and variable rate interest payments between two parties, based on commonnotional principal amounts and maturity dates. The notional amounts of the swap agreements represent balancesused to calculate the exchange of cash flows and are not our assets or liabilities. Our credit risk related to theseagreements is considered low because the swap agreements are with creditworthy financial institutions. Theinterest payments under these agreements are settled on a net basis. These derivatives have been recognized inthe financial statements at their respective fair values. Changes in the fair value of these derivatives, which aredesignated as cash flow hedges, are included in other comprehensive income, and changes in the fair value ofderivatives which have not been designated as hedges are recorded in operations.
With respect to our interest-bearing liabilities, approximately $3.540 billion of long-term debt atDecember 31, 2013 was subject to variable rates of interest, while the remaining balance in long-term debt of$24.836 billion at December 31, 2013 was subject to fixed rates of interest. Both the general level of interestrates and, for the senior secured credit facilities, our leverage affect our variable interest rates. Our variable debtis comprised primarily of amounts outstanding under the senior secured credit facilities. Borrowings under thesenior secured credit facilities bear interest at a rate equal to an applicable margin plus, at our option, either (a) abase rate determined by reference to the higher of (1) the federal funds rate plus 0.50% and (2) the prime rate ofBank of America or (b) a LIBOR rate for the currency of such borrowing for the relevant interest period. Theapplicable margin for borrowings under the senior secured credit facilities may fluctuate according to a leverageratio. The average effective interest rate for our long-term debt declined from 6.6% for 2012 to 6.5% for 2013.
The estimated fair value of our total long-term debt was $29.603 billion at December 31, 2013. Theestimates of fair value are based upon the quoted market prices for the same or similar issues of long-term debtwith the same maturities. Based on a hypothetical 1% increase in interest rates, the potential annualized reductionto future pretax earnings would be approximately $35 million. To mitigate the impact of fluctuations in interestrates, we generally target a portion of our debt portfolio to be maintained at fixed rates.
Our international operations and the related market risks associated with foreign currencies are currentlyinsignificant to our results of operations and financial position.
80
HCA HOLDINGS, INC.
MANAGEMENT’S DISCUSSION AND ANALYSIS OF FINANCIAL CONDITIONAND RESULTS OF OPERATIONS (continued)
Market Risk (continued)
Financial Instruments
Derivative financial instruments are employed to manage risks, including foreign currency and interest rateexposures, and are not used for trading or speculative purposes. We recognize derivative instruments, such asinterest rate swap agreements and foreign exchange contracts, in the consolidated balance sheets at fair value.Changes in the fair value of derivatives are recognized periodically either in earnings or in stockholders’ equity,as a component of other comprehensive income, depending on whether the derivative financial instrumentqualifies for hedge accounting, and if so, whether it qualifies as a fair value hedge or a cash flow hedge. Gainsand losses on derivatives designated as cash flow hedges, to the extent they are effective, are recorded in othercomprehensive income, and subsequently reclassified to earnings to offset the impact of the hedged items whenthey occur. Changes in the fair value of derivatives not qualifying as hedges, and for any portion of a hedge thatis ineffective, are reported in earnings.
The net interest paid or received on interest rate swaps is recognized as interest expense. Gains and lossesresulting from the early termination of interest rate swap agreements are deferred and amortized as adjustmentsto expense over the remaining period of the debt originally covered by the terminated swap.
Effects of Inflation and Changing Prices
Various federal, state and local laws have been enacted that, in certain cases, limit our ability to increaseprices. Revenues for general, acute care hospital services rendered to Medicare patients are established under thefederal government’s prospective payment system. Total fee-for-service Medicare revenues were 23.3%, 25.1%and 25.8% of our revenues for 2013, 2012 and 2011, respectively.
Management believes hospital industry operating margins have been, and may continue to be, undersignificant pressure because of changes in payer and service mix and growth in operating expenses in excess ofthe increase in prospective payments under the Medicare program. In addition, as a result of increasingregulatory and competitive pressures, our ability to maintain operating margins through price increases to non-Medicare patients is limited.
IRS Examinations
We expect the IRS Examination Division will begin an audit of HCA Holdings, Inc.’s 2011 federal incometax return in 2014.
Management believes HCA Holdings, Inc., its predecessors and affiliates properly reported taxable incomeand paid taxes in accordance with applicable laws and agreements established with the IRS and final resolutionof any disputes will not have a material, adverse effect on our results of operations or financial position.However, if payments due upon final resolution of any issues exceed our recorded estimates, such resolutionscould have a material, adverse effect on our results of operations or financial position.
81
Item 7A. Quantitative and Qualitative Disclosures about Market Risk
Information with respect to this Item is provided under the caption “Market Risk” under Item 7,“Management’s Discussion and Analysis of Financial Condition and Results of Operations.”
Item 8. Financial Statements and Supplementary Data
Information with respect to this Item is contained in our consolidated financial statements indicated in theIndex to Consolidated Financial Statements on Page F-1 of this annual report on Form 10-K.
Item 9. Changes in and Disagreements with Accountants on Accounting and Financial Disclosure
None.
Item 9A. Controls and Procedures
1. Conclusion Regarding the Effectiveness of Disclosure Controls and Procedures
Under the supervision and with the participation of our management, including our principal executiveofficer and principal financial officer, we conducted an evaluation of our disclosure controls and procedures, assuch term is defined under Rule 13a-15(e) promulgated under the Securities Exchange Act of 1934, as amended(the “Exchange Act”). Based on this evaluation, our principal executive officer and our principal financial officerconcluded that our disclosure controls and procedures were effective as of the end of the period covered by thisannual report.
2. Internal Control Over Financial Reporting
(a) Management’s Report on Internal Control Over Financial Reporting
Our management is responsible for establishing and maintaining effective internal control over financialreporting, as such term is defined in Exchange Act Rule 13a-15(f). Because of its inherent limitations, internalcontrol over financial reporting may not prevent or detect misstatements. Therefore, even those systemsdetermined to be effective, can provide only reasonable assurance with respect to financial statement preparationand presentation.
Under the supervision and with the participation of our management, including our principal executiveofficer and principal financial officer, we conducted an assessment of the effectiveness of our internal controlover financial reporting based on the framework in Internal Control — Integrated Framework issued by theCommittee of Sponsoring Organizations of the Treadway Commission (1992 framework). Based on ourassessment under the framework in Internal Control — Integrated Framework, our management concluded thatour internal control over financial reporting was effective as of December 31, 2013.
Ernst & Young, LLP, the independent registered public accounting firm that audited our consolidatedfinancial statements included in this Form 10-K, has issued a report on our internal control over financialreporting, which is included herein.
(b) Attestation Report of the Independent Registered Public Accounting Firm
82
Report of Independent Registered Public Accounting Firm
The Board of Directors and StockholdersHCA Holdings, Inc.
We have audited HCA Holdings, Inc.’s internal control over financial reporting as of December 31, 2013,based on criteria established in Internal Control — Integrated Framework issued by the Committee of SponsoringOrganizations of the Treadway Commission (1992 framework) (the “COSO criteria”). HCA Holdings, Inc.’smanagement is responsible for maintaining effective internal control over financial reporting, and for itsassessment of the effectiveness of internal control over financial reporting included in the accompanyingManagement’s Report on Internal Control Over Financial Reporting. Our responsibility is to express an opinionon the company’s internal control over financial reporting based on our audit.
We conducted our audit in accordance with the standards of the Public Company Accounting OversightBoard (United States). Those standards require that we plan and perform the audit to obtain reasonable assuranceabout whether effective internal control over financial reporting was maintained in all material respects. Ouraudit included obtaining an understanding of internal control over financial reporting, assessing the risk that amaterial weakness exists, testing and evaluating the design and operating effectiveness of internal control basedon the assessed risk, and performing such other procedures as we considered necessary in the circumstances. Webelieve that our audit provides a reasonable basis for our opinion.
A company’s internal control over financial reporting is a process designed to provide reasonable assuranceregarding the reliability of financial reporting and the preparation of financial statements for external purposes inaccordance with generally accepted accounting principles. A company’s internal control over financial reportingincludes those policies and procedures that (1) pertain to the maintenance of records that, in reasonable detail,accurately and fairly reflect the transactions and dispositions of the assets of the company; (2) provide reasonableassurance that transactions are recorded as necessary to permit preparation of financial statements in accordancewith generally accepted accounting principles, and that receipts and expenditures of the company are being madeonly in accordance with authorizations of management and directors of the company; and (3) provide reasonableassurance regarding prevention or timely detection of unauthorized acquisition, use, or disposition of thecompany’s assets that could have a material effect on the financial statements.
Because of its inherent limitations, internal control over financial reporting may not prevent or detectmisstatements. Also, projections of any evaluation of effectiveness to future periods are subject to the risk thatcontrols may become inadequate because of changes in conditions, or that the degree of compliance with thepolicies or procedures may deteriorate.
In our opinion, HCA Holdings, Inc. maintained, in all material respects, effective internal control overfinancial reporting as of December 31, 2013, based on the COSO criteria.
We also have audited, in accordance with the standards of the Public Company Accounting Oversight Board(United States), the consolidated balance sheets of HCA Holdings, Inc. as of December 31, 2013 and 2012, andthe related consolidated statements of income, stockholders’ deficit, and cash flows for each of the three years inthe period ended December 31, 2013 and our report dated February 26, 2014 expressed an unqualified opinionthereon.
/s/ Ernst & Young LLP
Nashville, TennesseeFebruary 26, 2014
83
(c) Changes in Internal Control Over Financial Reporting
During the fourth quarter of 2013, there have been no changes in our internal control over financialreporting that have materially affected or are reasonably likely to materially affect our internal control overfinancial reporting.
Item 9B. Other Information
None.
PART III
Item 10. Directors, Executive Officers and Corporate Governance
The information required by this Item regarding the identity and business experience of our directors andexecutive officers is set forth under the heading “Election of Directors” in the definitive proxy materials of HCAto be filed in connection with our 2014 Annual Meeting of Stockholders with respect to our directors and is setforth in Item 1 of Part I of this annual report on Form 10-K with respect to our executive officers. Theinformation required by this Item contained in such definitive proxy materials is incorporated herein byreference.
Information on the beneficial ownership reporting for our directors and executive officers required by thisItem is contained under the caption “Section 16(a) Beneficial Ownership Reporting Compliance” in the definitiveproxy materials to be filed in connection with our 2014 Annual Meeting of Stockholders and is incorporatedherein by reference.
Information on our Audit and Compliance Committee and Audit Committee Financial Experts required bythis Item is contained under the caption “Corporate Governance” in the definitive proxy materials to be filed inconnection with our 2014 Annual Meeting of Stockholders and is incorporated herein by reference.
We have a Code of Conduct which is applicable to all our directors, officers and employees (the “Code ofConduct”). The Code of Conduct is available on the Ethics and Compliance and Corporate Governance pages ofour website at www.hcahealthcare.com. To the extent required pursuant to applicable SEC regulations, we intendto post amendments to or waivers from our Code of Conduct (to the extent applicable to our chief executiveofficer, principal financial officer or principal accounting officer) at this location on our website or report thesame on a Current Report on Form 8-K. Our Code of Conduct is available free of charge upon request to ourCorporate Secretary, HCA Holdings, Inc., One Park Plaza, Nashville, TN 37203.
Item 11. Executive Compensation
The information required by this Item is set forth under the headings “Executive Compensation” and“Compensation Committee Interlocks and Insider Participation” in the definitive proxy materials to be filed inconnection with our 2014 Annual Meeting of Stockholders, which information is incorporated herein byreference.
Item 12. Security Ownership of Certain Beneficial Owners and Management and Related StockholderMatters
Information about security ownership of certain beneficial owners required by this Item is set forth underthe heading “Security Ownership of Certain Beneficial Owners and Management and Related StockholderMatters” in the definitive proxy materials to be filed in connection with our 2014 Annual Meeting ofStockholders, which information is incorporated herein by reference.
84
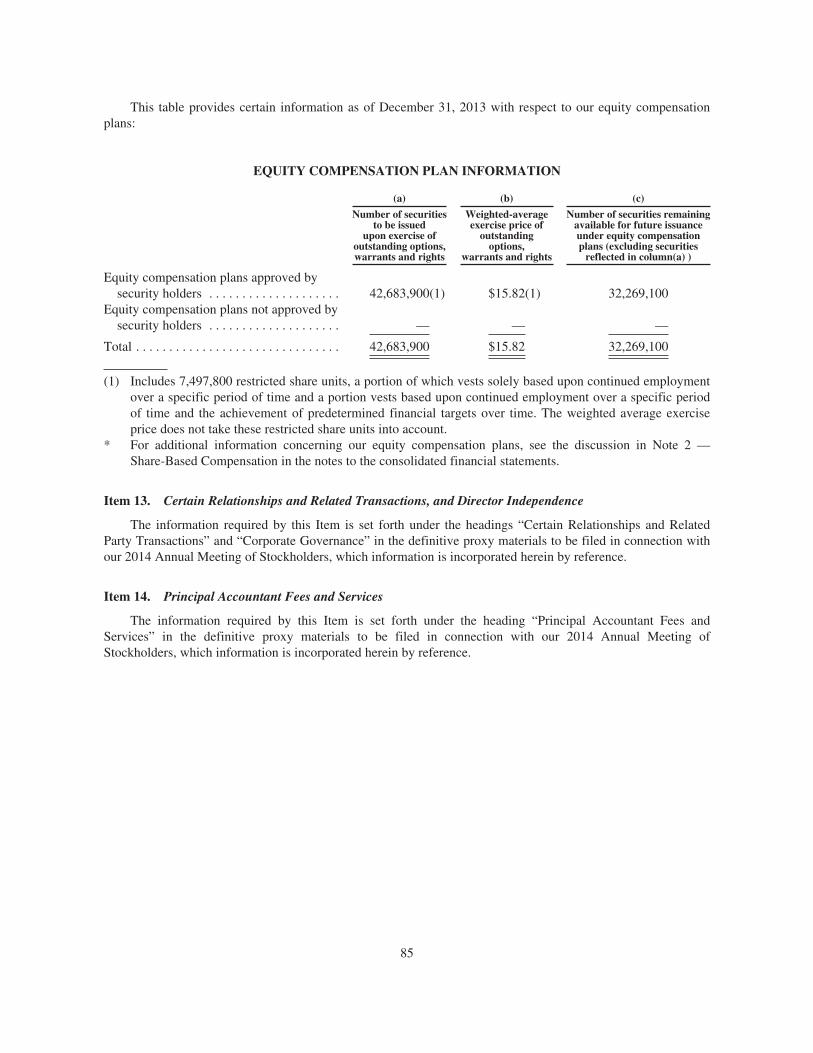
This table provides certain information as of December 31, 2013 with respect to our equity compensationplans:
EQUITY COMPENSATION PLAN INFORMATION
(a) (b) (c)
Number of securitiesto be issued
upon exercise ofoutstanding options,warrants and rights
Weighted-averageexercise price of
outstandingoptions,
warrants and rights
Number of securities remainingavailable for future issuanceunder equity compensationplans (excluding securities
reflected in column(a) )
Equity compensation plans approved bysecurity holders . . . . . . . . . . . . . . . . . . . . 42,683,900(1) $15.82(1) 32,269,100
Equity compensation plans not approved bysecurity holders . . . . . . . . . . . . . . . . . . . . — — —
Total . . . . . . . . . . . . . . . . . . . . . . . . . . . . . . . 42,683,900 $15.82 32,269,100
(1) Includes 7,497,800 restricted share units, a portion of which vests solely based upon continued employmentover a specific period of time and a portion vests based upon continued employment over a specific periodof time and the achievement of predetermined financial targets over time. The weighted average exerciseprice does not take these restricted share units into account.
* For additional information concerning our equity compensation plans, see the discussion in Note 2 —Share-Based Compensation in the notes to the consolidated financial statements.
Item 13. Certain Relationships and Related Transactions, and Director Independence
The information required by this Item is set forth under the headings “Certain Relationships and RelatedParty Transactions” and “Corporate Governance” in the definitive proxy materials to be filed in connection withour 2014 Annual Meeting of Stockholders, which information is incorporated herein by reference.
Item 14. Principal Accountant Fees and Services
The information required by this Item is set forth under the heading “Principal Accountant Fees andServices” in the definitive proxy materials to be filed in connection with our 2014 Annual Meeting ofStockholders, which information is incorporated herein by reference.
85
PART IV
Item 15. Exhibits and Financial Statement Schedules
(a) Documents filed as part of the report:
1. Financial Statements. The accompanying Index to Consolidated Financial Statements on page F-1 ofthis annual report on Form 10-K is provided in response to this item.
2. List of Financial Statement Schedules. All schedules are omitted because the required information iseither not present, not present in material amounts or presented within the consolidated financial statements.
3. List of Exhibits
2.1 — Agreement and Plan of Merger, dated July 24, 2006, by and among HCA Inc., Hercules Holding II,LLC and Hercules Acquisition Corporation (filed as Exhibit 2.1 to the Company’s Current Report onForm 8-K filed July 25, 2006 (File No. 001-11239), and incorporated herein by reference).
2.2 — Merger Agreement, dated November 22, 2010, by and among HCA Inc., HCA Holdings, Inc.,and HCA Merger Sub LLC (filed as Exhibit 2.1 to the Company’s Current Report on Form 8-Kfiled November 24, 2010, and incorporated herein by reference).
2.3 — Membership Interest Purchase Agreement by and between HealthONE, D/B/A The ColoradoHealth Foundation, and HealthONE of Denver, Inc., dated August 2, 2011 (Registrant agrees tofurnish supplementally a copy of any omitted schedule to the Securities and ExchangeCommission upon request) (filed as Exhibit 2.1 to the Company’s Quarterly Report onForm 10-Q for the quarter ended June 30, 2011, and incorporated herein by reference).
3.1 — Amended and Restated Certificate of Incorporation of the Company (filed as Exhibit 3.1 to theCompany’s Registration Statement on Form S-1 (File No. 333-171369), and incorporated hereinby reference).
3.2 — Amended and Restated Bylaws of the Company (filed as Exhibit 3.2 to the Company’s RegistrationStatement on Form S-1 (File No. 333-171369), and incorporated herein by reference).
4.1 — Specimen Certificate for shares of Common Stock, par value $0.01 per share, of the Company.(filed as Exhibit 4.1 to the Company’s Registration Statement on Form S-1(File No. 333-171369), and incorporated herein by reference).
4.2 — Security Agreement, dated as of November 17, 2006, among HCA Inc., the subsidiary grantorsparty thereto and The Bank of New York, as collateral agent (filed as Exhibit 4.2 to theCompany’s Current Report on Form 8-K filed November 24, 2006 (File No. 001-11239), andincorporated herein by reference).
4.3 — Pledge Agreement, dated as of November 17, 2006, among HCA Inc., the subsidiary pledgorsparty thereto and The Bank of New York, as collateral agent (filed as Exhibit 4.3 to theCompany’s Current Report of Form 8-K filed November 24, 2006 (File No. 001-11239), andincorporated herein by reference).
4.4(a) — $13,550,000,000 — €1,000,000,000 Credit Agreement, dated as of November 17, 2006, amongHCA Inc., HCA UK Capital Limited, the lending institutions from time to time parties thereto,Banc of America Securities LLC, J.P. Morgan Securities Inc., Citigroup Global Markets Inc.and Merrill Lynch, Pierce, Fenner & Smith Incorporated, as joint lead arrangers and jointbookrunners, Bank of America, N.A., as administrative agent, JPMorgan Chase Bank, N.A. andCiticorp North America, Inc., as co-syndication agents and Merrill Lynch Capital Corporation,as documentation agent (filed as Exhibit 4.8 to the Company’s Current Report on Form 8-Kfiled November 24, 2006 (File No. 001-11239), and incorporated herein by reference).
86

4.4(b) — Amendment No. 1 to the Credit Agreement, dated as of February 16, 2007, among HCA Inc.,HCA UK Capital Limited, the lending institutions from time to time parties thereto, Bank ofAmerica, N.A., as administrative agent, JPMorgan Chase Bank, N.A., and Citicorp NorthAmerica, Inc., as Co-Syndication Agents, Banc of America Securities, LLC, J.P. MorganSecurities Inc., Citigroup Global Markets Inc. and Merrill Lynch, Pierce, Fenner & SmithIncorporated, as joint lead arrangers and bookrunners, Deutsche Bank Securities and WachoviaCapital Markets LLC, as joint bookrunners and Merrill Lynch Capital Corporation, asdocumentation agent (filed as Exhibit 4.7(b) to the Company’s Annual Report on Form 10-K forthe fiscal year ended December 31, 2006 (File No. 001-11239), and incorporated herein byreference).
4.4(c) — Amendment No. 2 to the Credit Agreement, dated as of March 2, 2009, among HCA Inc., HCAUK Capital Limited, the lending institutions from time to time parties thereto, Bank of America,N.A., as administrative agent, JPMorgan Chase Bank, N.A., and Citicorp North America, Inc.,as Co-Syndication Agents, Banc of America Securities, LLC, J.P. Morgan Securities Inc.,Citigroup Global Markets Inc. and Merrill Lynch, Pierce, Fenner & Smith Incorporated, as jointlead arrangers and bookrunners, Deutsche Bank Securities and Wachovia Capital Markets LLC,as joint bookrunners and Merrill Lynch Capital Corporation, as documentation agent (filed asexhibit 4.8(c) to the Company’s Annual Report on Form 10-K for the fiscal year endedDecember 31, 2008 (File No. 001-11239), and incorporated herein by reference).
4.4(d) — Amendment No. 3 to the Credit Agreement, dated as of June 18, 2009, among HCA Inc., HCAUK Capital Limited, the lending institutions from time to time parties thereto, Bank of America,N.A., as administrative agent, JPMorgan Chase Bank, N.A., and Citicorp North America, Inc.,as Co-Syndication Agents, Banc of America Securities, LLC, J.P. Morgan Securities Inc.,Citigroup Global Markets Inc. and Merrill Lynch, Pierce, Fenner & Smith Incorporated, as jointlead arrangers and bookrunners, Deutsche Bank Securities and Wachovia Capital Markets LLC,as joint bookrunners and Merrill Lynch Capital Corporation, as documentation agent (filed asExhibit 4.1 to the Company’s Current Report on Form 8-K filed June 22, 2009, and incorporatedherein by reference).
4.4(e) — Extension Amendment No. 1 to the Credit Agreement, dated as of April 6, 2010, among HCAInc., HCA UK Capital Limited, the lending institutions from time to time parties thereto, Bankof America, N.A., as administrative agent and collateral agent (filed as Exhibit 10.1 to theCompany’s Current Report on Form 8-K filed April 8, 2010, and incorporated herein byreference).
4.4(f) — Amended and Restated Joinder Agreement No. 1, dated as of November 8, 2010, by and amongeach of the financial institutions listed as a “Replacement-1 Revolving Credit Lender” onSchedule A thereto, HCA Inc., Bank of America, N.A., as Administrative Agent and asCollateral Agent, and the other parties listed on the signature pages thereto (filed as Exhibit 4.1to the Company’s Quarterly Report on Form 10-Q filed November 9, 2010, and incorporatedherein by reference).
4.4(g) — Restatement Agreement, dated as of May 4, 2011, by and among HCA Inc., HCA UK CapitalLimited, the lenders party thereto and Bank of America, N.A., as administrative agent andcollateral agent to the Credit Agreement, dated as of November 17, 2006, as amended onFebruary 16, 2007, March 2, 2009, June 18, 2009, April 6, 2010 and November 8, 2010 (filed asExhibit 10.1 to the Company’s Current Report on Form 8-K filed May 9, 2011, and incorporatedherein by reference).
4.4(h) — Extension Amendment No. 1, dated as of April 25, 2012, by and among HCA Inc., HCA UKCapital Limited, each of the U.S. Guarantors, each of the European Guarantors, the lenders partythereto and Bank of America, N.A., as administrative agent, swingline lender and letter of creditissuer (filed as Exhibit 10.1 to the Company’s Current Report on Form 8-K filed April 25, 2012,and incorporated herein by reference).
87
4.4(i) — Joinder Agreement No. 1, dated as of October 22, 2012, by and among each of the financialinstitutions listed as a “Replacement-2012 Revolving Credit Lender” on Schedule A thereto,HCA Inc., Bank of America, N.A., as Administrative Agent and as Collateral Agent, and theother parties listed on the signature pages thereto (filed as Exhibit 4.1 to the Company’sCurrent Report on Form 8-K filed October 23, 2012, and incorporated herein by reference).
4.4(j) — Joinder Agreement, dated as of April 25, 2013, by and among HCA Inc., as borrower, Bank ofAmerica, N.A., as administrative agent and collateral agent and the lenders party thereto (filedas Exhibit 4.1 to the Company’s Current Report on Form 8-K filed May 1, 2013, andincorporated herein by reference).
4.4(k) — Joinder Agreement No. 2, dated as of May 3, 2013, by and among HCA Inc., as borrower,Bank of America, N. A., as administrative agent and collateral agent and the lenders partythereto (filed as Exhibit 4.1 to the Company’s Current Report on Form 8-K filed May 9, 2013,and incorporated herein by reference).
4.4(l) — Joinder Agreement No. 3, dated as of May 22, 2013, by and among HCA Inc., as borrower,Bank of America, N. A., as administrative agent and collateral agent and the lenders partythereto (filed as Exhibit 4.1 to the Company’s Current Report on Form 8-K filed May 28, 2013,and incorporated herein by reference).
4.5 — Indenture, dated as of April 22, 2009, among HCA Inc., the guarantors party thereto, DeutscheBank Trust Company Americas, as paying agent, registrar and transfer agent, and LawDebenture Trust Company of New York, as trustee (filed as Exhibit 4.1 to the Company’sCurrent Report on Form 8-K filed April 28, 2009, and incorporated herein by reference).
4.6 — Security Agreement, dated as November 17, 2006, and amended and restated as of March 2,2009, among the Company, the Subsidiary Grantors named therein and Bank of America, N.A.,as Collateral Agent (filed as exhibit 4.10 to the Company’s Annual Report on Form 10-K forthe fiscal year ended December 31, 2008 (File No. 001-11239), and incorporated herein byreference).
4.7 — Pledge Agreement, dated as of November 17, 2006, and amended and restated as of March 2,2009, among the Company, the Subsidiary Pledgors named therein and Bank of America, N.A.,as Collateral Agent (filed as exhibit 4.11 to the Company’s Annual Report on Form 10-K forthe fiscal year ended December 31, 2008 (File No. 001-11239), and incorporated herein byreference).
4.8 — Form of 81⁄2% Senior Secured Notes due 2019 (included in Exhibit 4.5).
4.9 — Indenture, dated as of August 11, 2009, among HCA Inc., the guarantors party thereto,Deutsche Bank Trust Company Americas, as paying agent, registrar and transfer agent, andLaw Debenture Trust Company of New York, as trustee (filed as Exhibit 4.1 to the Company’sCurrent Report on Form 8-K filed August 17, 2009, and incorporated herein by reference).
4.10 — Form of 77⁄8% Senior Secured Notes due 2020 (included in Exhibit 4.9).
4.11 — Indenture, dated as of March 10, 2010, among HCA Inc., the guarantors party thereto,Deutsche Bank Trust Company Americas, as paying agent, registrar and transfer agent, andLaw Debenture Trust Company of New York, as trustee (filed as Exhibit 4.1 to the Company’sCurrent Report on Form 8-K filed March 12, 2010, and incorporated herein by reference).
4.12 — Form of 71⁄4% Senior Secured Notes due 2020 (included in Exhibit 4.11).
4.13 — $2,500,000,000 Credit Agreement, dated as of September 30, 2011, by and among HCA Inc.,the subsidiary borrowers party thereto, the lenders from time to time party thereto and Bank ofAmerica, N.A., as administrative agent (filed as Exhibit 4.4 to the Company’s Current Reporton Form 8-K filed October 3, 2011, and incorporated herein by reference).
88

4.14 — Security Agreement, dated as of September 30, 2011, by and among HCA Inc., the subsidiaryborrowers party thereto and Bank of America, N.A., as collateral agent (filed as Exhibit 4.5 tothe Company’s Current Report on Form 8-K filed October 3, 2011, and incorporated herein byreference).
4.15(a) — General Intercreditor Agreement, dated as of November 17, 2006, between Bank of America,N.A., as First Lien Collateral Agent, and The Bank of New York, as Junior Lien CollateralAgent (filed as Exhibit 4.13(a) to the Company’s Registration Statement on Form S-4(File No. 333-145054), and incorporated herein by reference).
4.15(b) — Additional General Intercreditor Agreement, dated as of April 22, 2009, by and among Bank ofAmerica, N.A., in its capacity as First Lien Collateral Agent, The Bank of New York Mellon,in its capacity as Junior Lien Collateral Agent and in its capacity as 2006 Second Lien Trusteeand The Bank of New York Mellon Trust Company, N.A., in its capacity as 2009 Second LienTrustee (filed as Exhibit 4.6 to the Company’s Current Report on Form 8-K filed April 28,2009, and incorporated herein by reference).
4.15(c) — Additional General Intercreditor Agreement, dated as of August 11, 2009, by and among Bankof America, N.A., in its capacity as First Lien Collateral Agent, The Bank of New YorkMellon, in its capacity as Junior Lien Collateral Agent and in its capacity as trustee for theSecond Lien Notes issued on November 17, 2006, and The Bank of New York MellonTrust Company, N.A., in its capacity as trustee for the Second Lien Notes issued onFebruary 19, 2009 (filed as Exhibit 4.6 to the Company’s Current Report on Form 8-K filedAugust 17, 2009, and incorporated herein by reference).
4.15(d) — Receivables Intercreditor Agreement, dated as of November 17, 2006, among Bank of America,N.A., as ABL Collateral Agent, Bank of America, N.A., as CF Collateral Agent and The Bank ofNew York, as Bonds Collateral Agent (filed as Exhibit 4.13(b) to the Company’s RegistrationStatement on Form S-4 (File No. 333-145054), and incorporated herein by reference).
4.15(e) — Additional Receivables Intercreditor Agreement, dated as of April 22, 2009, by and betweenBank of America, N.A. as ABL Collateral Agent, and Bank of America, N.A. as New FirstLien Collateral Agent (filed as Exhibit 4.7 to the Company’s Current Report on Form 8-K filedApril 28, 2009, and incorporated herein by reference).
4.15(f) — Additional Receivables Intercreditor Agreement, dated as of August 11, 2009, by and betweenBank of America, N.A., as ABL Collateral Agent, and Bank of America, N.A., as New FirstLien Collateral Agent (filed as Exhibit 4.7 to the Company’s Current Report on Form 8-K filedAugust 17, 2009, and incorporated herein by reference).
4.15(g) — First Lien Intercreditor Agreement, dated as of April 22, 2009, among Bank of America, N.A.as Collateral Agent, Bank of America, N.A. as Authorized Representative under the CreditAgreement and Law Debenture Trust Company of New York as the Initial AdditionalAuthorized Representative (filed as Exhibit 4.5 to the Company’s Current Report on Form 8-Kfiled April 28, 2009, and incorporated herein by reference).
4.15(h) — Additional General Intercreditor Agreement, dated as of August 1, 2011, by and among Bankof America, N.A., in its capacity as First Lien Collateral Agent, The Bank of New YorkMellon, in its capacity as Junior Lien Collateral Agent and in its capacity as trustee for theSecond Lien Notes issued on November 17, 2006, and The Bank of New York Mellon TrustCompany, N.A., in its capacity as trustee for the Second Lien Notes issued on February 19,2009 (filed as Exhibit 4.9 to the Company’s Current Report on Form 8-K filed August 1, 2011,and incorporated herein by reference).
4.15(i) — Additional Receivables Intercreditor Agreement, dated as of August 1, 2011 by and betweenBank of America, N.A., as ABL Collateral Agent, and Bank of America, N.A., as New FirstLien Collateral Agent (filed as Exhibit 4.1 to the Company’s Current Report on Form 8-K filedOctober 3, 2011, and incorporated herein by reference).
89

4.15(j) — Additional General Intercreditor Agreement, dated as of February 16, 2012, by and amongBank of America, N.A., in its capacity as First Lien Collateral Agent, The Bank of New YorkMellon, in its capacity as Junior Lien Collateral Agent and in its capacity as trustee for theSecond Lien Notes issued on November 17, 2006, and The Bank of New York Mellon TrustCompany, N.A., in its capacity as trustee for the Second Lien Notes issued on February 19,2009 (filed as Exhibit 4.9 to the Company’s Current Report on Form 8-K filed February 16,2012, and incorporated herein by reference).
4.15(k) — Additional Receivables Intercreditor Agreement, dated as of February 16, 2012, by andbetween Bank of America, N.A., as ABL Collateral Agent, and Bank of America, N.A., asNew First Lien Collateral Agent (filed as Exhibit 4.10 to the Company’s Current Report onForm 8-K filed February 16, 2012, and incorporated herein by reference).
4.15(l) — Additional General Intercreditor Agreement, dated as of October 23, 2012, by and among Bankof America, N.A., in its capacity as First Lien Collateral Agent, The Bank of New YorkMellon, in its capacity as Junior Lien Collateral Agent and in its capacity as trustee for theSecond Lien Notes issued on November 17, 2006, and The Bank of New York Mellon TrustCompany, N.A., in its capacity as trustee for the Second Lien Notes issued on February 19,2009 (filed as Exhibit 4.10 to the Company’s Current Report on Form 8-K filed October 23,2012, and incorporated herein by reference).
4.15(m) — Additional Receivables Intercreditor Agreement, dated as of October 23, 2012, by and betweenBank of America, N.A., as ABL Collateral Agent, and Bank of America, N.A., as New FirstLien Collateral Agent (filed as Exhibit 4.11 to the Company’s Current Report on Form 8-Kfiled October 23, 2012, and incorporated herein by reference).
4.16 — Registration Rights Agreement, dated as of November 22, 2010, among HCA Holdings, Inc.,Hercules Holding II, LLC and certain other parties thereto (filed as Exhibit 4.4 to theCompany’s Current Report on Form 8-K filed November 24, 2010, and incorporated herein byreference).
4.17 — Registration Rights Agreement, dated as of March 16, 1989, by and among HCA-HospitalCorporation of America and the persons listed on the signature pages thereto (filed asExhibit 4.14 to the Company’s Registration Statement on Form S-4 (File No. 333-145054), andincorporated herein by reference).
4.18 — Assignment and Assumption Agreement, dated as of February 10, 1994, between HCA-Hospital Corporation of America and the Company relating to the Registration RightsAgreement, as amended (filed as Exhibit 4.15 to the Company’s Registration Statement onForm S-4 (File No. 333-145054), and incorporated herein by reference).
4.19(a) — Indenture, dated as of December 16, 1993 between the Company and The First National Bankof Chicago, as Trustee (filed as Exhibit 4.16(a) to the Company’s Registration Statement onForm S-4 (File No. 333-145054), and incorporated herein by reference).
4.19(b) — First Supplemental Indenture, dated as of May 25, 2000 between the Company and Bank OneTrust Company, N.A., as Trustee (filed as Exhibit 4.16(b) to the Company’s RegistrationStatement on Form S-4 (File No. 333-145054), and incorporated herein by reference).
4.19(c) — Second Supplemental Indenture, dated as of July 1, 2001 between the Company and Bank OneTrust Company, N.A., as Trustee (filed as Exhibit 4.16(c) to the Company’s RegistrationStatement on Form S-4 (File No. 333-145054), and incorporated herein by reference).
4.19(d) — Third Supplemental Indenture, dated as of December 5, 2001 between the Company and TheBank of New York, as Trustee (filed as Exhibit 4.16(d) to the Company’s RegistrationStatement on Form S-4 (File No. 333-145054), and incorporated herein by reference).
90

4.19(e) — Fourth Supplemental Indenture, dated as of November 14, 2006, between the Company andThe Bank of New York, as Trustee (filed as Exhibit 4.1 to the Company’s Current Report onForm 8-K filed November 16, 2006 (File No. 001-11239), and incorporated herein byreference).
4.20 — Form of 7.5% Debentures due 2023 (filed as Exhibit 4.17 to the Company’s RegistrationStatement on Form S-4 (File No. 333-145054), and incorporated herein by reference).
4.21 — Form of 8.36% Debenture due 2024 (filed as Exhibit 4.18 to the Company’s RegistrationStatement on Form S-4 (File No. 333-145054), and incorporated herein by reference).
4.22 — Form of Fixed Rate Global Medium-Term Note (filed as Exhibit 4.19 to the Company’sRegistration Statement on Form S-4 (File No. 333-145054), and incorporated herein byreference).
4.23 — Form of Floating Rate Global Medium-Term Note (filed as Exhibit 4.20 to the Company’sRegistration Statement on Form S-4 (File No. 333-145054), and incorporated herein byreference).
4.24 — Form of 7.69% Note due 2025 (filed as Exhibit 4.10 to the Company’s Annual Report onForm 10-K for the fiscal year ended December 31, 2004 (File No. 001-11239), andincorporated herein by reference).
4.25 — Form of 7.19% Debenture due 2015 (filed as Exhibit 4.22 to the Company’s RegistrationStatement on Form S-4 (File No. 333-145054), and incorporated herein by reference).
4.26 — Form of 7.50% Debenture due 2095 (filed as Exhibit 4.23 to the Company’s RegistrationStatement on Form S-4 (File No. 333-145054), and incorporated herein by reference).
4.27 — Form of 7.05% Debenture due 2027 (filed as Exhibit 4.24 to the Company’s RegistrationStatement on Form S-4 (File No. 333-145054), and incorporated herein by reference).
4.28 — 7.50% Note due 2033 in the principal amount of $250,000,000 (filed as Exhibit 4.2 to theCompany’s Current Report on Form 8-K dated November 6, 2003 (File No. 001-11239), andincorporated herein by reference).
4.29 — 5.75% Note due 2014 in the principal amount of $500,000,000 (filed as Exhibit 4.1 to theCompany’s Current Report on Form 8-K dated March 8, 2004 (File No. 001-11239), andincorporated herein by reference).
4.30(a) — 6.375% Note due 2015 in the principal amount of $500,000,000 (filed as Exhibit 4.2 to theCompany’s Current Report on Form 8-K dated November 16, 2004 (File No. 001-11239), andincorporated herein by reference).
4.30(b) — 6.375% Note due 2015 in the principal amount of $250,000,000 (filed as Exhibit 4.3 to theCompany’s Current Report on Form 8-K dated November 16, 2004 (File No. 001-11239), andincorporated herein by reference).
4.31(a) — 6.500% Note due 2016 in the principal amount of $500,000,000 (filed as Exhibit 4.1 to theCompany’s Current Report on Form 8-K filed on February 8, 2006 (File No. 001-11239), andincorporated herein by reference).
4.31(b) — 6.500% Note due 2016 in the principal amount of $500,000,000 (filed as Exhibit 4.2 to theCompany’s Current Report on Form 8-K filed on February 8, 2006 (File No. 001-11239), andincorporated herein by reference).
4.32 — Indenture, dated as of November 23, 2010, among HCA Holdings, Inc., Deutsche BankTrust Company Americas, as paying agent, registrar and transfer agent, and Law DebentureTrust Company of New York, as trustee (filed as Exhibit 4.1 to the Company’s Current Reporton Form 8-K filed November 24, 2010, and incorporated herein by reference).
91

4.33 — Form of 73/4% Senior Notes due 2021 (included in Exhibit 4.32).
4.34 — Form of Indenture of HCA Inc. (filed as Exhibit 4.2 to the Registrant’s Registration Statementon Form S-3 (File No. 333-175791), and incorporated herein by reference).
4.35 — Supplemental Indenture No. 1, dated as of August 1, 2011, among HCA Inc., HCA Holdings, Inc.,Law Debenture Trust Company of New York, as trustee, and Deutsche Bank Trust CompanyAmericas, as paying agent, registrar and transfer agent (filed as Exhibit 4.2 to the Company’sCurrent Report on Form 8-K filed August 1, 2011, and incorporated herein by reference).
4.36 — Supplemental Indenture No. 2, dated as of August 1, 2011, among HCA Inc., HCA Holdings,Inc., the subsidiary guarantors named therein, Law Debenture Trust Company of New York, astrustee, and Deutsche Bank Trust Company Americas, as paying agent, registrar and transferagent (filed as Exhibit 4.3 to the Company’s Current Report on Form 8-K filed August 1, 2011,and incorporated herein by reference).
4.37 — Form of 7.50% Senior Notes Due 2022 (included in Exhibit 4.35).
4.38 — Form of 6.50% Senior Secured Notes Due 2020 (included in Exhibit 4.36).
4.39 — Supplemental Indenture No. 3, dated as of October 3, 2011, among HCA Inc., HCA Holdings, Inc.,Law Debenture Trust Company of New York, as trustee, and Deutsche Bank Trust CompanyAmericas, as paying agent, registrar and transfer agent (filed as Exhibit 4.2 to the Company’sCurrent Report on Form 8-K filed October 3, 2011, and incorporated herein by reference).
4.40 — Form of 8.00% Senior Notes Due 2018 (included in Exhibit 4.39).
4.41 — Supplemental Indenture No. 4, dated as of February 16, 2012, among HCA Inc., HCAHoldings, Inc., the subsidiary guarantors named therein, Law Debenture Trust Company ofNew York, as trustee, and Deutsche Bank Trust Company Americas, as paying agent, registrarand transfer agent (filed as Exhibit 4.2 to the Company’s Current Report on Form 8-K filedFebruary 16, 2012, and incorporated herein by reference).
4.42 — Form of 5.875% Senior Secured Notes due 2022 (included in Exhibit 4.41).
4.43 — Supplemental Indenture No. 5, dated as of October 23, 2012, among HCA Inc., HCA Holdings,Inc., Law Debenture Trust Company of New York, as trustee, and Deutsche Bank TrustCompany Americas, as paying agent, registrar and transfer agent (Unsecured Notes) (filed asExhibit 4.3 to the Company’s Current Report on Form 8-K filed October 23, 2012, andincorporated herein by reference).
4.44 — Supplemental Indenture No. 6, dated as of October 23, 2012, among HCA Inc., HCA Holdings,Inc., the subsidiary guarantors named therein, Law Debenture Trust Company of New York, astrustee, and Deutsche Bank Trust Company Americas, as paying agent, registrar and transferagent (Secured Notes) (filed as Exhibit 4.4 to the Company’s Current Report on Form 8-K filedOctober 23, 2012, and incorporated herein by reference).
4.45 — Form of 5.875% Senior Notes due 2023 (included in Exhibit 4.43).
4.46 — Form of 4.75% Senior Secured Notes due 2023 (included in Exhibit 4.44).
4.47 — Indenture, dated as of December 6, 2012, among HCA Holdings, Inc., Law Debenture TrustCompany of New York, as trustee, and Deutsche Bank Trust Company Americas, as registrar,paying agent and transfer agent (filed as Exhibit 4.1 to the Company’s Current Report onForm 8-K filed December 6, 2012, and incorporated herein by reference).
4.48 — Supplemental Indenture No. 1, dated as of December 6, 2012, among HCA Holdings, Inc., LawDebenture Trust Company of New York, as trustee, and Deutsche Bank Trust CompanyAmericas, as registrar, paying agent and transfer agent (filed as Exhibit 4.2 to the Company’sCurrent Report on Form 8-K filed December 6, 2012, and incorporated herein by reference).
92
4.49 — Form of 6.25% Senior Notes due 2021 (included in Exhibit 4.48)
10.1 — HCA-Hospital Corporation of America Nonqualified Initial Option Plan (filed as Exhibit 4.6 tothe Company’s Registration Statement on Form S-3 (File No. 33-52379), and incorporatedherein by reference).*
10.2 — Form of Indemnity Agreement with certain officers and directors (filed as Exhibit 10.3 to theCompany’s Registration Statement on Form S-4 (File No. 333-145054) and incorporatedherein by reference).
10.3 — Columbia/HCA Healthcare Corporation 2000 Equity Incentive Plan (filed as Exhibit A to theCompany’s Proxy Statement for the Annual Meeting of Stockholders on May 25, 2000 (FileNo. 001-11239), and incorporated herein by reference).*
10.4 — Form of Non-Qualified Stock Option Award Agreement (Officers) (filed as Exhibit 99.2 to theCompany’s Current Report on Form 8-K dated February 2, 2005 (File No. 001-11239), andincorporated herein by reference).*
10.5 — HCA 2005 Equity Incentive Plan (filed as Exhibit B to the Company’s Proxy Statement for theAnnual Meeting of Shareholders on May 26, 2005 (File No. 001-11239), and incorporatedherein by reference).*
10.6 — Form of 2005 Non-Qualified Stock Option Agreement (Officers) (filed as Exhibit 99.2 to theCompany’s Current Report on Form 8-K dated October 6, 2005 (File No. 001-11239), andincorporated herein by reference).*
10.7 — Form of 2006 Non-Qualified Stock Option Award Agreement (Officers) (filed as Exhibit 10.2to the Company’s Current Report on Form 8-K dated February 1, 2006 (File No. 001-11239),and incorporated herein by reference).*
10.8(a) — 2006 Stock Incentive Plan for Key Employees of HCA Holdings, Inc. and its Affiliates asAmended and Restated (filed as Exhibit 10.11(b) to the Company’s Registration Statement onForm S-1 (File No. 333-171369), and incorporated herein by reference).*
10.8(b) — First Amendment to 2006 Stock Incentive Plan for Key Employees of HCA Holdings, Inc. andits Affiliates, as amended and restated (filed as Exhibit 10.1 to the Company’s QuarterlyReport on Form 10-Q for the quarter ended June 30, 2011, and incorporated herein byreference).*
10.8(c) — Second Amendment to the 2006 Stock Incentive Plan for Key Employees of HCA Holdings,Inc. and its Affiliates, as amended and restated (filed as Exhibit 10.1 to the Company’sQuarterly Report on Form 10-Q for the quarter ended March 31, 2013, and incorporated hereinby reference).*
10.9(a) — Management Stockholder’s Agreement dated November 17, 2006 (filed as Exhibit 10.12 to theCompany’s Annual Report on Form 10-K for the fiscal year ended December 31, 2006 (FileNo. 001-11239), and incorporated herein by reference).
10.9(b) — Form of Omnibus Amendment to HCA Holdings, Inc’s Management Stockholder’sAgreements (filed as Exhibit 10.39 to the Company’s Registration Statement on Form S-1(File No. 333-171369), and incorporated herein by reference).
10.10 — Form of Option Rollover Agreement (filed as Exhibit 10.14 to the Company’s Annual Reporton Form 10-K for the fiscal year ended December 31, 2006 (File No. 001-11239), andincorporated herein by reference).*
10.11 — Form of Stock Option Agreement (2007) (filed as Exhibit 10.15 to the Company’s AnnualReport on Form 10-K for the fiscal year ended December 31, 2006 (File No. 001-11239), andincorporated herein by reference).*
93

10.12 — Form of Stock Option Agreement (2008) (filed as Exhibit 10.16 to the Company’s AnnualReport on Form 10-K for the fiscal year ended December 31, 2007 (File No. 001-11239), andincorporated herein by reference).*
10.13 — Form of Stock Option Agreement (2009) (filed as Exhibit 10.17 to the Company’s AnnualReport on Form 10-K for the fiscal year ended December 31, 2008 (File No. 001-11239), andincorporated herein by reference).*
10.14 — Form of Stock Option Agreement (2010) (filed as Exhibit 10.20 to the Company’s Annual Reporton Form 10-K for the fiscal year ended December 31, 2009, and incorporated herein by reference).*
10.15 — Form of 2x Time Stock Option Agreement (filed as Exhibit 10.2 to the Company’s QuarterlyReport on Form 10-Q for the quarterly period ended September 30, 2009, and incorporatedherein by reference).*
10.16 — Form Stock Option Agreement (2011) (filed as Exhibit 10.1 to the Company’s Quarterly Report onForm 10-Q for the quarter ended September 30, 2011, and incorporated herein by reference).*
10.17(a) — Form of Stock Appreciation Right Award Agreement Under the 2006 Stock Incentive Plan forKey Employees of HCA Holdings, Inc. and its Affiliates, as Amended and Restated (filed asExhibit 10.1 to the Company’s Current Report on Form 8-K filed February 14, 2012, andincorporated herein by reference).*
10.17(b) — Form of 2014 Stock Appreciation Right Award Agreement Under the 2006 Stock IncentivePlan for Key Employees of HCA Holdings, Inc. and its Affiliates, as Amended and Restated.*
10.18 — Form of Director Restricted Share Unit Agreement (Initial Award) Under the 2006 StockIncentive Plan for Key Employees of HCA Holdings, Inc. and its Affiliates, as Amended andRestated (filed as Exhibit 10.2 to the Company’s Current Report on Form 8-K filedFebruary 14, 2012, and incorporated herein by reference).*
10.19 — Form of Director Restricted Share Unit Agreement (Annual Award) Under the 2006 StockIncentive Plan for Key Employees of HCA Holdings, Inc. and its Affiliates, as Amended andRestated (filed as Exhibit 10.3 to the Company’s Current Report on Form 8-K filedFebruary 14, 2012, and incorporated herein by reference).*
10.20 — Exchange and Purchase Agreement (filed as Exhibit 10.16 to the Company’s Annual Report onForm 10-K for the fiscal year ended December 31, 2006 (File No. 001-11239), andincorporated herein by reference).
10.21 — Civil and Administrative Settlement Agreement, dated December 14, 2000 between theCompany, the United States Department of Justice and others (filed as Exhibit 99.2 to theCompany’s Current Report on Form 8-K dated December 20, 2000 (File No. 001-11239), andincorporated herein by reference).
10.22 — Plea Agreement, dated December 14, 2000 between the Company, Columbia Homecare Group,Inc., Columbia Management Companies, Inc. and the United States Department of Justice(filed as Exhibit 99.3 to the Company’s Current Report on Form 8-K dated December 20, 2000(File No. 001-11239), and incorporated herein by reference).
10.23 — Corporate Integrity Agreement, dated December 14, 2000 between the Company and theOffice of Inspector General of the United States Department of Health and Human Services(filed as Exhibit 99.4 to the Company’s Current Report on Form 8-K dated December 20, 2000(File No. 001-11239), and incorporated herein by reference).
10.24 — Management Agreement, dated November 17, 2006, among HCA Inc., Bain Capital Partners,LLC, Kohlberg Kravis Roberts & Co. L.P., Dr. Thomas F. Frist, Jr., Patricia F. Elcan, WilliamR. Frist and Thomas F. Frist III, and Merrill Lynch Global Partners, Inc. (filed as Exhibit 10.20to the Company’s Annual Report on Form 10-K for the fiscal year ended December 31, 2006(File No. 001-11239), and incorporated herein by reference).
94

10.25 — Retirement Agreement between the Company and Thomas F. Frist, Jr., M.D. dated as ofJanuary 1, 2002 (filed as Exhibit 10.30 to the Company’s Annual Report on Form 10-K for thefiscal year ended December 31, 2001 (File No. 001-11239), and incorporated herein byreference).*
10.26 — Amended and Restated HCA Supplemental Executive Retirement Plan, effective December 22,2010, except as provided therein (filed as Exhibit 10.26 to the Company’s Annual Report onForm 10-K for the fiscal year ended December 31, 2010, and incorporated herein byreference).*
10.27 — Amended and Restated HCA Restoration Plan, effective December 22, 2010 (filed asExhibit 10.27 to the Company’s Annual Report on Form 10-K for the fiscal year endedDecember 31, 2010, and incorporated herein by reference).*
10.28(a) — Amended and Restated Employment Agreement dated August 2, 2013 (Richard M. Bracken)(filed as Exhibit 10.1 to the Company’s Quarterly Report on Form 10-Q for the quarter endedJune 30, 2013, and incorporated herein by reference).*
10.28(b) — Employment Agreement dated November 16, 2006 (R. Milton Johnson) (filed asExhibit 10.27(c) to the Company’s Annual Report on Form 10-K for the fiscal year endedDecember 31, 2006 (File No. 001-11239), and incorporated herein by reference).*
10.28(c) — Employment Agreement dated November 16, 2006 (Samuel N. Hazen) (filed asExhibit 10.27(d) to the Company’s Annual Report on Form 10-K for the fiscal year endedDecember 31, 2006 (File No. 001-11239), and incorporated herein by reference).*
10.28(d) — Employment Agreement dated November 16, 2006 (Charles J. Hall) (filed as Exhibit 10.28(d)to the Company’s Annual Report on Form 10-K for the fiscal year ended December 31, 2012,and incorporated herein by reference).*
10.28(e) — Amendment to Employment Agreement effective February 9, 2011 (R. Milton Johnson) (filedas Exhibit 10.29(i) to the Company’s Annual Report on Form 10-K for the fiscal year endedDecember 31, 2010, and incorporated herein by reference).*
10.28(f) — Amendment to Employment Agreement effective February 9, 2011 (Samuel N. Hazen) (filedas Exhibit 10.29(j) to the Company’s Annual Report on Form 10-K for the fiscal year endedDecember 31, 2010, and incorporated herein by reference).*
10.28(g) — Second Amendment to Employment Agreement effective January 1, 2014 (R. MiltonJohnson).*
10.29 — Administrative Settlement Agreement dated June 25, 2003 by and between the United StatesDepartment of Health and Human Services, acting through the Centers for Medicare andMedicaid Services, and the Company (filed as Exhibit 10.1 to the Company’s Quarterly Reporton Form 10-Q for the quarter ended June 30, 2003 (File No. 001-11239), and incorporatedherein by reference).
10.30 — Civil Settlement Agreement by and among the United States of America, acting through theUnited States Department of Justice and on behalf of the Office of Inspector General of theDepartment of Health and Human Services, the TRICARE Management Activity (filed asExhibit 10.2 to the Company’s Quarterly Report of Form 10-Q for the quarter ended June 30,2003 (File No. 001-11239), and incorporated herein by reference).
10.31(a) — Form of Amended and Restated Limited Liability Company Agreement of Hercules HoldingII, LLC dated as of November 17, 2006, among Hercules Holding II, LLC and certain otherparties thereto (filed as Exhibit 10.3 to the Company’s Registration Statement on Form 8-A,filed April 29, 2008 (File No. 000-18406) and incorporated herein by reference).
95

10.31(b) — Form of Amendment to the Amended and Restated Limited Liability Company Agreement ofHercules Holding II, LLC (filed as Exhibit 10.32(a) to the Company’s Registration Statementon Form S-1 (File No. 333-171369), and incorporated herein by reference).
10.32 — Indemnification Priority and Information Sharing Agreement, dated as of November 1, 2009,between HCA Inc. and certain other parties thereto (filed as Exhibit 10.35 to the Company’sAnnual Report on Form 10-K for the fiscal year ended December 31, 2009(File No. 001-11239), and incorporated herein by reference).
10.33 — Assignment and Assumption Agreement, dated November 22, 2010, by and among HCA Inc.,HCA Holdings, Inc. and HCA Merger Sub LLC (filed as Exhibit 10.1 to the Company’sCurrent Report on Form 8-K filed November 24, 2010, and incorporated herein by reference).
10.34 — Omnibus Amendment to Various Stock and Option Plans and the Management Stockholders’Agreement, dated November 22, 2010 (filed as Exhibit 10.2 to the Company’s Current Reporton Form 8-K filed November 24, 2010, and incorporated herein by reference).*
10.35 — Omnibus Amendment to Stock Option Agreements Issued Under the 2006 Stock IncentivePlan for Key Employees of HCA Holdings, Inc. and its Affiliates, as amended, effectiveFebruary 16, 2011 (filed as Exhibit 10.38 to the Company’s Annual Report on Form 10-K forthe fiscal year ended December 31, 2010, and incorporated herein by reference).*
10.36 — Stockholders’ Agreement, dated as of March 9, 2011, by and among the Company, HerculesHolding II, LLC and the other signatories thereto (filed as Exhibit 10.1 to the Company’sCurrent Report on Form 8-K filed March 16, 2011, and incorporated herein by reference).
10.37 — Amendment, dated as of September 21, 2011, to the Stockholders’ Agreement, dated as ofMarch 9, 2011 (filed as Exhibit 10.2 to the Company’s Current Report on Form 8-K filedSeptember 21, 2011, and incorporated herein by reference).
10.38 — HCA Holdings, Inc. 2011 Senior Officer Performance Excellence Program (filed asExhibit 10.1 to the Company’s Current Report on Form 8-K filed April 5, 2011, andincorporated herein by reference).*
10.39 — Form of 2011 PEP Restricted Share Unit Agreement (Officers) (filed as Exhibit 10.2 to theCompany’s Current Report on Form 8-K filed April 5, 2011, and incorporated herein byreference).*
10.40 — Form of Director Restricted Share Unit Agreement Under the 2006 Stock Incentive Plan forKey Employees of HCA Holdings, Inc. and its Affiliates, as Amended and Restated (filed asExhibit 10.5 to the Company’s Quarterly Report on Form 10-Q for the quarter ended March 31,2011, and incorporated herein by reference).*
10.41 — HCA Holdings, Inc. 2012 Senior Officer Performance Excellence Program (filed asExhibit 10.1 to the Company’s Current Report on Form 8-K filed April 4, 2012, andincorporated herein by reference).*
10.42 — Form of 2012 PEP Restricted Share Unit Agreement (Officers) (filed as Exhibit 10.2 to theCompany’s Current Report on Form 8-K filed April 4, 2012, and incorporated herein by reference).*
10.43 — Share Repurchase Agreement, dated as of October 28, 2013, by and between HCA Holdings,Inc. and Hercules Holdings II, LLC (filed as Exhibit 10.1 to the Company’s Current Report onForm 8-K filed November 1, 2013, and incorporated herein by reference).
10.44 — HCA Holdings, Inc. 2013 Senior Officer Performance Excellence Program.*
10.45 — Form of 2013 PEP Restricted Share Unit Agreement (Officers).*
10.46 — Executive Severance Policy.*
10.47 — Form of Restricted Share Unit Agreement (Richard M. Bracken).*
96
10.48 — Form of Director Restricted Share Unit Agreement (Initial Award) under the 2006 Stock IncentivePlan for Key Employees of HCA Holdings, Inc. and its Affiliates, as Amended and Restated.*
10.49 — Form of Director Restricted Share Unit Agreement (Annual Award) under the 2006 Stock IncentivePlan for Key Employees of HCA Holdings, Inc. and its Affiliates, as Amended and Restated.*
21 — List of Subsidiaries.
23 — Consent of Ernst & Young LLP.
31.1 — Certification of Chief Executive Officer Pursuant to Section 302 of the Sarbanes-Oxley Act of 2002.
31.2 — Certification of Chief Financial Officer Pursuant to Section 302 of the Sarbanes-Oxley Act of 2002.
32 — Certification Pursuant to 18 U.S.C. Section 1350, as Adopted Pursuant to Section 906 of theSarbanes-Oxley Act of 2002.
101 — The following financial information from our annual report on Form 10-K for the year endedDecember 31, 2013, filed with the SEC on February 26, 2014, formatted in Extensible BusinessReporting Language (XBRL): (i) the consolidated balance sheets at December 31, 2013 and 2012,(ii) the consolidated income statements for the years ended December 31, 2013, 2012 and 2011,(iii) the consolidated comprehensive income statements for the years ended December 31, 2013,2012 and 2011, (iv) the consolidated statements of stockholders’ deficit for the years endedDecember 31, 2013, 2012 and 2011, (v) the consolidated statements of cash flows for the yearsended December 31, 2013, 2012 and 2011, and (vi) the notes to consolidated financial statements.
* Management compensatory plan or arrangement.
97
SIGNATURES
Pursuant to the requirements of Section 13 or 15(d) of the Securities Exchange Act of 1934, the Registranthas duly caused this report to be signed on its behalf by the undersigned, thereunto duly authorized.
HCA HOLDINGS, INC.
By: /s/ R. MILTON JOHNSON
R. Milton JohnsonPresident and
Chief Executive Officer
Dated: February 26, 2014
Pursuant to the requirements of the Securities Exchange Act of 1934, this report has been signed below bythe following persons on behalf of the registrant and in the capacities and on the dates indicated.
Signature Title Date
/s/ RICHARD M. BRACKEN
Richard M. BrackenChairman of the Board February 26, 2014
/s/ R. MILTON JOHNSON
R. Milton JohnsonPresident, Chief Executive Officer andDirector (Principal Executive Officer)
February 26, 2014
/s/ WILLIAM B. RUTHERFORD
William B. RutherfordChief Financial Officer and Executive Vice President
(Principal Financial Officer andPrincipal Accounting Officer)
February 26, 2014
/s/ ROBERT J. DENNIS
Robert J. DennisDirector February 26, 2014
/s/ NANCY-ANN DEPARLE
Nancy-Ann DeParleDirector February 26, 2014
/s/ THOMAS F. FRIST IIIThomas F. Frist III
Director February 26, 2014
/s/ WILLIAM R. FRIST
William R. FristDirector February 26, 2014
/s/ ANN H. LAMONT
Ann H. LamontDirector February 26, 2014
/s/ JAY O. LIGHT
Jay O. LightDirector February 26, 2014
/s/ MICHAEL W. MICHELSON
Michael W. MichelsonDirector February 26, 2014
/s/ GEOFFREY G. MEYERS
Geoffrey G. MeyersDirector February 26, 2014
/s/ STEPHEN G. PAGLIUCA
Stephen G. PagliucaDirector February 26, 2014
/s/ WAYNE J. RILEY
Wayne J. RileyDirector February 26, 2014
/s/ JOHN W. ROWE
John W. RoweDirector February 26, 2014
98
HCA HOLDINGS, INC.
INDEX TO CONSOLIDATED FINANCIAL STATEMENTS
Page
Report of Independent Registered Public Accounting Firm . . . . . . . . . . . . . . . . . . . . . . . . . . . . . . . . . . . . . F-2
Consolidated Financial Statements:
Consolidated Income Statements for the years ended December 31, 2013, 2012 and 2011 . . . . . . . . . . F-3
Consolidated Comprehensive Income Statements for the years ended December 31, 2013, 2012 and2011 . . . . . . . . . . . . . . . . . . . . . . . . . . . . . . . . . . . . . . . . . . . . . . . . . . . . . . . . . . . . . . . . . . . . . . . . . . . F-4
Consolidated Balance Sheets, December 31, 2013 and 2012 . . . . . . . . . . . . . . . . . . . . . . . . . . . . . . . . . F-5
Consolidated Statements of Stockholders’ Deficit for the years ended December 31, 2013, 2012 and2011 . . . . . . . . . . . . . . . . . . . . . . . . . . . . . . . . . . . . . . . . . . . . . . . . . . . . . . . . . . . . . . . . . . . . . . . . . . . F-6
Consolidated Statements of Cash Flows for the years ended December 31, 2013, 2012 and 2011 . . . . F-7
Notes to Consolidated Financial Statements . . . . . . . . . . . . . . . . . . . . . . . . . . . . . . . . . . . . . . . . . . . . . . F-8
Quarterly Consolidated Financial Information (Unaudited) . . . . . . . . . . . . . . . . . . . . . . . . . . . . . . . . . . F-49
F-1
REPORT OF INDEPENDENT REGISTERED PUBLIC ACCOUNTING FIRM
The Board of Directors and StockholdersHCA Holdings, Inc.
We have audited the accompanying consolidated balance sheets of HCA Holdings, Inc. as of December 31,2013 and 2012, and the related consolidated statements of income, comprehensive income, stockholders’ deficit,and cash flows for each of the three years in the period ended December 31, 2013. These financial statements arethe responsibility of the Company’s management. Our responsibility is to express an opinion on these financialstatements based on our audits.
We conducted our audits in accordance with the standards of the Public Company Accounting OversightBoard (United States). Those standards require that we plan and perform the audit to obtain reasonable assuranceabout whether the financial statements are free of material misstatement. An audit includes examining, on a testbasis, evidence supporting the amounts and disclosures in the financial statements. An audit also includesassessing the accounting principles used and significant estimates made by management, as well as evaluatingthe overall financial statement presentation. We believe that our audits provide a reasonable basis for ouropinion.
In our opinion, the financial statements referred to above present fairly, in all material respects, theconsolidated financial position of HCA Holdings, Inc. at December 31, 2013 and 2012, and the consolidatedresults of its operations and its cash flows for each of the three years in the period ended December 31, 2013, inconformity with U.S. generally accepted accounting principles.
We also have audited, in accordance with the standards of the Public Company Accounting Oversight Board(United States), HCA Holdings, Inc.’s internal control over financial reporting as of December 31, 2013, basedon criteria established in Internal Control — Integrated Framework issued by the Committee of SponsoringOrganizations of the Treadway Commission (1992 framework), and our report dated February 26, 2014expressed an unqualified opinion thereon.
/s/ Ernst & Young LLP
Nashville, TennesseeFebruary 26, 2014
F-2
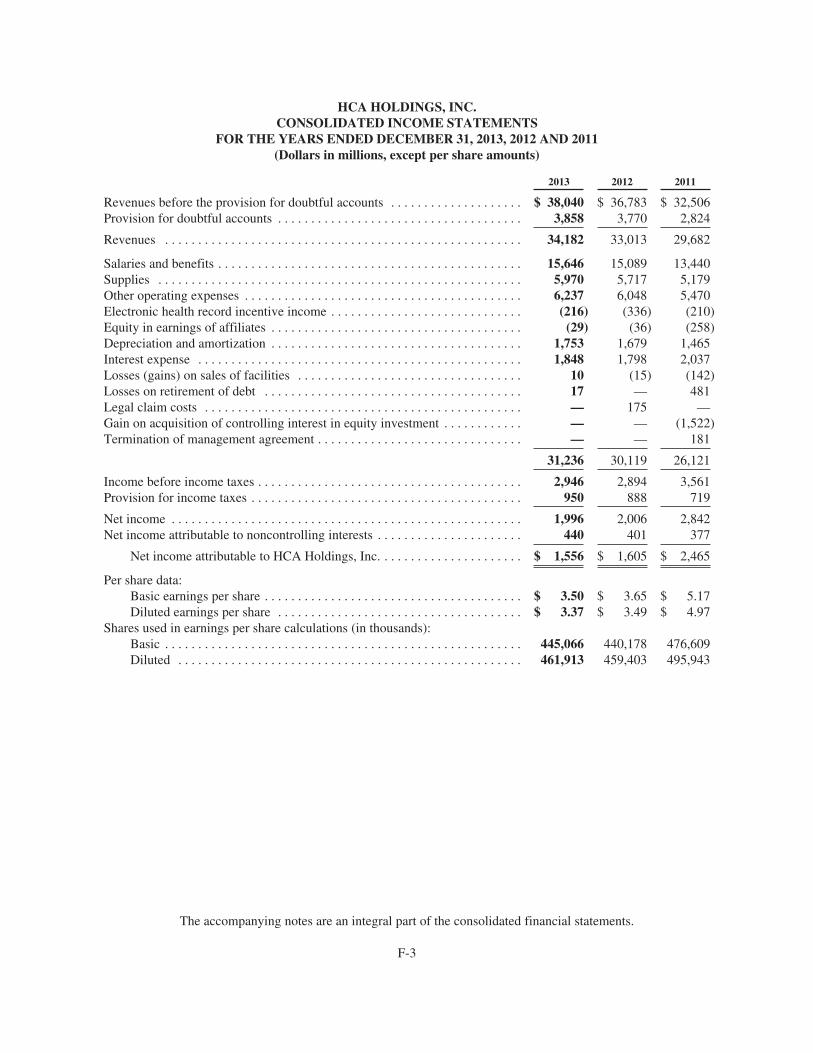
HCA HOLDINGS, INC.CONSOLIDATED INCOME STATEMENTS
FOR THE YEARS ENDED DECEMBER 31, 2013, 2012 AND 2011(Dollars in millions, except per share amounts)
2013 2012 2011
Revenues before the provision for doubtful accounts . . . . . . . . . . . . . . . . . . . . $ 38,040 $ 36,783 $ 32,506Provision for doubtful accounts . . . . . . . . . . . . . . . . . . . . . . . . . . . . . . . . . . . . . 3,858 3,770 2,824
Revenues . . . . . . . . . . . . . . . . . . . . . . . . . . . . . . . . . . . . . . . . . . . . . . . . . . . . . . 34,182 33,013 29,682
Salaries and benefits . . . . . . . . . . . . . . . . . . . . . . . . . . . . . . . . . . . . . . . . . . . . . . 15,646 15,089 13,440Supplies . . . . . . . . . . . . . . . . . . . . . . . . . . . . . . . . . . . . . . . . . . . . . . . . . . . . . . . 5,970 5,717 5,179Other operating expenses . . . . . . . . . . . . . . . . . . . . . . . . . . . . . . . . . . . . . . . . . . 6,237 6,048 5,470Electronic health record incentive income . . . . . . . . . . . . . . . . . . . . . . . . . . . . . (216) (336) (210)Equity in earnings of affiliates . . . . . . . . . . . . . . . . . . . . . . . . . . . . . . . . . . . . . . (29) (36) (258)Depreciation and amortization . . . . . . . . . . . . . . . . . . . . . . . . . . . . . . . . . . . . . . 1,753 1,679 1,465Interest expense . . . . . . . . . . . . . . . . . . . . . . . . . . . . . . . . . . . . . . . . . . . . . . . . . 1,848 1,798 2,037Losses (gains) on sales of facilities . . . . . . . . . . . . . . . . . . . . . . . . . . . . . . . . . . 10 (15) (142)Losses on retirement of debt . . . . . . . . . . . . . . . . . . . . . . . . . . . . . . . . . . . . . . . 17 — 481Legal claim costs . . . . . . . . . . . . . . . . . . . . . . . . . . . . . . . . . . . . . . . . . . . . . . . . — 175 —Gain on acquisition of controlling interest in equity investment . . . . . . . . . . . . — — (1,522)Termination of management agreement . . . . . . . . . . . . . . . . . . . . . . . . . . . . . . . — — 181
31,236 30,119 26,121
Income before income taxes . . . . . . . . . . . . . . . . . . . . . . . . . . . . . . . . . . . . . . . . 2,946 2,894 3,561Provision for income taxes . . . . . . . . . . . . . . . . . . . . . . . . . . . . . . . . . . . . . . . . . 950 888 719
Net income . . . . . . . . . . . . . . . . . . . . . . . . . . . . . . . . . . . . . . . . . . . . . . . . . . . . . 1,996 2,006 2,842Net income attributable to noncontrolling interests . . . . . . . . . . . . . . . . . . . . . . 440 401 377
Net income attributable to HCA Holdings, Inc. . . . . . . . . . . . . . . . . . . . . . $ 1,556 $ 1,605 $ 2,465
Per share data:Basic earnings per share . . . . . . . . . . . . . . . . . . . . . . . . . . . . . . . . . . . . . . . $ 3.50 $ 3.65 $ 5.17Diluted earnings per share . . . . . . . . . . . . . . . . . . . . . . . . . . . . . . . . . . . . . $ 3.37 $ 3.49 $ 4.97
Shares used in earnings per share calculations (in thousands):Basic . . . . . . . . . . . . . . . . . . . . . . . . . . . . . . . . . . . . . . . . . . . . . . . . . . . . . . 445,066 440,178 476,609Diluted . . . . . . . . . . . . . . . . . . . . . . . . . . . . . . . . . . . . . . . . . . . . . . . . . . . . 461,913 459,403 495,943
The accompanying notes are an integral part of the consolidated financial statements.
F-3
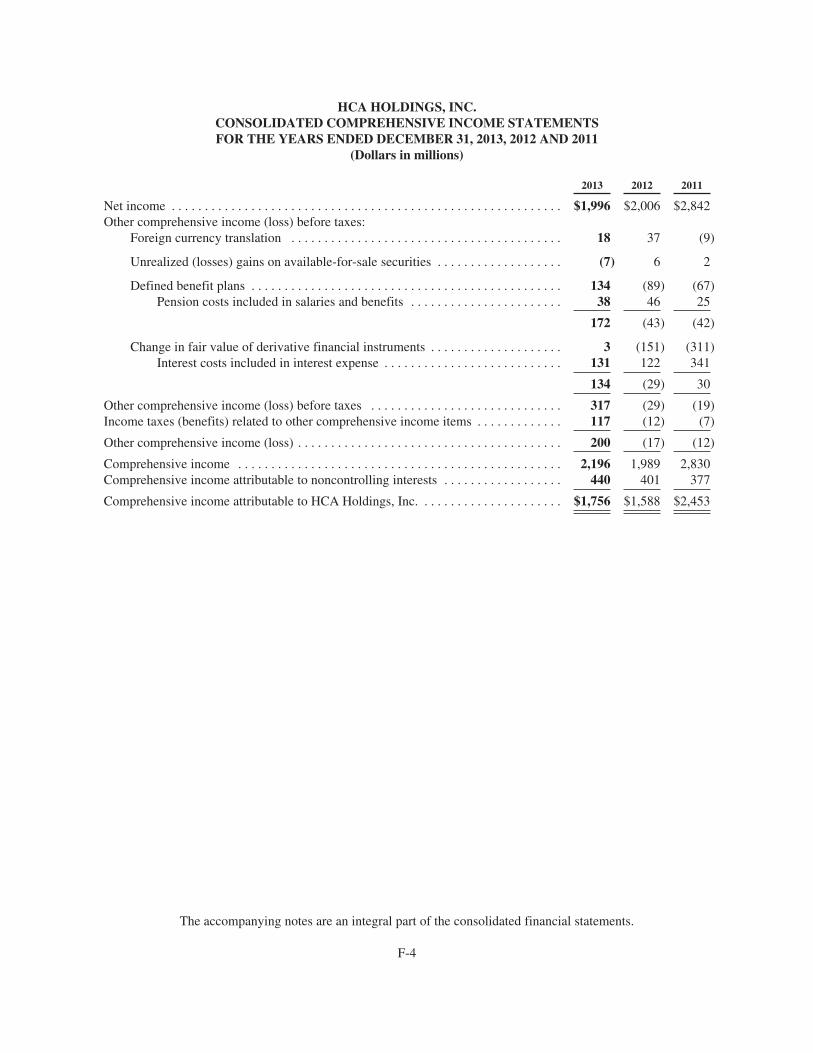
HCA HOLDINGS, INC.CONSOLIDATED COMPREHENSIVE INCOME STATEMENTSFOR THE YEARS ENDED DECEMBER 31, 2013, 2012 AND 2011
(Dollars in millions)
2013 2012 2011
Net income . . . . . . . . . . . . . . . . . . . . . . . . . . . . . . . . . . . . . . . . . . . . . . . . . . . . . . . . . . . $1,996 $2,006 $2,842Other comprehensive income (loss) before taxes:
Foreign currency translation . . . . . . . . . . . . . . . . . . . . . . . . . . . . . . . . . . . . . . . . . 18 37 (9)
Unrealized (losses) gains on available-for-sale securities . . . . . . . . . . . . . . . . . . . (7) 6 2
Defined benefit plans . . . . . . . . . . . . . . . . . . . . . . . . . . . . . . . . . . . . . . . . . . . . . . . 134 (89) (67)Pension costs included in salaries and benefits . . . . . . . . . . . . . . . . . . . . . . . 38 46 25
172 (43) (42)
Change in fair value of derivative financial instruments . . . . . . . . . . . . . . . . . . . . 3 (151) (311)Interest costs included in interest expense . . . . . . . . . . . . . . . . . . . . . . . . . . . 131 122 341
134 (29) 30
Other comprehensive income (loss) before taxes . . . . . . . . . . . . . . . . . . . . . . . . . . . . . 317 (29) (19)Income taxes (benefits) related to other comprehensive income items . . . . . . . . . . . . . 117 (12) (7)
Other comprehensive income (loss) . . . . . . . . . . . . . . . . . . . . . . . . . . . . . . . . . . . . . . . . 200 (17) (12)
Comprehensive income . . . . . . . . . . . . . . . . . . . . . . . . . . . . . . . . . . . . . . . . . . . . . . . . . 2,196 1,989 2,830Comprehensive income attributable to noncontrolling interests . . . . . . . . . . . . . . . . . . 440 401 377
Comprehensive income attributable to HCA Holdings, Inc. . . . . . . . . . . . . . . . . . . . . . $1,756 $1,588 $2,453
The accompanying notes are an integral part of the consolidated financial statements.
F-4
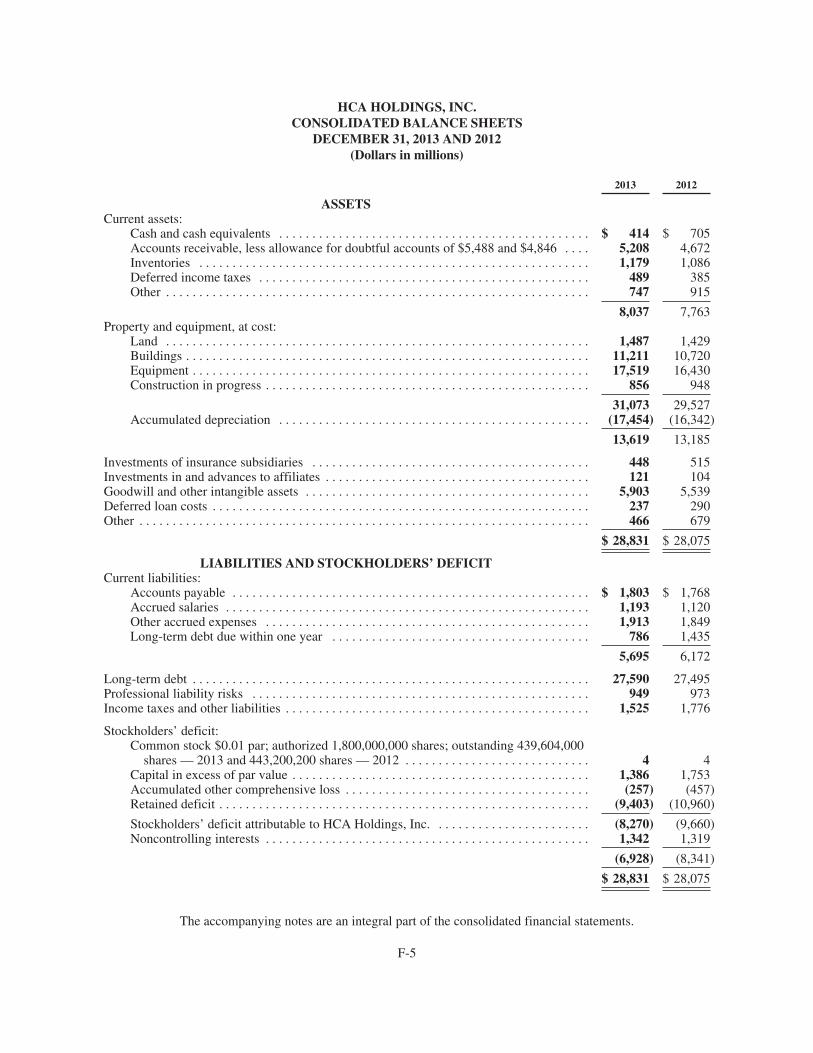
HCA HOLDINGS, INC.CONSOLIDATED BALANCE SHEETS
DECEMBER 31, 2013 AND 2012(Dollars in millions)
2013 2012
ASSETSCurrent assets:
Cash and cash equivalents . . . . . . . . . . . . . . . . . . . . . . . . . . . . . . . . . . . . . . . . . . . . . . . $ 414 $ 705Accounts receivable, less allowance for doubtful accounts of $5,488 and $4,846 . . . . 5,208 4,672Inventories . . . . . . . . . . . . . . . . . . . . . . . . . . . . . . . . . . . . . . . . . . . . . . . . . . . . . . . . . . . 1,179 1,086Deferred income taxes . . . . . . . . . . . . . . . . . . . . . . . . . . . . . . . . . . . . . . . . . . . . . . . . . . 489 385Other . . . . . . . . . . . . . . . . . . . . . . . . . . . . . . . . . . . . . . . . . . . . . . . . . . . . . . . . . . . . . . . . 747 915
8,037 7,763Property and equipment, at cost:
Land . . . . . . . . . . . . . . . . . . . . . . . . . . . . . . . . . . . . . . . . . . . . . . . . . . . . . . . . . . . . . . . . 1,487 1,429Buildings . . . . . . . . . . . . . . . . . . . . . . . . . . . . . . . . . . . . . . . . . . . . . . . . . . . . . . . . . . . . . 11,211 10,720Equipment . . . . . . . . . . . . . . . . . . . . . . . . . . . . . . . . . . . . . . . . . . . . . . . . . . . . . . . . . . . . 17,519 16,430Construction in progress . . . . . . . . . . . . . . . . . . . . . . . . . . . . . . . . . . . . . . . . . . . . . . . . . 856 948
31,073 29,527Accumulated depreciation . . . . . . . . . . . . . . . . . . . . . . . . . . . . . . . . . . . . . . . . . . . . . . . (17,454) (16,342)
13,619 13,185
Investments of insurance subsidiaries . . . . . . . . . . . . . . . . . . . . . . . . . . . . . . . . . . . . . . . . . . 448 515Investments in and advances to affiliates . . . . . . . . . . . . . . . . . . . . . . . . . . . . . . . . . . . . . . . . 121 104Goodwill and other intangible assets . . . . . . . . . . . . . . . . . . . . . . . . . . . . . . . . . . . . . . . . . . . 5,903 5,539Deferred loan costs . . . . . . . . . . . . . . . . . . . . . . . . . . . . . . . . . . . . . . . . . . . . . . . . . . . . . . . . . 237 290Other . . . . . . . . . . . . . . . . . . . . . . . . . . . . . . . . . . . . . . . . . . . . . . . . . . . . . . . . . . . . . . . . . . . . 466 679
$ 28,831 $ 28,075
LIABILITIES AND STOCKHOLDERS’ DEFICITCurrent liabilities:
Accounts payable . . . . . . . . . . . . . . . . . . . . . . . . . . . . . . . . . . . . . . . . . . . . . . . . . . . . . . $ 1,803 $ 1,768Accrued salaries . . . . . . . . . . . . . . . . . . . . . . . . . . . . . . . . . . . . . . . . . . . . . . . . . . . . . . . 1,193 1,120Other accrued expenses . . . . . . . . . . . . . . . . . . . . . . . . . . . . . . . . . . . . . . . . . . . . . . . . . 1,913 1,849Long-term debt due within one year . . . . . . . . . . . . . . . . . . . . . . . . . . . . . . . . . . . . . . . 786 1,435
5,695 6,172
Long-term debt . . . . . . . . . . . . . . . . . . . . . . . . . . . . . . . . . . . . . . . . . . . . . . . . . . . . . . . . . . . . 27,590 27,495Professional liability risks . . . . . . . . . . . . . . . . . . . . . . . . . . . . . . . . . . . . . . . . . . . . . . . . . . . 949 973Income taxes and other liabilities . . . . . . . . . . . . . . . . . . . . . . . . . . . . . . . . . . . . . . . . . . . . . . 1,525 1,776
Stockholders’ deficit:Common stock $0.01 par; authorized 1,800,000,000 shares; outstanding 439,604,000
shares — 2013 and 443,200,200 shares — 2012 . . . . . . . . . . . . . . . . . . . . . . . . . . . . 4 4Capital in excess of par value . . . . . . . . . . . . . . . . . . . . . . . . . . . . . . . . . . . . . . . . . . . . . 1,386 1,753Accumulated other comprehensive loss . . . . . . . . . . . . . . . . . . . . . . . . . . . . . . . . . . . . . (257) (457)Retained deficit . . . . . . . . . . . . . . . . . . . . . . . . . . . . . . . . . . . . . . . . . . . . . . . . . . . . . . . . (9,403) (10,960)
Stockholders’ deficit attributable to HCA Holdings, Inc. . . . . . . . . . . . . . . . . . . . . . . . (8,270) (9,660)Noncontrolling interests . . . . . . . . . . . . . . . . . . . . . . . . . . . . . . . . . . . . . . . . . . . . . . . . . 1,342 1,319
(6,928) (8,341)
$ 28,831 $ 28,075
The accompanying notes are an integral part of the consolidated financial statements.
F-5
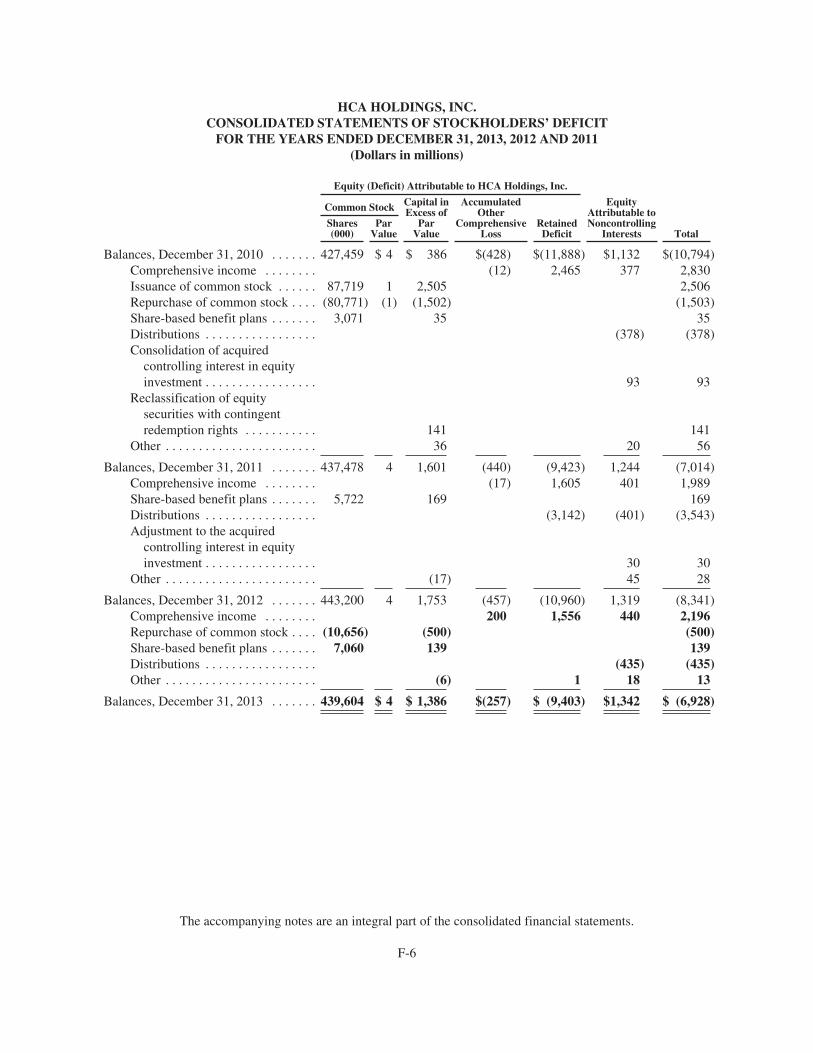
HCA HOLDINGS, INC.CONSOLIDATED STATEMENTS OF STOCKHOLDERS’ DEFICIT
FOR THE YEARS ENDED DECEMBER 31, 2013, 2012 AND 2011(Dollars in millions)
Equity (Deficit) Attributable to HCA Holdings, Inc.
EquityAttributable toNoncontrolling
Interests Total
Common Stock Capital inExcess of
ParValue
AccumulatedOther
ComprehensiveLoss
RetainedDeficit
Shares(000)
ParValue
Balances, December 31, 2010 . . . . . . . 427,459 $ 4 $ 386 $(428) $(11,888) $1,132 $(10,794)Comprehensive income . . . . . . . . (12) 2,465 377 2,830Issuance of common stock . . . . . . 87,719 1 2,505 2,506Repurchase of common stock . . . . (80,771) (1) (1,502) (1,503)Share-based benefit plans . . . . . . . 3,071 35 35Distributions . . . . . . . . . . . . . . . . . (378) (378)Consolidation of acquired
controlling interest in equityinvestment . . . . . . . . . . . . . . . . . 93 93
Reclassification of equitysecurities with contingentredemption rights . . . . . . . . . . . 141 141
Other . . . . . . . . . . . . . . . . . . . . . . . 36 20 56
Balances, December 31, 2011 . . . . . . . 437,478 4 1,601 (440) (9,423) 1,244 (7,014)Comprehensive income . . . . . . . . (17) 1,605 401 1,989Share-based benefit plans . . . . . . . 5,722 169 169Distributions . . . . . . . . . . . . . . . . . (3,142) (401) (3,543)Adjustment to the acquired
controlling interest in equityinvestment . . . . . . . . . . . . . . . . . 30 30
Other . . . . . . . . . . . . . . . . . . . . . . . (17) 45 28
Balances, December 31, 2012 . . . . . . . 443,200 4 1,753 (457) (10,960) 1,319 (8,341)Comprehensive income . . . . . . . . 200 1,556 440 2,196Repurchase of common stock . . . . (10,656) (500) (500)Share-based benefit plans . . . . . . . 7,060 139 139Distributions . . . . . . . . . . . . . . . . . (435) (435)Other . . . . . . . . . . . . . . . . . . . . . . . (6) 1 18 13
Balances, December 31, 2013 . . . . . . . 439,604 $ 4 $ 1,386 $(257) $ (9,403) $1,342 $ (6,928)
The accompanying notes are an integral part of the consolidated financial statements.
F-6
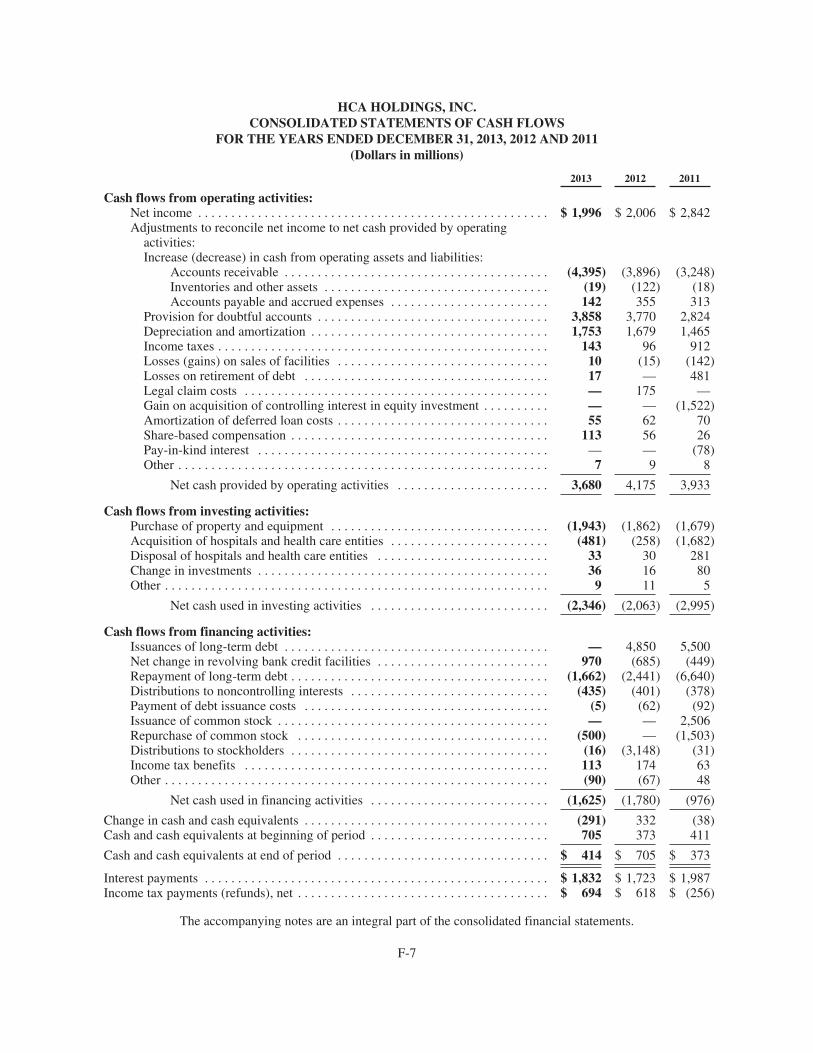
HCA HOLDINGS, INC.CONSOLIDATED STATEMENTS OF CASH FLOWS
FOR THE YEARS ENDED DECEMBER 31, 2013, 2012 AND 2011(Dollars in millions)
2013 2012 2011
Cash flows from operating activities:Net income . . . . . . . . . . . . . . . . . . . . . . . . . . . . . . . . . . . . . . . . . . . . . . . . . . . . . $ 1,996 $ 2,006 $ 2,842Adjustments to reconcile net income to net cash provided by operating
activities:Increase (decrease) in cash from operating assets and liabilities:
Accounts receivable . . . . . . . . . . . . . . . . . . . . . . . . . . . . . . . . . . . . . . . . (4,395) (3,896) (3,248)Inventories and other assets . . . . . . . . . . . . . . . . . . . . . . . . . . . . . . . . . . (19) (122) (18)Accounts payable and accrued expenses . . . . . . . . . . . . . . . . . . . . . . . . 142 355 313
Provision for doubtful accounts . . . . . . . . . . . . . . . . . . . . . . . . . . . . . . . . . . . 3,858 3,770 2,824Depreciation and amortization . . . . . . . . . . . . . . . . . . . . . . . . . . . . . . . . . . . . 1,753 1,679 1,465Income taxes . . . . . . . . . . . . . . . . . . . . . . . . . . . . . . . . . . . . . . . . . . . . . . . . . . 143 96 912Losses (gains) on sales of facilities . . . . . . . . . . . . . . . . . . . . . . . . . . . . . . . . 10 (15) (142)Losses on retirement of debt . . . . . . . . . . . . . . . . . . . . . . . . . . . . . . . . . . . . . 17 — 481Legal claim costs . . . . . . . . . . . . . . . . . . . . . . . . . . . . . . . . . . . . . . . . . . . . . . — 175 —Gain on acquisition of controlling interest in equity investment . . . . . . . . . . — — (1,522)Amortization of deferred loan costs . . . . . . . . . . . . . . . . . . . . . . . . . . . . . . . . 55 62 70Share-based compensation . . . . . . . . . . . . . . . . . . . . . . . . . . . . . . . . . . . . . . . 113 56 26Pay-in-kind interest . . . . . . . . . . . . . . . . . . . . . . . . . . . . . . . . . . . . . . . . . . . . — — (78)Other . . . . . . . . . . . . . . . . . . . . . . . . . . . . . . . . . . . . . . . . . . . . . . . . . . . . . . . . 7 9 8
Net cash provided by operating activities . . . . . . . . . . . . . . . . . . . . . . . 3,680 4,175 3,933
Cash flows from investing activities:Purchase of property and equipment . . . . . . . . . . . . . . . . . . . . . . . . . . . . . . . . . (1,943) (1,862) (1,679)Acquisition of hospitals and health care entities . . . . . . . . . . . . . . . . . . . . . . . . (481) (258) (1,682)Disposal of hospitals and health care entities . . . . . . . . . . . . . . . . . . . . . . . . . . 33 30 281Change in investments . . . . . . . . . . . . . . . . . . . . . . . . . . . . . . . . . . . . . . . . . . . . 36 16 80Other . . . . . . . . . . . . . . . . . . . . . . . . . . . . . . . . . . . . . . . . . . . . . . . . . . . . . . . . . . 9 11 5
Net cash used in investing activities . . . . . . . . . . . . . . . . . . . . . . . . . . . (2,346) (2,063) (2,995)
Cash flows from financing activities:Issuances of long-term debt . . . . . . . . . . . . . . . . . . . . . . . . . . . . . . . . . . . . . . . . — 4,850 5,500Net change in revolving bank credit facilities . . . . . . . . . . . . . . . . . . . . . . . . . . 970 (685) (449)Repayment of long-term debt . . . . . . . . . . . . . . . . . . . . . . . . . . . . . . . . . . . . . . . (1,662) (2,441) (6,640)Distributions to noncontrolling interests . . . . . . . . . . . . . . . . . . . . . . . . . . . . . . (435) (401) (378)Payment of debt issuance costs . . . . . . . . . . . . . . . . . . . . . . . . . . . . . . . . . . . . . (5) (62) (92)Issuance of common stock . . . . . . . . . . . . . . . . . . . . . . . . . . . . . . . . . . . . . . . . . — — 2,506Repurchase of common stock . . . . . . . . . . . . . . . . . . . . . . . . . . . . . . . . . . . . . . (500) — (1,503)Distributions to stockholders . . . . . . . . . . . . . . . . . . . . . . . . . . . . . . . . . . . . . . . (16) (3,148) (31)Income tax benefits . . . . . . . . . . . . . . . . . . . . . . . . . . . . . . . . . . . . . . . . . . . . . . 113 174 63Other . . . . . . . . . . . . . . . . . . . . . . . . . . . . . . . . . . . . . . . . . . . . . . . . . . . . . . . . . . (90) (67) 48
Net cash used in financing activities . . . . . . . . . . . . . . . . . . . . . . . . . . . (1,625) (1,780) (976)
Change in cash and cash equivalents . . . . . . . . . . . . . . . . . . . . . . . . . . . . . . . . . . . . . (291) 332 (38)Cash and cash equivalents at beginning of period . . . . . . . . . . . . . . . . . . . . . . . . . . . 705 373 411
Cash and cash equivalents at end of period . . . . . . . . . . . . . . . . . . . . . . . . . . . . . . . . $ 414 $ 705 $ 373
Interest payments . . . . . . . . . . . . . . . . . . . . . . . . . . . . . . . . . . . . . . . . . . . . . . . . . . . . $ 1,832 $ 1,723 $ 1,987Income tax payments (refunds), net . . . . . . . . . . . . . . . . . . . . . . . . . . . . . . . . . . . . . . $ 694 $ 618 $ (256)
The accompanying notes are an integral part of the consolidated financial statements.
F-7
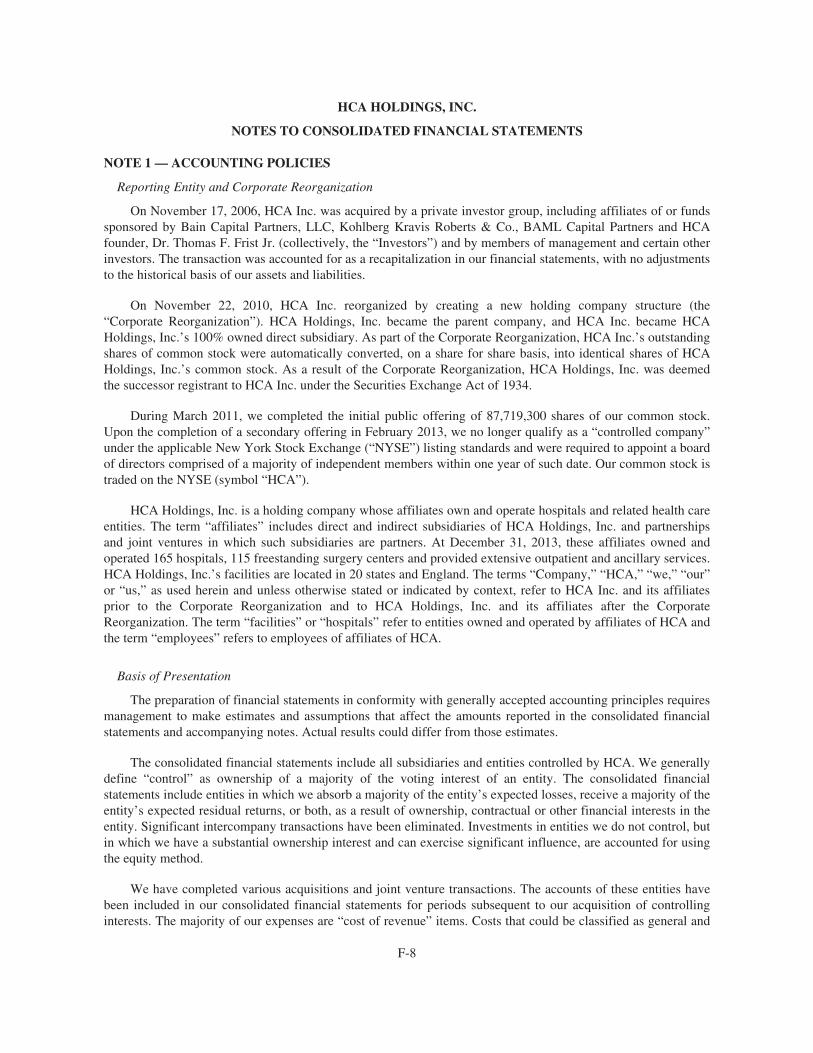
HCA HOLDINGS, INC.
NOTES TO CONSOLIDATED FINANCIAL STATEMENTS
NOTE 1 — ACCOUNTING POLICIES
Reporting Entity and Corporate Reorganization
On November 17, 2006, HCA Inc. was acquired by a private investor group, including affiliates of or fundssponsored by Bain Capital Partners, LLC, Kohlberg Kravis Roberts & Co., BAML Capital Partners and HCAfounder, Dr. Thomas F. Frist Jr. (collectively, the “Investors”) and by members of management and certain otherinvestors. The transaction was accounted for as a recapitalization in our financial statements, with no adjustmentsto the historical basis of our assets and liabilities.
On November 22, 2010, HCA Inc. reorganized by creating a new holding company structure (the“Corporate Reorganization”). HCA Holdings, Inc. became the parent company, and HCA Inc. became HCAHoldings, Inc.’s 100% owned direct subsidiary. As part of the Corporate Reorganization, HCA Inc.’s outstandingshares of common stock were automatically converted, on a share for share basis, into identical shares of HCAHoldings, Inc.’s common stock. As a result of the Corporate Reorganization, HCA Holdings, Inc. was deemedthe successor registrant to HCA Inc. under the Securities Exchange Act of 1934.
During March 2011, we completed the initial public offering of 87,719,300 shares of our common stock.Upon the completion of a secondary offering in February 2013, we no longer qualify as a “controlled company”under the applicable New York Stock Exchange (“NYSE”) listing standards and were required to appoint a boardof directors comprised of a majority of independent members within one year of such date. Our common stock istraded on the NYSE (symbol “HCA”).
HCA Holdings, Inc. is a holding company whose affiliates own and operate hospitals and related health careentities. The term “affiliates” includes direct and indirect subsidiaries of HCA Holdings, Inc. and partnershipsand joint ventures in which such subsidiaries are partners. At December 31, 2013, these affiliates owned andoperated 165 hospitals, 115 freestanding surgery centers and provided extensive outpatient and ancillary services.HCA Holdings, Inc.’s facilities are located in 20 states and England. The terms “Company,” “HCA,” “we,” “our”or “us,” as used herein and unless otherwise stated or indicated by context, refer to HCA Inc. and its affiliatesprior to the Corporate Reorganization and to HCA Holdings, Inc. and its affiliates after the CorporateReorganization. The term “facilities” or “hospitals” refer to entities owned and operated by affiliates of HCA andthe term “employees” refers to employees of affiliates of HCA.
Basis of Presentation
The preparation of financial statements in conformity with generally accepted accounting principles requiresmanagement to make estimates and assumptions that affect the amounts reported in the consolidated financialstatements and accompanying notes. Actual results could differ from those estimates.
The consolidated financial statements include all subsidiaries and entities controlled by HCA. We generallydefine “control” as ownership of a majority of the voting interest of an entity. The consolidated financialstatements include entities in which we absorb a majority of the entity’s expected losses, receive a majority of theentity’s expected residual returns, or both, as a result of ownership, contractual or other financial interests in theentity. Significant intercompany transactions have been eliminated. Investments in entities we do not control, butin which we have a substantial ownership interest and can exercise significant influence, are accounted for usingthe equity method.
We have completed various acquisitions and joint venture transactions. The accounts of these entities havebeen included in our consolidated financial statements for periods subsequent to our acquisition of controllinginterests. The majority of our expenses are “cost of revenue” items. Costs that could be classified as general and
F-8
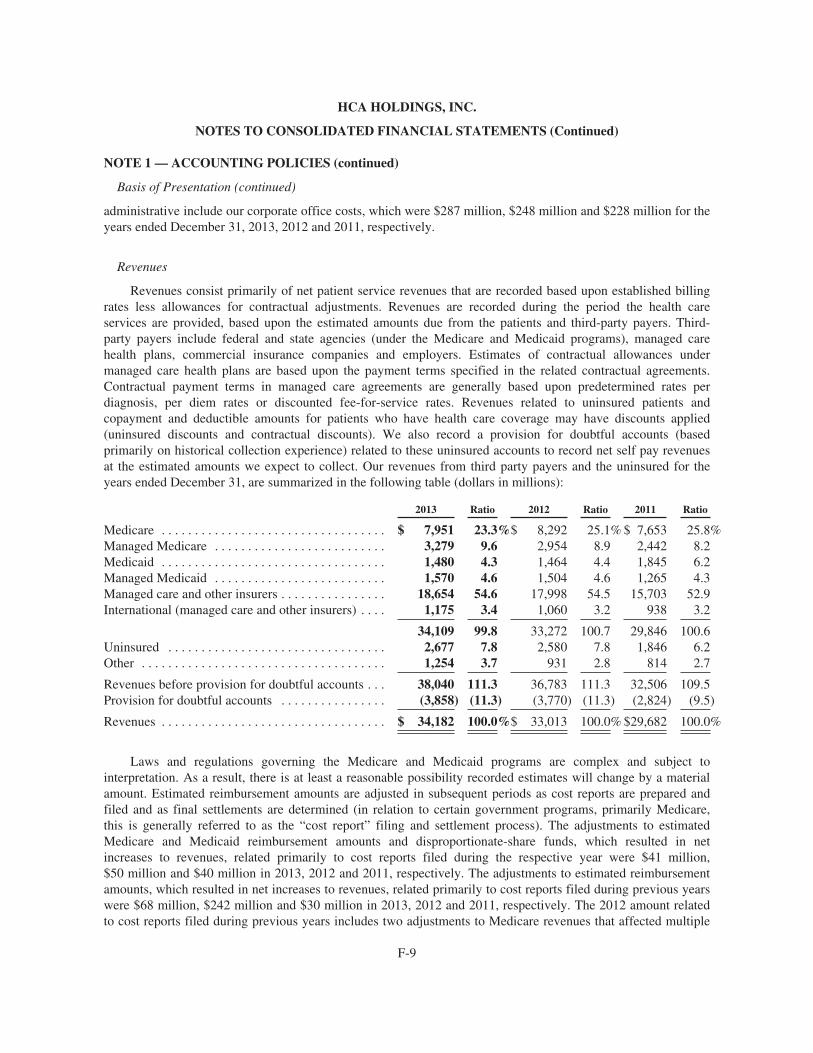
HCA HOLDINGS, INC.
NOTES TO CONSOLIDATED FINANCIAL STATEMENTS (Continued)
NOTE 1 — ACCOUNTING POLICIES (continued)
Basis of Presentation (continued)
administrative include our corporate office costs, which were $287 million, $248 million and $228 million for theyears ended December 31, 2013, 2012 and 2011, respectively.
Revenues
Revenues consist primarily of net patient service revenues that are recorded based upon established billingrates less allowances for contractual adjustments. Revenues are recorded during the period the health careservices are provided, based upon the estimated amounts due from the patients and third-party payers. Third-party payers include federal and state agencies (under the Medicare and Medicaid programs), managed carehealth plans, commercial insurance companies and employers. Estimates of contractual allowances undermanaged care health plans are based upon the payment terms specified in the related contractual agreements.Contractual payment terms in managed care agreements are generally based upon predetermined rates perdiagnosis, per diem rates or discounted fee-for-service rates. Revenues related to uninsured patients andcopayment and deductible amounts for patients who have health care coverage may have discounts applied(uninsured discounts and contractual discounts). We also record a provision for doubtful accounts (basedprimarily on historical collection experience) related to these uninsured accounts to record net self pay revenuesat the estimated amounts we expect to collect. Our revenues from third party payers and the uninsured for theyears ended December 31, are summarized in the following table (dollars in millions):
2013 Ratio 2012 Ratio 2011 Ratio
Medicare . . . . . . . . . . . . . . . . . . . . . . . . . . . . . . . . . . $ 7,951 23.3%$ 8,292 25.1% $ 7,653 25.8%Managed Medicare . . . . . . . . . . . . . . . . . . . . . . . . . . 3,279 9.6 2,954 8.9 2,442 8.2Medicaid . . . . . . . . . . . . . . . . . . . . . . . . . . . . . . . . . . 1,480 4.3 1,464 4.4 1,845 6.2Managed Medicaid . . . . . . . . . . . . . . . . . . . . . . . . . . 1,570 4.6 1,504 4.6 1,265 4.3Managed care and other insurers . . . . . . . . . . . . . . . . 18,654 54.6 17,998 54.5 15,703 52.9International (managed care and other insurers) . . . . 1,175 3.4 1,060 3.2 938 3.2
34,109 99.8 33,272 100.7 29,846 100.6Uninsured . . . . . . . . . . . . . . . . . . . . . . . . . . . . . . . . . 2,677 7.8 2,580 7.8 1,846 6.2Other . . . . . . . . . . . . . . . . . . . . . . . . . . . . . . . . . . . . . 1,254 3.7 931 2.8 814 2.7
Revenues before provision for doubtful accounts . . . 38,040 111.3 36,783 111.3 32,506 109.5Provision for doubtful accounts . . . . . . . . . . . . . . . . (3,858) (11.3) (3,770) (11.3) (2,824) (9.5)
Revenues . . . . . . . . . . . . . . . . . . . . . . . . . . . . . . . . . . $ 34,182 100.0%$ 33,013 100.0% $29,682 100.0%
Laws and regulations governing the Medicare and Medicaid programs are complex and subject tointerpretation. As a result, there is at least a reasonable possibility recorded estimates will change by a materialamount. Estimated reimbursement amounts are adjusted in subsequent periods as cost reports are prepared andfiled and as final settlements are determined (in relation to certain government programs, primarily Medicare,this is generally referred to as the “cost report” filing and settlement process). The adjustments to estimatedMedicare and Medicaid reimbursement amounts and disproportionate-share funds, which resulted in netincreases to revenues, related primarily to cost reports filed during the respective year were $41 million,$50 million and $40 million in 2013, 2012 and 2011, respectively. The adjustments to estimated reimbursementamounts, which resulted in net increases to revenues, related primarily to cost reports filed during previous yearswere $68 million, $242 million and $30 million in 2013, 2012 and 2011, respectively. The 2012 amount relatedto cost reports filed during previous years includes two adjustments to Medicare revenues that affected multiple
F-9
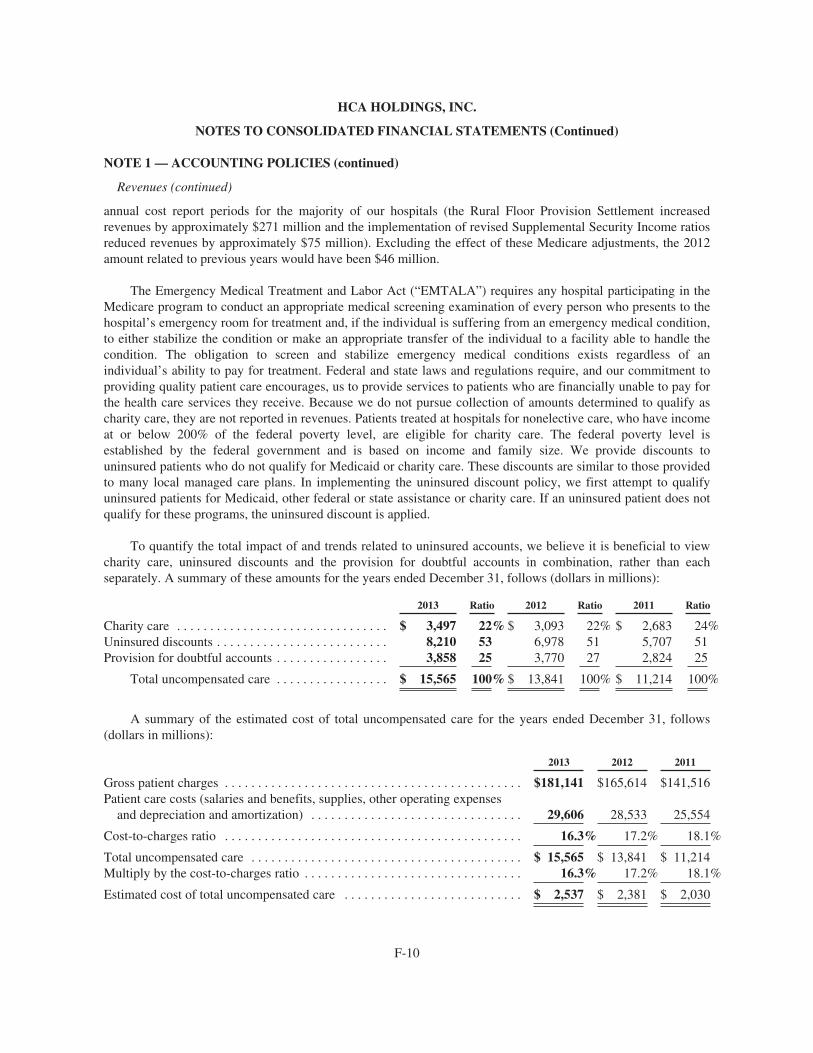
HCA HOLDINGS, INC.
NOTES TO CONSOLIDATED FINANCIAL STATEMENTS (Continued)
NOTE 1 — ACCOUNTING POLICIES (continued)
Revenues (continued)
annual cost report periods for the majority of our hospitals (the Rural Floor Provision Settlement increasedrevenues by approximately $271 million and the implementation of revised Supplemental Security Income ratiosreduced revenues by approximately $75 million). Excluding the effect of these Medicare adjustments, the 2012amount related to previous years would have been $46 million.
The Emergency Medical Treatment and Labor Act (“EMTALA”) requires any hospital participating in theMedicare program to conduct an appropriate medical screening examination of every person who presents to thehospital’s emergency room for treatment and, if the individual is suffering from an emergency medical condition,to either stabilize the condition or make an appropriate transfer of the individual to a facility able to handle thecondition. The obligation to screen and stabilize emergency medical conditions exists regardless of anindividual’s ability to pay for treatment. Federal and state laws and regulations require, and our commitment toproviding quality patient care encourages, us to provide services to patients who are financially unable to pay forthe health care services they receive. Because we do not pursue collection of amounts determined to qualify ascharity care, they are not reported in revenues. Patients treated at hospitals for nonelective care, who have incomeat or below 200% of the federal poverty level, are eligible for charity care. The federal poverty level isestablished by the federal government and is based on income and family size. We provide discounts touninsured patients who do not qualify for Medicaid or charity care. These discounts are similar to those providedto many local managed care plans. In implementing the uninsured discount policy, we first attempt to qualifyuninsured patients for Medicaid, other federal or state assistance or charity care. If an uninsured patient does notqualify for these programs, the uninsured discount is applied.
To quantify the total impact of and trends related to uninsured accounts, we believe it is beneficial to viewcharity care, uninsured discounts and the provision for doubtful accounts in combination, rather than eachseparately. A summary of these amounts for the years ended December 31, follows (dollars in millions):
2013 Ratio 2012 Ratio 2011 Ratio
Charity care . . . . . . . . . . . . . . . . . . . . . . . . . . . . . . . . $ 3,497 22% $ 3,093 22% $ 2,683 24%Uninsured discounts . . . . . . . . . . . . . . . . . . . . . . . . . . 8,210 53 6,978 51 5,707 51Provision for doubtful accounts . . . . . . . . . . . . . . . . . 3,858 25 3,770 27 2,824 25
Total uncompensated care . . . . . . . . . . . . . . . . . $ 15,565 100% $ 13,841 100% $ 11,214 100%
A summary of the estimated cost of total uncompensated care for the years ended December 31, follows(dollars in millions):
2013 2012 2011
Gross patient charges . . . . . . . . . . . . . . . . . . . . . . . . . . . . . . . . . . . . . . . . . . . . . $181,141 $165,614 $141,516Patient care costs (salaries and benefits, supplies, other operating expenses
and depreciation and amortization) . . . . . . . . . . . . . . . . . . . . . . . . . . . . . . . . 29,606 28,533 25,554
Cost-to-charges ratio . . . . . . . . . . . . . . . . . . . . . . . . . . . . . . . . . . . . . . . . . . . . . 16.3% 17.2% 18.1%
Total uncompensated care . . . . . . . . . . . . . . . . . . . . . . . . . . . . . . . . . . . . . . . . . $ 15,565 $ 13,841 $ 11,214Multiply by the cost-to-charges ratio . . . . . . . . . . . . . . . . . . . . . . . . . . . . . . . . . 16.3% 17.2% 18.1%
Estimated cost of total uncompensated care . . . . . . . . . . . . . . . . . . . . . . . . . . . $ 2,537 $ 2,381 $ 2,030
F-10
HCA HOLDINGS, INC.
NOTES TO CONSOLIDATED FINANCIAL STATEMENTS (Continued)
NOTE 1 — ACCOUNTING POLICIES (continued)
Revenues (continued)
The sum of charity care, uninsured discounts and the provision for doubtful accounts, as a percentage of thesum of revenues, charity care, uninsured discounts and the provision for doubtful accounts increased from 27.4%for 2011, to 29.5% for 2012 and to 31.3% for 2013.
Cash and Cash Equivalents
Cash and cash equivalents include highly liquid investments with a maturity of three months or less whenpurchased. Our insurance subsidiaries’ cash equivalent investments in excess of the amounts required to payestimated professional liability claims during the next twelve months are not included in cash and cashequivalents as these funds are not available for general corporate purposes. Carrying values of cash and cashequivalents approximate fair value due to the short-term nature of these instruments.
Our cash management system provides for daily investment of available balances and the funding ofoutstanding checks when presented for payment. Outstanding, but unpresented, checks totaling $461 million and$437 million at December 31, 2013 and 2012, respectively, have been included in “accounts payable” in theconsolidated balance sheets. Upon presentation for payment, these checks are funded through available cashbalances or our credit facility.
Accounts Receivable
We receive payments for services rendered from federal and state agencies (under the Medicare andMedicaid programs), managed care health plans, commercial insurance companies, employers and patients. Werecognize that revenues and receivables from government agencies are significant to our operations, but do notbelieve there are significant credit risks associated with these government agencies. We do not believe there areany other significant concentrations of revenues from any particular payer that would subject us to anysignificant credit risks in the collection of our accounts receivable.
Additions to the allowance for doubtful accounts are made by means of the provision for doubtful accounts.Accounts written off as uncollectible are deducted from the allowance for doubtful accounts and subsequentrecoveries are added. The amount of the provision for doubtful accounts is based upon management’s assessmentof historical and expected net collections, business and economic conditions, trends in federal, state and privateemployer health care coverage and other collection indicators. The provision for doubtful accounts and theallowance for doubtful accounts relate to “uninsured” amounts due directly from patients (including copaymentand deductible amounts from patients who have health care coverage). Accounts are written off when allreasonable internal and external collection efforts have been performed. We consider the return of an accountfrom the secondary collection agency to be the culmination of our reasonable collection efforts and the timingbasis for writing off the account balance. Writeoffs are based upon specific identification and the writeoffprocess requires a writeoff adjustment entry to the patient accounting system. Management relies on the resultsof detailed reviews of historical writeoffs and recoveries at facilities that represent a majority of our revenues andaccounts receivable (the “hindsight analysis”) as a primary source of information to utilize in estimating thecollectibility of our accounts receivable. We perform the hindsight analysis quarterly, utilizing rolling twelve-months accounts receivable collection and writeoff data. At both December 31, 2013 and 2012, the allowance fordoubtful accounts represented approximately 93% of the $5.927 billion and $5.228 billion, respectively, patientdue accounts receivable balance. The patient due accounts receivable balance represents the estimated uninsuredportion of our accounts receivable. The estimated uninsured portion of Medicaid pending and uninsured discountpending accounts is included in our patient due accounts receivable balance. Days revenues in accounts
F-11
HCA HOLDINGS, INC.
NOTES TO CONSOLIDATED FINANCIAL STATEMENTS (Continued)
NOTE 1 — ACCOUNTING POLICIES (continued)
Accounts Receivable (continued)
receivable were 54 days, 51 days and 52 days at December 31, 2013, 2012 and 2011, respectively. Adversechanges in general economic conditions, patient accounting service center operations, payer mix or trends infederal or state governmental health care coverage could affect our collection of accounts receivable, cash flowsand results of operations.
Inventories
Inventories are stated at the lower of cost (first-in, first-out) or market.
Property and Equipment
Depreciation expense, computed using the straight-line method, was $1.733 billion in 2013, $1.673 billionin 2012 and $1.461 billion in 2011. Buildings and improvements are depreciated over estimated useful livesranging generally from 10 to 40 years. Estimated useful lives of equipment vary generally from four to 10 years.
When events, circumstances or operating results indicate the carrying values of certain long-lived assetsexpected to be held and used, might be impaired, we prepare projections of the undiscounted future cash flowsexpected to result from the use of the assets and their eventual disposition. If the projections indicate the recordedamounts are not expected to be recoverable, such amounts are reduced to estimated fair value. Fair value may beestimated based upon internal evaluations that include quantitative analyses of revenues and cash flows, reviewsof recent sales of similar facilities and independent appraisals.
Long-lived assets to be disposed of are reported at the lower of their carrying amounts or fair value lesscosts to sell or close. The estimates of fair value are usually based upon recent sales of similar assets and marketresponses based upon discussions with and offers received from potential buyers.
Investments of Insurance Subsidiaries
At December 31, 2013 and 2012, the investments of our 100% owned insurance subsidiaries were classifiedas “available-for-sale” as defined in Accounting Standards Codification (“ASC”) No. 320, Investments — Debtand Equity Securities and are recorded at fair value. The investment securities are held for the purpose ofproviding a funding source to pay liability claims covered by the insurance subsidiaries. We perform a quarterlyassessment of individual investment securities to determine whether declines in market value are temporary orother-than-temporary. Our investment securities evaluation process involves multiple subjective judgments, ofteninvolves estimating the outcome of future events, and requires a significant level of professional judgment indetermining whether an impairment has occurred. We evaluate, among other things, the financial position andnear term prospects of the issuer, conditions in the issuer’s industry, liquidity of the investment, changes in theamount or timing of expected future cash flows from the investment, and recent downgrades of the issuer by arating agency, to determine if, and when, a decline in the fair value of an investment below amortized cost isconsidered other-than-temporary. The length of time and extent to which the fair value of the investment is lessthan amortized cost and our ability and intent to retain the investment, to allow for any anticipated recovery ofthe investment’s fair value, are important components of our investment securities evaluation process.
Goodwill and Intangible Assets
Goodwill is not amortized but is subject to annual impairment tests. In addition to the annual impairmentreview, impairment reviews are performed whenever circumstances indicate a possible impairment may exist.
F-12
HCA HOLDINGS, INC.
NOTES TO CONSOLIDATED FINANCIAL STATEMENTS (Continued)
NOTE 1 — ACCOUNTING POLICIES (continued)
Goodwill and Intangible Assets (continued)
Impairment testing for goodwill is done at the reporting unit level. Reporting units are one level below thebusiness segment level, and our impairment testing is performed at the operating division or market level. Wecompare the fair value of the reporting unit assets to the carrying amount, on at least an annual basis, todetermine if there is potential impairment. If the fair value of the reporting unit assets is less than their carryingvalue, we compare the fair value of the goodwill to its carrying value. If the fair value of the goodwill is less thanits carrying value, an impairment loss is recognized. Fair value of goodwill is estimated based upon internalevaluations of the related long-lived assets for each reporting unit that include quantitative analyses of marketmultiples, revenues and cash flows and reviews of recent sales of similar facilities. No goodwill impairmentswere recognized during 2013, 2012 and 2011. Since January 1, 2000, we have recognized total goodwillimpairments of $102 million in the aggregate. None of the goodwill impairments related to evaluations ofgoodwill at the reporting unit level, as all recognized goodwill impairments during this period related to goodwillallocated to asset disposal groups.
During 2013, goodwill increased by $265 million related to acquisitions, declined by $1 million related tofacility sales and declined by $13 million related to foreign currency translation and other adjustments. During2012, goodwill increased by $288 million related to acquisitions, declined by $3 million related to facility salesand increased by $3 million related to foreign currency translation and other adjustments.
During 2013, identifiable intangible assets increased by $113 million and are being amortized overestimated lives ranging generally from three to 15 years. During 2012, there were no changes in identifiableintangible assets. During 2011, indefinite-lived identifiable intangible assets increased by $269 million.Indefinite-lived identifiable intangible assets are not amortized, but all identifiable intangible assets are subject toannual impairment tests, and impairment reviews are performed whenever circumstances indicate a possibleimpairment may exist.
Deferred Loan Costs
Debt issuance costs are amortized based upon the terms of the respective debt obligations. The grosscarrying amount of deferred loan costs at December 31, 2013 and 2012 was $542 million and $571 million,respectively, and accumulated amortization was $305 million and $281 million, respectively. Amortization ofdeferred loan costs is included in interest expense and was $55 million, $62 million and $70 million for 2013,2012 and 2011, respectively.
Physician Recruiting Agreements
In order to recruit physicians to meet the needs of our hospitals and the communities they serve, we enterinto minimum revenue guarantee arrangements to assist the recruited physicians during the period they arerelocating and establishing their practices. A guarantor is required to recognize, at the inception of a guarantee, aliability for the fair value of the stand-ready obligation undertaken in issuing the guarantee. We expense the totalestimated guarantee liability amount at the time the physician recruiting agreement becomes effective as we arenot able to justify recording a contract-based asset based upon our analysis of the related control, regulatory andlegal considerations.
The physician recruiting liability amount of $15 million at both December 31, 2013 and 2012 represents theamount of expense recognized in excess of payments made through December 31, 2013 and 2012. AtDecember 31, 2013 the maximum amount we could have to pay under all effective minimum revenue guaranteeswas $39 million.
F-13
HCA HOLDINGS, INC.
NOTES TO CONSOLIDATED FINANCIAL STATEMENTS (Continued)
NOTE 1 — ACCOUNTING POLICIES (continued)
Professional Liability Claims
Reserves for professional liability risks were $1.279 billion and $1.297 billion at December 31, 2013 and2012, respectively. The current portion of the reserves, $331 million and $324 million at December 31, 2013 and2012, respectively, is included in “other accrued expenses” in the consolidated balance sheets. Provisions forlosses related to professional liability risks were $314 million, $331 million and $244 million for 2013, 2012 and2011, respectively, and are included in “other operating expenses” in our consolidated income statements.Provisions for losses related to professional liability risks are based upon actuarially determined estimates. Lossand loss expense reserves represent the estimated ultimate net cost of all reported and unreported losses incurredthrough the respective consolidated balance sheet dates. The reserves for unpaid losses and loss expenses areestimated using individual case-basis valuations and actuarial analyses. Those estimates are subject to the effectsof trends in loss severity and frequency. The estimates are continually reviewed and adjustments are recorded asexperience develops or new information becomes known. Adjustments to the estimated reserve amounts areincluded in current operating results. The reserves for professional liability risks cover approximately 2,600individual claims and 2,700 individual claims at December 31, 2013 and 2012, respectively, and estimates forunreported potential claims. The time period required to resolve these claims can vary depending upon thejurisdiction and whether the claim is settled or litigated. During 2013 and 2012, $307 million and $335 million,respectively, of net payments were made for professional and general liability claims. The estimation of thetiming of payments beyond a year can vary significantly. Although considerable variability is inherent inprofessional liability reserve estimates, we believe the reserves for losses and loss expenses are adequate;however, there can be no assurance the ultimate liability will not exceed our estimates.
A portion of our professional liability risks is insured through a 100% owned insurance subsidiary. Subjectto a $5 million per occurrence self-insured retention, our facilities are insured by our 100% owned insurancesubsidiary for losses up to $50 million per occurrence. The insurance subsidiary has obtained reinsurance forprofessional liability risks generally above a retention level of $15 million per occurrence. We also maintainprofessional liability insurance with unrelated commercial carriers for losses in excess of amounts insured by ourinsurance subsidiary.
The obligations covered by reinsurance and excess insurance contracts are included in the reserves forprofessional liability risks, as we remain liable to the extent the reinsurers and excess insurance carriers do notmeet their obligations under the reinsurance and excess insurance contracts. The amounts receivable under thereinsurance contracts include $19 million and $17 million at December 31, 2013 and 2012, respectively, recordedin “other assets”, and $5 million and $32 million at December 31, 2013 and 2012, respectively, recorded in“other current assets”.
Financial Instruments
Derivative financial instruments are employed to manage risks, including interest rate and foreign currencyexposures, and are not used for trading or speculative purposes. We recognize derivative instruments, such asinterest rate swap agreements and foreign exchange contracts, in the consolidated balance sheets at fair value.Changes in the fair value of derivatives are recognized periodically either in earnings or in stockholders’ equity,as a component of other comprehensive income (loss), depending on whether the derivative financial instrumentqualifies for hedge accounting, and if so, whether it qualifies as a fair value hedge or a cash flow hedge.Generally, changes in fair values of derivatives accounted for as fair value hedges are recorded in earnings, alongwith the changes in the fair value of the hedged items related to the hedged risk. Gains and losses on derivativesdesignated as cash flow hedges, to the extent they are effective, are recorded in other comprehensive income(loss), and subsequently reclassified to earnings to offset the impact of the forecasted transactions when they
F-14
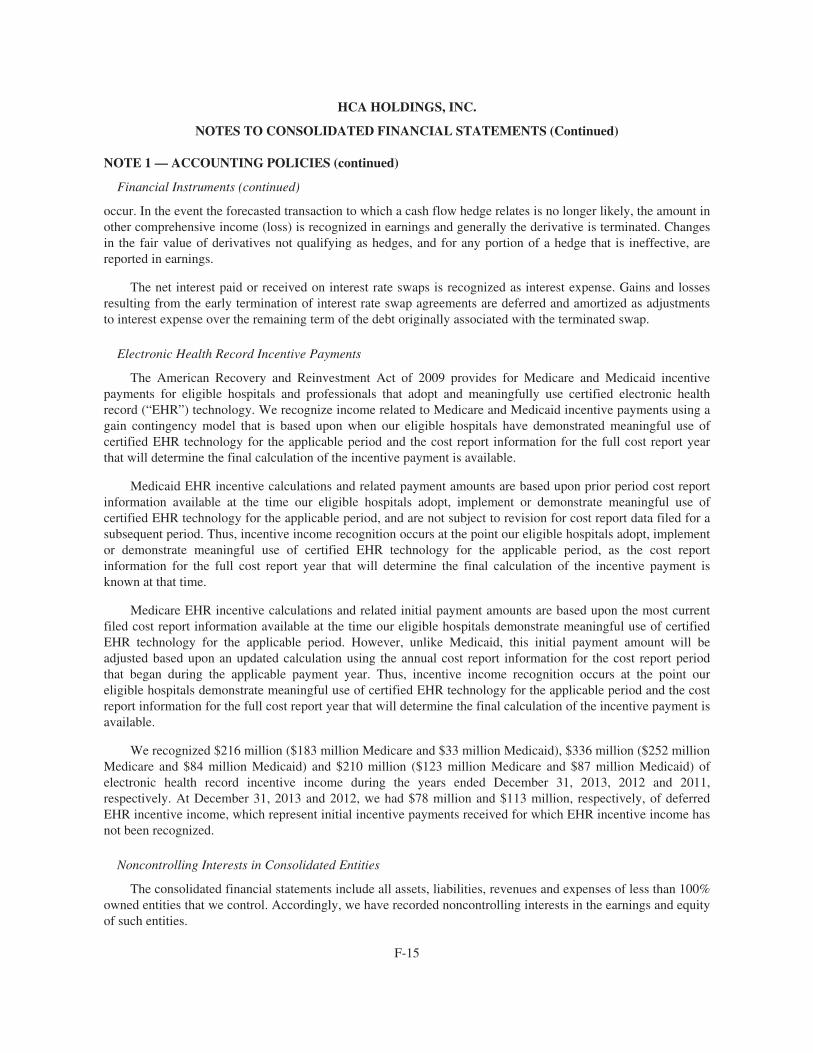
HCA HOLDINGS, INC.
NOTES TO CONSOLIDATED FINANCIAL STATEMENTS (Continued)
NOTE 1 — ACCOUNTING POLICIES (continued)
Financial Instruments (continued)
occur. In the event the forecasted transaction to which a cash flow hedge relates is no longer likely, the amount inother comprehensive income (loss) is recognized in earnings and generally the derivative is terminated. Changesin the fair value of derivatives not qualifying as hedges, and for any portion of a hedge that is ineffective, arereported in earnings.
The net interest paid or received on interest rate swaps is recognized as interest expense. Gains and lossesresulting from the early termination of interest rate swap agreements are deferred and amortized as adjustmentsto interest expense over the remaining term of the debt originally associated with the terminated swap.
Electronic Health Record Incentive Payments
The American Recovery and Reinvestment Act of 2009 provides for Medicare and Medicaid incentivepayments for eligible hospitals and professionals that adopt and meaningfully use certified electronic healthrecord (“EHR”) technology. We recognize income related to Medicare and Medicaid incentive payments using again contingency model that is based upon when our eligible hospitals have demonstrated meaningful use ofcertified EHR technology for the applicable period and the cost report information for the full cost report yearthat will determine the final calculation of the incentive payment is available.
Medicaid EHR incentive calculations and related payment amounts are based upon prior period cost reportinformation available at the time our eligible hospitals adopt, implement or demonstrate meaningful use ofcertified EHR technology for the applicable period, and are not subject to revision for cost report data filed for asubsequent period. Thus, incentive income recognition occurs at the point our eligible hospitals adopt, implementor demonstrate meaningful use of certified EHR technology for the applicable period, as the cost reportinformation for the full cost report year that will determine the final calculation of the incentive payment isknown at that time.
Medicare EHR incentive calculations and related initial payment amounts are based upon the most currentfiled cost report information available at the time our eligible hospitals demonstrate meaningful use of certifiedEHR technology for the applicable period. However, unlike Medicaid, this initial payment amount will beadjusted based upon an updated calculation using the annual cost report information for the cost report periodthat began during the applicable payment year. Thus, incentive income recognition occurs at the point oureligible hospitals demonstrate meaningful use of certified EHR technology for the applicable period and the costreport information for the full cost report year that will determine the final calculation of the incentive payment isavailable.
We recognized $216 million ($183 million Medicare and $33 million Medicaid), $336 million ($252 millionMedicare and $84 million Medicaid) and $210 million ($123 million Medicare and $87 million Medicaid) ofelectronic health record incentive income during the years ended December 31, 2013, 2012 and 2011,respectively. At December 31, 2013 and 2012, we had $78 million and $113 million, respectively, of deferredEHR incentive income, which represent initial incentive payments received for which EHR incentive income hasnot been recognized.
Noncontrolling Interests in Consolidated Entities
The consolidated financial statements include all assets, liabilities, revenues and expenses of less than 100%owned entities that we control. Accordingly, we have recorded noncontrolling interests in the earnings and equityof such entities.
F-15
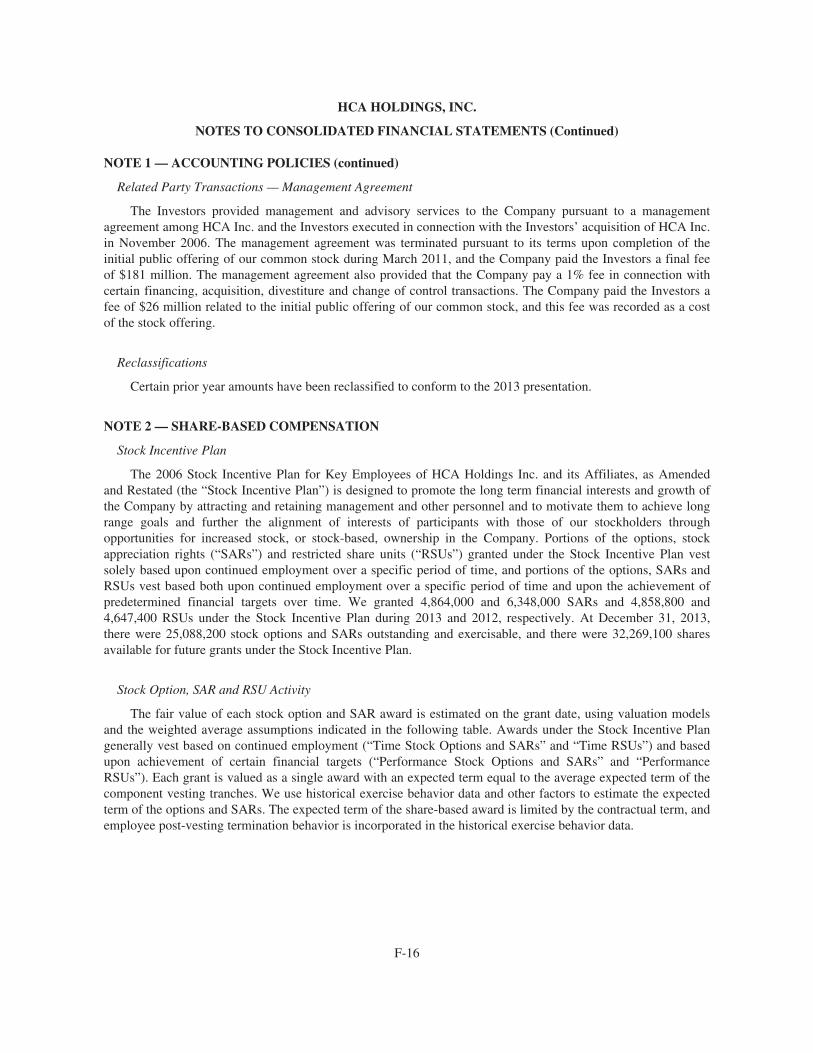
HCA HOLDINGS, INC.
NOTES TO CONSOLIDATED FINANCIAL STATEMENTS (Continued)
NOTE 1 — ACCOUNTING POLICIES (continued)
Related Party Transactions — Management Agreement
The Investors provided management and advisory services to the Company pursuant to a managementagreement among HCA Inc. and the Investors executed in connection with the Investors’ acquisition of HCA Inc.in November 2006. The management agreement was terminated pursuant to its terms upon completion of theinitial public offering of our common stock during March 2011, and the Company paid the Investors a final feeof $181 million. The management agreement also provided that the Company pay a 1% fee in connection withcertain financing, acquisition, divestiture and change of control transactions. The Company paid the Investors afee of $26 million related to the initial public offering of our common stock, and this fee was recorded as a costof the stock offering.
Reclassifications
Certain prior year amounts have been reclassified to conform to the 2013 presentation.
NOTE 2 — SHARE-BASED COMPENSATION
Stock Incentive Plan
The 2006 Stock Incentive Plan for Key Employees of HCA Holdings Inc. and its Affiliates, as Amendedand Restated (the “Stock Incentive Plan”) is designed to promote the long term financial interests and growth ofthe Company by attracting and retaining management and other personnel and to motivate them to achieve longrange goals and further the alignment of interests of participants with those of our stockholders throughopportunities for increased stock, or stock-based, ownership in the Company. Portions of the options, stockappreciation rights (“SARs”) and restricted share units (“RSUs”) granted under the Stock Incentive Plan vestsolely based upon continued employment over a specific period of time, and portions of the options, SARs andRSUs vest based both upon continued employment over a specific period of time and upon the achievement ofpredetermined financial targets over time. We granted 4,864,000 and 6,348,000 SARs and 4,858,800 and4,647,400 RSUs under the Stock Incentive Plan during 2013 and 2012, respectively. At December 31, 2013,there were 25,088,200 stock options and SARs outstanding and exercisable, and there were 32,269,100 sharesavailable for future grants under the Stock Incentive Plan.
Stock Option, SAR and RSU Activity
The fair value of each stock option and SAR award is estimated on the grant date, using valuation modelsand the weighted average assumptions indicated in the following table. Awards under the Stock Incentive Plangenerally vest based on continued employment (“Time Stock Options and SARs” and “Time RSUs”) and basedupon achievement of certain financial targets (“Performance Stock Options and SARs” and “PerformanceRSUs”). Each grant is valued as a single award with an expected term equal to the average expected term of thecomponent vesting tranches. We use historical exercise behavior data and other factors to estimate the expectedterm of the options and SARs. The expected term of the share-based award is limited by the contractual term, andemployee post-vesting termination behavior is incorporated in the historical exercise behavior data.
F-16
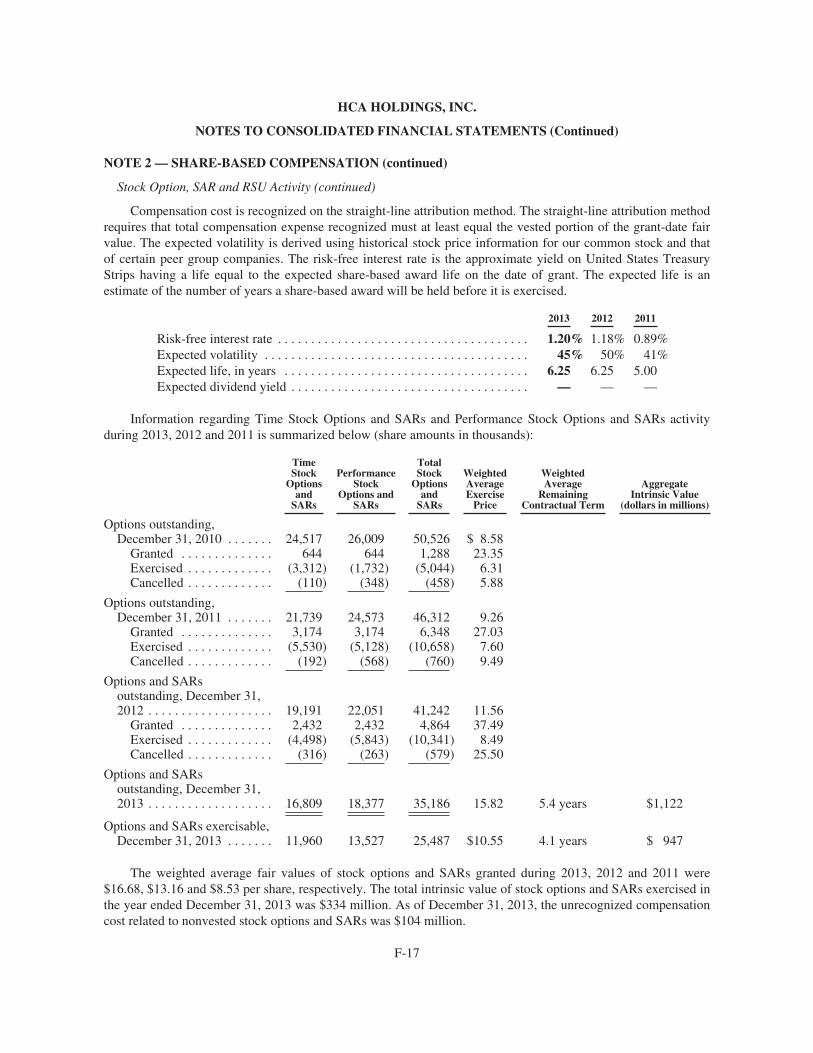
HCA HOLDINGS, INC.
NOTES TO CONSOLIDATED FINANCIAL STATEMENTS (Continued)
NOTE 2 — SHARE-BASED COMPENSATION (continued)
Stock Option, SAR and RSU Activity (continued)
Compensation cost is recognized on the straight-line attribution method. The straight-line attribution methodrequires that total compensation expense recognized must at least equal the vested portion of the grant-date fairvalue. The expected volatility is derived using historical stock price information for our common stock and thatof certain peer group companies. The risk-free interest rate is the approximate yield on United States TreasuryStrips having a life equal to the expected share-based award life on the date of grant. The expected life is anestimate of the number of years a share-based award will be held before it is exercised.
2013 2012 2011
Risk-free interest rate . . . . . . . . . . . . . . . . . . . . . . . . . . . . . . . . . . . . . . 1.20% 1.18% 0.89%Expected volatility . . . . . . . . . . . . . . . . . . . . . . . . . . . . . . . . . . . . . . . . 45% 50% 41%Expected life, in years . . . . . . . . . . . . . . . . . . . . . . . . . . . . . . . . . . . . . 6.25 6.25 5.00Expected dividend yield . . . . . . . . . . . . . . . . . . . . . . . . . . . . . . . . . . . . — — —
Information regarding Time Stock Options and SARs and Performance Stock Options and SARs activityduring 2013, 2012 and 2011 is summarized below (share amounts in thousands):
TimeStock
Optionsand
SARs
PerformanceStock
Options andSARs
TotalStock
Optionsand
SARs
WeightedAverageExercise
Price
WeightedAverage
RemainingContractual Term
AggregateIntrinsic Value
(dollars in millions)
Options outstanding,December 31, 2010 . . . . . . . 24,517 26,009 50,526 $ 8.58
Granted . . . . . . . . . . . . . . 644 644 1,288 23.35Exercised . . . . . . . . . . . . . (3,312) (1,732) (5,044) 6.31Cancelled . . . . . . . . . . . . . (110) (348) (458) 5.88
Options outstanding,December 31, 2011 . . . . . . . 21,739 24,573 46,312 9.26
Granted . . . . . . . . . . . . . . 3,174 3,174 6,348 27.03Exercised . . . . . . . . . . . . . (5,530) (5,128) (10,658) 7.60Cancelled . . . . . . . . . . . . . (192) (568) (760) 9.49
Options and SARsoutstanding, December 31,2012 . . . . . . . . . . . . . . . . . . . 19,191 22,051 41,242 11.56
Granted . . . . . . . . . . . . . . 2,432 2,432 4,864 37.49Exercised . . . . . . . . . . . . . (4,498) (5,843) (10,341) 8.49Cancelled . . . . . . . . . . . . . (316) (263) (579) 25.50
Options and SARsoutstanding, December 31,2013 . . . . . . . . . . . . . . . . . . . 16,809 18,377 35,186 15.82 5.4 years $1,122
Options and SARs exercisable,December 31, 2013 . . . . . . . 11,960 13,527 25,487 $10.55 4.1 years $ 947
The weighted average fair values of stock options and SARs granted during 2013, 2012 and 2011 were$16.68, $13.16 and $8.53 per share, respectively. The total intrinsic value of stock options and SARs exercised inthe year ended December 31, 2013 was $334 million. As of December 31, 2013, the unrecognized compensationcost related to nonvested stock options and SARs was $104 million.
F-17
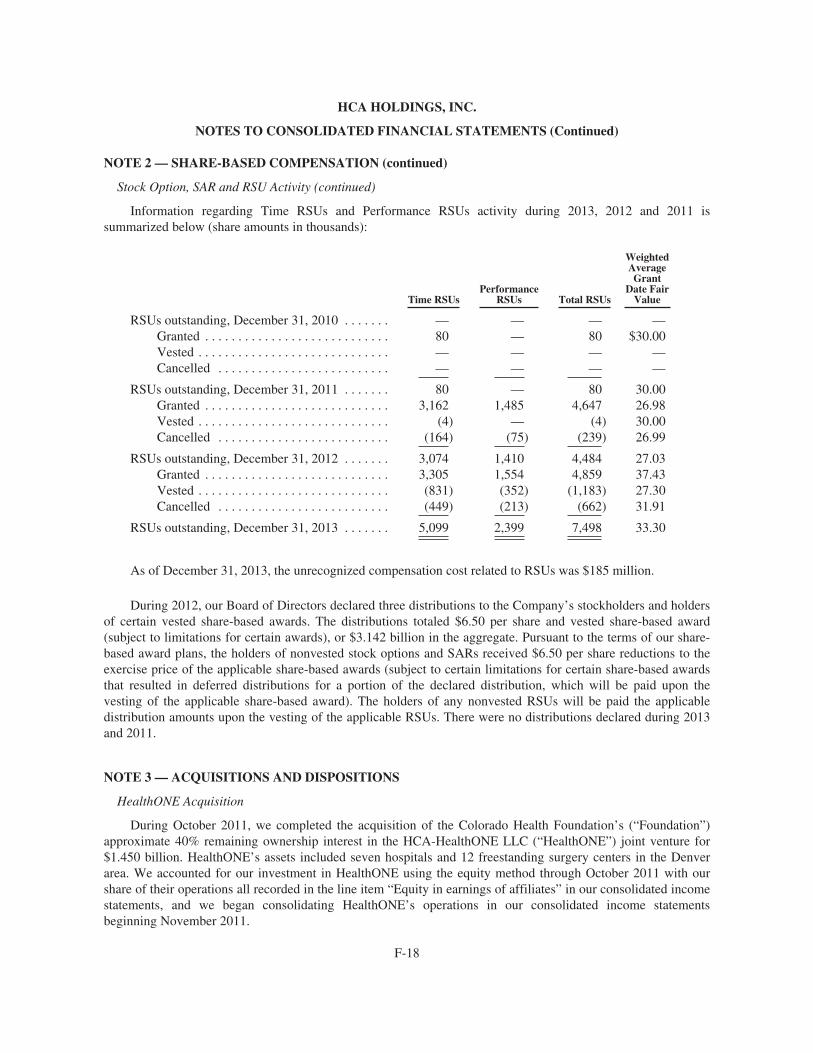
HCA HOLDINGS, INC.
NOTES TO CONSOLIDATED FINANCIAL STATEMENTS (Continued)
NOTE 2 — SHARE-BASED COMPENSATION (continued)
Stock Option, SAR and RSU Activity (continued)
Information regarding Time RSUs and Performance RSUs activity during 2013, 2012 and 2011 issummarized below (share amounts in thousands):
Time RSUsPerformance
RSUs Total RSUs
WeightedAverageGrant
Date FairValue
RSUs outstanding, December 31, 2010 . . . . . . . — — — —Granted . . . . . . . . . . . . . . . . . . . . . . . . . . . . 80 — 80 $30.00Vested . . . . . . . . . . . . . . . . . . . . . . . . . . . . . — — — —Cancelled . . . . . . . . . . . . . . . . . . . . . . . . . . — — — —
RSUs outstanding, December 31, 2011 . . . . . . . 80 — 80 30.00Granted . . . . . . . . . . . . . . . . . . . . . . . . . . . . 3,162 1,485 4,647 26.98Vested . . . . . . . . . . . . . . . . . . . . . . . . . . . . . (4) — (4) 30.00Cancelled . . . . . . . . . . . . . . . . . . . . . . . . . . (164) (75) (239) 26.99
RSUs outstanding, December 31, 2012 . . . . . . . 3,074 1,410 4,484 27.03Granted . . . . . . . . . . . . . . . . . . . . . . . . . . . . 3,305 1,554 4,859 37.43Vested . . . . . . . . . . . . . . . . . . . . . . . . . . . . . (831) (352) (1,183) 27.30Cancelled . . . . . . . . . . . . . . . . . . . . . . . . . . (449) (213) (662) 31.91
RSUs outstanding, December 31, 2013 . . . . . . . 5,099 2,399 7,498 33.30
As of December 31, 2013, the unrecognized compensation cost related to RSUs was $185 million.
During 2012, our Board of Directors declared three distributions to the Company’s stockholders and holdersof certain vested share-based awards. The distributions totaled $6.50 per share and vested share-based award(subject to limitations for certain awards), or $3.142 billion in the aggregate. Pursuant to the terms of our share-based award plans, the holders of nonvested stock options and SARs received $6.50 per share reductions to theexercise price of the applicable share-based awards (subject to certain limitations for certain share-based awardsthat resulted in deferred distributions for a portion of the declared distribution, which will be paid upon thevesting of the applicable share-based award). The holders of any nonvested RSUs will be paid the applicabledistribution amounts upon the vesting of the applicable RSUs. There were no distributions declared during 2013and 2011.
NOTE 3 — ACQUISITIONS AND DISPOSITIONS
HealthONE Acquisition
During October 2011, we completed the acquisition of the Colorado Health Foundation’s (“Foundation”)approximate 40% remaining ownership interest in the HCA-HealthONE LLC (“HealthONE”) joint venture for$1.450 billion. HealthONE’s assets included seven hospitals and 12 freestanding surgery centers in the Denverarea. We accounted for our investment in HealthONE using the equity method through October 2011 with ourshare of their operations all recorded in the line item “Equity in earnings of affiliates” in our consolidated incomestatements, and we began consolidating HealthONE’s operations in our consolidated income statementsbeginning November 2011.
F-18
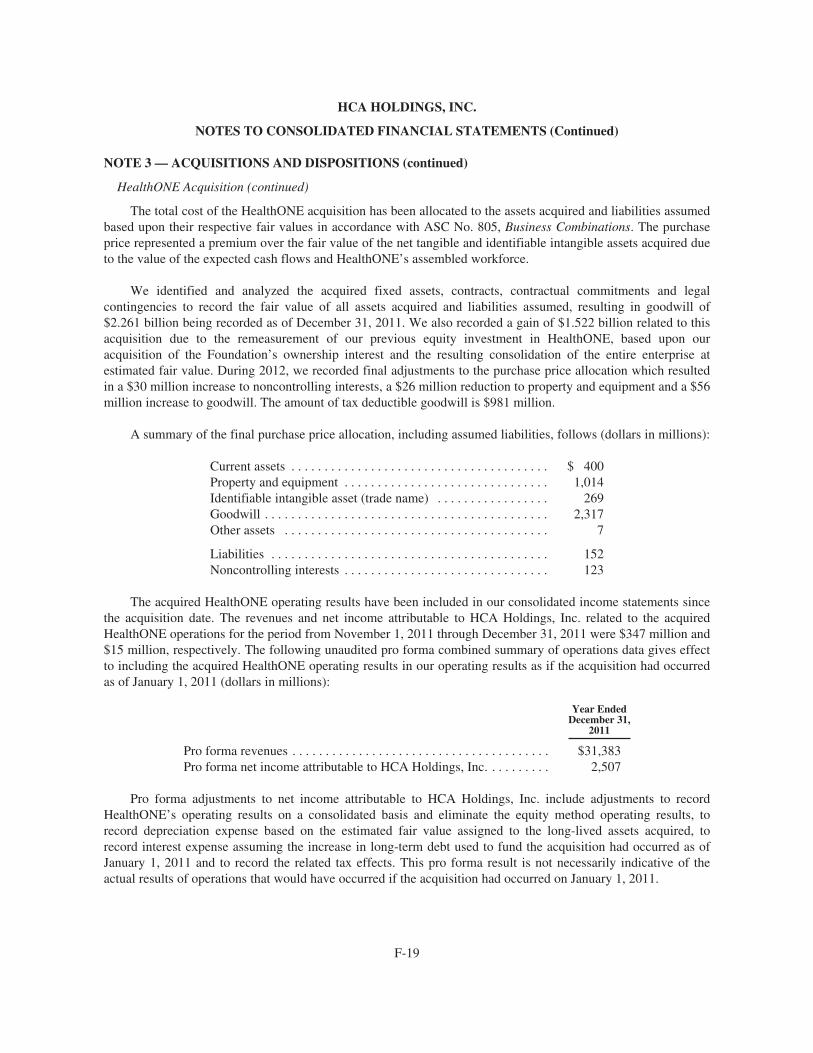
HCA HOLDINGS, INC.
NOTES TO CONSOLIDATED FINANCIAL STATEMENTS (Continued)
NOTE 3 — ACQUISITIONS AND DISPOSITIONS (continued)
HealthONE Acquisition (continued)
The total cost of the HealthONE acquisition has been allocated to the assets acquired and liabilities assumedbased upon their respective fair values in accordance with ASC No. 805, Business Combinations. The purchaseprice represented a premium over the fair value of the net tangible and identifiable intangible assets acquired dueto the value of the expected cash flows and HealthONE’s assembled workforce.
We identified and analyzed the acquired fixed assets, contracts, contractual commitments and legalcontingencies to record the fair value of all assets acquired and liabilities assumed, resulting in goodwill of$2.261 billion being recorded as of December 31, 2011. We also recorded a gain of $1.522 billion related to thisacquisition due to the remeasurement of our previous equity investment in HealthONE, based upon ouracquisition of the Foundation’s ownership interest and the resulting consolidation of the entire enterprise atestimated fair value. During 2012, we recorded final adjustments to the purchase price allocation which resultedin a $30 million increase to noncontrolling interests, a $26 million reduction to property and equipment and a $56million increase to goodwill. The amount of tax deductible goodwill is $981 million.
A summary of the final purchase price allocation, including assumed liabilities, follows (dollars in millions):
Current assets . . . . . . . . . . . . . . . . . . . . . . . . . . . . . . . . . . . . . . . $ 400Property and equipment . . . . . . . . . . . . . . . . . . . . . . . . . . . . . . . 1,014Identifiable intangible asset (trade name) . . . . . . . . . . . . . . . . . 269Goodwill . . . . . . . . . . . . . . . . . . . . . . . . . . . . . . . . . . . . . . . . . . . 2,317Other assets . . . . . . . . . . . . . . . . . . . . . . . . . . . . . . . . . . . . . . . . 7
Liabilities . . . . . . . . . . . . . . . . . . . . . . . . . . . . . . . . . . . . . . . . . . 152Noncontrolling interests . . . . . . . . . . . . . . . . . . . . . . . . . . . . . . . 123
The acquired HealthONE operating results have been included in our consolidated income statements sincethe acquisition date. The revenues and net income attributable to HCA Holdings, Inc. related to the acquiredHealthONE operations for the period from November 1, 2011 through December 31, 2011 were $347 million and$15 million, respectively. The following unaudited pro forma combined summary of operations data gives effectto including the acquired HealthONE operating results in our operating results as if the acquisition had occurredas of January 1, 2011 (dollars in millions):
Year EndedDecember 31,
2011
Pro forma revenues . . . . . . . . . . . . . . . . . . . . . . . . . . . . . . . . . . . . . . . $31,383Pro forma net income attributable to HCA Holdings, Inc. . . . . . . . . . 2,507
Pro forma adjustments to net income attributable to HCA Holdings, Inc. include adjustments to recordHealthONE’s operating results on a consolidated basis and eliminate the equity method operating results, torecord depreciation expense based on the estimated fair value assigned to the long-lived assets acquired, torecord interest expense assuming the increase in long-term debt used to fund the acquisition had occurred as ofJanuary 1, 2011 and to record the related tax effects. This pro forma result is not necessarily indicative of theactual results of operations that would have occurred if the acquisition had occurred on January 1, 2011.
F-19
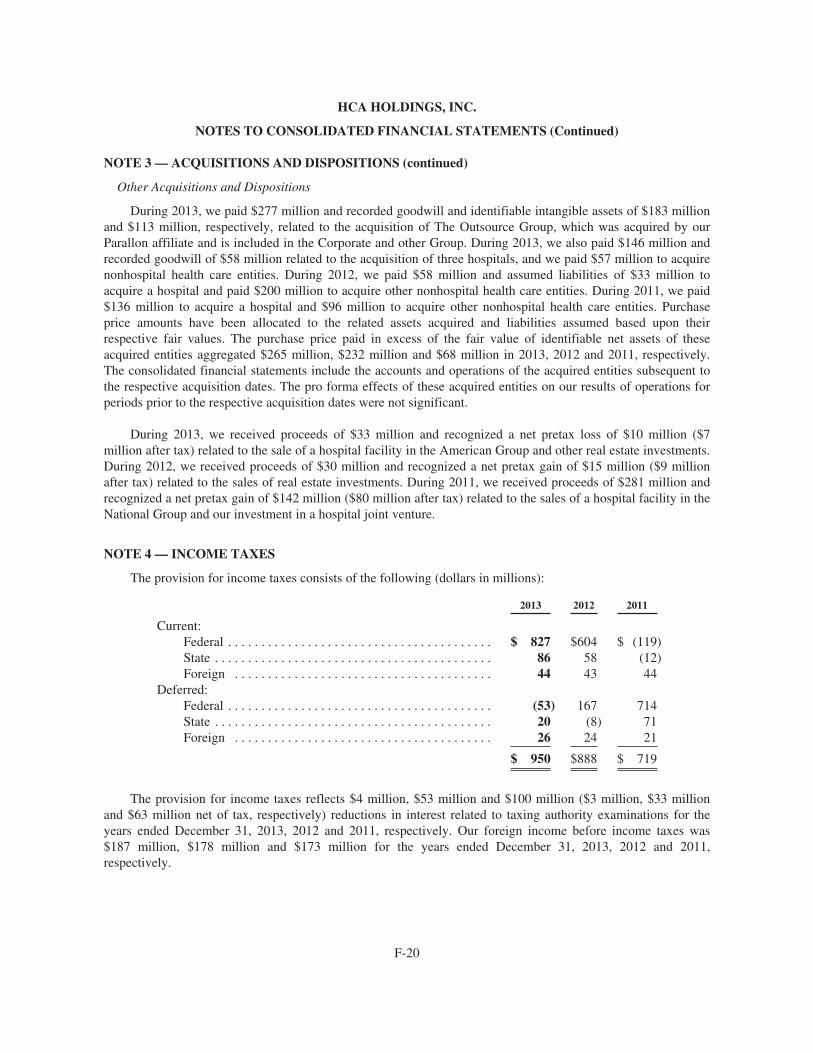
HCA HOLDINGS, INC.
NOTES TO CONSOLIDATED FINANCIAL STATEMENTS (Continued)
NOTE 3 — ACQUISITIONS AND DISPOSITIONS (continued)
Other Acquisitions and Dispositions
During 2013, we paid $277 million and recorded goodwill and identifiable intangible assets of $183 millionand $113 million, respectively, related to the acquisition of The Outsource Group, which was acquired by ourParallon affiliate and is included in the Corporate and other Group. During 2013, we also paid $146 million andrecorded goodwill of $58 million related to the acquisition of three hospitals, and we paid $57 million to acquirenonhospital health care entities. During 2012, we paid $58 million and assumed liabilities of $33 million toacquire a hospital and paid $200 million to acquire other nonhospital health care entities. During 2011, we paid$136 million to acquire a hospital and $96 million to acquire other nonhospital health care entities. Purchaseprice amounts have been allocated to the related assets acquired and liabilities assumed based upon theirrespective fair values. The purchase price paid in excess of the fair value of identifiable net assets of theseacquired entities aggregated $265 million, $232 million and $68 million in 2013, 2012 and 2011, respectively.The consolidated financial statements include the accounts and operations of the acquired entities subsequent tothe respective acquisition dates. The pro forma effects of these acquired entities on our results of operations forperiods prior to the respective acquisition dates were not significant.
During 2013, we received proceeds of $33 million and recognized a net pretax loss of $10 million ($7million after tax) related to the sale of a hospital facility in the American Group and other real estate investments.During 2012, we received proceeds of $30 million and recognized a net pretax gain of $15 million ($9 millionafter tax) related to the sales of real estate investments. During 2011, we received proceeds of $281 million andrecognized a net pretax gain of $142 million ($80 million after tax) related to the sales of a hospital facility in theNational Group and our investment in a hospital joint venture.
NOTE 4 — INCOME TAXES
The provision for income taxes consists of the following (dollars in millions):
2013 2012 2011
Current:Federal . . . . . . . . . . . . . . . . . . . . . . . . . . . . . . . . . . . . . . . . $ 827 $604 $ (119)State . . . . . . . . . . . . . . . . . . . . . . . . . . . . . . . . . . . . . . . . . . 86 58 (12)Foreign . . . . . . . . . . . . . . . . . . . . . . . . . . . . . . . . . . . . . . . 44 43 44
Deferred:Federal . . . . . . . . . . . . . . . . . . . . . . . . . . . . . . . . . . . . . . . . (53) 167 714State . . . . . . . . . . . . . . . . . . . . . . . . . . . . . . . . . . . . . . . . . . 20 (8) 71Foreign . . . . . . . . . . . . . . . . . . . . . . . . . . . . . . . . . . . . . . . 26 24 21
$ 950 $888 $ 719
The provision for income taxes reflects $4 million, $53 million and $100 million ($3 million, $33 millionand $63 million net of tax, respectively) reductions in interest related to taxing authority examinations for theyears ended December 31, 2013, 2012 and 2011, respectively. Our foreign income before income taxes was$187 million, $178 million and $173 million for the years ended December 31, 2013, 2012 and 2011,respectively.
F-20
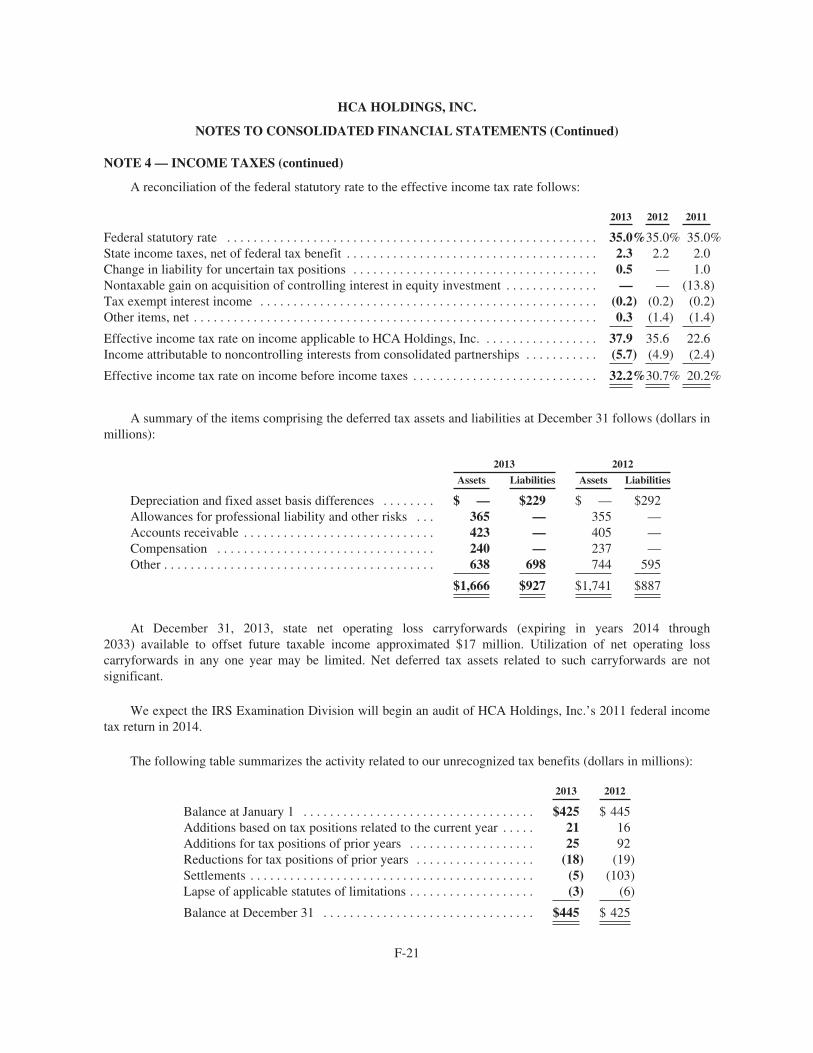
HCA HOLDINGS, INC.
NOTES TO CONSOLIDATED FINANCIAL STATEMENTS (Continued)
NOTE 4 — INCOME TAXES (continued)
A reconciliation of the federal statutory rate to the effective income tax rate follows:
2013 2012 2011
Federal statutory rate . . . . . . . . . . . . . . . . . . . . . . . . . . . . . . . . . . . . . . . . . . . . . . . . . . . . . . . . 35.0%35.0% 35.0%State income taxes, net of federal tax benefit . . . . . . . . . . . . . . . . . . . . . . . . . . . . . . . . . . . . . . 2.3 2.2 2.0Change in liability for uncertain tax positions . . . . . . . . . . . . . . . . . . . . . . . . . . . . . . . . . . . . . 0.5 — 1.0Nontaxable gain on acquisition of controlling interest in equity investment . . . . . . . . . . . . . . — — (13.8)Tax exempt interest income . . . . . . . . . . . . . . . . . . . . . . . . . . . . . . . . . . . . . . . . . . . . . . . . . . . (0.2) (0.2) (0.2)Other items, net . . . . . . . . . . . . . . . . . . . . . . . . . . . . . . . . . . . . . . . . . . . . . . . . . . . . . . . . . . . . . 0.3 (1.4) (1.4)
Effective income tax rate on income applicable to HCA Holdings, Inc. . . . . . . . . . . . . . . . . . 37.9 35.6 22.6Income attributable to noncontrolling interests from consolidated partnerships . . . . . . . . . . . (5.7) (4.9) (2.4)
Effective income tax rate on income before income taxes . . . . . . . . . . . . . . . . . . . . . . . . . . . . 32.2%30.7% 20.2%
A summary of the items comprising the deferred tax assets and liabilities at December 31 follows (dollars inmillions):
2013 2012
Assets Liabilities Assets Liabilities
Depreciation and fixed asset basis differences . . . . . . . . $ — $229 $ — $292Allowances for professional liability and other risks . . . 365 — 355 —Accounts receivable . . . . . . . . . . . . . . . . . . . . . . . . . . . . . 423 — 405 —Compensation . . . . . . . . . . . . . . . . . . . . . . . . . . . . . . . . . 240 — 237 —Other . . . . . . . . . . . . . . . . . . . . . . . . . . . . . . . . . . . . . . . . . 638 698 744 595
$1,666 $927 $1,741 $887
At December 31, 2013, state net operating loss carryforwards (expiring in years 2014 through2033) available to offset future taxable income approximated $17 million. Utilization of net operating losscarryforwards in any one year may be limited. Net deferred tax assets related to such carryforwards are notsignificant.
We expect the IRS Examination Division will begin an audit of HCA Holdings, Inc.’s 2011 federal incometax return in 2014.
The following table summarizes the activity related to our unrecognized tax benefits (dollars in millions):
2013 2012
Balance at January 1 . . . . . . . . . . . . . . . . . . . . . . . . . . . . . . . . . . . $425 $ 445Additions based on tax positions related to the current year . . . . . 21 16Additions for tax positions of prior years . . . . . . . . . . . . . . . . . . . 25 92Reductions for tax positions of prior years . . . . . . . . . . . . . . . . . . (18) (19)Settlements . . . . . . . . . . . . . . . . . . . . . . . . . . . . . . . . . . . . . . . . . . . (5) (103)Lapse of applicable statutes of limitations . . . . . . . . . . . . . . . . . . . (3) (6)
Balance at December 31 . . . . . . . . . . . . . . . . . . . . . . . . . . . . . . . . $445 $ 425
F-21
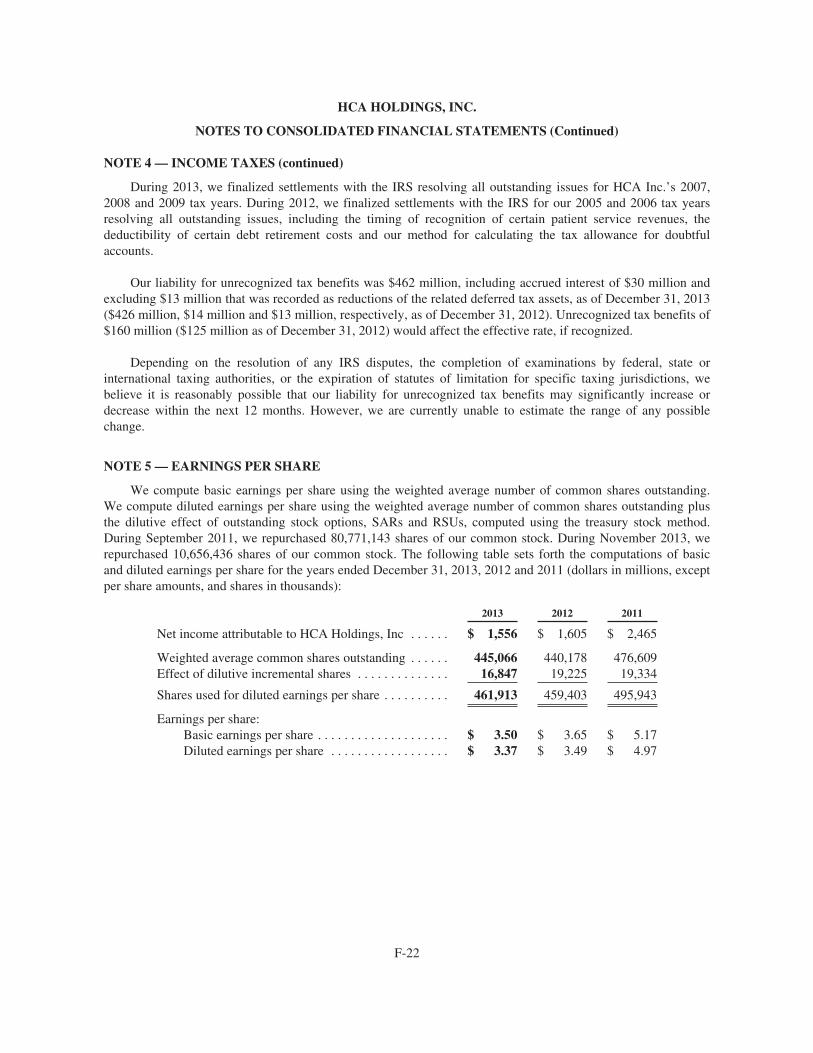
HCA HOLDINGS, INC.
NOTES TO CONSOLIDATED FINANCIAL STATEMENTS (Continued)
NOTE 4 — INCOME TAXES (continued)
During 2013, we finalized settlements with the IRS resolving all outstanding issues for HCA Inc.’s 2007,2008 and 2009 tax years. During 2012, we finalized settlements with the IRS for our 2005 and 2006 tax yearsresolving all outstanding issues, including the timing of recognition of certain patient service revenues, thedeductibility of certain debt retirement costs and our method for calculating the tax allowance for doubtfulaccounts.
Our liability for unrecognized tax benefits was $462 million, including accrued interest of $30 million andexcluding $13 million that was recorded as reductions of the related deferred tax assets, as of December 31, 2013($426 million, $14 million and $13 million, respectively, as of December 31, 2012). Unrecognized tax benefits of$160 million ($125 million as of December 31, 2012) would affect the effective rate, if recognized.
Depending on the resolution of any IRS disputes, the completion of examinations by federal, state orinternational taxing authorities, or the expiration of statutes of limitation for specific taxing jurisdictions, webelieve it is reasonably possible that our liability for unrecognized tax benefits may significantly increase ordecrease within the next 12 months. However, we are currently unable to estimate the range of any possiblechange.
NOTE 5 — EARNINGS PER SHARE
We compute basic earnings per share using the weighted average number of common shares outstanding.We compute diluted earnings per share using the weighted average number of common shares outstanding plusthe dilutive effect of outstanding stock options, SARs and RSUs, computed using the treasury stock method.During September 2011, we repurchased 80,771,143 shares of our common stock. During November 2013, werepurchased 10,656,436 shares of our common stock. The following table sets forth the computations of basicand diluted earnings per share for the years ended December 31, 2013, 2012 and 2011 (dollars in millions, exceptper share amounts, and shares in thousands):
2013 2012 2011
Net income attributable to HCA Holdings, Inc . . . . . . $ 1,556 $ 1,605 $ 2,465
Weighted average common shares outstanding . . . . . . 445,066 440,178 476,609Effect of dilutive incremental shares . . . . . . . . . . . . . . 16,847 19,225 19,334
Shares used for diluted earnings per share . . . . . . . . . . 461,913 459,403 495,943
Earnings per share:Basic earnings per share . . . . . . . . . . . . . . . . . . . . $ 3.50 $ 3.65 $ 5.17Diluted earnings per share . . . . . . . . . . . . . . . . . . $ 3.37 $ 3.49 $ 4.97
F-22
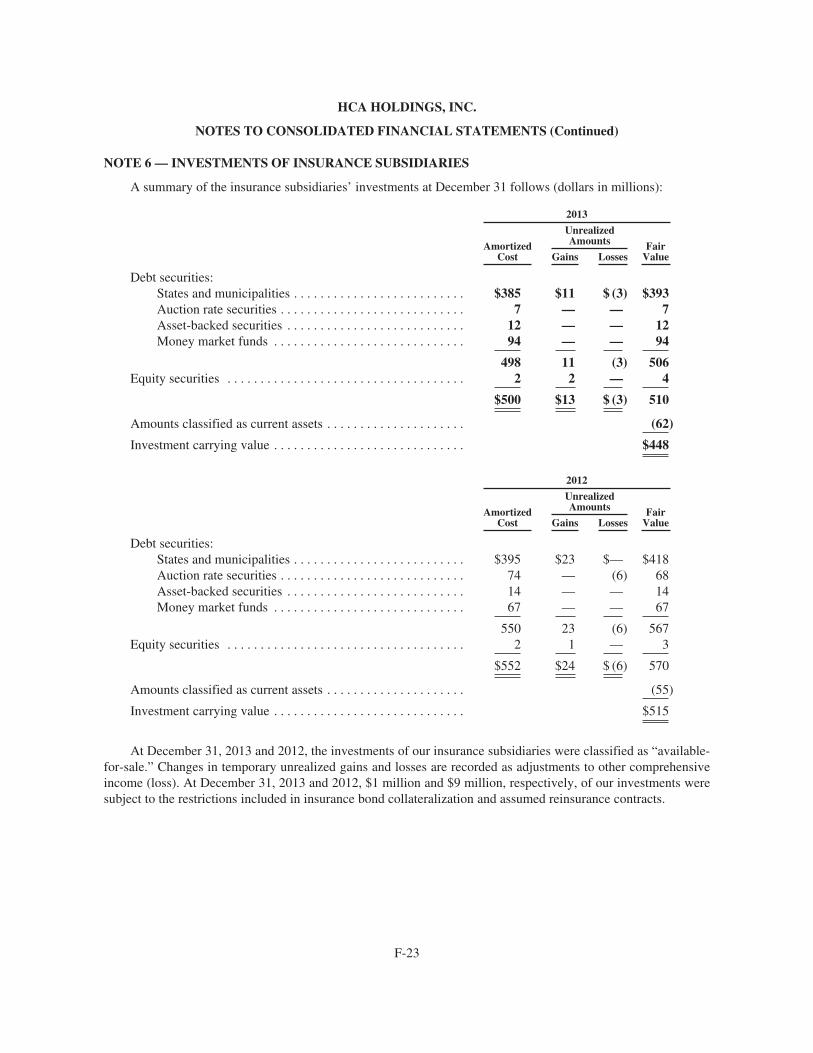
HCA HOLDINGS, INC.
NOTES TO CONSOLIDATED FINANCIAL STATEMENTS (Continued)
NOTE 6 — INVESTMENTS OF INSURANCE SUBSIDIARIES
A summary of the insurance subsidiaries’ investments at December 31 follows (dollars in millions):
2013
AmortizedCost
UnrealizedAmounts Fair
ValueGains Losses
Debt securities:States and municipalities . . . . . . . . . . . . . . . . . . . . . . . . . . $385 $11 $ (3) $393Auction rate securities . . . . . . . . . . . . . . . . . . . . . . . . . . . . 7 — — 7Asset-backed securities . . . . . . . . . . . . . . . . . . . . . . . . . . . 12 — — 12Money market funds . . . . . . . . . . . . . . . . . . . . . . . . . . . . . 94 — — 94
498 11 (3) 506Equity securities . . . . . . . . . . . . . . . . . . . . . . . . . . . . . . . . . . . . 2 2 — 4
$500 $13 $ (3) 510
Amounts classified as current assets . . . . . . . . . . . . . . . . . . . . . (62)
Investment carrying value . . . . . . . . . . . . . . . . . . . . . . . . . . . . . $448
2012
AmortizedCost
UnrealizedAmounts Fair
ValueGains Losses
Debt securities:States and municipalities . . . . . . . . . . . . . . . . . . . . . . . . . . $395 $23 $— $418Auction rate securities . . . . . . . . . . . . . . . . . . . . . . . . . . . . 74 — (6) 68Asset-backed securities . . . . . . . . . . . . . . . . . . . . . . . . . . . 14 — — 14Money market funds . . . . . . . . . . . . . . . . . . . . . . . . . . . . . 67 — — 67
550 23 (6) 567Equity securities . . . . . . . . . . . . . . . . . . . . . . . . . . . . . . . . . . . . 2 1 — 3
$552 $24 $ (6) 570
Amounts classified as current assets . . . . . . . . . . . . . . . . . . . . . (55)
Investment carrying value . . . . . . . . . . . . . . . . . . . . . . . . . . . . . $515
At December 31, 2013 and 2012, the investments of our insurance subsidiaries were classified as “available-for-sale.” Changes in temporary unrealized gains and losses are recorded as adjustments to other comprehensiveincome (loss). At December 31, 2013 and 2012, $1 million and $9 million, respectively, of our investments weresubject to the restrictions included in insurance bond collateralization and assumed reinsurance contracts.
F-23
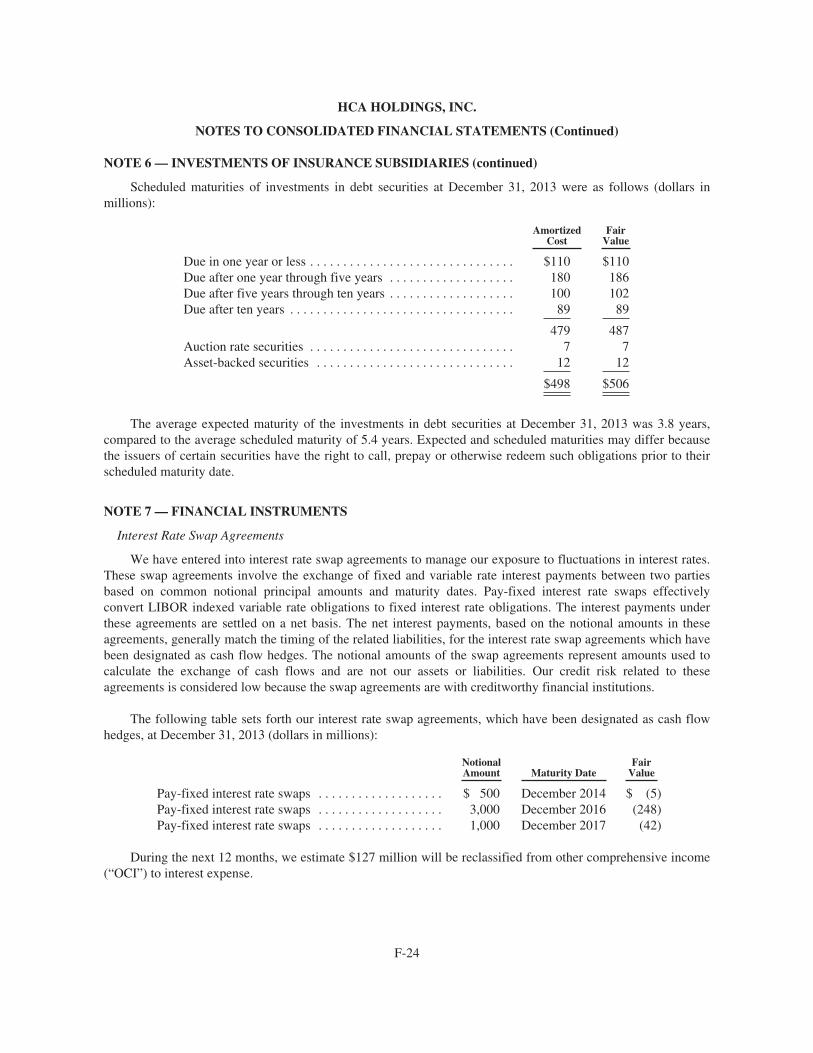
HCA HOLDINGS, INC.
NOTES TO CONSOLIDATED FINANCIAL STATEMENTS (Continued)
NOTE 6 — INVESTMENTS OF INSURANCE SUBSIDIARIES (continued)
Scheduled maturities of investments in debt securities at December 31, 2013 were as follows (dollars inmillions):
AmortizedCost
FairValue
Due in one year or less . . . . . . . . . . . . . . . . . . . . . . . . . . . . . . . $110 $110Due after one year through five years . . . . . . . . . . . . . . . . . . . 180 186Due after five years through ten years . . . . . . . . . . . . . . . . . . . 100 102Due after ten years . . . . . . . . . . . . . . . . . . . . . . . . . . . . . . . . . . 89 89
479 487Auction rate securities . . . . . . . . . . . . . . . . . . . . . . . . . . . . . . . 7 7Asset-backed securities . . . . . . . . . . . . . . . . . . . . . . . . . . . . . . 12 12
$498 $506
The average expected maturity of the investments in debt securities at December 31, 2013 was 3.8 years,compared to the average scheduled maturity of 5.4 years. Expected and scheduled maturities may differ becausethe issuers of certain securities have the right to call, prepay or otherwise redeem such obligations prior to theirscheduled maturity date.
NOTE 7 — FINANCIAL INSTRUMENTS
Interest Rate Swap Agreements
We have entered into interest rate swap agreements to manage our exposure to fluctuations in interest rates.These swap agreements involve the exchange of fixed and variable rate interest payments between two partiesbased on common notional principal amounts and maturity dates. Pay-fixed interest rate swaps effectivelyconvert LIBOR indexed variable rate obligations to fixed interest rate obligations. The interest payments underthese agreements are settled on a net basis. The net interest payments, based on the notional amounts in theseagreements, generally match the timing of the related liabilities, for the interest rate swap agreements which havebeen designated as cash flow hedges. The notional amounts of the swap agreements represent amounts used tocalculate the exchange of cash flows and are not our assets or liabilities. Our credit risk related to theseagreements is considered low because the swap agreements are with creditworthy financial institutions.
The following table sets forth our interest rate swap agreements, which have been designated as cash flowhedges, at December 31, 2013 (dollars in millions):
NotionalAmount Maturity Date
FairValue
Pay-fixed interest rate swaps . . . . . . . . . . . . . . . . . . . $ 500 December 2014 $ (5)Pay-fixed interest rate swaps . . . . . . . . . . . . . . . . . . . 3,000 December 2016 (248)Pay-fixed interest rate swaps . . . . . . . . . . . . . . . . . . . 1,000 December 2017 (42)
During the next 12 months, we estimate $127 million will be reclassified from other comprehensive income(“OCI”) to interest expense.
F-24
HCA HOLDINGS, INC.
NOTES TO CONSOLIDATED FINANCIAL STATEMENTS (Continued)
NOTE 7 — FINANCIAL INSTRUMENTS (continued)
Cross Currency Swaps
The Company and certain subsidiaries have incurred obligations and entered into various intercompanytransactions where such obligations are denominated in currencies, other than the functional currencies of theparties executing the trade. In order to mitigate the currency exposure risks and better match the cash flows ofour obligations and intercompany transactions with cash flows from operations, we enter into various crosscurrency swaps. At December 31, 2013, we are not party to any cross currency swaps.
Derivatives — Results of Operations
The following tables present the effect of our interest rate and cross currency swaps on our results ofoperations for the year ended December 31, 2013 (dollars in millions):
Derivatives in Cash Flow Hedging Relationships
Amount of GainRecognized in OCI onDerivatives, Net of Tax
Location of LossReclassified fromAccumulated OCI
into Operations
Amount of LossReclassified fromAccumulated OCI
into Operations
Interest rate swaps . . . . . . . . . . . . . . . . . . $2 Interest expense $131
Derivatives Not Designated as Hedging Instruments
Location of GainRecognized inOperations on
Derivatives
Amount of GainRecognized inOperations on
Derivatives
Cross currency swap (matured November 2013) . . . . . . . Other operating expenses $13
Credit-risk-related Contingent Features
We have agreements with each of our derivative counterparties that contain a provision where we could bedeclared in default on our derivative obligations if repayment of the underlying indebtedness is accelerated by thelender due to our default on the indebtedness. As of December 31, 2013, we have not been required to post anycollateral related to these agreements. If we had breached these provisions at December 31, 2013, we would havebeen required to settle our obligations under the agreements at their aggregate, estimated termination value of$308 million.
NOTE 8 — ASSETS AND LIABILITIES MEASURED AT FAIR VALUE
Accounting Standards Codification 820, Fair Value Measurements and Disclosures (“ASC 820”)emphasizes fair value is a market-based measurement, not an entity-specific measurement. Therefore, a fair valuemeasurement should be determined based on the assumptions market participants would use in pricing the assetor liability. As a basis for considering market participant assumptions in fair value measurements, ASC 820utilizes a fair value hierarchy that distinguishes between market participant assumptions based on market dataobtained from sources independent of the reporting entity (observable inputs classified within Levels 1 and 2 ofthe hierarchy) and the reporting entity’s own assumptions about market participant assumptions (unobservableinputs classified within Level 3 of the hierarchy).
Level 1 inputs utilize quoted prices (unadjusted) in active markets for identical assets or liabilities. Level 2inputs are inputs other than quoted prices included in Level 1 that are observable for the asset or liability, eitherdirectly or indirectly. Level 2 inputs may include quoted prices for similar assets and liabilities in active markets,as well as inputs observable for the asset or liability (other than quoted prices), such as interest rates, foreignexchange rates, and yield curves observable at commonly quoted intervals. Level 3 inputs are unobservable
F-25
HCA HOLDINGS, INC.
NOTES TO CONSOLIDATED FINANCIAL STATEMENTS (Continued)
NOTE 8 — ASSETS AND LIABILITIES MEASURED AT FAIR VALUE (continued)
inputs for the asset or liability, which are typically based on an entity’s own assumptions, as there is little, if any,related market activity. In instances where the determination of the fair value measurement is based on inputsfrom different levels of the fair value hierarchy, the level in the fair value hierarchy within which the entire fairvalue measurement falls is based on the lowest level input significant to the fair value measurement in itsentirety. Our assessment of the significance of a particular input to the fair value measurement in its entiretyrequires judgment, and considers factors specific to the asset or liability.
Cash Traded Investments
Our cash traded investments are generally classified within Level 1 or Level 2 of the fair value hierarchybecause they are valued using quoted market prices, broker or dealer quotations, or alternative pricing sourceswith reasonable levels of price transparency. Certain types of cash traded instruments are classified withinLevel 3 of the fair value hierarchy because they trade infrequently and therefore have little or no pricetransparency. The valuation of these securities involves management’s judgment, after consideration of marketfactors and the absence of market transparency, market liquidity and observable inputs. Our valuation modelsderived fair market values compared to tax-equivalent yields of other securities of similar credit worthiness andsimilar effective maturities.
Derivative Financial Instruments
We have entered into interest rate and cross currency swap agreements to manage our exposure tofluctuations in interest rates and foreign currency risks. The valuation of these instruments is determined usingwidely accepted valuation techniques, including discounted cash flow analysis on the expected cash flows ofeach derivative. This analysis reflects the contractual terms of the derivatives, including the period to maturity,and uses observable market-based inputs, including interest rate curves, foreign exchange rates and impliedvolatilities. To comply with the provisions of ASC 820, we incorporate credit valuation adjustments to reflectboth our own nonperformance risk and the respective counterparty’s nonperformance risk in the fair valuemeasurements.
Although we determined the majority of the inputs used to value our derivatives fall within Level 2 of thefair value hierarchy, the credit valuation adjustments associated with our derivatives utilize Level 3 inputs, suchas estimates of current credit spreads to evaluate the likelihood of default by us and our counterparties. Weassessed the significance of the impact of the credit valuation adjustments on the overall valuation of ourderivative positions, and at December 31, 2013 and 2012, we determined the credit valuation adjustments werenot significant to the overall valuation of our derivatives.
F-26
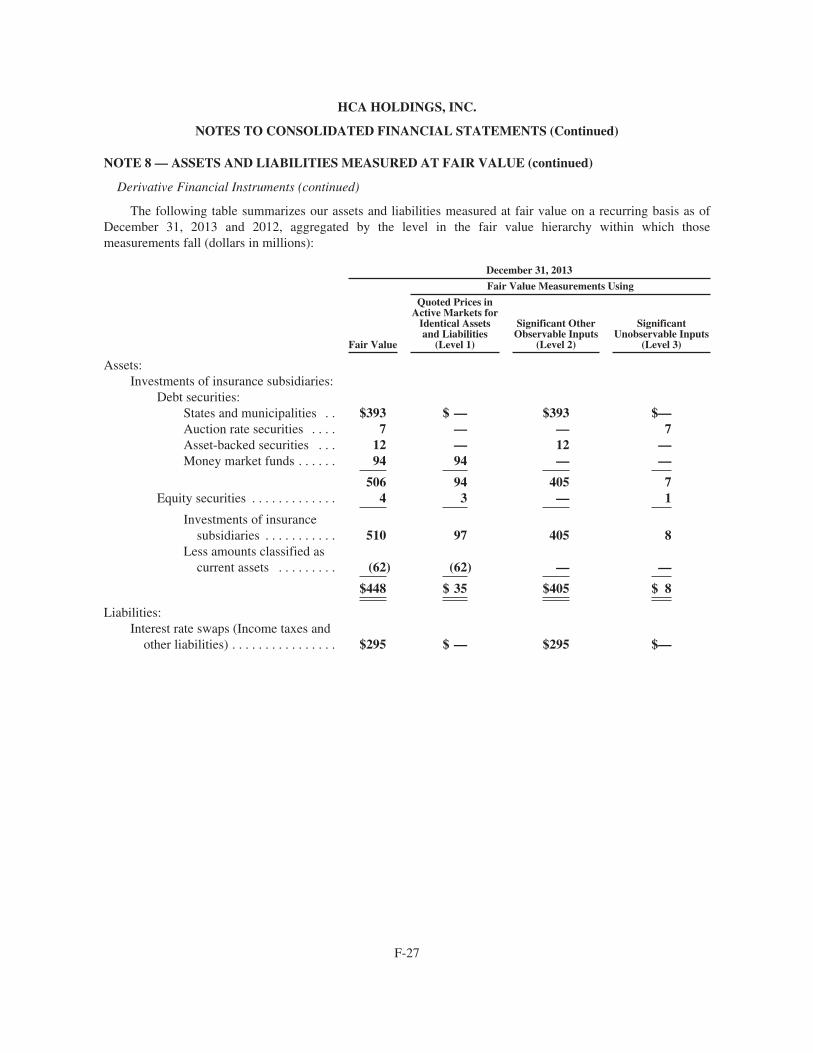
HCA HOLDINGS, INC.
NOTES TO CONSOLIDATED FINANCIAL STATEMENTS (Continued)
NOTE 8 — ASSETS AND LIABILITIES MEASURED AT FAIR VALUE (continued)
Derivative Financial Instruments (continued)
The following table summarizes our assets and liabilities measured at fair value on a recurring basis as ofDecember 31, 2013 and 2012, aggregated by the level in the fair value hierarchy within which thosemeasurements fall (dollars in millions):
December 31, 2013
Fair Value
Fair Value Measurements Using
Quoted Prices inActive Markets for
Identical Assetsand Liabilities
(Level 1)
Significant OtherObservable Inputs
(Level 2)
SignificantUnobservable Inputs
(Level 3)
Assets:Investments of insurance subsidiaries:
Debt securities:States and municipalities . . $393 $ — $393 $—Auction rate securities . . . . 7 — — 7Asset-backed securities . . . 12 — 12 —Money market funds . . . . . . 94 94 — —
506 94 405 7Equity securities . . . . . . . . . . . . . 4 3 — 1
Investments of insurancesubsidiaries . . . . . . . . . . . 510 97 405 8
Less amounts classified ascurrent assets . . . . . . . . . (62) (62) — —
$448 $ 35 $405 $ 8
Liabilities:Interest rate swaps (Income taxes and
other liabilities) . . . . . . . . . . . . . . . . $295 $ — $295 $—
F-27
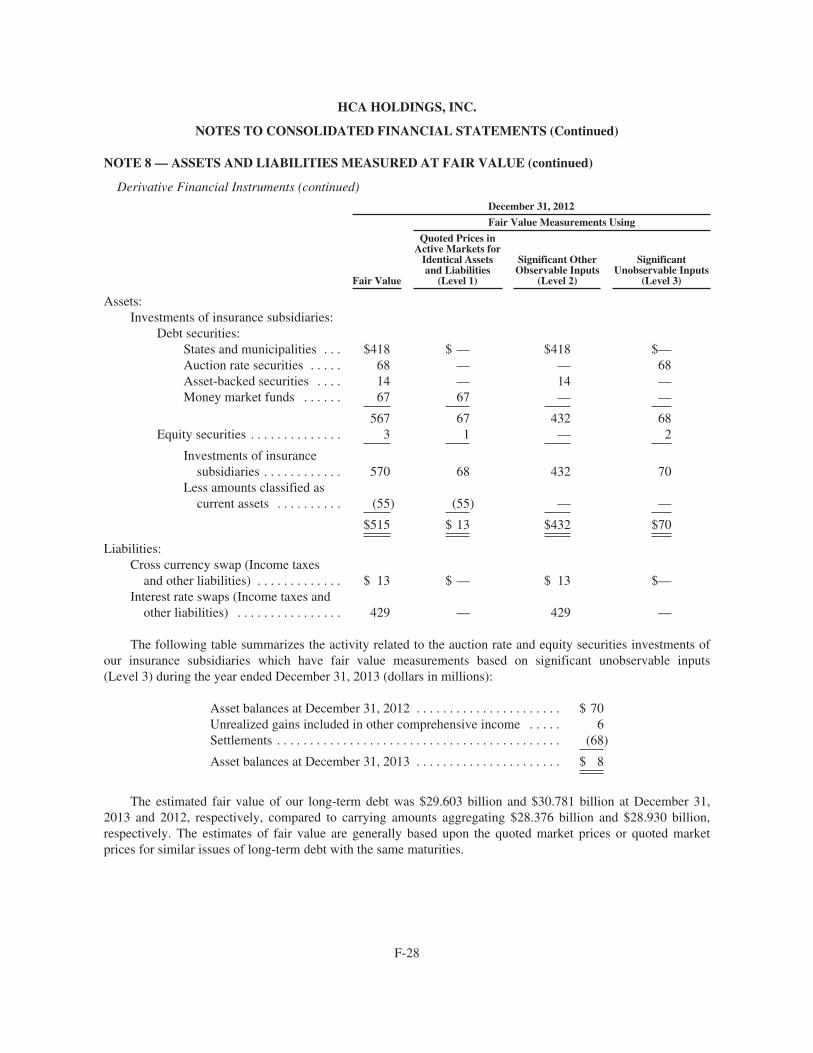
HCA HOLDINGS, INC.
NOTES TO CONSOLIDATED FINANCIAL STATEMENTS (Continued)
NOTE 8 — ASSETS AND LIABILITIES MEASURED AT FAIR VALUE (continued)
Derivative Financial Instruments (continued)
December 31, 2012
Fair Value Measurements Using
Fair Value
Quoted Prices inActive Markets for
Identical Assetsand Liabilities
(Level 1)
Significant OtherObservable Inputs
(Level 2)
SignificantUnobservable Inputs
(Level 3)
Assets:Investments of insurance subsidiaries:
Debt securities:States and municipalities . . . $418 $ — $418 $—Auction rate securities . . . . . 68 — — 68Asset-backed securities . . . . 14 — 14 —Money market funds . . . . . . 67 67 — —
567 67 432 68Equity securities . . . . . . . . . . . . . . 3 1 — 2
Investments of insurancesubsidiaries . . . . . . . . . . . . 570 68 432 70
Less amounts classified ascurrent assets . . . . . . . . . . (55) (55) — —
$515 $ 13 $432 $70
Liabilities:Cross currency swap (Income taxes
and other liabilities) . . . . . . . . . . . . . $ 13 $ — $ 13 $—Interest rate swaps (Income taxes and
other liabilities) . . . . . . . . . . . . . . . . 429 — 429 —
The following table summarizes the activity related to the auction rate and equity securities investments ofour insurance subsidiaries which have fair value measurements based on significant unobservable inputs(Level 3) during the year ended December 31, 2013 (dollars in millions):
Asset balances at December 31, 2012 . . . . . . . . . . . . . . . . . . . . . . $ 70Unrealized gains included in other comprehensive income . . . . . 6Settlements . . . . . . . . . . . . . . . . . . . . . . . . . . . . . . . . . . . . . . . . . . . (68)
Asset balances at December 31, 2013 . . . . . . . . . . . . . . . . . . . . . . $ 8
The estimated fair value of our long-term debt was $29.603 billion and $30.781 billion at December 31,2013 and 2012, respectively, compared to carrying amounts aggregating $28.376 billion and $28.930 billion,respectively. The estimates of fair value are generally based upon the quoted market prices or quoted marketprices for similar issues of long-term debt with the same maturities.
F-28
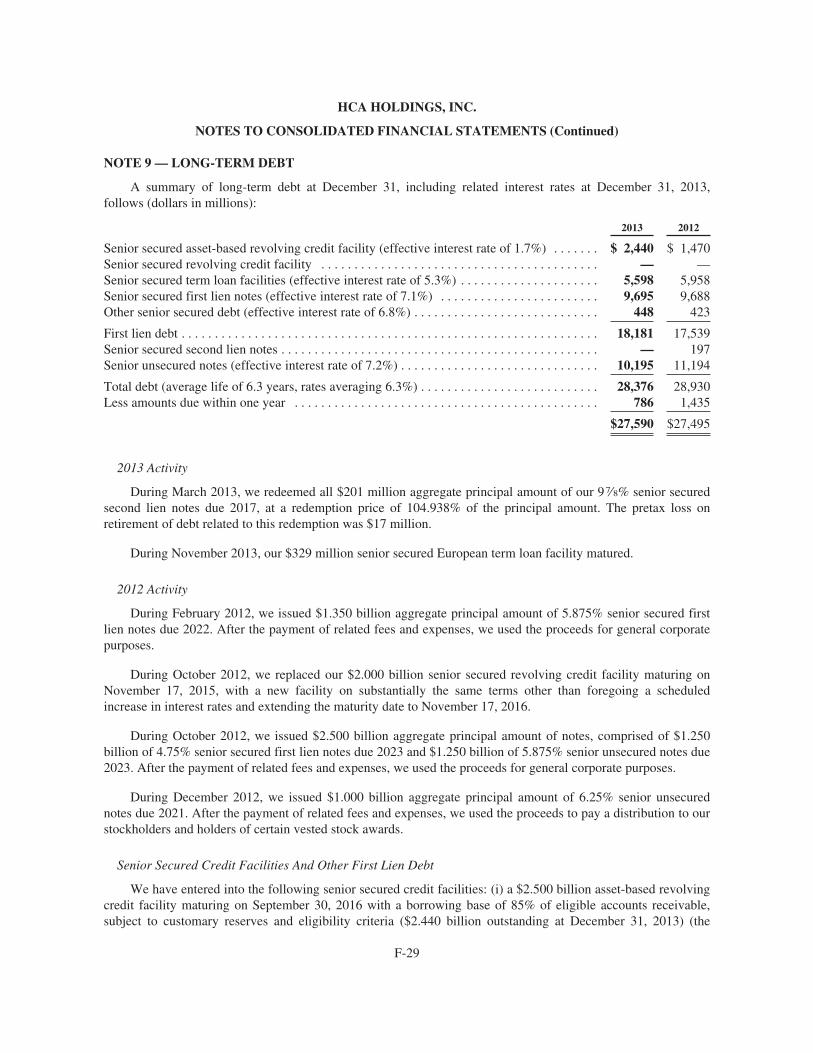
HCA HOLDINGS, INC.
NOTES TO CONSOLIDATED FINANCIAL STATEMENTS (Continued)
NOTE 9 — LONG-TERM DEBT
A summary of long-term debt at December 31, including related interest rates at December 31, 2013,follows (dollars in millions):
2013 2012
Senior secured asset-based revolving credit facility (effective interest rate of 1.7%) . . . . . . . $ 2,440 $ 1,470Senior secured revolving credit facility . . . . . . . . . . . . . . . . . . . . . . . . . . . . . . . . . . . . . . . . . . — —Senior secured term loan facilities (effective interest rate of 5.3%) . . . . . . . . . . . . . . . . . . . . . 5,598 5,958Senior secured first lien notes (effective interest rate of 7.1%) . . . . . . . . . . . . . . . . . . . . . . . . 9,695 9,688Other senior secured debt (effective interest rate of 6.8%) . . . . . . . . . . . . . . . . . . . . . . . . . . . . 448 423
First lien debt . . . . . . . . . . . . . . . . . . . . . . . . . . . . . . . . . . . . . . . . . . . . . . . . . . . . . . . . . . . . . . . 18,181 17,539Senior secured second lien notes . . . . . . . . . . . . . . . . . . . . . . . . . . . . . . . . . . . . . . . . . . . . . . . . — 197Senior unsecured notes (effective interest rate of 7.2%) . . . . . . . . . . . . . . . . . . . . . . . . . . . . . . 10,195 11,194
Total debt (average life of 6.3 years, rates averaging 6.3%) . . . . . . . . . . . . . . . . . . . . . . . . . . . 28,376 28,930Less amounts due within one year . . . . . . . . . . . . . . . . . . . . . . . . . . . . . . . . . . . . . . . . . . . . . . 786 1,435
$27,590 $27,495
2013 Activity
During March 2013, we redeemed all $201 million aggregate principal amount of our 97⁄8% senior securedsecond lien notes due 2017, at a redemption price of 104.938% of the principal amount. The pretax loss onretirement of debt related to this redemption was $17 million.
During November 2013, our $329 million senior secured European term loan facility matured.
2012 Activity
During February 2012, we issued $1.350 billion aggregate principal amount of 5.875% senior secured firstlien notes due 2022. After the payment of related fees and expenses, we used the proceeds for general corporatepurposes.
During October 2012, we replaced our $2.000 billion senior secured revolving credit facility maturing onNovember 17, 2015, with a new facility on substantially the same terms other than foregoing a scheduledincrease in interest rates and extending the maturity date to November 17, 2016.
During October 2012, we issued $2.500 billion aggregate principal amount of notes, comprised of $1.250billion of 4.75% senior secured first lien notes due 2023 and $1.250 billion of 5.875% senior unsecured notes due2023. After the payment of related fees and expenses, we used the proceeds for general corporate purposes.
During December 2012, we issued $1.000 billion aggregate principal amount of 6.25% senior unsecurednotes due 2021. After the payment of related fees and expenses, we used the proceeds to pay a distribution to ourstockholders and holders of certain vested stock awards.
Senior Secured Credit Facilities And Other First Lien Debt
We have entered into the following senior secured credit facilities: (i) a $2.500 billion asset-based revolvingcredit facility maturing on September 30, 2016 with a borrowing base of 85% of eligible accounts receivable,subject to customary reserves and eligibility criteria ($2.440 billion outstanding at December 31, 2013) (the
F-29

HCA HOLDINGS, INC.
NOTES TO CONSOLIDATED FINANCIAL STATEMENTS (Continued)
NOTE 9 — LONG-TERM DEBT (continued)
Senior Secured Credit Facilities And Other First Lien Debt (continued)
“ABL credit facility”); (ii) a $2.000 billion senior secured revolving credit facility maturing on November 17,2016 (none outstanding at December 31, 2013 without giving effect to certain outstanding letters of credit); (iii) a$512 million senior secured term loan A-2 facility maturing on May 2, 2016; (iv) a $724 million senior securedterm loan A-4 facility maturing on February 2, 2016; (v) a $2.367 billion senior secured term loan B-4 facilitymaturing on May 1, 2018; and (vi) a $1.995 billion senior secured term loan B-5 facility maturing on March 31,2017. We refer to the facilities described under (ii) through (vi) above, collectively, as the “cash flow creditfacility” and, together with the ABL credit facility, the “senior secured credit facilities.”
Borrowings under the senior secured credit facilities bear interest at a rate equal to, at our option, either (a) abase rate determined by reference to the higher of (1) the federal funds rate plus 0.50% or (2) the prime rate ofBank of America or (b) a LIBOR rate for the currency of such borrowing for the relevant interest period, plus, ineach case, an applicable margin. The applicable margin for borrowings under the senior secured credit facilitiesmay be reduced subject to attaining certain leverage ratios.
The senior secured credit facilities contain a number of covenants that restrict, subject to certain exceptions,our (and some or all of our subsidiaries’) ability to incur additional indebtedness, repay subordinatedindebtedness, create liens on assets, sell assets, make investments, loans or advances, engage in certaintransactions with affiliates, pay dividends and distributions, and enter into sale and leaseback transactions. Inaddition, we are required to satisfy and maintain a maximum total leverage ratio covenant under the cash flowcredit facility and, in certain situations under the ABL credit facility, a minimum interest coverage ratiocovenant.
Senior secured first lien notes consist of (i) $1.500 billion aggregate principal amount of 81⁄2% seniorsecured first lien notes due 2019; (ii) $1.250 billion aggregate principal amount of 77⁄8% senior secured first liennotes due 2020; (iii) $1.400 billion aggregate principal amount of 71⁄4% senior secured first lien notes due 2020;(iv) $3.000 billion aggregate principal amount of 6.50% senior secured first lien notes due 2020; (v) $1.350billion aggregate principal amount of 5.875% first lien notes due 2022; (vi) $1.250 billion aggregate principalamount of 4.75% first lien notes due 2023; and (vii) $55 million of unamortized debt discounts that reduce thesenior secured first lien indebtedness. Capital leases and other secured debt totaled $448 million at December 31,2013.
We use interest rate swap agreements to manage the variable rate exposure of our debt portfolio. AtDecember 31, 2013, we had entered into effective interest rate swap agreements, in a total notional amount of$4.500 billion, in order to hedge a portion of our exposure to variable rate interest payments associated with thesenior secured credit facilities. The effect of the interest rate swaps is reflected in the effective interest rates forthe senior secured credit facilities.
Senior Unsecured Notes
Senior unsecured notes consist of (i) $6.541 billion aggregate principal amount of senior notes withmaturities ranging from 2014 to 2033; (ii) an aggregate principal amount of $246 million medium-term noteswith maturities ranging from 2014 to 2025; (iii) an aggregate principal amount of $886 million debentures withmaturities ranging from 2015 to 2095; (iv) an aggregate principal amount of $1.525 billion senior notes due 2021issued by HCA Holdings, Inc.; (v) an aggregate principal amount of $1.000 billion senior notes due 2021 issuedby HCA Holdings, Inc.; and (vi) $3 million of unamortized debt discounts that reduce the indebtedness.
F-30
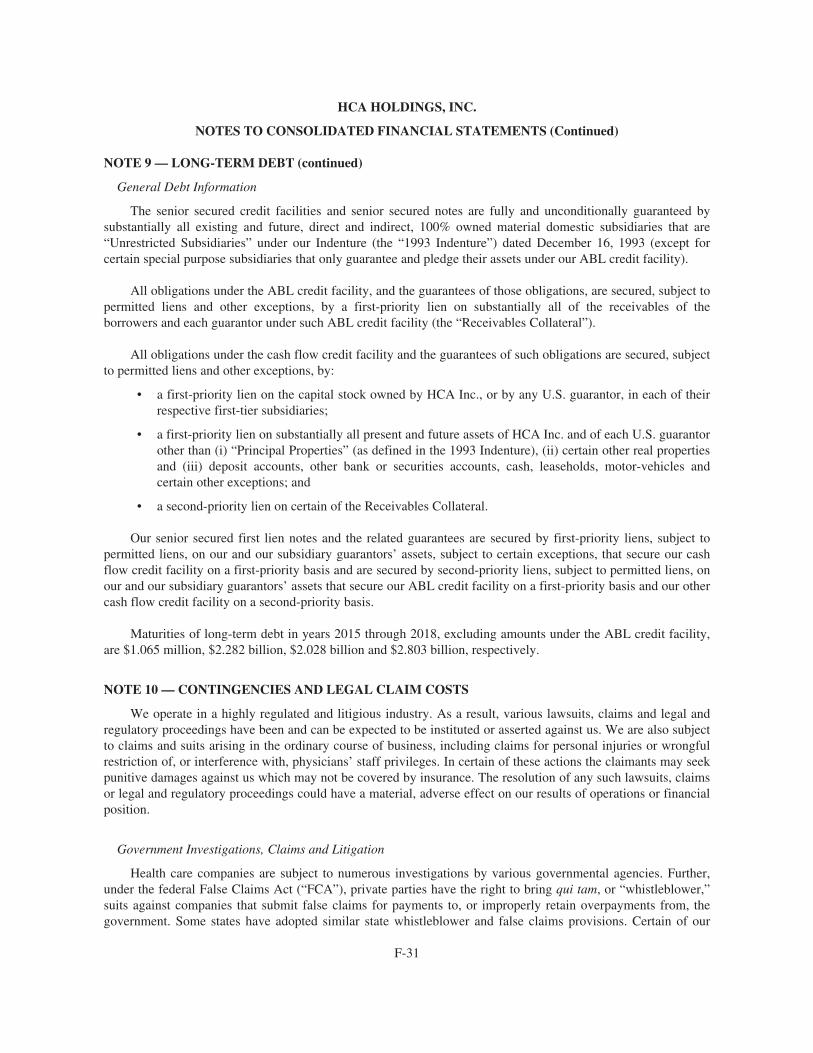
HCA HOLDINGS, INC.
NOTES TO CONSOLIDATED FINANCIAL STATEMENTS (Continued)
NOTE 9 — LONG-TERM DEBT (continued)
General Debt Information
The senior secured credit facilities and senior secured notes are fully and unconditionally guaranteed bysubstantially all existing and future, direct and indirect, 100% owned material domestic subsidiaries that are“Unrestricted Subsidiaries” under our Indenture (the “1993 Indenture”) dated December 16, 1993 (except forcertain special purpose subsidiaries that only guarantee and pledge their assets under our ABL credit facility).
All obligations under the ABL credit facility, and the guarantees of those obligations, are secured, subject topermitted liens and other exceptions, by a first-priority lien on substantially all of the receivables of theborrowers and each guarantor under such ABL credit facility (the “Receivables Collateral”).
All obligations under the cash flow credit facility and the guarantees of such obligations are secured, subjectto permitted liens and other exceptions, by:
• a first-priority lien on the capital stock owned by HCA Inc., or by any U.S. guarantor, in each of theirrespective first-tier subsidiaries;
• a first-priority lien on substantially all present and future assets of HCA Inc. and of each U.S. guarantorother than (i) “Principal Properties” (as defined in the 1993 Indenture), (ii) certain other real propertiesand (iii) deposit accounts, other bank or securities accounts, cash, leaseholds, motor-vehicles andcertain other exceptions; and
• a second-priority lien on certain of the Receivables Collateral.
Our senior secured first lien notes and the related guarantees are secured by first-priority liens, subject topermitted liens, on our and our subsidiary guarantors’ assets, subject to certain exceptions, that secure our cashflow credit facility on a first-priority basis and are secured by second-priority liens, subject to permitted liens, onour and our subsidiary guarantors’ assets that secure our ABL credit facility on a first-priority basis and our othercash flow credit facility on a second-priority basis.
Maturities of long-term debt in years 2015 through 2018, excluding amounts under the ABL credit facility,are $1.065 million, $2.282 billion, $2.028 billion and $2.803 billion, respectively.
NOTE 10 — CONTINGENCIES AND LEGAL CLAIM COSTS
We operate in a highly regulated and litigious industry. As a result, various lawsuits, claims and legal andregulatory proceedings have been and can be expected to be instituted or asserted against us. We are also subjectto claims and suits arising in the ordinary course of business, including claims for personal injuries or wrongfulrestriction of, or interference with, physicians’ staff privileges. In certain of these actions the claimants may seekpunitive damages against us which may not be covered by insurance. The resolution of any such lawsuits, claimsor legal and regulatory proceedings could have a material, adverse effect on our results of operations or financialposition.
Government Investigations, Claims and Litigation
Health care companies are subject to numerous investigations by various governmental agencies. Further,under the federal False Claims Act (“FCA”), private parties have the right to bring qui tam, or “whistleblower,”suits against companies that submit false claims for payments to, or improperly retain overpayments from, thegovernment. Some states have adopted similar state whistleblower and false claims provisions. Certain of our
F-31
HCA HOLDINGS, INC.
NOTES TO CONSOLIDATED FINANCIAL STATEMENTS (Continued)
NOTE 10 — CONTINGENCIES AND LEGAL CLAIM COSTS (continued)
Government Investigations, Claims and Litigation (continued)
individual facilities have received, and from time to time, other facilities may receive, government inquiriesfrom, and may be subject to investigation by, federal and state agencies. Depending on whether the underlyingconduct in these or future inquiries or investigations could be considered systemic, their resolution could have amaterial, adverse effect on our financial position, results of operations and liquidity.
As initially disclosed in 2010, the Civil Division of the Department of Justice (“DOJ”) has contacted theCompany in connection with its nationwide review of whether, in certain cases, hospital charges to the federalgovernment relating to implantable cardio-defibrillators (“ICDs”) met the CMS criteria. In connection with thisnationwide review, the DOJ has indicated that it will be reviewing certain ICD billing and medical records at 95HCA hospitals; the review covers the period from October 2003 to the present. In August 2012, HCA, along withnon-HCA hospitals across the country subject to the DOJ’s review, received from the DOJ a proposed frameworkfor resolving the DOJ’s review of ICDs. The Company is cooperating in the review. The review could potentiallygive rise to claims against the Company under the federal FCA or other statutes, regulations or laws. At this time,we cannot predict what effect, if any, this review or any resulting claims could have on the Company.
In July 2012, the Civil Division of the U.S. Attorney’s Office in Miami requested information on reviewsassessing the medical necessity of interventional cardiology services provided at any Company facility (otherthan peer reviews). The Company is cooperating with the government’s request and has produced medicalrecords associated with particular reviews at eight hospitals, located primarily in Florida. At this time, we cannotpredict what effect, if any, the request or any resulting claims, including any potential claims under the federalFCA, other statutes, regulations or laws, could have on the Company.
Securities Class Action Litigation
On October 28, 2011, a shareholder action, Schuh v. HCA Holdings, Inc. et al., was filed in the UnitedStates District Court for the Middle District of Tennessee seeking monetary relief. The case sought to include asa class all persons who acquired the Company’s stock pursuant or traceable to the Company’s RegistrationStatement issued in connection with the March 9, 2011 initial public offering. The lawsuit asserted a claim underSection 11 of the Securities Act of 1933 against the Company, certain members of the board of directors, andcertain underwriters in the offering. It further asserted a claim under Section 15 of the Securities Act of 1933against the same members of the board of directors. The action alleged various deficiencies in the Company’sdisclosures in the Registration Statement. Subsequently, two additional class action complaints, Kishtah v. HCAHoldings, Inc. et al. and Daniels v. HCA Holdings, Inc. et al., setting forth substantially similar claims againstsubstantially the same defendants were filed in the same federal court on November 16, 2011 and December 12,2011, respectively. All three of the cases were consolidated. On May 3, 2012, the court appointed New EnglandTeamsters & Trucking Industry Pension Fund as Lead Plaintiff for the consolidated action. On July 13, 2012, thelead plaintiff filed an amended complaint asserting claims under Sections 11 and 12(a)(2) of the Securities Act of1933 against the Company, certain members of the board of directors, and certain underwriters in the offering. Itfurther asserts a claim under Section 15 of the Securities Act of 1933 against the same members of the board ofdirectors and Hercules Holdings II, LLC, a majority shareholder of the Company at the time of the initial publicoffering. The consolidated complaint alleges deficiencies in the Company’s disclosures in the RegistrationStatement and Prospectus relating to: (1) the accounting for the Company’s 2006 recapitalization and 2010reorganization; (2) the Company’s failure to maintain effective internal controls relating to its accounting forsuch transactions; and (3) the Company’s Medicare and Medicaid revenue growth rates. The Company and otherdefendants moved to dismiss the amended complaint on September 11, 2012. The Court granted the motion inpart on May 28, 2013. The action is proceeding to discovery on the remaining claims.
F-32
HCA HOLDINGS, INC.
NOTES TO CONSOLIDATED FINANCIAL STATEMENTS (Continued)
NOTE 10 — CONTINGENCIES AND LEGAL CLAIM COSTS (continued)
Securities Class Action Litigation (continued)
In addition to the above described shareholder class actions, on December 8, 2011, a federal shareholderderivative action, Sutton v. Bracken, et al., putatively initiated in the name of the Company, was filed in theUnited States District Court for the Middle District of Tennessee against certain officers and present and formerdirectors of the Company seeking monetary relief. The action alleges breaches of fiduciary duties by the namedofficers and directors in connection with the accounting and earnings claims set forth in the shareholder classactions. Setting forth substantially similar claims against substantially the same defendants, an additional federalderivative action, Schroeder v. Bracken, et al., was filed in the United States District Court for the MiddleDistrict of Tennessee on December 16, 2011, and a state derivative action, Bagot v. Bracken, et al., was filed inTennessee state court in the Davidson County Circuit Court on December 20, 2011. The federal derivativeactions were consolidated in the Middle District of Tennessee and stayed pending developments in theshareholder class actions. The state derivative action had also been stayed pending developments in theshareholder class actions, but that stay has expired. The plaintiff in the state derivative action subsequently filedan amended complaint on September 9, 2013 that added additional allegations made in the shareholder classactions. On September 24, 2013, an additional state derivative action, Steinberg v. Bracken, et al., was filed inTennessee state court in the Davidson County Circuit Court. This action against our board of directors has beenconsolidated with the earlier filed state derivative action. The plaintiffs in the consolidated action filed aconsolidated complaint on December 4, 2013. The Company has filed a motion to again stay the state derivativeaction pending developments in the class action, but the Court has not yet acted on that motion.
Health Midwest Litigation
In October 2009, the Health Care Foundation of Greater Kansas City, a nonprofit health foundation, filedsuit against HCA Inc. in the Circuit Court of Jackson County, Missouri and alleged that HCA did not fund thelevel of capital expenditures and uncompensated care agreed to in connection with HCA’s purchase of hospitalsfrom Health Midwest in 2003. The central issue in the case was whether HCA’s construction of new hospitalscounted towards its $450 million five-year capital commitments. In addition, the plaintiff alleged that HCA didnot make its required capital expenditures in a timely fashion. On January 24, 2013, the Court ruled in favor ofthe plaintiff and awarded at least $162 million. The Court also ordered a court-supervised accounting of HCA’scapital expenditures, as well as of expenditures on charity and uncompensated care during the ten years followingthe purchase. Should the accounting fail to satisfy the Court concerning HCA’s compliance with its capital andcharity care commitments, the amount of the judgment award could substantially increase. The Court alsoindicated it would award plaintiff attorneys fees, which the parties have stipulated are about $12 million. HCArecorded $175 million of legal claim costs in the fourth quarter of 2012 related to this ruling. The accounting forHCA’s capital expenditures and charity and uncompensated care is ongoing and will likely not be concludedbefore the fourth quarter of 2014. HCA plans to appeal the trial court’s ruling on the breach of contract claim andorder for the accounting once the trial court rules on the accounting and enters final judgment.
F-33
HCA HOLDINGS, INC.
NOTES TO CONSOLIDATED FINANCIAL STATEMENTS (Continued)
NOTE 11 — LEASES
We lease medical office buildings and certain equipment under operating lease agreements. Commitmentsrelating to noncancellable operating leases for each of the next five years and thereafter are as follows (dollars inmillions):
For the Year Ended December 31,
2014 . . . . . . . . . . . . . . . . . . . . . . . . . . . . . . . . . . . . . . . . . . . . . . $ 2932015 . . . . . . . . . . . . . . . . . . . . . . . . . . . . . . . . . . . . . . . . . . . . . . 2672016 . . . . . . . . . . . . . . . . . . . . . . . . . . . . . . . . . . . . . . . . . . . . . . 2152017 . . . . . . . . . . . . . . . . . . . . . . . . . . . . . . . . . . . . . . . . . . . . . . 1752018 . . . . . . . . . . . . . . . . . . . . . . . . . . . . . . . . . . . . . . . . . . . . . . 132Thereafter . . . . . . . . . . . . . . . . . . . . . . . . . . . . . . . . . . . . . . . . . . 740
1,822Less sublease income . . . . . . . . . . . . . . . . . . . . . . . . . . . . . . . . . (30)
$1,792
NOTE 12 — CAPITAL STOCK
The amended and restated certificate of incorporation authorizes the Company to issue up to1,800,000,000 shares of common stock, and our amended and restated by-laws set the number of directorsconstituting the board of directors of the Company at not less than three members, the exact number to bedetermined from time to time by resolution adopted by the affirmative vote of a majority of the total number ofdirectors then in office.
During March 2011, we completed the initial public offering of 87,719,300 shares of our common stock at aprice of $30.00 per share and realized net proceeds (after costs of the offering) of $2.506 billion. DuringSeptember 2011, we repurchased 80,771,143 shares of our common stock beneficially owned by affiliates ofBank of America Corporation at a purchase price of $18.61 per share, the closing price of the Company’scommon stock on the New York Stock Exchange on September 14, 2011. The shares repurchased representedapproximately 15.6% of our total shares outstanding at the time of the repurchase. During November 2013, werepurchased 10,656,436 shares of our common stock at a price of $46.92 per share.
Distributions
During 2012, our Board of Directors declared three distributions to the Company’s stockholders and holdersof certain vested share-based awards. The distributions totaled $6.50 per share and vested share-based award(subject to limitations for certain awards), or $3.142 billion in the aggregate. Pursuant to the terms of our share-based award plans, the holders of nonvested stock options and SARs received $6.50 per share reductions to theexercise price of the applicable share-based awards (subject to certain limitations for certain share-based awardsthat resulted in deferred distributions for a portion of the declared distribution, which will be paid upon thevesting of the applicable share-based award). The holders of nonvested RSUs will be paid the applicabledistribution amounts upon the vesting of the applicable RSUs. There were no distributions declared during 2013and 2011.
NOTE 13 — EMPLOYEE BENEFIT PLANS
We maintain contributory, defined contribution benefit plans that are available to employees who meetcertain minimum requirements. Certain of the plans require that we match specified percentages of participant
F-34
HCA HOLDINGS, INC.
NOTES TO CONSOLIDATED FINANCIAL STATEMENTS (Continued)
NOTE 13 — EMPLOYEE BENEFIT PLANS (continued)
contributions up to certain maximum levels (generally, 100% of the first 3% to 9%, depending upon years ofvesting service, of compensation deferred by participants). The cost of these plans totaled $374 million for 2013,$371 million for 2012 and $322 million for 2011. Our contributions are funded periodically during each year.
We maintain the noncontributory, nonqualified Restoration Plan to provide certain retirement benefits foreligible employees. Eligibility for the Restoration Plan is based upon earning eligible compensation in excess ofthe Social Security Wage Base and attaining 1,000 or more hours of service during the plan year. Companycredits to participants’ account balances (the Restoration Plan is not funded) depend upon participants’compensation, years of vesting service and certain IRS limitations related to the HCA 401(k) plan. Benefitsexpense under this plan was $29 million for 2013, $20 million for 2012 and $25 million for 2011. Accruedbenefits liabilities under this plan totaled $137 million at December 31, 2013 and $120 million at December 31,2012.
We maintain a Supplemental Executive Retirement Plan (“SERP”) for certain executives. The plan isdesigned to ensure that upon retirement the participant receives the value of a prescribed life annuity from thecombination of the SERP and our other benefit plans. Benefits expense under the plan was $43 million for 2013,$51 million for 2012 and $33 million for 2011. Accrued benefits liabilities under this plan totaled $214 million atDecember 31, 2013 and $242 million at December 31, 2012.
We maintain defined benefit pension plans which resulted from certain hospital acquisitions in prior years.Benefits expense under these plans was $37 million for 2013, $49 million for 2012, and $39 million for 2011.Accrued benefits liabilities under these plans totaled $81 million at December 31, 2013 and $196 million atDecember 31, 2012.
NOTE 14 — SEGMENT AND GEOGRAPHIC INFORMATION
We operate in one line of business, which is operating hospitals and related health care entities. EffectiveJanuary 1, 2013, we reorganized our operational groups into two geographically organized groups: the Nationaland American Groups. The acquired HealthONE operating results have been included in the American Groupoperating results for periods subsequent to November 1, 2011. Prior to November 1, 2011, the American Grouprecorded its share of the HealthONE operating results in equity in earnings of affiliates.
At December 31, 2013, the National Group included 82 hospitals located in Alaska, California, Florida,southern Georgia, Idaho, Indiana, northern Kentucky, Nevada, New Hampshire, South Carolina, Utah andVirginia, and the American Group included 77 hospitals located in Colorado, northern Georgia, Kansas, southernKentucky, Louisiana, Mississippi, Missouri, Oklahoma, Tennessee and Texas. We also operate six hospitals inEngland, and these facilities are included in the Corporate and other group.
Adjusted segment EBITDA is defined as income before depreciation and amortization, interest expense,losses (gains) on sales of facilities, losses on retirement of debt, legal claim costs, gain on acquisition ofcontrolling interest in equity investment, termination of management agreement, income taxes and net incomeattributable to noncontrolling interests. We use adjusted segment EBITDA as an analytical indicator for purposesof allocating resources to geographic areas and assessing their performance. Adjusted segment EBITDA iscommonly used as an analytical indicator within the health care industry, and also serves as a measure ofleverage capacity and debt service ability. Adjusted segment EBITDA should not be considered as a measure offinancial performance under generally accepted accounting principles, and the items excluded from adjustedsegment EBITDA are significant components in understanding and assessing financial performance. Because
F-35
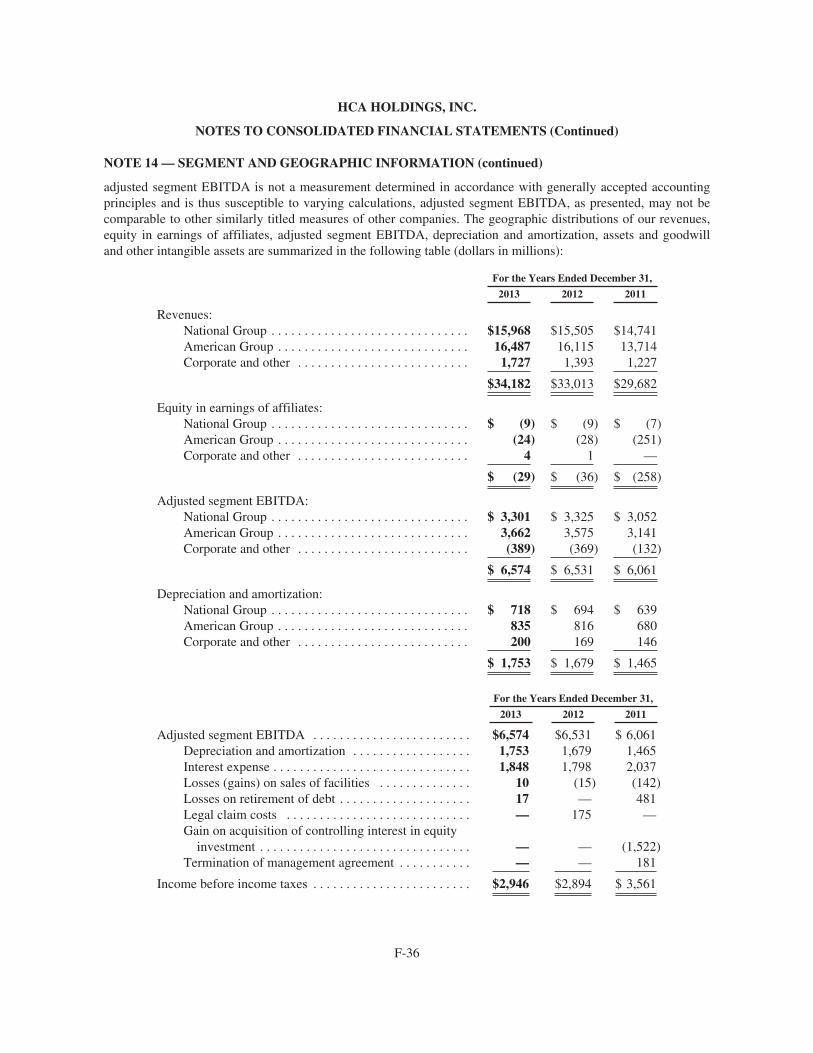
HCA HOLDINGS, INC.
NOTES TO CONSOLIDATED FINANCIAL STATEMENTS (Continued)
NOTE 14 — SEGMENT AND GEOGRAPHIC INFORMATION (continued)
adjusted segment EBITDA is not a measurement determined in accordance with generally accepted accountingprinciples and is thus susceptible to varying calculations, adjusted segment EBITDA, as presented, may not becomparable to other similarly titled measures of other companies. The geographic distributions of our revenues,equity in earnings of affiliates, adjusted segment EBITDA, depreciation and amortization, assets and goodwilland other intangible assets are summarized in the following table (dollars in millions):
For the Years Ended December 31,
2013 2012 2011
Revenues:National Group . . . . . . . . . . . . . . . . . . . . . . . . . . . . . . $15,968 $15,505 $14,741American Group . . . . . . . . . . . . . . . . . . . . . . . . . . . . . 16,487 16,115 13,714Corporate and other . . . . . . . . . . . . . . . . . . . . . . . . . . 1,727 1,393 1,227
$34,182 $33,013 $29,682
Equity in earnings of affiliates:National Group . . . . . . . . . . . . . . . . . . . . . . . . . . . . . . $ (9) $ (9) $ (7)American Group . . . . . . . . . . . . . . . . . . . . . . . . . . . . . (24) (28) (251)Corporate and other . . . . . . . . . . . . . . . . . . . . . . . . . . 4 1 —
$ (29) $ (36) $ (258)
Adjusted segment EBITDA:National Group . . . . . . . . . . . . . . . . . . . . . . . . . . . . . . $ 3,301 $ 3,325 $ 3,052American Group . . . . . . . . . . . . . . . . . . . . . . . . . . . . . 3,662 3,575 3,141Corporate and other . . . . . . . . . . . . . . . . . . . . . . . . . . (389) (369) (132)
$ 6,574 $ 6,531 $ 6,061
Depreciation and amortization:National Group . . . . . . . . . . . . . . . . . . . . . . . . . . . . . . $ 718 $ 694 $ 639American Group . . . . . . . . . . . . . . . . . . . . . . . . . . . . . 835 816 680Corporate and other . . . . . . . . . . . . . . . . . . . . . . . . . . 200 169 146
$ 1,753 $ 1,679 $ 1,465
For the Years Ended December 31,
2013 2012 2011
Adjusted segment EBITDA . . . . . . . . . . . . . . . . . . . . . . . . $6,574 $6,531 $ 6,061Depreciation and amortization . . . . . . . . . . . . . . . . . . 1,753 1,679 1,465Interest expense . . . . . . . . . . . . . . . . . . . . . . . . . . . . . . 1,848 1,798 2,037Losses (gains) on sales of facilities . . . . . . . . . . . . . . 10 (15) (142)Losses on retirement of debt . . . . . . . . . . . . . . . . . . . . 17 — 481Legal claim costs . . . . . . . . . . . . . . . . . . . . . . . . . . . . — 175 —Gain on acquisition of controlling interest in equity
investment . . . . . . . . . . . . . . . . . . . . . . . . . . . . . . . . — — (1,522)Termination of management agreement . . . . . . . . . . . — — 181
Income before income taxes . . . . . . . . . . . . . . . . . . . . . . . . $2,946 $2,894 $ 3,561
F-36
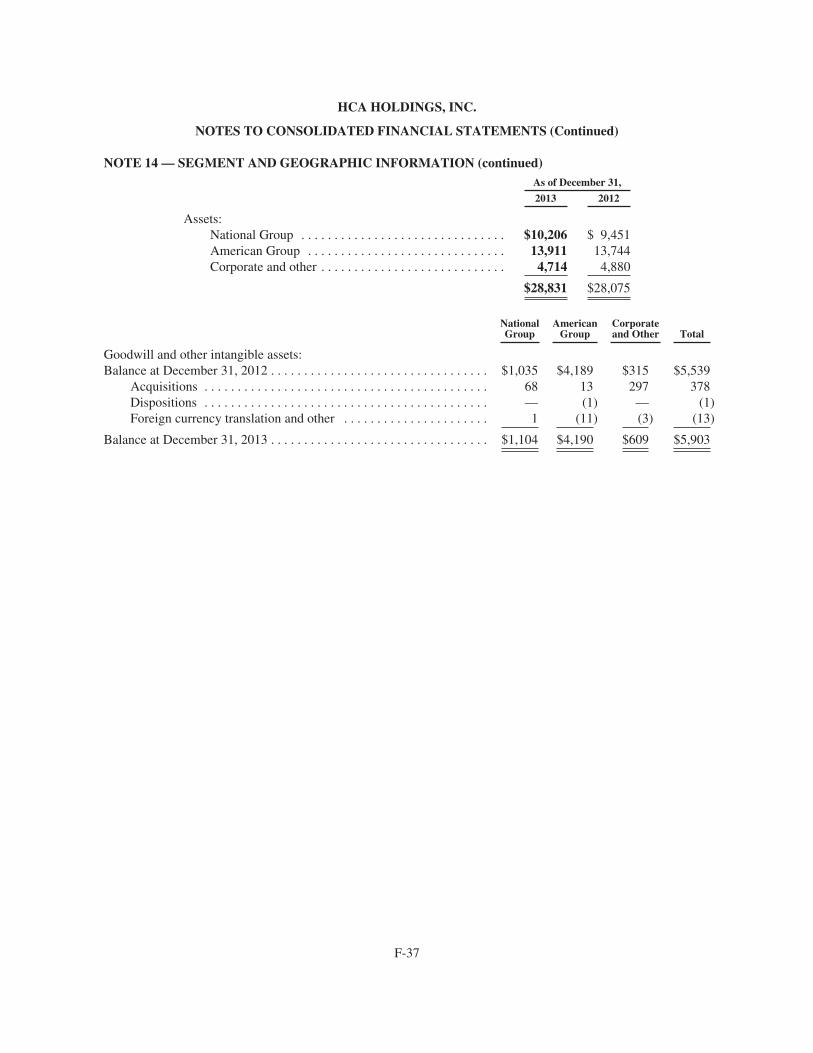
HCA HOLDINGS, INC.
NOTES TO CONSOLIDATED FINANCIAL STATEMENTS (Continued)
NOTE 14 — SEGMENT AND GEOGRAPHIC INFORMATION (continued)As of December 31,
2013 2012
Assets:National Group . . . . . . . . . . . . . . . . . . . . . . . . . . . . . . . $10,206 $ 9,451American Group . . . . . . . . . . . . . . . . . . . . . . . . . . . . . . 13,911 13,744Corporate and other . . . . . . . . . . . . . . . . . . . . . . . . . . . . 4,714 4,880
$28,831 $28,075
NationalGroup
AmericanGroup
Corporateand Other Total
Goodwill and other intangible assets:Balance at December 31, 2012 . . . . . . . . . . . . . . . . . . . . . . . . . . . . . . . . . $1,035 $4,189 $315 $5,539
Acquisitions . . . . . . . . . . . . . . . . . . . . . . . . . . . . . . . . . . . . . . . . . . . 68 13 297 378Dispositions . . . . . . . . . . . . . . . . . . . . . . . . . . . . . . . . . . . . . . . . . . . — (1) — (1)Foreign currency translation and other . . . . . . . . . . . . . . . . . . . . . . 1 (11) (3) (13)
Balance at December 31, 2013 . . . . . . . . . . . . . . . . . . . . . . . . . . . . . . . . . $1,104 $4,190 $609 $5,903
F-37
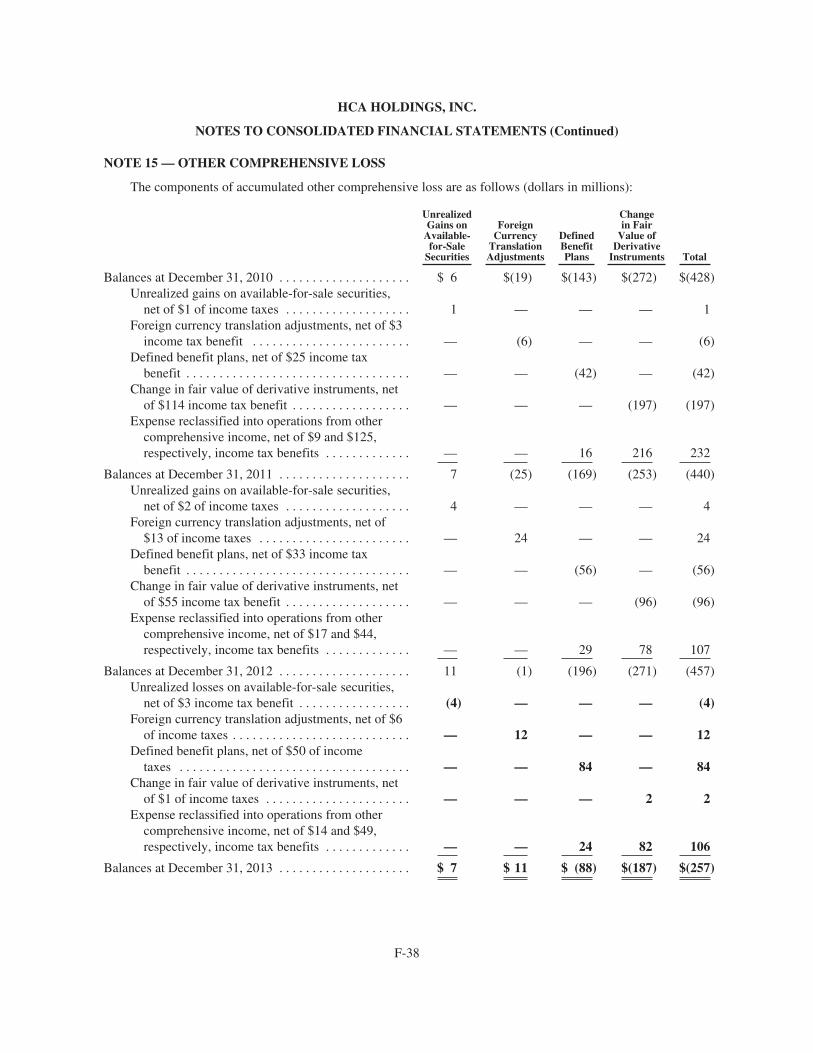
HCA HOLDINGS, INC.
NOTES TO CONSOLIDATED FINANCIAL STATEMENTS (Continued)
NOTE 15 — OTHER COMPREHENSIVE LOSS
The components of accumulated other comprehensive loss are as follows (dollars in millions):
UnrealizedGains on
Available-for-Sale
Securities
ForeignCurrency
TranslationAdjustments
DefinedBenefitPlans
Changein Fair
Value ofDerivative
Instruments Total
Balances at December 31, 2010 . . . . . . . . . . . . . . . . . . . . $ 6 $(19) $(143) $(272) $(428)Unrealized gains on available-for-sale securities,
net of $1 of income taxes . . . . . . . . . . . . . . . . . . . 1 — — — 1Foreign currency translation adjustments, net of $3
income tax benefit . . . . . . . . . . . . . . . . . . . . . . . . — (6) — — (6)Defined benefit plans, net of $25 income tax
benefit . . . . . . . . . . . . . . . . . . . . . . . . . . . . . . . . . . — — (42) — (42)Change in fair value of derivative instruments, net
of $114 income tax benefit . . . . . . . . . . . . . . . . . . — — — (197) (197)Expense reclassified into operations from other
comprehensive income, net of $9 and $125,respectively, income tax benefits . . . . . . . . . . . . . — — 16 216 232
Balances at December 31, 2011 . . . . . . . . . . . . . . . . . . . . 7 (25) (169) (253) (440)Unrealized gains on available-for-sale securities,
net of $2 of income taxes . . . . . . . . . . . . . . . . . . . 4 — — — 4Foreign currency translation adjustments, net of
$13 of income taxes . . . . . . . . . . . . . . . . . . . . . . . — 24 — — 24Defined benefit plans, net of $33 income tax
benefit . . . . . . . . . . . . . . . . . . . . . . . . . . . . . . . . . . — — (56) — (56)Change in fair value of derivative instruments, net
of $55 income tax benefit . . . . . . . . . . . . . . . . . . . — — — (96) (96)Expense reclassified into operations from other
comprehensive income, net of $17 and $44,respectively, income tax benefits . . . . . . . . . . . . . — — 29 78 107
Balances at December 31, 2012 . . . . . . . . . . . . . . . . . . . . 11 (1) (196) (271) (457)Unrealized losses on available-for-sale securities,
net of $3 income tax benefit . . . . . . . . . . . . . . . . . (4) — — — (4)Foreign currency translation adjustments, net of $6
of income taxes . . . . . . . . . . . . . . . . . . . . . . . . . . . — 12 — — 12Defined benefit plans, net of $50 of income
taxes . . . . . . . . . . . . . . . . . . . . . . . . . . . . . . . . . . . — — 84 — 84Change in fair value of derivative instruments, net
of $1 of income taxes . . . . . . . . . . . . . . . . . . . . . . — — — 2 2Expense reclassified into operations from other
comprehensive income, net of $14 and $49,respectively, income tax benefits . . . . . . . . . . . . . — — 24 82 106
Balances at December 31, 2013 . . . . . . . . . . . . . . . . . . . . $ 7 $ 11 $ (88) $(187) $(257)
F-38
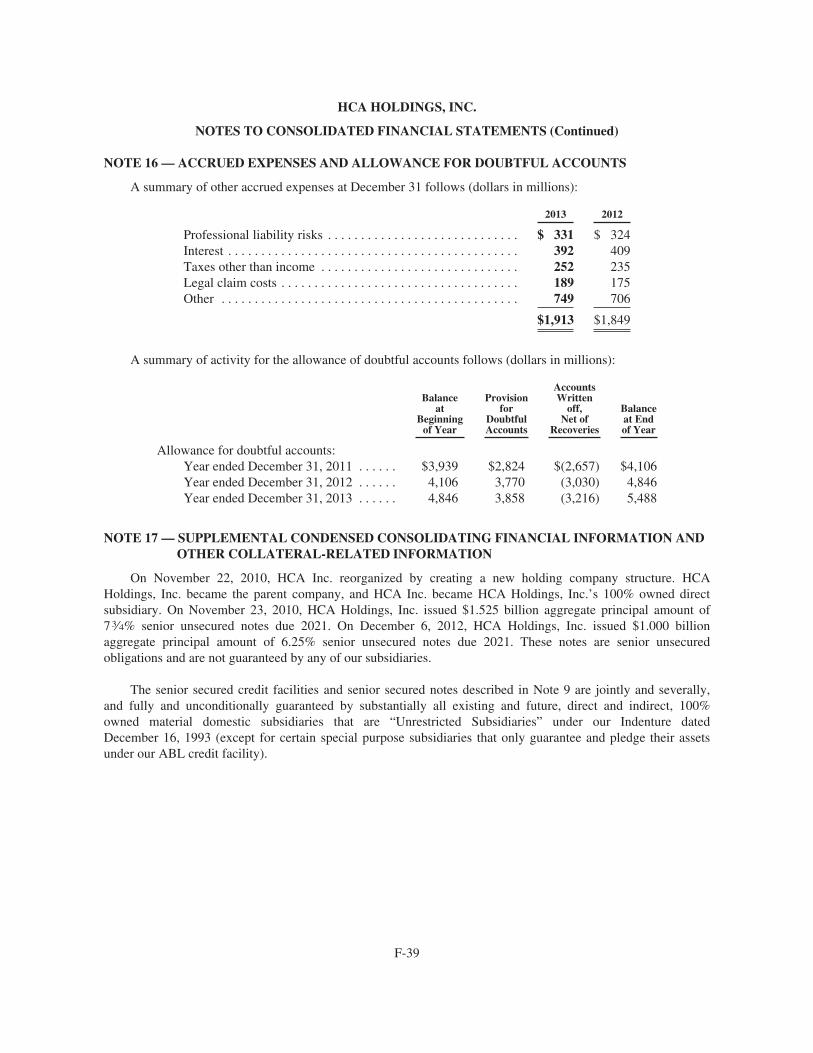
HCA HOLDINGS, INC.
NOTES TO CONSOLIDATED FINANCIAL STATEMENTS (Continued)
NOTE 16 — ACCRUED EXPENSES AND ALLOWANCE FOR DOUBTFUL ACCOUNTS
A summary of other accrued expenses at December 31 follows (dollars in millions):
2013 2012
Professional liability risks . . . . . . . . . . . . . . . . . . . . . . . . . . . . . $ 331 $ 324Interest . . . . . . . . . . . . . . . . . . . . . . . . . . . . . . . . . . . . . . . . . . . . 392 409Taxes other than income . . . . . . . . . . . . . . . . . . . . . . . . . . . . . . 252 235Legal claim costs . . . . . . . . . . . . . . . . . . . . . . . . . . . . . . . . . . . . 189 175Other . . . . . . . . . . . . . . . . . . . . . . . . . . . . . . . . . . . . . . . . . . . . . 749 706
$1,913 $1,849
A summary of activity for the allowance of doubtful accounts follows (dollars in millions):
Balanceat
Beginningof Year
Provisionfor
DoubtfulAccounts
AccountsWritten
off,Net of
Recoveries
Balanceat Endof Year
Allowance for doubtful accounts:Year ended December 31, 2011 . . . . . . $3,939 $2,824 $(2,657) $4,106Year ended December 31, 2012 . . . . . . 4,106 3,770 (3,030) 4,846Year ended December 31, 2013 . . . . . . 4,846 3,858 (3,216) 5,488
NOTE 17 — SUPPLEMENTAL CONDENSED CONSOLIDATING FINANCIAL INFORMATION ANDOTHER COLLATERAL-RELATED INFORMATION
On November 22, 2010, HCA Inc. reorganized by creating a new holding company structure. HCAHoldings, Inc. became the parent company, and HCA Inc. became HCA Holdings, Inc.’s 100% owned directsubsidiary. On November 23, 2010, HCA Holdings, Inc. issued $1.525 billion aggregate principal amount of73⁄4% senior unsecured notes due 2021. On December 6, 2012, HCA Holdings, Inc. issued $1.000 billionaggregate principal amount of 6.25% senior unsecured notes due 2021. These notes are senior unsecuredobligations and are not guaranteed by any of our subsidiaries.
The senior secured credit facilities and senior secured notes described in Note 9 are jointly and severally,and fully and unconditionally guaranteed by substantially all existing and future, direct and indirect, 100%owned material domestic subsidiaries that are “Unrestricted Subsidiaries” under our Indenture datedDecember 16, 1993 (except for certain special purpose subsidiaries that only guarantee and pledge their assetsunder our ABL credit facility).
F-39
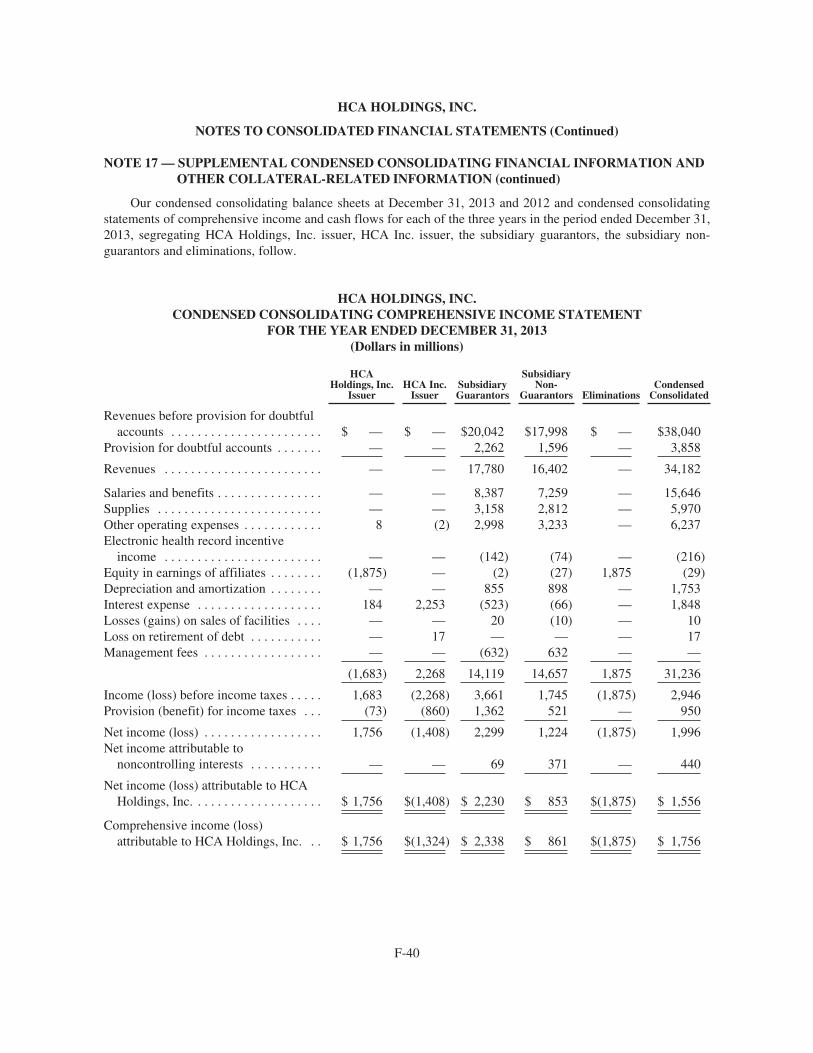
HCA HOLDINGS, INC.
NOTES TO CONSOLIDATED FINANCIAL STATEMENTS (Continued)
NOTE 17 — SUPPLEMENTAL CONDENSED CONSOLIDATING FINANCIAL INFORMATION ANDOTHER COLLATERAL-RELATED INFORMATION (continued)
Our condensed consolidating balance sheets at December 31, 2013 and 2012 and condensed consolidatingstatements of comprehensive income and cash flows for each of the three years in the period ended December 31,2013, segregating HCA Holdings, Inc. issuer, HCA Inc. issuer, the subsidiary guarantors, the subsidiary non-guarantors and eliminations, follow.
HCA HOLDINGS, INC.CONDENSED CONSOLIDATING COMPREHENSIVE INCOME STATEMENT
FOR THE YEAR ENDED DECEMBER 31, 2013(Dollars in millions)
HCAHoldings, Inc.
IssuerHCA Inc.
IssuerSubsidiaryGuarantors
SubsidiaryNon-
Guarantors EliminationsCondensed
Consolidated
Revenues before provision for doubtfulaccounts . . . . . . . . . . . . . . . . . . . . . . . $ — $ — $20,042 $17,998 $ — $38,040
Provision for doubtful accounts . . . . . . . — — 2,262 1,596 — 3,858
Revenues . . . . . . . . . . . . . . . . . . . . . . . . — — 17,780 16,402 — 34,182
Salaries and benefits . . . . . . . . . . . . . . . . — — 8,387 7,259 — 15,646Supplies . . . . . . . . . . . . . . . . . . . . . . . . . — — 3,158 2,812 — 5,970Other operating expenses . . . . . . . . . . . . 8 (2) 2,998 3,233 — 6,237Electronic health record incentive
income . . . . . . . . . . . . . . . . . . . . . . . . — — (142) (74) — (216)Equity in earnings of affiliates . . . . . . . . (1,875) — (2) (27) 1,875 (29)Depreciation and amortization . . . . . . . . — — 855 898 — 1,753Interest expense . . . . . . . . . . . . . . . . . . . 184 2,253 (523) (66) — 1,848Losses (gains) on sales of facilities . . . . — — 20 (10) — 10Loss on retirement of debt . . . . . . . . . . . — 17 — — — 17Management fees . . . . . . . . . . . . . . . . . . — — (632) 632 — —
(1,683) 2,268 14,119 14,657 1,875 31,236
Income (loss) before income taxes . . . . . 1,683 (2,268) 3,661 1,745 (1,875) 2,946Provision (benefit) for income taxes . . . (73) (860) 1,362 521 — 950
Net income (loss) . . . . . . . . . . . . . . . . . . 1,756 (1,408) 2,299 1,224 (1,875) 1,996Net income attributable to
noncontrolling interests . . . . . . . . . . . — — 69 371 — 440
Net income (loss) attributable to HCAHoldings, Inc. . . . . . . . . . . . . . . . . . . . $ 1,756 $(1,408) $ 2,230 $ 853 $(1,875) $ 1,556
Comprehensive income (loss)attributable to HCA Holdings, Inc. . . $ 1,756 $(1,324) $ 2,338 $ 861 $(1,875) $ 1,756
F-40

HCA HOLDINGS, INC.
NOTES TO CONSOLIDATED FINANCIAL STATEMENTS (Continued)
NOTE 17 — SUPPLEMENTAL CONDENSED CONSOLIDATING FINANCIAL INFORMATION ANDOTHER COLLATERAL-RELATED INFORMATION (continued)
HCA HOLDINGS, INC.CONDENSED CONSOLIDATING COMPREHENSIVE INCOME STATEMENT
FOR THE YEAR ENDED DECEMBER 31, 2012(Dollars in millions)
HCAHoldings, Inc.
IssuerHCA Inc.
IssuerSubsidiaryGuarantors
SubsidiaryNon-
Guarantors EliminationsCondensed
Consolidated
Revenues before provision for doubtfulaccounts . . . . . . . . . . . . . . . . . . . . . . . $ — $ — $19,415 $17,368 $ — $36,783
Provision for doubtful accounts . . . . . . . — — 2,144 1,626 — 3,770
Revenues . . . . . . . . . . . . . . . . . . . . . . . . — — 17,271 15,742 — 33,013
Salaries and benefits . . . . . . . . . . . . . . . . — — 7,959 7,130 — 15,089Supplies . . . . . . . . . . . . . . . . . . . . . . . . . — — 2,995 2,722 — 5,717Other operating expenses . . . . . . . . . . . . 3 5 3,013 3,027 — 6,048Electronic health record incentive
income . . . . . . . . . . . . . . . . . . . . . . . . — — (219) (117) — (336)Equity in earnings of affiliates . . . . . . . . (1,668) — (5) (31) 1,668 (36)Depreciation and amortization . . . . . . . . — — 821 858 — 1,679Interest expense . . . . . . . . . . . . . . . . . . . 123 2,167 (468) (24) — 1,798Losses (gains) on sales of facilities . . . . — — 3 (18) — (15)Legal claim costs . . . . . . . . . . . . . . . . . . — 175 — — — 175Management fees . . . . . . . . . . . . . . . . . . — — (569) 569 — —
(1,542) 2,347 13,530 14,116 1,668 30,119
Income (loss) before income taxes . . . . . 1,542 (2,347) 3,741 1,626 (1,668) 2,894Provision (benefit) for income taxes . . . (46) (839) 1,313 460 — 888
Net income (loss) . . . . . . . . . . . . . . . . . . 1,588 (1,508) 2,428 1,166 (1,668) 2,006Net income attributable to
noncontrolling interests . . . . . . . . . . . — — 62 339 — 401
Net income (loss) attributable to HCAHoldings, Inc. . . . . . . . . . . . . . . . . . . . $ 1,588 $(1,508) $ 2,366 $ 827 $(1,668) $ 1,605
Comprehensive income (loss)attributable to HCA Holdings, Inc. . . $ 1,588 $(1,526) $ 2,339 $ 855 $(1,668) $ 1,588
F-41
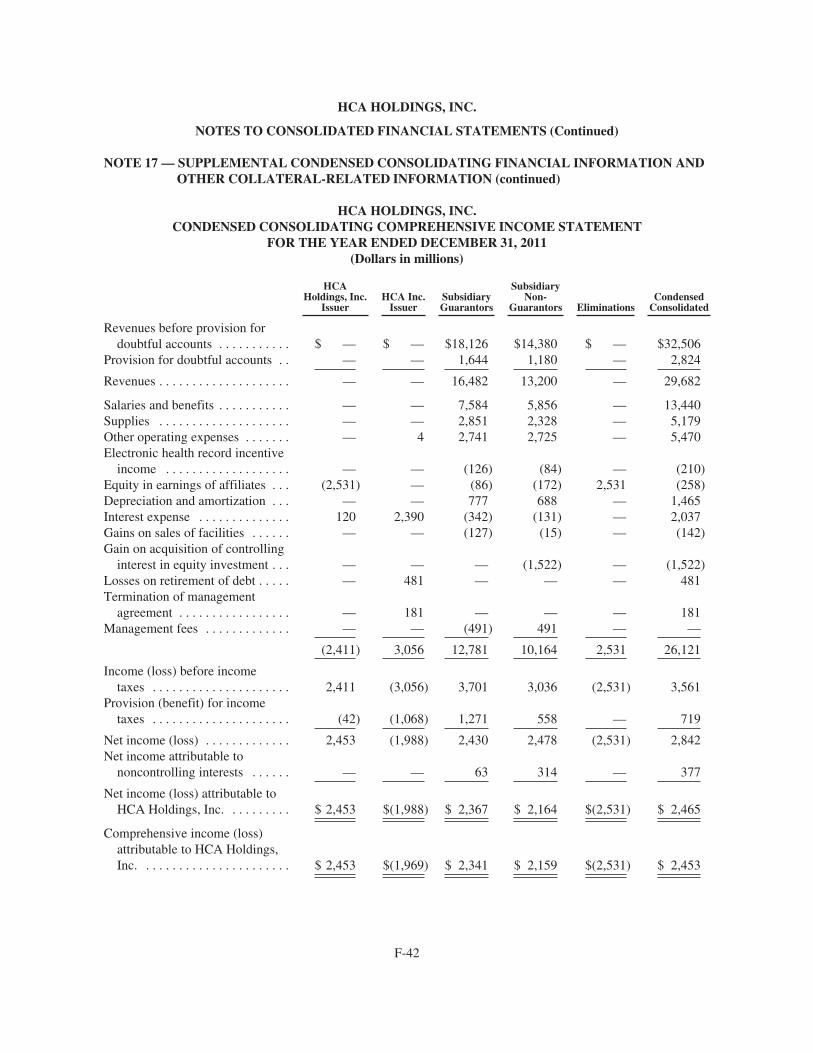
HCA HOLDINGS, INC.
NOTES TO CONSOLIDATED FINANCIAL STATEMENTS (Continued)
NOTE 17 — SUPPLEMENTAL CONDENSED CONSOLIDATING FINANCIAL INFORMATION ANDOTHER COLLATERAL-RELATED INFORMATION (continued)
HCA HOLDINGS, INC.CONDENSED CONSOLIDATING COMPREHENSIVE INCOME STATEMENT
FOR THE YEAR ENDED DECEMBER 31, 2011(Dollars in millions)
HCAHoldings, Inc.
IssuerHCA Inc.
IssuerSubsidiaryGuarantors
SubsidiaryNon-
Guarantors EliminationsCondensed
Consolidated
Revenues before provision fordoubtful accounts . . . . . . . . . . . $ — $ — $18,126 $14,380 $ — $32,506
Provision for doubtful accounts . . — — 1,644 1,180 — 2,824
Revenues . . . . . . . . . . . . . . . . . . . . — — 16,482 13,200 — 29,682
Salaries and benefits . . . . . . . . . . . — — 7,584 5,856 — 13,440Supplies . . . . . . . . . . . . . . . . . . . . — — 2,851 2,328 — 5,179Other operating expenses . . . . . . . — 4 2,741 2,725 — 5,470Electronic health record incentive
income . . . . . . . . . . . . . . . . . . . — — (126) (84) — (210)Equity in earnings of affiliates . . . (2,531) — (86) (172) 2,531 (258)Depreciation and amortization . . . — — 777 688 — 1,465Interest expense . . . . . . . . . . . . . . 120 2,390 (342) (131) — 2,037Gains on sales of facilities . . . . . . — — (127) (15) — (142)Gain on acquisition of controlling
interest in equity investment . . . — — — (1,522) — (1,522)Losses on retirement of debt . . . . . — 481 — — — 481Termination of management
agreement . . . . . . . . . . . . . . . . . — 181 — — — 181Management fees . . . . . . . . . . . . . — — (491) 491 — —
(2,411) 3,056 12,781 10,164 2,531 26,121
Income (loss) before incometaxes . . . . . . . . . . . . . . . . . . . . . 2,411 (3,056) 3,701 3,036 (2,531) 3,561
Provision (benefit) for incometaxes . . . . . . . . . . . . . . . . . . . . . (42) (1,068) 1,271 558 — 719
Net income (loss) . . . . . . . . . . . . . 2,453 (1,988) 2,430 2,478 (2,531) 2,842Net income attributable to
noncontrolling interests . . . . . . — — 63 314 — 377
Net income (loss) attributable toHCA Holdings, Inc. . . . . . . . . . $ 2,453 $(1,988) $ 2,367 $ 2,164 $(2,531) $ 2,465
Comprehensive income (loss)attributable to HCA Holdings,Inc. . . . . . . . . . . . . . . . . . . . . . . $ 2,453 $(1,969) $ 2,341 $ 2,159 $(2,531) $ 2,453
F-42
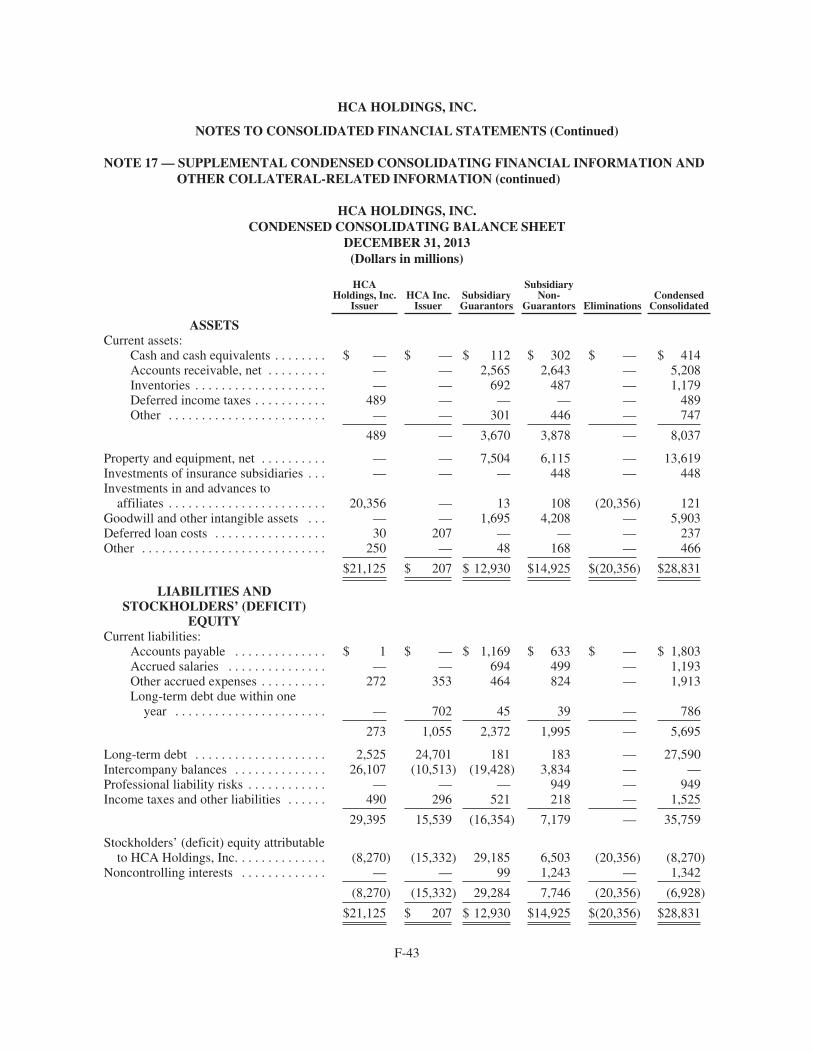
HCA HOLDINGS, INC.
NOTES TO CONSOLIDATED FINANCIAL STATEMENTS (Continued)
NOTE 17 — SUPPLEMENTAL CONDENSED CONSOLIDATING FINANCIAL INFORMATION ANDOTHER COLLATERAL-RELATED INFORMATION (continued)
HCA HOLDINGS, INC.CONDENSED CONSOLIDATING BALANCE SHEET
DECEMBER 31, 2013(Dollars in millions)
HCAHoldings, Inc.
IssuerHCA Inc.
IssuerSubsidiaryGuarantors
SubsidiaryNon-
Guarantors EliminationsCondensed
Consolidated
ASSETSCurrent assets:
Cash and cash equivalents . . . . . . . . $ — $ — $ 112 $ 302 $ — $ 414Accounts receivable, net . . . . . . . . . — — 2,565 2,643 — 5,208Inventories . . . . . . . . . . . . . . . . . . . . — — 692 487 — 1,179Deferred income taxes . . . . . . . . . . . 489 — — — — 489Other . . . . . . . . . . . . . . . . . . . . . . . . — — 301 446 — 747
489 — 3,670 3,878 — 8,037
Property and equipment, net . . . . . . . . . . — — 7,504 6,115 — 13,619Investments of insurance subsidiaries . . . — — — 448 — 448Investments in and advances to
affiliates . . . . . . . . . . . . . . . . . . . . . . . . 20,356 — 13 108 (20,356) 121Goodwill and other intangible assets . . . — — 1,695 4,208 — 5,903Deferred loan costs . . . . . . . . . . . . . . . . . 30 207 — — — 237Other . . . . . . . . . . . . . . . . . . . . . . . . . . . . 250 — 48 168 — 466
$21,125 $ 207 $ 12,930 $14,925 $(20,356) $28,831
LIABILITIES ANDSTOCKHOLDERS’ (DEFICIT)
EQUITYCurrent liabilities:
Accounts payable . . . . . . . . . . . . . . $ 1 $ — $ 1,169 $ 633 $ — $ 1,803Accrued salaries . . . . . . . . . . . . . . . — — 694 499 — 1,193Other accrued expenses . . . . . . . . . . 272 353 464 824 — 1,913Long-term debt due within one
year . . . . . . . . . . . . . . . . . . . . . . . — 702 45 39 — 786
273 1,055 2,372 1,995 — 5,695
Long-term debt . . . . . . . . . . . . . . . . . . . . 2,525 24,701 181 183 — 27,590Intercompany balances . . . . . . . . . . . . . . 26,107 (10,513) (19,428) 3,834 — —Professional liability risks . . . . . . . . . . . . — — — 949 — 949Income taxes and other liabilities . . . . . . 490 296 521 218 — 1,525
29,395 15,539 (16,354) 7,179 — 35,759
Stockholders’ (deficit) equity attributableto HCA Holdings, Inc. . . . . . . . . . . . . . (8,270) (15,332) 29,185 6,503 (20,356) (8,270)
Noncontrolling interests . . . . . . . . . . . . . — — 99 1,243 — 1,342
(8,270) (15,332) 29,284 7,746 (20,356) (6,928)
$21,125 $ 207 $ 12,930 $14,925 $(20,356) $28,831
F-43

HCA HOLDINGS, INC.
NOTES TO CONSOLIDATED FINANCIAL STATEMENTS (Continued)
NOTE 17 — SUPPLEMENTAL CONDENSED CONSOLIDATING FINANCIAL INFORMATION ANDOTHER COLLATERAL-RELATED INFORMATION (continued)
HCA HOLDINGS, INC.CONDENSED CONSOLIDATING BALANCE SHEET
DECEMBER 31, 2012(Dollars in millions)
HCAHoldings, Inc.
IssuerHCA Inc.
IssuerSubsidiaryGuarantors
SubsidiaryNon-
Guarantors EliminationsCondensed
Consolidated
ASSETSCurrent assets:
Cash and cash equivalents . . . . . . . . $ 22 $ — $ 383 $ 300 $ — $ 705Accounts receivable, net . . . . . . . . . — — 2,448 2,224 — 4,672Inventories . . . . . . . . . . . . . . . . . . . . — — 629 457 — 1,086Deferred income taxes . . . . . . . . . . . 385 — — — — 385Other . . . . . . . . . . . . . . . . . . . . . . . . 122 — 342 451 — 915
529 — 3,802 3,432 — 7,763
Property and equipment, net . . . . . . . . . . — — 7,417 5,768 — 13,185Investments of insurance subsidiaries . . . — — — 515 — 515Investments in and advances to
affiliates . . . . . . . . . . . . . . . . . . . . . . . . 18,481 — 16 88 (18,481) 104Goodwill and other intangible assets . . . — — 1,697 3,842 — 5,539Deferred loan costs . . . . . . . . . . . . . . . . . 32 258 — — — 290Other . . . . . . . . . . . . . . . . . . . . . . . . . . . . 469 — 31 179 — 679
$19,511 $ 258 $ 12,963 $13,824 $(18,481) $28,075
LIABILITIES ANDSTOCKHOLDERS’ (DEFICIT)
EQUITYCurrent liabilities:
Accounts payable . . . . . . . . . . . . . . $ — $ — $ 1,203 $ 565 $ — $ 1,768Accrued salaries . . . . . . . . . . . . . . . — — 638 482 — 1,120Other accrued expenses . . . . . . . . . . 30 567 464 788 — 1,849Long-term debt due within one
year . . . . . . . . . . . . . . . . . . . . . . . — 1,360 39 36 — 1,435
30 1,927 2,344 1,871 — 6,172
Long-term debt . . . . . . . . . . . . . . . . . . . . 2,525 24,304 173 493 — 27,495Intercompany balances . . . . . . . . . . . . . . 26,131 (12,407) (17,130) 3,406 — —Professional liability risks . . . . . . . . . . . . — — — 973 — 973Income taxes and other liabilities . . . . . . 485 442 629 220 — 1,776
29,171 14,266 (13,984) 6,963 — 36,416
Stockholders’ (deficit) equity attributableto HCA Holdings, Inc. . . . . . . . . . . . . . (9,660) (14,008) 26,847 5,642 (18,481) (9,660)
Noncontrolling interests . . . . . . . . . . . . . — — 100 1,219 — 1,319
(9,660) (14,008) 26,947 6,861 (18,481) (8,341)
$19,511 $ 258 $ 12,963 $13,824 $(18,481) $28,075
F-44
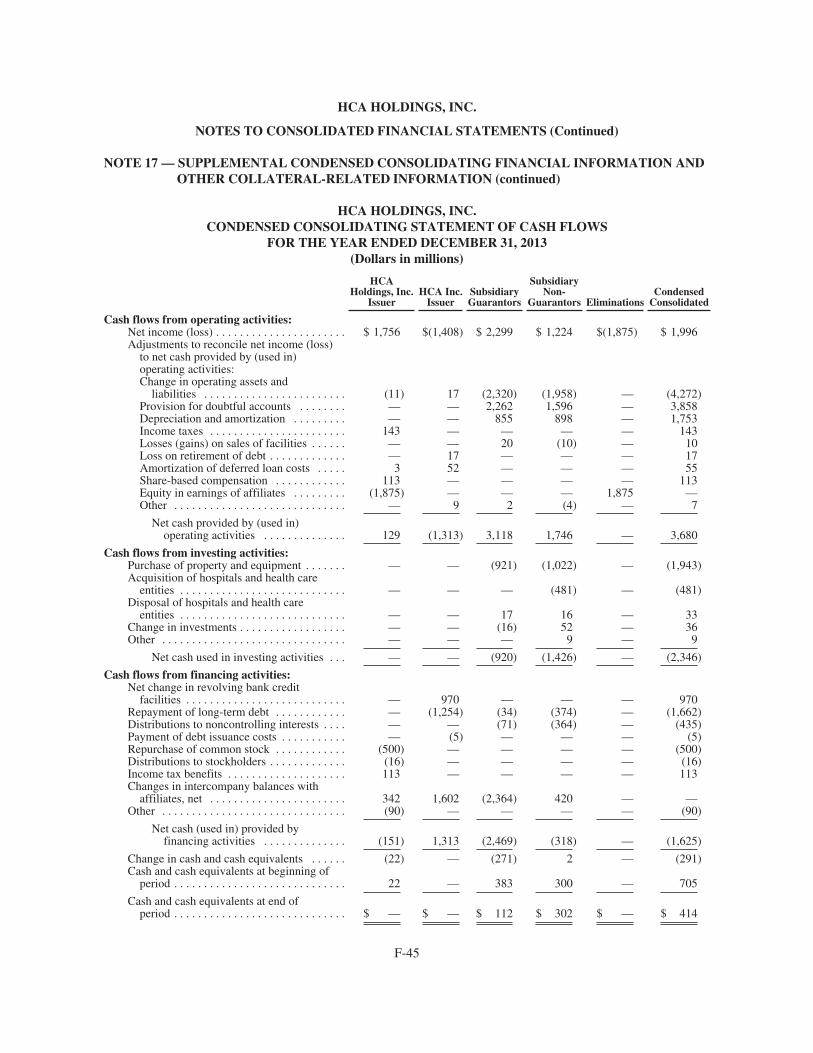
HCA HOLDINGS, INC.
NOTES TO CONSOLIDATED FINANCIAL STATEMENTS (Continued)
NOTE 17 — SUPPLEMENTAL CONDENSED CONSOLIDATING FINANCIAL INFORMATION ANDOTHER COLLATERAL-RELATED INFORMATION (continued)
HCA HOLDINGS, INC.CONDENSED CONSOLIDATING STATEMENT OF CASH FLOWS
FOR THE YEAR ENDED DECEMBER 31, 2013(Dollars in millions)
HCAHoldings, Inc.
IssuerHCA Inc.
IssuerSubsidiaryGuarantors
SubsidiaryNon-
Guarantors EliminationsCondensed
Consolidated
Cash flows from operating activities:Net income (loss) . . . . . . . . . . . . . . . . . . . . . . $ 1,756 $(1,408) $ 2,299 $ 1,224 $(1,875) $ 1,996Adjustments to reconcile net income (loss)
to net cash provided by (used in)operating activities:Change in operating assets and
liabilities . . . . . . . . . . . . . . . . . . . . . . . . (11) 17 (2,320) (1,958) — (4,272)Provision for doubtful accounts . . . . . . . . — — 2,262 1,596 — 3,858Depreciation and amortization . . . . . . . . . — — 855 898 — 1,753Income taxes . . . . . . . . . . . . . . . . . . . . . . . 143 — — — — 143Losses (gains) on sales of facilities . . . . . . — — 20 (10) — 10Loss on retirement of debt . . . . . . . . . . . . . — 17 — — — 17Amortization of deferred loan costs . . . . . 3 52 — — — 55Share-based compensation . . . . . . . . . . . . 113 — — — — 113Equity in earnings of affiliates . . . . . . . . . (1,875) — — — 1,875 —Other . . . . . . . . . . . . . . . . . . . . . . . . . . . . . — 9 2 (4) — 7
Net cash provided by (used in)operating activities . . . . . . . . . . . . . . 129 (1,313) 3,118 1,746 — 3,680
Cash flows from investing activities:Purchase of property and equipment . . . . . . . — — (921) (1,022) — (1,943)Acquisition of hospitals and health care
entities . . . . . . . . . . . . . . . . . . . . . . . . . . . . — — — (481) — (481)Disposal of hospitals and health care
entities . . . . . . . . . . . . . . . . . . . . . . . . . . . . — — 17 16 — 33Change in investments . . . . . . . . . . . . . . . . . . — — (16) 52 — 36Other . . . . . . . . . . . . . . . . . . . . . . . . . . . . . . . — — — 9 — 9
Net cash used in investing activities . . . — — (920) (1,426) — (2,346)
Cash flows from financing activities:Net change in revolving bank credit
facilities . . . . . . . . . . . . . . . . . . . . . . . . . . . — 970 — — — 970Repayment of long-term debt . . . . . . . . . . . . — (1,254) (34) (374) — (1,662)Distributions to noncontrolling interests . . . . — — (71) (364) — (435)Payment of debt issuance costs . . . . . . . . . . . — (5) — — — (5)Repurchase of common stock . . . . . . . . . . . . (500) — — — — (500)Distributions to stockholders . . . . . . . . . . . . . (16) — — — — (16)Income tax benefits . . . . . . . . . . . . . . . . . . . . 113 — — — — 113Changes in intercompany balances with
affiliates, net . . . . . . . . . . . . . . . . . . . . . . . 342 1,602 (2,364) 420 — —Other . . . . . . . . . . . . . . . . . . . . . . . . . . . . . . . (90) — — — — (90)
Net cash (used in) provided byfinancing activities . . . . . . . . . . . . . . (151) 1,313 (2,469) (318) — (1,625)
Change in cash and cash equivalents . . . . . . (22) — (271) 2 — (291)Cash and cash equivalents at beginning of
period . . . . . . . . . . . . . . . . . . . . . . . . . . . . . 22 — 383 300 — 705
Cash and cash equivalents at end ofperiod . . . . . . . . . . . . . . . . . . . . . . . . . . . . . $ — $ — $ 112 $ 302 $ — $ 414
F-45
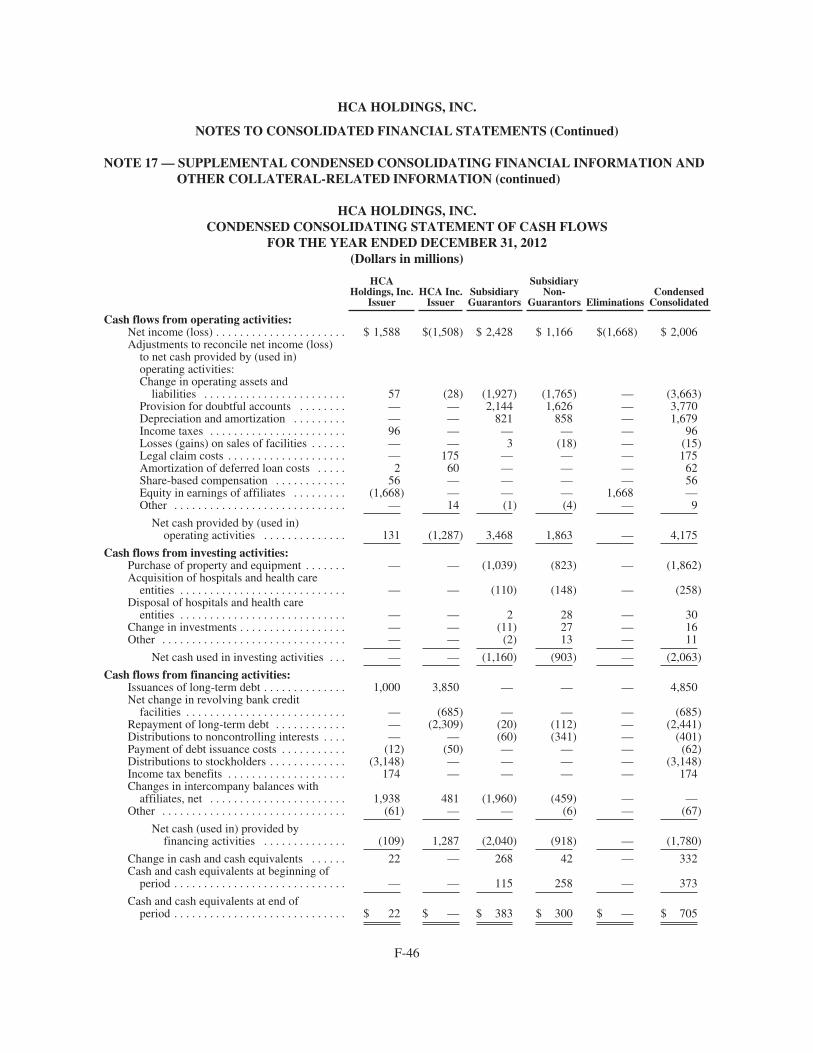
HCA HOLDINGS, INC.
NOTES TO CONSOLIDATED FINANCIAL STATEMENTS (Continued)
NOTE 17 — SUPPLEMENTAL CONDENSED CONSOLIDATING FINANCIAL INFORMATION ANDOTHER COLLATERAL-RELATED INFORMATION (continued)
HCA HOLDINGS, INC.CONDENSED CONSOLIDATING STATEMENT OF CASH FLOWS
FOR THE YEAR ENDED DECEMBER 31, 2012(Dollars in millions)
HCAHoldings, Inc.
IssuerHCA Inc.
IssuerSubsidiaryGuarantors
SubsidiaryNon-
Guarantors EliminationsCondensed
Consolidated
Cash flows from operating activities:Net income (loss) . . . . . . . . . . . . . . . . . . . . . . $ 1,588 $(1,508) $ 2,428 $ 1,166 $(1,668) $ 2,006Adjustments to reconcile net income (loss)
to net cash provided by (used in)operating activities:Change in operating assets and
liabilities . . . . . . . . . . . . . . . . . . . . . . . . 57 (28) (1,927) (1,765) — (3,663)Provision for doubtful accounts . . . . . . . . — — 2,144 1,626 — 3,770Depreciation and amortization . . . . . . . . . — — 821 858 — 1,679Income taxes . . . . . . . . . . . . . . . . . . . . . . . 96 — — — — 96Losses (gains) on sales of facilities . . . . . . — — 3 (18) — (15)Legal claim costs . . . . . . . . . . . . . . . . . . . . — 175 — — — 175Amortization of deferred loan costs . . . . . 2 60 — — — 62Share-based compensation . . . . . . . . . . . . 56 — — — — 56Equity in earnings of affiliates . . . . . . . . . (1,668) — — — 1,668 —Other . . . . . . . . . . . . . . . . . . . . . . . . . . . . . — 14 (1) (4) — 9
Net cash provided by (used in)operating activities . . . . . . . . . . . . . . 131 (1,287) 3,468 1,863 — 4,175
Cash flows from investing activities:Purchase of property and equipment . . . . . . . — — (1,039) (823) — (1,862)Acquisition of hospitals and health care
entities . . . . . . . . . . . . . . . . . . . . . . . . . . . . — — (110) (148) — (258)Disposal of hospitals and health care
entities . . . . . . . . . . . . . . . . . . . . . . . . . . . . — — 2 28 — 30Change in investments . . . . . . . . . . . . . . . . . . — — (11) 27 — 16Other . . . . . . . . . . . . . . . . . . . . . . . . . . . . . . . — — (2) 13 — 11
Net cash used in investing activities . . . — — (1,160) (903) — (2,063)
Cash flows from financing activities:Issuances of long-term debt . . . . . . . . . . . . . . 1,000 3,850 — — — 4,850Net change in revolving bank credit
facilities . . . . . . . . . . . . . . . . . . . . . . . . . . . — (685) — — — (685)Repayment of long-term debt . . . . . . . . . . . . — (2,309) (20) (112) — (2,441)Distributions to noncontrolling interests . . . . — — (60) (341) — (401)Payment of debt issuance costs . . . . . . . . . . . (12) (50) — — — (62)Distributions to stockholders . . . . . . . . . . . . . (3,148) — — — — (3,148)Income tax benefits . . . . . . . . . . . . . . . . . . . . 174 — — — — 174Changes in intercompany balances with
affiliates, net . . . . . . . . . . . . . . . . . . . . . . . 1,938 481 (1,960) (459) — —Other . . . . . . . . . . . . . . . . . . . . . . . . . . . . . . . (61) — — (6) — (67)
Net cash (used in) provided byfinancing activities . . . . . . . . . . . . . . (109) 1,287 (2,040) (918) — (1,780)
Change in cash and cash equivalents . . . . . . 22 — 268 42 — 332Cash and cash equivalents at beginning of
period . . . . . . . . . . . . . . . . . . . . . . . . . . . . . — — 115 258 — 373
Cash and cash equivalents at end ofperiod . . . . . . . . . . . . . . . . . . . . . . . . . . . . . $ 22 $ — $ 383 $ 300 $ — $ 705
F-46
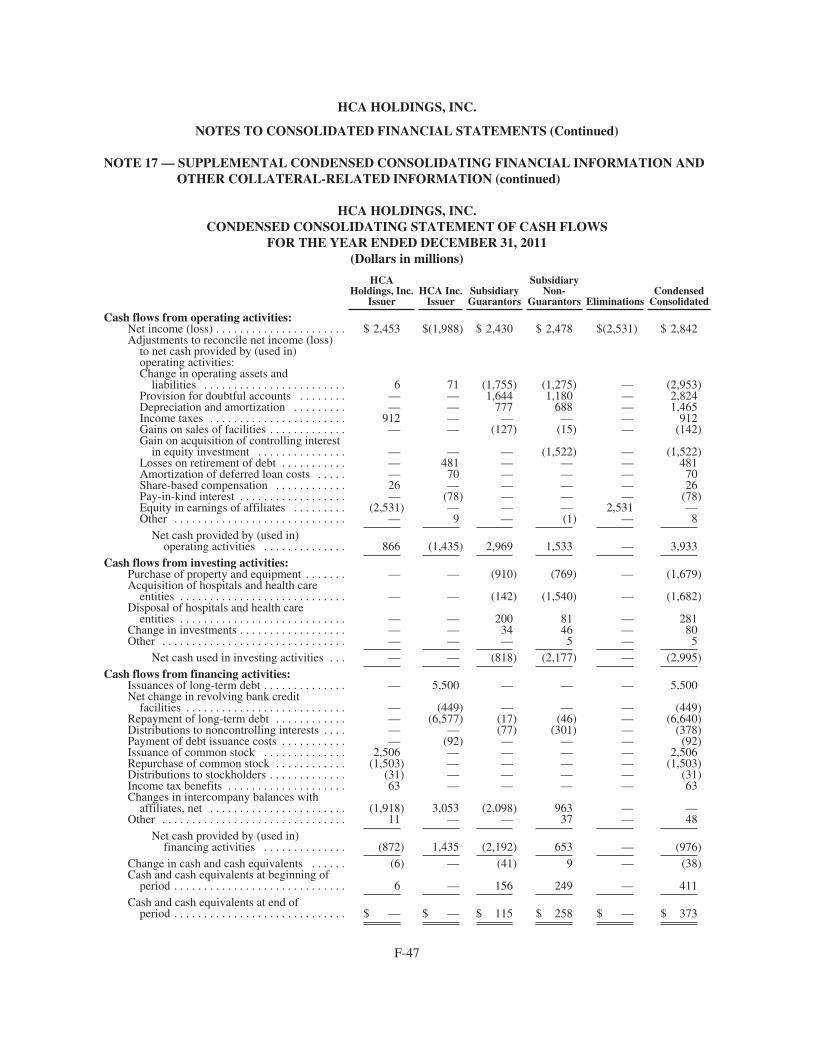
HCA HOLDINGS, INC.
NOTES TO CONSOLIDATED FINANCIAL STATEMENTS (Continued)
NOTE 17 — SUPPLEMENTAL CONDENSED CONSOLIDATING FINANCIAL INFORMATION ANDOTHER COLLATERAL-RELATED INFORMATION (continued)
HCA HOLDINGS, INC.CONDENSED CONSOLIDATING STATEMENT OF CASH FLOWS
FOR THE YEAR ENDED DECEMBER 31, 2011(Dollars in millions)
HCAHoldings, Inc.
IssuerHCA Inc.
IssuerSubsidiaryGuarantors
SubsidiaryNon-
Guarantors EliminationsCondensed
Consolidated
Cash flows from operating activities:Net income (loss) . . . . . . . . . . . . . . . . . . . . . . $ 2,453 $(1,988) $ 2,430 $ 2,478 $(2,531) $ 2,842Adjustments to reconcile net income (loss)
to net cash provided by (used in)operating activities:Change in operating assets and
liabilities . . . . . . . . . . . . . . . . . . . . . . . . 6 71 (1,755) (1,275) — (2,953)Provision for doubtful accounts . . . . . . . . — — 1,644 1,180 — 2,824Depreciation and amortization . . . . . . . . . — — 777 688 — 1,465Income taxes . . . . . . . . . . . . . . . . . . . . . . . 912 — — — — 912Gains on sales of facilities . . . . . . . . . . . . . — — (127) (15) — (142)Gain on acquisition of controlling interest
in equity investment . . . . . . . . . . . . . . . — — — (1,522) — (1,522)Losses on retirement of debt . . . . . . . . . . . — 481 — — — 481Amortization of deferred loan costs . . . . . — 70 — — — 70Share-based compensation . . . . . . . . . . . . 26 — — — — 26Pay-in-kind interest . . . . . . . . . . . . . . . . . . — (78) — — — (78)Equity in earnings of affiliates . . . . . . . . . (2,531) — — — 2,531 —Other . . . . . . . . . . . . . . . . . . . . . . . . . . . . . — 9 — (1) — 8
Net cash provided by (used in)operating activities . . . . . . . . . . . . . . 866 (1,435) 2,969 1,533 — 3,933
Cash flows from investing activities:Purchase of property and equipment . . . . . . . — — (910) (769) — (1,679)Acquisition of hospitals and health care
entities . . . . . . . . . . . . . . . . . . . . . . . . . . . . — — (142) (1,540) — (1,682)Disposal of hospitals and health care
entities . . . . . . . . . . . . . . . . . . . . . . . . . . . . — — 200 81 — 281Change in investments . . . . . . . . . . . . . . . . . . — — 34 46 — 80Other . . . . . . . . . . . . . . . . . . . . . . . . . . . . . . . — — — 5 — 5
Net cash used in investing activities . . . — — (818) (2,177) — (2,995)Cash flows from financing activities:
Issuances of long-term debt . . . . . . . . . . . . . . — 5,500 — — — 5,500Net change in revolving bank credit
facilities . . . . . . . . . . . . . . . . . . . . . . . . . . . — (449) — — — (449)Repayment of long-term debt . . . . . . . . . . . . — (6,577) (17) (46) — (6,640)Distributions to noncontrolling interests . . . . — — (77) (301) — (378)Payment of debt issuance costs . . . . . . . . . . . — (92) — — — (92)Issuance of common stock . . . . . . . . . . . . . . 2,506 — — — — 2,506Repurchase of common stock . . . . . . . . . . . . (1,503) — — — — (1,503)Distributions to stockholders . . . . . . . . . . . . . (31) — — — — (31)Income tax benefits . . . . . . . . . . . . . . . . . . . . 63 — — — — 63Changes in intercompany balances with
affiliates, net . . . . . . . . . . . . . . . . . . . . . . . (1,918) 3,053 (2,098) 963 — —Other . . . . . . . . . . . . . . . . . . . . . . . . . . . . . . . 11 — — 37 — 48
Net cash provided by (used in)financing activities . . . . . . . . . . . . . . (872) 1,435 (2,192) 653 — (976)
Change in cash and cash equivalents . . . . . . (6) — (41) 9 — (38)Cash and cash equivalents at beginning of
period . . . . . . . . . . . . . . . . . . . . . . . . . . . . . 6 — 156 249 — 411Cash and cash equivalents at end of
period . . . . . . . . . . . . . . . . . . . . . . . . . . . . . $ — $ — $ 115 $ 258 $ — $ 373
F-47
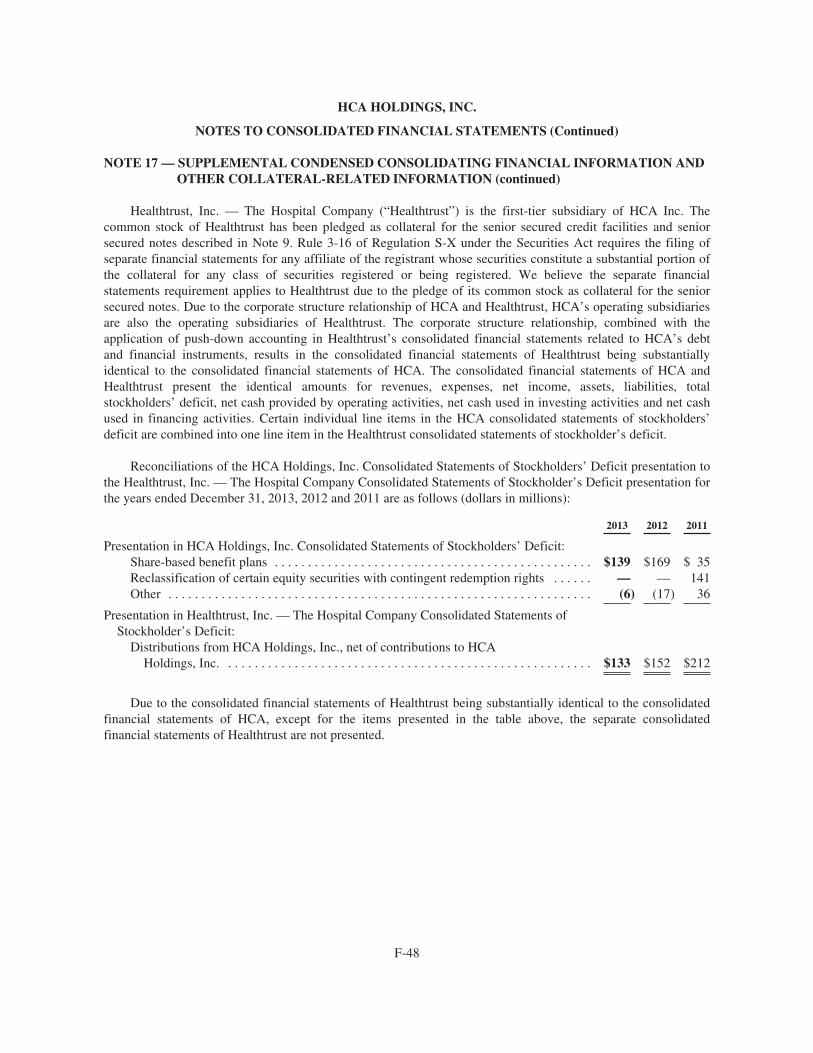
HCA HOLDINGS, INC.
NOTES TO CONSOLIDATED FINANCIAL STATEMENTS (Continued)
NOTE 17 — SUPPLEMENTAL CONDENSED CONSOLIDATING FINANCIAL INFORMATION ANDOTHER COLLATERAL-RELATED INFORMATION (continued)
Healthtrust, Inc. — The Hospital Company (“Healthtrust”) is the first-tier subsidiary of HCA Inc. Thecommon stock of Healthtrust has been pledged as collateral for the senior secured credit facilities and seniorsecured notes described in Note 9. Rule 3-16 of Regulation S-X under the Securities Act requires the filing ofseparate financial statements for any affiliate of the registrant whose securities constitute a substantial portion ofthe collateral for any class of securities registered or being registered. We believe the separate financialstatements requirement applies to Healthtrust due to the pledge of its common stock as collateral for the seniorsecured notes. Due to the corporate structure relationship of HCA and Healthtrust, HCA’s operating subsidiariesare also the operating subsidiaries of Healthtrust. The corporate structure relationship, combined with theapplication of push-down accounting in Healthtrust’s consolidated financial statements related to HCA’s debtand financial instruments, results in the consolidated financial statements of Healthtrust being substantiallyidentical to the consolidated financial statements of HCA. The consolidated financial statements of HCA andHealthtrust present the identical amounts for revenues, expenses, net income, assets, liabilities, totalstockholders’ deficit, net cash provided by operating activities, net cash used in investing activities and net cashused in financing activities. Certain individual line items in the HCA consolidated statements of stockholders’deficit are combined into one line item in the Healthtrust consolidated statements of stockholder’s deficit.
Reconciliations of the HCA Holdings, Inc. Consolidated Statements of Stockholders’ Deficit presentation tothe Healthtrust, Inc. — The Hospital Company Consolidated Statements of Stockholder’s Deficit presentation forthe years ended December 31, 2013, 2012 and 2011 are as follows (dollars in millions):
2013 2012 2011
Presentation in HCA Holdings, Inc. Consolidated Statements of Stockholders’ Deficit:Share-based benefit plans . . . . . . . . . . . . . . . . . . . . . . . . . . . . . . . . . . . . . . . . . . . . . . . . $139 $169 $ 35Reclassification of certain equity securities with contingent redemption rights . . . . . . — — 141Other . . . . . . . . . . . . . . . . . . . . . . . . . . . . . . . . . . . . . . . . . . . . . . . . . . . . . . . . . . . . . . . . (6) (17) 36
Presentation in Healthtrust, Inc. — The Hospital Company Consolidated Statements ofStockholder’s Deficit:
Distributions from HCA Holdings, Inc., net of contributions to HCAHoldings, Inc. . . . . . . . . . . . . . . . . . . . . . . . . . . . . . . . . . . . . . . . . . . . . . . . . . . . . . . . $133 $152 $212
Due to the consolidated financial statements of Healthtrust being substantially identical to the consolidatedfinancial statements of HCA, except for the items presented in the table above, the separate consolidatedfinancial statements of Healthtrust are not presented.
F-48
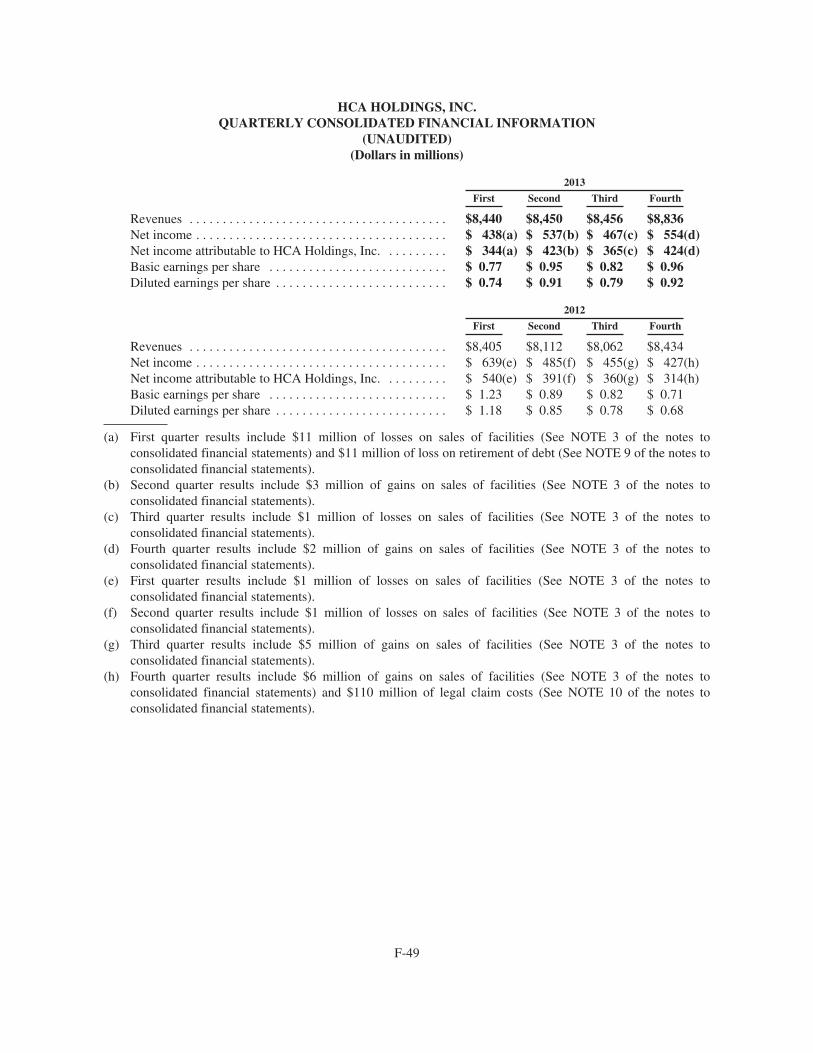
HCA HOLDINGS, INC.QUARTERLY CONSOLIDATED FINANCIAL INFORMATION
(UNAUDITED)(Dollars in millions)
2013
First Second Third Fourth
Revenues . . . . . . . . . . . . . . . . . . . . . . . . . . . . . . . . . . . . . . . $8,440 $8,450 $8,456 $8,836Net income . . . . . . . . . . . . . . . . . . . . . . . . . . . . . . . . . . . . . . $ 438(a) $ 537(b) $ 467(c) $ 554(d)Net income attributable to HCA Holdings, Inc. . . . . . . . . . $ 344(a) $ 423(b) $ 365(c) $ 424(d)Basic earnings per share . . . . . . . . . . . . . . . . . . . . . . . . . . . $ 0.77 $ 0.95 $ 0.82 $ 0.96Diluted earnings per share . . . . . . . . . . . . . . . . . . . . . . . . . . $ 0.74 $ 0.91 $ 0.79 $ 0.92
2012
First Second Third Fourth
Revenues . . . . . . . . . . . . . . . . . . . . . . . . . . . . . . . . . . . . . . . $8,405 $8,112 $8,062 $8,434Net income . . . . . . . . . . . . . . . . . . . . . . . . . . . . . . . . . . . . . . $ 639(e) $ 485(f) $ 455(g) $ 427(h)Net income attributable to HCA Holdings, Inc. . . . . . . . . . $ 540(e) $ 391(f) $ 360(g) $ 314(h)Basic earnings per share . . . . . . . . . . . . . . . . . . . . . . . . . . . $ 1.23 $ 0.89 $ 0.82 $ 0.71Diluted earnings per share . . . . . . . . . . . . . . . . . . . . . . . . . . $ 1.18 $ 0.85 $ 0.78 $ 0.68
(a) First quarter results include $11 million of losses on sales of facilities (See NOTE 3 of the notes toconsolidated financial statements) and $11 million of loss on retirement of debt (See NOTE 9 of the notes toconsolidated financial statements).
(b) Second quarter results include $3 million of gains on sales of facilities (See NOTE 3 of the notes toconsolidated financial statements).
(c) Third quarter results include $1 million of losses on sales of facilities (See NOTE 3 of the notes toconsolidated financial statements).
(d) Fourth quarter results include $2 million of gains on sales of facilities (See NOTE 3 of the notes toconsolidated financial statements).
(e) First quarter results include $1 million of losses on sales of facilities (See NOTE 3 of the notes toconsolidated financial statements).
(f) Second quarter results include $1 million of losses on sales of facilities (See NOTE 3 of the notes toconsolidated financial statements).
(g) Third quarter results include $5 million of gains on sales of facilities (See NOTE 3 of the notes toconsolidated financial statements).
(h) Fourth quarter results include $6 million of gains on sales of facilities (See NOTE 3 of the notes toconsolidated financial statements) and $110 million of legal claim costs (See NOTE 10 of the notes toconsolidated financial statements).
F-49
EXHIBIT 31.1
CERTIFICATIONS
I, R. Milton Johnson, certify that:
1. I have reviewed this annual report on Form 10-K of HCA Holdings, Inc.;
2. Based on my knowledge, this report does not contain any untrue statement of a material fact or omit tostate a material fact necessary to make the statements made, in light of the circumstances under which suchstatements were made, not misleading with respect to the period covered by this report;
3. Based on my knowledge, the financial statements, and other financial information included in this report,fairly present in all material respects the financial condition, results of operations and cash flows of the registrantas of, and for, the periods presented in this report;
4. The registrant’s other certifying officer(s) and I are responsible for establishing and maintainingdisclosure controls and procedures (as defined in Exchange Act Rules 13a-15(e) and 15d-15(e)) and internalcontrol over financial reporting (as defined in Exchange Act Rules 13a-15(f) and 15d-15(f)) for the registrant andhave:
(a) Designed such disclosure controls and procedures, or caused such disclosure controls andprocedures to be designed under our supervision, to ensure that material information relating to theregistrant, including its consolidated subsidiaries, is made known to us by others within those entities,particularly during the period in which this report is being prepared;
(b) Designed such internal control over financial reporting, or caused such internal control overfinancial reporting to be designed under our supervision, to provide reasonable assurance regarding thereliability of financial reporting and the preparation of financial statements for external purposes inaccordance with generally accepted accounting principles;
(c) Evaluated the effectiveness of the registrant’s disclosure controls and procedures and presented inthis report our conclusions about the effectiveness of the disclosure controls and procedures, as of the end ofthe period covered by this report based on such evaluation; and
(d) Disclosed in this report any change in the registrant’s internal control over financial reporting thatoccurred during the registrant’s most recent fiscal quarter (the registrant’s fourth fiscal quarter in the case ofan annual report) that has materially affected, or is reasonably likely to materially affect, the registrant’sinternal control over financial reporting; and
5. The registrant’s other certifying officer(s) and I have disclosed, based on our most recent evaluation ofinternal control over financial reporting, to the registrant’s auditors and the audit and compliance committee ofthe registrant’s board of directors (or persons performing the equivalent functions):
(a) All significant deficiencies and material weaknesses in the design or operation of internal controlover financial reporting which are reasonably likely to adversely affect the registrant’s ability to record,process, summarize and report financial information; and
(b) Any fraud, whether or not material, that involves management or other employees who have asignificant role in the registrant’s internal control over financial reporting.
By: /s/ R. MILTON JOHNSON
R. Milton JohnsonChief Executive Officer and President
Date: February 26, 2014
EXHIBIT 31.2
CERTIFICATIONS
I, William B. Rutherford, certify that:
1. I have reviewed this annual report of Form 10-K of HCA Holdings, Inc.;
2. Based on my knowledge, this report does not contain any untrue statement of a material fact or omit tostate a material fact necessary to make the statements made, in light of the circumstances under which suchstatements were made, not misleading with respect to the period covered by this report;
3. Based on my knowledge, the financial statements, and other financial information included in this report,fairly present in all material respects the financial condition, results of operations and cash flows of the registrantas of, and for, the periods presented in this report;
4. The registrant’s other certifying officer(s) and I are responsible for establishing and maintainingdisclosure controls and procedures (as defined in Exchange Act Rules 13a-15(e) and 15d-15(e)) and internalcontrol over financial reporting (as defined in Exchange Act Rules 13a-15(f) and 15d-15(f)) for the registrant andhave:
(a) Designed such disclosure controls and procedures, or caused such disclosure controls andprocedures to be designed under our supervision, to ensure that material information relating to theregistrant, including its consolidated subsidiaries, is made known to us by others within those entities,particularly during the period in which this report is being prepared;
(b) Designed such internal control over financial reporting, or caused such internal control overfinancial reporting to be designed under our supervision, to provide reasonable assurance regarding thereliability of financial reporting and the preparation of financial statements for external purposes inaccordance with generally accepted accounting principles;
(c) Evaluated the effectiveness of the registrant’s disclosure controls and procedures and presented inthis report our conclusions about the effectiveness of the disclosure controls and procedures, as of the end ofthe period covered by this report based on such evaluation; and
(d) Disclosed in this report any change in the registrant’s internal control over financial reporting thatoccurred during the registrant’s most recent fiscal quarter (the registrant’s fourth fiscal quarter in the case ofan annual report) that has materially affected, or is reasonably likely to materially affect, the registrant’sinternal control over financial reporting; and
5. The registrant’s other certifying officer(s) and I have disclosed, based on our most recent evaluation ofinternal control over financial reporting, to the registrant’s auditors and the audit and compliance committee ofthe registrant’s board of directors (or persons performing the equivalent functions):
(a) All significant deficiencies and material weaknesses in the design or operation of internal controlover financial reporting which are reasonably likely to adversely affect the registrant’s ability to record,process, summarize and report financial information; and
(b) Any fraud, whether or not material, that involves management or other employees who have asignificant role in the registrant’s internal control over financial reporting.
By: /s/ WILLIAM B. RUTHERFORD
William B. RutherfordChief Financial Officer and Executive Vice President
Date: February 26, 2014
EXHIBIT 32
CERTIFICATION PURSUANT TO18 U.S.C. SECTION 1350,
AS ADOPTED PURSUANT TOSECTION 906 OF THE SARBANES-OXLEY ACT OF 2002
In connection with the Annual Report of HCA Holdings, Inc. (the “Company”) on Form 10-K for the yearended December 31, 2013, as filed with the Securities and Exchange Commission on the date hereof (the“Report”), each of the undersigned certifies, pursuant to 18 U.S.C. Section 1350, as adopted pursuant toSection 906 of the Sarbanes-Oxley Act of 2002, that:
(1) The Report fully complies with the requirements of section 13(a) or 15(d) of the Securities ExchangeAct of 1934; and
(2) The information contained in the Report fairly presents, in all material respects, the financial conditionand results of operations of the Company.
By: /s/ R. MILTON JOHNSON
R. Milton JohnsonChief Executive Officer and President
February 26, 2014
By: /s/ WILLIAM B. RUTHERFORD
William B. RutherfordChief Financial Officer and Executive Vice President
February 26, 2014