about our 2009 u.s. containerized import · international trade community, zepol has created this...
TRANSCRIPT

www.zepol.com Page 2
About our 2009 U.S. Containerized Import
Ports Report:
As the most innovative and advanced U.S. trade information provider to the
international trade community, Zepol has created this report of the top 50 U.S. ports for port authorities, steamship lines, 3PLs, importers, and suppliers of the
United States market. This report provides a better understanding of where the
U.S. transportation market has been in 2009 and where it is going in the future.
Not only do we list the top 50 U.S. ports based on TEU, but also their foreign port and carrier partners (by SCAC). In addition, we have listed some of their key
consignees who imported significant TEU quantities according to U.S. Customs.1
There is also a 12 month trend for each port’s TEU volumes. Using U.S. Census data, we have provided a list of the most important products for each port through
the first 11 months of 2009.
All data was retrieved using Zepol’s trade data tools, TradeIQ™ and TradeView™. These products are subscription services for the international trade arena.
Subscribers have access to additional information for each port, carrier, product, and importer at both a transactional and aggregate level.
Data is reported as it is released by government sources. In many cases, multiple
sources will not show data that correlates. Most of these cases are accounted for based on how products arrive in the United States and the manner in which the
U.S. government records the shipment data.
TEUs (Twenty-foot Equivalent Units) are derived from U.S. Customs trade data.
TEUs include all containerized shipments released via U.S. Customs’ Automated Manifest System (AMS), including empties and excluding NVOCC Bill of Lading
records. Values of trade are the total imports for the first 11 months of 2009 and all of 2008 from U.S. Census trade statistics.
The international ports reported are the last foreign ports the shipments left from
before reaching the United States. Key importers are taken from a sampling of some of the top well known companies using the port for imports. Carriers are
based upon the reported Standard Carrier Alpha Code (SCAC) included on shipments.
Zepol hopes that the information in this report will be informative and help your
organization plan for 2010 by fully understanding your market.
1 U.S. Customs allows importers to conceal the identity of their shipments. Thus, not all major importers for ports will be listed. Major companies using this treatment for their shipments include Wal Mart, Home Depot, and Target Corporation.

www.zepol.com Page 3
Summary of Port Review
2009
2009
TEU
2008
TEU
TEU
Change 2009 Value 2008 Value
# of Bills
of Lading #1 - Los Angeles, CA 3,791,071 4,443,987 -14.69% $169,245,899,298 $210,537,839,892 1,751,151
#2 - Long Beach, CA 2,932,514 3,567,627 -17.80% $44,399,190,507 $59,956,631,169 1,321,361
#3 - Seattle, WA (See Report Note) 1,598,069 1,475,757 8.29% $25,626,440,001 $30,212,317,613 627,642
#4 - Newark, NJ 2 1,562,014 1,838,854 -15.06% $98,278,631,499 $127,482,879,523 761,463
#5 - Houston, TX 1,130,941 1,083,606 4.37% $48,518,537,003 $78,985,305,249 295,593
#6 - Savannah, GA 1,096,042 1,238,987 -11.54% $27,718,215,950 $36,347,852,793 384,083
#7 - New York, NY 3 876,386 922,432 -4.99% $15,298,265,465 $18,251,093,472 711,977
#8 - Tacoma, WA (See Report Note) 784,255 1,071,426 -26.80% $19,226,090,709 $27,108,371,089 361,435
#9 - Oakland, CA 755,791 820,821 -7.92% $21,160,784,080 $26,363,443,422 327,510
#10 - Norfolk, VA 720,603 838,572 -14.07% $24,051,716,914 $30,032,508,566 301,875
#11 - Charleston, SC 642,950 910,446 -29.38% $28,684,019,307 $40,114,785,623 295,331
#12 - Miami, FL 488,167 521,442 -6.38% $9,591,992,476 $11,279,841,117 197,217
#13 - Port Everglades, FL 425,252 517,065 -17.76% $6,769,692,458 $10,577,655,034 131,983
#14 - San Juan, PR 372,584 354,422 5.12% $4,787,161,978 $5,373,075,833 135,045
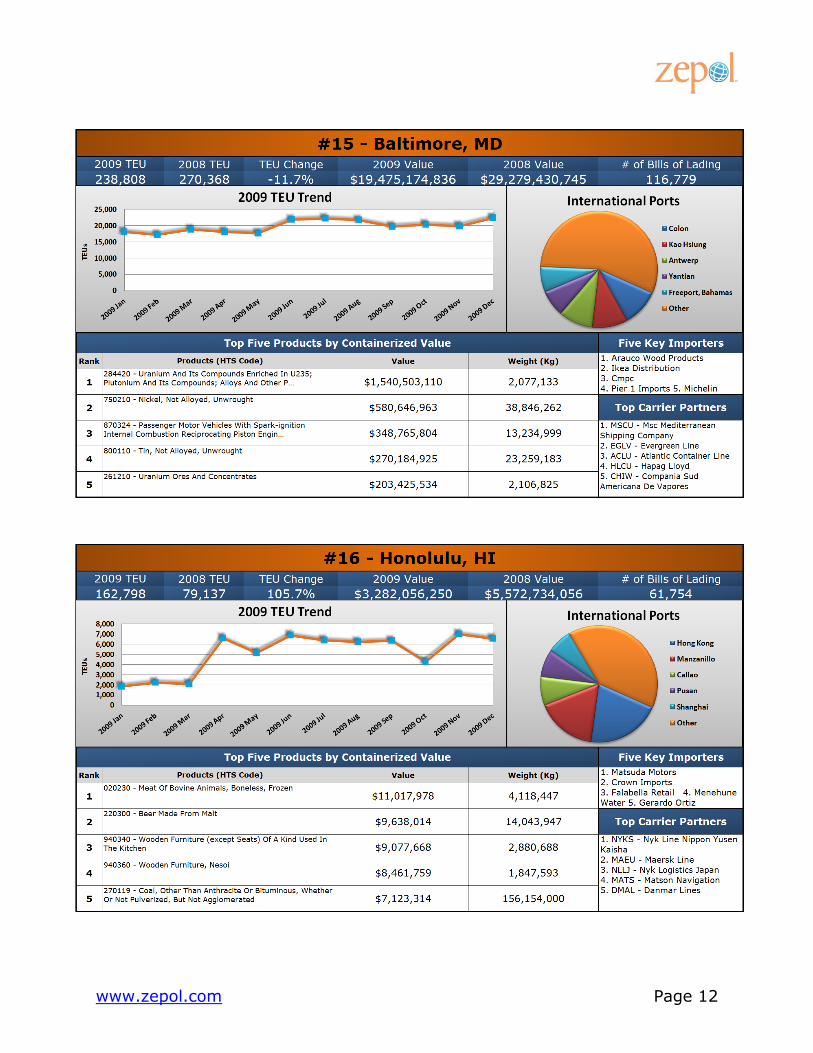
#15 - Baltimore, MD 238,808 270,368 -11.67% $19,475,174,836 $29,279,430,745 116,779
#16 - Honolulu, HI 162,798 79,137 105.72% $3,282,056,250 $5,572,734,056 61,754
#17 - Philadelphia, PA 158,060 213,571 -25.99% $24,478,422,742 $42,605,180,758 80,211
#18 - New Orleans, LA 154,603 158,369 -2.38% $40,086,113,165 $49,557,679,038 35,694
#19 - Wilmington, DE 140,404 145,985 -3.82% $3,635,123,346 $6,663,684,147 13,001
#20 - Jacksonville, FL 128,755 105,755 21.75% $6,520,332,630 $11,835,928,679 32,234
#21 - West Palm Beach, FL 110,322 127,910 -13.75% $447,936,884 $706,465,967 32,090
#22 - Gulfport, MS 104,389 114,646 -8.95% $1,219,719,537 $1,598,778,710 14,408
#23 - Wilmington, NC 101,383 91,408 10.91% $3,769,527,590 $3,418,211,920 41,062
#24 - Portland, OR 97,035 141,550 -31.45% $7,225,080,775 $12,049,127,478 39,031
#25 - Boston, MA 89,988 96,249 -6.50% $6,995,624,135 $9,783,334,766 51,149
#26 - Mobile, AL 57,042 47,485 20.13% $5,414,580,919 $8,827,269,794 14,598
#27 - San Diego, CA 48,132 46,409 3.71% $4,201,131,491 $7,122,132,513 20,022
#28 - Chester, PA 39,816 58,717 -32.19% $5,527,017,177 $9,500,265,810 17,822
#29 - Freeport, TX 36,652 33,178 10.47% $7,567,266,585 $13,830,659,574 6,539
#30 - Tampa, FL 24,807 23,273 6.59% $1,370,192,399 $2,729,212,821 11,789
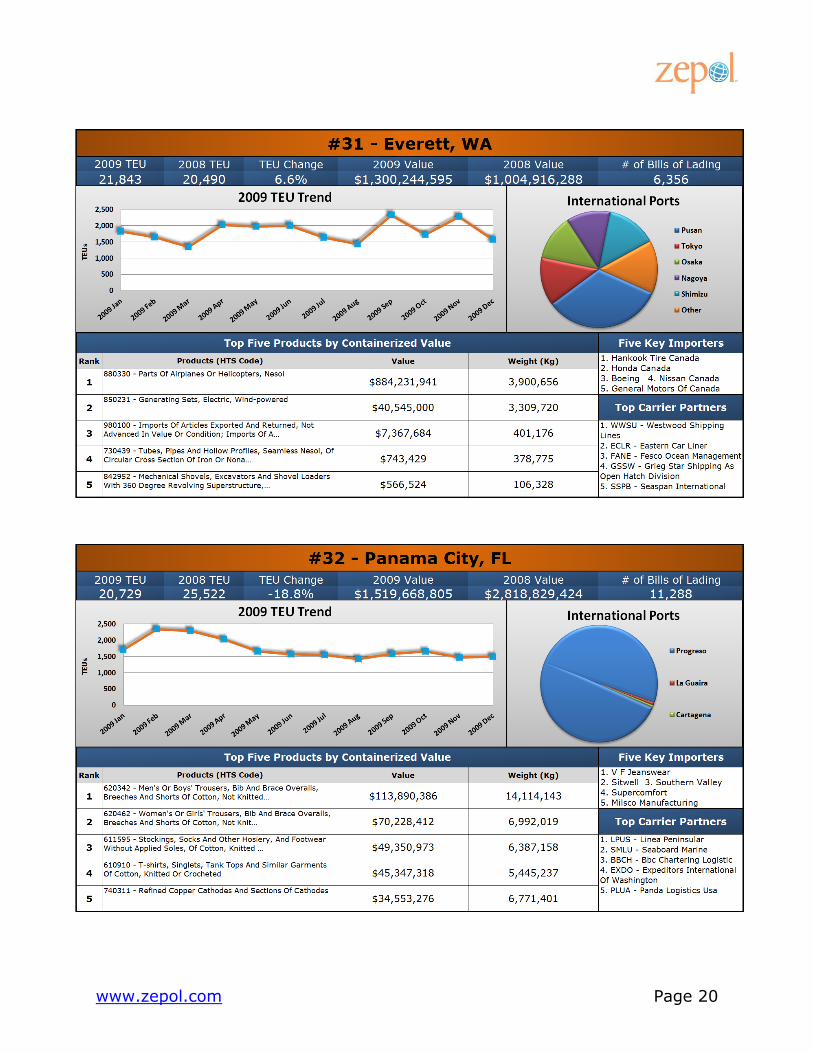
#31 - Everett, WA 21,843 20,490 6.60% $1,300,244,595 $1,004,916,288 6,356
#32 - Panama City, FL 20,729 25,522 -18.78% $1,519,668,805 $2,818,829,424 11,288
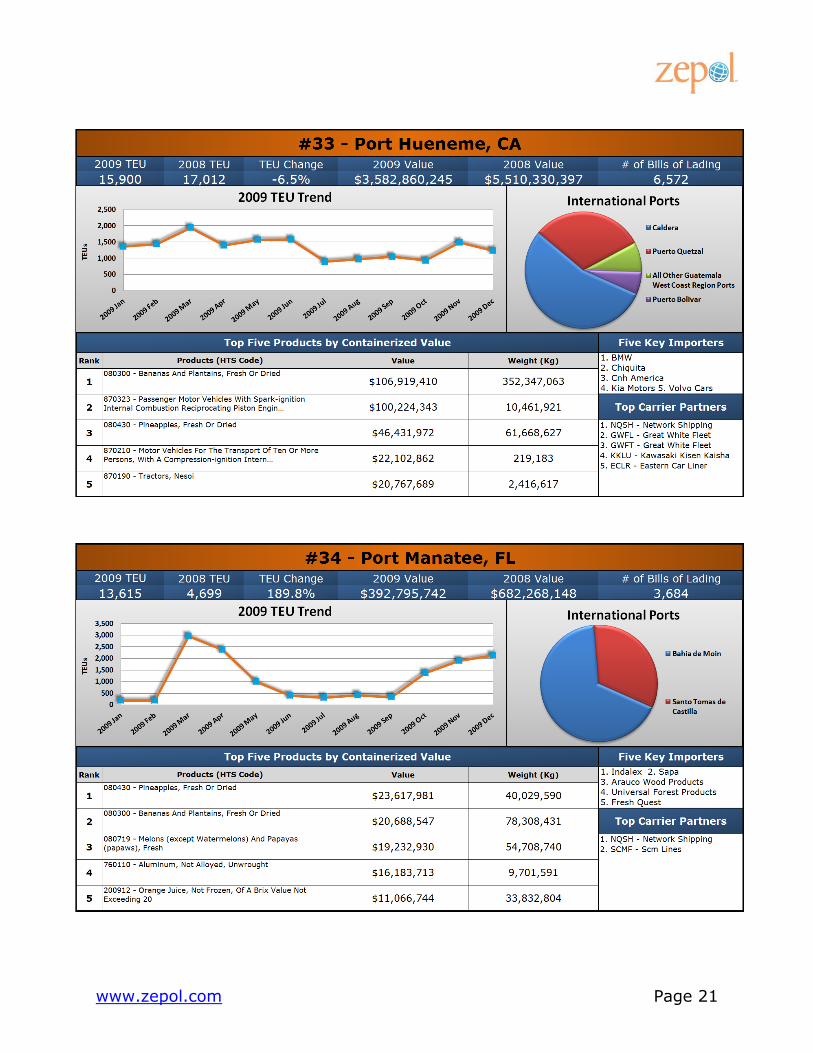
#33 - Port Hueneme, CA 15,900 17,012 -6.54% $3,582,860,245 $5,510,330,397 6,572
#34 - Port Manatee, FL 13,615 4,699 189.76% $392,795,742 $682,268,148 3,684
#35 - Fernandina Beach, FL 11,398 13,450 -15.26% $5,341,668 $21,558,446 421
#36 - Fort Pierce, FL 8,156 6,146 32.72% $5,593,598 $20,845,098 837
#37 - Mayaguez, PR 6,110 10,434 -41.44% $165,563,021 $377,908,066 3,469
#38 - Galveston, TX 6,013 6,070 -0.93% $2,495,010,184 $4,038,705,845 8,233
#39 - Richmond-Petersburg,VA 5,110 23,836 -78.56% $240,403,861 $1,189,713,312 1,815
#40 - Anchorage, AK 3,623 3,345 8.30% $26,860,046,822 $32,135,746,403 1,958
#41 - Lake Charles, LA 2,785 4,051 -31.24% $9,051,136,078 $12,762,478,582 1,871
#42 - Chicago, IL 2,383 1,783 33.64% $78,357,493,392 $92,698,146,118 3,753
#43 - Longview, WA 2,122 973 118.23% $585,296,856 $595,509,920 1,403
#44 - Portsmouth, NH 738 247 198.58% $540,089,818 $834,785,714 525
#45 - Vancouver, WA 736 612 20.13% $1,393,513,903 $1,351,765,684 2,121
#46 - Gramercy, LA 721 961 -24.97% $6,425,274,425 $15,482,342,816 1,238
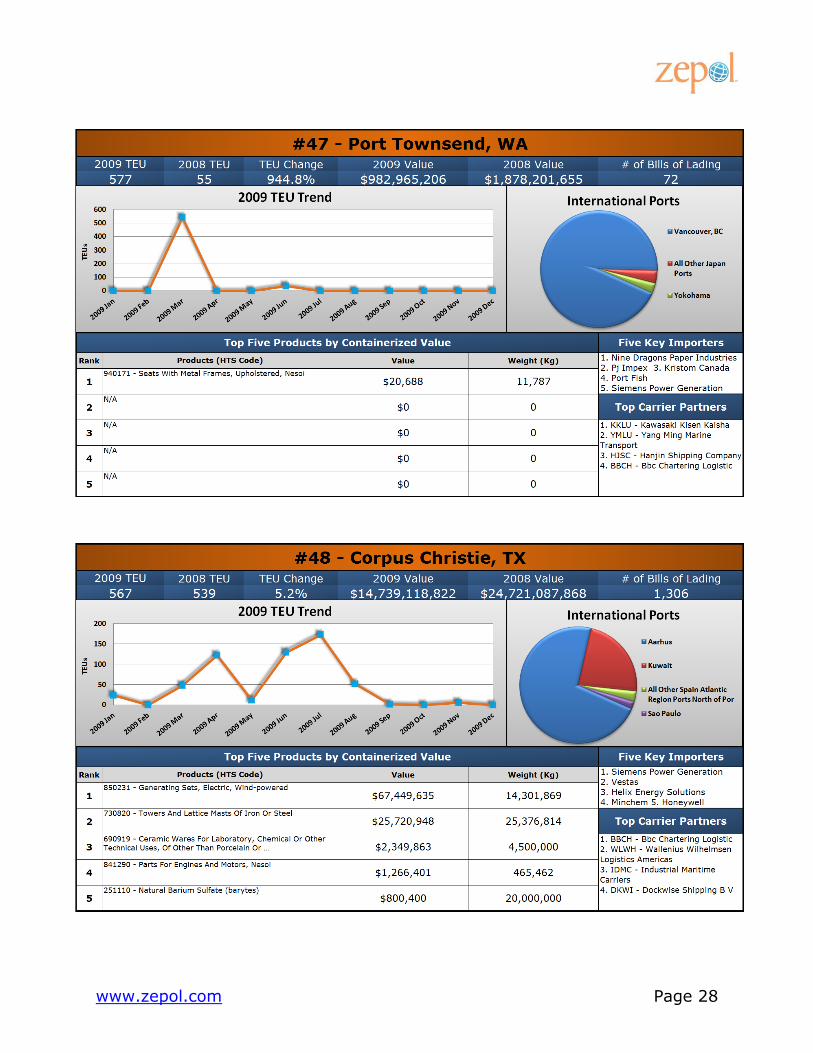
#47 - Port Townsend, WA 577 55 944.80% $982,965,206 $1,878,201,655 72
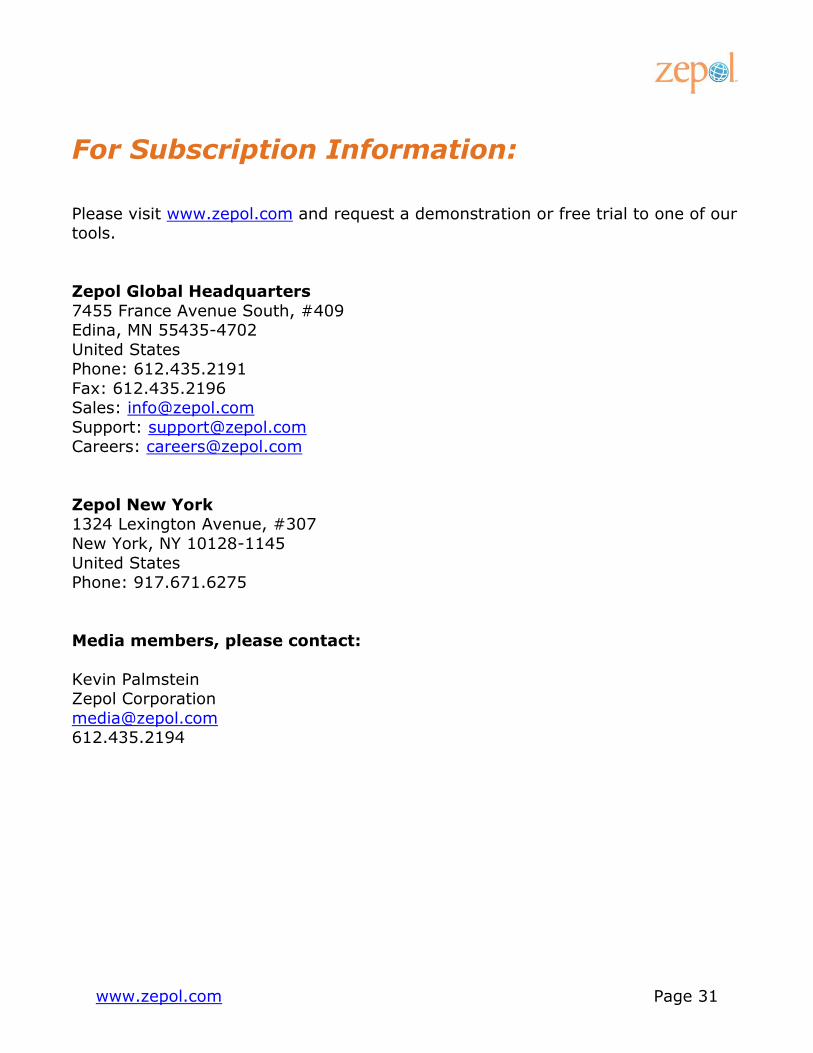
#48 - Corpus Christie, TX 567 539 5.19% $14,739,118,822 $24,721,087,868 1,306
#49 - Beaumont, TX 456 589 -22.58% $9,739,671,037 $18,491,498,719 672
#50 - Newport News, VA 407 12,886 -96.84% $1,751,563,321 $3,443,407,382 1,475
2 Shipments for Newark represent U.S. Port code 1003, commonly grouped with New York U.S. Port Code 1001.
3 Shipments for New York represent U.S. Port code 1001, commonly grouped with Newark U.S. Port Code 1003.

www.zepol.com Page 4
Report Note:
This report is based from data collected from U.S. Customs on a daily basis from
the Automated Manifest System. Because of this collection method, some data will
show imports into a particular port which were actually transshipments.
This is particularly prominent for the ports of Tacoma and Seattle as imports to and exports from Prince Rupert and Vancouver are often recorded as imports for
the United States as part of the collection method. Therefore, the port of entry for some imports reported will in reality be a Canadian port.
This recording method leads to an overstatement of imports for the ports of
Seattle and Tacoma. In addition, some of the consignees and carriers listed will be transporting containers through Canadian ports rather than Seattle and Tacoma.
This data represents the information as it is recorded by U.S. Customs. It does
include TEU quantities from empty containers, may overstate totals from transshipments, and may include other data anomalies.

www.zepol.com Page 5

www.zepol.com Page 6

www.zepol.com Page 7

www.zepol.com Page 8

www.zepol.com Page 9

www.zepol.com Page 10

www.zepol.com Page 11
www.zepol.com Page 12

www.zepol.com Page 13

www.zepol.com Page 14

www.zepol.com Page 15

www.zepol.com Page 16

www.zepol.com Page 17

www.zepol.com Page 18

www.zepol.com Page 19
www.zepol.com Page 20
www.zepol.com Page 21

www.zepol.com Page 22

www.zepol.com Page 23

www.zepol.com Page 24

www.zepol.com Page 25

www.zepol.com Page 26

www.zepol.com Page 27
www.zepol.com Page 28

www.zepol.com Page 29

www.zepol.com Page 30
About Zepol At Zepol, we provide innovative, online trade databases that generate real
competitive advantages for businesses. With our products, TradeIQ™ and TradeView™, subscribers have access to vital trade data, developed entirely from
U.S. government sources that offer insights into:
Competitive activity Potential sales leads
Supplier sourcing
Market trends and analysis Legal and brand protection
Subscribers, in turn, use our databases to create smarter business strategies, new
sales leads, and tactical market advantages.
TradeIQ™ - Subscribers can access millions of U.S. import shipments from over 200 countries, delivered via a user-friendly online database that makes
finding the information you want easy. Analyze import shipments into the United States by searching Bill of Lading data and find the most up-to-date
containerized shipment data easily.
TradeView™ - Using trade data released by the U.S. Census Bureau's Foreign Trade Division, subscribers use the most effective tool for analyzing
U.S. imports and exports. Examine total imports and exports for products,
ports, customs districts, and transportation types by U.S. dollar value, searching all trade activity.
Our company is a privately held corporation based in Minneapolis, Minnesota. Co-
founders Paul Rasmussen and Jeff Wilson launched Zepol in 2002, using their extensive data warehousing, product development, and marketing backgrounds to
bring a new solution to the international trade data industry.
www.zepol.com Page 31
For Subscription Information:
Please visit www.zepol.com and request a demonstration or free trial to one of our tools.
Zepol Global Headquarters
7455 France Avenue South, #409 Edina, MN 55435-4702
United States Phone: 612.435.2191
Fax: 612.435.2196 Sales: [email protected]
Support: [email protected] Careers: [email protected]
Zepol New York 1324 Lexington Avenue, #307
New York, NY 10128-1145
United States Phone: 917.671.6275
Media members, please contact:
Kevin Palmstein Zepol Corporation
[email protected] 612.435.2194