about ijsrpub7)-p175... · about ijsrpub.com international journals of scientific research...
TRANSCRIPT


- A -
About IJSRPUB.com International Journals of Scientific Research Publications is one of the leading international publishers for Open Access journals devoted to various disciplines.
Please refer to our website at http://www.ijsrpub.com for a list all open access journals.
About IJSRK (Peer-reviewed; Open Access)
International Journal of Scientific Research in Knowledge (ISSN: 2322-4541) seeks to promote and disseminate the knowledge by publishing original research findings, review articles and short communications in the broad field of applied sciences.
Scope of the journal includes biology, chemistry, physics, environmental, business and economics, finance, mathematics and statistics, geology, engineering, computer science, social sciences, natural and technological sciences, linguistics, medicine, and architecture.
We Encourage The Authors Look And Possibly Cite Similar Works Recently Published By IJSR Publications. Kindly, You Can Use The Search Menu.
Abstracting / Indexing: ISC; Google Scholar; Global Impact Factor; CrossRef; ProQuest; Electronic Journals Library; JournalSeek; J-Gagte; Georgetown University Library (USA); Biotechnology Institute of UNAM; Research Bible; Get CITED; International Society of Universal Research in Sciences (EyeSource); German National Library of Science and Technology; Directory of Research Journals Indexing;

- B -
Editors
Editors in Chief: Professor Badorul Hisham Abu Bakar School of Civil Engineering, Engineering Campus, University Sains Malaysia, 14300 Nibong Tebal, Penang, Malaysia [email protected], Homepage
Assistant Professor Mohammed J.K. Bashir Department of Environmental Engineering, Faculty of Engineering and Green Technology, Universiti Tunku Abdul Rahman, Malaysia [email protected], Homepage
Assistant Professor Shoukr Qarani Aziz Department of Civil Engineering, College of Engineering, University of Salahaddin–Erbil, Iraq [email protected]
Co-Editor in Chief: Amin Mojiri School of Civil Engineering, Engineering Campus, University Sains Malaysia (USM), 14300 Nibong Tebal, Penang, Malaysia [email protected] or [email protected]
Managing Editor: Assistant Professor Emad Soliman Elmolla PhD in Environmental Engineering, Department of Civil Engineering, Al-Azhar University, Cairo, Egypt [email protected]
Editorial Board Members: Professor Mostafa kamel A.A. Omar Ismaiel PhD in Agronomy, Field Crops Department, National Research Center, Egypt, Cairo , Dokki, El-bohoth st. - post code : 12622 [email protected]
Professor Ali Moghimi PhD in Analytical Chemistry, Department of Chemistry, Varamin (Pishva) Branch, Islamic Azad University Varamin, Iran [email protected]
Professor Faten M. Momen PhD in Acarology, Head of Pests and Plant Protection Department, National Research Center, El-Tahrir St. Dokki, Cairo, Egypt [email protected]

- C -
Professor Syed Tauseef Mohyud-Din PhD in Mathematics, Dean Faculty of Science, Chairman, Department of Mathematics, HITEC University Taxila Cantt Pakistan [email protected]
Professor Osama Mohamed H. Abo-Seida PhD in Mathematics, Head of Mathematics Department, Faculty of Science, Kafr El-Sheikh University, 33516 Kafr El-Sheikh, Egypt [email protected]
Professor Amer A. Taqa PhD in Inorganic Chemistry, Department of Dental Basic Science, College of Dental, Mosul University, Iraq [email protected]
Professor Virupaxi Bagodi PhD in Industrial Engineering & Management, Head, Department of Mechanical Engineering, Government Engineering College, HAVERI - 581110, India [email protected]
Associate Professor Noor Mohammad PhD in Environmental Law, Faculty of Law, University Kebangsaan Malaysia (UKM), 43600 The National University of Malaysia, Bangi, Selangor Darul Ehsan, Malaysia [email protected]
Associate Professor Makarand Upadhyaya PhD in Marketing Management, Chairman of Department of Marketing, College of Business Administration, Jazan University, Saudi Arabia [email protected]
Associate Professor Helena Maria Sabo PhD in Geography, UBB Cluj, Faculty of Psychology and Science of Education, Department of Sciences, Romania [email protected]
Associate Professor Rajat Gera PhD in Management, Asia Pacific Institute of Management, 3&4, Institutional Area, Jasola, New Delhi -110025, India [email protected]
Associate Professor Oyedele Kayode Festus PhD in Geoscience, Department of Geosciences, University of Lagos, Nigeria [email protected]
Associate Professor K.V Arun PhD in Fracture Mechanics and Surface Engineering, Department of Mechanical Engineering, Goavernment Engineering College, Haveri – 581110 Karnataka, India [email protected]
Assistant Professor Maryam Asghari PhD in Environmental Economics, Shahid Ashrafi Esfahani University, Sepahanshahr, Isfahan, Iran [email protected]

- D -
Assistant Professor Chakresh Kumar Electronics & Communication Engineering Department, Tezpur Central University, Assam, India [email protected]
Assistant Professor Younos Vakilalroaia PhD in Management, Chairman, Department of Management, Semnan Branch, Islamic Azad University, Semnan, Iran [email protected]
Assistatnt Professor Said Jaouadi PhD in Economics, College of Business and Administration, Jazan University, Saudi Arabia Kingdom [email protected]
Assistant Professor Dharani K. Ajithdoss PhD in Virology, Department of Veterinary Pathobiology, College of Veterinary Medicine and Biomedical Sciences, Texas A&M University, US [email protected]
Assistant Professor Fadhil Ismail Sharrad PhD in Nuclear Physics, Physics Department, Science College, Kerbala University, Iraq [email protected]
Assistant Professor Faisal Talib PhD in Mechanical Engineering, Mechanical Engineering Section, University Polytechnic, Faculty of Engineering and Technology, Aligarh Muslim University, Aligarh, India [email protected]
Assistant Professor Samir Rabie El Sayed Abo-Hegazy PhD in Plant Breeding, Agronomy Department, Agriculture Faculty, Cairo University, Egypt [email protected]
Assistant Professor Salwa Sh. Abdul-Wahid Al-kinani PhD in Community Medicine, Academic of Epidemiology and Community medicine, College of Medicine, Diyala University, Iraq [email protected]
Assistant Professor Sanjay Sanatan Ghosh PhD in Physics, Department of Physics, North Maharashtra University, Jalgaon-425001, India [email protected]
Assistant Professor Divya Rana PhD in Agribusiness, Department of Business Administration, King Abdulaziz University, Ministry of Higher Education, Jeddah-21589, Kingdom of Saudi Arabia [email protected]
Assistant Professor Pouya Derakhshan Barjoei PhD in Telecommunication systems, Head of Electrical and Electronic Department, Islamic Azad University, Naein Branch, Naein, Iran [email protected]

- E -
Senior Lecturer Dr. Norrozila Sulaiman PhD in Communication Networks, Faculty of Computer Systems and Software Engineering, University Malaysia Pahang, 26300 Gambang, Kuantan, Pahang, Malaysia [email protected]
Senior Lecturer Dr. Ruwan Duminda Jayasinghe
Senior Lecturer and Consultant Oral Surgeon, Dept. of Oral Medicine and Periodontology, Faculty of Dental Sciences, University of Peradeniya, Peradeniya, Sri Lanka [email protected]
Dr. Moinuddin Sarker PhD in Chemistry, Vice President (VP) of Research and Development (R & D), Head of Science Team (VP and CTO), 1376 Chopsey Hill Road, Bridgeport, CT-06606, USA [email protected]
Dr. James H. Haido PhD in Structure Engineering, Faculty of Engineering and Applied Sciences, University of Duhok, Duhok, Iraq [email protected]
Dr. Petr Slama PhD in General Animal Production, Department of Animal Morphology, Physiology and Genetics, Mendel University in Brno, Zemedelska 1.61300 Brno, Czech Republic [email protected]
Dr. Wael A.Y. Salah PhD in Electrical and Electronic Engineering, Faculty of Engineering, Multimedia University, Selangor, Malaysia [email protected]
Dr. Guldem Kaplan PhD in Geological Engineering, Yüzüncü Yıl University, Faculty of Architecture and Engineering, Department of Geological Engineering, Van/Turkey [email protected]
Dr. Vikram Singh PhD in Biochemistry, Division of Crop Science, Central Research Institue of Dryland Agriculture, Hyderabad, Andhra Pradesh, India [email protected]
Dr. Ahmed A. Ahmed Afifi PhD in Soil Science, Department of Soils and Water Use, National Research Centre, Dokki, Giza, Egypt [email protected]
Dr. Eşi Marius Costel PhD in Business administration; Stefan cel Mare University Suceava, Str. Ştefan Tomşa, Nr. 8, Bl.C5, Sc. A, Ap. 20, zip code 720046, Suceava, Suceava county, Romania [email protected]
Dr. Mohd Amin Mir PhD in Chemistry, R & D Division Uttaranchal College of Science and Technology, Dehradun, India [email protected]

- F -
Dr. Ravikiran Donthu PhD in Cattle Genomics & Bioinformatics (Animal Sciences), High performance biological computing (HPCbio), Roy J. Carver Biotechnology Center, University of Illinois, US [email protected]
NB: Editor and editorial board members do not receive any remuneration. These positions are voluntary

- G -
How to submit your manuscripts (Quick Guide) To submit your article you must logged in to the site, and then submit a ticket via "communication center" using your article's title as "ticket title".
You may add one description, and many additional notes and files (to attach cover letter, full text, figures, etc.) with your ticket.
How to submit a ticket: 1) Login to the site (if you have no account yet, please register first) 2) Click on "communication center" link, under "user menu" 3) Click on the link "Submit new ticket", to view ticket submission form 4) Select appropriate department and fill other blanks. 5) Finally, click on "Submit" button to send your ticket. 6) Communication center will send our appropriate representative an automatic email message including your ticket information, and another copy of the same information to your email address at the same time. 7) Communication center will permanently save your ticket(s) and related future updates.
How will you informed me once my ticket is answered/updated? You will be informed of any update and answer made by representatives on your submitted ticket via an automatic email message. Therefore, there is no need to check your ticket on communication center consecutively. You should only check your own email inbox. Moreover, if you found any message sent from “[email protected]” then you should go to communication center for more details.
How to view details of my tickets (including updates, answers, descriptions, etc.):
1) Login to the site ijsrpub.com 2) Click on "community center" link, under "user menu" 3) Click on "View submitted tickets" to view all of your previously submitted tickets 4) Click on the ticket, which you want to view its details.
How can I update my previously submitted tickets? 1) Login to the site ijsrpub.com 2) Click on "community center" link, under "user menu" 3) Click on "View submitted tickets" to view all of your previously submitted tickets 4) Click on ticket you want update. 5) Enter additional notes; you may also attach a file if you wish to. 6) Press save button
If you want to attach more files or more descriptions through your ticket, you may freely update your ticket(s) by sending descriptions and files repeatedly. Important: please, do not submit more than one ticket for the same manuscript this will postpone the revision process. Except, when you want to submit another manuscript (obviously with another subject). Please do not hesitate to contact support, if you have any question or concern. View full version of this help here: http://ijsrpub.com/help-n-support/tutorials/43-how-to-submit-your-articles-full-help.

- H -
Instructions for Authors Article Types
Three types of manuscripts may be submitted: Regular articles: These should describe new and carefully confirmed findings, and experimental procedures should be given in sufficient detail for others to verify the work. The length of a full paper should be the minimum required to describe and interpret the work clearly. Short Communications: A Short Communication is suitable for recording the results of complete small investigations or giving details of new models or hypotheses, gene isolation and identification, innovative methods, techniques or apparatus. The style of main sections need not conform to that of full-length papers. Short communications are 2 to 4 printed pages (about 6 to 12 manuscript pages) in length. Mini review: Submissions of mini-reviews and perspectives covering topics of current interest are welcome and encouraged. Mini-reviews should be concise and no longer than 4-6 printed pages (about 12 to 18 manuscript pages). Mini-reviews are also peer-reviewed. Review Process
All manuscripts are reviewed by an editor and members of the Editorial Board or qualified outside reviewers. Decisions will be made as rapidly as possible, and the journal strives to return reviewers’ comments to authors within 4 weeks. The editorial board will re-review manuscripts that are accepted pending revision. Regular articles
All portions of the manuscript must be typed no columns and all pages numbered starting from the title page. The Title should be a brief phrase describing the contents of the paper. The Title Page should include the authors' full names and affiliations, the name of the corresponding author along with phone, fax and E-mail information. Present addresses of authors should appear as a footnote. The Abstract should be informative and completely self-explanatory, briefly present the topic, state the scope of the experiments, indicate significant data, and point out major findings and conclusions. The Abstract should be 150 to 250 words in length. Complete sentences, active verbs, and the third person should be used, and the abstract should be written in the past tense. Standard nomenclature should be used and abbreviations should be avoided. No literature should be cited. Following the abstract, about 3 to 10 key words that will provide indexing references to should be listed. A list of non-standard Abbreviations should be added. In general, non-standard abbreviations should be used only when the full term is very long and used often. Each abbreviation should be spelled out and introduced in parentheses the first time it is used in the text. Only recommended SI units should be used. Authors should use the solidus presentation (mg/ml). Standard abbreviations (such as ATP and DNA) need not be defined.

- I -
The Introduction should provide a clear statement of the problem, the relevant literature on the subject, and the proposed approach or solution. It should be understandable to colleagues from a broad range of scientific disciplines. Materials and methods should be complete enough to allow experiments to be reproduced. However, only truly new procedures should be described in detail; previously published procedures should be cited, and important modifications of published procedures should be mentioned briefly. Capitalize trade names and include the manufacturer's name and address. Subheadings should be used. Methods in general use need not be described in detail. Results should be presented with clarity and precision. The results should be written in the past tense when describing findings in the authors' experiments. Previously published findings should be written in the present tense. Results should be explained, but largely without referring to the literature. Discussion, speculation and detailed interpretation of data should not be included in the Results but should be put into the Discussion section. The Discussion should interpret the findings in view of the results obtained in this and in past studies on this topic. State the conclusions in a few sentences at the end of the paper. The Results and Discussion sections can include subheadings, and when appropriate, both sections can be combined. The Acknowledgments of people, grants, funds, etc should be brief. Tables should be kept to a minimum and be designed to be as simple as possible. Tables are to be typed double-spaced throughout, including headings and footnotes. Each table should be on a separate page, numbered consecutively in Arabic numerals and supplied with a heading and a legend. Tables should be self-explanatory without reference to the text. The details of the methods used in the experiments should preferably be described in the legend instead of in the text. The same data should not be presented in both table and graph form or repeated in the text. Figure legends should be typed in numerical order on a separate sheet. Graphics should be prepared using applications capable of generating high resolution GIF, TIFF, JPEG or PowerPoint before pasting in the Microsoft Word manuscript file. Tables should be prepared in Microsoft Word. Use Arabic numerals to designate figures and upper case letters for their parts (Fig 1). Begin each legend with a title and include sufficient description so that the figure is understandable without reading the text of the manuscript. Information given in legends should not be repeated in the text. References: In the text, a reference identified by means of an author‘s name should be followed by the date of the reference in parentheses. When there are more than two authors, only the first author‘s name should be mentioned, followed by ’et al‘. In the event that an author cited has had two or more works published during the same year, the reference, both in the text and in the reference list, should be identified by a lower case letter like ’a‘ and ’b‘ after the date to distinguish the works. Examples:

- J -
Smith (2000), Blake et al. (2003), (Kelebeni, 1983), (Chandra and Singh,1992),(Chege, 1998; Steddy, 1987a,b; Gold, 1993,1995), (Kumasi et al., 2001) References should be listed at the end of the paper in alphabetical order. Articles in preparation or articles submitted for publication, unpublished observations, personal communications, etc. should not be included in the reference list but should only be mentioned in the article text (e.g., A. Kingori, University of Nairobi, Kenya, personal communication). Journal names are abbreviated according to Chemical Abstracts. Authors are fully responsible for the accuracy of the references. Examples: Diaz E, Prieto MA (2000). Bacterial promoters triggering biodegradation of aromatic pollutants.Curr.Opin.Biotech. 11: 467-475. Dorn E, Knackmuss HJ (1978). Chemical structure and biodegradability of halogenated aromatic compounds. Two catechol 1, 2 dioxygenases from a 3-chlorobenzoate-grown Pseudomonad.Biochem. J. 174: 73-84. Pitter P, Chudoba J (1990).Biodegradability of Organic Substances in the Aquatic Environment.CRC press, Boca Raton, Florida, USA. Alexander M (1965). Biodegradation: Problems of Molecular Recalcitrance and Microbial Fallibility. Adv. Appl. Microbiol. 7: 35-80. Boder ET, Wittrup KD (1997). Yeast surface display for screening combinatorial polypeptide libraries. Nat. Biotechnol. 15: 537-553. Short Communications
Short Communications are limited to a maximum of two figures and one table. They should present a complete study that is more limited in scope than is found in full-length papers. The items of manuscript preparation listed above apply to Short Communications with the following differences: (1) Abstracts are limited to 100 words; (2) instead of a separate Materials and Methods section, experimental procedures may be incorporated into Figure Legends and Table footnotes; (3) Results and Discussion should be combined into a single section. Proofs and Reprints: Electronic proofs will be sent (e-mail attachment) to the corresponding author as a PDF file. Page proofs are considered to be the final version of the manuscript. With the exception of typographical or minor clerical errors, no changes will be made in the manuscript at the proof stage. Because IJSRPUB will be published freely online only for the first year (to attract a wide audience), authors will have free electronic access to the full text (in both HTML and PDF) of the article. Authors can freely download the PDF file from which they can print unlimited copies of their articles. Copyright: Submission of a manuscript implies: that the work described has not been published before (except in the form of an abstract or as part of a published lecture, or thesis) that it is not under consideration for publication elsewhere; that if and when the manuscript is accepted for publication, the authors agree to automatic transfer of the copyright to the publisher. Fees and Charges: FREE of Charge.

- K -
Publication Ethics This journal adopts the COPE guidelines on publication ethics.
Authors of IJSRPUB must confirm the following: Submitted manuscripts must be the original work of the author(s) Only unpublished manuscripts should be submitted It is unethical to submit a manuscript to more than one journal concurrently Any conflict of interest must be clearly stated Acknowledge the sources of data used in the development of the manuscript All errors discovered in the manuscript after submission must be swiftly communicated to the Editor. Authors must be noted: All manuscripts will be checked by Plagiarism Scanner Software. There must be a similarity of less than 20%.
Reviewers of IJSRPUB must confirm the following: That all manuscripts are reviewed in fairness based on the intellectual content of the paper regardless of gender, race, ethnicity, religion, citizenry nor political values of author(s) That any observed conflict of interest during the review process must be communicated to the Editor That all information pertaining to the manuscript is kept confidential That any information that may be the reason for the rejection of publication of a manuscript must be communicated to the Editor
Editors of IJSRPUB must confirm the following: That all manuscripts are evaluated in fairness based on the intellectual content of the paper regardless of gender, race, ethnicity, religion, citizenry nor political values of authors That information pertaining manuscripts are kept confidential That any observed conflict of interest pertaining manuscripts must be disclosed The Editorial Board takes responsibility for making publication decisions for submitted manuscripts based on the reviewer’s evaluation of the manuscript, policies of the journal editorial board and legal restrain acting against plagiarism, libel and copyright infringement.

IJSRK Internat ional Journal of Scient if ic Research in Knowledge
www.i jsrpub.com
July 2013
Volume 1, Issue 7
Pages 175 – 237

Table of Contents
Article Author(s) page
Evaluation of Ductility and Load Carrying Capacity in RC Beam-Column in Exterior Joints Enhanced with FRP
Alireza Mardookhpour 175
Synthesis and Characterization of Two New Oxo-centered Trinuclear Complexes of Manganese and Iron
Haman Tavakkoli, Arezoo Ghaemi, Fouad Mohave
182
Factors Influencing Anemia and Night Blindness among Children Less than Five Years Old (0 - 4.11 Years) in Khartoum State, Sudan
Samir Mohamed Ali Hassan Alredaisy, Haram Omer El Hag Saeed
189
Remediation of Tetrachloroethylene -Contaminated Soil with Zero Valent Iron Utilizing Electrokinetic Reactors
Maryam Taghizadeh, Daryoush Yousefi Kebria
202
Monitoring and Configuration of Energy Harvesting System Using WSN
Kodegandlu Venkatarayappa Narayanaswamy
212
Assessing Cracks in Reinforced Concrete Structure Using Acoustic Emission
Alireza Panjsetooni, Norazura Muhamad Bunnori, Tze Liang Lau
222
Time-Dependent Creep Analysis of Rotating Thick-Walled Cylindrical Pressure Vessels under Heat Flux
Mohammad Zamani Nejad, Mosayeb Davoudi Kashkoli
228

International Journal of Scientific Research in Knowledge (IJSRK), 1(7), pp. 175-181, 2013 Available online at http://www.ijsrpub.com/ijsrk
ISSN: 2322-4541; ©2013 IJSRPUB
http://dx.doi.org/10.12983/ijsrk-2013-p175-181
175
Full Length Research Paper
Evaluation of Ductility and Load Carrying Capacity in RC Beam-Column in Exterior
Joints Enhanced with FRP
Alireza Mardookhpour
Ph.D., Department of Civil Engineering, Islamic Azad University, Lahijan Branch, Iran
Received 18 April 2013; Accepted 21 May 2013
Abstract. One of the techniques of strengthening of the reinforced concrete (RC) structural members is through confinement
with a composite enclosure. This external confinement of concrete by high strength fiber reinforced polymer (FRP) composite
can significantly enhance the strength and ductility and will result in large energy absorption capacity of structural members.
An experimental investigation of the behavior of retrofitted FRP wrapped exterior beam-column joints under seismic
conditions is presented. Also, the experimental study on exterior beam-column joint of a multistory reinforced concrete
building under the seismic has been analyzed using ANSYS software. Two specimens were cast and tested to failure during the
present investigation. One is Control specimen test up to 70% of the ultimate load (without FRP), and another specimen test
up to 70% of the ultimate Load (with one layer of FRP). The results show about 18% has been obtained by retrofitting with
FRP sheets in load carrying capacity. Also an increase about 54% has been obtained by retrofitting with FRP sheets in
cumulative ductility.
Key words: FRP, cyclic loading, ANSYS software, beam-column exterior joints
1. INTRODUCTION
One of the modern methods in strengthening concrete
structures is utilizing fiber reinforced polymers (FRP)
bonded to concrete beams as strips made of carbon
fibers. The effect of FRP (Fiber Reinforced Polymers)
sheets on bending strength of beams is one of the
advantages of utilizing carbon fibers in concrete
structures. FRP materials have a number of favorable
characteristics such as ease, to install immunity to
corrosion, high strength, availability in sheets etc
(Appa Rao et al., 2008). Tensile Properties of the
Sprayed GFRP has been shown in Table 1 and Figure
1.The simplest way to strengthen such joints is to
attach FRP sheets in the joint region in two orthogonal
directions (HungJen and SiYing, 2009).
In RC buildings, portions of columns that are
common to beams at their intersections are called
beam-column joints. Under earthquake shaking, the
beams adjoining a joint are subjected to moments in
the same (clockwise or counterclockwise) direction
(Murthy et al., 2001). The dynamics of earth quake
loadings are 12 cycles in five stages .The loading is
applied gradually for forward direction with
3,6,9,12,15 KN respectively and 3,6,9,12,15 KN for
reverse direction. Under these moments, the top bars
in the beam-column joint are pulled in one direction
and the bottom ones in the opposite direction (Kolluru
and Subramaniam, 2007). These forces are balanced
by bond stress developed between concrete and steel
in the joint region. If the column is not wide enough
or if the strength of concrete in the joint is low, there
is insufficient grip of concrete on the steel bars (Tajari
and Esfehani, 2006).
In such circumstances, the bar slips inside the joint
region, and beams lose their capacity to carry load.
Further, under the action of the above pull-push forces
at top and bottom ends, joints undergo geometric
distortion; One diagonal length of the joint elongates
and the other compresses (Ali-Ahmad et al., 2007;
Murugesan and Thirugnanam, 2009). If the column
cross-sectional size is insufficient for satisfying
minimum bar ratio, the concrete in the joint develops
diagonal cracks (Tajari and Esfehani, 2006). Problems
of diagonal cracking and crushing of concrete in the
joint region can be controlled by two mean, namely
providing large column sizes and providing closely
spaced closed-loop steel ties around column bars in
the joint region (Sayed and Soleimani, 2009). The ties
hold together the concrete in the joint and also resist
shear force, thereby reducing the cracking and
crushing of concrete (Murugesan and Thirugnanam,
2009). One of the newest methods for retrofitting joint
region of beam-column, to increase shear strength of
RC structures under cyclic loading is utilizing FRP
sheets (Thirugnanam, 2007; Tsonos et al., 1992).

Mardookhpour
Evaluation of Ductility and Load Carrying Capacity in RC Beam-Column in Exterior Joints Enhanced with FRP
176
2. MATERIALS AND METHODS
The experimental study exterior beam-column joint of
a reinforced concrete structure under the seismic
circumstance has been analyzed using ANSYS
software. Mechanical properties of GFRP sheets are
presented in Table 1. Also the stress – strain
relationship is sketched in Figure 1.
Table 1: Tensile Properties of the Sprayed GFRP
unit value Tensile Properties
M Pa 69 Ultimate Tensile Strength
M Pa 14000 Tensile Modulus
% 0.63 Ultimate Rupture Strain
Fig. 1: Stress – strain diagram of GFRP sheets
For testing model the dimension of beam was 120
X 170 mm with out slab thickness and beam length of
450mm and that column size was 120 X 230 mm.
Height of the column was 600mm.Figure (2.a-1.b)
shows the details of beam- column joints. The basis
for this model and reinforcements is satisfying
minimum bar ratio and flexibility in joints.
The reinforcement cages were placed in the moulds
and cover between cage and form provided was 20
mm. The concrete mixture design has been shown in
Table 2.
Table 2: Concrete mixture design (kg / m3)
Coarse aggregate sand cement water
750 1000 300 160
The concrete was placed into the mould
immediately after mixing and well compacted.
Control cubes and cylinders were prepared for all the
mixes along with concreting. The test specimens
cubes were remolded at the end of 24 hours of casting.
They were marked identifications. They are cured in
water for 28 days. After 28 days of curing the
specimen was dried in air and white washed according
to ISIS. A hydraulic jack was used to apply the axial load
for column. To record the load precisely a proving
ring was used. The load is applied forward and
reverses cyclic and deflection measured by using
LVDT (Figure 3).Linear variable differential
transformer (LVDT) is a type of electrical transformer
used for measuring linear and rotary position and
displacement. The LVDT converts a position or linear
displacement from a mechanical reference (zero, or
null position) into a proportional electrical signal
containing phase (for direction) and amplitude (for
distance) information. After loading the deflection of
the specimens the strains at the end- spans are
measured by gauge. Also, the strain of concrete at the
level of the tensile and compressive reinforcing bars
and the strain of GFRP sheets at the end- span of
beam are measured by gauge according to Figure 3.

International Journal of Scientific Research in Knowledge (IJSRK), 1(7), pp. 175-181, 2013
177
Fig. 2: a. casting the joint
Fig. 2: b. ductile detailing of beam -column joint
Fig. 3: Measuring instruments
The deflection was measured at the beam free end
tip. The loading is applied gradually for forward
direction with 3,6,9,12,15 KN respectively and
3,6,9,12,15 KN for reverse direction (Figure 4 a, 4 b).

Mardookhpour
Evaluation of Ductility and Load Carrying Capacity in RC Beam-Column in Exterior Joints Enhanced with FRP
178
Fig. 4: b Test Setup for Cyclic Loading for Control Specimen
The Exterior beam column joint specimen named
as SL1 (Single Layer) was tested subject to quasistatic
cyclic loading simulating earthquake loads (Figure 4-
1, 4-2). The Load was applied by using screw jack
under 5 cycles. The beam-column joint was gradually
loaded by increasing the load level during each cycle
on the column head (Tang and Saadatmanesh, 2005).
The load sequence consists of 3kN, 6kN, 9kN and up
to 70% ultimate load. The deflection measured at tip
during the cycle of loading, as the load level was
increased in each cycle.
Fig. 4: a Load setup for the retrofitted specimen
3. RESULTS AND DISCUSSION
Experimental results are compared with finite
elements model (FEM) in ANSYS software. The
70% of ultimate load carrying capacity of the joint
was 17.0 kN in control specimen. In other words, the
first crack was witnessed during 4 th cycle at the load
level of 17.0 kN. The maximum stresses are occurred
at the junction for the ultimate loading. As the load
level was increased, further cracks were developed in
other portions. Cumulative ductility of joint for
control specimen has been shown in Figure 5.

International Journal of Scientific Research in Knowledge (IJSRK), 1(7), pp. 175-181, 2013
179
0
5
10
15
20
25
30
35
40
0 5 10 15
Load Cycles
Co
mu
lati
ve D
ucti
lity
(m
m)
Retrofitted Specimens
Control specimens
Fig. 5: Comulative ductility VS load cycles for Control Specimen
In the next series of experiments, the GFRP
wrapped specimen was subjected to quasistatic cyclic
loading simulating earthquake loads. The history of
load sequence followed for the test was presented in
Figure 6.
Fig. 6: Load Vs Deflection curve for retrofitted specimen
The loading is applied gradually for forward
direction with 3,6,9,12,15 KN respectively and
3,6,9,12,15 KN for reverse direction. The load was
applied by using screw jack Totally 12 cycles were
imposed. The 70% of ultimate load carrying capacity
of the one single layer (SL1) specimen was 20.0kN
recorded at 5 th cycle. Figure 5 shows the ductility-
load curve for retrofitted specimen. According to
Figure 5, an increase about 54% has been obtained by
retrofitting with FRP sheets in cumulative ductility. In
Control specimens the cumulative ductility reached
about 24 mm whereas in retrofitted specimens the
cumulative ductility has been increased up to 37 mm.
Also, the load carrying capacity in Control specimens
has been about 13.5 kN, but the load carrying capacity
in retrofitted specimens increased up to 15 kN which
refers an increase about 18 % has been obtained by
utilizing GFRP at the joint region.
4. CONCLUSION
The structural behavior of RCC beam column joint
exterior type has been studied analytically by using
standard software packages ANSYS software. The
load deformation characteristics and load carrying
capacity improved to large extent in the case of the

Mardookhpour
Evaluation of Ductility and Load Carrying Capacity in RC Beam-Column in Exterior Joints Enhanced with FRP
180
retrofitted specimen over the control specimen in test
presented work. The results show, the load carrying
capacity has been increased about 18% by retrofitting
with FRP sheets. Also an increase about 54% has been
obtained by retrofitting with FRP sheets in cumulative
ductility.
REFERENCES
Ali-Ahmad M, Subramaniam KV, Ghosn M (2007).
Analysis of Instability in FRP Concrete Shear
Debonding for Beam Strengthening
Applications. Journal of Engineering
Mechanics of Materials, ASCE, 133(1): 58−67.
Appa Rao G, Mahajan M, Gangaram M, Eligehausen
R (2008). Performance of nonseismically
designed RC beam column joints strengthened
by various schemes subjected to seismic loads.
Journal of structural engineering, 35 (1): 52-58.
HungJen L, SiYing Yu (2009). Cyclic Response of
Exterior Beam-Column Joints with Different
Anchorage Methods, The ACI structural
Journal, Title No.106S32.
ISIS (2001).Canada strengthening reinforced concrete
structures with externally-Bounded fiber
reinforced polymers. Design manual. No 4.
2001.
Kolluru V, Subramaniam S (2007). Civil Engineering
Department, City College of City University of
New York, New York, NY 10031
Murthy CV, Durgesh C, Rai K, Bajpai K, Sudhir K
(2001).Anchorage Details and Joint Design in
Seismic RC Frames. the Indian Concrete
Journal, 274 –280.
Murugesan A, Thirugnanam GS (2009).Ductile
Behavior of Steel Fiber Reinforced Concrete
beam column joints subjected to Cyclic loading,
National Conference on Advances and
Innovations in civil Engineering. Mepco
Schlenk Engineering college, Sivakasi , 27-33.
Murugesan A, ThirugnanamG.S (2009).Ductile
behavior Reinforced Concrete Beam Column
joints Subjected to Cyclic loading, National
Conference on Recent Advances in Concrete.
Steel and Composite Structures , I.R.T.T.,
Erode,118-135.
Sayed M, Soleimani S (2009).Sprayed GFRP shear
strengthened reinforced concrete beams under
impact loading, University of British Columbia,
Vancouver. Canada.
Tajari A.R., Esfehani M.R (2006).Flexural behavior
of reinforced concrete beams strengthened by
CFRP sheets, Elsevier.
Tang T, Saadatmanesh H (2005). Analytical and
experimental studies of fiber reinforced
polymer-strengthened concrete beams under
impact loading. ACI Structures J., 102:139–149
Thirugnanam G.S (2007). Ductile Behavior Of FRP
Strengthened R.C Beams Subjected To Cyclic
Loading IRTT Erode.
Tsonos AG, Tegos IA, Penelis G (1992). Seismic
resistance of Type 2 Exterior Beam column
joints reinforced with inclined bars. The ACI
structural Journal, Title No.89S1.

International Journal of Scientific Research in Knowledge (IJSRK), 1(7), pp. 175-181, 2013
181
Dr. Alireza Mardookhpour has Ph.D. in Civil Engineering. He is Assistant Professor in department of
civil and water engineering, manager of civil engineering, Islamic Azad University, Lahijan Branch,
Iran. He has 81 papers in ISI and scientific research journals.

International Journal of Scientific Research in Knowledge (IJSRK), 1(7), pp. 182-188, 2013 Available online at http://www.ijsrpub.com/ijsrk
ISSN: 2322-4541; ©2013 IJSRPUB
http://dx.doi.org/10.12983/ijsrk-2013-p182-188
182
Full Length Research Paper
Synthesis and Characterization of Two New Oxo-centered Trinuclear Complexes of
Manganese and Iron
Haman Tavakkoli*, Arezoo Ghaemi, Fouad Mohave
Department of Chemistry, Science and Research Branch, Islamic Azad University, Khouzestan, Iran
*Corresponding author: [email protected]
Received 1 May 2013; Accepted 3 June 2013
Abstract. Two new oxo-centered trinuclear complexes, one of them a mixed-valence complex [Mn2MnO(CCl3CO2)6(Py)3] (1)
and the other, mixed-metal complex of [Fe2MnO(CCl3CO2)6(H2O)3].NO3 (2) were synthesized by the direct reaction between
metal nitrates and trichloroacetic acid. These complexes were characterized by elemental analyses (CHN), atomic absorption
spectroscopy and spectral (IR, electronic) studies. These are new types of oxo-bridged mixed-metal complexes in which the
carboxylate ligand is trichloroacetic acid. The UV spectra of the complexes exhibited strong bands in the region 213 and 257
nm which are related to the (π → π*) and (n → π*) transitions of the pyridine and H2O ligands, respectively. The IR spectra of
these compounds showed two strong stretching vibrations bands, indicating a bridging coordination mode of the carboxylic
group of the ligand in the complexes.
Keywords: oxo-centered; trinuclear complexes; carboxylic ligand; IR spectra.
1. INTRODUCTION
Transition-metal carboxylate chemistry has played a
key role in the conceptual development of modern
inorganic chemistry (Kim and Cho, 2004). The
current interest in the trinuclear, oxo-centered metal
carboxylate assemblies of the general composition
[M3O(OOCR)6L3]+ (where M= trivalent 3-d metal,
RCOO=carboxylic acid (R = CH3, Ph, etc) L=
monodentate ligand) is due to these complexes have
served as important models to test theories of
magnetic and electronic coupling between metal ions
(Beattie et al., 2003 and Gavrilenko et al., 2002). They
are particularly valuable as frame works for
systematically studying metal-metal interactions in
clusters and constitute an important class of
compounds in transition metal chemistry. They have
been characterized with a wide variety of first-row
and heavier transition metals, with mixed-metal
(Blake et al., 1998) and mixed-valency combinations
(Wu et al., 1998).
Electron transfer interactions, and subtle
distortions from regular structures, can be detected by
their effects on molecular vibrations. These are
valuable precursors for the synthesis of higher
nuclearity clusters exhibiting interesting magnetic
properties. Surprisingly, little attention has been paid
to the consideration of substitution properties, with
only a few reports of comparative studies regarding
the redox properties when the terminal ligand L
changes. There is interest in establishing how
substitution in the Carboxylate Bridge affects the
liability of the terminal ligand and the redox potential
of the metal centers. These carboxylate complexes are
of additional interest when the carboxylate is
unsaturated, because there is a potential scope for
further polymerization in the solid state by cross-
linking of the substituents (Chavan et al., 2001 and
Maragh et al., 2005). Trinuclear μ3,-oxo-bridged iron
carboxylate complexes have been studied in great
detail (Sorai et al., 1986 and Woehler et al., 1986),
whereas analogous mixed-valence manganese-
carboxylate complexes have been the object of only
limited investigation to date. Each carboxylate anion
spans two metal centers at the periphery of the
[M3(μ3-O)]6+
core, while the neutral monodentate
ligands occupy the remaining coordination sites on
each metal center, and as a result the coordination
around the metal center is approximately octahedral
(Fig.1)
In previous studies, we reported fabrication of
some trinuclear oxo-centered complexes with
saturated and unsaturated carboxylate ligands
(Yazdanbakhsh et al., 2010 and Tavakkoli et al., 2011
and Yazdanbakhsh et al., 2009). In this paper, the
syntheses and characterization of mixed-valence and
mixed-metal clusters are reported. These are,
however, limited to clusters coordinated by relatively
small organic ligands.

Tavakkoli et al.
Synthesis and Characterization of Two New Oxo-centered Trinuclear Complexes of Manganese and Iron
183
2. EXPERIMENTAL
2.1. Materials
All starting materials, except (N-n-Bu4MnO4), used in
this study were analytical grade and purchased from
Merck.
Fig. 1: Schematic representation of the oxo-centered trinuclear clusters structure [M3O(RCOO)6(L)3]
z
N-n-Bu4MnO4; This material was prepared, as
outlined in the literature (Yazdanbakhsh et al., 2007),
by mixing aqueous solutions of KMnO4, (5.00 g, 31.6
mmol) and N-n-Bu4Br (12.00 g, 37.2 mmol) with
vigorous stirring to give a total volume of ca. 200 ml.
The immediate purple precipitate was collected by
filtration, washed thoroughly with distilled water and
diethyl ether and dried in vacuum at ambient
temperature: yield > 90%.
The C, H and N analyses were realized on a Thermo
Finnigan Flash model EA1112 elemental analyzer.
The atomic absorption analyses were performed on a
Shimadzu model AA-670 atomic absorption
spectrometer. The IR spectra of KBr discs (600–4000
cm-1
) were recorded on a Buck 500 spectrometer. The
electronic spectra were registered in the range of 200–
600 nm on a Perkin-Elmer 1600 spectrometer.
Preparation of [Mn2MnO(CCl3CO2)6(Py)3]
N-n-Bu4Br (12 g, 37.2 mmol) was added to an
aqueous solution of KMnO4 (5 g, 31.6 mmol) under
vigorous stirring. The immediately formed purple
precipitate was collected by filtration, washed
thoroughly with distilled water and diethyl ether and
dried in vacuo at room temperature. Then
Mn(OOCMe)2.4H2O (10 mmol, 2.5 g) and
trichloroacetic acid (54 mmol, 8.83 g) were dissolved
in a solvent mixture comprising pyridine (7 ml) and
absolute ethanol (15 ml). The resulting solution was
stirred while solid N-n-Bu4MnO4 (3.5 mmol, 1.25 g)
was added in small portions and stirred to give a dark
brown homogeneous solution. This solution was
allowed to stand undisturbed for 48 h and the resulting
large octahedral-shaped crystals were collected by
filtration, washed with pyridine and dried in vacuum.
(Yield: 72%), m.p.: 185˚C, Anal. Calc. for
C27H15Cl18Mn3N3O13: C, 23.26; H, 1.07; N, 3.01; Mn,
11.84%. Found: C, 22.96; H, 1.15; N, 3.11; Mn,
11.65%.
Preparation of [Fe2MnO(CCl3CO2)6(H2O)3].NO3
A mixture of Fe(NO3)3.9H2O (1.08 g, 2.68 mmol) and
Mn(NO3)2.4H2O (0.34 g, 1.34 mmol) was dissolved in
25 ml deionezed water and was refluxed for 10 min.
Then, NaCCl3CO2 (2.22 g, 12 mmol) was added and
the reflux continued for 5 h. The resulting brown
solution was allowed to cool and stored for 2 days at
20 °C. The black crystals were filtered off, washed
copiously with Et2O and dried in vacuum. (Yield:
85%), m.p.: 275˚C, Anal. Calc. for
C12H6Cl18Fe2MnNO22: C, 10.89; H, 0.45; N, 1.06; Fe,
8.47; Mn, 4.16%. Found: C, 10.64; H, 0.62; N, 1.14;
Fe, 8.85; Mn, 4.39%.
3. RESULTS AND DISCUSSION
3.1. IR Spectroscopy
The IR spectra of these complexs are shown in Fig. 2
that indicate the presence of carboxylate, H2O and
M2MO groups. The observed vibrational
frequencies υasym(COO) and υsym(COO) for the

International Journal of Scientific Research in Knowledge (IJSRK), 1(7), pp. 182-188, 2013
184
carboxylate ligand support the presence of bridging
coordinated carboxylates in all the complexes. For the
mixed-metal complexes, it appears from the
carboxylate stretching frequencies that all six ligands
are approximately equivalent and they are best
represented as bidentate bridges. For a new series of
trinuclear mixed metal complexes, Cannon assigned
the IR spectra and identified the vibrational modes of
the central M3O core (Baranwal et al., 2009). He
found that the reduction in site geometry from D3h to
C2v lifted the degeneracy of the asymmetric M3O
stretches and two bands were seen. These spectra
indicate a single pair of carboxylate stretching
vibrations at 1601 and 1425 cm-1
for (1), 1615 and
1430 cm-1
for (2) assigned to υasym(COO) and
υsym(COO), respectively. The difference (Δυ =
υasym(COO) –υsym(COO)) is 176 and 185 cm–1
. In the
IR spectrum of complex 2, the characteristic vibration
frequencies for H2O groups appear at ~3500–3600 cm-
1. For identification of the metal-oxygen bonds of
M3O group, IR spectra in the range of 800-400 cm-1
were used (Boudalis et al., 2002). The band observed
for asymmetric vibration associated with the M2M'O
unit splits into two components, A1 and B2 (Cannon
and White, 1988) .These spectra show the
characteristic bands for the valence oscillations
υas(Fe2MnO) in the region 565 cm-1
(A1) and 420 cm-1
(B2) and υas(Mn3O) is observed at 580 cm-1
. All data
of IR spectroscopy for these compounds are given in
Table 1.
Table 1: Selected IR bands (cm-1
) for complexes
Compound asym (COO) sym (COO) (M3O) (C-H) (C-Cl) (O-H)
1 1601 1425 580 3036 824
2 1615 1430 420-565 2970 816 3570
Fig. 2: IR spectra of [Mn2Mn(O)(CCl3COO)6(py)3] (a) and [Fe2Mn(O)(CCl3COO)6(H2O)3].NO3 (b) (KBr pellet)

Tavakkoli et al.
Synthesis and Characterization of Two New Oxo-centered Trinuclear Complexes of Manganese and Iron
185
3.2. Electronic spectroscopy
The electronic spectra of the trinuclear complexes can
be interpreted to a good approximation in terms of the
individual metal ions, together with ligand-metal
charge transfer transitions. The electronic spectra of
the complexes were recorded in the range of 200-600
nm in dichloromethane solution. The spectra of the
oxo-centered complexes 1 and 2 show the
characteristic bands provided by both metal ions. The
UV spectra of the complex 1 and 2 (Fig.3) exhibited a
strong bands in the region 257 and 213 nm which is
related to the (π → π*) transitions of the pyridine (Py)
ligand (Chen et al., 2005) and (n → π*) transition of
the water ligand.
The Vis spectra for complex 1 and 2 are shown in
Fig. 4. As is obvious in this Figure, broad band in the
region 480 nm, which can be assigned to the transition
from 5Eg to
5T2g, should be attributed to the existence
of Mn(III)
(d4) ion in these complexes. Obtained data
can be assigned and characterized based on other
literature (Mizoguchi et al., 1999).
Fig. 3: UV spectra of the [Mn2MnO(CCl3CO2)6(Py)3] (a) and [Fe2MnO(CCl3CO2)6(H2O)3].NO3 (b)
4. CONCLUSION
Two new Oxo-centered trinuclear complexes with the
general formula [M2M'O(CCl3COO)6(L)3] where M =
Mn, M' = Mn, L = py (1); M = Fe, M' = Mn, L = H2O
(2) were prepared and studied by elemental analysis
(CHN), electronic and infrared spectroscopy and
atomic absorption spectroscopy. All compounds have
a similar μ3-oxo structure. The IR investigations of
these compounds show intensive absorption bands,
which are assigned to υasym(COO) and υsym(COO)
vibrations. Furthermore, the three metal ions are
bound to a central oxygen atom and adjacent metal
ions are bridged by two carboxylate ligands. In
addition, for mixed metal complex 2, the atomic
absorption data show a statistical 2:1 disorder of iron
and manganese atoms, respectively.

International Journal of Scientific Research in Knowledge (IJSRK), 1(7), pp. 182-188, 2013
186
Fig. 4: Vis spectra of the [Mn2MnO(CCl3CO2)6(Py)3] (a) and [Fe2MnO(CCl3CO2)6(H2O)3].NO3 (b)
REFERENCES
Baranwal BP, Fatma T, Varma A (2009). Synthesis,
spectral and thermal characterization of nano-
sized, oxo-centered, trinuclear carboxylate-
bridged chromium(III) complexes of
hydroxycarboxylic acids. J. Mol. Struct, 920:
472-477.
Beattie JK, Klepetko JA, Masters AF, Turner P
(2003). The chemistry of cobalt acetate. VIII.
New members of the family of oxo-centred
trimers, [Co3(μ3-O)(μ-O2CCH3)5−p(μ-OR)pL5]2+
(R=H, alkyl, L=ligand, p=0–4). The preparation
and characterisation of the trimeric tetrakis(μ-
acetato)-(μ-hydroxo)-μ3-oxo-
pentakis(pyridine)-tri-cobalt(III)
hexafluorophosphate, [Co3(μ3-O)(μ-
O2CCH3)4(μ-OH)(C5H5N)5][PF6]2. Polyhedron,
22: 947-965.
Blake AB, Sinn E, Yavari A, Murray KS, Moubaraki
B (1998). Preparation and crystal structure
analysis of a novel oxo-centered mixed-metal
complex containing bridging carboxylates
ligands. J. Chem. Soc. Dalton Trans., 45: 158-
163.
Boudalis AK, Lalioti N, Spyroulias GA, Raptopoulou
CP, Terzis A(2002). Novel Rectangular
[Fe4(μ4-OHO)(μ-OH)2]7+ versus “Butterfly”
[Fe4(μ3-O)2]8+ Core Topology in the
FeIII/RCO2-/phen Reaction Systems (R = Me,
Ph; phen = 1,10-Phenanthroline): Preparation
and Properties of
[Fe4(OHO)(OH)2(O2CMe)4(phen)4](ClO4)3,
[Fe4O2(O2CPh)7(phen)2](ClO4), and
[Fe4O2(O2CPh)8(phen)2]. Inorg. Chem, 41:
6474-6487.
Cannon RD, White RP (1988). Progress in Inorganic
Chemistry. Wiley, 36: 23-28.
Chavan SA, Srinavas D, Ratnasamy J (2001). A
novel, zeolite-encapsulated μ3-oxo Co/Mn
cluster catalyst for oxidation of para-xylene to
terephthalic acid. Chem. Commun, 12: 1124-
1125.
Chen JL, Zhang LY, Shi LX, Ye HY, Chen ZN
(2005). Preparation, characterization and redox
chemistry of oxo-centered triruthenium dimers
linked by bis(diphenylphosphino)anthracene
and -ferrocene. Inorg. Chim. Acta, 358: 859-
864.
Gavrilenko KS, Vertes A, Vanko G, Kiss LF, Addison
AW, Weyhermuller T, Pavlishchuk VV (2002).
Synthesis, Magnetochemistry, and
Spectroscopy of Heterometallic Trinuclear
Basic Trifluoroacetates [Fe2M(μ3-

Tavakkoli et al.
Synthesis and Characterization of Two New Oxo-centered Trinuclear Complexes of Manganese and Iron
187
O)(CF3COO)6(H2O)3]·H2O (M = Mn, Co, Ni).
Eur. J. Inorg. Chem, 2002: 3347-3355.
Kim J, Cho H (2004). Reductive coupling of
trinuclear [MnIIMn
III2O] core to form
hexanuclear [Mn4IIMn2
IIIO2] cluster. Inorg.
Chem. Commun, 7: 122-124.
Maragh PT, Thomas SE, Dasgupta TP (2005).
Kinetics and mechanism of the aquation of the
trinuclear cation, [μ3-oxo-triaqua-
hexakis(acetato)tris(iron(III))]+in perchloric
acid media. Inorg. Chim. Acta, 358: 3610-3616.
Mizoguchi TJ, Davydov RM, Lippard SJ (1999).
Structural and Spectroscopic Comparisons
between (μ-Oxo)- and (μ-Hydroxo)bis(μ-
carboxylato)diiron(III) Complexes That
Contain All-Oxygen-Donor Ligands. Inorg.
Chem, 38:4098-4103.
Sorai M, Kaji K, Hendrickson DN, Oh SM (1986).
Heat capacity and phase transitions of the
mixed-valence compound
[Fe3O(O2CCH3)6(py)3](py). J. Am. Chem. Soc,
108: 702-708.
Tavakkoli H, Yazdanbakhsh M, Lotfian N, Boese R
(2011). Synthesis, characterization and crystal
structure analysis of a novel oxo-centered
mixed-metal complex containing unsaturated
bridging carboxylates. Cent. Eur. J. Chem, 9:
585-589.
Woehler SE, Wittebort RJ, Oh SM, Hendrickson DN,
Inniss D, Strouse CE (1986). Solid-state
deuterium NMR, iron-57 Moessbauer, and x-
ray structural characteristics of .mu.3-oxo-
bridged mixed-valence [Fe3O(O2CCH3)6(4-Me-
py)3](C6H6): dynamics of the benzene solvate
molecules influencing intramolecular electron
transfer. J. Am. Chem. Soc, 108: 2938-2946.
Wu R, Poyraz M, Sowrey FE, Anson C.E, Wocadlo S,
Powell AK, Jayasooriya UA, Cannon RD,
Nakamoto T, Katada M, Sano H (1998).
Electron Localization and Delocalization in
Mixed-Valence Transition Metal Clusters:
Structural and Spectroscopic Studies of Oxo-
Centered Trinuclear Complexes
[Fe3O(OOCCMe3)6(py)3] and
[Mn3O(OOCCMe3)6(py)3]. Inorg. Chem., 37:
1913-1921.
Yazdanbakhsh M, Alizadeh MH, Khorramdel HZ,
Frank W (2007). Synthesis, Characterization
and Crystal Structure of Novel Mixed Bridged
Trinuclear Oxo-Centered Iron(III), Chromium
(III) Complexes Containing Terminal
Unsaturated Carboxylato and Acrylic Acid
Dimer Anion Ligands. Anorg Z. Allg. Chem,
633: 1193-1198.
Yazdanbakhsh M, Khosravi I, Tavakkoli H (2009).
Synthesis and characterization of novel oxo-
bridged, trinuclear mixed-metal complexes of
Cr(III) and Fe(III). J. Serb. Chem. Soc, 74:
401–406.
Yazdanbakhsh M, Tavakkoli H, Taherzadeh M, Boese
R (2010). Synthesis, X-ray crystal structure and
spectroscopic characterization of
heterotrinuclear oxo-centered complex
[Fe2NiO(CH3CH2COO)6(H2O)3]. Journal of
Molecular Structure, 982: 176–180.

International Journal of Scientific Research in Knowledge (IJSRK), 1(7), pp. 182-188, 2013
188
Dr. Haman Tavakkoli is an assistant professor in inorganic chemistry in Islamic Azad University,
Khouzestan Science and Research Branch, Iran. He received his M.Sc and Ph.D degree in inorganic
chemistry from Ferdowsi University of Mashhad, Iran in 2007 and 2012, respectively. He has published
14 refereed articles in valid ISI journals and 10 scientific articles in conference proceedings. Dr.
Tavakkoli’s fields of expertise are in coordination chemistry, nanomaterials chemistry and physics and
environmental chemistry.
Dr. Arezoo Ghaemi obtained her Bachelor’s degree from the Ferdowsi University of Mashhad, Iran in
chemistry in 2004. She later bagged her Master’s and Doctorate degrees in Analytical chemistry from
Ferdowsi University of Mashhad, Iran in 2006 and 2012, respectively. She has graduated with first
grade in Ph.D degree. At present, Dr. Ghaemi is an assistant professor in analytical chemistry in Islamic
Azad University, Khuzestan Science and Research Branch, Iran. She has published numerous articles in
ISI journals and conference proceedings.
Fouad Mohave is a MSc student in Organic Chemistry Science and Research Branch, Islamic Azad
University, Khouzestan, Iran.

International Journal of Scientific Research in Knowledge (IJSRK), 1(7), pp. 189-201, 2013 Available online at http://www.ijsrpub.com/ijsrk
ISSN: 2322-4541; ©2013 IJSRPUB
http://dx.doi.org/10.12983/ijsrk-2013-p189-201
189
Full Length Research Paper
Factors Influencing Anemia and Night Blindness among Children Less than Five
Years Old (0 - 4.11 Years) in Khartoum State, Sudan
Samir Mohamed Ali Hassan Alredaisy1, Haram Omer El Hag Saeed
2
1Faculty of Education, University of Khartoum, Khartoum Omdurman 406 Sudan 2Rufaa Nutrition and Maternity Office, Ministry of Health, Gezira state, Sudan
*Corresponding Author: [email protected]
Received 24 April 2013; Accepted 5 June 2013
Abstract. This study investigated factors influencing nutritional status of children less than five years old suffering anemia and
night blindness in Khartoum State. Sample size was 138 children determined by 10% rate of prevalence of nutritional
deficiency diseases among children living in Khartoum State. In addition, testing hemoglobin and anthropometric
measurements were done. Results depicted that, illiteracy was prevailing, and household monthly income averaged 100 USD.
Symptoms of anemia included loss of appetite (8777%), paleness (9375%), and eating clay (29%), while for night blindness
they were xerophthalmia (20%); Pinot spots (52%); karatomalacia (12%), and Cornea ulceration (4%). Children suffering these
two diseases had hemoglobin concentration below 60% standard, indicated to Iron deficiency anemia and cute malnutrition
constitute 63% of the cases. Females are less malnourished compared to males. Significant relationship exists between
household monthly income and number of meals per day taken by a child (P=0 .0003); and between nutritional status of
children and number of meals taken by a child per day (P=0 .003); and between household monthly income and frequency of
daily intake of energy, protein, iron by a child (0.04; 0.01; 0.07 respectively). Nutritional status of pregnant women and
nutritional status of the family are significantly correlated (P= 0.0056); and hemoglobin and intake of animal and plant protein
is significant correlated (P= 0.03 and 0.01 respectively). Big family size of children suffering anemia and night blindness had
reduced their share of energy, protein, iron and vitamin A. The authors suggested some recommendations to alleviate these two
diseases in Khartoum State.
Key words: anemia, night blindness, malnutrition, poverty, illiteracy, lactation, low food quality, Khartoum State
1. INTRODUCTION
Nutrition deficiency diseases are worldwide
spreading. In Sudan, one child out of ten dies before
completing five years due to these diseases (UNICEF,
2008). Malnutrition due to micro nutrients deficiency
(hidden hunger) represents the most prevailing form
of nutrition deficiency diseases where more than two
billions are suffering from it in the world; in addition
to more than 250,000 children are affected by night
blindness every year and more than half of these
children dies approximately (UNICEF, 2008). In
Sudan, the estimated rate of prevalence of hidden
hunger is 4.8% while the rate of anemia (iron
deficiency anemia) for children less than five years
old is about 55.1% (National Ministry of Health,
2008; World Health Organization, 2009). In
Khartoum State, anemia due to Iron deficiency is
distributed as 76% in Khartoum town, 75.3% in
Khartoum north town, and 23.9% in Omdurman town
(National Ministry of Health, 2008; World Health
Organization, 2009). However, nutritional deficiency
diseases as cause of death during early childhood,
have contributed around 51% among overall causes of
death during this period (UNICEF, 2008).
Areas nutritionally insecure in Sudan include rural
areas of low crop and animal production; areas of low
purchasing power and education and knowledge; and
areas of low access to health facilities, in addition to
areas with low access to water especially during dry
season, vulnerable residents who were indirectly
affected by the influx of internally displaced
population in their communities and returnees
numbering 4 million internally displaced population
and 600,000 refugees almost all from south Sudan
(FAO/WFP, 2006; Cambrez et al., 1998). Nutrition
insecurity leads to protein – energy malnutrition.
Nutrition status is measured directly by dietary
surveys, biochemical data, and clinical examination
methods. While food adequacy is necessary for a
household to achieve nutrition security, it is not in
itself sufficient. This is because some other key
contributors to good nutrition are also important, such
as poverty reduction, female education and a healthy
environment. However, some researchers view
poverty as the main cause of malnutrition while some
others believe in malnutrition eradication without
reduction in poverty pointing to well nourished
children living in very poor households. Female
education is positively correlated with reduction in

Alredaisy and Saeed
Factors Influencing Anemia and Night Blindness among Children Less than Five Years Old (0 - 4.11 Years) in
Khartoum State, Sudan
190
infant mortality rate (UNICEF, 1990; Brahman,
1988). Environmental health largely determines
nutritional status either through infections, depletion
of nutrients and illnesses or vice versa (United Nation
University, 1979; Osmani, 1997; Biesel, 1984).
The purpose of this research is to investigate
factors influencing nutritional status of children
suffering anemia and night blindness in Khartoum
State and to suggest some recommendations to reduce
the incidence of these two diseases.
2. MATERIALS AND METHODS
2.1. THE STUDY AREA
Khartoum States consists of the three towns of
Khartoum, Khartoum north and Omdurman (Fig.1).
Rate of population increase in Greater Khartoum was
4.92% in 1956, 7.76% in 1973, 8.75% in 1983, and
13.7% in 1993 (MFEP 1956–1993). The number of
persons per square kilometer was 55.6 persons in
1973, 85.5 in 1983 and 169 in 1993. In addition
Khartoum state accepted 39% of internal migration of
the country in 1983 and 45% in 1993 (MFEP 1956 –
1993). This population increase is reflected in the
expansion of informal squatter areas (El Bushra,
1995) and consequently higher demand for public
services.
Fig. 1: location of the three hospitals under study in Khartoum State
2.2. Data collection
The fieldwork took place in February 2009 through to
February 2012 in central specialized children hospitals
in each of the three towns, including Ga’far Bin Oaf
Hospital in Khartoum, Child Emergency Outpatient of
Omdurman Hospital, and Ahmad Grasim Hospital in
Khartoum north. A questionnaire was designed to
collect relevant nutritional data of children suffering
anemia and night blindness, as well as clinical data on
symptoms of anaemia and night blindness. To
estimate the sample size, based on 10% rate of
prevalence of nutritional deficiency diseases in
Khartoum State (Ministry of Health Khartoum
State,2009), the formula provided by Ministry of
Health, Khartoum State 2009, was used below:
n = sample size; Z = 1.96; P = prevalence
rate of nutritional deficiency diseases; q = 1 – P; d
= 0.05
The 10% prevalence, )96.1(n e rate of
nutritional deficiency diseases in Khartoum State is
used to get q which gave 138 individuals, as follows:

International Journal of Scientific Research in Knowledge (IJSRK), 1(7), pp. 189-201, 2013
191
n= (1.96)2 x 0.1(1-0.1)
(0.05)2
=
= 138
To determine the share of each Hospital from this
sample size, the equation of distribution in proportion
to size of population (children suffering nutritional
deficiency diseases) in each hospital is used, as
follows:
Cases of malnutrition in Khartoum (15628) = = 32%
Cases of malnutrition in Khartoum north (12602) = = 26%
Cases of malnutrition in Omdurman (20773) = = 42%
The total cases of malnutrition in Khartoum State = 49003; The share of each town (hospital) of the sample size
is determined as:
Khartoum = = 44
Khartoum north = = 36
Omdurman = =58
Before conducting the fieldwork, children
suffering anemia and night blindness were determined
by testing blood samples which was done by
Technicians working in each of the three hospitals, as
well as one of the authors. Symptoms of anemia and
night blindness were specified by Doctors during their
routine rounds in the hospital. Following that, the
questionnaires were filled with mothers of the sick
children whom were chosen purposively.
Hemoglobin measurement was done by Colorimeter,
by taking 20 micro millimeter of the blood of the 138
sick children in a test tube, and 4 milliliter of
Drabakin was added with 14.8 15 gram/deciliter
concentration and fully mixed, left for five minutes to
be read by Colorimeter. This gave that: Hemoglobin
gm/Deciliter X 6.8 (constant factor) = Hemoglobin %
Anthropometric measurements were done using
Salter’s scale to measure weight for age for all the 138
children to determine their nutritional status, where
the nutritional status index of weight for age is a quick
and accurate method to determine the nutritional
status of children less than five years old.
The evaluation of the nutritional status of children
less than five years old was done using tables of
estimation of rate by age – group which is published
by World Health Organization. The most indices used
to measure body to estimate nutritional status is
weight for age index. Measurement of weight is used
into observing gradual growth in body volume and
organs and helps into detection of early malnutrition.
Daily food weight intake was carried out using
electronic scale which weights for 3 kilograms. To
determine average of energy, protein, iron and
Vitamin consumed relative to the size of the
household. Children under study were divided into
age groups including less than one year, 1-3 years,
and 4- 4.11 years; This classification facilitates
comparison between food consumption according to
age groups of children less than five years old.
Nutrients intake were calculated using food
20773 ×100
49003
32 ×138
100
26 ×138
100
42 ×138
100
12602 ×100
49003
15628 ×100
49003

Alredaisy and Saeed
Factors Influencing Anemia and Night Blindness among Children Less than Five Years Old (0 - 4.11 Years) in
Khartoum State, Sudan
192
composition tables for population in Sudan, provided
by Sukar (1985). Conditions for rejection included all
children transferred from other States of Sudan
hospitals during fieldwork, and the study was
restricted to those who live permanently in Khartoum
State during the time of fieldwork.
Traditional porridge is made by boiling cereals
(Dura or Dukhn), and usually taken with sauce or
milk. Sauce is a mixture of vegetables, meat, oil, and
spices. In addition, cereals are fermented and cooked
to produce traditional bread (Kisra).
3. RESULTS
3.1. Socioeconomic characteristics
The results of the fieldwork depicted that 94.2% of the
mothers interviewed were married, 4.3% widowed,
and 1.4% divorced. The age structure of the
households depicts that, the age group of children less
than one year old represents 6.1%, and the age group
1-3 years represents 18.7%, while the age group 4-6
years represents 13.0%. They collectively represented
37.8% of the total number of the members of
households. The remaining percentage is distributed
among the other age groups where the age group 29+
holds 24.5% of the total number of members of
households. The population is young, and its pyramid
would be flat at the bottom and had hard tip on top.
Concerning level of education of mothers and fathers
of the sick children, results revealed dominance of
religious education by 45% among mothers and 23%
among fathers, and 35 % of mothers had completed
basic school compared to 40% among fathers, while
11% of fathers had completed secondary school
compared to 3% for mothers. Generally, fathers are
more educated than mothers. Religious education is a
form of informal education and does not qualify for
good reading and arithmetic.
The majority of the heads of the households
worked in the informal sector (43.5%), followed by
those who work as traders (8.7%), then government
employees (6.5%), while those who worked as
farmers and car drivers have equal percent (6%). This
reflected educational qualification of the interviewees
who were incompetent to compete for higher carriers,
and therefore involved into the daily paid wages
informal sector. However, 96.4% of the mothers
interviewed were housewives, and only 3.6% of them
got involved into informal sector. The average
monthly income among those who work in the
informal sector is 450 Sudanese Guinea (SDG), while
traders can get as high as 700 SDG, government
employees 350 SDG and car drivers 600 SDG. They
collectively give monthly average income of 563
SDG. This equals almost 100 USD per month or 3.3
USD per day to categorize them as urban poor. The
majority of the households (87.7%) did not have an
additional income or remittances from their relatives
outside Sudan, while 12.3% have additional monthly
income that on average is 225 Sudanese Guinea ( 38
USD).
The majority of the houses of the interviewees had
traditional pit latrines (82.6%), shared pit latrines with
neighbors (13.8%) and modern sewerage system
represented very low percentage (1.4%). The highest
percent of them have no bathroom (42.0%) and
depend on water vendors to get drinking water
(donkey carts) by 47.8%, followed by those who have
piped water supply (43.5%), while some others
depend on communal water pipes (8.7% ). The
majority of the houses have one room (42.0%),
followed by two rooms (31.2%), then three (15.2%)
and lastly four rooms (11.6%). These rooms range in
area where small rooms 12 m2 represents the highest
percentage (59.4%), followed by 16 m2 (38.4%), and
lastly 9 m2 (2.2%). They depend on natural ventilation
(73.9%), and range in number of windows per room
where, 4 windows dominated (43.5%), followed by
three windows (33.3%), and 2 windows (16.7%) and
one window (6.5%).
3.2. Symptoms of anemia and night blindness
Physical symptoms of anemia are loss of appetite
(8777%), paleness (9375%), and fatigue, eating clay
(29%) and eating snow (279%). The symptoms of
night blindness are night blindness (12%);
xerophthalmia (20%); Pinot spots (52%);
karatomalacia (12%), and Cornea ulceration (4%).
Hemoglobin measurement for children suffering night
blindness (Table1) revealed that children aged 1-3
years old had less hemoglobin concentration
compared to those aged less than one year. Table 1
also revealed that children aged 3-5 years old who had
equal concentration of hemoglobin. This means that
children aged 1-3 year old sufferd Iron deficiency
anemia compared to the two other groups. This
contrasted anemic children, where children aged 1-3
and 3-5 years old almost had equal concentration of
hemoglobin which exceeds that for children aged less
than one year old. This means that, children <1 year
old were more anemic compared to those aged 1-3,
and 3-5 years old.
The general striking feature of distribution of night
blindness and anemia among these three age groups
was that, each age group had acquired ⅓ of incidence
of a disease and the differences might be quite minor.
The distribution of children suffering night blindness
by sex by percent of hemoglobin (Table 1) depicted
that males had higher level compared to females. This
could be also seen for anemia. Children suffered

International Journal of Scientific Research in Knowledge (IJSRK), 1(7), pp. 189-201, 2013
193
anemia and night blindness distributed among
different age groups had very low percent of
hemoglobin below 60% standard, confirming for
prevalence of Iron deficiency anemia.
Table 1: Hemoglobin measurement (%) among children suffering Night blindness and Anemia by Age’s sex
Age / sex Night blindness Anemia
frequency % frequency %
<1 year 3 37 31 32.2
1-3years 18 34.8 73 38.8
3-5 years 4 37 9 39.1
Males 60 43.5 15 10.9
Female 53 38.4 10 7.2
Total 113 81.9 25 18.1
3.3. Levels of Iron deficiency malnutrition
Table 2 depicts Iron deficiency malnutrition in
Khartoum state. Acute Iron deficiency malnutrition
prevails with significant difference than the other
three levels of this type of malnutrition shown in the
table. The difference between normal and simple
levels of Iron deficiency malnutrition is quite small.
Acute Iron deficiency malnutrition is a reflection of
low nutritional status which makes children
vulnerable to childhood diseases. The distribution of
rate of Iron deficiency malnutrition by age groups of
these children suffering these two types of diseases
(Table 3), identified the highest rate among those aged
1-3 year old, followed by <1 year old and lastly by
those aged 3-5 years old. This means that acute
malnutrition remarkably prevails among children aged
1-3 year old, and significantly differs than the other
two age groups, and furthermore, the difference
between children aged <1 year old and children aged
3-5 years old is more than doubled. The distribution of
malnutrition by sex by age distinguishes males first
and then females. Females and males aged 1-3 years
suffered most. However, females are generally less
malnourished than males with difference of 8.6%
between them (Table 3).
Table 2: Iron deficiency malnutrition of children <5 years in Khartoum State
Iron deficiency malnutrition frequency %
Normal 11 8.0
Simple 13 9.4
Medium 27 19.6
Acute 87 63.0
Total 138 100.0
Note: These levels were determined according to weight for age of children suffering these two diseases in Khartoum State.
3.4. Type of food during pregnancy and lactation
Table 4 depicts types of type of food during
pregnancy and lactation. During pregnancy, mothers
used to consume vegetables, fruits, milk, cereals,
meat, and legumes abundantly. They also depended
on porridge with sauce; salad and yogurt which are
connected with likes and dislikes of pregnant women.
Lactating mothers largely depended on vegetables,
legumes, meat, cereals, milk, and fruits + sweet
porridge which are nutritionally valuable providing
protein, energy, iron, minerals, and vitamins. There is
no noticeable difference in food types during
pregnancy and lactation, except the introduction of
sweet porridge. Sweet porridge is a mixture of cereals,
sugar, oil, and ghee which activates producing much
milk for lactating mothers. Table 5 depicts that, the majority of mothers did
not take preventive or curative doses of Vitamin A
during pregnancy. This situation is somehow reversed
concerning Iron and Fevol. Folic acid recorded the
worst position among these four protective elements.

Alredaisy and Saeed
Factors Influencing Anemia and Night Blindness among Children Less than Five Years Old (0 - 4.11 Years) in
Khartoum State, Sudan
194
Table 3: Iron deficiency malnutrition by sex / age
Table 4: Types of foods during pregnancy and lactation (%)
Types of foods Pregnancy (%) Lactation (%)
Porridge with sauce 20.3 0.0
Salad 10.9 0.0
Salad with yogurt 9.4 0.0
Vegetables, legumes, meat, cereals, milk, and fruits 56.4 18.1
Vegetables, legumes, meat, cereals, milk, and fruits+ sweet porridge 0.0 81.9
Total 100 100
Table 5: Ante-Natal Drugs Given to Mothers of Night blindness and Anemic Children in Khartoum State
3.5. Food type of children suffering anemia and
night blindness
The majority of households depend on fathers (63.8%)
for food provisioning, while few households depend
on mothers (10.1%), or relatives (26.1%). The
majority of the mothers (61.6%) perceive that breast
feeding is important and prevents childhood diseases,
while some others (38.4%) ignore that. However,
97.1% of the mothers commence breastfeeding 3 days
after delivery. The average period of breast feeding is
eleven months. Mothers who did not breast feed their
children; have attributed that to death of a mother
(25%), infection of mother with tuberculosis or
psychiatric diseases (50%), or the child being sick
(25%).
During the early 6 months of a new born baby,
89.9% of the mothers used to breast feed their
children and give supplementary food, while few
mothers (7.2%) exclusively breastfeed, and still very
few mothers (2.9%) wholly depend on supplementary
food. During the second half of the first year of a child
(6 - 12 months), very few mothers (0.41%) depend on
breast feeding as the main source of feeding their
children, while 87.7% of them combine breast feeding
with supplementary food, and 10.9% give their
children supplementary food only. This means that,
the majority of mothers did not change their
behavioral pattern of feeding their children throughout
the first year of a child life. However, children prefer
biscuits (14.3%), soft drinks (25.4%), and chips
(12.3%), juice (9.4%), cakes (5.8%), and sweets
(8.6%) as supplementary food types. This indicates to
shift from traditional food types to ready - made food
among urban households. The majority of children
(63.8%) take three meals a day, 21.9% take four meals
a day, 2.9% take more than four meals a day, and
11.6% take two meals a day. The majorities of the
households share the same dish (84.8%), or eats
separately (15.2%).
Table 6 depicts average daily intake of energy,
protein, iron, and vitamin A among children suffering
anemia and night blindness. From the table, children
aged less than one year old ranked first in energy
intake compared to other two groups of 1-3, and 4-6
year old. Taking two age groups of children together,
children aged <1 year old + 4 - 6 years old ranked first
and followed by those aged <1 + 1- 3 years, with very
small difference between them.
Drugs taken
during
Pregnancy/
Responses.
Vitamin A Iron others
preventive Curative Curative Folic Acid Fevol
Frequency % frequency % frequency % frequency % frequency %
Yes 16 11.6 4 2.9 47 34.1 2 2.9 29 21
No 118 85.5 118 85.5 91 65.9 134 97.1 109 79.0
total 134 97.1 122 88.4 138 100 138 100 138 100

International Journal of Scientific Research in Knowledge (IJSRK), 1(7), pp. 189-201, 2013
195
Taking daily protein intake by age group of these
sick children, children aged less than 1 year old
ranked first, followed by 4-6 year old, and lastly 1- 3
year old. Taking two age groups together, had ranked
children aged <1 year old + 4-6 years old first, and
those aged 1 + 1- 3 years old second, while children
aged 1-3 + 4-6 came lastly. The general average
intake of protein for the three age groups reveals low
protein intake among children aged less than five
years old in Khartoum State. Moreover, ranking daily
intake of iron by age groups of these sick children
puts children aged <1 year old first, 4-6 year second,
and 1-3 year old last. There is slight difference in
daily iron intake when two age groups of children are
taken together. This is more particular to children in
the age groups of <1 + 1- 3 and 1-3 + 4-6 years old.
Table 6: Average daily intake of energy, protein, iron, vitamin A by age among children suffering anemia and night blindness
Table 7 depicts average hemoglobin measurement
by age groups of children by daily intake of animal
and plant protein. Highest percent of hemoglobin
among children aged less than one year old is
coincided with highest levels of animal and plant
protein intake. This is similarly seen among children
aged 4-6 year old. Taking two age groups together had
ranked children aged -1 + 4 - 6 year old first, and
followed by children aged -1 + 1-3 year old children,
with very small difference between them. Increasing
hemoglobin is associated with increasing protein,
confirming for better nutritional status of these
children. However, the general average of
hemoglobin, as well as the general average of both
types of protein is far below the recommended levels
for children to remain healthy. The fact here is that, an
increase in consumption of legumes will reduce Iron
absorption due to Fianite and Vitamin C which
reduces blood hemoglobin.
Table 7: Average hemoglobin measurement (%) and daily intake of animal and plant protein among children suffering anemia
and night blindness by age groups
3.6. Factors influencing children suffering anemia
and night blindness
Table 8 depicts highly significant probability
confirming the relationship between household
monthly income and number of meals a child takes
per day. This implies increased food expenditure and
higher level of energy; protein; iron; and vitamin
intake, as well as consumption of better quality
protein, with increasing income. Less income will of
course result in prevalence of anemia and night
blindness in the study area. However, the relationship
between nutritional status of children suffering anemia
and night blindness and type of food of a mother
Age groups No. Energy (calorie) Protein (g) Iron (milligram) Vitamin A (microgram)
<1 50 1127777 32675 5376 123977
1-3 153 854273 24877 4070 85870
4-6 106 975676 27974 4577 97977
<1 + 1- 3 66 547670 15575 2577 53474
<1 + 4-6 74 548473 15977 2675 63879
1-3 + 4-6 176 490076 14070 2277 46278
<1 + 1-3 +4-6 76 371574 10677 1775 36674

Alredaisy and Saeed
Factors Influencing Anemia and Night Blindness among Children Less than Five Years Old (0 - 4.11 Years) in
Khartoum State, Sudan
196
during pregnancy gave highly significant probability
(Table 8). The food types during pregnancy (table 4)
reflect household monthly income level, educational
attainment, and other socioeconomic characteristics of
the surveyed households in the study area.
Table 8: Chi-Square test for relationships between some socioeconomic factors and nutritional status of children suffering
anemia and night blindness in Khartoum State
The relationship between sex and age structure of
children suffering anemia and night blindness and
frequency of daily intake of bread and cereals (P =
0.0008), milk and milk products (P= 0.0008); legumes
(P = 0.0007); vegetables (P = 0.0001); fruits (P =
0.0005); and other food types (p = 0.0004); are
positive and highly statistically significant which
suggests for influence of food nutrients on anemia and
night blindness during early childhood. There is
highly significant relationship between nutritional
status of children suffering anemia and night
blindness and number of children under five year old
in the household (P= 0.0002). This points out to
decreasing food nutrients intake with increasing
number of persons sharing the common dish which its
protein content was originally low. This is further
depicted by the relationship between nutritional status
of these sick children and ideal method for food
distribution in the family (P = 0.027). Since energy
and protein intakes (Table 6) were less and the
households are big enough, it is expected to have
positive relationship between household size and
nutrition status of these sick children. In addition,
relationship between hemoglobin level (%) and
amounts of animal protein consumed is positively
statistically significant (P= 0.01); and similarly with
plant protein (P= 0.03).
However, other factors influencing nutrition status
of children less than 5 years old in the study area
might include those operating at the national level.
They are financial inflation and corruption; absence of
social development, insufficient productive capital

International Journal of Scientific Research in Knowledge (IJSRK), 1(7), pp. 189-201, 2013
197
investment in agriculture and industry, lacking
development policies that care or rural – urban
development and armed conflicts.
4. DISCUSSION
The investigation of nutritional status of children
suffering anemia and night blindness in Khartoum
State suggests low hemoglobin rate; inadequate food
intake and prevalence of malnutrition by age and sex
with major and minor differences. Males suffering
anemia and night blindness are more malnourished
compared to females. This agrees with the fact that,
generally children suffer night blindness between
second and fifth year of childhood, with more
emphasis to males than females, but differs
concerning anemia which prevails more between 6 to
8 months of a childhood, but with more emphasis to
males than females (Hassan et al., 2002). The high
rate of hemoglobin concentration among children
aged less than 1 year old might be attributed to more
care given to a lactating mother in Sudanese culture
which effectively supports neonatal period and early
childhood, where relatives could supply with
nutritional food types such as sweet porridge.
Children aged 1-3 year old have less hemoglobin
concentration and suffers Iron deficiency anemia
compared to the two other two groups. This might be
attributed to average short period of parities and to
poverty which make the majority of Sudanese to
afford living costs in situations of accelerating
financial inflation. However, prevalence of breast
feeding in the study area is attributed to the awareness
of mothers to its nutritional value to a newborn child,
and to the inherited Islamic culture which enhances
mothers to breast feed their children for two complete
years. It might be also attributed to the fact the
majority of urban households are incapable to
purchase readymade food for their children where 70
to 80% of urban population live below the poverty
line (Hamid, 2000), and also many of the mothers are
mainly housewives who have devoted themselves to
child bearing. However, this is supported by the fact
that, during pregnancy and lactation, mothers used to
consume vegetables, fruits, milk, cereals, meat, and
legumes abundantly compared to less amounts of
these food types during lactation.
Prevalence of low weight and malnutrition among
children less than 5 years old in Khartoum State
(Table 2) is almost similar to the 50 % cited by FAO
and WFP for pre-2001 studies for North Kordofan
state (FAO/WFP, 2006). However, it was higher than
the most recent report Sudan household health survey
of 42.9% (SHHA, 2006). The result was also higher
than all previous studies carried out in Sudan,
although it is similar to that by Al Jaloudi for children
less than five years old living in poor urban Khartoum
state (Al Jaloudi, 2000). In addition, the difference in
malnutrition is possibly due to geographic reasons. In
Khartoum State, squatter areas have expanded rapidly
in recent decades, occupied by poorest people who are
generally facing inadequate food intake and
unhygienic residential environment (Alredaisy and
Davies, 2003, Babiker and Alredaisy, 1997).
However, since the majority of mothers did not take
preventive or curative doses of Vitamin A during
pregnancy (Table 5), this makes mothers and new
born infants vulnerable to many childhood diseases.
However, this situation might be milder when putting
into consideration that 61% of the mothers have been
vaccinated, 32% partially vaccinated, and only 7%
were not vaccinated. The general average intake of
energy for the three age groups reveals low energy
(calories) intake among children aged less than five
year old in Khartoum State. The general average of
daily iron intake depicts very low level among these
children. This picture is also seen when daily intake of
Vitamin A is taken into consideration.
Average daily intake of energy, protein, iron, and
vitamin A by age groups of children suffering anemia
and night blindness had identified children aged less
than one year as the most advantageous group
compared to the other two groups. In addition, the
general average of each of these nutrients is far below
the recommended level for children to remain healthy
in Arica and Sudan. Comparing macronutrients daily
intake in the study area (Table 6) with the study by
Ministry of Agriculture and Forestry of Sudan (FSU,
2005) puts the study area below by that there are less
protein, carbohydrates and lower energy intakes.
There is less animal protein; vitamins, minerals
consumed and abundant cereal are consumed. In the
study area, fat and carbohydrates (calories) consumed
were lower than the recommended values (Katch,
1983) and for population in Africa which is 2041.7
calories (Latham, 1997). This study agrees with
Mohammed's study in Al Shigla area in east
Khartoum State, which indicated to imbalanced intake
of food types where legumes and cereals are
abundantly consumed while meat, fish and chickens
are less consumed among surveyed households
(Mohamed, 1999). It also agrees with Ali's study in
north state of Sudan where cereals are the main source
for poor households although cereals are deficient in
vitamin A, and 41% of the sample suffers vitamin A
deficiency (Ali, 2005). Energy obtained by higher
protein and carbohydrates intakes was more than
double the value obtained by excess fat intake in this
study (FSU, 2005). Cereals highly contribute to
energy and protein intake in the study area, a situation
similar to rural Philippines where 361g/person/day are
consumed there (Florentino, 1996). Animal protein

Alredaisy and Saeed
Factors Influencing Anemia and Night Blindness among Children Less than Five Years Old (0 - 4.11 Years) in
Khartoum State, Sudan
198
sources such as meat and milk provide less than the
recommended value which is 55.3g (FSU, 2005).
The high fertility rate of population of the study
area agrees with general demographic trends in Sudan
where total fertility rate was 5.9 births per woman in
1999; annual population growth rate was 2.53 %
between 2003 and 2007 and the natural rate of
increase was 41.23 per 1 000 in 2006 (Ministry of
Health, Sudan. 2008). Dominance of Low income
groups in the study area agrees with figures in Sub–
Saharan Africa where about half the population is
living below the poverty line, with both numbers and
percentage on the increase (Alredaisy, et al., 2001).
Generally, growth of towns and cities in Sudan has
been accompanied by growing numbers of poor and
vulnerable urban dwellers (Sara Pavanello, 2011).
Although Sudan is rich in natural and human
resources, 77.5% of the households surveyed in north
Sudan were on or below the poverty line (MOL and
ILO, 1997]. The study by the United Nations
Development Program in 2005 reported that 75% of
north Sudan population as poor and the majority
(80%) is concentrating in rural areas where 30% of
them suffered from extreme poverty (United Nations
Development Program, 2005). The majority of the
urban poor are dependent upon marginal livelihood
activities in the informal economy, and their access to
safe and sustainable livelihoods is extremely unstable
(Sara Pavanello, 2011). However, factors influencing
income attainment in the study area might include
those operating at the national level including absence
of social development and insufficient productive
capital investment (UNDP, 1998), ill-conceived
development policies and armed conflicts (Zeng,
2003).
Fieldwork results depicted positive relationship
between number of meals a child takes per day and
household monthly income (table 8). Some
researchers are convinced that increasing income
leads to increasing food intake (Strauss 1984,
Maxwell et al 2000) while some others believe that
poor households spend their additional incomes on
more expensive foods such as finer cereals, meat or
dairy products which do not necessarily yield more
energy. The fieldwork results support the first
assumption that increasing income had positively
increased number of meals a child takes per day and
therefore more energy and protein intakes are
expected. Less income resulted in prevalence of
malnutrition in the study area, thus decreasing income
might lead to marginal or sub-optimal intakes of
energy and protein resulting in more prevalence of
anemia and night blindness. In addition, it is expected
that more energy and protein will positively correlate
with three meals per day other than with two meals.
Higher level of protein intake implies consumption of
better quality protein with increasing income. There is
significant increase in energy and protein intakes with
increasing incomes and a similar increase that was
highly significant were recorded for protein (Ibrahim,
2008). Many studies in Sudan referred low weight
among young children to unequal income distribution,
vertically between incomes and horizontally between
rural and urban areas (UNDP 2006). Furthermore,
increased income will increase food expenditure in the
study area as has been confirmed in rural western
Kordofan State (Alredaisy and Suleiman, 2011) that
had significantly increased energy and protein intakes
in the study area for both energy, probability of 0.042,
and for protein with probability of 0.025, and
significant relationship exists between food
expenditure and undernutrition prevalence in the study
area with probability of 0.004.
The relationship between nutritional status of
children and type of food consumed during pregnancy
is highly significant (0.0056). This might be attributed
to household monthly income, educational level of a
mother or a father where the majority has attained
religious or basic education. Mothers' literacy
positively effects low weight- for- age compared to
illiterate mothers who have more stunted children in
Sudan (FAO/WFP, 2006), and in Khartoum State
(Magboul et al, 2000) and SERISS (1988) and SMCH
(1995) results where mothers' educational level was
remarkably influential.
One of the main reasons for generally declining
levels of food consumption in the study area is
attributed mainly to the high living costs and high
inflation rates in Sudan. The high expenditure on food
in situations of low income, big households and
illiteracy has many consequences. One consequence is
that, a low-income household's consumer surplus for
food is very high, amounting to a substantial
proportion of its total income. This has important
consequences for the economic appraisal of food
supply. With regard to affordability, households are
unable to pay for food at the current cost. High
proportion would be unable to pay the actual costs of
food. The revenue that may realistically be expected
to be recovered from these households in the future
lies somewhere between what they are able to pay and
what they are presently willing to pay. Another
consequence is the lack of elasticity and repercussions
on expenditure for food would imperatively be
retarded. The high price of food in urban Sudan is
probably a major cause of the malnutrition prevalent
in the squatter areas (Sandy et al, 1992). Decreasing
income led to marginal or sub-optimal intakes of
energy and protein resulting in more prevalence of
under-nutrition in rural western Kordofan of Sudan
(Alredaisy and Suleiman, 2010). Many studies in
Sudan referred low weight, stunting and wasting

International Journal of Scientific Research in Knowledge (IJSRK), 1(7), pp. 189-201, 2013
199
among young children to unequal income distribution,
vertically between incomes and horizontally between
rural and urban areas (UNDP, 2006).
5. CONCLUSION AND RECOMMENDATIONS
The general conclusions of this study are as follows:
1- Children aged less than five year old living in
Khartoum State are suffering anemia and night
blindness.
2- Malnutrition and underweight are prevalent in
Khartoum State.
3- Promotion of community and child nutrition is a
necessity in the study area.
4- Many interrelated socioeconomic factors are
influencing anemia and night blindness.
5- Promotion of child nutrition and urban living
conditions is a necessity in the study to combat these
two diseases.
Based on that, some suggestions could be
presented. Firstly, breast feeding should be enhanced
from delivery up to six months of a child’s age, and
should be accompanied by supplementary feeding
thereafter up to the completion of two years of a child
age. Secondly, more care should be devoted to
qualitative and quantitative complementary feeding.
Thirdly, introduction of balance diets rich in vitamin
A, and Iron when a child completes six months of age,
and during pregnancy and lactation is a necessity.
Fourthly, nutrition education should be introduced and
enhanced among mothers to accept knowledge about
good child feeding. Fifthly, urban poor should be
supported by appropriate socioeconomic development
programs to curb financial inflation which adversely
depriving this segment of the society. Promotion of
urban living conditions could be through provisioning
adequate housing conditions; income generation
sources to poor urban households; stopping
accelerated financial inflation; and reducing rates of
rural - urban migration to avoid addition of more
urban poor and growth of squatter settlements. In
addition, Sudan has to work hardly to solve political
problems with South Sudan Republic and the
rebelling militia in Darfur, southern Kordofan, and
Blue Nile to achieve stability that will reflect on
development of agriculture and industry that will
certainly promote nutrition status of the young
growing generations of Sudanese youth.
REFERENCES
Al Jaloudi AE (2000). Assessment of the nutritional
status and household food security in the poor
urban areas in Khartoum state: case study
‘’Marzouk in Omdurman’’. Unpub. PhD.
Thesis, University of Khartoum, Sudan.
Ali AM (2005). Vitamin A deficiency and nutritional
status among basic schools students in Dongola
town. M Sc. University of Khartoum.
Alredaisy SMA, Sulieman HI (2011). Assessment of
nutritional status of children less than 10 years
old in rural Western Kordofan, Sudan’’. An
International Journal of Multidisciplinary
Integrative Science and Applications. India.
IIOAB Journal 2 (4): 40-49.
Alredaisy SMA, Davies HRJ (2001). Food insecurity
in Sub-Saharan rainlands: Um Sial, a village in
White Nile state, Sudan. The Arab World
Geographer, 3(1): 19–30.
Alredaisy SMA, Davies HRJ (2003). The ecology of
malaria in urban squatters of Greater Khartoum,
Gamier area in Omdurman. Arab World
Geographer Journal, 6(3): 178-193, Canada.
Babiker A, Bagi A, Ghani, Alredaisy SMA (1997).
Evaluation of food situation and survival
strategies in urban Sudan, case studies from
Omdurman. Bayreuther Geowissenschaftliche
Arbeiten, 16: 291-300. Germany.
Biesel WR (1984). The metabolic effects of infection.
Progress in Food. Nutr Sci 8:43–5.
Brahman GNV (1988). Intra family distribution of
dietary energy- an Indian experience. Ecol of
Food Nutr., 22: 56–64.
Cambrez C, El Magboul B 1.1998. Food security and
nutrition situation in north Sudan. FAO/WFO
Crop assessment mission for Sudan. Khartoum,
Sudan.
El Bushra, El Sayed (1995). Two Million Squatter
Settlements in Khartoum Urban Complex. The
Dilemma of Sudan National Capital
GeoJournal, 34(4): 505-514.
FAO/WFP (2006). Special report, crop and food
supply. Assessment mission to Sudan, 8-
27/10/2005, FAO, Rome.
FAO/WFP (2006). Special report, crop and food
supply. Assessment mission to Sudan, 8–
27/10/2005, FAO, Rome.
Florentino RF (1996). Contribution of major food
items on calorie and protein in takes in
Filipinos. Joint technical workshop of the micro
impacts of macroeconomics adjustment policies
and the Philippine Institute of Development
Studies technical resources project, 11-
12/4/1996, Calatagen, Phillip.
FSU (2005). Food security annual report. Food
Security Unit, Ministry of Agriculture and
Forestry, Khartoum, Sudan.
Hamid GM (2000). Local level authorities and local
action in Greater Khartoum. The Arab World
Geographer 3:230-48.
Hassan S, Hindi H (2002). Human Nutrition. First
Edition, Alexandria, Egypt (Arabic).

Alredaisy and Saeed
Factors Influencing Anemia and Night Blindness among Children Less than Five Years Old (0 - 4.11 Years) in
Khartoum State, Sudan
200
Ibrahim HS (2008). Poverty, food security and
malnutrition in an urban – rural setting: case
study the former west Kordofan state.
Unpublished PhD thesis, University of
Khartoum.
Katch F (1983). In nutrition, weight control and
exercise. 2 nd edition, Lea and Bebiger,
Philadelphia.
Latham, H C (1979). Human nutrition in tropical
Africa. No.11. Rev.1. RAR. Rome. Ithaca.
USA.
Magboul BI, Mohammad KA, El Khalifa MY (2002).
Dietary iron intake and prevalence of iron
deficiency anemia among underfive children in
Khartoum state. Report to EMRO/WHO,
Project EM/ICP/RPS/002.
Maxwell D (2000). Urban livelihoods and food
nutrition security in Greater Acccra, Ghana.
IFPRI/Noguchi Memorial Institute for Medical
Research/WHO. Accra, Ghana.
Ministry of Finance & Economic Planning, MFEP
1956-1993: Population censuses of Sudan 1956
– 1993, Khartoum, Sudan.
Ministry of Health, Sudan (2008). Annual health
statistics report: Health statistics. Khartoum:
National Center for Health Statistics.
Ministry of Labor and International Labor
Organization (MOL/ILO )(1997). Trends and
profiles of poverty in Sudan [1990–2008].
Ministry of Labor and International Labor
Organization, Khartoum.
Mohammed, F O (1999). Iron deficiency anemia
among children less than five year old in
Alshigla area, Khartoum State. MSc. University
of Khartoum.
National Ministry of Health (2008). Guidelines for
combating micronutrients deficiency. National
Ministry of Health, Khartoum (Arabic).
Osmani SR (1997). Poverty and nutrition in south
Asia. ACC/SCN Symposium, Katmandu,
March 1997. Nutrition Policy Report 16: 23–
51.
Sandy C, Kinnear J (1992). Elasticity of demand for
water in Khartoum, Sudan, Social Science &
Medicine, Volume 34, Issue 2, Pages 183-189
Sara Pavanello (2011). Urbanization in Sudan: An
Overview of International Engagement
http://www.refugeecooperat
SERISS Sudan emergency and recovery information
and surveillance. 1988. Ministry of Health,
Directorate of primary health care/ nutrition
Department, Department of Statistics.
Workshop, Friendship Hall, 22-25 Feb.,
Khartoum, Sudan.
SHHA (2006). Sudan household health survey.
National report, Government of Sudan,
WFP/UNEFPA/WHO/USAID/UNICEF,
Khartoum, Sudan.
SMCHS Sudan maternity and child health survey
(1995). Ministry of Health, Khartoum, Sudan.
Strauss J (1984). Joint determination of food
consumption and production in rural Sierra
Leone, estimate of a household mode. Journal
of Develop. Econ., 14:19-103.
Sukkar MY (1985). In human nutrition. Khartoum,
Sudan.
United Nations Development Program (2006).
Macroeconomic policies for poverty reduction,
the case of Sudan. October 2008, Khartoum.
United Nations Development Program (2006).
Macroeconomic policies for poverty reduction,
the case of Sudan. Khartoum.
United Nations Development Program (1998). Sudan-
Common Country Assessment. UNDP,
Khartoum.
UNICEF (2008). Nutrition. www. UNICEF.
org/Arabic.
UNICEF (1990). Strategy for improved nutrition of
children and women in Developing Countries.
UNICEF, New York.
United Nation University ‘’UNU’’ (1979). The
nutritional consequences of acute and chronic
infections. Protein energy requirements under
conditions prevailing in Developing Countries:
current knowledge and research needs. Food
Nutr Bull S, (1): Tokyo.
United Nations Development Program (2005). Human
development report. Oxford University Press,
Oxford.
United Nations (1977). Desertification: its causes and
consequences. Pergamon, Oxford.
World Health Organization (2009). Guidelines for
combating micronutrients deficiency. WHO.
Geneva.
Zeng N (2003). Drought in the Sahel. Science, 302:
999–1000.

International Journal of Scientific Research in Knowledge (IJSRK), 1(7), pp. 189-201, 2013
201
Samir Mohamd Ali Hassan Alredaisy is Associate Professor at University of Khartoum. He received his
first degree from University of Khartoum in 1983/ He obtained Masters from University of Khartoum,
and PhD from University of Wales, Swansea in 1993. His current research focuses on Medical
Geography of Sudan. To date, he published more than 40 referred papers, and 20 textbook and
reference.
Haram Omer ELHag Seed is a Nutritionist at Health Unit in Central State (Gezira) in Sudan. She
obtained her first degree in nutrition from Ahad University and her Masters in Science from University
of Khartoum. To date, she published two referred papers. Her current research focuses on nutrition
problems in Gezira area, particularly among prgnat mothers and newborn children.

International Journal of Scientific Research in Knowledge (IJSRK), 1(7), pp. 202-211, 2013 Available online at http://www.ijsrpub.com/ijsrk
ISSN: 2322-4541; ©2013 IJSRPUB
http://dx.doi.org/10.12983/ijsrk-2013-p202-211
202
Full Length Research Paper
Remediation of Tetrachloroethylene -Contaminated Soil with Zero Valent Iron
Utilizing Electrokinetic Reactors
Maryam Taghizadeh1, Daryoush Yousefi Kebria
2,*
1Department of Civil and Environmental Engineering, Babol Noshirvani University of Technology, Iran
2Assistant Professor in Civil Engineering, Babol University of Technology, P.O. Box: 484, Babol, Iran.
*Corresponding Author: [email protected]
Received 21 April 2013; Accepted 25 May 2013
Abstract. This study was conducted to evaluate an integrated technique a combination of electrokinetics (EK) and zero-valent
iron and a nonionic surfactant, Triton X-100(TX-100), which was selected as the solubility-enhancing agent for the
remediation of soils-contaminated with Tetrachloroethylene (TCE). Four Lab-scale tests (T1 toT4) were conducted to
investigate the performance of EK-PRB on TCE removal from soils. Electrical current, cumulative electro-osmosis flow and
the pH in anode and cathode reservoir were measured every 24h during the run. Results show that coupling EK with ZVI- PRB
would greatly enhance the removal efficiency of TCE from soils. With this method TCE removal would generally be increased
by approximately 40% when EK is coupled with PRB as compared with EK alone. The highest TCE removals were
respectively recorded in T4 about 80% and 55% near to the anode and cathode of the electrokinetic cell.
Key words: Combination of Electrokinetics and zero-valent iron, Tetrachloroethylene, Surfactant, Triton X-100, soil, Electro
osmosis
1. INTRODUCTION
Chlorinated organic compounds (COCs) refer to the
substitution of one or more hydrogen in aliphatic and
aromatic hydrocarbons and their derivatives by
chlorine. COCs are widely used in the fields of
chemistry, medicine, electronics, pesticides, ect. Many
COCs are endocrine disturbance substances; show
carcinogenic effects, and have been listed as priority
pollutants by the US Environmental Protection
Agency (USEPA). When released into the
environment, COCs are transported in both air and
water. However, COCs are chemically stable and
difficult to destroy, and they are eventually deposited
in soils and sediments due to their hydrophobic it. Soil
and sediments contaminated with COCs are long-term
sources of pollutants and pose great threats to human
health and ecosystems. Therefore, remediation of
these contaminated soils and sediments is of great
importance (Reddy and Camesella, 2009).
Various chlorinated organic compounds, including
tetrachloroethylene (TCE), are widely used as
solvents in various industries. When entering the
subsurface environment, they generally would pose
great threats to the environment as well as human
health. For example, TCE is harmful to the central
nervous system of human bodies and can enter the
body through respiratory or dermal exposure.
Tetrachloroethylene dissolves fats from the skin,
potentially resulting in skin irritation. Because of
these hazards to the environment and potential
groundwater contamination, remediation of TCE
contaminated soils is necessary to reduce public
health risk (WHO, 2006).
Few remediation technologies are available for the
removal of chlorinated hydrocarbon from rather low
hydraulic permeability media, such as clay. The use of
an electrokinetic (EK) process in soil remediation has
received increasing attention worldwide because of its
unique applicability to low-permeability soils
(Khodadadi et al., 2011; Gholami and Yousefi Kebria,
2012).
Electrokinetics, also known as electroreclamation,
electrokinetic soil processing, electrokinetic
extraction, electrodialytic remediation and
electrochemical decontamination is the application of
a DC current to induce the movement of chemical
species. Electrokinetic phenomena comprise of (i)
electromigration- the movement of charged ions due
to an electric potential difference, (ii) electrophoresis-
the movement of colloids or macromolecules due to
an electric potential difference and (iii)
electroosmosis- the bulk movement of water due to an
electric potential difference. Electrokinetics is not
affected by the hydraulic conductivity of the soil
matrix, and thus has the potential to be a treatment
technique for soils possessing low hydraulic
conductivities (Van Cauwenberghe, 1997).
EK has been reported to be successful and a cost-
effective method to treat both organic (Yalcin et al.
1992, Weng et al., 2003) and inorganic contaminants
(Coletta et al., 1997; Alshawabkeh et al., 1999; Sah

Taghizadeh and Kebria
Remediation of Tetrachloroethylene -Contaminated Soil with Zero Valent Iron Utilizing Electrokinetic Reactors
203
and Lin., 2000) from low permeability soils (Weng et
al., 2007).
To improve the efficiency of EK remediation for
TCE-contaminated soils, the combination of EK with
other techniques may provide a solution. For example,
the effect of electrokinetic on the microbial
remediation of PCP contaminated soil was
investigated. However, the introduction of
microorganisms into soil with low permeability is still
a problem in the bioelectrokinetic process.
Comparatively, electrokinetics coupled with a
permeable reactive barrier (PRB) can simultaneously
realize the EK transport and PRB destruction of
contaminants. Great enhancement has been recorded
for the treatment of contaminants in soils by EK-PRB
(Li et al., 2011).
In the present study, a PRB filled with Fe particles
was installed between anodes and cathodes in order to
reach an enhanced remediation of TCE-contaminated
soil. When TCE transports through the PRB, it can be
dechlorinated to ethylene, which has much lower
toxicity and larger aqueous solubility than TCE. The
electroosmotic removal of ethylene can therefore be
achieved easily.
Because TCE is weakly water-soluble and has
preferential sorption in soils, it is very difficult to
drive out via electro-osmosis. As a result, surfactants
are the facilitating agents that both lower the
interfacial surface tension and increase the solubility
of TCE through a process called micellar stabilization
Surfactant-enhanced electro-osmosis remediation
techniques and surfactants can be adsorbed at
interfaces and reduce interfacial energies. Therefore,
surfactants can be used to mediate mass transport in
the dechlorination process. Surfactant enhanced
remediation has been suggested as a promising
technology for the remediation of contaminated soils
and groundwater (Zheng et al., 2009).
The objectives of this study are (1) to assess the
remediation efficiency of PCE contaminated soil by
electrokinetics coupled with Pd/Fe PRB, (2) to
evaluate the migration and removal of PCE and its
dechlorination products during remediation process.
Triton X-100 (TX-100) was chosen as the
enhancement agent because of its solubility-enhancing
capacity for TCE.
2. MATERIALS AND METHODS
2.1. Chemicals and materials TCE and microscaled zero-valent iron was purchased
from DAE JUNG, Korea. Triton X-100 (TX-100) was
from Merck and was used as received.
The model soil in this study was collected from the
top soil layer (50 cm in depth) from farmland located
in northern Iran. The physical-chemical properties of
soil are listed in Table 1. The texture of this soil was
classified as clay.
Table 1: Soil properties
Characteristics value
Texture clay
Organic Content (%) 7.7
Soil pH 7.6
Density (g/cm3) 2.71
Optimum Moisture (%) 25
Porosity (%) 40.3
Permeability (cm/s) 6×10⁻³
The soil samples were air-dried and passed through
a 2mm sieve, then for preparation of simulated TCE-
contaminated soil at a concentration of 600 mg.kg-1
dry soil, was made by adding 600 mg TCE and 100
mL acetone to 1000 g dry soil, and then this was
thoroughly stirred to obtain simulated TCE-
contaminated soil. The simulated soil was then dried
in air for 24h and stored in the dark bottle for
treatment. The uniform distribution of TCE in
simulated TCE-contaminated soil was verified by the
consistency of gas chromatography (GC) analysis for
three random samples.
2.2. EK-PRB experiment
Lab-scale EK-PRB experiments were conducted in a
setup as shown in Fig.1. The setup was comprised of
two Plexiglas soil columns (4.5*4.5*6cm), one PRB
compartment (1*4.5*6cm) and two pairs of electrolyte
compartments (4.5*5*6cm) which were used as the
EK cell. Perforated graphite electrodes (50*40*5mm)
were used as anodes and cathodes. The anode flushing
solution was siphoned from a stocking bottle via a soft
rubber tube, which was attached to a piston in order to
control the inlet flow. The electro-osmotic flow in the
cathode was collected and measured with a 500mL
cylinder whose top was sealed with gummed tape to
avoid the evaporation of water. The constant potential
was supplied by a DC power (DAZHENG, 30V/5A).
The electric current was monitored with a multimeter.
Electrical current and cumulative EOF was measured
every day during the run. Contaminated soil was prepared by mixing a TCE
solution and soil with a water content of 25% in order
to reach 600 mg TCE per kilogram of dry soil. About
400 g of contaminated soil were used. This was
compacted in five additions under a static load of 50
kPa; leading to specimen dimensions of 4.5*4.5*6 cm.
Filter paper was sequentially attached to each end of
the column to avoid the leakage of soil particles.

International Journal of Scientific Research in Knowledge (IJSRK), 1(7), pp. 202-211, 2013
204
Fig. 1: Schematic diagram of EK-PRB setup
The acid-washed iron particles were then blended
with acid-washed quartz sand (with the initial mass to
mass of 1:1) to ensure even dispersion and impede
clogging by iron precipitation. The columns were
weighted and assembled with the electrodes and
compartments; meanwhile approximately 30 g of PRB
materials was loaded into the PRB compartment.
Four tests were carried out with parameters as
listed in Table 2. In T3-T4 the surfactant was used in
order to increase efficiency. In T3, surfactant was
used as an anode-flushing solution and in T4,
surfactant is mixed with soil. The electric field
induced significant pH changes at both cathode and
anode. Furthermore, in order to prevent, or control,
the resulting changes in soil chemistry, the pH of
either electrolyte could be controlled with manual
addition of either sulphuric acid (at the cathode) or
sodium hydroxide solution (at the anode). As shown
in Table 2, the control experiment of T1 was
conducted to depict the transport behavior of PCE
under electric field without PRB. From T2 to T4, PRB
was installed at the position of 0.5 (normalized
distance from anode).
Table 2: Associated parameters with EK-PRB tests
No. PRB Anode
Column
Cathode
Column
Duration(day)
T1 No Spiked Soil Spiked Soil 10
T2 Yes Spiked Soil Spiked Soil 10
T3 Yes Spiked Soil Clear Soil 10
T4 Yes Spiked Soil Spiked Soil 10
2.3. Analysis of the samples
At the end of the EK experiments, soil was extracted
from the electrokinetic cell and divided into three
sections along the length of the cell to analyze the
spatial distribution of the pH and residual TCE
remaining in the soil. pH was measured with a pH
meter (HANNA, HI-8314, Italy) by mixing 3 g soil
sample with 7.5 ml NaCl 0.02 M. For the analysis of
TCE in moist soils, samples were dried in air for
about 48h. Each sample was prepared twice. Then, the
samples passed through a 2mm sieve. In order to
extract the target organics from the soil, 2 g dry soil
was mixed with 2 mL 0.1 M sulfuric acid and 5 mL
hexan for shaking 24 h. The chlorinated organic in the
extractor were determined by gas chromatography
equipped with an electron capture detector (GC/ECD,
Varian CP3800). After analyzing experimental data,
the removal efficiency of TCE under different
experimental conditions could be obtained. The
recovery of TCE in the processes was verified to be
above 85%.
3. RESULTS AND DISCUSSION
3.1. Variation of electrical current during EK-PRB
experiments
In all experiments, a constant voltage was applied
across the electrodes. It was found that, whilst the
voltage between the electrodes was kept constant, the
potential difference across the soil was variable and
impossible to control in this manner. This effect was
due to the movement of ions and changes in moisture
in the soil system (Li et al., 2011).
Fig. (2) Displays the variations of electrical current
versus time for the four tests. As shown in Fig. (2), the
current decreased in 10 days. In general, the maximal
current was reached at the start of test when the
quantity of ions in the pore solution was the greatest.

Taghizadeh and Kebria
Remediation of Tetrachloroethylene -Contaminated Soil with Zero Valent Iron Utilizing Electrokinetic Reactors
205
Fig. 2: Variation of electrical current in EK tests
Fig. 3: Variation of cumulative EOF in EK tests
The increase in current indicates that many ions
entered into the soil column, while the decrease
suggests the moving out or precipitation of ions (Li et
al., 2011). Comparison of the electrical current during
2-10 days in four experiments indicates that tests with
PRB had higher currents than tests without (T1),
suggesting a slight promotion on the electrical current
with the presence of PRB. The variation of current is
in agreement with that which was reported by Chang
and Cheng (Chang and Cheng., 2006), whereas the
EK-ZVM test had a higher electrical current than the
EK test, due to the higher conductivity of pore
solution and lower resistance of high electric
conductive ZVM (Chang and Cheng., 2006; Wan et
al., 2010).
3.2. Variation of cumulative EOF during EK-PRB
Flow induced by the presence of an electrified field
was found to have a certain amount of repeatability
between experiments, in that the flow would initially
be slow to start, and then accelerate substantially,
before reducing or stopping entirely. The results of
four different experiments are shown in Fig. (3).
Fig. (3) Reveals that the cumulative EOF collected
at the cathode reservoir varied from test to test.
According to the Helmholtz-Smoluchowski equation,
the EO velocity is directly proportional to the zeta
potential of soil and the dielectric constant of pore
fluid (Virkutyte et al., 2002; Richard and Krishna,
2005).

International Journal of Scientific Research in Knowledge (IJSRK), 1(7), pp. 202-211, 2013
206
As known, considerable H2 can be generated by
the ZVI system, due to the decomposition of H2O by
Fe (0) (Zhang, 2003; Wan et al., 2010).
So there would be an accumulation of gas in the
PRB compartment, which would dramatically
decrease the dielectric constant of the pore fluid
within the system. Furthermore, the presence of quartz
sand could further contribute to the decrease of
dielectric constant of pore fluid, considering its poor
conductivity when compared with water or even soil.
The lower permeability of soil in cathode regions,
which was caused by the block of Fe oxides, formed
because of the very alkali circumstance near the
cathode. This was indicated by an increasing dark-
green color in the cathode regions during the EK-PRB
process. In addition, higher ion strength of the pore
solution due to the dissolution of ZVI is also expected
to impede the EOF by compressing the thickness of
diffusive double layer (Wan et al., 2010).
According to Fig. (3) With the addition of TX-100
(T3 and T4), the cumulative EOF of T3-T4 in ten
days, was more than that of T1 and T2. The
absorption of TX-100 within soil will reduce the
absorption of mobile ions, release the ions and reduce
the formation of precipitate (Yuan et al., 2006).
Besides, as a kind of dispersing agent, TX-100 could
improve the permeability of soil (Siachek and Reddy,
2002). Thus, the pore Fluid could be mobilized more
smoothly in T3 and T4 than in T1 and T2.
3.3. pH distribution
Changes in the pH of the electrolyte fluids were found
in all experiments, due to water electrolysis at the
electrodes. It was expected that the hydrogen and
hydroxyl ions produced would migrate into the soil,
primarily through electromigration and diffusion,
changing the pH of the soil pore fluid. This was
observed many times (Virkutyte et al., 2002; Wan et
al., 2009). Typical results from a range of different
experiment types are presented in Fig. (4). According to Fig. (4), in ten days, pH in anode
reservoirs decreases due to the production of H+, and
increase in cathode reservoirs due to production of
OH-.
In comparison, tests without PRB showed a higher
pH, which may be attributed to less H+ generation at
anodes due to the lower electrical current.
Furthermore, it can be found that tests with PRB
exhibited a more fluctuant pH compared with tests
without PRB. It is suggested that in the presence of
PRB, reactions between Fe particles and the
contaminants, the corrosion and transformation of Fe
and its oxides, as well as reactions associated with
quartz sand may all affect the variation of pH (Wan et
al., 2009).
3.4. Soil pH distribution
The soil pH values across the columns, upon the
completion of EK tests, are plotted in Fig. (5) Due to
water electrolysis at the electrodes the soil pH near the
anodes drop and the soil pH near the cathodes rise.

Taghizadeh and Kebria
Remediation of Tetrachloroethylene -Contaminated Soil with Zero Valent Iron Utilizing Electrokinetic Reactors
207
Fig. 4: Variation of (a) anolyte and (b) catholyte pH
Fig. 5: Distribution of soil pH
According to the Fig. 5, pH in the soil sample did
not indicate many changes due to buffering properties
of soil compared to the initial soil pH (7.6). Overall,
pH increases from the anode to the cathode and it did
not change more than 2 units. These negligible
changes indicate that the pH control is partially at the
right time at the anode and cathode reservoir.
3.5. Distribution of TCE in the soils
TCE is highly insoluble in water and is preferentially
absorbed in soils. It is therefore difficult to drive TCE
out by electro-osmosis. In order to accomplish the EK
remediation of TCE contaminated soils, the first step
is to de-absorb TCE from soils and dissolve it in a
porous solution. Surfactants have both hydrophilic
and lipophilic groups, so it can improve the solubility
of many HOCs (Ko et al., 2000; Reddy and Richard,
2003; Saichek and Reddy, 2002). Fig. (6) Illustrates
removal percentage in the four tests upon the
completion of remediation.

International Journal of Scientific Research in Knowledge (IJSRK), 1(7), pp. 202-211, 2013
208
Fig. 6: Removal percentage of TCE in EK tests
Table 3: Mass balance of TCE for four tests
Test No Initial Mass(mg) Soil Column (mg) Catholyte (mg)
Anode Middle Cathode
T1 240 59.77 69.77 73.07 25.95
T2 240 91.08 16.34 98.8 31.6
T3 240 67.08 31.18 11.01 60.11
T4 240 23.54 28.82 50.1 60.7
In addition, the mass of TCE in each column and
in cumulative EOF was calculated and listed in Table.
3.
The curve of T1 in Fig. 6 depicts the movement of
TCE in the electric field without the influence of PRB.
TCEs near the anode were moved to the middle
section and the cathode via electro-osmosis. As shown
by the mass balance calculated in Table. 3, negligible
TCE was removed from the soil in T1, which is
indicative of low EK remediation efficiency for TCE-
contaminated soil. The observation confirms the fact
that EK alone can only facilitate a reliable removal of
HOCs in anode regions, as found was confirmed
several previous studies.
When PRB was installed, as indicated in T2, more
TCE near the anode column migrated towards the
cathode when compared to T1. Correspondingly, the
overall TCE removal in the cathode column in T2 was
much higher than that in T1. For T3 and T4, TCE
distribution in the anode column was higher than T2,
and in the cathode column, the residue was lower than
in T2. Particularly, no detectable TCE was recorded in
the cathode regions in T3, suggesting that no TCE
from the anode column moved into these regions.
In the EK-PRB process, there are two main
approaches that contribute to the removal of TCE
from soils. One is the electro-osmotic (EO) movement
of contaminants across the soil from anode to cathode,
which plays a primary role in HOC removal in
conventional EK remediation (Siachek and Reddy,
2002; Virkutyte et al., 2002).
The other is the adsorption/degradation of TCE by
Fe particles in the PRB compartment. Generally, EO
functioned as the predominant approach to move TCE
in the anode column, and ZVI-PRB functioned as a
unit to remove TCE that was moved by EOF from the
anode (Li et al., 2009).
Comparison of TCE residue in an anode column
(Table. 3) reveals that the test with PRB generally
obtained an overall TCE removal of about 70%,
which was nearly 40% higher than by EK alone. This
reliable promotion in contaminants removal with the
combination of EK and ZVI-PRB has also been
reported in literature (Mooon et al., 2005; Yuan et al.,
2006).
Taghizadeh and Kebria
Remediation of Tetrachloroethylene -Contaminated Soil with Zero Valent Iron Utilizing Electrokinetic Reactors
209
4. CONCLUSIONS
In this study we investigated the performance of EK-
PRB technique to remediate TCE in contaminated
soils. TX-100 was selected as a solubility-enhanced
agent and microscale Fe particles were used as a PRB
material. The results showed that EK-PRB could
greatly enhance the removal of target contaminants in
soils. Major conclusions can summed up as follows:
1) The integration technique is feasible to clean up
TCE contaminated soils in a lab scale; the best TCE
removal efficiency can reach 79% after a 10-days
treatment.
2) The combination of EK and Fe (0) PRB could
increase the overall TCE removal from soils by 40%
when compared with EK alone. The results also
suggest that TX-100 is a superior enhancement agent
for TCE removal, both in the EOF movement process
and in the Fe (0) degradation process.
3) Mass balance of TCE revealed that in the EK-
PRB system, TCE could be removed from soil
through several sequential processes: the movement
driven by EOF in the anode column, the complete
adsorption/ degradation by the Fe (0) PRB and the
consequent movement by EOF and probable
degradation by electrochemical reactions in the
cathode column.
4) Comparison of the electrical current during 2-10
day in four experiments indicates that tests with PRB
due to the higher conductivity of pore solution and
lower resistance of high electric conductive ZVM had
higher currents than tests without (T1).
REFERENCES
Alshawabkeh AN, Yeung AT, Bricka MR (1999).
Practical aspects of in-situ electrokinetic
extraction. Journal of Environmental
Engineering, 125(1): 27-35.
Chang JH, Cheng SF (2006). The remediation
performance of a specific electrokinetics
integrated with zero-valent metals for
perchloroethylene contaminated soils. Journal
of hazardous materials, 131(1): 153-162.
Coletta TF, Bruell CF, Rayan DK (1997). Cation-
enhance removal of lead from kaolinite by
electrokinetics. Environmental Engineering
Science, 123(12): 1227-1233.
Gholami M, Yousefi Kebria D (2012). The
comparison of phytoremediation and
electrokinetic methods in remediation of
petroleum hydrocarbons contaminated soil.
Second International Conference on
Geotechnique, Construction Matrials and
Environment, Kuala lumpur, Malaysia Nov. 14-
16, 2012(ISBN: 978-4-9905958-1-4 C3051).
Khodadadi A, Yousefi D, Ganjidoust H, Yari M
(2011). Bioremediation of diesel- contaminated
soil using Bacillus sp. (stratin TMY-2) in soil
by uniform and non- uniform electrokinetic
technology field. Journal of Toxicology and
Environmental Heaith Sciences, 3(15): 376-
384.
Ko SO, Schlautman M. A.., E.R. Carraway (2000).
"Cyclodextrin-enhanced electrokinetic removal
of phenanthrene from a model caly soil."
Environ. Sci. Technol 34: 1535-1541.
Li Z, Yuan S, Wan J, Long H, Tong M (2011). A
combination of electrokinetics and Pd/Fe PRB
for the remediation of pentachlorophenol-
contaminated soil. Journal of contaminant
hydrology.
Li TP, Yuan SH, Wan JZ, Lin L, Long HY, Wu XF,
Lu XH (2009). Pilot-scale electrokinetic
movement of HCB and Zn in real contaminated
sediments enhanced with hydroxypropyl-beta-
cyclodextrin. Chemosphere, 76: 1226-1232.
Moon JW, Moon HS, Kim H, Roh Y (2005).
"Remediation of TCE-contaminated
groundwater using zero valent iron and direct
current: experimental results and electron
competition model. Environ. Geol., 48: 805-
817.
Reddy KR, Cameselle C (2009). Electrochemical
remediation technologies for polluted Soils,
sediments and groundwater. Wiley.
Reddy Krishna R, Saichek RE (2003). Effect of soil
type on electrokinetic removal of
phenantherene using surfactants and cosolvents.
J. Environ. Eng., 129: 336-346.
Sah JG, Lin LY (2000). Electrokinetic study on
copper contaminated soils. Journal of
Environmental Science & Health Part A, 35(7):
1117-1139.
Siachek Richard E, Reddy Krishna R (2002). Effect of
pH control at the anode for the electrokinetic
removal of phenanthrene from kaolin soil."
Chemosphere (51): 273-287.
Siachek Richard E, Reddy KR (2005).
Electrokinetically enhanced remediation of
hydrophobic organic compounds in soils: A
review. Critical reviews in environmental
science and technology, 35(2): 115-192.
Van Cauwenberghe (1997). Electrokinetics.
Groundwater Remediation Technologies
Analysis Center, To-97-03.
Virkutyte J, Sillanpää, M, Latostenmaa P (2002).
Electrokinetic soil remediation — critical
overview. Science of The Total Environment
289(1-3): 97-121.
Wan J, Li Z, Lu X,Yuan S (2010). Remediation of a
hexachlorobenzene-contaminated soil by

International Journal of Scientific Research in Knowledge (IJSRK), 1(7), pp. 202-211, 2013
210
surfactant-enhanced electrokinetics coupled
with microscale Pd/Fe PRB." Journal of
hazardous materials 184(1-3): 184-190.
Wan JZ, Yuan SH, Chen J, Li TP, Lin L, Lu XH
(2009). Solubility-enhanced electrokinetic
movement of hexachlorobenzene in sediments:
a comparison of cosolvent and cyclodextrin. J
Hazard Mater., 166: 221-226.
Weng CH, Lin YT, Lin TY, Kao CM (2007).
"Enhancement of electrokinetic remediation of
hyper-Cr (VI) contaminated clay by zero-valent
iron." Journal of hazardous materials 149(2):
292-302.
Weng CH, Yuan C, Tu HH (2003). Removal of
trichloroethylene from clay soil by series-
electrokinetic process. Practice Periodical of
Hazardous, Toxic, and Radioactive Waste
Management, 7(1): 25-30.
WHO (2006). World Health Organization. Concise
International Chemical Assessment Document
68, Tetrachloroethylene.
Yalcin B, Li HRJ (1992). Phenol removal from
kaolinite by electrokinetics. J. Geotech. Eng.,
118(11): 1837-1853.
Yuan C (2006). The effect of Fe(0) on electrokinetic
remediation of clay contaminated with
perchloroethylene. Water Sci. Technol., 53: 91-
98.
Yuan S, Tian M, Lu X (2006). Electrokinetic
movement of hexachlorobenzene in clayed soils
enhanced by Tween 80 and B-cyclodextrin. J
Hazard Mater., B137: 1218-1225.
Zhang, W. X. (2003). "Nanoscale iron particles for
environmental remediation: an overview." J.
Nanopart . Res 5: 323-332.
Zheng Z, Yuan S, Yuan S, Liu Y, Lu, Wan X, Wu J,
Chen J (2009). Reductive dechlorination of
hexachlorobenzene by Cu/Fe bimetal in the
presence of nonionic surfactant. Journal of
hazardous materials, 170(2): 895-901.

211
Maryam Taghizadeh has MSC in civil engineering-Environment Science from Babol Noshirvani
university of Technology (Iran).Currently; she works in the Islamic azad university of behshahr. She
has more than 5 articles in the international conference and Journal.
Daryoush Yousefi Kebria has PHD in civil engineering-Environment Science from Tarbiat modares
University(Tehran-Iran).Currently, he is Assistant Professor in Civil Engineering, Babol University of
Technology. he has more than 7 articles in the international conference and Journal.

International Journal of Scientific Research in Knowledge (IJSRK), 1(7), pp. 212-221, 2013 Available online at http://www.ijsrpub.com/ijsrk
ISSN: 2322-4541; ©2013 IJSRPUB
http://dx.doi.org/10.12983/ijsrk-2013-p212-221
212
Full Length Research Paper
Monitoring and Configuration of Energy Harvesting System Using WSN
Kodegandlu Venkatarayappa Narayanaswamy
Senior Member IEEE; Professor & Head of EEE, MSRUAS, Bangalore, India; Email: [email protected]
Received 15 May 2013; Accepted 12 June 2013
Abstract. Energy harvesting (EH) system is a new concept introduced for capturing or reusing energy from natural resources like
solar energy and wind energy. The EH system consists of two key components i.e. an EH unit and an energy storage device.
Monitoring and control of EH system is essential for its efficient and effective functioning, and reduces the cost required for
replacement of damaged storage devices caused due to overcharging. This research article propose an architecture for
monitoring voltage / state of the charge of EH system during charging and discharging process i.e. essential to protect the storage
device from overcharging / deep discharging using Wireless Sensor Network (WSN) technology. A prototype of voltage
monitoring slave sensor unit is designed to monitor overcharging / deep discharging of EH system. The monitored voltage is
communicated to the sink at periodic intervals. Master slave wireless communication is set up using Zigbee wireless module to
enhance communication between the monitoring slave sensor unit and master. The system is also scaled using remote
configuration capability to extend the monitoring of EH system by setting up threshold limit to protect the storage device from
over charging. By setting up the threshold limit an alert is generated by the monitoring unit and communicated to master over
Wireless Network (WN), the remote configuration also provides to put the monitoring unit in low power mode to extend the
monitoring unit life.
Key words: Energy harvesting, Wireless Sensor Network, Wireless Network, Cluster Heads
1. INTRODUCTION
The emerging technology has brought new
opportunities in EH system and WSN for data
monitoring and has given rise to expand WSN
potential prospects for monitoring and processing
various sensor information through wireless
communication. Improvements in EH system
technologies and utilization of renewable energy
source for power generation has attracted the young
researcher to expand the EH systems. EH system has
been in rapid development for renewable power
generation and monitoring EH system over WSN
technology is the fastest and most effective way to
reduce cost and man power required for maintenance
of these systems. The monitoring and configuration of
EH system over WSN has following advantages Used
for remote monitoring of renewable harvested energy.
Remote configuration for setting charging threshold
limits of storage device that in turn reduce cost and
man power required for manual work. The
overcharging / deep discharge alerts reduces the
storage device replacement and maintenance cost.
Particularly suitable for industrial monitoring
application in distributed power generation plants.
Fig. 1: System Architecture of WSN for Monitoring of EH System
Most recently the wireless communication ability
has made the embedded applications world by leading
to the development of sensor networks. In any
monitoring and control application the sensor nodes is
composed of small wireless sensor node. These nodes
are randomly deployed and distributed in a designated
region where humans may have limited access to the
area/location. This means that once sensor nodes are
deployed it should be able to self-organize into a
wireless network to identify its connectivity and

Narayanaswamy
Monitoring and Configuration of Energy Harvesting System Using WSN
213
distribution without human intervention. The typical
arrangement of WSN architecture for collecting
information about the region and transmits the
monitoring information to the centralized monitoring
station / base station (BS) through multi-hop
communications. Then the centralized monitoring
station then sends the data/information to any remote
user for monitor and control application.
Industrial Control and Monitoring: Wireless
sensors can be used to monitor the state of machinery,
measure the performance of machine or to
environmental parameters in harsh environments. With
this remote monitoring capability the maintenance cost
can be reduced and also deployment cost required for
wiring connections to these sensing devices is reduced.
2. LITERATURE REVIEW
In literature review the previous research efforts to
understand the concepts in the areas of monitoring and
control application using WSN. In remote monitoring
application, water environment monitoring plays an
important role in environment protection and
management in the field of large-scale water quality
measurement. The traditional method requires man
power to collect the water sample and perform manual
testing in the laboratory. This is a labor intensive and
time-consuming task to meet the water environment
protection and management objective these issues
wrwe addressed by the authors (Jin et al., 2010).
The author (Biyabani, 2009) proposes design
considerations for an embedded WSN for periodic
monitoring of civil infrastructure using an on chip
integration of solar energy harvesting super-capacitors
for extra power along with batteries powered source
when mains power is not available.
The Energy harvesting setup with six hours of
adequate sunlight to harvest solar power to recharge
battery to its full capacity every day increases the
lifetime of the Wireless networks (Musiani et al.,
2007) explored the active sensing platform for wireless
structural health monitoring of batteries were
discussed. (Piorno et al., 2009) Management of solar
harvested energy in actuation-based and event-
triggered the systems. (Staszewski, W. J., Lee, et al.,
2004) Structural health monitoring using scanning
laser vibrometry concept were presented.(Steck, 2009)
Energy and Task Management in Energy Harvesting
Wireless Sensor Networks for Structural Health
Monitoring were dealt .
(Taylor et al., 2009) A mobile-agent based wireless
sensing network for structural monitoring applications,
has explored scenarios in which nodes can harvest
energy from their environment (Jiang et al., 2005)
perpetual environmentally powered sensor networks.
Existing approaches to the problem of dynamic duty-
cycling of nodes with energy harvesting capabilities
attempt to model the energy source and adjust the
node’s duty cycle in anticipation of expected incoming
energy or lack thereof (Voigt et al., 2003) Utilizing
solar power in wireless sensor networks and health
monitoring is carried out.
Lifetime Maximization in Clustered WSN: The
sensor nodes are grouped into cluster and it comprises
of Cluster Heads (CH) and Non-Cluster Heads
(NCH). The cluster head processes the data of each
non cluster heads and transmit the whole cluster
information to base station. The energy consumed by
the cluster head to do the processing is higher
compared to non cluster heads thereby it drains its
battery energy quickly. Thus the authors (Zhang et
al., 2011). Presented the single cluster algorithm for
life time optimization in homogeneous WSN with one
solar powered sensor node. In this technique the
cluster heads listen on the network for the non cluster
head nodes to transmit the data in the specified time
slot. On the receipt of the NCHs data, cluster heads
process and routes through the shorter distance energy
harvesting node to relay information to the Base
Station (BS) thereby increase the network life time
and minimizing the energy required by cluster head.
Monitoring systems are widely used in industrial
applications and the review shows how wireless
sensors can contribute to monitoring systems;
however it does not take into account the need of
intelligent wireless monitoring systems that can
minimize the cost required for maintenance increase
the operational efficiency of the system i.e. monitored.
3. MONITORING EH SYSTEM
Energy harvesting is a process by which energy is
derived from external sources (e.g., solar power,
thermal energy and wind energy) captured, and stored
in energy storage devices Example: lithium-ion (Li-
ion)/ nickel–cadmium (NiCd) Battery.
The monitoring of any energy harvesting system
plays an important role to provide reliable operation
of the systems that utilizes the energy from energy
harvesting storage device, it is important to know the
factors that affect the storage device (battery) life and
the amount of energy remaining in the storage devices
at any point of time. The factors that affect the storage
devices (battery) life are (a) Deep discharge of the
energy reduces the life of the battery; (b) Frequent
overcharging has a damaging effect on the battery.

International Journal of Scientific Research in Knowledge (IJSRK), 1(7), pp. 212-221, 2013
214
4. SYSTEM ARCHITECTURE FOR WSN FOR
MONITORING AND CONFIGURATION OF EH SYSTEM
Figure 1 forms the basic setup of WSN and the
communication between monitoring unit, master and
slave node forms WSN for any monitoring
application. In this case WSN for monitoring of
energy harvesting system the output of the system i.e.
to be monitored is given as input to signal
conditioning circuitry
5. DESIGN SPECIFICATION
The monitoring and configuration of EH system
consists the following stages:
(a) Monitoring unit needed to monitor the EH
system
(b) Monitoring unit integrated with wireless slave
node required to transmit the monitoring data to the
master over WN
(c) Master node communicates with the slave node
to gather data and present them to the end user over
USART communication
(d) A user interface over HyperTerminal for
displaying data and giving the user the ability to
configure the EH System over WN
5.1. Development of WSN Monitoring and
Configuring EH System
The hardware development of the system mainly
includes Monitoring slave sensor node and sink node.
They are composed of the control and wireless
communication module and the related functional
module.
5.2. The Monitoring Slave Sensor Node
Figure 2 shows the hardware structure of sensor node.
It mainly consists of monitoring and control unit, and
wireless communication module.
Fig. 2: The Structure of WSN for Monitoring of EH System
5.3. Monitoring and Control Unit
The characteristics of the system that is to be
monitored are voltage / state of charge in the EH
system’s storage device. In monitoring and control unit
block the microcontroller has the limitation on the
inputs that can be given to it. The monitoring systems
voltage is stepped down using signal conditioning
circuit then its output is given as the voltage input to
the 10 bit Analog to Digital Converter (ADC) of the
microcontroller. The value from the signal
conditioning circuit and ADC are sampled, and
processed using the microcontroller to determine the
voltage / state of charge of the system that is
monitored. This information is displayed on LCD and
also packetized, and transmitted to the master over
WN by the wireless communication module.
5.4. Control and Communication Module:
The control and communication module is the core
unit that forms slave sensor node, which is responsible
for obtaining the data from the monitoring and control
unit, and perform wireless communication with other
nodes/master using 2.4GHz IEEE 802.15.4 compliant
RF transceiver. Below are the following task that are
initiated by the slave node, when the master node
sends a data request to the slave node
Receive and decode the master request
Send command to the monitoring unit
Receive the data over USART communication
line.
Packetizes the data with IEEE802.15.4
compliant frame and transmit over WN.
Go back to monitoring mode and put the RF
radio in receiver mode

Narayanaswamy
Monitoring and Configuration of Energy Harvesting System Using WSN
215
5.5. The Master Node
The key device is Zigbee module with 2.4GHz
IEEE802.15.4 compliant low power consumption
Yoda RF transceiver with an enhanced USART
interface and microcontroller from Si2 Microsystems
Pvt. Ltd. Figure 5 shows the master node structure,
where the Zigbee acts as main communication module
to transmit the data request to the slave nodes based on
the Zigbee protocol for monitoring of EH system.
Sink / Master Node
RF wireless
ModuleMicrocontroller USART
Host User
Power Supply
Fig. 3: The Structure of Master Node
5.6. Software Design of WSN for Monitoring and
Configuration of EH System
The self-organization and data transmission of the
wireless sensor networks are based on Zigbee protocol
stack. The Zigbee IEEE 802.15.4 protocol on 2.4GHz
(license free for personal area network) is most
suitable for the short range data communication and
provides good coverage for industrial monitoring
applications.
5.7. Establishing WSN over Master Node
Figure 4 shows the logic flow to form WSN with the
slave nodes over master node. Here the master node
broadcasts association request command to all the
sensor nodes over WN and waits for a specified
interval of time for the nodes to respond back. The
master node saves the address of all nodes to form a
wireless communication network for monitoring
application. If the slave node doesn’t respond then the
network search time is incremented and trial counter is
incremented. If number of trials is completed then the
master node goes into the power saver mode and puts
the radio into sleep mode. The master has a wakeup
counter to wake up the radio and start the new search
to establish the WSN.
5.8 Event based algorithm with Periodic Sleep
and Communicate Mode
The event based algorithm is an energy efficient
algorithm by configuring periodic sleep and
communicate method, the RF radio is put to sleep and
periodically the radio is made to wake and transmit the
data to master thereby minimizing the power
consumption and increasing the WN life time.
Figure 7 shows the logic flow diagram of event
based algorithm with periodic wake up and
communicate mode. In this algorithm certain events
are initially configured before deployment in the EH
monitoring system by setting up the battery threshold
levels for certain types of events. When the events
occur in the node or the node sleep time is finished the
monitoring node sends a wake up command to the RF
module and establishes the wireless communication to
notify the monitoring status of EH System to the
master. Thus by increasing the sleep time of the slave
node and wakeup the RF slave node on event
minimizes the energy consumption that is required for
data communication.
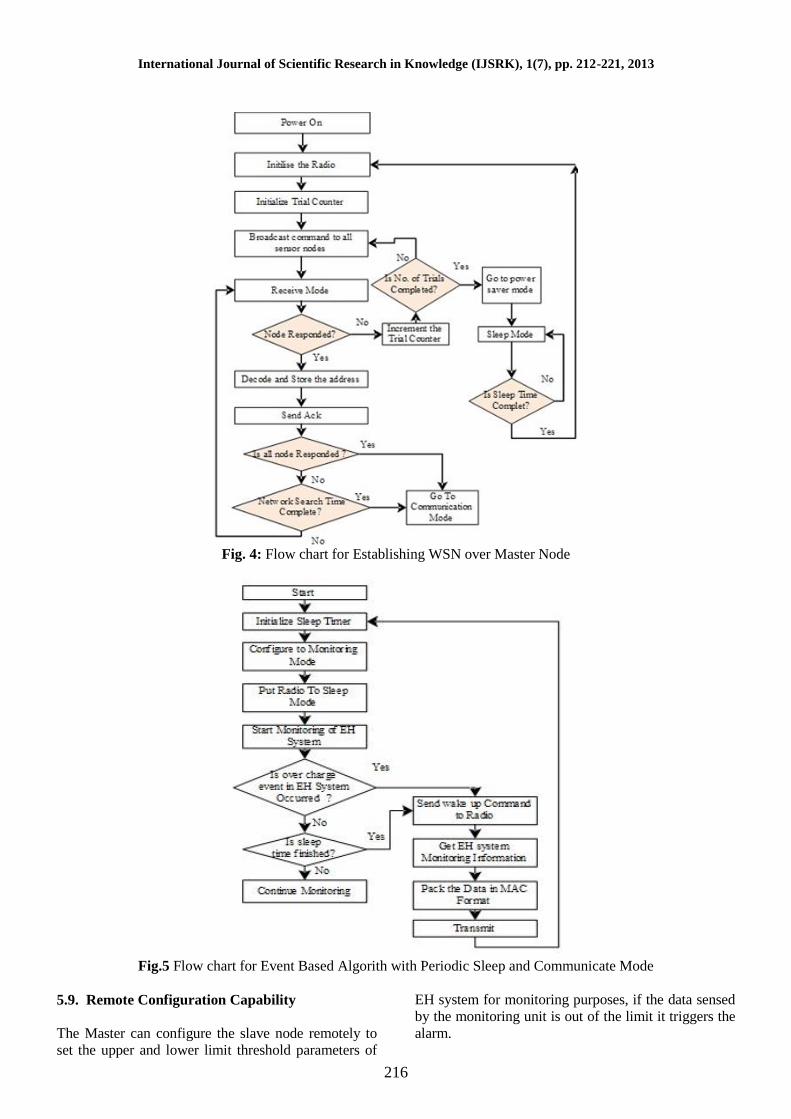
International Journal of Scientific Research in Knowledge (IJSRK), 1(7), pp. 212-221, 2013
216
Fig. 4: Flow chart for Establishing WSN over Master Node
Fig.5 Flow chart for Event Based Algorith with Periodic Sleep and Communicate Mode
5.9. Remote Configuration Capability
The Master can configure the slave node remotely to
set the upper and lower limit threshold parameters of
EH system for monitoring purposes, if the data sensed
by the monitoring unit is out of the limit it triggers the
alarm.

Narayanaswamy
Monitoring and Configuration of Energy Harvesting System Using WSN
217
Fig. 6: Flow chart Over the Air Remote Configuration of EH System
Figure 6 shows the logic flow of the remote
configuration of EH system over master, the slave
receives and decodes the configuration parameters, and
then sends a command to the monitoring unit to update
the new monitoring configuration parameter of the EH
system. The monitoring unit then updates with the new
parameters and starts monitoring. This design
eliminates the manually updating monitoring
parameters and also minimizes the cost involved for
manual work.
6. IMPLEMENTATION
Figure 7 shows the hardware prototype setup for WSN
for monitoring and configuration EH System. The
following are steps are initiated for monitoring the EH
System over WSN
(a) Monitor the EH System Continuously
(b) Upon monitoring data request from master node
pack the monitoring data in MAC frame and Transmit
(c) Master receives the monitoring data, decode and
present the monitoring parameter of the EH System to
user over host HyperTerminal
(d) Monitor the data on Hyper Terminal for over
charge alert and initiate corrective measure to
minimize the damage to the storage devices
Fig. 7: Hardware Setup for Monitoring & EH System
7. RESULTS
The Figure 8 shows the monitoring of EH system over
WSN. The master sends a request to the monitoring
slave and the slave nodes send the data of the battery
voltage of the energy harvest device. This enables to
monitor the energy stored in the harvesting devices
and also enables better utilization of other system to
utilize the harvested energy.

International Journal of Scientific Research in Knowledge (IJSRK), 1(7), pp. 212-221, 2013
218
Fig. 8: Monitoring of EH System Over Master Console Utility
Fig. 9: Receiveing Alerts Over Master Console Utility
Figure 9shows the remote configuration feature
over master console utility that enables to update the
threshold limits over the air and the Figure 12 shows
the monitoring of EH system using event based
algorithm, where upon an event of over charge or
sudden discharge the slave node sends an alert
message over WN.
8. MONITORING ANALYSIS
To demonstrate WSN for monitoring EH system, the
experiment has been set up using monitoring unit,
slave node and master node using Zigbee modules and
the experiment had been carried out on a sunny day
using a solar panel that outputs 18 volts with constant
current not exceeding more than 1200mA and Li-ion
battery had been used as EH storage device. The EH
system data is captured by the monitoring unit and the
master request the data at every three minutes form
slave and logged for future analysis. The battery
characteristic graph below shows the monitoring data
collected from EH system over WN the resulting 60
minute for charging and 66 minutes for discharge at
different constant discharge currents and the variation
of voltage with respect to time is obtained and
discussed.
8.1. Monitoring of Storage Device during Energy
Harvesting
To determine the time required to fully charge / state
of charge, two trials have been conducted one is with

Narayanaswamy
Monitoring and Configuration of Energy Harvesting System Using WSN
219
load and other is without the load connected to the EH
system and the graph is plotted for monitoring data
that is collected over WN from EH system for the
resulting 60-minute charge time. From the Figure 10 it
can be observed that the voltage of the battery
increases with the time. When the load is connected
the time required to charge increases compared to that
without the load.
Fig. 10: Battery Characteristics while Harvesting the Energy
Fig. 11: Battery Characteristic During Discharge
8.2. Monitoring of Storage Device during
Discharging
Figure 11 gives the variation of voltage in battery with
time when the battery is discharged at a constant
current of 800mA and 1A. From the characteristics
Figure 11 it is seen that the terminal voltage of the
battery decreases with time till a certain voltage. The
battery is considered to be depleted fully when the
terminal voltage reaches 6200mV.
The experiment shows that when higher load is
connected and the load is kept continuously actives
results in decrease in battery life time and upon
completely depleted the load becomes inactive.
9. CONCLUSION
The proposed method provides low power monitoring
unit, master and slave nodes for monitoring of EH
system by establishing the communication between
master-slave over WSN with an easy to install and
setup the monitoring of EH system. The monitoring
system provides reliable measurements in a periodic
time interval and the system provides remote
configuration capability that is capable to configure
EH system to provide over charged / discharge alert to
minimize the damage to the EH storage devices and
also reduces the man power and cost required to set
the EH system threshold limit manually. To assure
efficient working operation of monitoring unit over
WSN allows remote configuration capability to put

International Journal of Scientific Research in Knowledge (IJSRK), 1(7), pp. 212-221, 2013
220
the monitoring unit in low power mode to extend the
life of the monitoring system / slave node. Further
improved by
(a) Multiple numbers of master/slave nodes can be
used for better performance.
(b) This monitoring alert can be further enhanced to
have a graphical user interface over internet to monitor
all system parameters online.
(c) The system can be made still energy efficient
with the use of path selection or cluster head selection
algorithm to increase the WN life time
REFERENCES
Jin N, Ma R, Lv Y, Lou X (2010). A Novel Design of
Water Environment Monitoring System Based
on WSN. IEEE Computer Design and
Applications, (2): 593-597.
Zhang P, Xiao G, Tan H (2011). A Preliminary Study
on Lifetime Maximization in Clustered
Wireless Sensor Networks with Energy
Harvesting Nodes. Singapore : IEEE
Communication.
Biyabani J (2009). Infrastructure Monitoring Smart
Wireless Sensor Network with Solar Energy
Harvesting. 2009 IEEE Communication, 1-4.
Musiani D, Lin K, Rosing TS (2007). Active sensing
platform for wireless structural health
monitoring. In IPSN ’07: Proceedings of the 6th
international conference on Information
processing in sensor networks, 390–399. ACM,
New York, NY, USA.
Piorno JR, Bergonzini C, Lee B, Rosing TS (2009).
Management of solar harvested energy in
actuation-based and event-triggered systems.
4th Annual Energy Harvesting Workshop.
Staszewski WJ, Lee BC, Mallet L, Scarpa F (2004).
Structural health monitoring using scanning
laser vibrometry: I. lamb wave sensing. Smart
Material Structures, 13: 251–260.
Steck J (2009). Energy and Task Management in
Energy Harvesting Wireless Sensor Networks
for Structural Health Monitoring. Master’s
thesis, UCSD. Advisor - Tajana Rosing.
Taylor SG, Farinholt KM, Flynn EB, Figueiredo E,
Mascarenas DL, Moro EA, Park G, Todd MD,
Farrar CR (2009). A mobile-agent based
wireless sensing network for structural
monitoring applications. Measurement Science
and Technology, 20(4): 045201 (14pp).
Jiang X, Polastre J, Culler D (2005). Perpetual
environmentally powered sensor networks. in
IEEE Information Processing in Sensor
Networks, 2005, pp. 463–468.
Voigt T, Ritter H, Schiller J (2003). Utilizing solar
power in wireless sensor networks. in The 28th
Annual IEEE Conference on Local Computer
Networks (LCN), Bonn/Konigswinter,
Germany.

Narayanaswamy
Monitoring and Configuration of Energy Harvesting System Using WSN
221
K.V.Narayanaswamy received his Bachelor and Post graduate degree in Electrical Engineering from
Bangalore University, and Ph.D degree in Electrical & Electronics Engineering, Specialised in
Wireless Communications and Networks from Visvesvaraya Technological University, Belgaum,
Karnataka, India. He has more than 22 Years of Teaching & Research experience in the field of
Electrical, Electronics & Telecommunication Engineering. His research interests are in the areas of
next-generation wireless communication and networks, Mobile Ad-hoc & wireless sensor networks,
Advanced optical network design, automotive communication protocols and standards. Carried
several research, consultancy and funded projects. Delivered number of corporate trainings in India
and abroad, Published more than 16 papers in peer reviewed international journals including IEEE,
IJCA, etc., and several conference papers.
International Journal of Scientific Research in Knowledge (IJSRK), 1(7), pp. 222-227, 2013 Available online at http://www.ijsrpub.com/ijsrk
ISSN: 2322-4541; ©2013 IJSRPUB
http://dx.doi.org/10.12983/ijsrk-2013-p222-227
222
Full Length Research Paper
Assessing Cracks in Reinforced Concrete Structure Using Acoustic Emission
Alireza Panjsetooni1,2,
*, Norazura Muhamad Bunnori1, Tze Liang Lau
1
1School of Civil Engineering, Engineering Campus, Universiti Sains Malaysia (USM), Seri Ampangan, Seberang Perai
Selatan, 14300 Nibong Tebal, Pulau Pinang, Malaysia 2Bakhtar institute of higher education, Ilam, Iran
*Corresponding Author: E-mail: [email protected]
Received 15 May 2013; Accepted 18 June 2013
Abstract. Acoustic emission (AE) is an important nondestructive evaluation (NDE) technique used in the field of structural
engineering. In this study AE technique with a new approach was employed to investigate the process of fracture formation in
reinforced concrete structure. A number of reinforced concrete (RC) frames were tested under cyclic load and were
simultaneously monitored using AE. The AE test data using intensity analysis method were analyzed. This is based on
calculating two values called the historic index (HI) and severity (Sr). The results showed that HI and Sr increase with
increasing of loading cycle and trend of HI and Sr showed that these parameters are able to indicate the levels of damage. Also,
the results indicated that AE can be considered as a viable method to investigate the process of fracture formation in reinforced
concrete structure.
Key words: Reinforced concrete; Acoustic emission; nondestructive evaluation technique; AE source location; Intensity
analysis
1. INTRODUCTION
The AE technique is one of the non-destructive
evaluation (NDE) techniques that have been
considered as the prime candidate for damage
monitoring in loaded structures and structural health
(Surgeon and Wevers, 1999). This technique is a
useful testing tool for examination of the behavior of
materials deforming under stress real time(Nair and
Cai, 2010). AE technique have been used in the field
of reinforced concrete structure for investigation
process of damage in both case local and global
monitoring (Panjsetooni and Bunnori, 2013).
The primary sources of acoustic emission in
concrete structures are numerous and include cracking
of the concrete, rubbing of crack surfaces during crack
closure, de-bonding of the reinforcing steel from the
surrounding concrete (Pollock, 1981). The main goal
of AE monitoring in structures is to detect, source, and
assess the intensity of damage(Holford and Lark,
2005).
AE data can be evaluated by means of several
methods. The Intensity analysis is a significant
method for analysis of AE signals. This technique has
already been success- fully applied to FRP and metal
piping system evaluations(Nair and Cai, 2010) . Also,
a few works was found that IA method has been used
for evaluation of the RC beam such as (Golaski et al.,
2002)and (Proverbio, 2011)
In main objective of this current study was
evaluation of damage using Intensity analysis method.
Commonly, previous works focused on local
evaluation of RC beams using Intensity analysis
method. However in this research, suitably of
Intensity analysis method for global evaluation of RC
frame was investigated.
2. METHODOLOGY
2.1. Intensity analysis
Intensity analysis (IA) evaluates the structural
significance of an AE event and the level of
deterioration of a structure by calculating two values
called the historic index (HI) and severity
(Sr)(Proverbio, 2011). The HI compares the signal
strength of the most recent emissions to the signal
strength of all emissions (Degala et al., 2009). Also,
HI a measure of the changes in signal strength
throughout the test which is an analytical method for
estimating the changes of slop in cumulative signal
strength against time(Proverbio, 2011) . The Severity
index, which is defined as the J largest signal strength
emissions received at a sensor (Degala et al., 2009).
HI is calculated using the following formulas
(Blessing et al., 1992).
HI= N/ (N-K) × ∑ ∑
(1)
Where N is number of hits up to and including
time, K is an empirical constant and is signal

Panjsetooni et al.
Assessing Cracks in Reinforced Concrete Structure Using Acoustic Emission
223
strength of ith hits. K is constant based on material.
For concrete, N<50, K=0 ; 51<N<200, K=N-30;
201<N<500, K=0.85N; and N>501, K=N-75 as well
as J valus for N<50, J=o and N>50 J=50 (Golaski et
al., 2002) .
(
) ∑
Where, is the signal strength of the hit, J
is an empirical constant based on material and
based on magnitude of signal strength.
3. EXPERIMENTAL PROCEDURE
3.1. Material details
A series of experiments was conducted on reinforced
concrete (RC) frame. A total of five RC frame
specimens were built. The dimension of RC frames,
were length of 2000mm, height of 1000mm and crocs
section of 250x250 mm. The water to cement ratio
was 0.5 and the material proportions were 1:3:4:0.6 by
weight of cement, sand, aggregate and water
respectively. The average compressive strength of
concrete at 28 days was 240Mpa.Figure 1 shows the
detail and dimension of RC frame specimens.
Fig. 1: Detail and dimension of RC frame specimen
3.2. Test monitoring using AE technique
A total of five RC frame specimens described earlier
were tested under loading cycle. In order to perform
acoustic emission monitoring, an eight channel AE
system (DISP-8PCI) manufactured by Physical
Acoustics Corporation (PAC) was employed. Four
R6I sensors with the resonance frequency of
approximately 60 kHz were used. Figure 2 shows
sensor arrangements for the three point bending test.
The AE systems hardware was set up was threshold
level of 45dB for all channels in order to avoid the
possibility of noise effect. The cyclic load pattern was
determined. The load applied at one at mid span of the
RC frame specimens. The load was applied in 10kN
steps at mid span of RC frame. The load was applied
from 0.5kN to maximum of each loading cycle (10kN
increment) and held constant for one minute. Then,
the load was unloaded from maximum of each loading
cycle to 0.5kN and was held for 2 minutes. The test
was monitored by AE throughout the test. The
measurement include load, mid span deflection and
AE data were recorded continuously during the three
point bending test. 4. RESULTS ANALYSIS AND DISCUSSIONS
4.1. Responses of test RC frame to cyclic loading
The RC frames described early were tested under
loading cycle. Figure 3 shows a typical cracks
development in the RC frames specimen. The
behaviour of all RC frames under loading cycle can be
divided into seven stages of failure namely:(I)Micro-
cracking at the mid span of RC frame (II) First
flexural cracks at mid span of RC frame (III)
distributed flexural cracks at the mid span of RC
frame (IV) first cracks at the BEAM-COLUMN
CONNECTION ZONES (V)Distributed cracks at
BEAM-COLUMN CONNECTION ZONES (VI)
Damage localization at the BEAM-COLUMN
CONNECTION ZONE (VII) Failure at beam-column
connection zone.

International Journal of Scientific Research in Knowledge (IJSRK), 1(7), pp. 222-227, 2013
224
Fig. 2: Sensor arrangements for the three point bending test
Fig. 3: Photographs of development of cracks in RC frame specimen
4.2. Intensity Analysis
The AE data obtained in test was used in order to
carry out Intensity Analysis (IA). The maximum of
Severity (Sr) and Historic Index (HI) for all channels
were calculated. These results are summarized in
Table 1 and 2. Also, Figure 4 shows the maximum
value of Sr and HI against loading cycle number for a
sample of RC frame specimen. Data points shows that
the maximum Sr and HI are increased with increasing
of damage. Data points show that in stage micro-
cracks, initiate cracks and distribution of cracks in
mid-span of beam that HI is low level and without
significant changes. Also, data points indicate that in
stage initiate cracks and distribution of cracks in beam
column connection, HI is high level with significant
changes.
HI is a measure of the changes in signal strength
throughout the test(Proverbio, 2011) . Also, a
significant increase in HI can indicate the onset of
more serious structural damage as the loading
progresses (Lovejoy, 2008). Furthermore, The AE
knees may be used to identify possible damage
mechanisms and to locate the onset of failure
(Gostautas et al., 2005)
The results of this study show that early stage of
failure that load cycles is less than 50% ultimate load,
HI haven’t significant change. Also, the results
indicated that is in stage in stage initiate in beam –
column until specimen failure that that load cycles is
more than 50% ultimate load, HI have significant
changes. Thus, using the interpretation described
above it is clear to see that HI can indicate serious
structural damage in RC frame.
With respect to Sr that is average signal strength,
the value of Sr can be used to show the level of
damage. The primary advantage of using both HI and
Sr in this application is the high sensitivity to stage of
failure.
Figure 5 shows a intensity chart for a sample RC
frame (SPRCF1). Data point indicate that the points
relative to the first until sixth loading cycle ( micro

Panjsetooni et al.
Assessing Cracks in Reinforced Concrete Structure Using Acoustic Emission
225
cracks behavior stage) fall in the area of low damage
level and the point relative to the seventh and ninth
loading cycle ( initial cracks stage in mid span of
frame) falls in the area of moderate. Furthermore, all
of the points relative to the tenth loading cycle until
twelfth loading cycle (Damage localization until
failure in beam-column connection) fall in the area of
high damage level.
The results for RC beam and frame show that three
levels of damage (heavy, moderate and low) can be
recognised using intensity chart. Data points show that
stages of damage is recognizable using IA chart.
Table 1: a summary of maximum Historic index during cycle loading
Cycle no. Stage of
failure.
Maximum Severity Index
SPRCF1 SPRCF2 SPRCF3 SPRCF4 SPRCF5
C1 I 1.47E+06 1.24E+06 3.25E+06 1.35E+06 1.01E+06
C2 I 2.95E+06 2.10E+06 6.05E+06 1.68E+06 1.25E+06
C3 I 6.58E+06 4.84E+06 1.37E+07 4.15E+06 3.10E+06
C4 II 1.04E+06 1.04E+06 2.48E+06 1.39E+06 1.04E+06
C5 III 5.40E+06 4.96E+06 1.24E+07 6.07E+06 4.53E+06
C6 III 1.55E+07 1.29E+07 3.40E+07 1.37E+07 1.02E+07
C7 IV 1.94E+07 1.58E+07 4.22E+07 1.65E+07 1.23E+07
C8 V 4.02E+07 2.54E+07 7.88E+07 1.43E+07 1.07E+07
C9 V 4.46E+07 7.07E+07 1.38E+08 1.30E+08 9.68E+07
C10 V 6.87E+07 5.39E+07 1.47E+08 5.23E+07 3.90E+07
C11 VI 7.08E+07 6.01E+07 1.57E+08 6.62E+07 4.94E+07
C12 VII 2.32E+08 1.40E+08 4.46E+08 6.41E+07 4.79E+07
Table 2: a summary of maximum historic index during cycle loading
Cycle no. Stage of failure. Maximum Historic Index
SPRCF1 SPRCF2 SPRCF3 SPRCF4 SPRCF5
C1 I 2.33E+00 4.09E+02 4.94E+02 1.09E+03 8.16E+02
C2 I 1.10E+02 6.11E+02 8.66E+02 1.49E+03 1.11E+03
C3 I 3.48E+02 1.16E+03 1.81E+03 2.64E+03 1.97E+03
C4 II 5.90E+02 1.02E+03 1.94E+03 1.96E+03 1.46E+03
C5 III 3.40E+02 7.88E+02 1.35E+03 1.66E+03 1.24E+03
C6 III 1.13E+03 1.29E+03 2.90E+03 1.94E+03 1.45E+03
C7 IV 6.73E+03 3.97E+03 1.28E+04 1.62E+03 1.21E+03
C8 V 4.41E+03 5.23E+03 1.16E+04 8.11E+03 6.05E+03
C9 V 8.45E+03 8.38E+03 2.02E+04 1.11E+04 8.30E+03
C10 V 5.47E+03 8.88E+03 1.72E+04 1.65E+04 1.23E+04
C11 VI 1.41E+04 9.42E+03 2.82E+04 6.39E+03 4.77E+03
C12 VII 3.40E+04 2.18E+04 6.70E+04 1.28E+04 9.56E+03
Fig. 4: Sr and HI against loading cycle number –SPRCF1

International Journal of Scientific Research in Knowledge (IJSRK), 1(7), pp. 222-227, 2013
226
Fig. 5: Intensity chart –SPRCF1
5. CONCLUSIONS
This paper provides the results from tests on RC
frame under loading cycle and was monitored by AE
throughout the test. On the basis of AE activities, the
analysis of signal characteristics using intensity
analysis and with regard to damage levels, the
conclusions are presented below:
(1) Three levels of damage in concrete structure
can be identified using intensity analysis; (2) The
trend of historic and severity index during loading
cycle showed that these parameters are strongly
sensitive with cracks growth in RC frame specimens
and were able to indicate the levels of damage; (3)
Results showed that AE can be considered as a viable
method to predict the remaining service life of
reinforced concrete.
Acknowledgment
The authors would like to thank Universiti Sains
Malaysia (USM) for providing support through the
short term Grant [304/PAWAM/6039047]
REFERENCES
Astm E (2006). 06a Standard Test Method for
Measurement of Fracture Toughness. Annual
Book of Astm Standards. Philadelphia PA:
American Society for Testing and Materials.
Blessing J, Fowler T, Strauser F. (1992). Intensity
analysis. Proc., 4th Int. Symp. on Acoustic
Emission from Composite Materials. American
Society for Nondestructive Testing.
Degala S, Rizzo P, Ramanathan K, Harries KA
(2009). Acoustic emission monitoring of CFRP
reinforced concrete slabs. Construction and
Building Materials, 23: 2016-2026.
Golaski L., Gebski P, Ono K (2002). Diagnostics of
reinforced concrete bridges by acoustic
emission. Journal of acoustic emission, 20: 83-
89.
Gostautas RS, Ramirez G, Peterman RJ, Meggers D
(2005). Acoustic emission monitoring and
analysis of glass fiber-reinforced composites
bridge decks. Journal of bridge engineering, 10:
713-721.
Holford K, Lark R (2005). Acoustic Emission Testing
Bridges.
Lovejoy SC (2008). Acoustic emission testing of
beams to simulate SHM of vintage reinforced
concrete deck girder highway bridges.
Structural Health Monitoring, 7: 329-346.
Nair A, Cai C (2010). Acoustic emission monitoring
of bridges: Review and case studies.
Engineering structures, 32: 1704-1714.
Panjsetooni A, Bunnori NM (2013). Damage
Evaluation Assessment of Reinforced Concrete
Structure using b-value and Damage Parameter
Analysis of Acoustic Emission Signals.
International Journal of Scientific Research in
Knowledge (IJSRK), 1: 44-50.
Pollock A (1981). Acoustic emission amplitude
distributions. International Advances in
Nondestructive Testing., 7: 215-239.
Proverbio E (2011). Evaluation of deterioration in
reinforced concrete structures by AE technique.
Materials and corrosion, 62: 161-169.
Surgeon M, Wevers M (1999). Modal analysis of
acoustic emission signals from CFRP
laminates. NDT & E International, 32: 311-322.

Panjsetooni et al.
Assessing Cracks in Reinforced Concrete Structure Using Acoustic Emission
227
Alireza Panjsetooni was born in Western area of Iran on 2rd January 1976. His first degree at University
Tabriz in Bach of Civil Eng (Hons) 2000. Then he continued deeply in Master of earthquake
Engineering (M.Struct) at Universiti Tehran in 2008 and currently his pursuing in PhD level at Universiti
Sains Malaysia in Structural Health Monitoring.
Norazura Muhamad Bunnori (PhD) has been involved in Acoustic Emission (AE) technique since 2004
while she was pursuing her PhD study at Cardiff University, Wales, UK. She was graduated from
Cardiff University in 2008 and continues with the AE research area in Universiti Sains Malaysia (USM),
Malaysia. Currently she is working as a Senior Lecturer at School of Civil Engineering, Universiti Sains
Malaysia (USM) since 2009. The research covered several topics of AE applications and analysis
(quantitative and qualitive). The aim is to continue the AE study especially in Structural Health
Monitoring (SHM) research area and to discover more in this potential area. The passion towards AE is
deep and she believes that there are a great number of information can be studied and discovered with
this tool.
Dr. Lau is a lecturer at School of Civil Engineering, Engineering Campus, University Sains Malaysia.

International Journal of Scientific Research in Knowledge (IJSRK), 1(7), pp. 228-237, 2013 Available online at http://www.ijsrpub.com/ijsrk
ISSN: 2322-4541; ©2013 IJSRPUB
http://dx.doi.org/10.12983/ijsrk-2013-p228-237
228
Full Length Research Paper
Time-Dependent Creep Analysis of Rotating Thick-Walled Cylindrical Pressure
Vessels under Heat Flux
Mohammad Zamani Nejad*, Mosayeb Davoudi Kashkoli
Mechanical Engineering Department, Yasouj University, P. O. Box: 75914-353, Yasouj, Iran
*Corresponding Author: [email protected]; [email protected]
Received 17 May 2013; Accepted 18 June 2013
Abstract. This paper presents a closed-form analytical solution for time-dependent creep stresses and displacements of
isotropic and homogeneous rotating thick-walled cylindrical pressure vessels under heat flux. Assuming that the thermoelastic
creep response of the material is governed by Norton’s law, using equations of equilibrium, strain-displacement and stress-
strain relations, a differential equation for the displacement rate is obtained and then the stress rates are calculated. When the
stress rates are known, the stresses at any time are calculated iteratively. The analytical solution is obtained for the conditions
of plane strain and plane stress. The thermal loading is as: inner surface is exposed to a uniform heat flux, and the outer surface
is exposed to an airstream. Following this, profiles are plotted for the radial stress, circumferential stress and axial stress as a
function of radial direction and time for different values of angular velocity. This analytical solution can be used easily to study
the dependence of the stresses on time and temperature. The values used in this study are arbitrary chosen to demonstrate
the effect of creep on displacements, and stresses distributions.
Key words: Thick Cylindrical Pressure Vessel, Heat Flux, Rotating, Creep, Time-Dependent
1. INTRODUCTION
Many components are used in modern technologies
such as nuclear, aircraft, space engineering and
pressure vessels are subjected to high temperature
environment and complex loading conditions over a
long time. Therefore, creep stress analysis of these
components is very important in these applications.
Weir (1957) investigated creep stresses in
pressurized thick walled tubes. Considering large
strains, Rimrott and Luke (1961) obtained the creep
stresses of a rotating hollow circular cylinder made of
isotropic and homogeneous materials. Bhatnagar and
Gupta (1662) obtained solution for an orthotropic
thick-walled internally pressurized cylinder by using
constitutive equations of anisotropy creep and
Norton’s creep law. Assuming the plane strain
condition, Bhatnagar et al. (1984) obtained analysis of
an internally pressurized, homogeneous, orthotropic
rotating cylinder subjected to a steady state creep
condition. In another study, considering the effect of
anisotropy on stress and strain, creep analysis of
thick-walled orthotropic rotating cylinders has been
investigated by Bhatnagar et al. (1986). Yang (2000)
obtained an analytical solution to calculate thermal
stresses of thick cylindrical shells made of
functionally graded materials with elastic and creep
behavior. Gupta and Pathak (2001), studied thermo
creep analysis in a pressurized thick hollow cylinder.
Hoseini et al. (2011) presented a new analytical
solution for the steady state creep in rotating thick
cylindrical shells subjected to internal and external
pressure. Assuming that the creep response of the
material is governed by Norton’s law, Zamani Nejad
et al. (2011) presented a new exact closed form
solution for creep stresses in isotropic and
homogeneous thick spherical pressure vessels. In
another study, assuming the mechanical properties
vary nonlinearly in the radial direction, Zamani Nejad
et al. (2013) obtained a new exact solution for steady
state creep stresses of pressurized thick spherical
shells made of functionally graded materials. In this
article, assuming that the thermo-creep response of the
material is governed by Norton’s law, an analytical
solution is presented for the calculation of time-
dependent creep stresses of isotropic and
homogeneous rotating thick-walled cylindrical
pressure vessels under heat flux.
2. SOLUTION FOR LINEAR ELASTIC
BEHAVIOR OF ROTATING THICK
CYLINDRICAL PRESSURE VESSEL
For the stress analysis in rotating cylinder, having
material creep behavior, the solutions of the stresses at
a time equal to zero (i.e. the initial stress state) are
needed, which correspond to the solution of materials
with linear elastic behavior. In this section, equations
to calculate such linear stresses in rotating cylinder
analytically will be given briefly for two cases: (a)
plane strain; (b) plane stress. Consider a thick-walled
cylinder with an inner radius a , and an outer radius

Zamani Nejad and Davoudi Kashkoli
Time-Dependent Creep Analysis of Rotating Thick-Walled Cylindrical Pressure Vessels under Heat Flux
229
b , subjected to internal pressure iP and external
pressure oP that are axisymmetric, and rotating at a
constant angular velocity about its axis (Fig. 1).
2.1. The case of plane strain
The heat conduction equation for the one-
dimensional problem in cylindrical coordinates
simplifies to:
0T
rr r
(1)
where T T r is temperature distribution in the
thick cylindrical pressure vessel. The general solution
of Eq. (1) is:
1 2T r A lnr A (2)
The boundary conditions for when that inner
surface is exposed to a uniform heat flux aq , and the
outer surface is exposed to an airstream temperature,
are as follows:
aT q , r a
T h T T , r b
dTT
dr
(3)
Here , T and h
are thermal conductivity,
temperatures and heat transfer coefficient of the
surrounding media, respectively. Substituting Eq. (2)
into Eq. (3) yields:
1
2
q
q q
aqA
aq aqA T lnb
bh
(4)
Therefore:
q qaq aq rT r T ln
bh b
(5)
The displacement in the r-direction is denoted by
ru . Three strain components can be expressed as:
rrr
du
dr (6)
ru
r (7)
0zz
(8)
where rr ,
and zz are radial, circumferential
and axial strains. The stress-strain relations for
homogenous and isotropic materials are:
1
1 1 2 1rr rr
E
(9) 1
1T
1
1 1 2 1rr
E
(10) 1
1T
(11) zz rr E T
where rr , and
zz are radial, circumferential
and axial stresses, respectively. Here E , and are
the Young's modulus, Poisson's ratio and thermal
expansion coefficient, respectively.
Fig. 1: Geometry and Boundary Conditions of the cylinder
The equilibrium equation of the rotating cylindrical
pressure vessel, in the absence of body forces, is
expressed as:
2rr rrdr
dr r
(12)
where is density.

International Journal of Scientific Research in Knowledge (IJSRK), 1(7), pp. 228-237, 2013
230
Using Eqs. (5-12), the essential differential equation
for the displacement ru can be obtained as:
2
2
1r rd u du dln E
dr dr r dr
1
1
ru dln E
r dr r
1
1
d dT dT T ln E
dr dr dr
2
1 1 2
1r
E
(13)
For a homogenous and isotropic material, Young's
modulus, Poisson's ratio , and the thermal expansion
coefficient ,are constant, therefore, Eq. (13) on
simplifying yields: 2
2 2
1r r rd u du u
dr r dr r
1
1
dT
dr
2
1 1 2
1r
E
(14)
The general solution of the displacement ru is:
2
1
1
1
r
r a
Cu ( r ) C r Trdr
r r
3 2
1 1 2
8 1r
E
(15)
The corresponding stresses are:
2
1 21 2
1 1 2rr
E CC
r
2 2
2
1 3 2
1 8 1
r
aTrdr r
r
(16)
2
1 21 2
1 1 2
E CC
r
2
1
1
r
a
E TTrdr
r
2 21 2
8 1r
(17)
zz rr E T
(18)
To determine the unknown constants 1C and 2C in
each material, boundary conditions have to be used,
which are:
rr i
rr o
P , r a
P , r b
(19)
The unknown constants 1C and 2C
are given in
Appendix.
2.2. The case of plane stress
For the case of plane stress the stress-strain relations
are:
(20) 2
11
rr rr
ET
(21) 2
11
rr
ET
(22) 0zz For The case of plane stress the differential equation
for displacement ru is:
2
2 2
1r r rd u du u
dr r dr r
2
211
dTr
dr E
(23)
The solution of Eq. (23) is:
2
1
1 r
r a
Cu C r Trdr
r r
23 21
8r
E
(24)
The corresponding stresses are:
2
1 2 2
1
1 1
r
rr a
E CC Trdr
r r
2 23
8r
(25)
21 2 2
1
1 1
r
a
E CC Trdr
r r
2 21 3
8E T r
(26)
To determine the constants 1C and 2C , boundary
conditions have to be used which are the same as
those for the case of plane strain (see Eq. (19)). The
unknown constants 1C and 2C are given in Appendix.
3. SOLUTION FOR CREEP BEHAVIOR OF
ROTATING THICK CYLINDRICAL
PRESSURE VESSEL
For materials with creep behavior, we use Norton's
law (Finnie and Heller, 1959) to describe the relations
between the rates of stress (ij ) and strain ( ij ) in the
multi-axial form:
(27) 11 3
2
( N )
ij ij kk ij eff ijD SE E
(28) 1
3ij ij kk ijS
3 1
2 2eff ij ijS S

Zamani Nejad and Davoudi Kashkoli
Time-Dependent Creep Analysis of Rotating Thick-Walled Cylindrical Pressure Vessels under Heat Flux
231
(29) 2 2 2
rr rr zz zz
where D and N are material constants for creep.
eff is the effective stress,
ijS is the deviator stress
tensor and rr , and
zz are respectively the
radial, tangential and axial stresses. The relations
between the rates of strain and displacement are:
(30) rrr
du
dr
(31) ru
r
and the equilibrium equation of the stress rate is:
(32) 0rrrrd
dr r
For the case of plane strain ( 0zz ), the relations
between the rates of stress and strain are:
1
1 1 2 1rr rr
E
13
2 1
( N )
eff rrD S S
(33)
1
1 1 2 1rr
E
13
2 1
( N )
eff rrD S S
(34)
where:
rr rr zz zzS S S , S S S (35)
For the case of plane stress ( 0zz ), the relations
between the rates of stress and strain are:
1
2
3
1 2
N
rr rr eff rr
ED S
(36)
1
2
3
1 2
N
rr eff
ED S
(37)
where:
rr rr rrS S S , S S S (38)
3.1. The case of zz being zero
Using Eqs. (30-35), the essential differential equation
for the displacement rate ru in thick cylindrical
pressure vessel can be obtained as: 2
2
1r rd u du d(ln E )
dr dr r dr
1ru d(ln E )
r dr r
13
2
( N )
eff rr
d(ln E )D S S
dr
13
2
( N )
eff rr
dD S S
dr
13
12
rr( N )
eff
S SD
r
(39)
where:
1
(40)
For a homogenous and isotropic material, Young's
modulus is constant, also the case of , D and N being constant is studied in this article, therefore, Eq.
(39) on simplifying yields: 2
2 2
r r rd u du u
dr rdr r
13
2
N
eff rr
dD S S
dr
131
2
N rreff
S SD
r
(41)
In general, the quantities eff , rrS and S
are
very complicated functions of the coordinate r , even
in an implicit function form. Therefore, it is almost
impossible to find an exact analytical solution of Eq.
(41). We can find an asymptotical solution of Eq.
(41). At first, we assume that eff , rrS and S
are
constant, i.e. they are independent of the coordinate r .
Then, the solution of Eq. (41) is:
121
1 3
2 2
N
r eff
Du D r D
r
2
rr
aS S r
r
2 21 2
1 2 2rr
r a aS S r lnr lna
r r
(42)
where the unknown constants 1D and 2D can be
determined from the boundary conditions. The
corresponding stress rates are:
2
1 21 2
1 2 1rr
E DD
r
13
4
N
eff rrD S S
2
21 1 2
a
r
1 2 1 2
1 2
rrS Sln r
2 2
2 2
1 2 1 2
2
a ln a a
r r
131
2
N
eff rrD S S
(43)

International Journal of Scientific Research in Knowledge (IJSRK), 1(7), pp. 228-237, 2013
232
2
1 21 2
1 2 1
E DD
r
13
4
N
eff rrD S S
2
21 1 2
a
r
1 2 1 2
1 2
rrS Sln r
2 2
2 2
1 2 1 2
2
a lna a
r r
131
2
N
eff rrD S S
(44)
13
2
N
zz rr eff zzD S (45)
The boundary conditions for a cylindrical vessel
subjected to internal and external pressure are given
as:
(46) 0
0
rr
rr
, r a
, r b
Using these boundary conditions the constants 1D
and 2D are obtained:
121 2
31 2
4
N
eff
DD D
a
2 1 2 1 2rrS S
rrS S lna
131
2
N
eff rrD S S (47)
2 1
2 2 2
3
4 1 2
N
effab DD
b a
2 2
2
1 2rrS S b a
b
1
1 2 21
rrS S lna
2
2
1 21 2
2
a lnalnb
b
2
2
1 2
2
a
b
(48)
When the stress rate is known, the calculation of
stresses at any time it should be performed iteratively:
(49) 1
1
i i i i
ij i ij i ij ir,t ( r,t ) ( r,t )dt
where:
(50)
0
ik
ik
t dt
To obtain a generally useful solution, a higher
order approximation of eff ,
rrS and S should be
made:
1
effr r
eff eff
dr
drr r r r!
2
2 2
2
effr r
dr
dr r r!
3
3 3
3
effr r
dr
dr r r ...!
(51)
1
'
rrr r' '
rr rr
dS r
drS r S r r r!
2
2 2
2
'
rrr r
dS r
dr r r!
3
3 3
3
'
rrr r
dS r
dr r r ...!
(52)
1
'
r r' '
dS r
drS r S r r r!
2
2 2
2
'
r r
dS r
dr r r!
3
3 3
3
'
r r
dS r
dr r r ...!
(53)
where r is one given point in the creep layer, the
center point of the creep layer.
3.2. The case of zz
being zero
Using Eqs. (30-32) and Eqs. (36-38), the essential
differential equation for the displacement rate ru in
thick cylindrical pressure vessel can be obtained as:
2
1
2 2
3
2
Nr r r
eff rr
d u du u DS S
dr rdr r r (54)
The solution of Eq. (54) is:
121
1 3
2 2
N
r eff rr
Du D r D S S
r
1
2r ln r a lna r a
(55)
where the unknown constants 1D and 2D can be
determined from the boundary conditions. The
corresponding stress rates are:
121 2
1 3
1 1 4
N
rr eff
E DD D
r

Zamani Nejad and Davoudi Kashkoli
Time-Dependent Creep Analysis of Rotating Thick-Walled Cylindrical Pressure Vessels under Heat Flux
233
1
1 11 2
rrS S aln r
r
13
2 1
N rr
eff
Sa lnaD
r
(56)
121 2
1 3
1 1 4
N
eff
E DD D
r
1
1 11 2
rrS S aln r
r
13
2
N
eff
alnaD S
r
(57)
where
1
21 2
1 3
1 4 1
N
eff rrD S SDD
b
1
1 1 22
lna lna
13
2 1
N rr
eff
SD
(58)
2 1
2 2 2
3
4
N
eff rrab D S SD
b a
1
1 12
a aln lna
b b
(59)
4. RESULTS AND DISCUSSION
In the previous section, the analytical solution of time-
dependent creep stresses and displacements of
isotropic and homogeneous rotating thick-walled
cylindrical pressure vessels under heat flux and
uniform pressures on the inner and outer surfaces have
been obtained. In this section, some profiles are
plotted for the radial stress, circumferential stress and
axial stress as a function of radial direction and time
for different values of angular velocity.
A cylindrical pressure vessel with creep behavior
under internal and external pressure is considered.
Radii of the cylinder are 20a mm, 40b mm. In
addition, angular velocity varies from 600 rpm to
1200 rpm. The other data are:
°
w207GPa 0 292 43
m. CE , . ,
6 ° 810 8 10 C 1 4 10 2 25. , D . , N .
3
2 2 °
w w7798kg m 3000 6 5
m m . Ca, q , h .
25 80MPa 0MPao
i oT C , P , P
The thermal loading is as follows: inner surface is
exposed to a uniform flux, aq , and the outer surface is
exposed to an airstream at T.
4.1. The case of plane strain
The stress distribution after 10h of creeping are
plotted in Fig. (2), (3) and (4) for the stress
components rr
, and zz respectively.
According to Fig. (3) and (4), radial and
circumferential stresses for all values of are
compressive. It can be seen that radial and
circumferential stresses decreases as increases.
Fig. 2: The radial stress calculated from the asymptotic solution after 10 h of creeping
Fig. 3: The circumferential stress calculated from the asymptotic solution after 10 h of creeping

International Journal of Scientific Research in Knowledge (IJSRK), 1(7), pp. 228-237, 2013
234
Fig. 4: The axial stress calculated from the asymptotic solution after 10 h of creeping
The time dependent stresses at point r=30 mm, are
plotted in Fig. (5), (6) and (7). It is clear that the
values of all three stresses are reduced over time. It is
also significant that at this radius, all three stresses are
compressive. According to Fig. (5), radial stress
decreases as increases.
Fig. 5: Time-dependent radial stress at the point r=30 mm
Fig. 6: Time-dependent circumferential stress at the point r=30 mm
Fig. 7: Time-dependent axial stress at the point r=30 mm
4.2. The case of plane stress
The stress distribution after 10h of creeping are
plotted in Fig. (8) and (9) for the stress components
rr and respectively. According to Fig. (9),
maximum value of circumferential stress occurs at the
inner radius and also all stresses are compressive for
different values of angular velocity .
The time dependent stresses at point r=30 mm, are
plotted in Fig. (10) and (11). According to Fig. (10)

Zamani Nejad and Davoudi Kashkoli
Time-Dependent Creep Analysis of Rotating Thick-Walled Cylindrical Pressure Vessels under Heat Flux
235
and (11), radial and circumferential stresses are
compressive and the values of all two stresses are
reduced over time for different values of angular
velocity .
Fig. 8: The radial stress calculated from the asymptotic solution after 10 h of creeping
Fig. 9: The circumferential stress calculated from the asymptotic solution after 10 h of
creeping
Fig. 10: Time-dependent radial stress at the point r=30 mm
Fig. 11: Time-dependent circumferential stress at the point r=30 mm
5. CONCLUSION
This study, an analytical solution procedure has
developed for the analysis of an internally and
externally pressurized, isotropic homogeneous
rotating thick-walled cylindrical pressure vessels
subjected to a time-dependent thermo creep condition.
For the stress analysis in a cylindrical pressure vessel,
having material creep behavior, the solutions of the
stresses at a time equal to zero (i.e. the initial stress
state) are needed, which correspond to the solution of
materials with linear elastic behavior. The analytical
solution is obtained for the conditions of plane strain
and plane stress. For the creep material behavior, the

International Journal of Scientific Research in Knowledge (IJSRK), 1(7), pp. 228-237, 2013
236
solution is asymptotic. For the stress analysis after a
long time creeping, the iterative procedure is
necessary. Norton's power law of creep is employed to
derive general expressions for stresses and strain rates
in the thick rotating cylindrical pressure vessel. The
pressure, inner radius and outer radius are considered
constant. Material properties are considered as
constant. The heat conduction equation for the one-
dimensional problem in polar coordinates is used to
obtain temperature distribution in the cylinder.
According to stress distribution after 10h of creeping
for the case of plane stress, both radial and
circumferential stresses remain compressive over the
entire cylindrical vessel radius. It must be noted that
for the case of plane stress, the maximum value of
circumferential stress at the point r=30 mm, is at a
time equal to zero (i.e. the initial stress state) and it
decreases as time increases while the maximum value
of radial stress at the point r=30 mm, is at almost
Time= 1h and it decreases as time increases.
According to stress distribution after 10h of creeping
for the case of plane strain, the maximum value of all
three stresses at the point r=30 mm, are at a time
equal to zero (i.e. the initial stress state), in other word all three stresses decrease as time increases.
6. APPENDIX
The unknown constants in Eqs. (16) and (17) are
2
1 2
1 1 2 1 2iP CC
E a
2 2
3 2 1 2 1
8 1a
E
(A1)
2
2 2 2
1i oP P abC
E b a
2
2 2
1
1 1 2
b
a
aTrdr
b a
2
23 2 1
8 1
ab
E
(A2)
The unknown constants in Eqs. (25) and (26) are
2
1 2
1 1
1
iP CC
E a
2 23 1
8a
E
(A3)
2
2 2 2
1i oP P abC
E b a
2
2 2
1
1
b
a
aTrdr
b a
2
23 1
8
ab
E
(A4)
REFERENCES
Bhatnagar NS, Gupta SK (1969). Analysis of thick-
walled orthotropic cylinder in the theory of
creep. Journal of the Physical Society of Japan,
27: 1655-1662.
Bhatnagar NS, Kulkarni PS, Arya VK (1984). Creep
analysis of an internally pressurized orthotropic
rotating cylinder. Nuclear Engineering and
Design, 83: 379-388.
Bhatnagar NS, Kulkarni PS, Arya VK (1986). Creep
analysis of orthotropic rotating cylinders
considering finite strains. International Journal
of Non-Linear Mechanics, 21: 61-71.
Finnie I, Heller WR (1959). Creep of Engineering
Materials. New York, McGraw-Hill.
Gupta SK, Pathak S (2001). Thermo creep transition
in a thick walled circular cylinder under internal
pressure. Indian Journal of Pure and Applied
Mathematics, 32: 237-253.
Hoseini Z, Nejad MZ, Niknejad A, Ghannad M
(2011). New exact solution for creep behavior
of rotating thick-walled cylinders. Journal of
Basic and Applied Scientific Research, 10:
1704-1708.
Nejad MZ, Hoseini Z, Niknejad A, Ghannad M
(2011). A new analytical solution for creep
stresses in thick-walled spherical pressure
vessels. Journal of Basic and Applied Scientific
Research, 11: 2162-2166.
Nejad MZ, Hoseini Z, Taghizadeh T, Niknejad A
(2013). Closed-form analytical solution for
creep stresses of pressurized functionally
graded material thick spherical shells.
Advanced Science Letters, 19: 464-467.
Rimrott FPJ, Luke JR (1961). Large strain creep of
rotating cylinders. ZAMM-Zeitschrift fur
Angewandte Mathematik und Mechanik, 41:
485-500.
Weir CD (1957). The creep of thick walled tube under
internal pressure. Journal of Applied
Mechanics, 24: 464-466.
Yang, YY (2000). Time-dependent stress analysis in
functionally graded materials. International
Journal of Solids and Structures, 37: 7593-
7608.

Zamani Nejad and Davoudi Kashkoli
Time-Dependent Creep Analysis of Rotating Thick-Walled Cylindrical Pressure Vessels under Heat Flux
237
Mohammad Zamani Nejad is currently as an assistant professor at the department of Mechanical
Engineering in Yasouj University, Yasouj, Iran. He received his bachelor’s degree in Mechanical
Engineering-Solids Design in Shiraz University and his master’s degree in Mechanical Engineering-
Applied Design in Mazandaran University. He obtained his Ph.D. from Tarbiat Modares University,
Tehran, Iran. His research interests include thermo-elasto plastic analysis and creep analysis of solids.
Mosayeb Davoudi Kashkoli received his bachelor’s degree in Mechanical Engineering-Solids Design in
Yasouj University, Yasouj, Iran. He is currently a graduate student in Mechanical Engineering-Applied
Design in Yasouj University. In his master course, he conducted many researches under the supervision of
Dr. Zamani Nejad. His research interests is creep stress analysis in axisymmetric thick shells.