abnormality of 2-deoxyglucose uptake kinetics in fibroblasts at low concentrations
TRANSCRIPT

Vol. 123, No. 2, 1984 BIOCHEMICAL AND BIOPHYSICAL RESEARCH COMMUNICATIONS
September 17, 1984 Pages 535-542
‘ABNORMALITY OF P-DEOXYGLUCOSE UPTAKE KINETICS IN FIBROBLASTS AT LOW CONCENTRATIONS
Luc CYNOBERl , Jean-Louis AUGET*, Jean AGNERAY and Ohvanesse G. EKINDJIAN
Laboratoire de Biochimie G&&ale et *DBpartement de Mathhmatiques Universit6 Paris XI, rue J.B. Clement - 92290 CHATENAY-MALABRY - FRANCE
Received July 9, 1984
Summary : 2-deoxyqlucose uptake rates at low sugar concentrations (less than 500 PM) appeared to be lower than those predicted by the Michaelis- Menten model which correctly described higher concentrations. This pheno- menon which we will call concentration-dependent transport lag, was also observed for L-glucose uptake which suggest that this phenomenon is car- rier-independent. A model involving the perimembrane space is developed which, for L-glucose, gives kl = 0.931 % 0.072 x 10e6 1. mg protein-‘. minute-‘, kz = 2.97 ? 0.19 x lo-’ 1. mg protein-’ . minute-’ and So = 88,8 f 4,3 $4 ; where kl is the diffusion constant in the cell mem-
brane, k2 is the diffusion constant in the perimembrine space and SO the sugar concentration required in the external medium in order to provide an equivalent sugar concentration in the transport carrier area.
2-deoxyglucose is a non metabolizable glucose analogue transported into
cells according to a facilitated mode as is glucose, but which is not fur-
ther metabolized after initial phosphorylation. It thus has been considered
a good molecule for studying glucose transport, since it minimizes problems
that might arise from enzymatic reactions in the glycolytic pathway (l-4).
When studying the factors that can induce variations in kinetic parameters
for uptake of this sugar in chick embryo fibroblasts (unpublished data),
we found that, at low E-deoxyglucose concentrations, transport did not fol-
low the Michaelis-Menten law. Thus, in the present paper, we study 2-deoxy-
glucose transport at low sugar concentrations and, in parallel, the uptake
of L-glucose, a sugar which is not transported into cells but which enters
uniquely according to an unsaturable process (5-7).
MATERIALS AND METHODS
2-deoxy-D-glucose, L-glucose and cytochalasin B were from Sigma (St Louis, MO, USA), Trypsin TPCK was purchased from Worthington
1 to whom correspondence should be adressed.
0006-291X/84 $1.50
535 Copyright 0 1984 by Academic Press, Inc.
All rights of reproduction in any form reserved.

Vol. 123, No. 2, 1984 BIOCHEMICAL AND BIOPHYSICAL RESEARCH COMMUNICATIONS
(Freehold, NJ, USA). Z-deoxy-D-[1-‘Ii] glucose (spec. act. 20-25 Ci/mmol) and L-[l-“‘Cl glucose (spec. act. 58 mCi/mmol) were obtained from Amersham (Les Ulys, France).
Normal chick embryo fibroblasts were cultured as previously described (8) in 9.6 cm2 dishes. Z-deoxyglucose and L-glucose uptake were performed as follows : confluent cultures were washed with 3 x 2 ml Dulbecco’s Phosphate Buffered Saline (PBS) pH 7,40, at +37OC. Then 2 $i of labelled Z-deoxyglucose or labelled L-glucose, diluted in variable amounts of unlabelled Z-deoxyglucose or L-glucose respectively, were added to every dish. After a 5-minute (in the case of Z-deoxyglucose) or a 15-minute (in the case of L-glucose) uptake at +37OC, plates were transferred to an ice-bath and rinsed with 3 x 2 ml icecold PBS. 0,5 ml trichloracetic acid 5% (w/v) was added for 1 hour at +4OC. After neutralization by 0.35 M NaOH, trichloracetic soluble material was counted in Aqualuma solvent (Lumac, Paris, France). 1 ml of 1 M NaOH was added to the tri- chloracetic insoluble material and protein content was measured by Lowry’s me- thod (9). In order to avoid errors in kinetic analysis of the facilited mode of sugar transport, initial transport rates were measured (transport rate was linear at least for 5 minutes ; data not shown). Moreover, simple diffusion (carrier independant) was estimated by using cytochalasin B 4 uM in order to inhibit facilitated mode of transport. Cytochalasin B was solubilized in DMSO. Final concentration of the solvent in medium was 0.4% (v/v).
Statistical data analysis was performed by means of the GENSTAT package (10) dealing with linear models and the NONLIN program (11) enabling processing of more sophisticated non-linear models. Whenever it was possible to linearize data, we chose the GENSTAT package because its very ease use. In both cases, an adequate weighting factor was used in the weighted least-square regression procedure.
RESULTS
To study 2-deoxyglucose uptake kinetic in chick embryo fibroblasts, we used
18 sugar concentration levels ranging from 5 uM to 15 mM and obtained (figure 1)
the classical curve defined by Michaelis and Menten and showing a carrier-
mediated diffusion process (2). With GENSTAT program, we found Km = 4.02 mM
and Vmax q 6.39 nmol.mg protein -l.minute-l . Quite similar results appeared with
NONLIN program (Km = 4.00 mM and Vmax q 6.09 nmol.mg protein -l.minute-l ). These
values agree with those from previous findings (2, 12-14).
However, when only low~sugar concentrations were considered (l-500 PM), we no-
ticed that, suprisingly, uptake did not follow the Michaelis-Menten law
(figure 1, right panel). In contrast, simple diffusion which is not inhi-
bited by cytochalasin B showed linear kinetics. This fact suggested an in-
volvment of the carrier in the phenomenon we called concentration-dependent
transport lag. However, as cytochalasin B is dissolved in DMSO, which has
been said to modifiy membrane fluidity (15), we studied L-glucose uptake
(within a lo-500 PM range) which is known to be carrier-independent. The
536

Vol. 123, No. 2, 1984 BIOCHEMICAL AND BIOPHYSICAL RESEARCH COMMUNICATIONS
. ..* . . . .
,..* ..--
. ..* ..a.
. . . . ..*
*... ..-*
.:.
12 5 10 15
2 - DEOXYGLUCOSE CONCENTRATION (mM )
Figure 1 - 2-deoxyglucose uptake kinetic. Confluent cultures were incu- bated for 5 minutes with 18 sugar concentration levels in 5 uM to 15 mM range, with (m) or without (0) cytochalasin B (4 PM in DMSO 0.04%). Right panel is an extension of the curve for low 2-deoxyglucose concentrations. Data are given as mean ? SD from triplicate measurements.
concentration-dependent transport lag was again observed (figure 2 A) which
shows that this phenomenon is a carrier-independent process.
Moreover it disappeared in presence of DMSO 0.04 E (figure 2 8) .Finally,
the concentration dependent transport lag process for Z-deoxyglucose up-
take was abolished after a Z-minute exposure to trypsin (200 ug/ml) under
conditions which allow the removal of some external membrane glycoproteins
without cell detachment from the substratum (data not shown).
537

Vol. 123, No. 2, 1984 BIOCHEMICAL AND BIOPHYSICAL RESEARCH COMMUNICATIONS
L-GLUCOSE CONCENTRATION (PM )
Figure 2 - L-glucose uptake kinetic at low sugar concentrations. Cultures were incubated for 15 minutes with 5 L-glucose concentration levels from 10 to 500 UM (A) or with 7 L-glucose concentration levels from 1 to 300 uM (6) in absence (0) or presence (B) of DMSO 0.04% (v/v). Data are given as mean * SD from triplicate measurements.
DISCUSSION
The concentration-dependent transport lag process has not been reported in the
literature. However, Weber’s work (13) suggested the existence of such a
phenomenon (see its figure 7 A) with regard to uptake kinetics for con-
fluent chick embryo fibroblasts. Such a phenomenon also appeared in Decker
and Lipmann’s paper (6), where 2-deoxyglucose uptake in membrane vesicles
from chick embryo fibroblasts was studied. Unfortunately,in both studies
(6, 13), this phenomenon was not discussed, perhaps because it was consi-
dered an artefact. Very little information exists about this topic for
the following reasons : i) few authors used such a narrow sugar concen-
tration range, since it does not permit calculation of Km and Vmax but
only the Km/Vmax ratio (16) and ii) since cytochalasin I3 is dissolved in
DMSD, total uptake is often measured in a DMSD-containing solution (17-19).
Indeed, we showed that DMSO removes the phenomenon.
538
Vol. 123, No. 2, 1984 BIOCHEMICAL AND BIOPHYSICAL RESEARCH COMMUNICATIONS
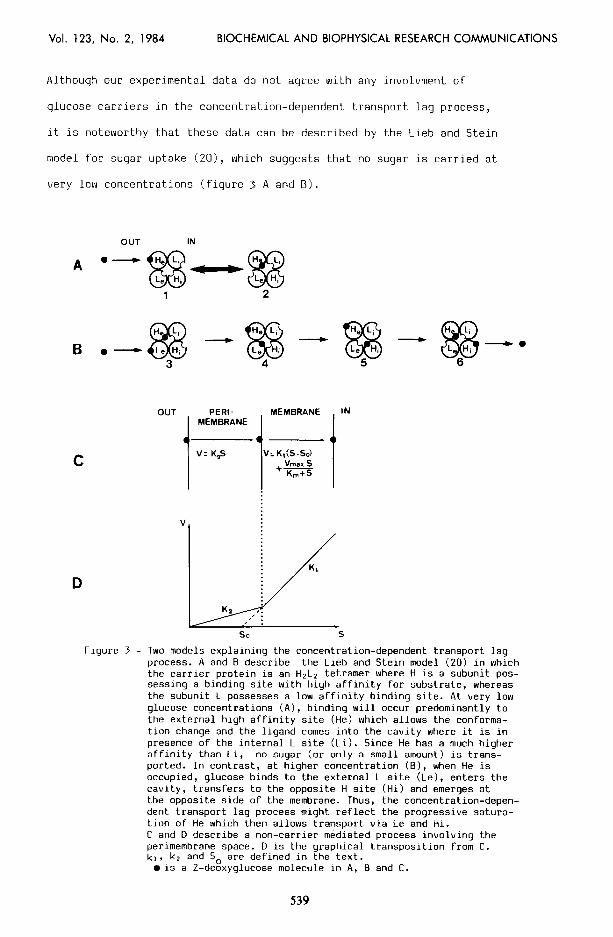
Although our experimental data do not agree with any involvment of
glucose carriers in the concentration-dependent transport lag process,
it is noteworthy that these data can be described by the Lieb and Stein
model for sugar uptake (ZO), which suggests that no sugar is carried at
very low concentrations (figure 3 A and B).
C
D
OUT
l ’ ggN-@ 1 2
.-fig-@-@-@-
V
KI
LK
K2 ,,‘: , :
SO S
Figure 3 - Two models explaining the concentration-dependent transport lag process. A and B describe the Lieb and Stein model (20) in which the carrier protein is an H2LZ tetramer where H is a subunit pos- sessing a binding site with high affinity for substrate, whereas the subunit L possesses a low affinity binding site. At very low glucose concentrations (A), binding will occur predominantly to the external high affinity site (He) which allows the conforma- tron change and the ligand comes into the cavity where it is in presence of the internal L site (Li). Since He has a much higher affinity than Li, no sugar (or only a small amount) is trans- ported. In contrast, at higher concentration (B), when He is occupied, glucose binds to the external L site (Le), enters the cavity, transfers to the opposite H site (Hi) and emerges at the opposite side of the membrane. Thus, the concentration-depen- dent transport lag process might reflect the progressive satura- tion of He which then allows transport via Le and Hi. C and D describe a non-carrier mediated process involving the perimembrane space. D is the graphical transposition from C. kr, k, and So are defined in the text.
0 is a Z-deoxyglucose molecule in A, B and C.
539

Vol. 123, No. 2, 1984 BIOCHEMICAL AND BIOPHYSICAL RESEARCH COMMUNICATIONS
The alternative assumption, in agreement with our experimental data,
is as follows : the membrane cell is not a flat surface in which glu-
cose carriers act like windows. The cell membrane is coated with nume-
rous componentssuch as glycoproteins (especially fibronectin) and pro-
teoglycans which might limit sugar accessibility to its carrier. We pro-
pose that, at low sugar concentrations, molecules accumulate in the pe-
rimembrane space and that a critical sugar concentration (equivalent to
the saturation concentration of this space) is required in the external
medium. Such an assumption was previously expressed without any evidence
by Stoker and Piggott (‘21) who suggested that mucopolysaccharides limit
accessibility to cell receptors for sugar, amino acids and growth fac-
tors contained in the serum. On the other hand, Foley et al. (ZZ), after
observing a lag-time process for sugar uptake in adipocytes, proposed
a pluricompartimental model similar to ours : transport would occur
first by diffusion towards an aqueous intramembrane pore, and then, after
diffusion into the pore, by transport into the interior of the cell.
Considering our model, diffusion into the perimembrane space would
follow Fick’s law (V q k2S) as does simple diffusion accross the mem-
brane. However, the model for diffusion in cell membrane must be modified
since this process should occur only when an adequate concentration level
(So)is reached in the carrier area.
Thus, total diffusion can be expressed as the sum of 2 diffusion processes
with V = k2S + kl (5 - So) where k2 is the diffusion constant in the peri-
membrane space, kl the membrane diffusion constant and So the critical su-
gar concentration required to provide adequate transmembrane uptake (figu-
re 3 C and 3 D). (S - So) was considered to be zero when 5 < S o. For L-
glucose uptake, which enters the cell only by simple diffusion, statis-
tical analysis provided the following values : kl = 0.931 + 0.072 x lo-%.
mg protein -1 . minute
-1 ; k2 q 2.97 f 0.19 x 10-71. mg protein -1
. minute -1
and So = 88.8 ? 4.34 PM.

Vol. 123, No. 2, 1984 BIOCHEMICAL AND BIOPHYSICAL RESEARCH COMMUNICATIONS
Vmax.S The model describing Z-deoxyglucose uptake is V z k2S + kl (5 - So) + ~
Km + S
Vmax.5 where ~ is the Michaelis-Menten model for facilited diffusion up-
Km + 5 take (2).
Thus, fitting this model requires simultaneous determination of five cor-
related parameters kl, k2, Km, So and Vmax. We were unable to fit cor-
rectly this model because, when the whole model was run, we had to con-
sider simultaneously two very heterogeneous processes. If we only used
very low Z-deoxyglucose concentrations, we could only determine k 2
and
s o, and not kl, Km and Vmax ; whereas conversely, using higher values,
determination of k2 and So was impossible.
It is noteworthy that trypsin, which is known to remove large external
glycocomponents such as fibronectin (23), abolished the concentration-
dependent transport lag process. This suggests that such perimembrane
componentsare involved in the phenomenon.
Finally, the concentration-dependent transport lag process was found in
8 separate experiments with large variations in the graphically calcula-
ted value of S o (15-150 uM) without any explanation of this variability.
Further studies are needed to determine the exact mechanism and the bio-
logical importance of this process and in particular to find out whether
the same phenomenon occurs in cells other than fibroblasts and more
generally in other transport systems such as that of amino acids.
AKNOWLEDGMENT
We are very grateful to Professor J. Maccario for helpful discussions in the course of this work and for careful reading of the manuscript. Thanks go also to Mrs P. Jue for excellent secretarial assistance.
REFERENCES
1. Plagemann, P.G.W. (1973) J. Cell. Physiol. BJ, 421-434. 2. Kletzien, R.F. and Perdue, J.F. (1974) J. Biol. Chem. 249, 3366-3374. 3. Kipnis, D.M. and Cori, C.F. (1959) J. Biol. Chem. z, 171-177. 4. Smith, D.E. and Gorski, J. (1968) J. Biol. Chem. 243, 4169-4174. 5. Zala, C.A. and Perdue J.F. (1980) Biochim. Biophys. Acta 600, 157-172. 6. Decker, S. and Lipmann, F. (1981) Proc. Natl. Acad. Sci. USA 2, 5358-5361.
541

Vol. 123, No. 2, 1984 BIOCHEMICAL AND BIOPHYSICAL RESEARCH COMMUNICATIONS
7.
8.
9.
10. 11. 12. 13. 14.
15. 16. 17. 18. 19. 20. 21. 22. 23.
Inui, K.I., Moller, D.E., Tillotson, L.G. and Isselbacher, K.J. (1979) Proc. Natl. Acad. Sci. USA 7&! 3972-3976. Cals, M.J., Adolphe, M., Jardrllier, J.C., Miocque, M., Agneray, J. and Ekindjian, O.G. (1981) Int. J. Tissue Reac. 3, 113-119. Lowry, O.H., Rosebrough, N.J., Farr, A.L., and Randall, R.J. (1951) J. Biol. Chem. 193, 265-275. Seber, G.R.F. (1977) Linear regression analysis. John Wiley and Sons Eds. Metzler, C.M., Elfring, G.L. and MC Ewen, A.J. (1974) Biometrics 30, 562-585. Kletzien, R.F. and Perdue, J.F. (1975) J. Biol. Chem. 250, 593-600. Weber, M.J. (1973) J. Biol. Chem. 248, 2978-2983. Singh, M., Singh, V.N., August, J.T. and Horecker, 8.L. (1978) J. Cell. Physiol. 97, 285-292. Plagemann, P.G.W. and Richey, D.P. (1974) Biochim. Biophys. Acta 2, 263-305. Cleland, W.W. (1976) Adv. Enzymol. 2, l-33. Graff, J.C., Hanson, D.J. and Hatanaka, M. (1973) Int. J. Cancer 12, 602-612. Germinario, R.J., Oliveira, M. and Leung, H. (1978) Can. J. Eiochem. 56, 80-88. Kletzien, R.F. and Perdue, J.F. (1973) J. Biol. Chem. 248, 711-719. Lieb, W.R. and Stein, W.D. (1972) Biochim. Biophys. Acta 265, 187-207. Stoker, M. and Piggott, D. (1974) Cell 3, 207-215. Foley, J.E., Foley, R. and Gliemann, Olden, K.,
J. (1980) J. Biol. Chem. 9, 9674-9677. Pratt, R.M. and Yamada, Y. (1979) Proc. Natl. Acad. Sci. USA,
76, 3343-3347.
542