abn amro investor day...it matters and efficiency everywhere else drive the sustainable agenda to...
TRANSCRIPT

ABN AMRO Investor Day
ABN AMRO Investor Day
London, 16 November 2018

2
For the purposes of this disclaimer ABN AMRO
Group N.V. and its consolidated subsidiaries are
referred to as "ABN AMRO“. This document (the
“Presentation”) has been prepared by ABN
AMRO. For purposes of this notice, the
Presentation shall include any document that
follows and relates to any oral briefings by ABN
AMRO and any question-and-answer session
that follows such briefings. The Presentation is
informative in nature and is solely intended to
provide financial and general information about
ABN AMRO. This Presentation has been
prepared with care and must be read in
connection with the relevant Financial
Documents (latest Quarterly Report and Annual
Financial Statements, "Financial Documents").
In case of any difference between the Financial
Documents and this Presentation the Financial
Documents are leading. The Presentation does
not constitute an offer of securities or a
solicitation to make such an offer, and may not
be used for such purposes, in any jurisdiction
(including the member states of the European
Union and the United States) nor does it
constitute investment advice or an investment
recommendation in respect of any financial
instrument. Any securities referred to in the
Presentation have not been and will not be
registered under the US Securities Act of 1933.
The information in the Presentation is, unless
expressly stated otherwise, not intended for
residents of the United States or any "U.S.
person" (as defined in Regulation S of the US
Securities Act 1933). No reliance may be placed
on the information contained in the Presentation.
No representation or warranty, express or
implied, is given by or on behalf of ABN AMRO,
or any of its directors or employees as to the
accuracy or completeness of the information
contained in the Presentation. ABN AMRO
accepts no liability for any loss arising, directly
or indirectly, from the use of such information.
Nothing contained herein shall form the basis of
any commitment whatsoever. ABN AMRO has
included in this Presentation, and from time to
time may make certain statements in its public
statements that may constitute “forward-looking
statements”. This includes, without limitation,
such statements that include the words ‘expect’,
‘estimate’, ‘project’, ‘anticipate’, ‘should’, ‘intend’,
‘plan’, ‘probability’, ‘risk’, ‘Value-at-Risk (“VaR”)’,
‘target’, ‘goal’, ‘objective’, ‘will’, ‘endeavour’,
‘outlook’, 'optimistic', 'prospects' and similar
expressions or variations on such expressions.
In particular, the Presentation may include
forward-looking statements relating but not
limited to ABN AMRO’s potential exposures to
various types of operational, credit and market
risk. Such statements are subject to
uncertainties. Forward-looking statements are
not historical facts and represent only ABN
AMRO's current views and assumptions on
future events, many of which, by their nature,
are inherently uncertain and beyond our control.
Factors that could cause actual results to differ
materially from those anticipated by forward-
looking statements include, but are not limited
to, (macro)-economic, demographic and political
conditions and risks, actions taken and policies
applied by governments and their agencies,
financial regulators and private organisations
(including credit rating agencies), market
conditions and turbulence in financial and other
markets, and the success of ABN AMRO in
managing the risks involved in the foregoing.
Any forward-looking statements made by ABN
AMRO are current views as at the date they are
made. Subject to statutory obligations, ABN
AMRO does not intend to publicly update or
revise forward-looking statements to reflect
events or circumstances after the date the
statements were made, and ABN AMRO
assumes no obligation to do so.
Disclaimer

3
09h30 – 09h35 Welcome & programme Dies Donker (Head of IR) 3
09h35 – 10h00 Banking for better, for generations to come Kees van Dijkhuizen (CEO) 4
10h00 – 10h25 Accelerate to the future Christian Bornfeld (CI&TO) 20
10h25 – 10h45 Safeguarding our moderate risk profile Tanja Cuppen (CRO) 33
10h45 – 11h15 Q&A CEO, CI&TO, CRO 44
11h15 – 11h40 Break - 45
11h40 – 12h00 Customer experience, our key priority Frans van der Horst (CEO RB) 46
12h00 – 12h20 Transforming to a more scalable private bank Pieter van Mierlo (CEO PB) 60
12h20 – 12h40 Q&A CEOs RB and PB 71
12h40 – 13h25 Lunch - 72
13h25 – 13h45 Future proof CIB Rutger van Nouhuijs (CEO CIB) 73
13h45 – 14h05 Sustainability, a business opportunity Daphne de Kluis (CEO CB) 85
14h05 – 14h25 Q&A CEOs CIB, CB 94
14h25 – 14h40 Break - 95
14h40 – 15h05 Strong capital generation and return Clifford Abrahams (CFO) 96
15h05 – 15h25 Q&A CFO 115
15h25 – 15h30 Wrap up Kees van Dijkhuizen (CEO) 117
Do not remove these hyper links to the respective chapters (required for the pdf on IR website)
Link to slide 3, paste over
AA logo on all title pages
ABN AMRO Investor Day
Banking for better,
for generations to come
CEO | Kees van Dijkhuizen
16 November 2018

5
Decisive management team achieving good results
Disciplined delivery since IPO
Strategic steps taken to further improve the bank
Accelerating the sustainability shift of our clients in
a profitable way
Photo to be updated
Moderate risk profile as evidenced by our good
2018 EU-wide stress results, confirming resilience
in adverse economic scenarios
Delivering attractive results with high capital return

6
50%
75%
100%
125%
150%
€9.0
€14.0
€19.0
€24.0
€29.0
Nov 2015 Nov 2016 Nov 2017 Nov 2018
ABN AMRO
STOXX Banks 600 Europe
Strong results and steady capital generation since IPO in 2015
1) Excluding the gain on PB Asia sale, the ROE was 13.4% and C/I was 61.2%
2) Cost/Income in the 4th quarter will be higher due to. regulatory levies , among other things
3) Dividend accrual YTD of 60%; final decision in FY results.
2013 2015 2017 2018 YTD IPO target
ROE 5.5% 12.0% 14.5%1) 13.1% 10-13% in coming years
C/I ratio 63.6% 61.8% 60.1%1) 55.3%2) 56-60% 2017
CET1 ratio 13.9% 15.5% 17.7% 18.6% 11.5-13.5% fully loaded
Dividend
pay-out ratio 30% 40% 50% 60%3) 50%
2017
Development key financial targets ABN AMRO share price since IPO
20/11/
2015
2016 2017 2018

7
Strategic steps taken to further improve profile and profitability
Sharpened C/I ratio to 56-58% by 2020
Nominal cost level 2020 lower than 2015
Focus on sustainability
Real Estate portfolio to average energy label ‘A’ in 2030, sustainable investments as the
norm and becoming a partner of choice to support clients in a circular business model
Continued IT Transformation and digitalisation
Strong digital offering. 65% of retail sales digital
Peer-to-peer app Tikkie with close to 5 million users
CIB Update
Reduction of RWAs from 39 bn to 34 bn to improve ROE above10% by 2021
Strategic focus Private Bank
Scalable franchise with strong local brands in core countries in NW Europe
New and decisive management team in place

8
Banking
for better,
for generations
to come
Purpose-led organisation to benefit all stakeholders
Clients
Effortless customer experience
Proactive and relevant advice
Safe, stable banking services
Employees
Purpose-led and values-driven culture
Improving the employee journey
Investors
Attractive returns
High capital return
A responsible investment proposition
Society
Integrate societal impact in decisions
Accelerate the sustainability shift
Megatrends
Climate change
Sharing economy
Ageing population
Continuously changing expectations
New technology
Increasing regulation
Safety and security
Unbundling of value chains
Digital ecosystems and partnerships
Disintermediation
Open Banking
Societal and banking trends Stakeholder expectations

9
Three pillars to help us live our purpose throughout the bank
Clear business opportunity
Engage with clients to support the
transition to sustainable business
model
Maintain strong DJSI score
Lead by example
Sustainability
Treasuring the customer relationship
Customer-focused and data-driven
Effortless and recognizable customer
experience
Partner to deliver better services and
extend to adjacent industries
Customer experience
Purpose-led and values-driven culture
Product and process rationalisation
and optimisation
Continued I&T improvements guided
by business needs
Improving the employee journey
Future-proof bank
Build on three pillars to the benefit of all our stakeholders: clients, employees, investors and society

10
250135
Continued focus on strong digital proposition of Retail Banking
1) Based on 13.5% CET1
37%65% ‘D’‘A’
Focus on Dutch, mass affluent clients
5 million clients, primary bank for 20% of Dutch population
Strong digital focus: >1 billion annual client contacts
Short-term revenue pressure due to continued low interest
rates
Efficiency drives stable and strong ROE of 33%1) YTD
Key features
Building on proven track record for delivery and address short
term revenue pressure
Delivering differentiating customer experiences by enhancing
our core offering and a continued focus on the shift to digital
Maintaining our forefront position in innovation to increase
customer loyalty and monetise our strong customer interface
Committed to
branches
(2016-2018)
Share of digital sales
(2016-2018)
Average energy level by 2030 in the
EUR 150bn residential real estate portfolio

11
Scalable Private Bank in NW Europe with growth potential
1) Based on 13.5% CET1
81% NL 56% DE 42% FR 52 80%
Focus on onshore North West Europe
Managing EUR 195bn of client assets
Focus on Private Wealth Management, Entrepreneurs &
Enterprise and LifeCycle segments
Clear market leader in NL, number 3 and 5 positions in
Germany and France
ROE of 23%1) YTD
Key features
Continued focus on North West Europe, pursuing organic and
inorganic growth
Further harmonise and digitise, achieving a C/I ratio <70% by
2021
Offer our clients sustainable investments as a standard
Committed to
One platform in NL and one shared platform
in all other locations (2017-2021)
Clients using online solutions
(August 2018)
Of new clients opt for
sustainable investments in NL

12
Growth through sustainable revenues in Commercial Banking
1) Based on 13.5% CET1
2) For enterprises with a yearly turnover below EUR 2.5 million
365,000 small-mid sized Dutch clients
Primary bank for 25% of Dutch enterprises
Strong economy supports good ROE of 15%1) YTD
Sector knowledge as a clear differentiator
Key features
Service the Dutch SME market guided by client intimacy where
it matters and efficiency everywhere else
Drive the sustainable agenda to accelerate the sustainability
shift, which contributes to society and our financial
performance
Grow our top line profitably and manage cost effectively
Committed to
Product reduction
in 2020
Of all contacts are initiated
digitally by 20222)
Circular assets and 100 circular
deals by 2020
EUR 1bn 85% 50%

13
RWA reduction in CIB to increase profitability to at least 10%
1) Based on 13.5% CET1
EUR 8bn Advisor on 12 deals Green bonds
in 2018 YTD
>60% of global clients are multi-product
by 2020
10% ROE by
2021
3,000 large corporate and financials clients in North West
Europe and specific global sectors
Leading domestic franchise, established positions in selected
global sectors
Sector knowledge leveraged to neighbouring countries
Strategic update to deliver ROE of at least 10%
(YTD 9.4%1))
Key features
Sustainable relationships with multi-product clients in
profitable sectors
Reducing RWA, lowering cost, and strict discipline in capital
allocation
Delivering >10% ROE targets in 2021 under Basel III and
transform as preparation for Basel IV
Committed to

14
Flattish loan book in 2019-2020, opportunities in medium term
Loan book expectation flattish for 2019-2020 due to interest
rate environment and disciplined margin behaviour, however at
high ROE and CET1 levels
After 2020 moderate growth of 1-3% of the loan book is
expected
Stable fees in short term; thereafter modest pickup from
growth initiatives, reflecting new services & business models,
and from partnerships
Strengthen return on capital through originate-to-distribute
opportunities
Disciplined delivery
Bolt-on
Not transformational
Within ROE hurdle in reasonable timeframe
Manageable by local management
Maintain capital position
Seize bolt-on opportunities for inorganic growth

15
Delivering on cost savings whilst investing in growth and digital
Cumulative cost savings of EUR 640m delivered at the end
of Q3 2018
Internal and external FTEs to decline by 14% by 2020
(vs. YE2015); actual FTEs down by 12.4% vs. YE2015
Further cost savings expected from digitalisation & process
optimisation, TOPS2020 & retail digitalisation and support
& control activities
Well on track to meet 56-58% in 2020
C/I target sharpened to <55%1) for 2022
Increase IT cost efficiency
Further product and process rationalisation and improvement
across business lines and support functions
Disciplined delivery Cost measures to ensure continued C/I improvements
59%
70% 65%
62% 56-58%
<55%
2010 2013 2015 Last 4Q 2020 2022
1) Based on assumptions of ABN AMRO group economics, incl on GDP, interest rates and the mortgage market

16
Strong capital position, well positioned for a dividend pay-out >50%
With Basel III CET1 ratio of 18.6%, well positioned for Basel IV
Our Basel III CET1 improved from 17.7% to 18.6% YTD 2018, while Basel IV CET 1 remained more
or less stable at c.13%, before mitigations, as Basel IV inflation increased from 35% to 43%
Mitigating actions lower Basel IV inflation from 43% to 35%. We expect to maintain our capital target
range in 2019 at 17.5%-18.5% (subject to SREP)
EU-wide stress test confirms resilience in adverse economic scenarios
Leverage ratio a constraint in 2018, less so in later years
− Possible legal merger Bank and Group: c.0.2%
− SA-CCR (Clearing) expected by 2021 at the latest: c.0.5%
YTD 2018 60% of profit accrued for dividend, final decision with FY result, subject to SREP
Strong ROE and moderate RWA growth create further room for a dividend pay-out clearly above 50%
in later years

17
1) Excluding the gain on PB Asia sale, the ROE was 13.4% and C/I was 61.2%
2) Cost/Income in the 4th quarter will be higher due to regulatory levies, among other things
3) Based on assumptions of ABN AMRO group economics, incl on GDP, interest rates and the mortgage market
4) Additional distributions will be considered when capital is within or above the target range, and are subject to other circumstances,
including regulatory and commercial considerations. Capital target range to be reviewed annually
5) Dividend accrual YTD of 60%; final decision in with FY results
6) Sustainable profit attributable to shareholders excludes exceptional items that significantly distort profitability; examples from the past
would have been the PB Asia divestment (2017) and the provision for SME derivatives (2016)
Financial targets
2017 2018 YTD Targets
ROE 14.5%1) 13.1% 10-13%
C/I ratio 60.1%1) 55.3%2) 56-58% by 2020
<55%3) by 2022
CET1 ratio 17.7% 18.6%
17.5-18.5%4)
2019
Dividend
pay-out ratio 50% 60%5) Additional distributions above
50% of sustainable profit4,6)

18
Responsible investment choice with high returns
Domestic champion in Retail, Private, Commercial and Corporate Banking in digitally-savvy and strong
Dutch market
Making a positive impact in a profitable way by accelerating the sustainability shift of our clients
Treasuring the customer relationship increasingly working with partners
Demonstrated delivery on cost savings, with Innovation & Technology as a critical enabler for efficiency
Moderate risk profile based on discipline, strong capitalisation and a clean balance sheet
Delivering attractive returns with high capital return
Decisive and agile management team

19
09h30 – 09h35 Welcome & programme Dies Donker (Head of IR) 3
09h35 – 10h00 Banking for better, for generations to come Kees van Dijkhuizen (CEO) 4
10h00 – 10h25 Accelerate to the future Christian Bornfeld (CI&TO) 20
10h25 – 10h45 Safeguarding our moderate risk profile Tanja Cuppen (CRO) 33
10h45 – 11h15 Q&A CEO, CI&TO, CRO 44
11h15 – 11h40 Break 45
11h40 – 12h00 Customer experience, our key priority Frans van der Horst (CEO RB) 46
12h00 – 12h20 Transforming to a more scalable private bank Pieter van Mierlo (CEO PB) 60
12h20 – 12h40 Q&A CEOs RB and PB 71
12h40 – 13h25 Lunch 72
13h25 – 13h45 Future proof CIB Rutger van Nouhuijs (CEO CIB) 73
13h45 – 14h05 Sustainability, a business opportunity Daphne de Kluis (CEO CB) 85
14h05 – 14h25 Q&A CEOs CIB, CB 94
14h25 – 14h40 Break 95
14h40 – 15h05 Strong capital generation and return Clifford Abrahams (CFO) 96
15h05 – 15h25 Q&A CFO 115
15h25 – 15h30 Wrap up Kees van Dijkhuizen (CEO) 117
ABN AMRO Investor Day
Accelerate to the future
Innovation & Technology | Christian Bornfeld
16 November 2018

21
We are committed to
Modernising our IT landscape without large-scale re-platforming; competitive
digital offering and solid roadmap in place
Reducing the IT spend while increasing competitiveness; further simplification
of IT landscape and adjustments to delivery model as key levers for efficiency
Evolving client offerings by reinventing client journeys and further leveraging
partnerships

22
Two strategic pillars strongly tied to innovation and technology
Sustain a high level of employee engagement
Develop, attract and retain key skills in areas like
sustainability, innovation, digitalisation and analytics
Continue consolidation, rationalisation and digitalisation
of products, processes and platforms
Strengthen data management capabilities as enabler for
regulatory agenda and client offerings
Increase cost and capital efficiency as well as agility and
learning in order to reduce time-to-market
Evolve our partnership, vendor and utility landscape to
reflect the future industry dynamics
Extend our lead in digital advisory and sales
Enhance the customer experience − anytime, anywhere
on any device
Leverage advanced analytics and AI to increase
relevance and proactivity in customer experience
Innovate and enable new business models that extend
beyond traditional banking
Address opportunities and threats associated with Open
Banking
Retain the trust of clients through continued focus on
cyber security and privacy
Reinvent the customer experience Build a future-proof bank

23
Solid base for reaching our ambitions
Large-scale decommissioning and
re-platforming achieved
Agile way of working adopted for all
change activities
No large-scale core system
replacement needed; step-wise
rejuvenation plan established
55% reduction in paper documents
sent to customers over 6 years
Strong digital offering in the retail
market with award winning apps, e.g.
Tikkie and Grip
Digitalisation roadmap in place for
Commercial and Private Banking
Key building blocks in place: Group
Innovation, Digital Impact Fund,
developer portal and partnerships
Strong innovation culture and
knowledge on key technologies like:
AI, Block chain and Cloud
Multiple learnings from our own
challenger banks
82 76
70 60
52
37
Modernised IT platform Digital focus Innovation enablers
# m. paper documents sent to customers
2013 2014 2015 2016 2017 2018 2014 2015 2016 2017 2018T 2019E
100%
(~730)
100%
(~2000)
Migration of applications to Cloud in scope
Decommissioning applications in scope

24
Historic distribution of IT spend
Multiple levers to improve focus and IT cost efficiency
Demand: Consolidate and focus
Adopt shared platforms across business lines, geographies
and subsidiaries
Further rationalise IT application landscape based on focussed
client value propositions
Reduce IT investment in non-strategic areas
Productivity: Automation and shift to cloud
From Agile to DevOps with integrated teams and a higher
degree of automation
Continue the shift to a hybrid cloud delivery model for IT
applications
Optimise our off-shore delivery model
Supply: Standardise and right-source
Standardised technology platforms and tools
Evolve partnerships to reflect cloud computing
Consolidate and optimise vendor landscape
Run Costs 55%
Change Costs 45%
Key levers to increase focus and IT cost efficiency
Share of IT spend for change activities historically higher
than peers
Maintained flat IT run spend since 2015 despite strong
increase of transaction volumes
IT change spend is not capitalised which gives us more
flexibility to adjust our IT spend as amortisation is limited
Full-year IT costs avg. 2015-2017
EUR
1.5 bn

25
Reducing IT spend while remaining fit for the future
IT is a critical enabler in decreasing
the overall cost/income ratio
IT spend as share of income will
decrease over the coming years
Decrease is enabled by delivering
required capacity for less spend,
combined with increased focus
Clear prioritisation in delivery of
regulatory and strategic priorities
1) European IT Benchmarking in Banking (EITBB) 2017. C/I Ratio: operating expenses as a percentage of operating income.
IT C/I Ratio: operating IT expenses as a percentage of operating income
IT C/I1)
Ratio (%)
Top
Quartile
(52,6%)
20 5 10 15
C/I Ratio1) (%)
2018 (Indicative)
Northern and Central Europe European Union
Type I
More technology &
automation?
Type II
How to leverage IT
spending?
Type III
Do we overspend?
Type IV
Is this sustainable?
Study Avg.
(13.2%)
30
90
60
50
Right-sizing the IT spend Top Quartile
(10.9%)
Study Avg.
(61.1%)
‘Sweet spot’
2017
Continuously manage the balance of
efficient and sufficient IT investments

26
60
200
400
Achieving our ambitions by moving to the sweet spot
1) IT C/I Ratio: IT expenses as a percentage of operating income
2) Including SaaS applications
2017 Sweet Spot
1,900 2,000 2,200
100%
3%
Private 97%
30%
70%
Public2)
Leading indicators
Reduction in number of applications since 2014 (accumulated)
Demand:
Consolidation
Productivity:
Automation
Supply: Cloud
delivery model
Focused effort over several years provides good starting point
Ambition to hit ‘sweet spot’ by gradually reducing IT spend as
share of operating income
Next steps in IT rejuvenation will be conducted step-wise
through multiple levers
IT C/I Ratio ‘sweet spot’ of 12-13%
IT C/I Ratio1) in %
12-13%
~16%
2019 2018 2022
2018 2019 2020
2017 2018 2022
Number of teams with DevOps capabilities
Cloud delivery models split (%)

27
Two parallel approaches to reinvent the customer experience
Create new offerings and experiences
Sharpen value proposition for key client
segments, allowing us to reduce complexity
Reduce client hassle by removing the need for
paper and physical signatures
Decrease processing time and increase
conversion rates on key processes
Further improve client access through digital
channels, e.g. video meetings and chatbots
Establish a proactive dialogue based on
predictive data models
Common capabilities (examples)
Extend our strong position step-by-step
‘Zoom out’ to identify key customer experience
points and new business opportunities
Establish new partnerships both within and
outside the financial sector
Address the threats and opportunities related to
Open Banking by providing APIs
Develop challenger propositions to experiment
with brand-neutral offerings
Engage with regulators to ensure alignment and
level playing field in new types of offerings
Key focus areas (examples)
Reinvented
Customer Experience
Online
On-boarding Users & clients Digital identity
Voice of client
& analytics Video & chat Track & trace
Energy
transition
Urbanisation &
future of work
Ownership,
access, usage
Privacy & trust AI Block chain
Step-
by-Step Reinvent

28
Realising my entrepreneurial dream1)
Extending into new client journeys
Two-pronged approach
1) Step-by-step approach to extend our position in the areas
in which we currently excel
2) Extending into new offerings and experiences
Current initiatives
Selected set of customer journeys is being mapped with a
broad sample of clients within focus segments
Multiple partnerships being explored to unlock business
potential in line with strategic identity
13 Touchpoint with AAB Client opportunity AAB Customer action
Awareness Ideation Starting a business Growth Consolidate / Exit
‘Zoom Out’ Identify customer decision points
‘Zoom Out’ Identify customer decision points
‘I need to employ more staff’
‘I need advice from an accountant and a lawyer’
‘I need to register with the corporate registry’
‘I need to extend my client base’
1
2 3 4
5 16
17 18
20
21
22 23
24
25
26
27
28 29
30
31
7
8a 9
10
11
12
14
13 19
6 15
‘I need to find a suitable office location’
‘I need a transaction account and liquidity management’
‘I need to invest in my inventory’
‘I need to do research and build my business plan’
‘I need to decrease my environmental footprint’
ABN AMRO What we excel in right now
‘I need help with a payment that won’t go through’
8b
Data driven
1) Simplified example

29
Leveraging on partners
Distribution
Digital and Personal Banking
Production
API based financial services
KYC Mortgage
processing …
IT
infrastructure
Cash
Handling ATMs
Big
tech
/
Fin
tech
Pe
ers
Pa
rtn
ers
Cha
llen
ge
rs
APIs
AI & security
Fin
tech
s
Pe
ers
Ch
alle
ng
ers
Pa
rtne
rs
Effect of Open Banking
Digital channels
and agents
Data, Analytics,
Privacy &
automation
Clie
nts
Communities
Platforms
(open, curated
or composed)
Aggregation
Utilities

30
Complemented by Digital Impact Fund investments
Learning by experimenting with challenger banks and impact fund
A new proposition can be built and brought to market in less
than a year
Agile practices combined with DevOps capabilities, cloud
technologies and Fintech solutions is highly efficient
Both proposition and timing need to be right
Client acquisition is expensive and association with a trusted
brand like ABN AMRO is key
Scale-up of operational processes as well as risk and
compliance functions is expensive in a stand-alone setup
Key learnings ABN AMRO challenger banks
New stand-alone propositions complement or replace part of
the ABN AMRO offering
Scale-up by redeploying solution under the main ABN AMRO
brand
Continuously evolve the challenger set-up to ensure return on
investment
Extracting value from challenger banks
fast and efficient
SME lending peer-to-peer
payment requests
future asset
management
special purchase
loans
FX and
multi-currency
payments
fully digital
financial services trade &
commodity
finance

31
We are committed to
Modernising our IT landscape without large-scale re-platforming; competitive
digital offering and solid roadmap in place
Reducing the IT spend while increasing competitiveness; further simplification of IT
landscape and adjustments to delivery model as key levers for efficiency
Evolving client offerings by reinventing client journeys and further leveraging
partnerships

32
09h30 – 09h35 Welcome & programme Dies Donker (Head of IR) 3
09h35 – 10h00 Banking for better, for generations to come Kees van Dijkhuizen (CEO) 4
10h00 – 10h25 Accelerate to the future Christian Bornfeld (CI&TO) 20
10h25 – 10h45 Safeguarding our moderate risk profile Tanja Cuppen (CRO) 33
10h45 – 11h15 Q&A CEO, CI&TO, CRO 44
11h15 – 11h40 Break 45
11h40 – 12h00 Customer experience, our key priority Frans van der Horst (CEO RB) 46
12h00 – 12h20 Transforming to a more scalable private bank Pieter van Mierlo (CEO PB) 60
12h20 – 12h40 Q&A CEOs RB and PB 71
12h40 – 13h25 Lunch 72
13h25 – 13h45 Future proof CIB Rutger van Nouhuijs (CEO CIB) 73
13h45 – 14h05 Sustainability, a business opportunity Daphne de Kluis (CEO CB) 85
14h05 – 14h25 Q&A CEOs CIB, CB 94
14h25 – 14h40 Break 95
14h40 – 15h05 Strong capital generation and return Clifford Abrahams (CFO) 96
15h05 – 15h25 Q&A CFO 115
15h25 – 15h30 Wrap up Kees van Dijkhuizen (CEO) 117
ABN AMRO Investor Day
Safeguarding our moderate
risk profile
CRO | Tanja Cuppen
16 November 2018

34
Refreshed strategy fully aligned to moderate risk profile
Building long-term relationships with clients in strong economies
Taking risks leading to sound asset quality and strong balance sheet
Being well prepared to anticipate and absorb impact of changes in the
economy, regulations and technology
We are committed to our moderate risk profile by …

35
Serving clients in strong economies
1) Based on 2018 Q3 RWA balances
2) Through-the-cycle (‘TTC’) cost of risk expressed as impairments over average gross loans (client lending)
Business profile Retail Banking Private Banking Commercial Banking C&I Banking
Client type Mass
affluent
Individuals, PWM, E&E
Institutions & Charities
Small-mid
sized companies
Large corporates
and Financials
Footprint Dutch NW-Europe Dutch NW Europe and
specific global sectors
Risk profile
Client lending 156bn 13bn 42bn 44bn
Portfolio granularity c.5m clients c.100k clients c.365k clients c.3k clients
RWA allocation 1) 26% 9% 24% 36%
Avg. cost of risk
since 2015 (IPO) c.1bps c.5bps c.23bps
TTC cost of risk 1) 5-7bps on domestic
mortgages 40-60bps

36
Sound asset quality reflected in decline of impairments
Cost of risk well below TTC level … … mainly driven by corporate loans
Average of 4Q cost of risk (bps) Average of 4Q impairments by product (EUR m)
Sound credit quality loan portfolio reflected in clear and significant cost-of-risk improvement to well below through-the-cycle levels
Elevated impairments in corporate loan niches (mainly CIB), resulted in implementation of mitigating measures
Impairments in 2018 reflect mainly IFRS9 stage 3 charges on existing non-performing files
Overall sound asset quality, portfolio behaving well,
defaulted portfolio expected to decline further
-25
0
25
50
75
2014 2015 2016 2017 2018
25-30bps TTC Cost of Risk
4Q Rolling average
-25
50
125
200
2017 2018
Mortgages Consumer loans
Corporate loans Total impairments
right hand chart

37
Impairments sector/file specific, not indicative for rest of loan book
1) Natural Resources includes Energy, Offshore Services and Basic Materials, Trade & Commodity Finance (TCF) includes EUR 1.1bn Diamond & Jewellery (D&J), Global
Transportation & Logistics (GTL) includes Shipping.
2) Impairments year-to-date 2018, expressed as percentage of total reported year-to-date impairments of EUR 447m.
Sectors 1) Natural Resources TCF (incl. D&J) GTL (incl. Shipping) Healthcare
Client lending EUR 8.5bn EUR 11.1bn EUR 10.4bn EUR 4.9bn (EAD)
Challenged
markets
Offshore services
Upstream energy
Diamond & Jewellery
TCF
Offshore Service Vessels
Crude oil tankers
Short sea
Domestic hospitals &
cure
Impairments 2) EUR 150m, 34% of YTD
impairments
EUR 69m, 15% of YTD
impairments
EUR 47m, 11% of YTD
impairments
EUR 39m, 9% of YTD
impairments
Market
dynamics
Signs of recovery
Higher oil prices should
lead to new contracts
Diamond production
shifts to India
Antwerp & Dubai focus
more on trading
Recovery seen in dry
bulk and containers
Regulatory changes
Overcapacity
Government cost focus
impacts client revenues
De-risking Offshore services
Several exposures sold
Diamond & Jewellery
Dubai & Moscow closure
Offshore Service Vessels
Several exposures sold
Close monitoring
Selective origination
Risk outlook Material additional impairments currently not expected, though challenges are expected to remain
We are currently
working on an
updated deep dive
hospitals healthcare.
Our portfolio includes
35 hospitals with a
total OOE of EUR
2.602 billion.
- 30 general and top-
clinical hospitals
(OOE EUR 2.153
billion)
- 2 academic hospitals
(OOE EUR 0.383
billion)
- 3 specialised
hospitals (OOE EUR
0.066 billion)
Part of Corporate & Institutional Banking Part of Commercial Banking
38
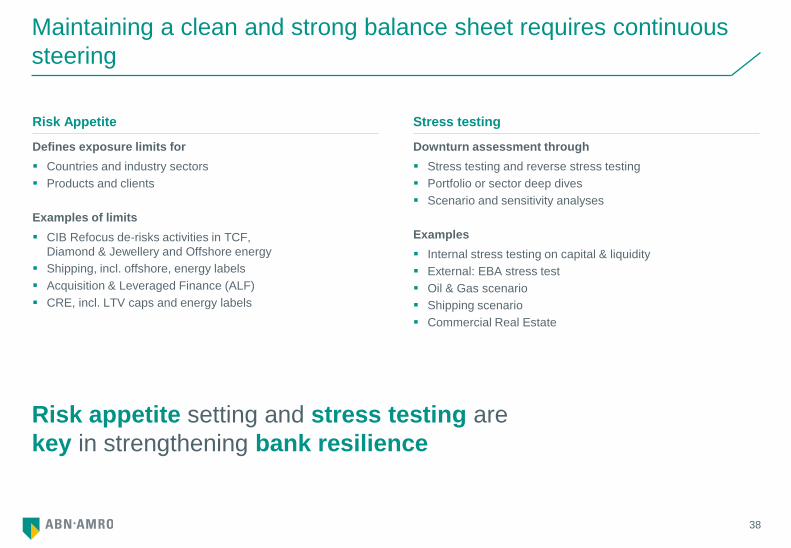
Maintaining a clean and strong balance sheet requires continuous
steering
Risk appetite setting and stress testing are
key in strengthening bank resilience
Defines exposure limits for
Countries and industry sectors
Products and clients
Examples of limits
CIB Refocus de-risks activities in TCF,
Diamond & Jewellery and Offshore energy
Shipping, incl. offshore, energy labels
Acquisition & Leveraged Finance (ALF)
CRE, incl. LTV caps and energy labels
Risk Appetite
Downturn assessment through
Stress testing and reverse stress testing
Portfolio or sector deep dives
Scenario and sensitivity analyses
Examples
Internal stress testing on capital & liquidity
External: EBA stress test
Oil & Gas scenario
Shipping scenario
Commercial Real Estate
Stress testing
CRE
Voor wat betreft kantoren is dat
als volgt: ABN AMRO Real Estate
financiert alleen nog kantoren met
een Label C of beter. Dit is van
toepassing op nieuwe
financieringen en
herfinancieringen.
Uitzonderingen:
1. Er is een plan voor
verduurzaming naar Label C of
beter
2. Kantoor wordt herontwikkeld
naar andere bestemming zoals
wonen
3. Het is een monument
4. Kantoor < 100 m2
Voor de andere assetclasses
geldt dat we het gesprek aangaan
met onze klanten over
verduurzamen. We financieren
nog "alles".
Daarnaast werken we met een
team aan het automatisch
beoordelen van de duurzaamheid
van een object. Als onderdeel van
de digitale bank voor Real
Estate.

39
-2.67% -2.36% -1.50%
-0.30%
-3.85% -3.56% -4.05%
-7.42% -6.94%
-7.69%
ABN AMRO Benelux Peers EBA sample
Low Average High
Moderate risk profile demonstrated by resilience to stress
1) Source: www.eba.europa.eu
Resilience under EBA stress test More resilient than peers
Loss of fully loaded CET1 under adverse scenario vs YE2017 starting
point under IFRS9
With -2.67% fully loaded CET1 deduction under the adverse stress
scenario ABN AMRO scored versus the EBA sample
Stress test confirms ABN AMRO’s resilient capital position: performed well vs. EBA sample
Adverse stress test scenario resulted in CET1 impact of -2.67% vs. -5.91% in the stress test of 2016
Stress test does not contain a pass or fail. Under adverse stress the CET1 remained well above the 2018 SREP of 10.425%
Impact of stress under Basel IV expected to be less significant given binding output floor
17.65%
14.85%
-0.13% -2.67%
YE2017 IFRS9 Adversescenario
YE2020
ABN AMRO CET1 Scenario impact IFRS9

40
Healthy outlook on credit quality, short-term outlook of below TTC
cost of risk
Growing share amortising and savings
loans, full interest-only declining
NHG remains popular
Strong focus on duty of care, full
recourse on collateral
Avg. LtMV: 66%, vs. 82% at YE2012
LtMV>100%: 3.3% of mortgages, vs.
21.1% at YE2012
Positive outlook on credit quality in
mortgage book
Mostly NW Europe, more than half in
the Netherlands
Benefit from Dutch economy and
positive consumer sentiment
Large diversified corporates expected
to remain less sensitive to shocks
Limited direct Brexit & trade war
exposure, indirect effects possible
Granular and stable loan book
Predominantly Dutch
Limited exposure to credit cards
Small average loan size
Strong duty of care rules
Low level of impairments
Good risk/return profile
18%
33%
25%
24%
37%
32%
18%
13%
Amortising& savings
Partialinterest only
Full interestonly
Life & other
Q4 2012 (avg LtMV 82%)
Q2 2018 (avg LtMV xx%)
3.6 3.1
1.0
4.8
Personalloans
Advances Creditcards
Otherconsumer
loans
200
400
600
2015 2016 2017 2018
Q3
Domestic mortgage loans (150bn) Corporate loans (92bn) Consumer loans (13bn)
18%
33%
25%
24%
39%
32%
17%
12%
Amortising& savings
Partialinterest only
Full interestonly
Life & other
Q4 2012 (avg LtMV 82%)
Q3 2018 (avg LtMV 66%)
Consumer loan book well diversified, 3.9%
impaired, 50.9% coverage ratio (Q3 2018)
Strong shift in mortgage portfolio towards
amortisation
Historic low Dutch bankruptcy rate
(monthly businesses & institutions, CBS)

41
Well prepared to absorb impact of industry-wide regulatory changes
1) ECB & EBA: Banks with gross NPL ratios of >5% should establish an NPE strategy, effective June 2019. ABN AMRO's gross NPL ratio is well below the 5% threshold
2) ECB: Banks should book maximum level of P&L provisions. If accounting standards do not fulfil prudential provisioning backstop, banks should adjust their CET1 capital
3) EBA aims to harmonise the definition of default, guidelines aim to increase comparability of risk estimates and own funds requirements across banks, effective Jan 2021
Basel IV implementation in EU
Leverage ratio & MREL
Model reviews & TRIM
IFRS9 replaced IAS39 accounting
standard
Overhaul of impairment methodology
NPE guidelines 1)
NPE reviews & backstops 2)
Definition of Default 3)
Capital Prudential regulation Impairments
Prospects
Implementation risks: transition to new
models and lack of guidance
Material RWA impact, reflecting 72.5%
output floor
Aim to be fully loaded compliant early
in the phase-in period
Prospects
Recognise impairments earlier, in
stage 2
Expected more P&L volatility from
stage 2
No change in incurred loss
Prospects
Governance, operating model, NPE
targets and implementation in risk
framework and recovery planning will
need to be developed
Prepare impact assessment
Lowers available capital

42
Strong focus on non-financial risk in changing world
Cyber attacks grow in number, severity
and risk: DDoS, phishing, hacking
New risks arise from digital
developments: open banking, PSDII,
APIs, electronic contracting, etc.
Key focus area of regulators, society
and management
Financial crime often internationally
organised and becoming more
sophisticated
KYC upgrades in implementation
Providing financial services in new
ways
Energy transition and financing of
clean, circular or new business models
Social Impact Finance (AASIF)
Cyber risk Innovation Conduct & AML
Activities
Cyber risk oversight in place and
further strengthened
Continuous investments in security
measures, penetration testing
Close cooperation with suppliers,
peers, authorities and law enforcement
agencies is key
Activities
Continuous investments in capabilities,
(new) systems and people
Develop public-private partnerships for
intelligence and solutions
Ongoing programmes to enhance
client files
Open dialogue with authorities
Activities
Training to enhance risk identification
of new technologies
Assessments on climate risk and
stranded assets
Define risk appetite for innovative
activities

43
We are committed to safeguarding our moderate risk profile
We are
Building long-term relationships with clients in strong economies
Taking risks leading to sound asset quality and strong balance sheet
Being well prepared to anticipate and absorb the impact of changes in the
economy, regulations and technology

Questions
CEO | CI&TO | CRO

45
09h30 – 09h35 Welcome & programme Dies Donker (Head of IR) 3
09h35 – 10h00 Banking for better, for generations to come Kees van Dijkhuizen (CEO) 4
10h00 – 10h25 Accelerate to the future Christian Bornfeld (CI&TO) 20
10h25 – 10h45 Safeguarding our moderate risk profile Tanja Cuppen (CRO) 33
10h45 – 11h15 Q&A CEO, CI&TO, CRO 44
11h15 – 11h40 Break 45
11h40 – 12h00 Customer experience, our key priority Frans van der Horst (CEO RB) 46
12h00 – 12h20 Transforming to a more scalable private bank Pieter van Mierlo (CEO PB) 60
12h20 – 12h40 Q&A CEOs RB and PB 71
12h40 – 13h25 Lunch 72
13h25 – 13h45 Future proof CIB Rutger van Nouhuijs (CEO CIB) 73
13h45 – 14h05 Sustainability, a business opportunity Daphne de Kluis (CEO CB) 85
14h05 – 14h25 Q&A CEOs CIB, CB 94
14h25 – 14h40 Break 95
14h40 – 15h05 Strong capital generation and return Clifford Abrahams (CFO) 96
15h05 – 15h25 Q&A CFO 115
15h25 – 15h30 Wrap up Kees van Dijkhuizen (CEO) 117

ABN AMRO Investor Day
Customer experience, our key
priority
Retail Banking | Frans van der Horst
16 November 2018

47
We are committed to
Building on proven track record for delivery and addressing short-term
revenue pressure
Delivering differentiating customer experiences by enhancing our core offering
and a continued focus on the shift to digital
Maintaining our forefront position in innovation to increase customer loyalty
and monetise our strong customer interface
Continuing to focus on the customer experience

48
Leading retail bank in the Netherlands
Primary bank for ~20% of Dutch population
Strong presence in urban areas
Strong and highly digital customer interface
> 1 billion annual customer contacts
> 7 million apps downloaded
Omni-channel distribution model
Strong remote advisory capabilities
Top-class digital offering
Solid revenue contributor
Strong position in core products
Tailored approach to address changing client behaviour
Client-driven and digital-focused business model
Stable base
of 5 million
customers

49
Short-term revenue pressure due to continued low interest rates
NII
Fees
Other
Current developments Revenue model Retail Banking
Relative high dependency on net interest income
Three products drive majority of revenue base
Revenues per product, in descending order
1) Mortgages
2) Savings
3) Lending
4) Payments
5) Investments
6) Insurances
EUR 2.7bn
Q3 2018
Fierce price competition pressures market share ABN AMRO
Main deposit rate at 3bps, little or no room to lower further
FTP deposits Main savings rate
deposit margins depend on rate developments
Base
Neg.
Pos.
Past Today Future
0
5
10
15
20
25
Jan-18 Jul-17 Mar-18 Sep-17 May-18 Jul-18 Nov-17 Sep-18
19.6%
7.4%
3.8%
5.3%
15.2%
16.8%
Source: Land registry

50
Focus on customer experience to address revenue pressure
Continued focus on digital first to
improve customer experience and
drive efficiency
− digitising all relevant core processes
and customer journeys and
assisting our clients’ shift to digital
− leveraging next generation tooling
like video banking to get closer to
our clients and increase flexibility
Expanding our involvement in broader
ecosystems and client journeys
outside our own
Aligning core offering with changed
client behaviour and expectations to
strengthen revenue base
− off-balance models in mortgages
− optimising funnel management in
consumer lending
− enhancing insurance and
investment offerings to drive fees
Leveraging relevant customer
touchpoints to strengthen engagement
and develop new sources of income
− driving customer relevancy and
loyalty
− expanding presence in our clients’
context post PSD2
− exploring different roles and
revenue models
Client-oriented offering Digital first Valuable customer interface
51
Tailoring our approach Adapting to changed client behaviour in mortgages
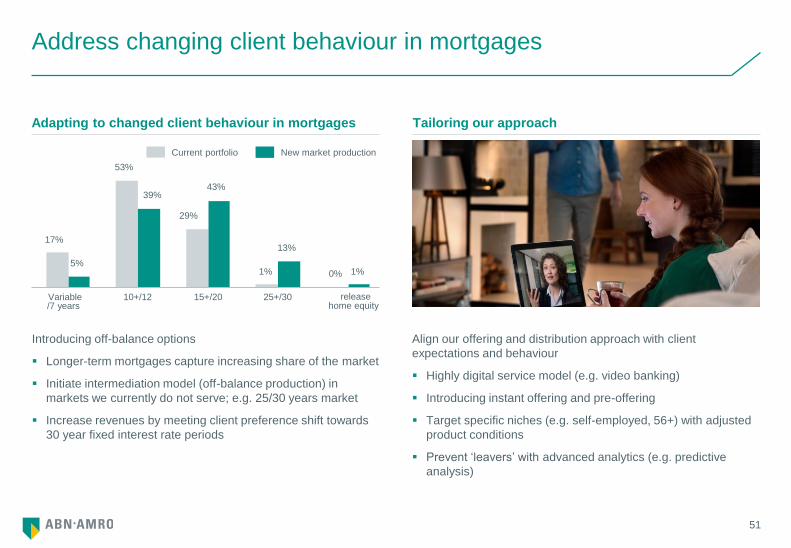
Address changing client behaviour in mortgages
Introducing off-balance options
Longer-term mortgages capture increasing share of the market
Initiate intermediation model (off-balance production) in
markets we currently do not serve; e.g. 25/30 years market
Increase revenues by meeting client preference shift towards
30 year fixed interest rate periods
25+/30 15+/20 10+/12 Variable /7 years
1% 0%
29%
53%
13%
39%
1% 5%
43%
17%
release home equity
Current portfolio New market production
Align our offering and distribution approach with client
expectations and behaviour
Highly digital service model (e.g. video banking)
Introducing instant offering and pre-offering
Target specific niches (e.g. self-employed, 56+) with adjusted
product conditions
Prevent ‘leavers’ with advanced analytics (e.g. predictive
analysis)
52
5
6
7
8
2017 2018 2019 2020 2021
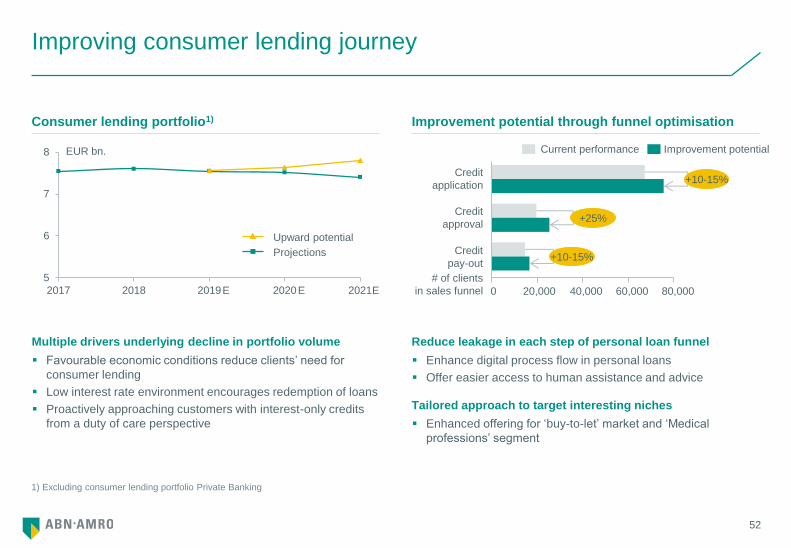
Improvement potential through funnel optimisation Consumer lending portfolio1)
Improving consumer lending journey
Multiple drivers underlying decline in portfolio volume
Favourable economic conditions reduce clients’ need for
consumer lending
Low interest rate environment encourages redemption of loans
Proactively approaching customers with interest-only credits
from a duty of care perspective
Reduce leakage in each step of personal loan funnel
Enhance digital process flow in personal loans
Offer easier access to human assistance and advice
Tailored approach to target interesting niches
Enhanced offering for ‘buy-to-let’ market and ‘Medical
professions’ segment
60,000 40,000 80,000 20,000 0
Credit
pay-out
Credit
approval
Credit
application
Current performance Improvement potential
# of clients
in sales funnel
+10-15%
+25%
+10-15%
EUR bn.
1) Excluding consumer lending portfolio Private Banking
E E E
Upward potential
Projections

53
0
1,000
2,000
3,000
2015 2016 2017 2018E 2019E 2020E 2021E
x k.
Enhancing complete insurance assortment to realise seamless
journeys in line with client expectations
− Improving digital request funnels car insurance and liability
insurance
− Integrating home-related insurances in mortgage sales
processes
− Expanding distribution strategy for term life insurances with
intermediary channel
Initial focus on car insurances, with already promising results
Growing fee income through investments and insurances
Insurances: increasing level of penetration Investments: targeting 30,000 new customers in 2019
Activate existing customer base by pro-actively providing
insights on relevant themes through launching ‘theme
investing’ app
Attract new investing customers through
− Enhanced offering and more competitive pricing of
‘execution only’ proposition
− Launch new investment app − leveraging Prospery
architecture − targeting younger customers and prospects
to start investing at a low threshold
Number of investing households expected to continue to grow
to over 2 million investing households by 2021
Current level of penetration emphasises growth potential
11% Level of
penetration
Premium inflow car insurances (in m.)
4 8 6 10 2 0
(YTD) 2018
2017 ~80%
Source: Kantar – TNS Retail Investor

54
412 366
303 260
221 202
135
Continued focus on digital first to improve customer experience and
drive efficiency
Share of digital continues to rise High level of customer satisfaction Consolidation of branch network
% of digital in sales and services % of 9+ experience digital channels # of branches
469
2018 2011 2019
E
65% 70%
FY
2016
FY
2015
YTD
2018
FY
2017
50%
37% 31%
FY
2014
34%
0
10
20
30
40
50
2011 YTD2018
Mobile banking Internet banking
Success of digital strategy emphasised by several use cases
Frontrunner in Video banking (‘Beeldbankieren’)
− Reduces necessity for a geographical footprint
− Clients value remote contact even higher than face-to-face contact
Continued focus on digitising our core, resulting in most advanced mobile banking app in the Netherlands
Redesign branches to assist-to-digital
Leveraging next generation tooling (e.g. chatbot, speech analytics) for better and more efficient client interactions
-70%
135

55
Increase loyalty and relevance
Resulting in strong growth of our mobile footprint
Multiple apps in place rather than one app with too many
functionalities as part of our constellation strategy
> 7 million apps downloaded
63% of Tikkie users are non ABN AMRO clients
Grip substantial growth potential after multi-bank aggregation
6
4
0
2
10
8
Dec-17 Jun-16 Dec-16 Jun-17 Jun-18
Grip Mobile Banking Wallet Tikkie
Contactless payment
with watch or ring
Overview and insight into
income and expenditure
Peer-to-peer
payments
Unique lending oppor-
tunities with Tweadle

56
Generating insight, creating pro-active customer interactions
Combining data from different apps to truly understand our
clients
Aggregation (multi-banking) to further increase value and
functionalities
Search for strategic partnerships with corporates
Smart connecting of data and insights across apps
Explore different revenue models (e.g. kick-back revenue
models)
06:30 12.30 08:25 08:45 12.45 17.30
Check personalized daily financial insight
Pick-up coffee on way to work
Check updates in ‘theme investment app’
Having lunch with colleagues, send payment request to settle bill
Notification – salary has been received
Time for groceries, skip the line, checkout with Tikkie
Alert: exceeded weekly budget for groceries
Check spend analysis, adjust weekly budgets and saving targets
22.45 17.30
Multiple possible models to monetise value Combination of above apps offers unique position

57
Well positioned to explore platform-oriented revenue models
API Developer platform to explore opportunities & connect with
developers, Beyond Banking Days to identify concepts
Expand our role and become involved in broader ecosystems
and customer journeys
Combining service with partners to deliver a broad value
proposition
Multiple capabilities and solutions in place that can be
leveraged through APIs
− Tikkie has potential as a B2B2C payments solution,
multiple third-party solutions being developed and validated
− Tweadle has future potential as lending API to distribute
capabilities to strategic suppliers
− Grip has potential in digitalising our advisory capabilities
Tikkie’s success proves platform potential Well positioned to explore different roles and models
Introduced as an innovative person-2-person payment solution
Tikkie has attracted a strong user base
Expanding product suite with business solution to attach
businesses to Tikkie and generate transaction based fees
With a growing base of users and businesses, Tikkie is well
positioned to explore platform-based revenue models (e.g.
monetise interactions between merchants and consumers)
Strong growth in number of fee-generating Tikkies
x k.
0
20
40
60
aug oct dec feb apr jun aug oct
Close to 5m users and still growing by 250k users a month
x m.
0 jan apr jul oct jan apr jul oct
2
4
6
58
We are committed to
Building on proven track record for delivery and addressing short-term revenue
pressure
Delivering differentiating customer experiences by enhancing our core offering
and a continued focus on the shift to digital
Maintaining our forefront position in innovation to increase customer loyalty and
monetise our strong customer interface
Continuing to focus on the customer experience

59
09h30 – 09h35 Welcome & programme Dies Donker (Head of IR) 3
09h35 – 10h00 Banking for better, for generations to come Kees van Dijkhuizen (CEO) 4
10h00 – 10h25 Accelerate to the future Christian Bornfeld (CI&TO) 20
10h25 – 10h45 Safeguarding our moderate risk profile Tanja Cuppen (CRO) 33
10h45 – 11h15 Q&A CEO, CI&TO, CRO 44
11h15 – 11h40 Break 45
11h40 – 12h00 Customer experience, our key priority Frans van der Horst (CEO RB) 46
12h00 – 12h20 Transforming to a more scalable private bank Pieter van Mierlo (CEO PB) 60
12h20 – 12h40 Q&A CEOs RB and PB 71
12h40 – 13h25 Lunch 72
13h25 – 13h45 Future proof CIB Rutger van Nouhuijs (CEO CIB) 73
13h45 – 14h05 Sustainability, a business opportunity Daphne de Kluis (CEO CB) 85
14h05 – 14h25 Q&A CEOs CIB, CB 94
14h25 – 14h40 Break 95
14h40 – 15h05 Strong capital generation and return Clifford Abrahams (CFO) 96
15h05 – 15h25 Q&A CFO 115
15h25 – 15h30 Wrap up Kees van Dijkhuizen (CEO) 117

ABN AMRO Investor Day
Transforming to a more
scalable private bank
Private Banking | Pieter van Mierlo
16 November 2018

61
We are committed to
Continue to focus on North West Europe, pursuing organic and inorganic growth
Further harmonise and digitise, achieving a C/I ratio <70% by 2021
Offer our clients sustainable investments as a standard
Transforming to a more scalable private bank

62
Market leader in the Netherlands with strong positions abroad
Netherlands #1 Germany #3 France #5 Belgium #8 Guernsey
Resilient income, low capital consumption
Strong contributor to group: 23% ROE (YTD)
Source of funding: EUR 66.7bn client deposits (YTD)
Unique combination of competitive advantages
Sustainability as a standard
Personal and digital service delivery
Open architecture product offering
Focus on onshore NW Europe
Acquisitions in Belgium (2018) and Germany (2011 & 2014)
Market consolidation offers additional growth opportunities
A leading cross-border private bank in NW Europe
Servicing
EUR 195bn
client assets
(Q3 2018)

63
Transforming to become a more scalable Private Bank
Regulatory pressure persists, including
MiFID II, KYC
Resulting processes and transparency
requirements put pressure on margins
Changing client expectations of digital
requires significant investments
1) Client assets, YTD 2018
2) Including announced acquisition in Belgium (2018)
Market profitability under pressure
Dutch activities (EUR 114bn client
assets) highly efficient, due to scale
Other locations working on reducing
C/I ratio, by harmonising and digitising
Well on track to reach a sustainable
C/I ratio <70% by 2021
Leverage on cross-border scale a
necessity
Scale to remain competitive
Building on our focused footprint,
creating significant cross-border scale
Divested non-core units, latest Asia &
Dubai (2017) and Luxembourg (2018)
Acquisitions in Belgium (2018) and
Germany (2011 & 2014)
Focus on onshore NW Europe
The Netherlands − EUR 114bn 1) Germany − EUR 38bn France − EUR 30bn Belgium − EUR 12bn 2) Channel Islands − EUR 8bn

64
1) Source: Worldbank
Announced acquisition Société Générale PB in Belgium
Further build on strong proposition in Belgium
Belgium market highly attractive (est. 4% client assets growth),
with highest share of millionaires in EU
Opportunity to increase scale, doubling client assets to EUR 12bn
Complementary footprint, similar products and segments,
resulting in considerable synergy potential
Closing expected in Q1 2019
Good add-on to existing portfolio In line with a clear PB M&A strategy
6bn 12bn Announced acquisition will double
client assets in Belgium
3.0%
2.0%
2.4%
2.9%
2.1%
BE NL DE FR EU
Selective bolt-on acquisitions in NW Europe, aiming to
leverage our proposition
Focus on onshore clients
Harmonised service propositions and platforms and
standardised processes to drive cross-country scale
Millionaires as percentage of population (2017) 1)

65
Sustainable investments is the new standard
1) On sustainable discretionary model portfolios
Partnership with University of Oxford
Funding chairs at Dutch universities
650 staff (23%) certified in the UN’s
PRI (Principles for Responsible
Investment)
Up to 50% less CO2 emission vs
benchmark 1)
Strict exclusions and positive
selections based on ESG criteria
Engagement with companies to
discuss UN Global Compact breaches
Leveraging open architecture model to
provide the best sustainable products
Increasing demand from next
generation
>30% of existing clients already own
sustainable investments (2017)
In NL 80% of new clients opt for
sustainable, other countries to follow
Shift also offered to existing clients
Expertise to support clients Clear investment strategy More demand for sustainable
Currently at EUR 13bn 8bn 16bn
Doubling sustainable client assets
(start 2017-2020)

66
Reinventing the customer experience
Segments redefined based on client’s wealth, source of wealth
and stage of life - implemented in NL, to be rolled out in other
locations
Development of dedicated value propositions per segment:
offering matches client needs
Cross-border focus segments first in line for investments
Client expectations of digital are changing, with remote
banking as a key factor to serve the next generation
Combine offline and online and realise seamless client
interaction at every touchpoint
Ambition to have almost 100% of our clients using our online
solutions
Segment propositions to optimise added value Taking customer experience into the digital age
Clients using online solutions
(August 2018)
81% NL 56% DE 42% FR

67
Building a future-proof private bank
1) Achieved a reduction from 3,122 to 2,828 FTEs from 2016 to 2018 YTD (excl. PB Asia and Luxembourg)
From different systems in each
location to a shared platform of
systems: core banking, CRM, portfolio
management
Belgium first-mover to new core
banking platform in Q1 2019
From inefficient and manual processes
to automated and simplified processes
All eligible processes digitised by 2020
One of the drivers for reduction in
FTEs
From very large product ranges in each
country to one product menu card
Each location with the same products,
based on cross-country client needs
Investments menu card defined, other
product groups to follow
Harmonise IT infrastructure Speed up digitisation One rationalised product offering
1 One cross-border
product menu card by 2020
5 2 One platform in NL together with Retail
Banking, one shared platform in all other
locations (2017-2021)
22% Expected total FTE reduction
2016-20211)

68
Further improve costs and efficiency with the transformation
1) Savings compared to the cost basis in 2016
2) Excluding publically disclosed incidentals
2017 2018E 2021E 2019E 2020E
BAU cost base Transformation investments
Transformation resulting in lower costs Well on track to reach a sustainable C/I ratio
On the back of the transformation, we expect to reach a
sustainable C/I ratio <70% by 2021
Taking into account continued investments in digital,
innovation and growth
Well on track with the transformation
Transformation investments total c. EUR 130m 2017–2021,
funded by realised savings
Large part investments used for harmonised IT platform
Cumulative cost savings to increase to c. EUR 100m as of
2021 1), mainly reflecting lower staff and IT costs
Cumulative cost savings EUR m 1) Operating expenses EUR m 2)
c.100
Cost/ income ratio 2)
80.2%
73.4%
2015 2016 2017 Last 4QLast 4Q 2015 2016 2017
1,050 950
69
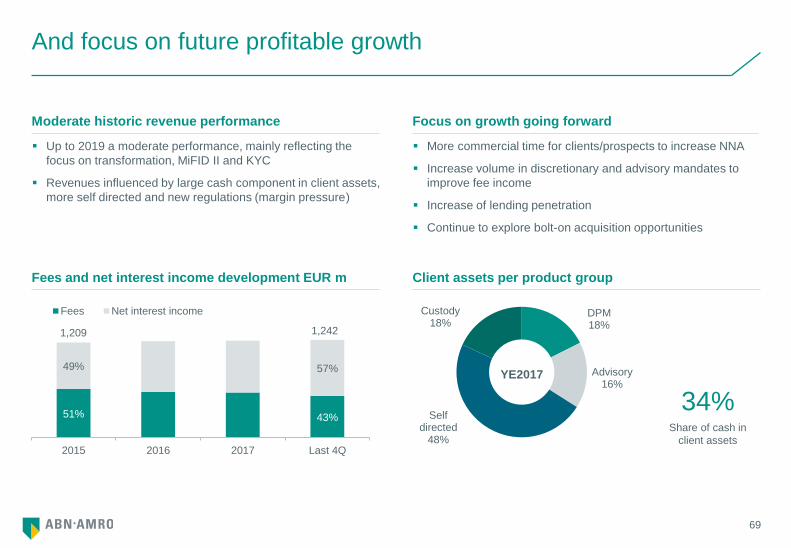
And focus on future profitable growth
Up to 2019 a moderate performance, mainly reflecting the
focus on transformation, MiFID II and KYC
Revenues influenced by large cash component in client assets,
more self directed and new regulations (margin pressure)
Moderate historic revenue performance
Client assets per product group
More commercial time for clients/prospects to increase NNA
Increase volume in discretionary and advisory mandates to
improve fee income
Increase of lending penetration
Continue to explore bolt-on acquisition opportunities
Focus on growth going forward
DPM 18%
Advisory 16%
Self directed
48%
Custody 18%
YE2017
34% Share of cash in
client assets
Fees and net interest income development EUR m
51% 43%
49% 57%
2015 2016 2017 Last 4Q
Fees Net interest income
1,209 1,242

70
We are committed to
Continue to focus on North West Europe, pursuing organic and inorganic growth
Further harmonise and digitise, achieving a C/I ratio <70% by 2021
Offer our clients sustainable investments as a standard
Transforming to a more scalable private bank

Questions
CEOs Retail & Private Banking

72
09h30 – 09h35 Welcome & programme Dies Donker (Head of IR) 3
09h35 – 10h00 Banking for better, for generations to come Kees van Dijkhuizen (CEO) 4
10h00 – 10h25 Accelerate to the future Christian Bornfeld (CI&TO) 20
10h25 – 10h45 Safeguarding our moderate risk profile Tanja Cuppen (CRO) 33
10h45 – 11h15 Q&A CEO, CI&TO, CRO 44
11h15 – 11h40 Break 45
11h40 – 12h00 Customer experience, our key priority Frans van der Horst (CEO RB) 46
12h00 – 12h20 Transforming to a more scalable private bank Pieter van Mierlo (CEO PB) 60
12h20 – 12h40 Q&A CEOs RB and PB 71
12h40 – 13h25 Lunch 72
13h25 – 13h45 Future proof CIB Rutger van Nouhuijs (CEO CIB) 73
13h45 – 14h05 Sustainability, a business opportunity Daphne de Kluis (CEO CB) 85
14h05 – 14h25 Q&A CEOs CIB, CB 94
14h25 – 14h40 Break 95
14h40 – 15h05 Strong capital generation and return Clifford Abrahams (CFO) 96
15h05 – 15h25 Q&A CFO 115
15h25 – 15h30 Wrap up Kees van Dijkhuizen (CEO) 117

ABN AMRO Investor Day
Future proof CIB
Corporate & Institutional Banking | Rutger van Nouhuijs
16 November 2018

74
Key takeaways
Sustainable relationships with multi-product clients in attractive sectors
Reducing RWA, lowering costs, and strict discipline in capital allocation
Delivering >10% ROE targets in 2021 under Basel III and transforming in
preparation for Basel IV
We are committed to:
75
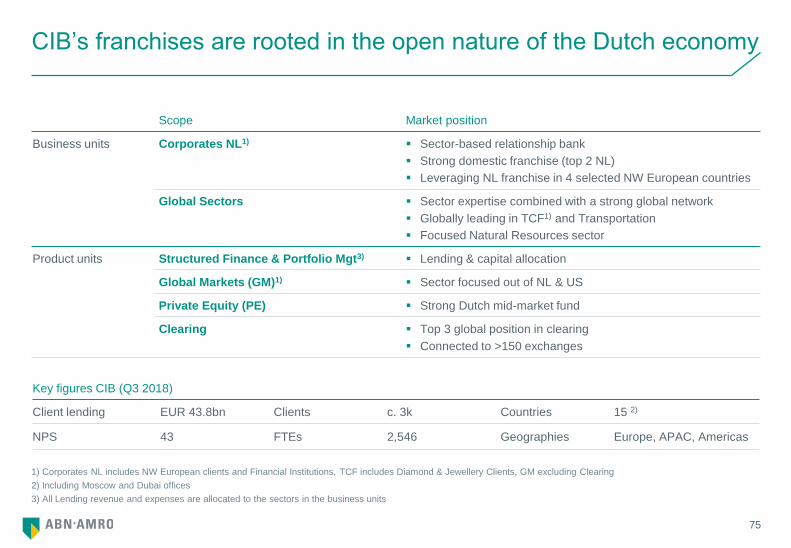
CIB’s franchises are rooted in the open nature of the Dutch economy
1) Corporates NL includes NW European clients and Financial Institutions, TCF includes Diamond & Jewellery Clients, GM excluding Clearing
2) Including Moscow and Dubai offices
3) All Lending revenue and expenses are allocated to the sectors in the business units
Scope Market position
Business units
Corporates NL1) Sector-based relationship bank
Strong domestic franchise (top 2 NL)
Leveraging NL franchise in 4 selected NW European countries
Global Sectors Sector expertise combined with a strong global network
Globally leading in TCF1) and Transportation
Focused Natural Resources sector
Product units
Structured Finance & Portfolio Mgt3) Lending & capital allocation
Global Markets (GM)1) Sector focused out of NL & US
Private Equity (PE) Strong Dutch mid-market fund
Clearing Top 3 global position in clearing
Connected to >150 exchanges
Key figures CIB (Q3 2018)
Client lending EUR 43.8bn Clients c. 3k Countries 15 2)
NPS 43 FTEs 2,546 Geographies Europe, APAC, Americas
76
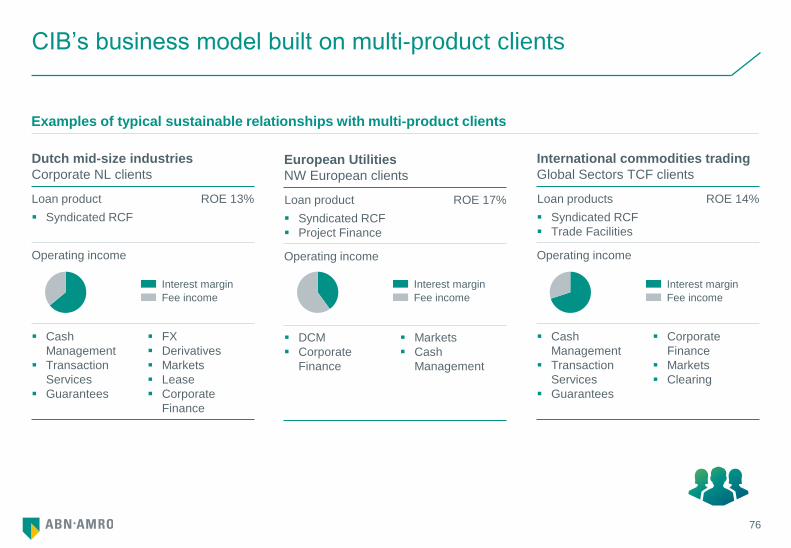
Dutch mid-size industries
Corporate NL clients
Loan product
Syndicated RCF
ROE 13%
Operating income
Cash
Management
Transaction
Services
Guarantees
FX
Derivatives
Markets
Lease
Corporate
Finance
CIB’s business model built on multi-product clients
Examples of typical sustainable relationships with multi-product clients
International commodities trading
Global Sectors TCF clients
Loan products
Syndicated RCF
Trade Facilities
ROE 14%
Operating income
Cash
Management
Transaction
Services
Guarantees
Corporate
Finance
Markets
Clearing
European Utilities
NW European clients
Loan product
Syndicated RCF
Project Finance
ROE 17%
Operating income
DCM
Corporate
Finance
Markets
Cash
Management
Interest margin
Fee income
Interest margin
Fee income
Interest margin
Fee income
Interest margin
Fee income
Interest margin
Fee income
Interest margin
Fee income

77
0%
2%
4%
6%
8%
10%
12%
0% 50% 100%
ROE 10%1)
1) ROE on basis of Basel III RWA and CET1 target of 13.5%. TTC = through-the-cycle
2) Including D&JC
Most businesses deliver returns through the cycle, some are lagging
Corporates NL sector serving mainly core clients
Mid-cap corporates where we have a broad relationship
Over 85% of clients are multi-product / service
ROE > 10%, helped by capital light fee income
Global sectors show mixed picture, one lagging sector TTC
Increasing level of multi-product clients, currently 50%
Asset-based lending, Basel IV vulnerable
TCF has high operational cost and a long tail of non-accretive
clients
Product units support the sectors
Global Markets is de-risking, client-driven, high cost base
Clearing is a generator of stable returns
Continued involvement in PE as cornerstone investor Size represents RWAs FY2017
Most CIB sectors deliver >10% ROE TTC impairments1) Above hurdle returns made on core clients
Operating Income adjusted for TTC impairments FY2017
Cost / Income (adj.)
Clearing
Income (adj) / RWA
ROE > 10% ROE < 10%
GTL
NR PE
TCF2) GM
Corporates NL

78
Improve capital & cost efficiency, to deliver >10% ROE by 2021
1) RWA EUR 5bn reduction (equals CET1 c. 0.9%) compared to Q1 2018, from around EUR 39bn to around EUR 34bn to be achieved by 2020, assuming static risk weighting,
i.e. excluding possible impact of TRIM or credit quality migrations.
2) EUR 27m restructuring costs were booked in Q3 2018
3) Under Basel III RWAs and a CET1 target of 13.5%
Reduce capital Lower costs Transform business model
Measures
Reduce non-core and cyclical
clients
Impacts TCF, offshore, shipping
Focus GM’s products and clients1)
Address low-return clients
FTE reduction & IT rationalisation
Right-size geographies & support
Capital efficient, focus on distribution
Focus on high share of wallet clients
Develop further sustainability
franchise
Objective
Net RWA reduction EUR 5bn1)
revenue impact c. EUR 100m
EUR 80m cost reduction
c.250 FTE reduction, restructuring
cost: c. EUR 50m 2)
CIB ROE >10% by 20213)
Progress
On track, reduced EUR 1.5bn1)
net RWA
Identified non-accretive clients and
developing client action plans
GM 40 FTEs reduction
Closed GM in NOR and Brazil
Closing Dubai & Moscow
Restructuring provision EUR 36m
Organisation restructuring
Energy transition plan
Excluded F&G labelled vessels

79
Reduce capital Lower costs Transform business model
Measures
Reduce non-accretive clients
Increase ownership based lending
D&JC: de-risking and exit
Dubai, US
Increase share of wallet in core
clients
Zero-loss mentality
Reduce FTEs in line with client
reductions
Simplify end-to-end processes
(‘lean’)
Centralise support activities
Closure of Dubai and Moscow
offices
Digitise paper based processes and
improve customer experience
Invest in block chain trade-finance
platforms
Objective
RWA reduction of EUR 3.5bn1)
Increase income / RWA
Direct cost reduction of
15-20%
Reinvent Customer Experience
Progress
Identified non-accretive clients
Capital reduction on track,
EUR 1.3bn RWA2)
Developing client action plans
Normalising level of provisions
Staff reduction of 20 FTEs
Centralised Dutch support activities
Implementing lean improvements
TCF: raising ROE to >10% by 2021
1) Including D&JC
2) Compared to Q1 2018
80
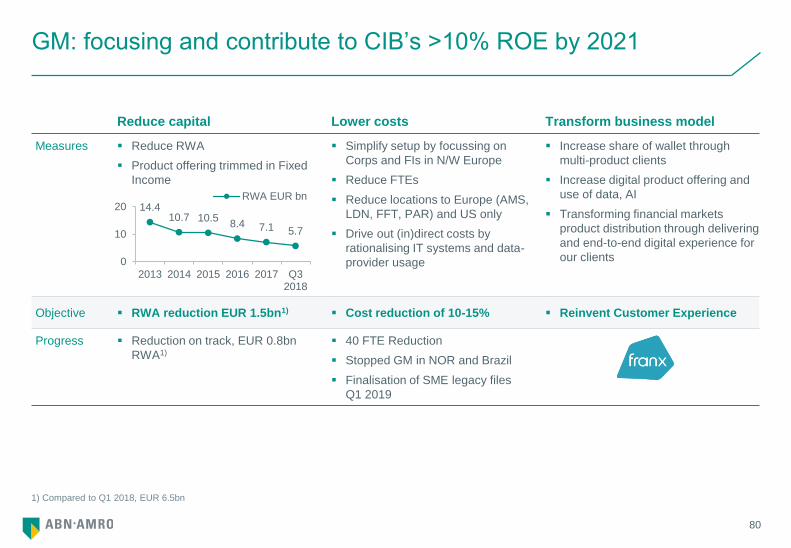
GM: focusing and contribute to CIB’s >10% ROE by 2021
1) Compared to Q1 2018, EUR 6.5bn
Reduce capital Lower costs Transform business model
Measures Reduce RWA
Product offering trimmed in Fixed
Income
Simplify setup by focussing on
Corps and FIs in N/W Europe
Reduce FTEs
Reduce locations to Europe (AMS,
LDN, FFT, PAR) and US only
Drive out (in)direct costs by
rationalising IT systems and data-
provider usage
Increase share of wallet through
multi-product clients
Increase digital product offering and
use of data, AI
Transforming financial markets
product distribution through delivering
and end-to-end digital experience for
our clients
Objective RWA reduction EUR 1.5bn1) Cost reduction of 10-15% Reinvent Customer Experience
Progress
Reduction on track, EUR 0.8bn
RWA1)
40 FTE Reduction
Stopped GM in NOR and Brazil
Finalisation of SME legacy files
Q1 2019
Check best
option 14.4
10.7 10.5 8.4 7.1 5.7
0
10
20
2013 2014 2015 2016 2017 Q32018
RWA EUR bn

81
Transforming CIB’s business model to increase capital efficiency
Improve cross-sell and lending efficiency
Stepping up in relationship tiering by
increasing underwrites to facilitate
cross-sell
Minimum of two cross-sell products
per client
Scale backs of product offerings
affected by Basel IV
Maximise capital efficiency
Central portfolio management steers
RWA under Basel III and Basel IV
Disciplined capital allocation for new
and existing transactions under BIII
and BIV
Progressive pricing during phase-in
of Basel IV
Increase fee income through distribution
More investor-centric origination
approach to increase asset turnover
Invest in origination and distribution
to support distribution efforts
Very substantially increase the current
3-5% risk distribution of the loan
portfolio
Focus on multi-product clients Strict capital discipline Increase capital velocity

82
1) Under Basel III RWAs and a CET1 target of 13.5%
2) RWA reduction of EUR 5bn vs. Q1 2018
Transformed business model to drive returns >10% under Basel IV
CIB to deliver >10% ROE by 20211) under BIII
Implement BIV mitigating actions
Transformed CIB business model is ready to drive capital
efficiency under Basel IV
− Steer capital allocation to least affected products and
sectors
− Higher capital velocity and increase fee income
− Balancing timely implementation of BIV versus optimising
performance under BIII
Vast majority of CIB’s book churns before 2022, which gives
the opportunity to steer portfolio over time
− Enforce progressive repricing as of 2019
CIB’s ROE has been impacted by cyclicality, Private Equity
and incidentals
Path to 10% ROE (Basel III ) driven by reducing capital to
non-accretive and cyclical clients
RWA reduction overlaps with Basel IV vulnerable areas
Driving capital efficiency >10% ROE under Basel IV
5.9%
4.3% 4.4%
6.0%
9.4%
2015 2016 2017 H1 2018 YTD 2018

83
Key takeaways
Sustainable relationships with multi-product clients in attractive sectors
Reducing RWA, lowering costs, and strict discipline in capital allocation
Delivering >10% ROE targets in 2021 under Basel III and transforming in
preparation for Basel IV
We are committed to:
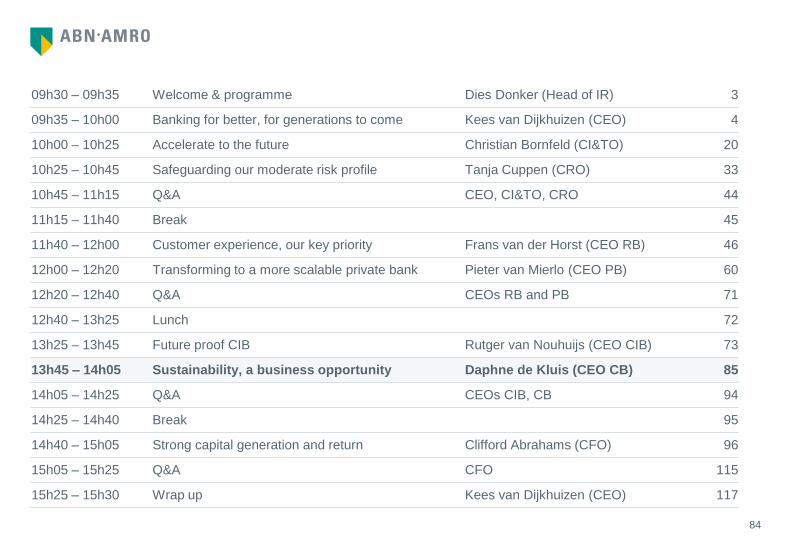
84
09h30 – 09h35 Welcome & programme Dies Donker (Head of IR) 3
09h35 – 10h00 Banking for better, for generations to come Kees van Dijkhuizen (CEO) 4
10h00 – 10h25 Accelerate to the future Christian Bornfeld (CI&TO) 20
10h25 – 10h45 Safeguarding our moderate risk profile Tanja Cuppen (CRO) 33
10h45 – 11h15 Q&A CEO, CI&TO, CRO 44
11h15 – 11h40 Break 45
11h40 – 12h00 Customer experience, our key priority Frans van der Horst (CEO RB) 46
12h00 – 12h20 Transforming to a more scalable private bank Pieter van Mierlo (CEO PB) 60
12h20 – 12h40 Q&A CEOs RB and PB 71
12h40 – 13h25 Lunch 72
13h25 – 13h45 Future proof CIB Rutger van Nouhuijs (CEO CIB) 73
13h45 – 14h05 Sustainability, a business opportunity Daphne de Kluis (CEO CB) 85
14h05 – 14h25 Q&A CEOs CIB, CB 94
14h25 – 14h40 Break 95
14h40 – 15h05 Strong capital generation and return Clifford Abrahams (CFO) 96
15h05 – 15h25 Q&A CFO 115
15h25 – 15h30 Wrap up Kees van Dijkhuizen (CEO) 117

ABN AMRO Investor Day
Sustainability, a business
opportunity
Commercial Banking | Daphne de Kluis
16 November 2018

86
We are committed to
Service the Dutch SME market guided by client intimacy where it matters and
efficiency everywhere else
Drive the sustainable agenda to accelerate the sustainability shift, which
contributes to society and our financial performance
Grow our top line profitably and manage costs effectively
Pursuing sustainability as a business opportunity

87
Leading bank in the Dutch market through client intimacy and efficiency
Solid contributor to group
c.20% of gross income, strong ROE 15.3% (YTD)
Client lending EUR 42bn, client deposits EUR 45bn (YTD)
Leading SME bank in the Netherlands
Primary bank for c.25% of Dutch enterprises
Selective ABF presence in UK, GE and FR1)
Sector focus and digital for basic needs
Clear sector knowledge, a differentiator in NL
Aim to serve clients’ basic needs digitally
Innovative value propositions
1) Asset Based Finance in United Kingdom, Germany and France
The new standard in
online borrowing
Smart global trading with
one multi-currency account
A new payment variant between
enterprise and consumer
Stable base of
365k clients

88
Sustainability as a growth opportunity, responding to market & client needs
Major shift towards sustainability in NL
A ‘pull’ in the market for sustainable &
circular solutions/deals 1,2)
Currently 52% of clients engaged in
sustainability, 25% already active 1)
Large growth opportunity, estimated
market potential for SMEs in NL 3)
− Energy transition: EUR 14bn
(2019-2030)
− Circular transition: EUR 7bn (yearly)
Risk profile of clients engaged in
sustainability is better
1) GFK, 2 November 2018; Sustainability, a research on sustainable entrepreneurship
2) For 80% of clients sustainability is an agenda topic
3) Sources: Energy - Dutch Government report regarding the Climate Agreement / Circular - Analysis based on data of the Dutch Central Bureau for Statistics
Rationale Key levers Targets
Engagement strategy by pro-actively
approaching all clients to facilitate their
transition
Knowledge & experience of sector,
products and technology
Develop innovative financial products
& solutions also with partners
Stimulate knowledge sharing through
platforms and education
Energy transition: real estate portfolio
to obtain an average label A score by
2030
Circular transition: finance 100 circular
deals, total EUR 1bn by 2020

89
1) Examples where ABN AMRO advised or provided financial solutions
New business propositions will lead to additional sources of income
Energy Transition Circular Transition
Description
Transition to reduce CO2 emissions
Real estate is responsible for 40% of total
carbon emission
Declining natural resources & sharing economy
lead to the transformation from linear to circular
economy
Examples1) Vibers: natural material to replace plastic
Debt and equity raising for Dutch wind farm
‘Product-as-a-service’: pay for usage instead of
ownership
HOMIE: washing machines – pay per use
‘Light as a service’ with smart LEDs
Opportunities Give clients insight into label by using the
Sustainable Investment Tool
Support clients to improve and find financial
solutions, a clear business opportunity
Help make real estate more energy efficient
(beyond Mission 2030)
Build a ‘materials bank’ to manage the material flow
Facilitate trade for re-usable materials and products

90
Build eco-systems
Create ecosystems to accelerate
projects and cooperation within
sustainability
Access to platforms
Support enterprises in doing business
easily by providing access to platforms
via ABN AMRO
Shift in energy transition
CO2 emission scans to provide clients
insight into savings potential and where
to invest effectively
Leveraging on partners is key in achieving our sustainability goals
To respond to client needs, improve client intimacy and
strengthen stickiness
Engage in partnerships to leverage innovative capabilities in
sustainability, e.g. with Ecochain
Provide a platform to offer clients a range of own/partner
services in order to do business easily, e.g. opportunity
network
Will generate more fee business and enable us to offer new,
innovative products & services
Help to accelerate and offer us introduction into new markets,
e.g. value added /beyond banking services
Partnerships are essential to service clients Examples
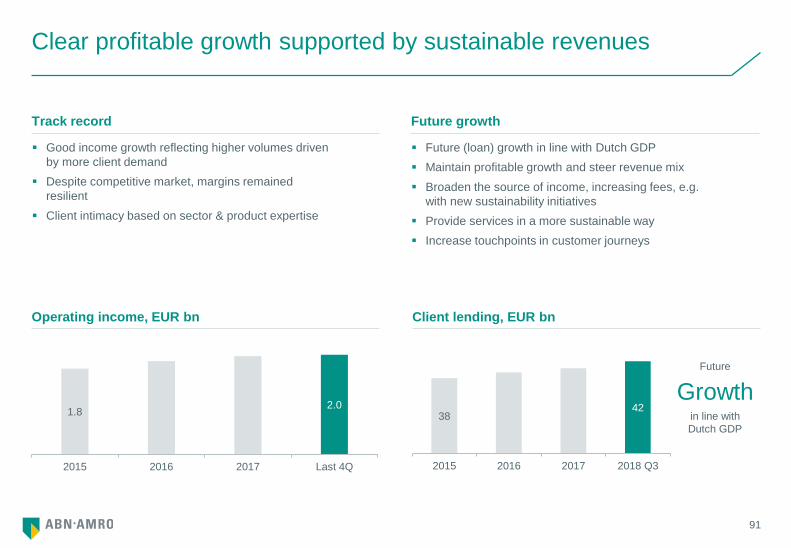
91
Clear profitable growth supported by sustainable revenues
Good income growth reflecting higher volumes driven
by more client demand
Despite competitive market, margins remained
resilient
Client intimacy based on sector & product expertise
Future
Growth in line with
Dutch GDP
Track record
Operating income, EUR bn Client lending, EUR bn
Future (loan) growth in line with Dutch GDP
Maintain profitable growth and steer revenue mix
Broaden the source of income, increasing fees, e.g.
with new sustainability initiatives
Provide services in a more sustainable way
Increase touchpoints in customer journeys
Future growth
1.8 2.0
2015 2016 2017 Last 4Q
38 42
2015 2016 2017 2018 Q3

92
53% 50%
2015 2016 2017 Last 4Q
FTEs trending down
Good progress in improving costs and efficiency
Realised by several drivers Future levers to lower costs
Rationalise product offering (in all categories) by c.50% in 2020
Develop simple solutions, optimise processes and
documentation to improve efficiency
Continue exploring alternative business models and new ways
of offering products (e.g. New10, from labour-intensive to
platform driven digitally)
Improve (operational) efficiency through convenient and fast
digital basic services to deliver ‘hassle free banking’
2,931 2,704
2017 Q3 2017 Q4 2018 Q1 2018 Q2 2018 Q3
Introduction of new management structure early 2017 leading
to delayering and improved span of control
Merger Lease and Factoring proposition into single Asset
Based Financing organisation
Introduction of sector-based approach (e.g. resulting in
centralisation of activities such as support)
More efficient way of working (a.o. COO organisation adopted
Agile way of working)
FTE 8% lower vs. Q3 2017, expected to decrease further
Cost/ income ratio

93
We are committed to
Service the Dutch SME market guided by client intimacy where it matters and
efficiency everywhere else
Drive the sustainable agenda to accelerate the sustainability shift, which
contributes to society and our financial performance
Grow our top line profitably and manage costs effectively
Pursuing sustainability as a business opportunity

Questions
CEOs CIB & Commercial Banking

95
09h30 – 09h35 Welcome & programme Dies Donker (Head of IR) 3
09h35 – 10h00 Banking for better, for generations to come Kees van Dijkhuizen (CEO) 4
10h00 – 10h25 Accelerate to the future Christian Bornfeld (CI&TO) 20
10h25 – 10h45 Safeguarding our moderate risk profile Tanja Cuppen (CRO) 33
10h45 – 11h15 Q&A CEO, CI&TO, CRO 44
11h15 – 11h40 Break 45
11h40 – 12h00 Customer experience, our key priority Frans van der Horst (CEO RB) 46
12h00 – 12h20 Transforming to a more scalable private bank Pieter van Mierlo (CEO PB) 60
12h20 – 12h40 Q&A CEOs RB and PB 71
12h40 – 13h25 Lunch 72
13h25 – 13h45 Future proof CIB Rutger van Nouhuijs (CEO CIB) 73
13h45 – 14h05 Sustainability, a business opportunity Daphne de Kluis (CEO CB) 85
14h05 – 14h25 Q&A CEOs CIB, CB 94
14h25 – 14h40 Break 95
14h40 – 15h05 Strong capital generation and return Clifford Abrahams (CFO) 96
15h05 – 15h25 Q&A CFO 115
15h25 – 15h30 Wrap up Kees van Dijkhuizen (CEO) 117

ABN AMRO Investor Day
Strong capital generation
and return
CFO | Clifford Abrahams
16 November 2018

97
Banking for better, for generations to come
Increasing fees with sustainability
initiatives
Fulfilling client demand for sustainable
investments in Private Bank
Better risk profile of clients engaged in
sustainability
Sustainability
Identifying key customer experience
points generates new business
opportunities
Aligning core offering with changed
client behaviour, e.g. enhancing
insurance and investment offerings
Establish new partnerships both within
and outside the financial sector
Lower cost through digital first
Customer experience
Continuously manage the balance of
efficient and sufficient IT investments
Improve IT cost efficiency through
demand, productivity and supply levers
Further product and process
rationalisation and improvement
Delivering RoE >10% in 2021 in CIB
through transforming the business
model
Future-proof bank

98
Strong capital generation and return
17.3
5
18.8
0
20.3
4
20.3
2
23
.26
2.94
YE15 YE16 YE17 18Q3 CumDPS
Adj.TBV
Cum. dividend paidTangible book value
Reliable earnings from clients in strong economies
Disciplined cost management
Moderate risk profile
Robust ROE delivering strong capital generation
Strong and resilient capital position
Attractive capital return to shareholders
Average annual capital generation, including dividends, equals
11.2% since year-end 2015 (EUR per share)
Our approach to value delivers … … strong capital generation and return

99
Past Today Future
Resilient NII, but pressure on deposit margins in the short-term
1) Client lending excludes divested activities of PB Asia (2017) & PB Luxembourg (2018)
2) ABN AMRO Group Economics Department interest rate outlook scenarios used for setting the FTP (Funds Transfer Price). Base scenario assumes a first rate hike towards
YE2019 and further increases in 2020/22. Positive scenario assumes earlier rate hikes of the main policy rates up until 2021, whereas the negative scenario assumes more
accommodative ECB measures (deposit cut and more QE). The dip in the FTP in Q3 2018 shows the implementation of the Non-Maturing Deposits (NMD) model
Suggest to change footnote 2
and refer to appendix. Instead
we can add a footnote on why
NII for Last 4Q is so high, as
17Q4 contained a large NII
release
Acc to Finance it
should be PB
Prospects on client lending
Flat short-term client lending, reflec-
ting CB increase, flat mortgages,
decline from CIB refocus
Thereafter modest increase, reflecting
normalisation of CIB, RB and PB loan
growth
Prospects on NII
Modestly lower in short-term, reflecting
margin pressure from deposits
Thereafter NII improvements as
deposit margin pressure eases and
client lending normalises
Prospects on deposit margins
Main deposit rate at 3bps, little or no
room to lower further
FTP and NII depend on interest rate
development
Base case assumes ongoing deposit
pressure in 2019 and improvements
thereafter
Client lending 1) Net interest income and margins Margin pressure deposits 2)
FTP deposits
Main savings rate
deposit margins depend on rate developments
Base
Neg.
Pos.
6.0 6.2 6.4 6.6
146 152 157
165
2015 2016 2017 Last 4Q
NII underlyingNII divestedNIM (bps)
236 246 248 255
2015 Q4 2016 Q4 2017 Q4 2018 Q3
PB CB CIB RBEUR bn EUR bn %

100
Other income
Resilient fees and other income
0.4 0.5 0.6 0.6
0.1
0.1 0.2
0.4 0.2
2015 2016 2017 Last 4Q
Other income Private Equity
Divestment effects Guidance (0.5bn)
EUR bn
Fees
Annual fee income excluding divested activities of PB Asia and
PB Luxembourg (EUR bn)
1.8 1.7 1.7 1.7
1.9 1.8
1.7 1.7
2015 2016 2017 Last 4Q
CIB 31%
PB 30%
RB 20%
CB 16%
GF 2%
Prospects on fees
Stable fees in short term, reflecting decline from CIB refocus,
growth in PB and stable in other segments
Thereafter modest pickup from growth initiatives, reflecting
new services & business models and from partnerships
PB to grow securities with focus on managed portfolios
Prospects on other income
Other income is volatile and includes accounting effects
Outlook guidance unchanged as recent outperformance
reflects divestments and large private equity disposal gains
Third party funding of Private Equity not expected to impact
materially in short term

101
1) Operating costs, excluding costs from divested activities (PB Asia, PB Lux). Costs of compensation schemes refer to costs associated with SME derivatives
and ICS credit cards
2) FTE decrease is a reduction of internal and external FTEs
Good progress on cost savings, well on track
Nearly 2/3rds of targeted cost savings delivered. FTE
decrease drives progress on cost savings 2)
On track to meet remaining cost target, through a)
digitalisation & process optimisation, b) TOPS2020 & retail
digitalisation, c) support & control activities
Cost measures from CIB refocus now in implementation
Stable underlying costs from disciplined cost management
Majority incidental costs relate to ongoing restructuring and
compensation schemes
On track to meet 2020 cost ambition of c.5.0bn
5.0 5.1 5.1 5.1
5.1
5.5 5.4 5.4
2015 2016 2017 Last 4Q
Other reported incidentals
Restructuring costs & compensation schemes
Underlying costs (ex. divestments)
12.4
%
13.0
%
1.5%
14%
2018 Q3 Pending Target2020
CIB Update
0.6
0.9 0.4
1.0
2018 Q3 Pending Target2020
EUR bn
Cost saving programmes well on track Targeted cost savings offset cost increases 1)
Targeted FTE reduction
nearly completed
EUR c.0.6bn of targeted savings
realised
CIB Update

102
On track to meet 56-58% target (2020) and raising ambition
to <55% (in 2022)
Short term headwinds
Flat NII outlook on lending
Deposit margin pressure from low rate environment
Costs of regulatory change, required digital investments
On track to meet 56-58% in 2020 through
Remaining savings from digitalisation & process optimisation,
TOPS2020 & retail digitalisation, support & control activities
CIB cost reduction
Restructuring provisions foreseen in Q4 of around 50m
Despite headwinds, C/I target sharpened to <55% for 2022
Income benefitting from lending and deposit margin
normalisation, growth initiatives
Based on our Group Economics base scenario including
GDP, interest rates and housing market developments
Improve IT cost efficiency, further product and process
rationalisation and improvement across business lines and
support functions
Cost savings deliver continued C/I improvements, despite headwinds
61.3%
56.9% 56% <55%
56-58%
61.8%
58.6%
2015 Last 4Q 2020 2022
Actuals Targets
Restructuring costs
Despite headwinds, C/I target sharpened to <55% for 2022
Moderate income growth from lending normalisation, easing of margin
pressure, growth initiatives
Increase IT cost efficiency through demand, productivity and supply levers.
Continued product and process rationalisation and optimisation
Further digitalisation and process improvement across business lines and
support functions
Restructuring provisions expected in Q4 of [40-80m]

103
Capital and dividend framework
1) Annual capital generation before dividend. Calculated as midpoint ROE target times CET1 capital divided by Basel III RWAs
Strong capital position and capital generation
but constrained by leverage ratio (today)
Strong capital position
CET1 well placed in 17.5-18.5% range
Basel IV well placed at c.13% ex.
mitigations, >13.5% incl. mitigations
Leverage ratio >4.0%
Capital Well controlled RWAs
Flat client lending in short term
Basel IV output floor reduces volatility
Basel IV management response
RWA
Committed to return excess capital
Dividend pay-out of ≥50% of sustainable profit
Additional distributions considered when capital is within (or above) target range
Preference for additional dividend pay-out in cash vs. buyback
€
Robust ROE
ROE target 10-13%
ROE 13.1% YTD
c.200bps CET1 generation 1)
ROE

104
1) ROE based on annualised 2018 YTD segment results and 13.5% CET1 (Basel III) over period end RWAs
2) Reduce capital by 2020 and improve ROE, also excluding changes NII allocation by ALM, by 2021
Robust ROE delivery, meeting target
ROE
Healthy (above target) ROE for
c.60% of capital employed CIB to refocus and restore
ROE to >10% by 2021
Consistent ROE delivery inside target range (EUR) Strong focus on segment ROEs 1)
Since IPO consistently strong ROE delivered, beating ROE target
Retail, Private and Commercial Banking deliver healthy ROEs
CIB measures announced to reduce capital usage and improve ROE to >10% 2)
ROE
12.0% 11.8%
14.5%
13.1%
EUR 15.9bn EUR 17.2bn EUR 18.8bn EUR 19.4bn
2015 2016 2017 2018 YTD
Avg. stock of equity
10-13% ROE target
10-13% ROE target
RB CB PB CIB
Capital employed (RWA)
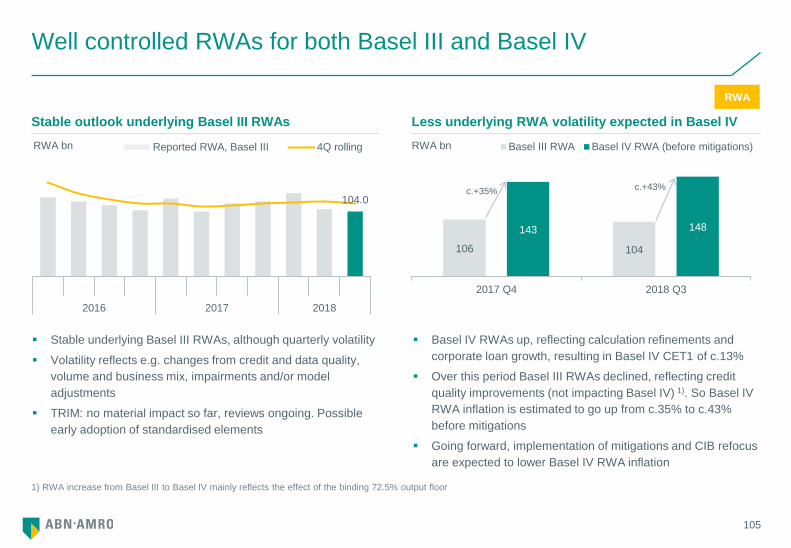
105
1) RWA increase from Basel III to Basel IV mainly reflects the effect of the binding 72.5% output floor
Well controlled RWAs for both Basel III and Basel IV
106 104
143 148
2017 Q4 2018 Q3
Basel III RWA Basel IV RWA (before mitigations)
c.+35% c.+43%
104.0
2016 2017 2018
Reported RWA, Basel III 4Q rolling
Stable underlying Basel III RWAs, although quarterly volatility
Volatility reflects e.g. changes from credit and data quality,
volume and business mix, impairments and/or model
adjustments
TRIM: no material impact so far, reviews ongoing. Possible
early adoption of standardised elements
Stable outlook underlying Basel III RWAs Less underlying RWA volatility expected in Basel IV
RWA bn RWA bn
Basel IV RWAs up, reflecting calculation refinements and
corporate loan growth, resulting in Basel IV CET1 of c.13%
Over this period Basel III RWAs declined, reflecting credit
quality improvements (not impacting Basel IV) 1). So Basel IV
RWA inflation is estimated to go up from c.35% to c.43%
before mitigations
Going forward, implementation of mitigations and CIB refocus
are expected to lower Basel IV RWA inflation
RWA

106
1) Risk weights prior to the application of the 72.5% output floor
Focusing now on ensuring well placed for Basel IV from 2022
Anticipate EU implementation from 2022 with ongoing uncertainties on details
Active regulatory dialogue on uncertainties: eg indexing mortgage collateral, NHG eligibility, specialised lending risk weights
Implement low cost and no regret actions: eg data enhancements, CIB refocus
Cautious approach to repricing to safeguard franchise through implementation uncertainties and transition
ABF example in speakernotes : under Basel IV only financial
collateral is effective
eg Production equipment
RWA
Response Objective Actions
Mitigations of c.1/5th
of Basel IV inflation
Reduce
RWA
inflation
Specific initiatives to reduce static Basel IV RWA inflation
Enhance data quality: eg source SME turnover to lower risk weight from 100% to 85%, CRE to RRE 1)
Procure external credit ratings: externally rated clients can have risk weight <100% 1)
Rationalise product offering: eg from committed to uncommitted, reduce undrawn headroom in credit
lines, restructure clearing credit lines, centrally clear securities transactions
Improve collateral: eg financial collateral lowers exposure, improve data sourcing
Reduce capital
intensive activities
Reduce
RWAs
CIB refocus lowers Basel III RWAs by 5bn
Focus on reducing NPLs
New business model Enhance
returns
CIB adopts more capital efficient business model, i.e. active portfolio management, originate to
distribute, increase risk mitigation
CB: co-lending partners, credit insurance
RB: externally funded long-term mortgage funds
Pricing Enhance
returns
Mortgages priced for Basel IV requirements for some time
Pricing for long term products allows for Basel IV phase-in: eg CRE, Shipping
CB: sector based pricing
This slide is too full
>> speaker notes: I know this is very full slide, don’t worry I will talk you through
Reduction c.1/5th
of RWA inflation

107
1) Former CET1 target based on 4.5% Pillar 1, 5.5% Combined Buffer Requirement, 1.75% Pillar 2R, 5bps Counter Cyclical Buffer and the remainder of Pillar 2G and
management buffer
Basel III capital target range remains 17.5-18.5% for 2019
RWA inflation increased to c.43% as Basel III RWAs declined. Net of identified mitigations of c.1/5th, net RWA inflation remains c.35%,
before CIB Refocus, reducing capital intensive activities, changes to business model and pricing
Aim to meet fully loaded Basel IV early in phase-in period. Prudent buffer for Basel IV implementation, expected unchanged for 2019,
and adequate to address implementation risks
Capital position at top of the range. Expect to review range annually or upon material changes (eg SREP, NPE guidance, TRIM,
provision reviews)
1)
13.5%
4-5% 17.5-18.5%
Formertarget
Basel IV imple-mentation buffer
Target 2019
c.43%
100%
c.135%
Basel III2018 Q3
RWAinflation
RWAmitigation
Pro formaBasel IV
Capital target unchanged for 2019 Estimated Basel IV RWA inflation & mitigation
Fully loaded CET1 target range stated in Basel III terms, in view of
current capital rules
Capital
2018 Q3
18.6% CET1

108
Well positioned for Basel III & Basel IV, leverage ratio
constrained short-term
1) Non-performing Exposure Guidelines aim to harmonise the impairment approach and treatment of non-performing exposures across European banks
Basel III Basel IV Leverage ratio
Actual 18.6% c.13% before mitigations
>13.5% post mitigations
4.1%
Target 10.425% SREP (2018)
17.5-18.5% target
13.5% early in phase-in period >4.0% ambition
Status Well positioned Well positioned Constrained short-term
Prospects 1) Credit and business
developments
Model reviews (TRIM)
Capital: provision reviews,
industry-wide NPE guidance
SREP (2019)
EU implementation Basel IV
Mitigation and management
response
Capital: provision reviews,
industry-wide NPE guidance
Capital: provision reviews,
industry-wide NPE guidance
Legal merger and SA-CCR
implementation provide relief
Capital

109
1) Source: ABN AMRO, S&P Global Market Intelligence, dated 2018 Q2
2) Instruments, exceeding ABN AMRO Bank’s requirements, do not fully contribute to consolidated group capital ratios, impacting T1, total capital and leverage ratio. No impact
on group CET1 ratio.
3) Legal merger has no material impact on shareholders, DR holders and creditors. No impact on effectiveness of defence mechanism or anti-takeover mechanism. STAK to
hold ABN AMRO Bank shares for depositary receipts. Subject to internal and external approvals, including from regulators, general meeting and depositary receipt
holders, and consent of or alignment with other stakeholders
Leverage ratio benefits from legal merger and
from future SA-CCR rules
Capital
Minority Interest Rules Current exposure calculation
Impacts Group T1 and T2 capital
(numerator) 2)
Exposure from derivative
clearing (denominator)
Solution Legal merger of group into
bank (2019) 3)
Application of
SA-CCR rules (≤2021)
Relief c.0.2% of LR c.0.5% of LR
Leverage ratio developments Implied leverage ratio at par with peer average 1)
Exploring legal merger, targeting to improve leverage ratio by c.0.2%, through optimising the AT1 effectiveness 2,3)
Regulatory dialogue continues and targets early SA-CCR adoption, improves leverage ratio by c.0.5%
Exposure measure actively managed and well controlled and benefits from CIB refocus
4.1
4.1
4.8
4.3
6.0
4.0
4.1
4.1
4.2
4.2
4.5
4.5
4.8
5.0
5.2
5.2
5.6
6.8
AB
N
AB
N a
dj.
ING
A
KB
C
BN
P
GLE
AC
A
DA
NS
KE
SH
B
SW
ED
CB
K
LLO
Y
ND
A
RB
S
UC
G
ISP
DN
B
Benelux Other EU
SA-CCR effect Merger effect
Leverage ratio Average

110
0.65
0.81 0.84
1.45
40% 45% 50% 60% accrued
2015 2016 2017 2018
Interim DPS (EUR) Final DPS (EUR)
Committed to return excess capital through dividend
Dividend policy
Dividend policy: 50% of sustainable profit plus additional
distributions
Preference for additional distributions in dividend vs.
buybacks
Good progress made on additional distributions
Well placed vs. Basel III capital range
Well controlled Basel III RWA development
Good progress on Basel IV management response
CIB refocus in execution
Steadily increasing dividend pay-out delivered to 50% in 2017
Dividend accrual raised to 60% of YTD profit to provide dividend flexibility. Final decision with FY2018 results,
reflecting SREP, leverage ratio, Basel IV outlook and industry-wide NPE guidance
Beyond 2018 we expect to be well placed to consider additional cash dividend pay-out on top of 50% of sustainable
profit, subject to regulatory, business and economic conditions
Track record of increased dividend Approach to additional dividends
40% 45% 50% 60% accrued
€

111
We are committed to delivering on our promises and targets
Reliable earnings from clients in strong economies
Disciplined cost management
Moderate risk profile
Robust ROE delivering strong capital generation
Strong and resilient capital position
Attractive capital return to shareholders
We are committed to…
Strong earnings track record in low rate environment
C/I ratio on track: 56-58% (2020) and to <55% (2022)
Sound asset quality, healthy credit outlook
Since IPO: ROE >11% delivered
Above target capital at 18.6%, resilient stress test result
60% accrued for 2018, well placed beyond 2018
Good progress on financial targets

A Additional slides

113
Current structure
Merger releases CET1 and AT1 capital and improves leverage ratio
Exploring legal merger, targeting to improve leverage ratio by c.0.2%, through optimising the AT1 effectiveness 1)
Merger also simplifies legal and reporting structure
No material effect on investors in equity & debt instruments and defence mechanism remains in place
Timing is subject to regulatory and stakeholder approvals. Completion targeted in the course of 2019
Post merger
1) EBA interpretation of Minority Interest Rules (MIR) applies to EU banks. At the holding company MIR limits the effectiveness of the portion of capital instruments exceeding
the minimum own funds requirement at the operating company. This portion of instruments can no longer fully contribute to consolidated capital ratios of ABN AMRO Group.
The legal merger removes these capital restrictions and results in higher effective amount of AT1, Tier 1, total capital and improves leverage ratio
ABN AMRO Bank
Shareholders & DR-holders
ABN AMRO Group
ABN AMRO Group
ABN AMRO Bank
(Acquiring Company)
Share Exchange
AAB shares for AAG shares
ABN AMRO Group
(Disappearing Company)
ABN AMRO Bank
Shareholders & DR-holders
ABN AMRO Bank
Legal merger
1) EBA interpretation of Minority Interest Rules (MIR) applies to EU banks. MIR limits the effectiveness of capital instruments at a holding company, as a portion of outstanding instruments at the operating
company, exceeding minimum own funds requirement. These instruments can no longer fully contribute to consolidated capital ratios of ABN AMRO Group. The legal merger removes these capital
restrictions and results in higher effective amount of AT1, Tier 1, total capital and improves leverage ratio

114
29.5
%
29.3
%
Q1 Q2 Q3 Q4 Q1 Q2 Q3 YE
2017 2018 2019
MREL (in RWAs) Ambition YE2019
4.1
%
4.0
%
Q1 Q2 Q3 Q4 Q1 Q2 Q3 YE
2017 2018 2018
Ambition YE2018
Leverage ratio
Exposure Measure
Limited issuance of capital and funding instruments in 2019
Leverage ratio managed to above
4.0%
Expectation 2019
− No AT1 issuance, no redemptions
− Legal merger to release trapped
equity and AT1
− Further profit accrual
− Exposure measure actively
managed
MREL ambition met, excluding any
senior preferred instruments
Finalisation MREL framework pending
(2019)
Outlook 2019
− Possible inaugural SNP issuance to
optimise MREL mix
− No T2 redemptions
LT funding need 2019: EUR 10-15bn
Senior preferred (unsecured) in
various currencies and maturities and
under various programmes
Covered Bonds to facilitate long dated
mortgage origination
Leverage ratio MREL Wholesale Funding
Key considerations
Regulatory requirements: LCR, NSFR
Internal limits: LtD, buffer, asset
encumbrance
Diversification and redemption profile
Market dynamics

Questions
CFO

116
09h30 – 09h35 Welcome & programme Dies Donker (Head of IR) 3
09h35 – 10h00 Banking for better, for generations to come Kees van Dijkhuizen (CEO) 4
10h00 – 10h25 Accelerate to the future Christian Bornfeld (CI&TO) 20
10h25 – 10h45 Safeguarding our moderate risk profile Tanja Cuppen (CRO) 33
10h45 – 11h15 Q&A CEO, CI&TO, CRO 44
11h15 – 11h40 Break 45
11h40 – 12h00 Customer experience, our key priority Frans van der Horst (CEO RB) 46
12h00 – 12h20 Transforming to a more scalable private bank Pieter van Mierlo (CEO PB) 60
12h20 – 12h40 Q&A CEOs RB and PB 71
12h40 – 13h25 Lunch 72
13h25 – 13h45 Future proof CIB Rutger van Nouhuijs (CEO CIB) 73
13h45 – 14h05 Sustainability, a business opportunity Daphne de Kluis (CEO CB) 85
14h05 – 14h25 Q&A CEOs CIB, CB 94
14h25 – 14h40 Break 95
14h40 – 15h05 Strong capital generation and return Clifford Abrahams (CFO) 96
15h05 – 15h25 Q&A CFO 115
15h25 – 15h30 Wrap up Kees van Dijkhuizen (CEO) 117

ABN AMRO Investor Day
Wrap-up
CEO | Kees van Dijkhuizen
16 November 2018

118
Wrap-up
Disciplined delivery since IPO
Strategy refresh with 3 pillars: sustainability, customer
experience and future-proof bank
We are committed to our moderate risk profile
Continuously manage the balance of efficient and
sufficient IT investments
Expanding our involvement in broader ecosystems and
client journeys outside our own
Photo to be updated
In the Retail Bank we will build on our proven track
record through a focus on customer experience
Harmonisation, digitisation and growth will drive the C/I
of the Private Bank
CIB to deliver >10% RoE in 2021 under Basel III and
transform and prepare for Basel IV
The Commercial Bank to turn sustainability into a
business opportunity

119
Responsible investment choice with high returns
Domestic champion in Retail, Private, Commercial and Corporate Banking in a digitally-
savvy and strong Dutch market
Making a positive impact in a profitable way by accelerating the sustainability shift of our
clients
Treasuring the customer relationship increasingly working with partners
Demonstrated delivery on cost savings, with Innovation & Technology as a critical enabler
for efficiency
Moderate risk profile based on discipline, strong capitalisation and a clean balance sheet
Delivering attractive returns with high capital return
Decisive and agile management team

Thank you

121
For the purposes of this disclaimer ABN AMRO
Group N.V. and its consolidated subsidiaries are
referred to as "ABN AMRO“. This document (the
“Presentation”) has been prepared by ABN
AMRO. For purposes of this notice, the
Presentation shall include any document that
follows and relates to any oral briefings by ABN
AMRO and any question-and-answer session
that follows such briefings. The Presentation is
informative in nature and is solely intended to
provide financial and general information about
ABN AMRO. This Presentation has been
prepared with care and must be read in
connection with the relevant Financial
Documents (latest Quarterly Report and Annual
Financial Statements, "Financial Documents").
In case of any difference between the Financial
Documents and this Presentation the Financial
Documents are leading. The Presentation does
not constitute an offer of securities or a
solicitation to make such an offer, and may not
be used for such purposes, in any jurisdiction
(including the member states of the European
Union and the United States) nor does it
constitute investment advice or an investment
recommendation in respect of any financial
instrument. Any securities referred to in the
Presentation have not been and will not be
registered under the US Securities Act of 1933.
The information in the Presentation is, unless
expressly stated otherwise, not intended for
residents of the United States or any "U.S.
person" (as defined in Regulation S of the US
Securities Act 1933). No reliance may be placed
on the information contained in the Presentation.
No representation or warranty, express or
implied, is given by or on behalf of ABN AMRO,
or any of its directors or employees as to the
accuracy or completeness of the information
contained in the Presentation. ABN AMRO
accepts no liability for any loss arising, directly
or indirectly, from the use of such information.
Nothing contained herein shall form the basis of
any commitment whatsoever. ABN AMRO has
included in this Presentation, and from time to
time may make certain statements in its public
statements that may constitute “forward-looking
statements”. This includes, without limitation,
such statements that include the words ‘expect’,
‘estimate’, ‘project’, ‘anticipate’, ‘should’, ‘intend’,
‘plan’, ‘probability’, ‘risk’, ‘Value-at-Risk (“VaR”)’,
‘target’, ‘goal’, ‘objective’, ‘will’, ‘endeavour’,
‘outlook’, 'optimistic', 'prospects' and similar
expressions or variations on such expressions.
In particular, the Presentation may include
forward-looking statements relating but not
limited to ABN AMRO’s potential exposures to
various types of operational, credit and market
risk. Such statements are subject to
uncertainties. Forward-looking statements are
not historical facts and represent only ABN
AMRO's current views and assumptions on
future events, many of which, by their nature,
are inherently uncertain and beyond our control.
Factors that could cause actual results to differ
materially from those anticipated by forward-
looking statements include, but are not limited
to, (macro)-economic, demographic and political
conditions and risks, actions taken and policies
applied by governments and their agencies,
financial regulators and private organisations
(including credit rating agencies), market
conditions and turbulence in financial and other
markets, and the success of ABN AMRO in
managing the risks involved in the foregoing.
Any forward-looking statements made by ABN
AMRO are current views as at the date they are
made. Subject to statutory obligations, ABN
AMRO does not intend to publicly update or
revise forward-looking statements to reflect
events or circumstances after the date the
statements were made, and ABN AMRO
assumes no obligation to do so.
Disclaimer

Website
ABN AMRO Group: www.abnamro.com/ir
Questions
Address
Gustav Mahlerlaan 10
1082 PP Amsterdam
The Netherlands
2018 Investor Relations