aberystwyth university spatial genetic structure and
TRANSCRIPT
Aberystwyth University
Spatial genetic structure and dispersal of the cacao pathogen Moniliophthoraperniciosa in the Brazilian AmazonArtero, A. S.; Silva, J. Q.; Albuquerque, P. S. B.; Bressan, E. A.; Leal Jr., G. A.; Sebben, A. M.; Griffith, G. W.;Figueira, A.
Published in:Plant Pathology
DOI:10.1111/ppa.12644
Publication date:2017
Citation for published version (APA):Artero, A. S., Silva, J. Q., Albuquerque, P. S. B., Bressan, E. A., Leal Jr., G. A., Sebben, A. M., Griffith, G. W., &Figueira, A. (2017). Spatial genetic structure and dispersal of the cacao pathogen Moniliophthora perniciosa inthe Brazilian Amazon. Plant Pathology, 358-371. https://doi.org/10.1111/ppa.12644
General rightsCopyright and moral rights for the publications made accessible in the Aberystwyth Research Portal (the Institutional Repository) areretained by the authors and/or other copyright owners and it is a condition of accessing publications that users recognise and abide by thelegal requirements associated with these rights.
• Users may download and print one copy of any publication from the Aberystwyth Research Portal for the purpose of private study orresearch. • You may not further distribute the material or use it for any profit-making activity or commercial gain • You may freely distribute the URL identifying the publication in the Aberystwyth Research Portal
Take down policyIf you believe that this document breaches copyright please contact us providing details, and we will remove access to the work immediatelyand investigate your claim.
tel: +44 1970 62 2400email: [email protected]
Download date: 18. Mar. 2022

Acc
epte
d A
rtic
leA
ccep
ted
Art
icle
This article has been accepted for publication and undergone full peer review but has not been through the copyediting, typesetting, pagination and proofreading process, which may lead to differences between this version and the Version of Record. Please cite this article as doi: 10.1111/ppa.12644
This article is protected by copyright. All rights reserved.
Received Date : 09-Nov-2015
Revised Date : 17-Oct-2016
Accepted Date : 18-Oct-2016
Article type : Original Article
Spatial genetic structure and dispersal of the cacao pathogen Moniliophthora perniciosa in the
Brazilian Amazon
A.S. Artero1,&; J. Q. Silva1,#a,&; P.S.B. Albuquerque2; E.A. Bressan1; G.A. Leal Jr.1,#b; A.M. Sebbenn3,
G.W. Griffith4; A. Figueira1*
1Universidade de São Paulo, Centro de Energia Nuclear na Agricultura, Piracicaba, São Paulo, Brazil;
2Comissão Executiva do Plano da Lavoura Cacaueira, ERJOH, Marituba, Pará, Brazil;
3Instituto Florestal de São Paulo, Estação Experimental de Tupi, Piracicaba, São Paulo, Brazil;
4Aberystwyth University, Cledwyn Building, Institute of Biological, Environmental and Rural Sciences,
Penglais, Ceredigion, SYD3 3DD, Wales, United Kingdom;
#aCurrent address: Universidade Federal do Recôncavo da Bahia, Centro de Ciências Agrárias,
Ambientais e Biológicas, Campus de Cruz das Almas, Cruz das Almas, Bahia, Brazil;
#bCurrent address: Universidade Federal de Alagoas, Centro de Ciências Agrárias, Rio Largo, Alagoas,
Brazil.
& These authors contributed equally to this work.

Acc
epte
d A
rtic
leA
ccep
ted
Art
icle
This article is protected by copyright. All rights reserved.
*Corresponding author
e-mail: [email protected]
Running head: Moniliophthora perniciosa diversity
Keywords: Crinipellis; Marasmius; Theobroma; witches’ broom disease.
Abstract
Moniliophthora perniciosa is the causal agent of witches’ broom in Theobroma cacao (cacao). Three
biotypes of M. perniciosa are recognized, differing in host specificity, with two causing symptoms on
cacao or Solanaceae species (C- and S-biotypes), and the third found growing endophytically on
lianas (L-biotype). Our objectives were to clarify the genetic relationship between the three
biotypes, and to identify for the C-biotype, those regions in the Brazilian Amazon with the greatest
genetic diversity. Phylogenetic reconstruction based on the rRNA ITS regions showed that the C-and
S-biotypes formed a well-supported clade separated from the L-biotype. Analysis of 131 isolates,
genotyped at 11 microsatellite loci found that S- and especially L-biotypes showed a higher genetic
diversity. A significant spatial genetic structure was detected for the C-biotype populations in
Amazonia for up to 137 km, suggesting isolation by distance mode of dispersal. However, in
regions containing extensive cacao plantings, C-biotype populations were essentially
‘clonal’, as evidenced by high frequency of repeated multilocus genotypes. Among the
Amazonian C-biotype populations, Acre and West Amazon displayed the largest genotypic
diversity and might be part of the center of diversity of the fungus. The pathogen dispersal may
have followed the direction of river flow downstream from Acre, Rondonia and West Amazon
eastward to the rest of the Amazon valley, where cacao is not endemic. The Bahia population
exhibited the lowest genotypic diversity, but high allele richness, suggesting multiple invasions, with
origin assigned to Rondonia and West Amazon, possibly through isolates from the Lower Amazon
population.
Acc
epte
d A
rtic
leA
ccep
ted
Art
icle
This article is protected by copyright. All rights reserved.
Introduction
Little attention has been given to the evolutionary biology and population genetics of plant
pathogens (Giraud et al., 2008), but establishing basic processes in the life history of parasites may
assist in developing strategies to avoid or reduce their impact in agriculture and manage potentially
harmful invasions. The dispersal ability of pathogens, especially fungi, defines the genetic
differentiation between populations and the potential gene flow between populations at global,
intracontinental or regional scale. Fungal mating system plays an important role in dispersal ability
since reproductive strategies, such as selfing or clonality, may be beneficial for pathogens as a
rapid means to propagate the fittest individuals, without requiring the presence of a
compatible mating partner.
Moniliophthora perniciosa (Marasmiaceae sensu stricto; Aime & Phillips-Mora, 2005)
is the causal agent of the witches’ broom disease of Theobroma cacao L (cacao). Its
basidiospores infect actively growing meristematic tissues (shoot apices, single flowers, flower
cushions, and developing pods), inducing a range of symptoms depending on organ infected and
stage of development (Purdy & Schmidt, 1996). Hypertrophic and hyperplastic growth of infected
buds, called ‘brooms’, are the most remarkable symptoms, but economic losses derive mainly from
infected pods and debilitated trees. It was originally believed that M. perniciosa infects only cacao
and Theobroma congeners, and species from the sister genus Herrania (Purdy & Schmidt, 1996), all
from the Malvaceae senso latu (formely Sterculiaceae). However, since the 1980s, it has been found
infecting living tissues of plants belonging to diverse unrelated hosts, causing distinctive witches´
broom symptoms in many of these.
Griffith & Hedger (1994a) proposed that M. perniciosa contains at least three discrete
biotypes (C-, S-, and L-biotypes). The fungus exhibits host specificity, with only very limited
development of symptoms (tissue swelling) in cross-inoculations among distinct biotypes and hosts.
Strains that infect cacao and relatives are termed C-biotype (Griffith & Hedger, 1994a), whilst the S-
biotype naturally infects various weedy solanaceous species (e.g. Solanum rugosum). However, upon
artificial inoculation, it can cause broom symptoms on cultivated species, such as tomato and pepper
(Bastos & Evans, 1985). The L-biotype has not been shown to cause witches’ broom symptoms and
has typically found forming basidiocarps in living woody liana vines and associated debris (Griffith &
Hedger, 1994b). In coastal and Amazonian Ecuador, the L-biotype was consistently found on vines of
Arrabidaea verrucosa (Bignoniaceae) (Griffith & Hedger, 1994b).
Acc
epte
d A
rtic
leA
ccep
ted
Art
icle
This article is protected by copyright. All rights reserved.
More detailed investigation of the breeding biology of the three biotypes (Griffith & Hedger,
1994b) showed that the L-biotype is with a multiallelic tetrapolar outcrossing mechanism, as is
widely found among agaric fungi, such that formation of the fertile dikaryotic mycelium bearing
clamp connections, first requires mating between two compatible monokaryons. In contrast, the C-
and S- biotypes exhibit an unusual non-outcrossing breeding strategy found only rarely among agaric
fungi whereby haploid, uninucleate basidiospores germinated on agar media are able to
autodikaryotize over a period of 1-3 weeks following germination. However, in nature basidiospores
germinate and infect host tissues forming a swollen and multinucleate ‘biotrophic’ mycelium within
green brooms, with the typical clamped dikaryotic mycelium only appearing as the brooms die
(Griffith & Hedger, 1994c). The breeding strategy of the C- and S- biotypes is often described as
‘clonal’ and we also use this term here. However, we recognize that meiotic division following
karyogamy of two identical nuclei is not clonality in its strictest sense. Furthermore, in multiply
infected brooms, it is possibly that fusion of hyphae derived from genetically different basidiospores
could lead to the formation of hetero-dikaryons.
Defining the areas with the largest genetic diversity would help to devise strategies to search
for resistance in the Amazon region, putatively considered the center of origin of both M. perniciosa
(Baker & Holliday, 1957; Purdy & Schmidt, 1996) and its host T. cacao (Motamayor et al., 2008;
Thomas et al., 2012). The C-biotype is endemic to the Amazon (Purdy & Schmidt, 1996), from where
it invaded and devastated local industries in various cacao-producing regions across South America
and the Caribbean, often being transported unwittingly. The first report of witches’ broom affecting
commercial cacao plantations occurred in Suriname in 1895 (Rorer, 1913). Afterwards, the pathogen
was sequentially reported occurring in British Guyana (1906), Ecuador (1921), Trinidad (1928),
Tobago (1939), and Grenada (1948) (Baker & Holliday, 1957), reaching the largest Brazilian cacao
producing region in southern Bahia state in 1989 (Andebrhan et al., 1999). The long distance
between Bahia and the Amazon region (over 2,000 km; Figure 1) and some phytosanitary controls
likely avoided an earlier invasion by the pathogen. The fungus is presently found in all South
American and Caribbean cacao producing countries, with estimated losses from witches’ broom
disease reaching over 250,000 tonnes.year-1 (Bowers et al., 2001). There are current serious
concerns about the potential risk of M. perniciosa invasion in West Africa, a region responsible for
over 70% of the world cacao production, with potential catastrophic socioeconomic consequences.
The natural distribution of T. cacao in Brazil is limited to the Upper Amazon region (Sereno et
al., 2006; Motamayor et al., 2008; Thomas et al., 2012), but when cacao became a valuable
commercial product during the 17th century, cultivation extended eastward to near the mouth of the

Acc
epte
d A
rtic
leA
ccep
ted
Art
icle
This article is protected by copyright. All rights reserved.
Amazon River, particularly stimulated by Jesuit missionaries (Bartley, 2005). Cacao production was
the original basis of the Amazon economy until being supplanted by rubber in the late 19th century.
Later, cacao cultivation was encouraged by the Brazilian government in the state of Rondonia and in
Central Para state along the Transamazon road (Figure 1), as part of colonization projects during the
1970s and 1980s (Godar et al., 2012). The states of Rondonia and Acre, near the putative center of
diversity, contained spontaneous wild cacao stands (possibly from ancient pre-European plantings),
with natural incidence of M. perniciosa (Bartley, 2005; Thomas et al., 2012). On the other hand, the
eastern parts of the Transamazon road (Central Para state) did not contain spontaneous cacao
stands (Bartley, 2005). Since the establishment of cacao cultivation in the Transamazon road region
(Godar et al., 2012), witches’ broom became a major limiting factor for production. But the origin of
M. perniciosa in the region along the Transamazon road is unclear, as it could have derived either
from the old plantations along the Amazon River (~400 km away) or around Belem (~500 km), from
local cupuassu (T. grandiflorum) stands, or from elsewhere.
The spread of the fungus to Southern Bahia occurred in 1989, apparently in two primary
outbreaks (Andebrhan et al., 1999), possibly by either deliberate or accidental intervention by man
(Homewood, 1991). The source of the original genotypes remains unknown, but clearly at least two
distinct lineages have been consistently detected by various molecular means (Andebrhan et al.,
1999; Rincones et al., 2003; Santana et al., 2012). Investigation of the origin of the genotypes in
these major cacao-producing regions is useful to inform breeding programs about diversity, dispersal
patterns, and structure of these pathogen populations.
Therefore, the objectives of this study were to describe the relationship between the
biotypes based on ribosomal gene internal transcribed spacer sequences (ITS), while defining the
regions in the Brazilian Amazon with the largest genetic diversity of the pathogenic C-biotype using
microsatellite loci, to determine the pathogen genetic population structure, the dispersal pattern in
the Amazon and to verify the origin of introduced genotypes in cacao producing regions (Bahia and
Transamazon).
Materials and methods
Moniliophthora perniciosa sampling: A systematic collection of isolates from the C-biotype was
conducted from infected T. cacao trees in 2004 in areas of the Amazonian region where the fungus
occurs naturally, including sites in the states of Acre, Amazonas, Pará, and Rondonia in Brazil, and in
Ecuador (Figure 1). Infected cacao shoots (‘brooms’) were collected from trees under cultivated or
Acc
epte
d A
rtic
leA
ccep
ted
Art
icle
This article is protected by copyright. All rights reserved.
natural conditions along main roads at the Brazilian Amazonian, located at a minimum distance of 10
km between sites, with the geographic positioning recorded (Table 1, Table S1). The isolates from
Acre, Amazonas, Pará and Rondonia were collected by the staff of the Brazilian Ministry of
Agriculture of the “Comissão Executiva do Plano da Lavoura Cacaueira” (CEPLAC). Briefly, infected
cacao shoots (‘green brooms’, 20-50 cm long) were collected from trees and taken back to the
laboratory at the “Estação de Recursos Genéticos José Haroldo” (ERJOH), Marituba, Para state,
where mycelia were cultivated using a selective PDA medium (Potato-Dextrose-Agar containing 100
mg L-1 benzamidazole and 100 mg L-1 streptomycin) from small slices of shoot tissues after surface
sterilization with 5% sodium hypochloride solution. All isolates were routinely maintained on PDA
media.
C-biotype isolates from Southern Bahia were included to investigate their origins. These
isolates from Bahia were kindly provided by Prof. Gonçalo Pereira from the “Universidade Estadual
de Campinas - UNICAMP” (isolates 74, 75, 76, and 77), and by Dr. Karina Peres Gramacho from
CEPLAC, Itabuna, Bahia state (the remaining fourteen isolates). A total of 111 C-biotype isolates of
M. perniciosa were analyzed (Table 1, Table S1). In addition, 14 isolates from the S-biotype and six
isolates from the L-biotypes, originally collected in Brazil and Ecuador (Table 1) were sourced from
the Mycology culture collection at Aberystwyth University or by Dr. Alan Pomella from the Mars
Center for Cocoa Studies, Barro Preto, Bahia, Brazil. Isolates were transported under the permit of
the Brazilian Ministry of Agriculture (‘Parecer Técnico’ DFCP/CGPP 003/2010).
DNA extraction: Isolates were cultivated on PDA in Petri dishes for two weeks, when hyphae plugs
from the growing edge of the culture were used to inoculated 50 mL of medium liquid MYE + G
(0.17% malt extract, 0.5% yeast extract, 5% glycerol). These cultures were incubated in the dark
under agitation (100 rpm) at room temperature for two weeks. Mycelium was then collected by
filtration and stored at -80º C. DNA was extracted from mycelia following a CTAB protocol (Silva et
al., 2008). DNA concentration was determined by fluorimetry using DyNA Quant 2000 (Amersham
Pharmacia Biotech; Buckinghamshire, UK).
ITS sequence analysis and phylogenetic reconstruction: For genetic analysis, the internal transcribed
spacer region (spanning ITS1 and ITS2) was amplified, using the primer pairs ITS1F and ITS4 (White et
al., 1990), and sequenced using Sanger BigDye technology. Sequence management was conducted
within the Geneious (v.6.1.6) bioinformatics package using MAFFT for sequence alignment (default
settings). Phylogenetic reconstruction was conducted using PhyML and the GTR substitution model.
Acc
epte
d A
rtic
leA
ccep
ted
Art
icle
This article is protected by copyright. All rights reserved.
Microsatellite loci analyses: The genetic diversity of the 131 isolates of M. perniciosa of the C-, S- and
L-biotype (Table 1, Table S1) was analyzed using specific primers for 14 microsatellite loci, including
nine loci (mMpCena3, mMpCena4, mMpCena8, mMpCena11, mMpCena12, mMpCena16,
mMpCena19, mMpCena22, and mMpCena26) described by Silva et al. (2008), and additional five loci
(MsCepec_14, MsCepec_15, MsCepec_16, MsCepec_19, and MsCepec_45) developed by Gramacho
et al. (2007). The amplification reactions were conducted as previously described (Silva et al., 2008).
Amplification products were separated in denaturing sequencing gels (7% polyacrylamide, 7 M urea)
ran in Tris-borate buffer at 50 W for 2 h, and visualized by silver staining (Silva et al., 2008). Allele
calls were conducted by migration distance in relation to a DNA 100 bp molecular ladder
(Fermentas, Waltham, MA, USA).
Genetic diversity analyses: To identify the presence of repeated multilocus genotypes among
isolates, we used the genetic identity analysis implemented in Cervus 3.0 (Kalinowski et al., 2007).
The likelihood that two individuals taken at random have different multilocus genotypes ( gD ) in
each population was estimated by: −−= )1)](1/([ 2ig pnnD , where is the sample size and ip is
the frequency of the ith multilocus genotype in each population (Kalinowski et al., 2007). Estimates of
gD were obtained using the Multilocus program (Agapow & Burt, 2001). Biotype and population
genetic diversities were determined using conventional parameters: the average number of alleles
per locus (A), allele richness estimated for a minimum sample size of 9 or 6 individuals (R) estimated
based on the rarefaction method (El Mousadik & Petit, 1996), expected heterozygosity ( eH ) and
fixation index ( F ). The statistical significance of the F values was estimated based on Monte Carlo
permutation of alleles among individuals and a Bonferroni correction of multiple tests (α= 0.05). All
these parameters and analyses were estimated using the FSTAT program, version 2.9.3.2 (Goudet,
1995).
Spatial genetic structure analyses and isolation by distance: The isolation by distance (IBD) was
investigated using only unique multilocus genotypes from the Amazonian region (n= 56) based on
the analysis of spatial genetic structure (SGS). Spatial genetic structure was determined using the
estimation of the average co-ancestry coefficient ( xyθ ) between pairs of isolates and SPAGeDi
version 1.3 (Hardy & Vekemans, 2002). The estimates of xyθ based on Loiselle et al. (1995) have the
advantage to not assume Hardy-Weinberg equilibrium and it can be used in populations with
inbreeding. To visualise the SGS, xyθ values were averaged over a set of ten distance classes and
plotted against distances. The distance classes were chosen to contain the same number of pair of
individuals. To test whether there was a significant deviation from random spatial genetic structure;

Acc
epte
d A
rtic
leA
ccep
ted
Art
icle
This article is protected by copyright. All rights reserved.
the 95% confidence interval was calculated for each observed value and each distance class from
1,000 permutations of individuals among locations.
Analysis of genotype assignment: Individual assignment tests were carried out using the Bayesian
multilocus approach (Cornuet et al., 1999) implemented in the Geneclass2 program (Piry et al.,
2004). Based on Efron (1983), all individuals from the reference dataset were self-classified to the
sampled populations using the leave-one-out approach (self-assignment). There was a most likely
population in any reference set to which the individuals could always be assigned to. However, the
set of reference populations might not include the true population of origin for the control group
resulting in a false positive assignment. Therefore, a measure of confidence was needed that the
tested individuals truly belonged to a given population (Halkett et al., 2010). This was developed by
comparing the likelihood value of the individual test with the likelihood distribution of the
population based on allele frequencies of the population, generated from 10,000 sampling runs with
replacement. If the observed likelihood of the individual test was outside the distribution, then this
indicated that the individual did not belong to that population.
Results
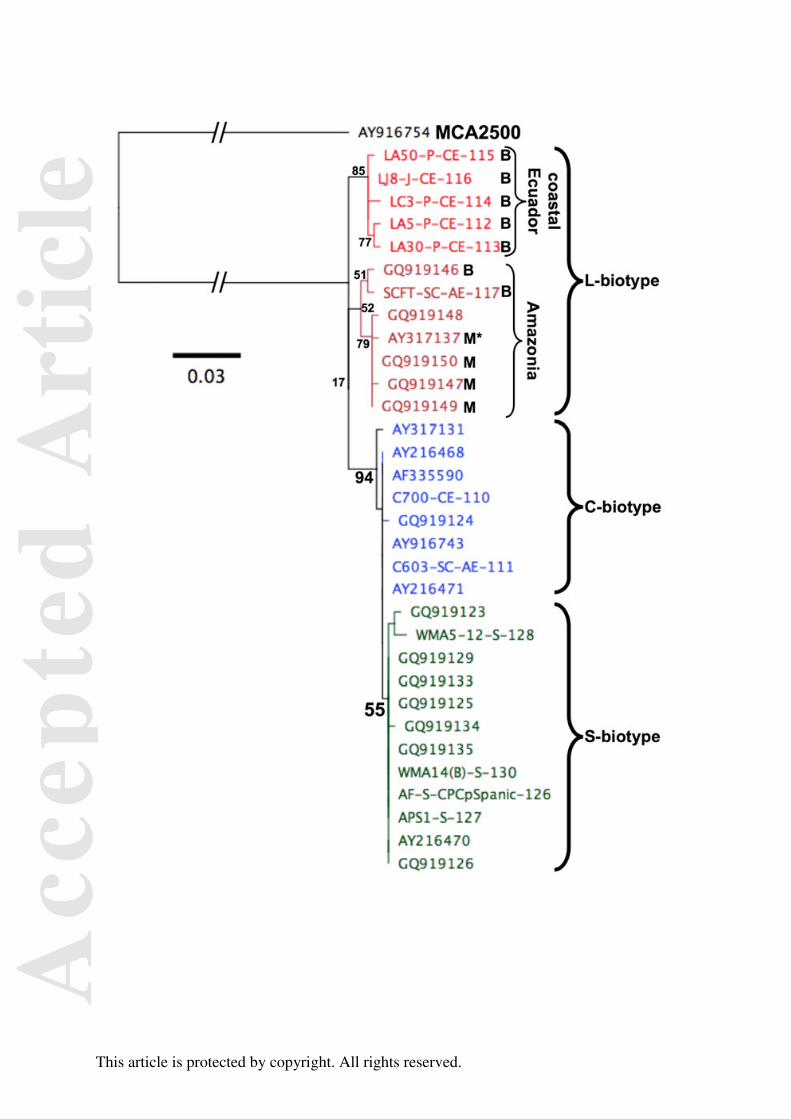
Phylogenetic analysis of the three biotypes: In order to better define the relationship between the
three genotypes, the ITS ‘DNA barcode’ region for all L-biotype and S-biotype and a subset of C-
biotype samples was sequenced. Phylogenetic reconstruction based on alignments of sequences
from the present study and several deposited in GenBank showed that the C-and S-biotype formed a
well-supported clade (Figure 2) with very few polymorphisms variation found within the ITS1/2
spacer regions. However, within this clade, S- and C-biotype isolates were separated but with only
poor statistical support. L-biotype isolates were clearly separated from C-/S-biotype samples, with
isolates from coastal Ecuador (112-116) forming a distinct well-supported clade, clearly separated
from the L-biotype sample from Amazonian Ecuador (117). Several unpublished sequences of the L-
biotype of M. perniciosa from Brazil are deposited on GenBank (Tarnowski & Ploetz, 2008). The host
liana is identified as either Bignoniaceae or Malphigiaceae and isolates obtained from these distinct
hosts clustered separately with good statistical support. Furthermore, the ‘Malphigiaceae’ L-biotype
clade also contained the sequence (AY317137) of the new species Crinipellis (=Moniliophthora)
brasiliensis that was reported by Arruda et al. (2005) forming brooms on Heteropterys acutifolia in
Eastern Brazil (Minas Gerais). For the purpose of the present study, these analyses confirm that L-
biotype is distinct from the C-/S- biotypes consistent with its outcrossing breeding strategy (Griffith

Acc
epte
d A
rtic
leA
ccep
ted
Art
icle
This article is protected by copyright. All rights reserved.
& Hedger, 1994a). However, further work is needed to determine whether there is host
specialization of the L-biotype on Bignoniaceae and Malphigiaceae and also whether the broom
formation reported for M. brasiliensis by Arruda et al. (2005) occurs on hosts in Bignoniaecae.
As all of the C-biotype isolates were obtained from infected tissues, it was necessary to
confirm their identity (Table 1, Table S1). The ITS1-5.8S-ITS2 region was amplified (circa 750 bp
fragment) and digested by either MspI or HinfI (Arruda et al., 2003). All putative M. perniciosa
isolates gave an identical PCR-RFLP pattern thus confirming their identity (Figure S1).
Analyses of microsatellite loci from isolates of the three biotypes: Analysis of the 14 microsatellite
loci in all 131 isolates revealed size polymorphism at all but one locus, and of these, unambiguous
allelic polymorphism was present at 11 loci. A total of 56 alleles were found, with a mean of 5.1
alleles per locus, ranging from the mMpCena19 locus with a total of 9 alleles, to MsCepec_15 with
only two alleles.
Most isolates were homozygous for nearly all the loci, but heterozygosity was detected for
eight loci (mMpCena3, mMpCena4, mMpCena8, mMpCena11, mMpCena19, mMpCena22,
MsCepec_16, and MsCepec_19) for a few isolates. Heterozygous isolates from all three biotypes
were observed for mMpCena3. For mMpCena11, heterozygosity was revealed for isolates from L-
and S-biotypes. For another four loci (mMpCena4, mMpCena19, MsCepec_16 and MsCepec_19),
heterozygous individuals were disclosed only from L-biotype. Isolate 113 (Pichilingue, Ecuador) of
the L-biotype was the only one exhibiting two alleles for loci mMpCena4, mMpCena19 and
MsCepec_19. For MsCepec_16, only the L-biotype isolate 114 (Pichilingue, Ecuador) was
heterozygous. C-biotype isolates from Acre (65 and 66 Mal. Thaumaturgo, 69 and 73 Assis Brasil),
Pará (27 Trairão) and Amazonas state (43 and 44 Costa da Conceição, 45 and 46 Ceplac/ERNEG)
were heterozygous for mMpCena8, whereas isolates from Pará state (1 Anapu, 7, 8 and 9
Medicilândia, 14 Uruará, 15 Alenquer, 17 Santarém, 19, 20 and 21 Cametá, 22 Baião, 23 and 24
Mocajuba) were heterozygous for mMpCena22 (Table 1, Table S1). For mMpCena3, heterozygous C-
biotype isolates were identified from Pará (26 Trairão), Amazonas (43 Costa da Conceição, 45
Ceplac/ERNEG), Rondonia (56, 57 and 58 Ouro Preto D’Oeste), and Acre (65 and 66 Mal.
Thaumaturgo, 70 Brasileia).
Isolates from the L-biotype displayed a total of 42 alleles, with an average of 3.81 alleles per
locus, with eight private alleles (Table S2). For the S-biotype isolates, 41 alleles were identified, with
an average of 3.72 alleles per locus and six private alleles. For all 111 C-biotype isolates, a total of 29
alleles were disclosed, with average 2.63 alleles per locus and with only three private alleles.
Acc
epte
d A
rtic
leA
ccep
ted
Art
icle
This article is protected by copyright. All rights reserved.
Identification of repeated multilocus genotypes within populations: The microsatellite analyses
indicated that some isolates from the same region of collection shared the same allelic composition
for the investigated loci. Therefore, Cervus 3.0 was used to verify and identify isolates with identical
multilocus genotypes (‘clonal’, with exact allelic match). Our results indicated that from the 131
isolates, only 83 corresponded to unique multilocus genotypes, with the remaining 48 shared
identical allele composition with one or more isolates (Table 1, Table S3).
Spatial genetic structure (SGS) and isolation by distance of C-biotype isolates: Excluding the seven
multilocus genotypes from Bahia (Table 1), where M. perniciosa was only recently introduced, and
one isolate without proper spatial position, the analysis of the remaining 56 unique multilocus
genotypes from the Amazon revealed a significant SGS for up to 137 km (Figure 3), tending to zero or
significantly negative values for longer distances, in a typical pattern of isolation by distance.
The SGS analysis allowed us to arbitrarily define seven geographic populations with the
isolates from the C-biotype of M. perniciosa (Figure 1): Central Pará (Transamazon road region), Pará
or Lower Amazon (surrounding the Amazon river mouth), East Amazon (around Manaus), West
Amazon (Upper Solimões at the Colombia-Peru border), Rondonia, Acre, and Bahia (Table 1). Among
these seven populations, Central Pará, East Amazon, Rondonia, and Bahia were the ones with the
largest number of repeated multilocus genotypes (>40%) (Table 1). From the 47 repeated multilocus
genotypes identified for the C-biotype, only in three cases identical genotypes were identified in
locations outside the original population (Table S3). Isolates from the East Amazon (44 Costa da
Conceição and 46 Ceplac-ERNEG, AM) displayed an identical multilocus match with isolate 27 from
Trairão, PA (Central Pará) and 73 from Assis Brasil (Acre). Isolate 64 from Marechal Thaumaturgo
(Acre) was identical to isolates from Central Pará (6 Medicilandia and 25 Trairão), whereas isolates
107 and 109 from Alenquer (Lower Amazon) were identical to isolate 92 from Tabatinga, AM (West
Amazon) (Table S3). For the S-biotype, only one pair of repeated multilocus genotypes was identified
(isolates 120 and 121, both from Manaus), and no repeated multilocus genotypes was detected
among the six L-biotype isolates (Table 1, Table S3).
Genetic diversity within and between biotypes and populations: The seven arbitrary C-biotype
populations of multilocus genotypes contained a distinct number of members, ranging from 10
(Acre) to 20 (Central Pará), while there were only six L-biotype isolates (Table 2). Isolates from the L-
and S-biotype displayed significantly higher expected heterozygosity ( eH ) compared to the C-
biotype isolates (0.69/0.56 vs. 0.29; Table 2). Within the C-biotype, the highest He was observed for
Pará population (0.39), followed by Bahia (0.32) and Acre (0.31). On the other hand, Acre held the
largest genotypic diversity ( gD = 0.96), followed by the West Amazon ( gD = 0.95), while Bahia
Acc
epte
d A
rtic
leA
ccep
ted
Art
icle
This article is protected by copyright. All rights reserved.
displayed the lowest gD (0.77). All C-biotype isolates exhibited a high and significant fixation index
(Table 2). Allele richness ( R ) was standardized for a sample size (n) of nine genotypes (Table 2)
when considering all genotypes (including identical multilocus genotypes). For the C-biotype, allele
richness (R) ranged from 2.14 (Bahia) to 1.71 (West Amazonas), whereas the S- and L-biotype
displayed higher values (3.56 and 3.82, respectively). When only the unique multilocus genotypes
were analyzed (n=6, Table 2), the genetic parameters showed a similar trend for most cases, except
that the highest He was observed for the Bahia population (0.45), followed by Pará (0.40) and
Rondonia (0.37).
Genetic assignment of genotypes to populations: We undertook a genetic assignment test to assign
or exclude the possible origin of individual multilocus genotypes to reference populations. When the
13 S-biotype genotypes were analyzed against all the remaining genotypes, nine were assigned at a
high score (>99%, Table 3) to isolate 117 of the L-biotype from San Carlos in Amazonian Ecuador,
whereas isolate 123 and 129 displayed a lower score (<92%) to the same genotype. Of the two other
S-biotype genotypes, the 124 displayed a high assignment score (>99%) to genotype 63 (Ji-Paraná,
RO), and 119 showed a lower score (50.1%) to genotype 91 (Aurelino Leal, BA), both from the C-
biotype (Table 3). As a group, the S-biotype isolates were assigned at a 100% probability to the L-
biotype isolate 117 from San Carlos, Ecuador.
When all 64 unique multilocus genotypes from the C-biotype were tested against those from
the L- and S-biotypes (Table S4), 57 were assigned at a high score (>98%) to L-biotype isolate 117
from San Carlos, while two (32 and 93) showed lower score (between 90.0 to 93.4%) to the same
genotype (Table S4). The remaining five genotypes were assigned to S-biotype isolate 131 from
Manaus (<97.0%). As a group (containing the seven populations), the C-biotype genotypes were
assigned to the L-biotype isolate 117 from San Carlos, Ecuador at a 100% score.
Conversely, when all six genotypes of the L-biotype from Ecuador were analyzed for
assignment against all the remaining genotypes from the S- and C-biotypes (Table 3), three were
assigned with a high score (> 99%) to the S-biotype isolate 131 (Manaus, AM, Brazil), together with
the isolate 116 (Janauche), but at a lower score (51.6%). The two other L-biotype genotypes (115
and 117) were assigned at a high score (>92%) to C-biotype genotypes (63 Ji-Paraná, RO or 91
Aurelino Leal, BA, respectively, Table 3). The group of L-biotype isolates matched, with 100% score,
the S-biotype isolate 131 from Manaus.

Acc
epte
d A
rtic
leA
ccep
ted
Art
icle
This article is protected by copyright. All rights reserved.
To determine the putative origin, genetic assignment analyses were then conducted for each
genotype from each arbitrary individual population of the C-biotype where M. perniciosa was
originally neither endemic nor its host T. cacao was endemic (East Amazon, Central Pará, Lower
Amazon, and Bahia). The 10 genotypes from East Amazon were assigned with a score below 96% to
genotypes from 92 Tabatinga, AM, 63 Ji-Paraná, RO, and 73 from Assis Brasil, AC (Table 3). As a
group, the East Amazon C-biotype isolates were assigned at 94.2% probability to isolate 73 from
Assis Brasil, Acre. The 12 genotypes from Central Pará were analyzed in the same way, and six were
assigned to genotype 73 from Assis Brasil, Acre, two to genotype 63 Ji-Paraná, Rondonia, and four to
genotype 45 Ceplac/ERNEG from East Amazon, which was assigned to genotype 73 Assis Brasil, Acre
(Table 3). The Central Pará population showed a high score (99.1%) to the genotype 45
Ceplac/ERNEG.
For the nine genotypes from the Lower Amazon population, three were assigned to
genotype 73 from Assis Brasil, Acre (score ranging from 90.7 to 97.7%), whereas four had a 100%
score with isolate 110 from Agua Blanca, Ecuador (Table 3). The two other genotypes were assigned
at 81.2 and 91.6% probability to isolate 63 from Ji-Paraná, RO and 45 Ceplac/ERNEG, AM,
respectively. As group, the Lower Amazon population shared a 100% certainty to derive from
genotype 63 from Ji-Paraná, Rondonia.
Among the seven genotypes from Bahia, four genotypes (74, 77, 84 and 91) were assigned to
an origin from Tabatinga, AM (92) with scores ranging from 53.4 to 100.0%, while another three (81,
87 and 90) were assigned to genotype 63 from Ji-Paraná, Rondonia, with scores ranging from 71.0 to
98.2%. As a group, the isolates from Bahia were assigned to genotype 92 from Tabatinga, AM at
100% probability.
The same analyses were conducted for the populations from Rondonia, Acre and West
Amazonas (Table S5). Of the seven genotypes from Rondonia, two exhibited high probability of
assignment (> 99%) to genotype 45 Ceplac/ERNEG, and one to 73 Assis Brasil, Acre. Of the eight
genotypes from Acre, four shared scores between 80.7 to 98.3% to genotype 73 Assis Brasil, three
shared scores between 92.6 to 97.8% to genotype 63 Ji-Paraná, RO, and one to genotype 45
Ceplac/ERNEG (score 76.1%). All the 11 multilocus genotypes from West Amazon (Upper Solimões)
at the border between Brazil, Colombia and Peru, displayed a high score (>99%) with an identical
multilocus genotype (isolate 109) from the same population (isolate 92 Tabatinga) (Table S5).

Acc
epte
d A
rtic
leA
ccep
ted
Art
icle
This article is protected by copyright. All rights reserved.
Discussion
The three recognized M. perniciosa biotypes exhibit contrasting life styles, ranging from the highly
pathogenic C-biotype on cacao, the occasionally pathogenic S-biotype, to the apparently endophytic
non-pathogenic L-biotype (Griffith & Hedger, 1994a). Our phylogenetic analyses found the
pathogenic broom-forming biotypes (C- and S-) to be closely related and exhibting little genetic
variability, consistent with their primary homothallic (homomictic) breeding strategy, whereas the L-
biotype (both Pacific and Amazonian populations) was distinct and more variable due to its
bifactorial outcrossing mechansism (Griffith & Hedger, 1994b). Biparental inbreeding might occur in
the S- and C-biotypes, possibly by selection for homothallism, linked to a more competitive dispersal
ability (i.e. meristem infection by a single spore could lead to later basidiocarp formation without
any mating event).
L-biotype isolates exhibited the greatest level of heterozygosity, possesing more alleles (A=
42), including eight private alleles, the largest allele richess (R), expected heterozygosity (He) and
genotypic diversity (Dg). Somatic compatibility and molecular analyses (Griffith & Hedger, 1994a;
Arruda et al., 2003) have previously suggested that the broom-forming C- and S-biotypes were more
similar to each other, while exhibiting a lower level of diversity, in comparison to the L-biotype.
Evidence from ITS nucleotide sequences (Arruda et al., 2005), karyotype and microsatellite telomeric
amplification analyses suggested that the S-biotype is more diverse than the C-biotype (Rincones et
al., 2006). Indeed, our results indicated a lower genetic diversity for the isolates from the C-biotype
in comparisonto to the S- or L-biotypes. It is recognized that a pathogen transition to an agricultural
host, even in the cases of sexually reproducing pathogen, imposes a founder effect with important
reduction in genetic variation (Stukenbrock & Bataillon, 2010). Such a genetic bottleneck could have
arisen in M. perniciosa by a switch from outcrossing to non-outcrossing breeding strategy, as
suggested by Griffith and Hedger (1994a).
The convergence of most S- and C-biotypes multilocus genotypes to the same L-biotype
isolate (117) could indicate a shared ancestry of both biotypes. Most of the C-biotype unique
multilocus genotypes (92%, 59 out of 64) were assigned to L-biotype isolate 117 from San Carlos,
Ecuador, while the remaining five isolates shared higher score against S-biotype isolate 131 from
Manaus, AM. These results suggested that both pathogenic bioypes (C- and S-) might have evolved
from a more ancestral non-pathogenic form, likely the L-biotype. S-biotype and C-biotype might
have evolved by disruptive selection by infection on distinct host species occurring in disturbed
forest areas, either as weedy invader (eg. Solanaceae species) or as a susceptible host with induced
meristematic flushing by the disturbed condition (Theobroma and Herrania).
Acc
epte
d A
rtic
leA
ccep
ted
Art
icle
This article is protected by copyright. All rights reserved.
The dispersal of M. perniciosa depends on the release of the haploid uninucleate
basidiospores, the only recognized infective structure of the C-biotype, following meiosis
from basidiocarps (Purdy & Schimdt, 1996). Basidiopores are highly sensitive to desiccation,
losing viability within hours, but long distance dispersal, most likely during the night, has
been reported to up to 50-70 Km in Ecuador (Wheeler & Soarez, 1993). Tropical rainfall
regimes do not typically limit infection cycles over the year, but infection tends to be
monocyclic within a year (Purdy & Schimdt, 1996), and continuous inoculum release may
favor spread over long distances upon the appropriate conditions. However, movement of
infected plant material under unwitting human intervention might predominate as a
mechanism for longer distance dispersal.
The dispersal ability of pathogens, especially fungi, defines the genetic differentiation among
populations and the potential gene flow between distant populations. Here, we detected a
significant spatial genetic structure (SGS) for isolates of the C-biotype in the Brazilian
Amazon, with significant co-ancestry detected for up to 137 km, suggesting the occurrence
of ‘isolation by distance’ (IBD) mode of dispersal. A large number of repeated multilocus
genotypes (47 in 111 isolates) were detected among C-biotype isolates from the same
region, especially in regions containing large commercial stands of cacao, such as Central
Pará, East Amazonas, Rondonia and Bahia. C-biotype isolates were mostly homozygous. As the
C-biotype mycelia is homomictic, dispersal can be achieved without the requirement for
mating prior to sexual reproduction, leading to the spread of geographically extensive
adapted lineages (Griffith & Hedger, 1994b), similar to ‘clones’ (Stukenbrock & Bataillon, 2010).
The C-biotype of M. perniciosa is endemic to the Upper Amazon valley, where it infects
cacao and related species (Purdy & Schmidt, 1996). The travel report of the naturalist Alexandre
Rodrigues Ferreira, who visited this region in 1785-1787 described cacao plants exhibiting what
appeared to be witches’ broom symptoms (‘lagarto’ [= lizard]; Silva, 1987), representing the earliest
report of the disease. Subsequently, the introduction of M. perniciosa into commercial cacao
plantations was documented since the first outbreak in 1895 in Suriname (Rorer, 1913). Within this
100-year period, modern cultivation of cacao had expanded in the Amazon and the pathogen might
have spread throughout the area, beyond its original natural distribution.
Acc
epte
d A
rtic
leA
ccep
ted
Art
icle
This article is protected by copyright. All rights reserved.
The Acre and West Amazon populations appeared to contain the greatest genetic
diversity within the C-biotype, and both might be part of the center of diversity of the fungus in
Brazil. Of these, the Acre population was the more diverse and was the only area where
heterozygosity (at two loci) was detected within the C-biotype populations. Such
heterozygosity could have arisen following multiple infections of meristems by genetically
different spores. The West Amazon population also presented an elevated genotypic
diversity, but the lowest allele richness, and together with the Acre population, both contained
the least repeated multilocus genotypes. Most of the multilocus genotypes from Acre tended to
be assigned to genotypes from Acre, or to a lesser extent, to Rondonia (isolate 63), corroborating
that Acre might be part of the origin of many multilocus genotypes from the Amazon.
The genetic assignment test indicated that the putative origin of isolates from the
East Amazon, Lower Amazon and Bahia populations was from the West Amazon. Some
genotypes from Rondonia also pointed to a West Amazon origin. The Acre and West
Amazon populations corresponded geographically to the regions that presumably encompass
the center of diversity of T. cacao (Sereno et al., 2006; Motamayor et al., 2008; Thomas et al., 2012),
therefore these two populations appeared to contain the largest genetic diversity of M. perniciosa,
and might be part of the center of genetic diversity and dispersal of the fungus.
The Rondonia population appeared to have an important role in the dispersal of isolates, as
individual multilocus genotypes from the East Amazon, Central Pará, Lower Amazon, and Bahia
traced back to isolate 63 from Ji-Paraná. But Rondonia showed no private alleles and a limited
number of heterozygous isolates for mMpCena3. According to GeneClass, the genotypes from
Rondonia derived from Acre (73 Assis Brasil) or West Amazon (92 Tabatinga). Rondonia became an
important cacao producing region since the 1970s, with large areas of cultivation, from where the
isolates were collected, which might have limited the genetic diversity of the pathogen.
The spread of the pathogen elsewhere occurred probably in association with cacao dispersal,
since the host species did not occur naturally outside the Upper Amazon region. The movement of
the pathogen might have followed the direction of river flow downstream from Acre, Rondonia and
West Amazon eastwards to the rest of the Amazon valley to regions where cacao is not native, and
where modern cultivation started around 300 years ago (Bartley, 2005). The Central Pará population
appeared to have derived exclusively from introductions of genotypes from Acre and Rondonia, but
not West Amazon, suggesting that the pathogen was either introduced directly from Rondonia and
Acre, or from the Santarém region, a traditional region of cacao cultivation, where the West Amazon

Acc
epte
d A
rtic
leA
ccep
ted
Art
icle
This article is protected by copyright. All rights reserved.
genotypes were not primarily detected. Introduction from the Lower Amazon was less likely as West
Amazon origins were also detected in that population.
The Bahia population exhibited the lowest genotypic diversity, but high allele richness,
suggesting multiple introductions. The multilocus genotypes from Bahia, a recent and well-
documented invasion of M. perniciosa (Andebrhan et al., 1999), displayed the clear migration from
two origins, with ancestry to genotype 63 from Ji-Paraná (Rondonia) and 92 from Tabatinga (West
Amazon). Cacao was introduced in Southern Bahia in the 18th century, and the region managed to be
free of M. perniciosa for over 200 years. In 1989, two independent foci of M. perniciosa occurrence
were reported at Uruçuca and Camacan municipalities, 120 km apart (Andebrhan et al., 1999). Our
results clearly indicated two major origins for the genotypes introduced in Southern Bahia. The
presence of two distinct lineages of M. perniciosa isolates in Bahia was originally demonstrated by
Andebrhan et al. (1999) and later confirmed by many other genetic analyses (Rincones et al., 2003;
Ploetz et al., 2005; Santana et al., 2012). Thus, it is possible that this invasion occurred based on
isolates from the Lower Amazon population (Pará), an area with an easier and more intense contact
with Southern Bahia.
The microsatellite analysis deployed in the present study has demonstrated only limited
genetic variability within C-biotype populations of M. perniciosa, consistent with non-outcrossing
(clonal) spread. The presence of genetically very similar strains in geographically distant areas is
consistent with known and suspected incidences of translocation of the pathogen by man. However,
the origins of the C-biotype remain uncertain but it may have evolved from an ancestral population
infecting solanaceous hosts. However, since these S-biotype populations are currently under-
sampled, additional collections from more diverse locations could shed light on the origins of this
destructive pathogen.
Acknowledgments
The authors wish to thank the “São Paulo Research Foundation” (FAPESP) for financial support
(03/11483-0, 07/07175-0) and CEPLAC for technical support. ASA, PSBA, GAL, AMS, and AF were
recipients of Brazilian National Research Council (CNPq) fellowships. Technical assistance by Edivaldo
Pimentel is greatly appreciated. GWG acknowledges funding from Cocoa Research UK Ltd.

Acc
epte
d A
rtic
leA
ccep
ted
Art
icle
This article is protected by copyright. All rights reserved.
References
Agapow PM, Burt A, 2001. Indices of multilocus linkage disequilibrium. Molecular Ecology Notes 1,
101-2.
Aime MC, Phillips-Mora W, 2005. The causal agent of withces’ broom and frosty pod rot of cocoa
(chocolate, Theobroma cacao) form a new lineage of Marasmiaceae. Mycologia 97, 1012-22.
Andebrhan T, Figueira A, Yamada MM, Furtek DB, 1999. Molecular fingerprinting suggests two
primary outbreaks of witches' broom disease (Crinipellis perniciosa) of Theobroma cacao in Bahia,
Brazil. European J Plant Pathology 105, 167-75.
Arruda MCC, Ferreira MASV, Miller RNG, Resende MLV, Felipe MSS, 2003. Nuclear and mitochondrial
rDNA variability in Crinipellis perniciosa from different geographic origins and hosts. Mycological
Research 107, 25–37.
Arruda MCC, Sepulveda GFC, Miller RNG, Ferreira MASV, Santiago DVR, Resende MLV, Dianese JC,
Felipe MSS, 2005. Crinipellis brasiliensis, a new species based on morphological and molecular
data. Mycologia 97, 1348-61.
Baker RED, Holliday P, 1957. Witches’ broom disease of cacao (Marasmius perniciosa Stahel).
Phytopathological papers no. 2. The Commonwealth Mycological Institute, Kew, 42 p.
Bartley BGD, 2005. The genetic diversity of cacao and its utilization. CABI Publishing, Oxforshire, UK.
Bastos CN, Evans HC, 1985. A new pathotype of Crinipellis perniciosa (witches’ broom disease) on
solanaceous hosts. Plant Pathology 34, 306–12.
Bowers JH, Bailey BA, Hebbar PK, Sanogo S, Lumsden RD, 2001. The impact of plant diseases on
world chocolate production. Plant Health doi: 10.1094/PHP-2001-0709-01-RV.
Cornuet JM, Piry S, Luikart G, Estoup A, Solignac M, 1999. New methods employing multilocus
genotypes to select or exclude populations as origins of individuals. Genetics 153, 1989-2000.
Efron B, 1983. Estimating the error rate of a prediction rule-improvement on cross-validation. J
American Statistical Association 78, 316-31.
El Mousadik A, Petit RJ, 1996. Chloroplast DNA phylogeography of the argan tree of Morocco.
Molecular Ecology 5, 547–55.

Acc
epte
d A
rtic
leA
ccep
ted
Art
icle
This article is protected by copyright. All rights reserved.
Giraud T, Refrégier G, Le Gac M, de Vienne DM, Hood ME, 2008. Speciation in fungi. Fungal Genetics
Biology 45, 791–802.
Godar J, Tizado EJ, Pokorny B, 2012. Who is responsible for deforestation in the Amazon? A spatially
explicit analysis along the Transamazon Highway in Brazil. Forest Ecology Management 267, 58–
73.
Goudet J, 1995. FSTAT version 1.2: a computer program to calculate F-statistics. J Heredity 86, 485–
6. http://www.unil.ch/popgen/softwares/fstat.htm.
Gramacho KP, Risterucci AM, Lanaud C, Lima LS, Lopes UV, 2007. Characterization of microsatellites
in the fungal plant pathogen Crinipellis perniciosa. Molecular Ecology Notes 7, 153-5.
Griffith GW, Hedger JN, 1994a. The breeding biology of biotypes of the witches’ broom pathogen of
cocoa, Crinipellis perniciosa. Heredity 72, 278-89.
Griffith GW, Hedger JN, 1994b. Spatial distribution of mycelia of the liana (L-) biotype of the agarica
Crinipellis perniciosa (Stahel) Singer in tropical forest. New Phytologist 127, 243-59.
Griffith GW, Hedger JN, 1994c. Dual culture of Crinipellis perniciosa and potato callus. European
Journal of Plant Pathology 100, 371-9.
Halkett F, Rivas CD, Platero GG, Zapater MF, Abadie C, Carlier J, 2010. Isolation by distance and
genetic discontinuities in recently established populations of the plant pathogenic fungus
Mycosphaerella fijiensis. Molecular Ecology 19, 3909-23.
Hardy O, Vekemans X, 2002. SPAGeDi 1.2: a versatile computer program to analyse spatial genetic
structure at the individual or population levels. Molecular Ecology Notes 2, 618-20.
http://www.ulb.ac.be/sciences/lagev/software.html.
Homewood B, 1991. Fungus threat to Brazil’s 300 million cocoa trees. New Scientist 1778 (July 1991),
16.
Kalinowski ST, Taper ML, Marshall TC, 2007. Revising how the computer program CERVUS
accommodates genotyping error increases success in paternity assignment. Molecular Ecology
16, 1099-106.
Loiselle BA, Sork VL, Nason J, Graham C, 1995. Spatial genetic structure of a tropical understory
shrub, Psychotria officinalis (Rubiaceae). Amercan J Botany 82,1420-5.
Acc
epte
d A
rtic
leA
ccep
ted
Art
icle
This article is protected by copyright. All rights reserved.
Motamayor JC, Lachenaud P, Mota JWS, Loor R, Kuhn DN, Brown JS, Schnell RJ, 2008. Geographic
and genetic population differentiation of the Amazonian chocolate tree (Theobroma cacao L).
Plos One 3, e3311.
Piry S, Alapetite A, Cornuet JM, Paetkau D, Baudouin L, Estoup A, 2004. GENECLASS 2: a software for
genetic assignment and first-generation migrant detection. J Heredity 95, 536-9.
Ploetz RC, Schnell RJ, Ying Z, Zheng Q, Olano CT, Motamayor JC, Johnson ES, 2005. Analysis of
molecular diversity in Crinipellis perniciosa with AFLP markers. European J Plant Pathology 111,
317-32.
Purdy LH, Schmidt RA, 1996. Status of cacao witches broom: biology, epidemiology, and
management. Annual Review Phytopathology 34, 573-94.
Rincones J, Meinhardt LW, Vidal BC, Pereira GAG, 2003. Electrophoretic karyotype analysis of
Crinipellis perniciosa, the causal agent of witches’ broom disease of Theobroma cacao.
Mycological Research 107, 452-8.
Rincones J, Mazotti GD, Griffith GW, Pomela A, Figueira A, Leal Jr. GA, Queiroz MV, Pereira JF,
Azevedo RA, Pereira GA, Meinhardt LW, 2006. Genetic variability and chromosome-length
polymorphisms of the witches’ broom pathogen Crinipellis perniciosa from various hosts in South
America. Mycological Research 110, 821-32.
Rorer JB, 1913. The Surinam witch-broom disease of cacao. Board of Agriculture. Trinidad & Tobago.
Circular no. 10 (July1913) 13 pp.
Santana MF, Araújo EF, Souza JT, Mizubuti ESG, Queiroz MV, 2012. Development of molecular
markers based on retrotransposons for the analysis of genetic variability in Moniliophthora
perniciosa. European J Plant Pathology 134, 497-507.
Sereno ML, Vencovsky R, Albuquerque PSB, Figueira A, 2006. Genetic diversity and natural
population structure of cacao (Theobroma cacao L.) from the Brazilian Amazon evaluated by
microsatellite markers. Conservation Genetics 7, 13-24.
Silva P, 1987, Cacau e lagartão e vassoura-de-bruxa: registros feitos por Alexandre Rodrigues
Ferreira em 1785 e 1787 na Amazonia. Boletim técnico CEPEC (Itabuna, Brazil) 146, 21 p.
Silva JRQ, Figueira A, Pereira GAG, Albuquerque PSB, 2008. Development of novel microsatellites
from Moniliophthora perniciosa, causal agent of the witches’ broom disease of Theobroma cacao.
Molecular Ecology Resources 8, 783-5.

Acc
epte
d A
rtic
leA
ccep
ted
Art
icle
This article is protected by copyright. All rights reserved.
Stukenbrock EH, Bataillon T, 2010. A population genomics perspective on the emergence and
adaptation of new plant pathogens in agro-ecosystems. PLoS Pathogen 8(9), e1002893.
doi:10.1371/journal.ppat.1002893.
Tarnowski TL, Ploetz RC, 2008. A multilocus phylogeny of the biotypes of Moniliophthora perniciosa,
cause of witches’ broom on cacao. Phytopathology 98:S155.
Thomas E, van Zonneveld M, Loo J, Hodgkin T, Galluzzzi G, van Etten J, 2012. Present spatial diversity
patterns of Theobroma cacao L. in the Neotropics reflect genetic differentiation in Pleistocene
refugia followed by human-influenced dispersal. Plos One 7, e47676.
Wheeler BJE, Soarez C, 1993. Disease gradients of Crinipellis perniciosa on cocoa seedlings. In:
Rudgard SA, Maddison AC, Andebrhan T, eds. Disease Management in Cocoa:
Comparative epidemiology of witches’ broom. London, UK: Chapman & Hall, 157–64.
White TJ, Bruns T, Lee S, Taylor J, 1990. Amplification and direct sequencing of fungal ribosomal RNA
genes for phylogenetics. In: Innis MA, Gelfand DH, Sninsky JJ, White TJ, eds. PCR Protocols: a
guide to methods and applications. New York, USA: Academic Press, 315-22.
Figure Legends
Figure 1. Approximate location of collection of the Moniliophthora perniciosa isolates from the C-, S-
and L-biotypes.
Figure 2. Maximum likelihood tree of 33 M. perniciosa sequences (704 bp alignment), rooted with an
unknown Moniliophthora species (MCA2500). Bootstrap values (% from 1000 replicates) are
shown at salient nodes. Scalebar indicates substitutions per site. B indicates host Bignoniaceae
and M indicates host in Malphigiaceae. M* was named Moniliophthora brasiliensis by Arruda et
al. (2005).
Figure 3. Correlogram of pairwise co-ancestry coefficient ( xyθ ) among the unique 56 C-biotype
multilocus genotypes. Co-ancestry coefficient ( xyθ ) was estimated as Loiselle et al. (1995) for the
56 C-biotype multilocus genotypes (one was excluded due to the lack of the spatial position) for
each distance class within populations exclusively from the Amazon region, estimated using
SPAGeDi 1. The solid line represents the average xyθ value, whereas the dashed lines represent
Acc
epte
d A
rtic
leA
ccep
ted
Art
icle
This article is protected by copyright. All rights reserved.
the 95% (two-tailed) confidence interval of the average xyθ distribution calculated by 1,000
permutations of individuals among of spatial distance.
Supporting Information
Figure S1
Analysis of identity of Monilihtora perniciosa isolates by rDNA-ITS region. A and B. Amplification of
the rDNA ITS1-5.8S-ITS2 region of 61 C-biotype isolates of M. perniciosa. C and D. Digestion of the
amplified rDNA ITS1-5.8S-ITS2 region with MspI. E and F. Digestion of the amplified rDNA ITS1-5.8S-
ITS2 region with HinfI.
Table S1
Description of isolates Moniliophthora perniciosa C-, S- and L- biotypes analyzed. Information about
the code adopted (ID), previous identification, host and biotype, locale of isolate collection with
state and country and year of collection; followed by geographical coordination of the site.
Table S2
Private alleles identified from microsatellite loci for isolates (coded as Table S1).
Table S3
Multilocus genotype with the respective identical individual and original location of collection.
Table S4
Assignment test of the 64 unique multilocus genotypes from the C-biotype. Results from individual
test or as a group, in comparison with the S- and L- biotypes.
Table S5
Results of the assignment test of each of the seven unique multilocus genotypes from the C-biotype
of Rondonia population; eight from Acre; and 11 from West Amazon in comparison with the other
biotypes.
Acc
epte
d A
rtic
le
This article is protected by copyright. All rights reserved.
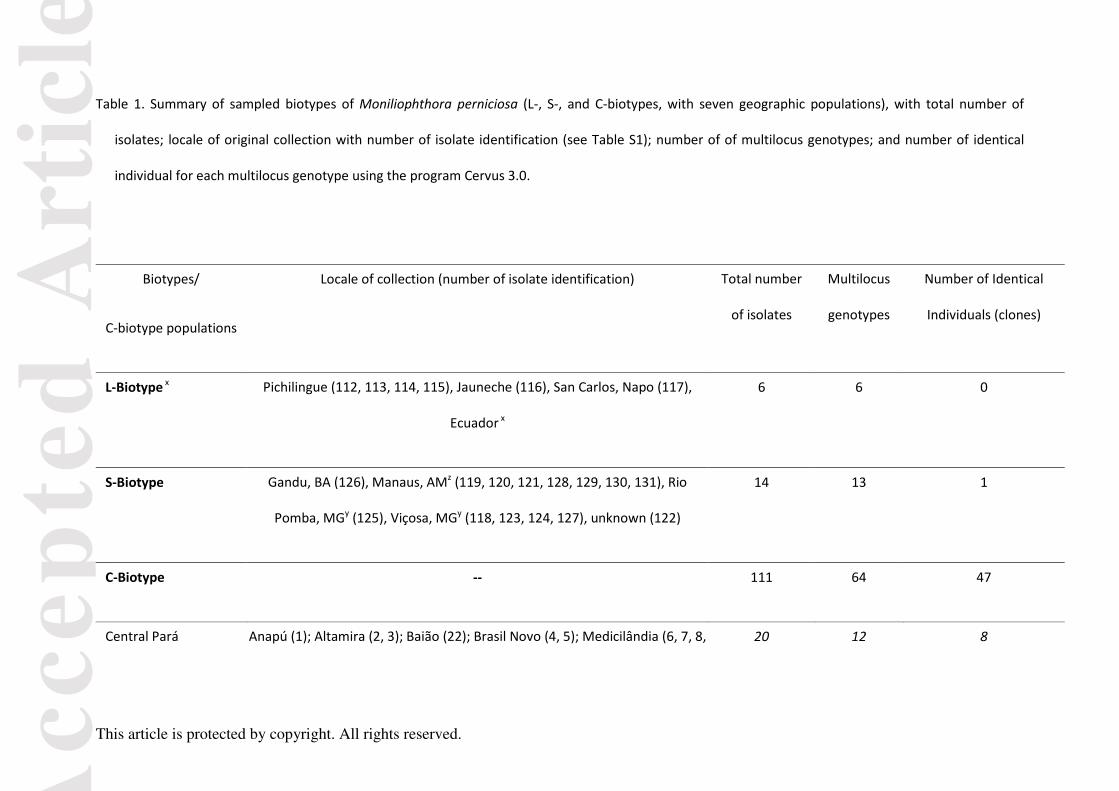
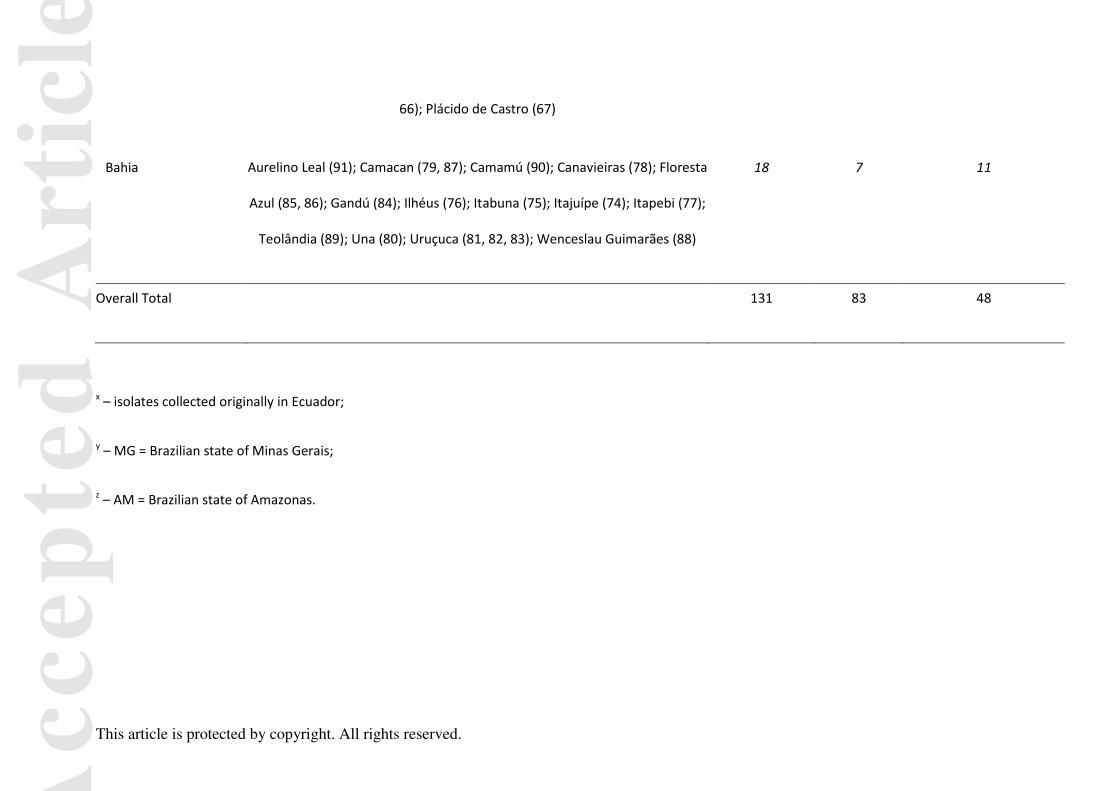
Table 1. Summary of sampled biotypes of Moniliophthora perniciosa (L-, S-, and C-biotypes, with seven geographic populations), with total number of
isolates; locale of original collection with number of isolate identification (see Table S1); number of of multilocus genotypes; and number of identical
individual for each multilocus genotype using the program Cervus 3.0.
Biotypes/
C-biotype populations
Locale of collection (number of isolate identification) Total number
of isolates
Multilocus
genotypes
Number of Identical
Individuals (clones)
L-Biotype x Pichilingue (112, 113, 114, 115), Jauneche (116), San Carlos, Napo (117),
Ecuador x
6 6 0
S-Biotype Gandu, BA (126), Manaus, AMz (119, 120, 121, 128, 129, 130, 131), Rio
Pomba, MGy (125), Viçosa, MGy (118, 123, 124, 127), unknown (122)
14 13 1
C-Biotype -- 111 64 47
Central Pará Anapú (1); Altamira (2, 3); Baião (22); Brasil Novo (4, 5); Medicilândia (6, 7, 8, 20 12 8

Acc
epte
d A
rtic
le
This article is protected by copyright. All rights reserved.
(Transamazon region) 9, 10, 11); Mocajuba (23, 24); Trairão (25, 26, 27); Uruará (12, 13, 14)
Pará (Lower Amazon) Alenquer (15, 16, 107, 108, 109); Cametá (19, 20, 21); Óbidos (106);
Santarém (17, 18)
11 9 2
East Amazonas Augusto Montenegro (33, 34, 35, 36, 37, 38, 39); Boa Vista (32);
Ceplac/ERNEG (45, 46); Costa da Conceição (43, 44); Manaus (28, 29,30, 31);
Uricurituba (40, 41, 42)
19 10 9
West Amazonas
(Upper Solimões)
Atalaia do Norte (105); Benjamim Constant (104); São Paulo de Olivença
(102, 103); Tabatinga (92, 93, 94, 95, 96, 97, 98, 99, 100, 101); Agua Blanca,
Ecuador x (110); San Carlos, Ecuador x (111)
16 11 5
Rondonia Ariquemes (47, 48, 49, 50, 51); Cacaulândia (52, 53, 54); Cacoal (61); Jaru
(55); Ji-Paraná (60, 62, 63); Ouro Preto D’Oeste (56, 57, 58, 59)
17 7 10
Acre Assis Brasil (68, 69, 72, 73); Brasiléia (70, 71); Marechal Thaumaturgo (64, 65, 10 8 2
Acc
epte
d A
rtic
le
This article is protected by copyright. All rights reserved.
66); Plácido de Castro (67)
Bahia Aurelino Leal (91); Camacan (79, 87); Camamú (90); Canavieiras (78); Floresta
Azul (85, 86); Gandú (84); Ilhéus (76); Itabuna (75); Itajuípe (74); Itapebi (77);
Teolândia (89); Una (80); Uruçuca (81, 82, 83); Wenceslau Guimarães (88)
18 7 11
Overall Total 131 83 48
x – isolates collected originally in Ecuador;
y – MG = Brazilian state of Minas Gerais;
z – AM = Brazilian state of Amazonas.

Acc
epte
d A
rtic
le
This article is protected by copyright. All rights reserved.
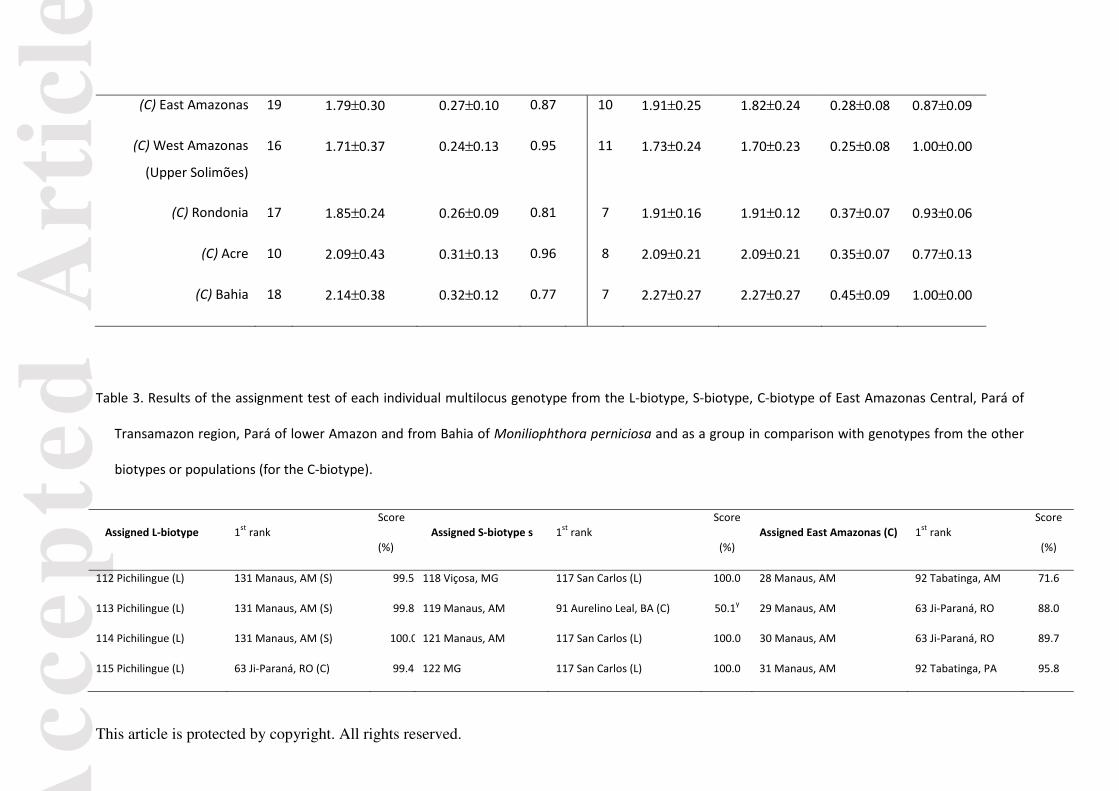
Table 2. Information about sample size ( n ), with results of allele richess (R); expected heterozigosity (eH );genotypic diversity ( gD ), effective number of
alleles (A), and fixation index (F) for the L-, S- and C-biotypes (all genotypes) and the seven geographic populations of isolates from the C-biotype of
Moniliophthora perniciosa, as well as for unique multilocus genotype. The parameter R was estimated for nine or six individuals, when all or unique
multilocus genotypes, respectively, were used in the analyses. SE is the standard error. * P< 0.05.
All genotypes Only unique multilocus genotypes
Population n R±SEeH ±SE
gD n A±SE R±SEeH ±SE F±SE
L-Biotype 6 3.82±0.05 0.69±0.06 1.00 6 3.82±0.50 3.82±0.50 0.66±0.04 0.74±0.12
S-Biotype 14 3.56±0.90 0.56±0.15 0.99 13 3.73±0.59 3.43±0.48 0.57±0.09 0.73±0.17
C-Biotype 111 1.90±0.12 0.29±0.04 - 64 2.73±0.24 2.37±0.16 0.43±0.06 0.92±0.05
(C) Central Pará
(Transamazon region)
20 1.80±0.26 0.26±0.09 0.94 12 1.91±0.21 1.81±0.18 0.27±0.07 0.86±0.08
(C) Pará (Lower
Amazon)
11 1.91±0.41 0.39±0.15 0.93 9 1.91±0.21 1.91±0.21 0.40±0.08 0.92±0.08
Acc
epte
d A
rtic
le
This article is protected by copyright. All rights reserved.
(C) East Amazonas 19 1.79±0.30 0.27±0.10 0.87 10 1.91±0.25 1.82±0.24 0.28±0.08 0.87±0.09
(C) West Amazonas
(Upper Solimões)
16 1.71±0.37 0.24±0.13 0.95 11 1.73±0.24 1.70±0.23 0.25±0.08 1.00±0.00
(C) Rondonia 17 1.85±0.24 0.26±0.09 0.81 7 1.91±0.16 1.91±0.12 0.37±0.07 0.93±0.06
(C) Acre 10 2.09±0.43 0.31±0.13 0.96 8 2.09±0.21 2.09±0.21 0.35±0.07 0.77±0.13
(C) Bahia 18 2.14±0.38 0.32±0.12 0.77 7 2.27±0.27 2.27±0.27 0.45±0.09 1.00±0.00
Table 3. Results of the assignment test of each individual multilocus genotype from the L-biotype, S-biotype, C-biotype of East Amazonas Central, Pará of
Transamazon region, Pará of lower Amazon and from Bahia of Moniliophthora perniciosa and as a group in comparison with genotypes from the other
biotypes or populations (for the C-biotype).
Assigned L-biotype 1st rank Score
(%) Assigned S-biotype s 1st rank
Score
(%) Assigned East Amazonas (C) 1st rank
Score
(%)
112 Pichilingue (L) 131 Manaus, AM (S) 99.5 118 Viçosa, MG 117 San Carlos (L) 100.0 28 Manaus, AM 92 Tabatinga, AM 71.6
113 Pichilingue (L) 131 Manaus, AM (S) 99.8 119 Manaus, AM 91 Aurelino Leal, BA (C) 50.1y 29 Manaus, AM 63 Ji-Paraná, RO 88.0
114 Pichilingue (L) 131 Manaus, AM (S) 100.0 121 Manaus, AM 117 San Carlos (L) 100.0 30 Manaus, AM 63 Ji-Paraná, RO 89.7
115 Pichilingue (L) 63 Ji-Paraná, RO (C) 99.4 122 MG 117 San Carlos (L) 100.0 31 Manaus, AM 92 Tabatinga, PA 95.8

Acc
epte
d A
rtic
le
This article is protected by copyright. All rights reserved.
116 Jauneche (L) 131 Manaus, AM (S) 51.6z 123 Viçosa, MG 117 San Carlos (L) 51.2w 32 Boa Vista, AM 73 Assis Brasil, AC 65.8x
117 San Carlos (L) 91 Aurelino Leal, BA (C) 92.7 124 Viçosa, MG 63 Ji-Paraná, RO (C) 99.9 33 A. Montenegro, AM 73 Assis Brasil, AC 81.0
L-Biotype isolates 131 Manaus, AM (S) 100.0 125 Rio Pomba, BA 117 San Carlos (L) 100.0 39 A. Montenegro, AM 63 Ji-Paraná, RO 45.3u
126 Gandu, BA 117 San Carlos (L) 100.0 43 Costa da Conceição, AM 73 Assis Brasil, AC 48.2c
127 Viçosa, MG 117 San Carlos (L) 100.0 44 Costa da Conceição, AM 73 Assis Brasil, AC 93.4
128 Manaus, AM 117 San Carlos (L) 99.7 45 Ceplac/ERNEG, AM 73 Assis Brasil, AC 89.5
129 Manaus, AM 117 San Carlos (L) 91.1 East Amazonas isolates 73 Assis Brasil, AC 94.2
130 Manaus, AM 117 San Carlos (L) 100.0
131 Manaus, AM 117 San Carlos (L) 100.0
S-Biotype isolates 117 San Carlos (L) 100.0
Assigned Central Pará (C)
1st rank Score
(%)
Assigned Lower Amazon (C)
1st rank Score
(%) Assigned Bahia (C) 1st rank
Score
(%)
1 Anapu, PA 73 Assis Brasil, AC 81.0 15 Alenquer, PA 73 Assis Brasil, AC 90.7 74 Itajuípe 92 Tabatinga, AM 99.2
2 Altamira, PA 73 Assis Brasil, AC 94.6 16 Alenquer, PA 73 Assis Brasil, AC 95.6 77 Itapebi 92 Tabatinga, AM 53.4p
3 Altamira, PA 63 Ji-Paraná, RO 93.7 17 Santarém, PA 63 Ji-Paraná, RO 81.2 81 Uruçuca 63 Ji-Paraná, RO 99.2
4 Brasil Novo, PA 73 Assis Brasil, AC 50.9 v 18 Santarém, PA 45 CEPLAC Erneg, AM 91.6 84 Gandu 92 Tabatinga, AM 86.0
6 Medicilândia, PA 73 Assis Brasil, AC 69.6t 19 Cametá, PA 73 Assis Brasil, AC 97.7 87 Camacan 63 Ji-Paraná, RO 78.5
7 Medicilândia, PA 45 Ceplac/ERNEG, AM 84.2 106 Óbidos, PA 110 A. Blanca, Manabi, EC 100.0 90 Camacan 63 Ji-Paraná, RO 71.0
10 Medicilândia, PA 45 Ceplac/ERNEG, AM 57.6s 107 Alenquer, PA 110 A. Blanca, Manabi, EC 100.0 91 Aurelino Leal 92 Tabatinga, AM 100.0

Acc
epte
d A
rtic
le
This article is protected by copyright. All rights reserved.
11 Medicilândia, PA 63 Ji-Paraná, RO 73.9 108 Alenquer, PA 110 A. Blanca, Manabi, EC 100.0 Bahia group 92 Tabatinga, AM 100.0
12 Uruará, PA 45 Ceplac/ERNEG, AM 64.9r 109 Duca Alenquer, PA 110 A. Blanca, Manabi, EC 100.0
14 Uruará, PA 73 Assis Brasil, AC 50.8q Lower Amazon group 63 Ji-Paraná, RO 100.0
26 Trairão, PA 73 Assis Brasil, AC 84.5
27 Trairão, PA 45 Ceplac/ERNEG, AM 97.9
Central Pará group 45 Ceplac/ERNEG, AM 99.1
z2nd score = 43.1% for 63 Ji-Paraná, RO (C);
y2nd score = 49.1% for 117 San Carlos (L);
w2nd score = 40.1% for 73 Assis Brasil, AC;
x2nd score = 43.4% for 73 Assis Brasil, AC;
u2nd score = 31.8% for 73 Assis Brasil, AC;
v2nd score = 41.1% for 45 Ceplac/ERNEG, AM;
t2nd score = 22.9% for 63 Ji-Paraná, RO;
s2nd score = 21.7% for 92 Tabatinga, AM;
r2nd score = 20.0% for 92 Tabatinga, AM;
q2nd score = 31.4% for 45 Ceplac/ERNEG, AM;
p2nd score = 45.9% for 73 Assis Brasil, AC.

Acc
epte
d A
rtic
leA
ccep
ted
Art
icle
This article is protected by copyright. All rights reserved.
Acc
epte
d A
rtic
leA
ccep
ted
Art
icle
This article is protected by copyright. All rights reserved.

Acc
epte
d A
rtic
leA
ccep
ted
Art
icle
This article is protected by copyright. All rights reserved.