aberrations and retinal image quality of the normal human...
TRANSCRIPT
J. Liang and D. R. Williams Vol. 14, No. 11 /November 1997 /J. Opt. Soc. Am. A 2873
Aberrations and retinal image qualityof the normal human eye
Junzhong Liang and David R. Williams
Center for Visual Science, University of Rochester, Rochester, New York 14627
Received January 7, 1997; revised manuscript received May 12, 1997; accepted May 20, 1997
We have constructed a wave-front sensor to measure the irregular as well as the classical aberrations of theeye, providing a more complete description of the eye’s aberrations than has previously been possible. Weshow that the wave-front sensor provides repeatable and accurate measurements of the eye’s wave aberration.The modulation transfer function of the eye computed from the wave-front sensor is in fair, though not com-plete, agreement with that obtained under similar conditions on the same observers by use of the double-passand the interferometric techniques. Irregular aberrations, i.e., those beyond defocus, astigmatism, coma, andspherical aberration, do not have a large effect on retinal image quality in normal eyes when the pupil is small(3 mm). However, they play a substantial role when the pupil is large (7.3-mm), reducing visual performanceand the resolution of images of the living retina. Although the pattern of aberrations varies from subject tosubject, aberrations, including irregular ones, are correlated in left and right eyes of the same subject, indi-cating that they are not random defects. © 1997 Optical Society of America [S0740-3232(97)00811-9]
1. INTRODUCTIONThe most important optical instrument is the human eye,yet its optical performance has not been completely char-acterized. In addition to exhibiting some defocus andastigmatism, normal eyes are known to suffer fromspherical aberration1,2 and comalike aberrations.3,4 Onthe basis of subjective observations of the retinal image ofpoint sources, Helmholtz emphasized the existence of ad-ditional ocular aberrations that are not found in conven-tional, man-made optical systems.5 In concordance withHelmholtz’s view, measurements of the eye’s waveaberration6–8 suggest that the eye has irregular aberra-tions that correspond to more abrupt, local variations inphase error. However, we have no quantitative informa-tion about these aberrations or their importance for visionand imaging the retina.
Liang et al.9 recently demonstrated a new technique tomeasure the eye’s wave aberration, based on theHartmann–Shack principle.10 To provide a more com-plete description of all the aberrations of the eye, we haveimproved the wave-front sensor by increasing the densityof samples taken of the wave-front slope in the pupil.Moreover, we use a description of each eye’s wave aberra-tion that includes up to tenth-order aberrations, corre-sponding to 65 aberrations, or Zernike modes. In thefirst part of this paper we examine the repeatability andaccuracy of aberration measurements obtained with thenew wave-front sensor. We then compare the modula-tion transfer function of the eye with a 3-mm pupil com-puted from the wave aberration with that obtained undersimilar conditions on the same observers with the double-pass and interferometric techniques. We find that thewave aberration measured with the wave-front sensor ac-counts for most of the loss in modulation transfer mea-sured with the other techniques. We also find that aber-rations greater than fourth order do not seriously degradeimage quality in normal eyes when the pupil is small.
0740-3232/97/112873-11$10.00 ©
However, such higher-order aberrations have a signifi-cant effect on retinal image quality for the dilated pupiland can influence visual performance as well as the reso-lution of images of the retina.
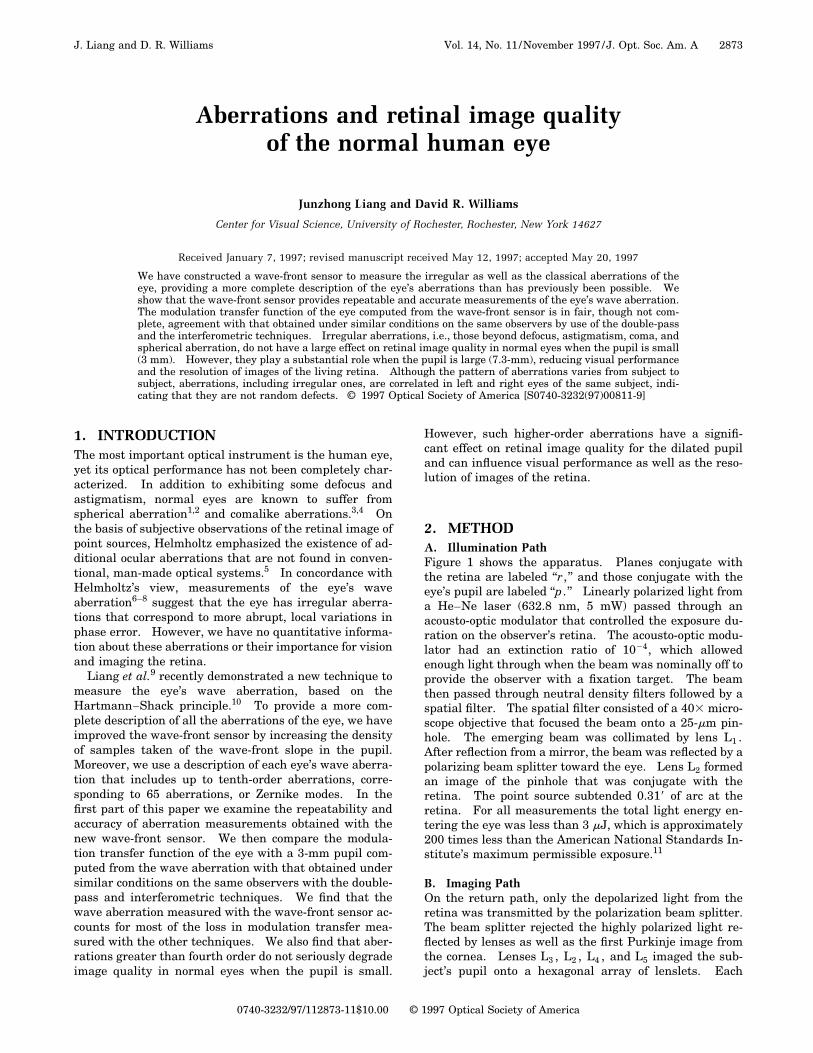
2. METHODA. Illumination PathFigure 1 shows the apparatus. Planes conjugate withthe retina are labeled ‘‘r, ’’ and those conjugate with theeye’s pupil are labeled ‘‘p. ’’ Linearly polarized light froma He–Ne laser (632.8 nm, 5 mW) passed through anacousto-optic modulator that controlled the exposure du-ration on the observer’s retina. The acousto-optic modu-lator had an extinction ratio of 1024, which allowedenough light through when the beam was nominally off toprovide the observer with a fixation target. The beamthen passed through neutral density filters followed by aspatial filter. The spatial filter consisted of a 403 micro-scope objective that focused the beam onto a 25-mm pin-hole. The emerging beam was collimated by lens L1 .After reflection from a mirror, the beam was reflected by apolarizing beam splitter toward the eye. Lens L2 formedan image of the pinhole that was conjugate with theretina. The point source subtended 0.318 of arc at theretina. For all measurements the total light energy en-tering the eye was less than 3 mJ, which is approximately200 times less than the American National Standards In-stitute’s maximum permissible exposure.11
B. Imaging PathOn the return path, only the depolarized light from theretina was transmitted by the polarization beam splitter.The beam splitter rejected the highly polarized light re-flected by lenses as well as the first Purkinje image fromthe cornea. Lenses L3 , L2 , L4 , and L5 imaged the sub-ject’s pupil onto a hexagonal array of lenslets. Each
1997 Optical Society of America
2874 J. Opt. Soc. Am. A/Vol. 14, No. 11 /November 1997 J. Liang and D. R. Williams
lenslet had an aperture of 0.5 mm and a focal length of 97mm. The wave aberration was measured across either a3.4-mm pupil or a 7.3-mm pupil. For the 3.4-mm pupilmeasurements, the pupil was magnified 2.5 times, so thatthe pupil was sampled with a center-to-center spacing of0.2 mm. For the 7.3-mm pupil measurements, lens L5was changed so that the pupil was magnified 1.17 times,and the center-to-center spacing in the pupil was 0.43mm. Each lenslet forms an aerial image of the retinalpoint source on a cooled, scientific-grade CCD camera.The wave-front sensor measures an aberrated wave frontemerging from the eye in reference to a perfect planewave at the eye’s entrance pupil. This is equivalent tomeasuring the wave-front error of the eye at the exit pu-pil in reference to a perfect reference sphere.9
C. Measurements with Small PupilsTwo sets of measurements of the wave aberration weremade with 3.4-mm pupils. The first set was made on the
Fig. 1. Hartmann–Shack wave-front sensor for the eye. Lightfrom a He–Ne laser produces a compact point source on theretina. If the eye has aberrations, the wave front of the lightreturning from the retina forms a distorted wave front at the pu-pil plane. This wave front is recreated by lenses L3 , L2 , L4 andL5 at the plane of lenslet array. The two-dimensional lenslet ar-ray samples this warped wave front and forms an array of fo-cused spots on a CCD array. Each of the spots from the lensletsis displaced on the CCD array in proportion to the slope of thewave front; the wave aberration itself can be calculated from thisdisplacement.
eyes of three subjects whose modulation transfer func-tions (MTF’s) were measured before with the double-passand interferometric techniques.12 The second set wasmade on nine other eyes with a slightly different proce-dure.
For comparison with double-pass and interferometricMTF’s, measurements were made on the right eyes ofRNB, DRW, and DHB, whose ages were 36, 40, and 34,respectively. These observers were mildly myopic [0.2,1.6, and 0.4 diopters (D), respectively]. In addition, DRWhad 0.8 D of astigmatism. In measuring these three eyeswe used the same alignment procedure as in the earlierstudy.12 Accommodation was paralyzed with two dropsof cyclopentolate hydrochloride (1%). During the align-ment procedure before the measurements, the observeradjusted the horizontal and vertical positions of his eye tooptimize the image quality of an 18-c/deg horizontalsquare-wave grating. We chose this criterion for align-ment because the goal of the earlier study was to measurethe best image quality possible in the human eye. A mir-ror temporarily placed between the spatial filter pinholeand lens L1 allowed the observer to view the grating,which was sandwiched against a diffuser and was backlitwith 630-nm light. The grating lay at the same opticaldistance as the pinhole from the eye. Lens L3 was at-tached to the bite-bar mount so that the observer could fo-cus the grating by translating his eye together with thelens along the optical axis. Corrective lenses were notworn during the experiment. The entrance pupil for thebeam was 3 mm and was determined by an artificial pupilin the back focal plane of L2 . The observer’s head wasstabilized with a bite bar.
For each observer, 20 images were obtained, each cor-responding to an exposure of 2 s on the retina. The use ofthis long exposure reduced the speckle in the images, be-cause eye movements cause slightly different retinal re-gions to be illuminated by the point source over time,which alters the speckle pattern. This has the effect ofimproving signal-to-noise ratio. Nonetheless, we foundsimilar results with the shortest exposures that we tried,which were 100 ms. All images were obtained in a singleexperimental session.
The measurements made for 3.4-mm pupils on nineother observers used a similar procedure, except for thefollowing. Each eye was aligned, not for optimum imagequality as before, but with respect to the center of thenatural pupil. For these measurements no drug wasused to dilate the pupil. At the beginning of the mea-surement on each eye, the subject adjusted his horizontalposition until the left side of the pupil occluded his view ofthe point source he was fixating. He repeated this taskusing the right side, the top, and the lower margin of thepupil. The average of two settings in each of these fourlocations was taken as the center of the entrance pupil.This served as the origin of the coordinate system inwhich the wave aberration was defined. The standarddeviation for the center of the entrance pupil with thisalignment technique was less than 0.1 mm. We reducedthe eye’s defocus by asking the observer to translate hiseye together with the lens (L3) along the optical axis tooptimize image quality of the point source. The diameterof the laser beam at the entrance pupil was 1.5 mm in-
J. Liang and D. R. Williams Vol. 14, No. 11 /November 1997 /J. Opt. Soc. Am. A 2875
stead of 3 mm. Subject age ranged from 21 to 38. Allhad normal visual acuity and required a correction for de-focus and astigmatism of less than 3 D.
D. Measurements with Large PupilsUsing the same procedures used on the nine observers de-scribed above, we made measurements on 14 eyes (nineobservers) for a 7.3-mm pupil. The pupil was dilatedwith tropicamide (1%). The exposure duration was 1 s.Three images, taken within 60 s, were averaged. Subjectage ranged from 21 to 38. All had normal visual acuityand had less than 3 D of defocus and astigmatism.
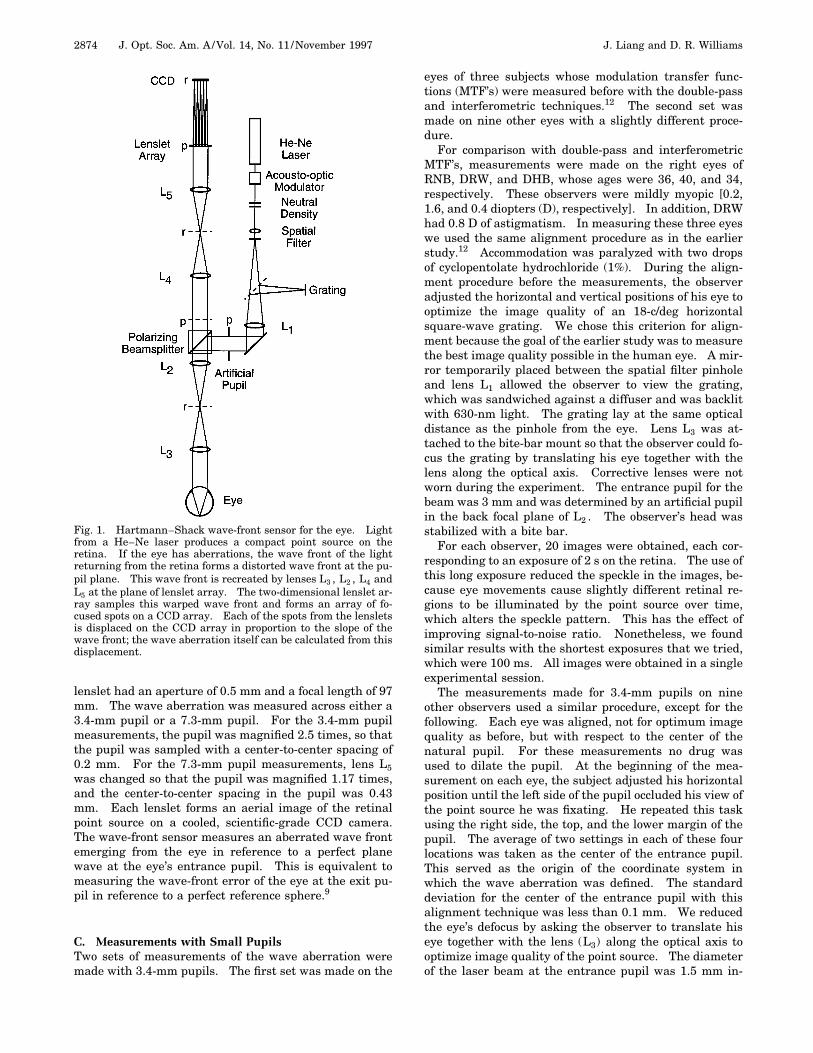
3. RESULTSA. Wave Aberration of the EyeFigure 2 shows results for the 3.4-mm pupil. Figure 2a.shows the expected result if an eye with perfect optics hadbeen used. It was obtained by introducing a plane waveinto the imaging path at the point where the eye’s pupilwould normally have been. The image consists of ahighly regular array of spots, one spot for each lenslet ofthe wave-front sensor. Figures 2b. and 2c. show the im-ages obtained from real eyes. Aberrations in real eyesdisplaced each spot relative to the corresponding spot inthe reference image obtained with a planar wave front.The displacement is proportional to the local slope of thewave front at that lenslet. The local wave-front slope inthe x and y directions was measured at 217 locations si-multaneously across the pupil. The wave aberration wascomputed from the array of local slopes with a least-squares technique.9,13 We represented the wave aberra-tion with the sum of 65 Zernike polynomials, correspond-ing to aberrations up to and including tenth order.14
Figures 2e. and 2f. show contour plots of the recon-structed wave aberration for each observer, averaged
across 20 exposures. The wave aberration shown hasbeen truncated to a pupil diameter of 3 mm. The spacingbetween contour lines is 0.15 mm, which is roughly l/4 at632.8 nm.
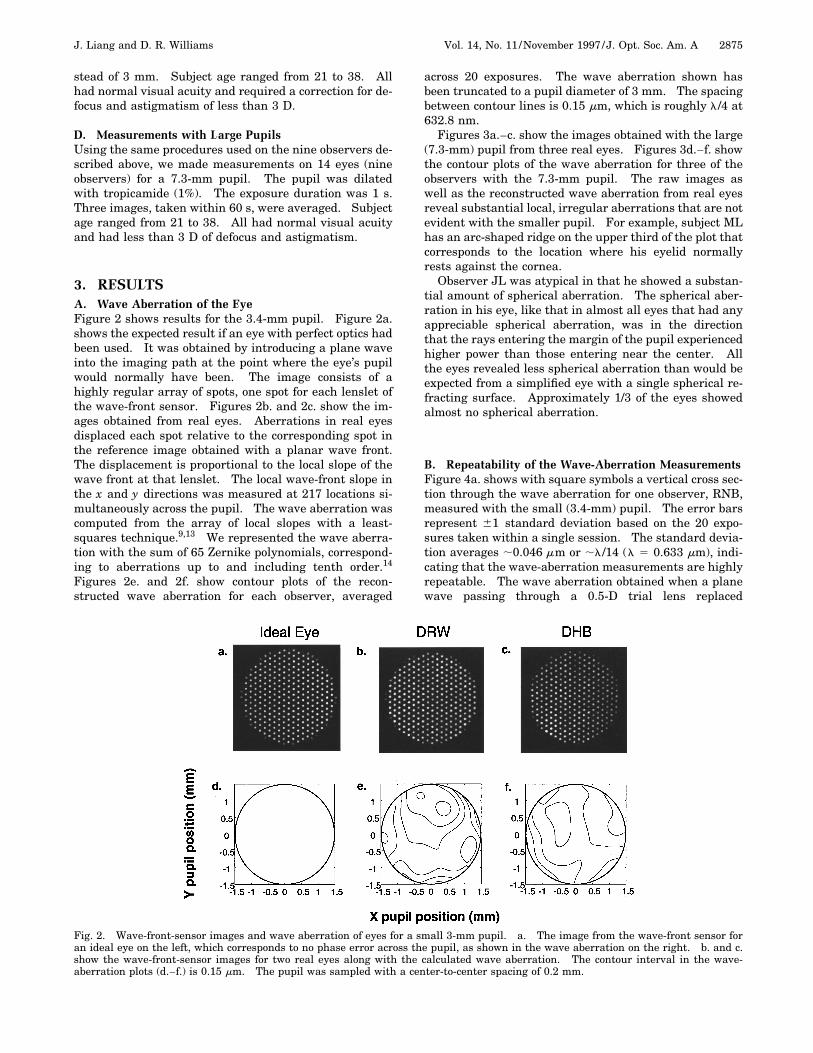
Figures 3a.–c. show the images obtained with the large(7.3-mm) pupil from three real eyes. Figures 3d.–f. showthe contour plots of the wave aberration for three of theobservers with the 7.3-mm pupil. The raw images aswell as the reconstructed wave aberration from real eyesreveal substantial local, irregular aberrations that are notevident with the smaller pupil. For example, subject MLhas an arc-shaped ridge on the upper third of the plot thatcorresponds to the location where his eyelid normallyrests against the cornea.
Observer JL was atypical in that he showed a substan-tial amount of spherical aberration. The spherical aber-ration in his eye, like that in almost all eyes that had anyappreciable spherical aberration, was in the directionthat the rays entering the margin of the pupil experiencedhigher power than those entering near the center. Allthe eyes revealed less spherical aberration than would beexpected from a simplified eye with a single spherical re-fracting surface. Approximately 1/3 of the eyes showedalmost no spherical aberration.
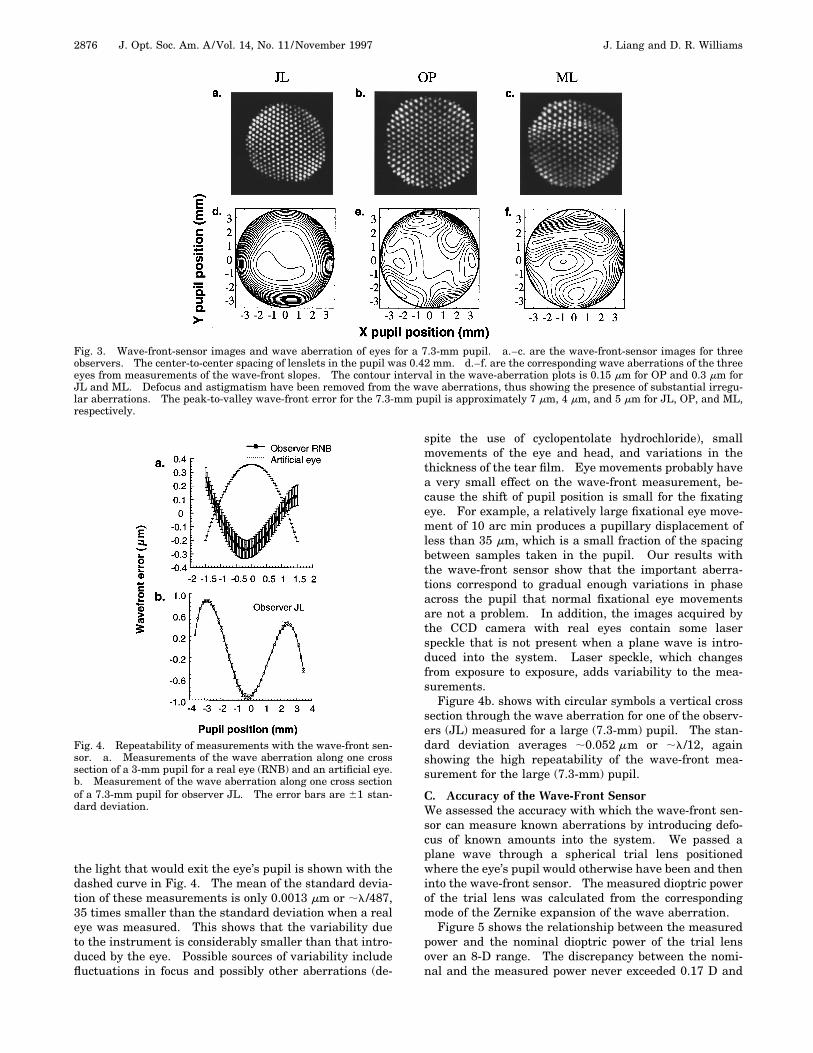
B. Repeatability of the Wave-Aberration MeasurementsFigure 4a. shows with square symbols a vertical cross sec-tion through the wave aberration for one observer, RNB,measured with the small (3.4-mm) pupil. The error barsrepresent 61 standard deviation based on the 20 expo-sures taken within a single session. The standard devia-tion averages ;0.046 mm or ;l/14 (l 5 0.633 mm), indi-cating that the wave-aberration measurements are highlyrepeatable. The wave aberration obtained when a planewave passing through a 0.5-D trial lens replaced
Fig. 2. Wave-front-sensor images and wave aberration of eyes for a small 3-mm pupil. a. The image from the wave-front sensor foran ideal eye on the left, which corresponds to no phase error across the pupil, as shown in the wave aberration on the right. b. and c.show the wave-front-sensor images for two real eyes along with the calculated wave aberration. The contour interval in the wave-aberration plots (d.–f.) is 0.15 mm. The pupil was sampled with a center-to-center spacing of 0.2 mm.
2876 J. Opt. Soc. Am. A/Vol. 14, No. 11 /November 1997 J. Liang and D. R. Williams
Fig. 3. Wave-front-sensor images and wave aberration of eyes for a 7.3-mm pupil. a.–c. are the wave-front-sensor images for threeobservers. The center-to-center spacing of lenslets in the pupil was 0.42 mm. d.–f. are the corresponding wave aberrations of the threeeyes from measurements of the wave-front slopes. The contour interval in the wave-aberration plots is 0.15 mm for OP and 0.3 mm forJL and ML. Defocus and astigmatism have been removed from the wave aberrations, thus showing the presence of substantial irregu-lar aberrations. The peak-to-valley wave-front error for the 7.3-mm pupil is approximately 7 mm, 4 mm, and 5 mm for JL, OP, and ML,respectively.
the light that would exit the eye’s pupil is shown with thedashed curve in Fig. 4. The mean of the standard devia-tion of these measurements is only 0.0013 mm or ;l/487,35 times smaller than the standard deviation when a realeye was measured. This shows that the variability dueto the instrument is considerably smaller than that intro-duced by the eye. Possible sources of variability includefluctuations in focus and possibly other aberrations (de-
Fig. 4. Repeatability of measurements with the wave-front sen-sor. a. Measurements of the wave aberration along one crosssection of a 3-mm pupil for a real eye (RNB) and an artificial eye.b. Measurement of the wave aberration along one cross sectionof a 7.3-mm pupil for observer JL. The error bars are 61 stan-dard deviation.
spite the use of cyclopentolate hydrochloride), smallmovements of the eye and head, and variations in thethickness of the tear film. Eye movements probably havea very small effect on the wave-front measurement, be-cause the shift of pupil position is small for the fixatingeye. For example, a relatively large fixational eye move-ment of 10 arc min produces a pupillary displacement ofless than 35 mm, which is a small fraction of the spacingbetween samples taken in the pupil. Our results withthe wave-front sensor show that the important aberra-tions correspond to gradual enough variations in phaseacross the pupil that normal fixational eye movementsare not a problem. In addition, the images acquired bythe CCD camera with real eyes contain some laserspeckle that is not present when a plane wave is intro-duced into the system. Laser speckle, which changesfrom exposure to exposure, adds variability to the mea-surements.
Figure 4b. shows with circular symbols a vertical crosssection through the wave aberration for one of the observ-ers (JL) measured for a large (7.3-mm) pupil. The stan-dard deviation averages ;0.052 mm or ;l/12, againshowing the high repeatability of the wave-front mea-surement for the large (7.3-mm) pupil.
C. Accuracy of the Wave-Front SensorWe assessed the accuracy with which the wave-front sen-sor can measure known aberrations by introducing defo-cus of known amounts into the system. We passed aplane wave through a spherical trial lens positionedwhere the eye’s pupil would otherwise have been and theninto the wave-front sensor. The measured dioptric powerof the trial lens was calculated from the correspondingmode of the Zernike expansion of the wave aberration.
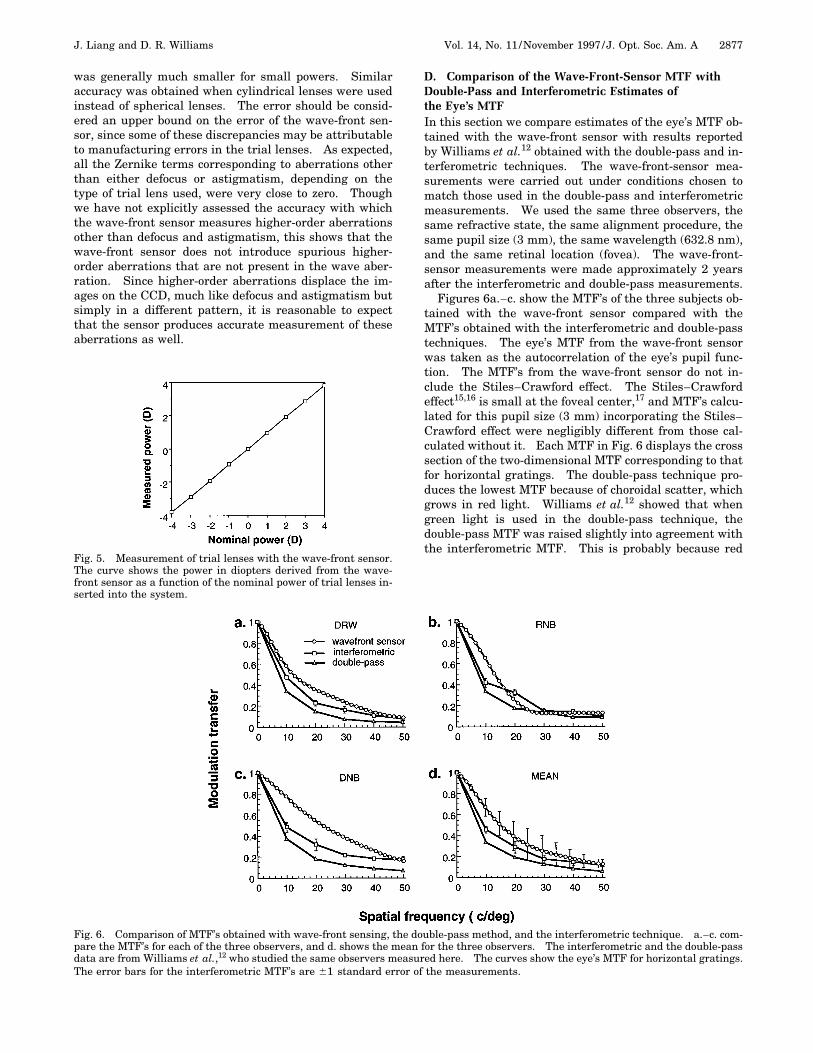
Figure 5 shows the relationship between the measuredpower and the nominal dioptric power of the trial lensover an 8-D range. The discrepancy between the nomi-nal and the measured power never exceeded 0.17 D and
J. Liang and D. R. Williams Vol. 14, No. 11 /November 1997 /J. Opt. Soc. Am. A 2877
was generally much smaller for small powers. Similaraccuracy was obtained when cylindrical lenses were usedinstead of spherical lenses. The error should be consid-ered an upper bound on the error of the wave-front sen-sor, since some of these discrepancies may be attributableto manufacturing errors in the trial lenses. As expected,all the Zernike terms corresponding to aberrations otherthan either defocus or astigmatism, depending on thetype of trial lens used, were very close to zero. Thoughwe have not explicitly assessed the accuracy with whichthe wave-front sensor measures higher-order aberrationsother than defocus and astigmatism, this shows that thewave-front sensor does not introduce spurious higher-order aberrations that are not present in the wave aber-ration. Since higher-order aberrations displace the im-ages on the CCD, much like defocus and astigmatism butsimply in a different pattern, it is reasonable to expectthat the sensor produces accurate measurement of theseaberrations as well.
Fig. 5. Measurement of trial lenses with the wave-front sensor.The curve shows the power in diopters derived from the wave-front sensor as a function of the nominal power of trial lenses in-serted into the system.
D. Comparison of the Wave-Front-Sensor MTF withDouble-Pass and Interferometric Estimates ofthe Eye’s MTFIn this section we compare estimates of the eye’s MTF ob-tained with the wave-front sensor with results reportedby Williams et al.12 obtained with the double-pass and in-terferometric techniques. The wave-front-sensor mea-surements were carried out under conditions chosen tomatch those used in the double-pass and interferometricmeasurements. We used the same three observers, thesame refractive state, the same alignment procedure, thesame pupil size (3 mm), the same wavelength (632.8 nm),and the same retinal location (fovea). The wave-front-sensor measurements were made approximately 2 yearsafter the interferometric and double-pass measurements.
Figures 6a.–c. show the MTF’s of the three subjects ob-tained with the wave-front sensor compared with theMTF’s obtained with the interferometric and double-passtechniques. The eye’s MTF from the wave-front sensorwas taken as the autocorrelation of the eye’s pupil func-tion. The MTF’s from the wave-front sensor do not in-clude the Stiles–Crawford effect. The Stiles–Crawfordeffect15,16 is small at the foveal center,17 and MTF’s calcu-lated for this pupil size (3 mm) incorporating the Stiles–Crawford effect were negligibly different from those cal-culated without it. Each MTF in Fig. 6 displays the crosssection of the two-dimensional MTF corresponding to thatfor horizontal gratings. The double-pass technique pro-duces the lowest MTF because of choroidal scatter, whichgrows in red light. Williams et al.12 showed that whengreen light is used in the double-pass technique, thedouble-pass MTF was raised slightly into agreement withthe interferometric MTF. This is probably because red
Fig. 6. Comparison of MTF’s obtained with wave-front sensing, the double-pass method, and the interferometric technique. a.–c. com-pare the MTF’s for each of the three observers, and d. shows the mean for the three observers. The interferometric and the double-passdata are from Williams et al.,12 who studied the same observers measured here. The curves show the eye’s MTF for horizontal gratings.The error bars for the interferometric MTF’s are 61 standard error of the measurements.
2878 J. Opt. Soc. Am. A/Vol. 14, No. 11 /November 1997 J. Liang and D. R. Williams
light is more subject to multiple scattering in the choroidthan is green light.
The within-subject variability of the MTF obtainedfrom wave-front sensing was very small; the standard er-ror of the individual MTF’s is smaller than the datapoints in Figs. 6a.–c. Nonetheless, as can be seen fromthe size of the error bars in Fig. 6d., the intersubject vari-ability is greater for the wave-front-sensor MTF’s than foreither the double-pass or the interferometric MTF’s. Thewave-front-sensor data were collected in a single sessionon a single day, whereas the interferometric and double-pass methods involved measurements over several days.It is possible that day-to-day variation in the eye’s MTF,perhaps as a result of shifts of refractive state and align-ment, can explain this difference.
In all three subjects the MTF from the wave-front-sensor lies somewhat above the interferometric data atlower spatial frequencies but agrees well at the highestspatial frequencies. One hypothesis is that forward lightscatter may account for the discrepancy. The wave-frontsensor discretely samples the pupil and does not captureimperfections in the eye’s optics at a very fine spatialscale such as those that would cause forward light scat-ter. To explain the low-frequency discrepancy, forwardscatter would have to produce a relatively broad skirt inthe eye’s point-spread function that affected the interfero-metric and the double-pass but not the wave-front-sensormeasurements. However, such a skirt would reducemodulation transfer at high as well as at low spatial fre-quencies, yet the discrepancy is confined to low frequen-cies. Therefore it does not appear that forward scatter byitself will explain the higher wave-front-sensor MTF’s atlow frequencies.
Another possibility is that the refractive state of the ob-servers in the different experiments was different. Al-though the same grating target and procedure were usedin each case, the wave-front-sensor data were collectedwithin a single experimental session, whereas the inter-ferometric data were obtained in several sessions each ofgreater length and were run on different days. It is con-ceivable that the refractive error was somewhat larger inthe longer, interferometric experiments. The amount ofdefocus required to bring the mean MTF’s into approxi-mate register is only ;0.15 diopters. Another factor thatcould contribute to the discrepancy is differences in pupilalignment. Although the same subjective criterion, opti-mum image quality of a horizontal grating, was used forall three methods, we do not know whether the subjectsselected the same pupil location with each method.
Despite these small differences among the MTF’s ob-tained with different techniques, the three techniquesyield reasonably similar MTF’s. The Hartmann–Shackwave-front sensor captures the most important sources ofimage blur, a conclusion that is also supported by evi-dence that wave-front-sensor data can be used to correcthigher-order aberrations in the eye.18 Although wave-front-sensing methods are insensitive to light scattercaused by structures on a spatial scale in the pupil finerthan that of the sampling array, the agreement in Fig. 6shows that in the normal eye, light scatter is a minorsource of image blur compared with the aberrations thatthe wave-front sensor can measure.
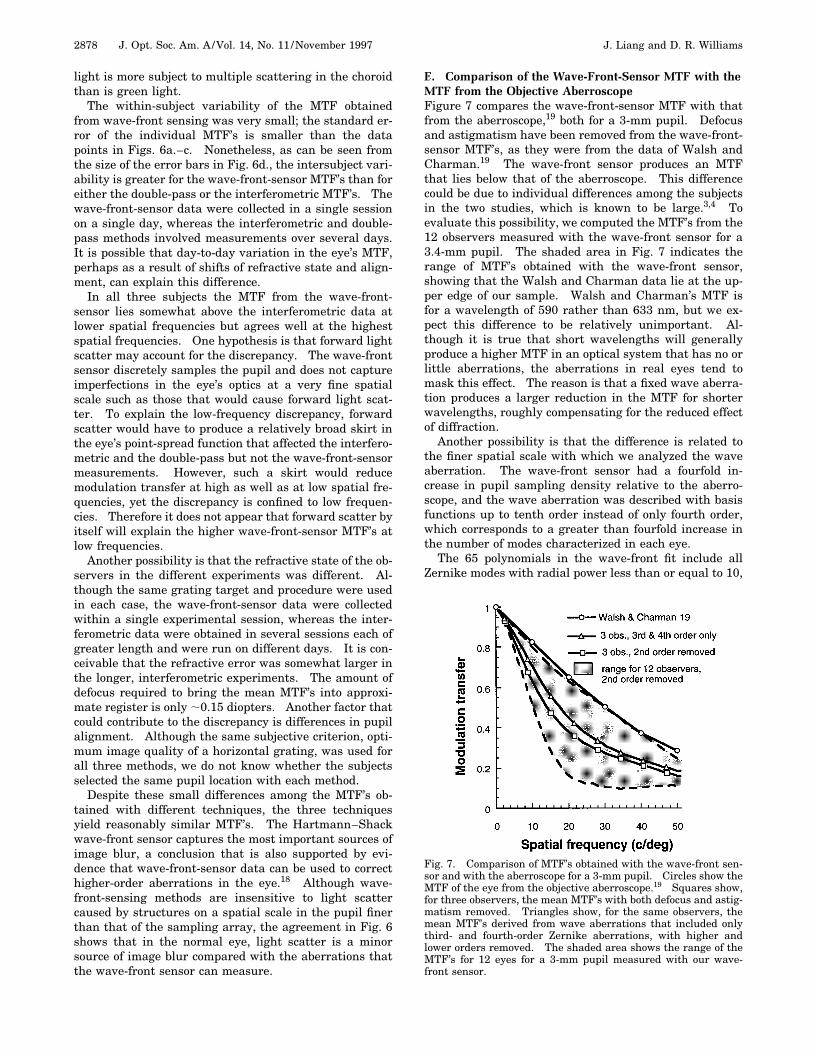
E. Comparison of the Wave-Front-Sensor MTF with theMTF from the Objective AberroscopeFigure 7 compares the wave-front-sensor MTF with thatfrom the aberroscope,19 both for a 3-mm pupil. Defocusand astigmatism have been removed from the wave-front-sensor MTF’s, as they were from the data of Walsh andCharman.19 The wave-front sensor produces an MTFthat lies below that of the aberroscope. This differencecould be due to individual differences among the subjectsin the two studies, which is known to be large.3,4 Toevaluate this possibility, we computed the MTF’s from the12 observers measured with the wave-front sensor for a3.4-mm pupil. The shaded area in Fig. 7 indicates therange of MTF’s obtained with the wave-front sensor,showing that the Walsh and Charman data lie at the up-per edge of our sample. Walsh and Charman’s MTF isfor a wavelength of 590 rather than 633 nm, but we ex-pect this difference to be relatively unimportant. Al-though it is true that short wavelengths will generallyproduce a higher MTF in an optical system that has no orlittle aberrations, the aberrations in real eyes tend tomask this effect. The reason is that a fixed wave aberra-tion produces a larger reduction in the MTF for shorterwavelengths, roughly compensating for the reduced effectof diffraction.
Another possibility is that the difference is related tothe finer spatial scale with which we analyzed the waveaberration. The wave-front sensor had a fourfold in-crease in pupil sampling density relative to the aberro-scope, and the wave aberration was described with basisfunctions up to tenth order instead of only fourth order,which corresponds to a greater than fourfold increase inthe number of modes characterized in each eye.
The 65 polynomials in the wave-front fit include allZernike modes with radial power less than or equal to 10,
Fig. 7. Comparison of MTF’s obtained with the wave-front sen-sor and with the aberroscope for a 3-mm pupil. Circles show theMTF of the eye from the objective aberroscope.19 Squares show,for three observers, the mean MTF’s with both defocus and astig-matism removed. Triangles show, for the same observers, themean MTF’s derived from wave aberrations that included onlythird- and fourth-order Zernike aberrations, with higher andlower orders removed. The shaded area shows the range of theMTF’s for 12 eyes for a 3-mm pupil measured with our wave-front sensor.
J. Liang and D. R. Williams Vol. 14, No. 11 /November 1997 /J. Opt. Soc. Am. A 2879
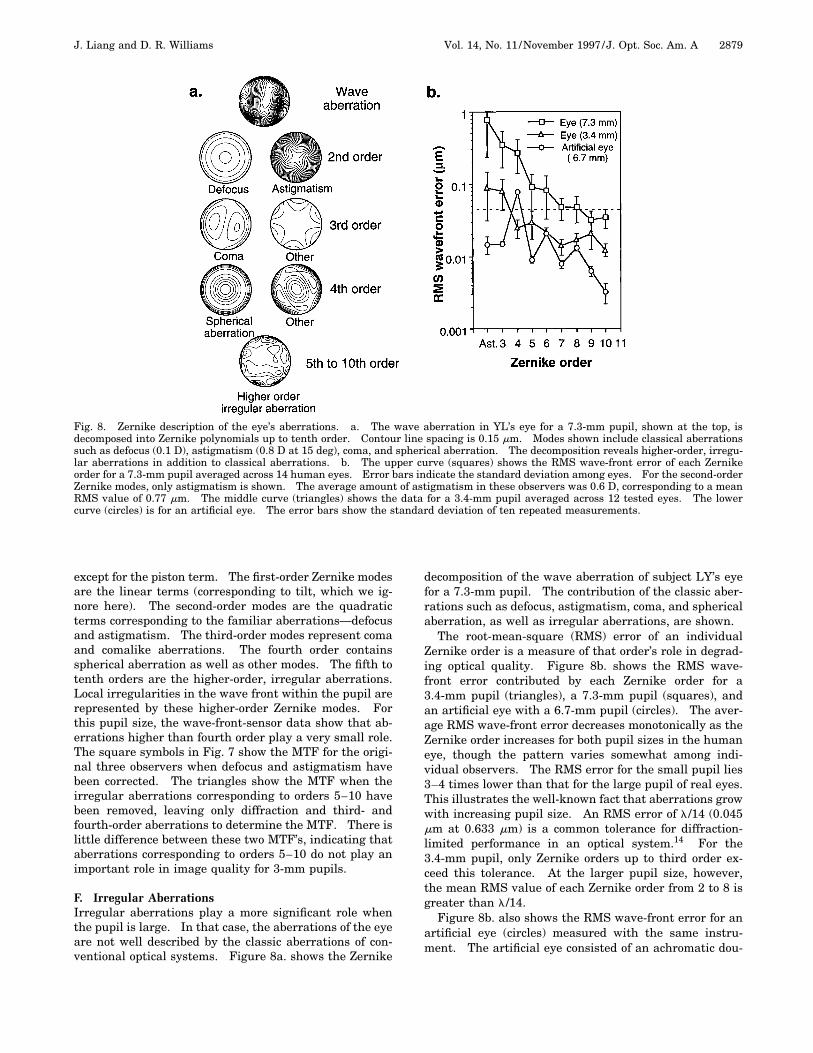
Fig. 8. Zernike description of the eye’s aberrations. a. The wave aberration in YL’s eye for a 7.3-mm pupil, shown at the top, isdecomposed into Zernike polynomials up to tenth order. Contour line spacing is 0.15 mm. Modes shown include classical aberrationssuch as defocus (0.1 D), astigmatism (0.8 D at 15 deg), coma, and spherical aberration. The decomposition reveals higher-order, irregu-lar aberrations in addition to classical aberrations. b. The upper curve (squares) shows the RMS wave-front error of each Zernikeorder for a 7.3-mm pupil averaged across 14 human eyes. Error bars indicate the standard deviation among eyes. For the second-orderZernike modes, only astigmatism is shown. The average amount of astigmatism in these observers was 0.6 D, corresponding to a meanRMS value of 0.77 mm. The middle curve (triangles) shows the data for a 3.4-mm pupil averaged across 12 tested eyes. The lowercurve (circles) is for an artificial eye. The error bars show the standard deviation of ten repeated measurements.
except for the piston term. The first-order Zernike modesare the linear terms (corresponding to tilt, which we ig-nore here). The second-order modes are the quadraticterms corresponding to the familiar aberrations—defocusand astigmatism. The third-order modes represent comaand comalike aberrations. The fourth order containsspherical aberration as well as other modes. The fifth totenth orders are the higher-order, irregular aberrations.Local irregularities in the wave front within the pupil arerepresented by these higher-order Zernike modes. Forthis pupil size, the wave-front-sensor data show that ab-errations higher than fourth order play a very small role.The square symbols in Fig. 7 show the MTF for the origi-nal three observers when defocus and astigmatism havebeen corrected. The triangles show the MTF when theirregular aberrations corresponding to orders 5–10 havebeen removed, leaving only diffraction and third- andfourth-order aberrations to determine the MTF. There islittle difference between these two MTF’s, indicating thataberrations corresponding to orders 5–10 do not play animportant role in image quality for 3-mm pupils.
F. Irregular AberrationsIrregular aberrations play a more significant role whenthe pupil is large. In that case, the aberrations of the eyeare not well described by the classic aberrations of con-ventional optical systems. Figure 8a. shows the Zernike
decomposition of the wave aberration of subject LY’s eyefor a 7.3-mm pupil. The contribution of the classic aber-rations such as defocus, astigmatism, coma, and sphericalaberration, as well as irregular aberrations, are shown.
The root-mean-square (RMS) error of an individualZernike order is a measure of that order’s role in degrad-ing optical quality. Figure 8b. shows the RMS wave-front error contributed by each Zernike order for a3.4-mm pupil (triangles), a 7.3-mm pupil (squares), andan artificial eye with a 6.7-mm pupil (circles). The aver-age RMS wave-front error decreases monotonically as theZernike order increases for both pupil sizes in the humaneye, though the pattern varies somewhat among indi-vidual observers. The RMS error for the small pupil lies3–4 times lower than that for the large pupil of real eyes.This illustrates the well-known fact that aberrations growwith increasing pupil size. An RMS error of l/14 (0.045mm at 0.633 mm) is a common tolerance for diffraction-limited performance in an optical system.14 For the3.4-mm pupil, only Zernike orders up to third order ex-ceed this tolerance. At the larger pupil size, however,the mean RMS value of each Zernike order from 2 to 8 isgreater than l/14.
Figure 8b. also shows the RMS wave-front error for anartificial eye (circles) measured with the same instru-ment. The artificial eye consisted of an achromatic dou-
2880 J. Opt. Soc. Am. A/Vol. 14, No. 11 /November 1997 J. Liang and D. R. Williams
blet ( f 5 16 mm) and a diffuser to mimic the retina.Though our measurements reveal some expected spheri-cal aberration in the artificial eye, the mean RMS value ofeach order averages approximately one order of magni-tude lower than in human eyes for the large (7.3-mm) pu-pil. This indicates that the measured higher-order, ir-regular aberrations are true defects of the human eyesand not aberrations in the apparatus.
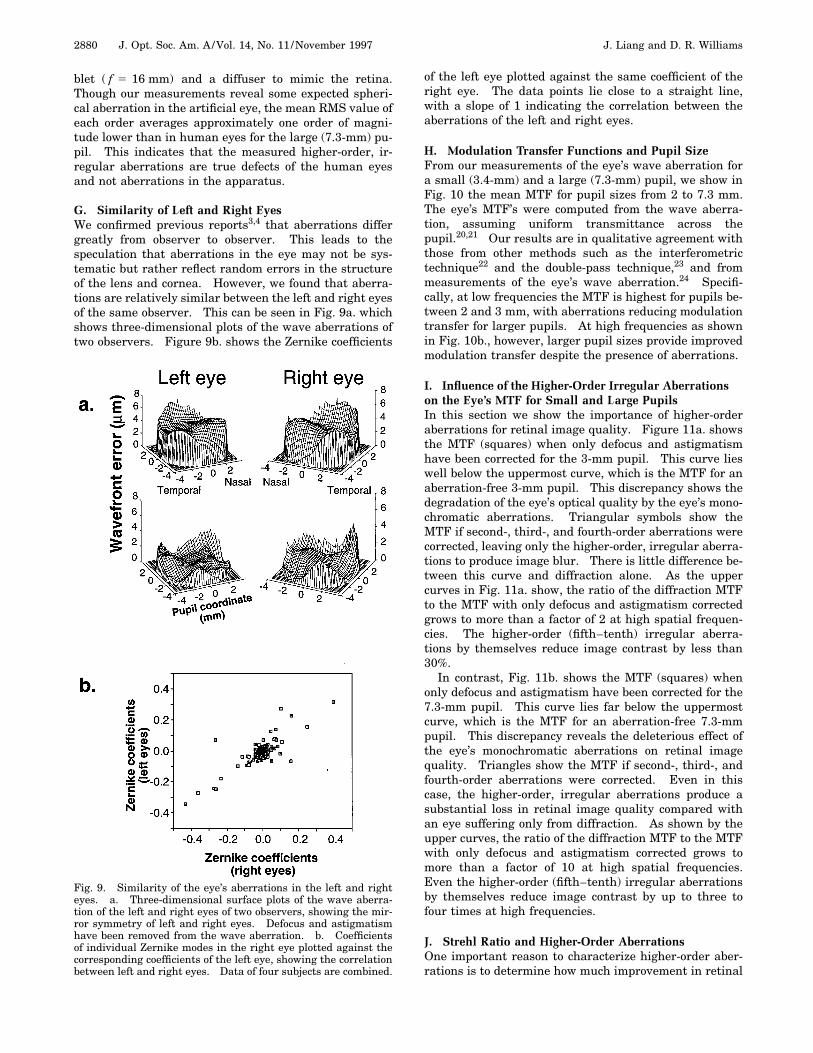
G. Similarity of Left and Right EyesWe confirmed previous reports3,4 that aberrations differgreatly from observer to observer. This leads to thespeculation that aberrations in the eye may not be sys-tematic but rather reflect random errors in the structureof the lens and cornea. However, we found that aberra-tions are relatively similar between the left and right eyesof the same observer. This can be seen in Fig. 9a. whichshows three-dimensional plots of the wave aberrations oftwo observers. Figure 9b. shows the Zernike coefficients
Fig. 9. Similarity of the eye’s aberrations in the left and righteyes. a. Three-dimensional surface plots of the wave aberra-tion of the left and right eyes of two observers, showing the mir-ror symmetry of left and right eyes. Defocus and astigmatismhave been removed from the wave aberration. b. Coefficientsof individual Zernike modes in the right eye plotted against thecorresponding coefficients of the left eye, showing the correlationbetween left and right eyes. Data of four subjects are combined.
of the left eye plotted against the same coefficient of theright eye. The data points lie close to a straight line,with a slope of 1 indicating the correlation between theaberrations of the left and right eyes.
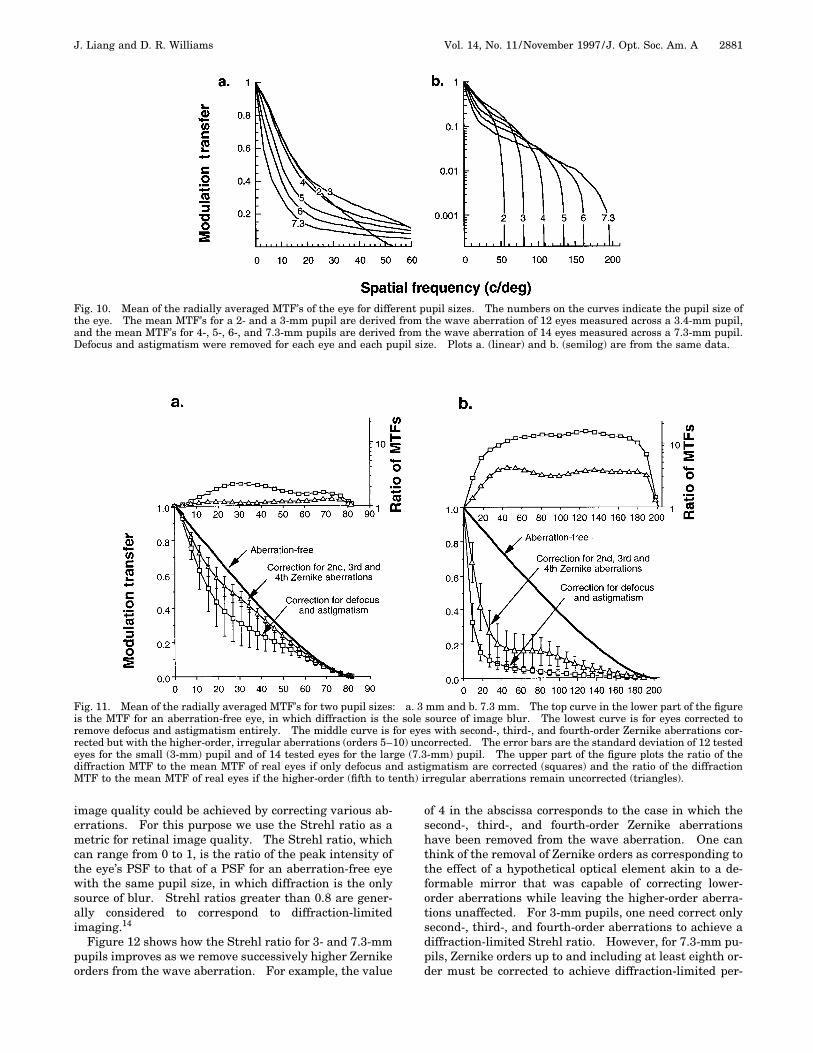
H. Modulation Transfer Functions and Pupil SizeFrom our measurements of the eye’s wave aberration fora small (3.4-mm) and a large (7.3-mm) pupil, we show inFig. 10 the mean MTF for pupil sizes from 2 to 7.3 mm.The eye’s MTF’s were computed from the wave aberra-tion, assuming uniform transmittance across thepupil.20,21 Our results are in qualitative agreement withthose from other methods such as the interferometrictechnique22 and the double-pass technique,23 and frommeasurements of the eye’s wave aberration.24 Specifi-cally, at low frequencies the MTF is highest for pupils be-tween 2 and 3 mm, with aberrations reducing modulationtransfer for larger pupils. At high frequencies as shownin Fig. 10b., however, larger pupil sizes provide improvedmodulation transfer despite the presence of aberrations.
I. Influence of the Higher-Order Irregular Aberrationson the Eye’s MTF for Small and Large PupilsIn this section we show the importance of higher-orderaberrations for retinal image quality. Figure 11a. showsthe MTF (squares) when only defocus and astigmatismhave been corrected for the 3-mm pupil. This curve lieswell below the uppermost curve, which is the MTF for anaberration-free 3-mm pupil. This discrepancy shows thedegradation of the eye’s optical quality by the eye’s mono-chromatic aberrations. Triangular symbols show theMTF if second-, third-, and fourth-order aberrations werecorrected, leaving only the higher-order, irregular aberra-tions to produce image blur. There is little difference be-tween this curve and diffraction alone. As the uppercurves in Fig. 11a. show, the ratio of the diffraction MTFto the MTF with only defocus and astigmatism correctedgrows to more than a factor of 2 at high spatial frequen-cies. The higher-order (fifth–tenth) irregular aberra-tions by themselves reduce image contrast by less than30%.
In contrast, Fig. 11b. shows the MTF (squares) whenonly defocus and astigmatism have been corrected for the7.3-mm pupil. This curve lies far below the uppermostcurve, which is the MTF for an aberration-free 7.3-mmpupil. This discrepancy reveals the deleterious effect ofthe eye’s monochromatic aberrations on retinal imagequality. Triangles show the MTF if second-, third-, andfourth-order aberrations were corrected. Even in thiscase, the higher-order, irregular aberrations produce asubstantial loss in retinal image quality compared withan eye suffering only from diffraction. As shown by theupper curves, the ratio of the diffraction MTF to the MTFwith only defocus and astigmatism corrected grows tomore than a factor of 10 at high spatial frequencies.Even the higher-order (fifth–tenth) irregular aberrationsby themselves reduce image contrast by up to three tofour times at high frequencies.
J. Strehl Ratio and Higher-Order AberrationsOne important reason to characterize higher-order aber-rations is to determine how much improvement in retinal
J. Liang and D. R. Williams Vol. 14, No. 11 /November 1997 /J. Opt. Soc. Am. A 2881
Fig. 10. Mean of the radially averaged MTF’s of the eye for different pupil sizes. The numbers on the curves indicate the pupil size ofthe eye. The mean MTF’s for a 2- and a 3-mm pupil are derived from the wave aberration of 12 eyes measured across a 3.4-mm pupil,and the mean MTF’s for 4-, 5-, 6-, and 7.3-mm pupils are derived from the wave aberration of 14 eyes measured across a 7.3-mm pupil.Defocus and astigmatism were removed for each eye and each pupil size. Plots a. (linear) and b. (semilog) are from the same data.
Fig. 11. Mean of the radially averaged MTF’s for two pupil sizes: a. 3 mm and b. 7.3 mm. The top curve in the lower part of the figureis the MTF for an aberration-free eye, in which diffraction is the sole source of image blur. The lowest curve is for eyes corrected toremove defocus and astigmatism entirely. The middle curve is for eyes with second-, third-, and fourth-order Zernike aberrations cor-rected but with the higher-order, irregular aberrations (orders 5–10) uncorrected. The error bars are the standard deviation of 12 testedeyes for the small (3-mm) pupil and of 14 tested eyes for the large (7.3-mm) pupil. The upper part of the figure plots the ratio of thediffraction MTF to the mean MTF of real eyes if only defocus and astigmatism are corrected (squares) and the ratio of the diffractionMTF to the mean MTF of real eyes if the higher-order (fifth to tenth) irregular aberrations remain uncorrected (triangles).
image quality could be achieved by correcting various ab-errations. For this purpose we use the Strehl ratio as ametric for retinal image quality. The Strehl ratio, whichcan range from 0 to 1, is the ratio of the peak intensity ofthe eye’s PSF to that of a PSF for an aberration-free eyewith the same pupil size, in which diffraction is the onlysource of blur. Strehl ratios greater than 0.8 are gener-ally considered to correspond to diffraction-limitedimaging.14
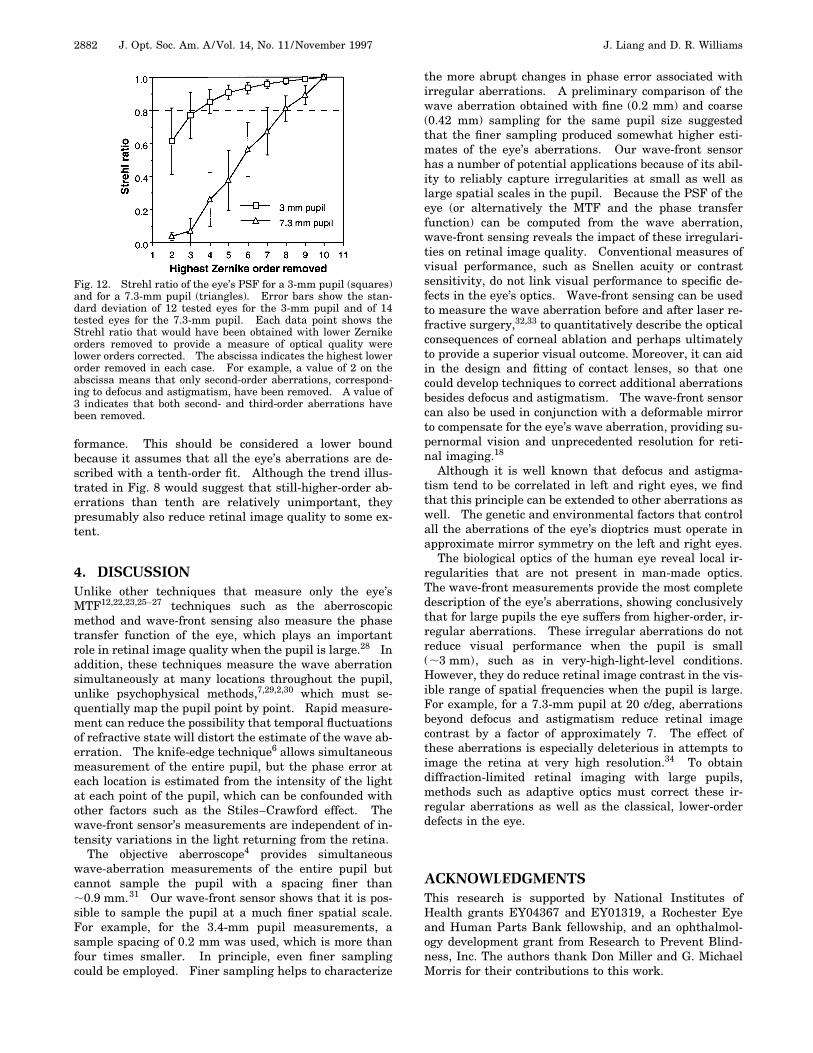
Figure 12 shows how the Strehl ratio for 3- and 7.3-mmpupils improves as we remove successively higher Zernikeorders from the wave aberration. For example, the value
of 4 in the abscissa corresponds to the case in which thesecond-, third-, and fourth-order Zernike aberrationshave been removed from the wave aberration. One canthink of the removal of Zernike orders as corresponding tothe effect of a hypothetical optical element akin to a de-formable mirror that was capable of correcting lower-order aberrations while leaving the higher-order aberra-tions unaffected. For 3-mm pupils, one need correct onlysecond-, third-, and fourth-order aberrations to achieve adiffraction-limited Strehl ratio. However, for 7.3-mm pu-pils, Zernike orders up to and including at least eighth or-der must be corrected to achieve diffraction-limited per-
2882 J. Opt. Soc. Am. A/Vol. 14, No. 11 /November 1997 J. Liang and D. R. Williams
formance. This should be considered a lower boundbecause it assumes that all the eye’s aberrations are de-scribed with a tenth-order fit. Although the trend illus-trated in Fig. 8 would suggest that still-higher-order ab-errations than tenth are relatively unimportant, theypresumably also reduce retinal image quality to some ex-tent.
4. DISCUSSIONUnlike other techniques that measure only the eye’sMTF12,22,23,25–27 techniques such as the aberroscopicmethod and wave-front sensing also measure the phasetransfer function of the eye, which plays an importantrole in retinal image quality when the pupil is large.28 Inaddition, these techniques measure the wave aberrationsimultaneously at many locations throughout the pupil,unlike psychophysical methods,7,29,2,30 which must se-quentially map the pupil point by point. Rapid measure-ment can reduce the possibility that temporal fluctuationsof refractive state will distort the estimate of the wave ab-erration. The knife-edge technique6 allows simultaneousmeasurement of the entire pupil, but the phase error ateach location is estimated from the intensity of the lightat each point of the pupil, which can be confounded withother factors such as the Stiles–Crawford effect. Thewave-front sensor’s measurements are independent of in-tensity variations in the light returning from the retina.
The objective aberroscope4 provides simultaneouswave-aberration measurements of the entire pupil butcannot sample the pupil with a spacing finer than;0.9 mm.31 Our wave-front sensor shows that it is pos-sible to sample the pupil at a much finer spatial scale.For example, for the 3.4-mm pupil measurements, asample spacing of 0.2 mm was used, which is more thanfour times smaller. In principle, even finer samplingcould be employed. Finer sampling helps to characterize
Fig. 12. Strehl ratio of the eye’s PSF for a 3-mm pupil (squares)and for a 7.3-mm pupil (triangles). Error bars show the stan-dard deviation of 12 tested eyes for the 3-mm pupil and of 14tested eyes for the 7.3-mm pupil. Each data point shows theStrehl ratio that would have been obtained with lower Zernikeorders removed to provide a measure of optical quality werelower orders corrected. The abscissa indicates the highest lowerorder removed in each case. For example, a value of 2 on theabscissa means that only second-order aberrations, correspond-ing to defocus and astigmatism, have been removed. A value of3 indicates that both second- and third-order aberrations havebeen removed.
the more abrupt changes in phase error associated withirregular aberrations. A preliminary comparison of thewave aberration obtained with fine (0.2 mm) and coarse(0.42 mm) sampling for the same pupil size suggestedthat the finer sampling produced somewhat higher esti-mates of the eye’s aberrations. Our wave-front sensorhas a number of potential applications because of its abil-ity to reliably capture irregularities at small as well aslarge spatial scales in the pupil. Because the PSF of theeye (or alternatively the MTF and the phase transferfunction) can be computed from the wave aberration,wave-front sensing reveals the impact of these irregulari-ties on retinal image quality. Conventional measures ofvisual performance, such as Snellen acuity or contrastsensitivity, do not link visual performance to specific de-fects in the eye’s optics. Wave-front sensing can be usedto measure the wave aberration before and after laser re-fractive surgery,32,33 to quantitatively describe the opticalconsequences of corneal ablation and perhaps ultimatelyto provide a superior visual outcome. Moreover, it can aidin the design and fitting of contact lenses, so that onecould develop techniques to correct additional aberrationsbesides defocus and astigmatism. The wave-front sensorcan also be used in conjunction with a deformable mirrorto compensate for the eye’s wave aberration, providing su-pernormal vision and unprecedented resolution for reti-nal imaging.18
Although it is well known that defocus and astigma-tism tend to be correlated in left and right eyes, we findthat this principle can be extended to other aberrations aswell. The genetic and environmental factors that controlall the aberrations of the eye’s dioptrics must operate inapproximate mirror symmetry on the left and right eyes.
The biological optics of the human eye reveal local ir-regularities that are not present in man-made optics.The wave-front measurements provide the most completedescription of the eye’s aberrations, showing conclusivelythat for large pupils the eye suffers from higher-order, ir-regular aberrations. These irregular aberrations do notreduce visual performance when the pupil is small(;3 mm), such as in very-high-light-level conditions.However, they do reduce retinal image contrast in the vis-ible range of spatial frequencies when the pupil is large.For example, for a 7.3-mm pupil at 20 c/deg, aberrationsbeyond defocus and astigmatism reduce retinal imagecontrast by a factor of approximately 7. The effect ofthese aberrations is especially deleterious in attempts toimage the retina at very high resolution.34 To obtaindiffraction-limited retinal imaging with large pupils,methods such as adaptive optics must correct these ir-regular aberrations as well as the classical, lower-orderdefects in the eye.
ACKNOWLEDGMENTSThis research is supported by National Institutes ofHealth grants EY04367 and EY01319, a Rochester Eyeand Human Parts Bank fellowship, and an ophthalmol-ogy development grant from Research to Prevent Blind-ness, Inc. The authors thank Don Miller and G. MichaelMorris for their contributions to this work.
J. Liang and D. R. Williams Vol. 14, No. 11 /November 1997 /J. Opt. Soc. Am. A 2883
REFERENCES AND NOTES1. W. M. Rosenblum and J. L. Christensen, ‘‘Objective and
subjective spherical aberration measurement of the humaneye,’’ in Progress in Optics, E. Wolf, ed. (North-Holland,Amsterdam, 1976), Vol. 13, pp. 69–91.
2. M. C. Campbell, E. M. Harrison, and P. Simonet, ‘‘Psycho-physical measurement of the blur on the retina due to op-tical aberrations of the eye,’’ Vision Res. 30, 1587–1602(1990).
3. H. C. Howland and B. Howland, ‘‘A subjective method forthe measurement of monochromatic aberrations of the eye,’’J. Opt. Soc. Am. 67, 1508–1518 (1977).
4. G. Walsh, W. N. Charman, and H. C. Howland, ‘‘Objectivetechnique for the determination of monochromatic aberra-tions of the human eye,’’ J. Opt. Soc. Am. A 1, 987–992(1984).
5. H. von Helmholtz, Physiological Optics, J. P. C. Southall,ed. (Dover, New York, 1896).
6. F. Berny, S. Slansky, ‘‘Wavefront determination resultingfrom foucault test as applied to the human eye and visualinstruments,’’ in Optical Instruments and Techniques, J. H.Dickenson, ed. (Oriel, Newcastle, UK, 1969), pp. 375–386.
7. G. Van den Brink, ‘‘Measurements of the geometrical aber-rations of the eye,’’ Vision Res. 2, 233–244 (1962).
8. H. C. Howland and J. Buettner, ‘‘Computing high orderwave aberration coefficients from variations of best focusfor small artificial pupils,’’ Vision Res. 29, 979–983 (1989).
9. J. Liang, B. Grimm, S. Goelz, and J. Bille, ‘‘Objective mea-surement of the wave aberrations of the human eye withthe use of a Hartmann–Shack wave-front sensor,’’ J. Opt.Soc. Am. A 11, 1949–1957 (1994).
10. B. Platt and R. V. Shack, ‘‘Lenticular Hartmann screen,’’Opt. Sci. Center Newsl. (University of Arizona) 5, 15–16(1971).
11. D. H. Sliney and M. L. Wolbarsht, ‘‘Safety standards andmeasurement techniques for high intensity light sources,’’Vision Res. 20, 1133–1142 (1980).
12. D. R. Williams, D. H. Brainard, M. J. McMahon, and R. Na-varro, ‘‘Double-pass and interferometric measures of the op-tical quality of the eye,’’ J. Opt. Soc. Am. A 11, 3123–3135(1994).
13. W. H. Southwell, ‘‘Wave-front estimation from wave-frontslope measurements,’’ J. Opt. Soc. Am. A 70, 998–1006(1980).
14. M. Born and E. Wolf, Principles of Optics (Pergamon, Ox-ford, 1983).
15. W. S. Stiles and B. H. Crawford, ‘‘The luminous efficiency ofrays entering the eye pupil at different points,’’ Proc. R. Soc.London Ser. B 112, 428–450 (1933).
16. J. Enoch and V. Lakshminarayanan, ‘‘Retinal fibre optics,’’in Visual Optics and Instrumentation, W. N. Charman, ed.,Vol. 1 of Vision and Visual Dysfunction, J. Cronly-Dillon,ed. (CRC, Boca Raton, Fla., 1991), Chap. 12.
17. G. Westheimer, ‘‘Dependence of the magnitude of the
Stiles–Crawford effect on retinal location,’’ J. Physiol. (Lon-don) 192, 309–315 (1967).
18. J. Liang, D. R. Williams, and D. T. Miller, ‘‘Supernormal vi-sion and high-resolution retinal imaging through adaptiveoptics,’’ J. Opt. Soc. Am. A 14, 2884–2892 (1997).
19. G. Walsh and W. N. Charman, ‘‘The effect of pupil centra-tion and diameter on ocular performance,’’ Vision Res. 28,659–665 (1988).
20. J. W. Goodman, Introduction to Fourier Optics (McGraw-Hill, San Francisco, Calif., 1968).
21. We have also calculated the eye’s MTF, incorporating theStiles–Crawford effect (r 5 0.05). The MTF is increasedslightly at lower frequencies but is reduced at higher fre-quencies; nevertheless, the Stiles–Crawford effect does notsubstantially change our conclusions.
22. F. W. Campbell and D. G. Green, ‘‘Optical and retinal fac-tors affecting visual resolution,’’ J. Physiol. (London) 181,576–593 (1965).
23. F. W. Campbell and R. W. Gubisch, ‘‘Optical quality of thehuman eye,’’ J. Physiol. (London) 186, 558–578 (1966).
24. G. Walsh and W. N. Charman, ‘‘Measurement of the axialwavefront aberration of the human eye,’’ Ophthalmic.Physiol. Opt. 5, 23–31 (1985).
25. F. Flamant, ‘‘Etude de la repartition de lumiere dansl’image retinienne d’une fente,’’ Rev. Opt. Theor. Instrum.34, 433–459 (1955).
26. G. Westheimer and F. W. Campbell, ‘‘Light distribution inthe image formed by the living human eye,’’ J. Opt. Soc.Am. 52, 1040–1044 (1962).
27. P. Artal, S. Marcos, R. Navarro, and D. R. Williams, ‘‘Oddaberrations and double-pass measurements of retinal im-age quality,’’ J. Opt. Soc. Am. A 12, 195–201 (1995).
28. W. N. Charman and G. Walsh, ‘‘The optical phase transferfunction of the eye and the perception of spatial phase,’’ Vi-sion Res. 25, 619–623 (1985).
29. M. S. Smirnov, ‘‘Measurement of the wave aberration of thehuman eye,’’ Biophys. J. 7, 766–795 (1962).
30. R. H. Webb, C. M. Penney, and K. P. Thompson, ‘‘Measure-ment of ocular wave-front distortion with a spatially re-solved refractometer,’’ Appl. Opt. 31, 3678–3686 (1992).
31. W. N. Charman, ‘‘Wave aberration of the eye: a review,’’Optom. Vis. Sci. 68, 574–583 (1991).
32. R. A. Applegate, C. A. Johnson, H. C. Howland, and R. W.Yee, ‘‘Monochromatic wavefront aberrations following ra-dial keratotomy,’’ in Noninvasive Assessment of Visual Sys-tem, Vol. 7 of 1989 OSA Technical Digest Series (Optical So-ciety of America, Washington, D.C., 1989), pp. 98–102.
33. R. A. Applegate and K. A. Gansel, ‘‘The importance of pupilsize in optical quality measurements following radial kera-totomy,’’ Refract. Corneal Surg. 6, 47–54 (1990).
34. D. T. Miller, D. R. Williams, G. M. Morris, and J. Liang,‘‘Images of the cone mosaic in the living human eye,’’ VisionRes. 36, 1067–1079 (1996).