aberrant behavior detection - hp labs
TRANSCRIPT

Aberrant Behavior Detection in Time Series for Network and Service Monitoring
Jake Brutlag3/04/05
http://www.usenix.org/events/lisa2000/full_papers/brutlag/brutlag.pdf

Outline
• Problem Description• Aberrant behavior detection• Algorithm Description• Algorithm Evaluation• Implementation and Deployment
– Threshold Watcher– Technicians like ‘black box’– The right audience

Problem Description
• Information Overload– Data collected/polled frequently (every 5 min) – Hundreds/thousands of targets (network devices,
hosts, applications)– Multiple performance/status counters per target
• network interface: octets, packets, error count• host: CPU, memory, disk• application: request load, latency, error count
• Technicians monitor this data stream and identify problems in near real time

Solution: Data Reduction
• Automated monitoring escalates interesting events to the technician
• Simple Thresholds– Technician (or expert) sets thresholds for each counter,
alarm generated on excess– Static, incapable of capturing subtle behavior– May not be data driven
• Aberrant Behavior Detection– Like thresholds, scope is a single counter– Dynamic, data-driven thresholds– Time series analysis
• Event Correlation– Multiple targets/counters

What is aberrant behavior?
• Aberrant behavior is in the eye of the beholder.– Intrusion Detection– Event Correlation– Signatures
• My definition– Given a mathematical model of the time series,
define aberrant behavior as data which does not fit the model
– Aberrant behavior is that which does not conform to past history.


Which mathematical model/algorithm?
• My requirements– Describes the regularities observed in time series.– Adapts over time.– Efficient enough for real-time monitoring.– Easy to tune.
• Regularity in time series1. Trend.2. Seasonal trend (daily cycle).3. Seasonal variability (deviations).4. Evolution of (1) – (3) over longer time periods.

How does it work?
• Predict the observation in the time series– use holt-winters forecasting– adaptive (prediction based upon history)
• Describe the deviation of the observed value from the prediction
• Flag observations that are ‘too deviant’– use a confidence interval– adaptive
• Aberrant behavior = the number of ‘too deviant’ > threshold in a fixed temporal period

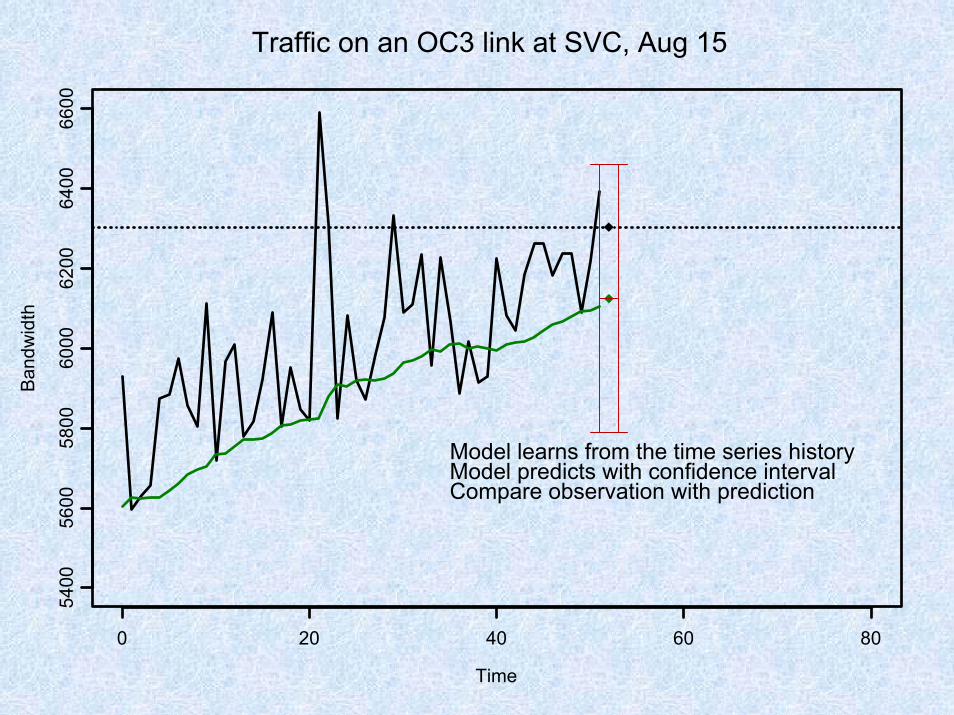
Traffic on an OC3 link at SVC, Aug 15
Time
Ban
dwid
th
0 20 40 60 80
5400
5600
5800
6000
6200
6400
6600

Traffic on an OC3 link at SVC, Aug 15
Time
Ban
dwid
th
0 20 40 60 80
5400
5600
5800
6000
6200
6400
6600
Model learns from the time series history

Traffic on an OC3 link at SVC, Aug 15
Time
Ban
dwid
th
0 20 40 60 80
5400
5600
5800
6000
6200
6400
6600
Model learns from the time series historyModel predicts with confidence interval
Traffic on an OC3 link at SVC, Aug 15
Time
Ban
dwid
th
0 20 40 60 80
5400
5600
5800
6000
6200
6400
6600
Model learns from the time series historyModel predicts with confidence intervalCompare observation with prediction

Traffic on an OC3 link at SVC, Aug 15
Time
Ban
dwid
th
0 20 40 60 80
5400
5600
5800
6000
6200
6400
6600
Model learns from the time series historyModel predicts with confidence intervalCompare observation with predictionNote observation is 'too deviant'

Traffic on an OC3 link at SVC, Aug 15
Time
Ban
dwid
th
0 20 40 60 80
5400
5600
5800
6000
6200
6400
6600
Model learns from the time series historyModel predicts with confidence intervalCompare observation with predictionNote observation is 'too deviant'Consider a temporal windowCount deviant observations in windowAlarm if count exceeds threshold
Model learns from the time series historyModel predicts with confidence interval
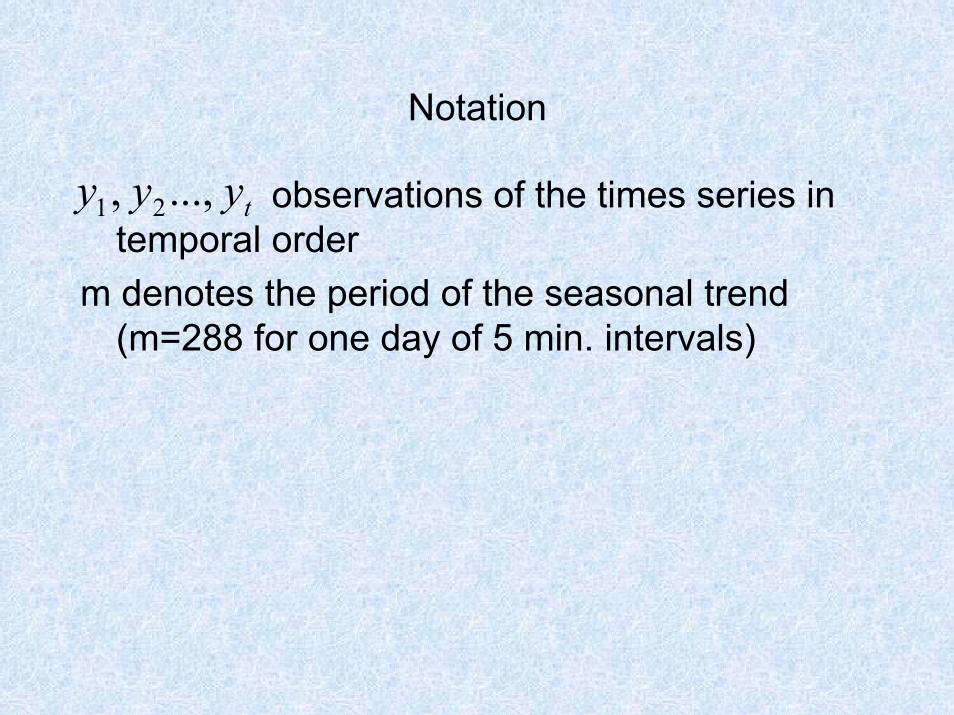
Notation
observations of the times series in temporal order
m denotes the period of the seasonal trend (m=288 for one day of 5 min. intervals)
tyyy ...,, 21

Holt-Winters Forecasting
• Prediction:
• Baseline (“intercept”):
• Linear Trend (“slope”):
• Seasonal Trend:
mtttt cbay −++ ++= 11ˆ
))(1()( 111 ttmttt bacya +−+−= −+++ αα
tttt baab )1()( 11 ββ −+−= ++
mtttt cayc −++++ −+−= 1111 )1()( γγ

Measure of Deviation
In addition to prediction, compute a measure of deviation for each time point:
Use weighted average absolute deviation updated via exponential smoothing:
Confidence bands: a collection of confidence intervals of the form:
mtttt dyyd −++++ −+−⋅= 1111 )1(ˆ γγ
( )mttmtt dydy −++−++ ⋅+⋅− 1111 ˆ,ˆ δδ
td

Smoothing
• Assume seasonal trend and deviation (variability) are smooth functions.
• Periodically apply a filter to smooth seasonal trend and deviation. Selected an equal-weight moving average filter with a window of 0.05m.

Algorithm Evaluation
• P. Barford, J. Kline, D. Plonka, A. Ron. "A Signal Analysis of Network Traffic Anomalies" Proceedings of ACM SIGCOMM Internet
Measurement Workshop November, 2002.• 39 anomalies hand-labeled by a network
operator– Holt-Winters forecasting identified 37– Deviation score (wavelet-based) identified 38– Holt-Winters found more “new” anomalies
• Potential false positives• Reported the same anomaly multiple times
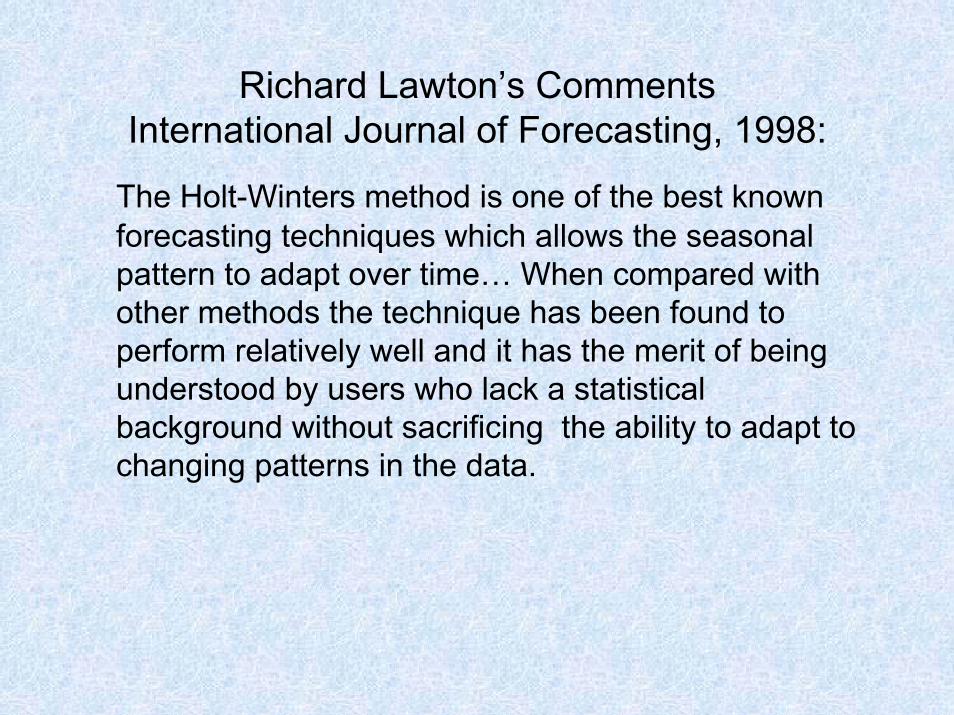
Richard Lawton’s CommentsInternational Journal of Forecasting, 1998:
The Holt-Winters method is one of the best known forecasting techniques which allows the seasonal pattern to adapt over time… When compared with other methods the technique has been found to perform relatively well and it has the merit of being understood by users who lack a statistical background without sacrificing the ability to adapt to changing patterns in the data.

Implementation and Deployment
• Implementation– algorithm is in RRDtool 1.1.x– supported by RRDtool front ends: Cricket & Torrus
• In limited deployment at MSN – network, security monitoring
• Aberrant Behavior Detection in Commercial Software – Arbor Peakflow DOS (Profiling)– Mercury Sitescope (Rolling baselines)

Technicians like ‘black box’
• Aberrant behavior detection not appropriate– Static data with random “blips” or “spikes”– Purely data driven has no outside context– Simple threshold is adequate
• Tuning algorithm parameters– Easy to understand ≠ Willing to use
• Tuning for each counter or group of counters is tedious– Results sensitive to tuning
• rate of adaptation: learning from “bad data”• Lag in detection vs. excluding data spikes
• Technicians like one size fits all• Mitigation
– Combine aberrant behavior with static thresholds– The ‘reset’ button
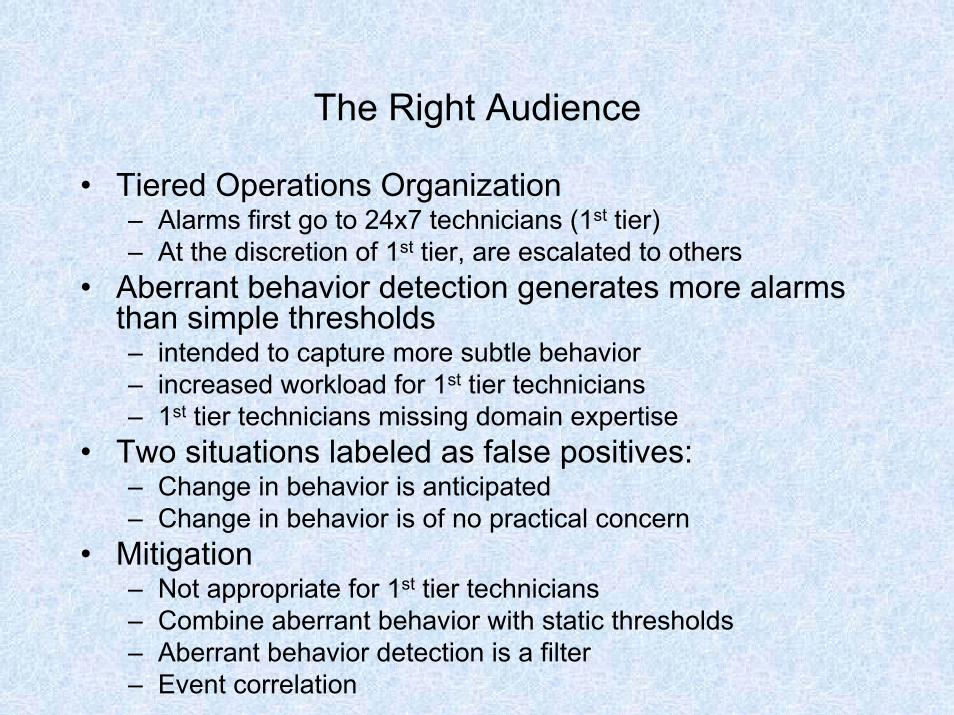
The Right Audience
• Tiered Operations Organization– Alarms first go to 24x7 technicians (1st tier)– At the discretion of 1st tier, are escalated to others
• Aberrant behavior detection generates more alarms than simple thresholds– intended to capture more subtle behavior– increased workload for 1st tier technicians– 1st tier technicians missing domain expertise
• Two situations labeled as false positives:– Change in behavior is anticipated– Change in behavior is of no practical concern
• Mitigation– Not appropriate for 1st tier technicians– Combine aberrant behavior with static thresholds– Aberrant behavior detection is a filter– Event correlation