abcsofgenomics - hematology ash education...
TRANSCRIPT

ABCs of genomics
Stefan K. Bohlander1
1Department of Molecular Medicine and Pathology, Faculty of Medical and Health Sciences, University of
Auckland, Auckland, New Zealand
Our genome, the 6 billion bp of DNA that contain the blueprint of a human being, has become the focus of intenseinterest in medicine in the past two decades. Two developments have contributed to this situation: (1) the genetic basisof more and more diseases has been discovered, especially of malignant diseases, and (2) at the same time, ourabilities to analyze our genome have increased exponentially through technological breakthroughs. We can expectgenomics to become ever more relevant for day-to-day treatment decisions and patient management. It is therefore ofgreat importance for physicians, especially those who are treating patients with malignant diseases, to become familiarwith our genome and the technologies that are currently available for genomics analysis. This review provides a briefoverview of the organization of our genome, high-throughput sequence analysis methods, and the analysis ofleukemia genomes using next-generation sequencing (NGS) technologies.
The human genomeThe haploid human genome contains � 3 billion bp of DNA,amounting to 6 billion bp in a diploid nucleus. The nuclear genomeis divided into 46 individual double-stranded DNA molecules,which are visible as chromosomes in metaphase cells. Even thoughalmost all of the complete euchromatic sequence of the humangenome has been known since 2001,1-3 we are still very far fromunderstanding the function of the majority of this sequence.
Only 1.5% of our genome, � 45 Mbp, codes for the proteinsequences of the classical genes (Figure 1A). There are � 22 000genes in the human genome, most of them coding for a protein.4
However, it has become apparent that there are also severalthousand genes that do not code for proteins, but in which thetranscribed and processed RNA itself has a function (eg, miRNAgenes, ribosomal RNA genes, and long intergenic noncodingRNAs).4 Some of these RNA genes have unexpected, novelfunctions, such as the recently described circular RNAs, whichregulate the activity of miRNAs.5
More than 98% of our genome does not code for proteins or is partof functional RNA molecules (Figure 1A). The average human genecodes for a protein of �370 amino acids in length that is composedof 7 exons that span � 3 kbp of genomic sequence.3 However, thereis a is a huge variation in the size of the proteins for which humangenes can code (from � 100 to � 26 000 amino acids), the numberof exons a gene has (1-364) and the genomic region a gene canoccupy (from � 1 kbp up to 2.2 Mbp; http://en.wikipedia.org/wiki/Human_genome). Up to 8% of our genome, excluding the 1.5% that isprotein coding, is highly conserved in evolution and/or containsimportant regulatory elements such as promoters, enhancers, and locuscontrol regions.4 Some genes are controlled by enhancer elements andlocus control regions that can be � 1 Mbp away from the gene.
A prevailing feature of the 90% of the human genome that does notconstitute protein coding regions or highly conserved regions is thepresence of repetitive elements. Repetitive elements can either occur asclusters of tandem repeats or as interspersed repeats. Overall, � 50% ofthe human genome can be assigned to repetitive elements (Figure 1A).We know very little about the function of the various repeat elements
and the noncoding, nonconserved unique DNA sequences in the humangenome. Great efforts are under way to decipher the function of this,sometimes referred to as “junk” DNA.4 The sheer abundance ofrepetitive elements and noncoding unique DNA sequences in ourgenome requires that we are aware of these elements when we embarkon analyzing changes in the genome that are relevant to hematopoieticmalignancies and cancer in general.
Because so little is known about the function of the majority of ourDNA sequences, rather than sequencing the complete genome, thetranscriptome and the exome have become the focus of interest whenanalyzing leukemia-associated genetic changes.
TranscriptomeThe transcriptome is defined as all of the RNA molecules that arepresent in a given cell at a given time.6 It is estimated that there are� 300 000 mRNA molecules in a cell. What is really contained in atranscriptome sequence is therefore very much context dependent: onthe cell type, the differentiation stage, and also on the way the RNA wasisolated and which sequencing library preparation protocols were used.Usually, only the polyadenylated mRNAs are isolated and sequenced.Of the � 22 000 genes in our genome, only � 6000 to 8000 areexpressed at significant levels in differentiated cells.6
ExomeThe exome is defined as the combined DNA sequence of all exonsof protein-coding and RNA genes in the genome. Even though thisdefinition appears to include almost the same sequences as thetranscriptome, there are important differences. The transcriptomecomprises all RNA molecules in a given cell (everything that istranscribed), so it varies from cell type to cell type. In contrast, theexome is identical for all cells of an organism. In practice, thesequences that are included in an exome will depend on the designof the specific exome capturing kit that is used. The capturedsequences usually comprise the sequences from the consensuscoding sequence (CCDS) database or an extended set of sequencessuch as the GENCODE exome target.7 On average, the target of anexome capturing kit is � 50 Mbp in size, or � 1.5% of the wholegenome.
GENOMICS IN HEMATOLOGY 101 FOR THE PRACTICING CLINICIAN
316 American Society of Hematology

Variability of the human genomeJust as every human being is an individual with unique character-istics and talents, so is his or her genome. All of our genomes are“individuals.” This fact has to be borne in mind when we try toidentify tumor-specific changes. The variation of the humangenome is apparent at all levels: from polymorphic single basepairs up to polymorphic chromosomal features that can be seen inthe light microscope.
Single nucleotide polymorphismsApproximately 1 in every 300 bases in our genome is found to bepolymorphic, with an alternative base present in � 1% of theindividuals in a population. These so-called single nucleotidepolymorphism (SNPs) are so frequent that any 2 individuals willdiffer at � 3 million SNP locations.8 Although most (� 99%) ofthese SNPs occur in noncoding regions, there is still a largenumber of SNPs that affect the coding portion of our genome,and both coding and noncoding SNPs can lead to alterations inthe function of proteins.9
Copy number variantsSNPs are easy to detect using sequencing, restriction fragmentlength polymorphism analyses, and several high-throughput ge-nome analysis tools. However, the variability of our genome is notconfined to a single nucleotide at a time. Our genome is not onlyhighly variable at length scales of a few nucleotides (1-5), but also atlength scales of several hundred to millions of base pairs. Thesecopy number variations (CNVs) are much more difficult to detectwith current methodologies.10 There is an overlap between very lowcopy number repeats (LCRs), also called segmental duplications,and CNVs. LCRs are often restricted to specific chromosomal
regions and can be a few thousand to several hundred thousand basepairs in length. LCRs are estimated to comprise � 5% of the humangenome. CNVs in the form of gene duplications can, for example,have important phenotypic consequences such as the increasednumber of amylase genes found in the genome of the bushmen insouthern Africa.11,12
Genome analysis methodsOur technical abilities to analyze the human genome have alsoshaped the way we perceive the genome and its diversity. Over thepast half century, increasingly more sophisticated and powerfulgenome analysis technologies have been developed. Two importantaspects of these technologies have to be considered: resolution andanalysis coverage (Figure 2A).
Cytogenetics and molecular cytogenetics andhigh-throughput array platformsThe most widely used and one of the oldest genome analysistechnologies is chromosomal analysis or cytogenetics. In theearly 1970s, with the invention of chromosome banding tech-niques,13 several breakthrough discoveries in the field of leuke-mia cytogenetics were made; for example, the discovery by JanetRowley that the t(9;22)(q34;q11) translocation is the cause of thePhiladelphia chromosome in chronic myeloid leukemia.14 Achromosomal analysis will visualize the whole genome at a lowresolution of � 0.5% to 1% of the genome (15-30 Mbp; Figure2A). To overcome some of the limitations in resolution andsample requirements of classical cytogenetics, molecular cytoge-netics techniques, especially FISH and comparative genomichybridization, were introduced in the 1990s.15 The utility andresolution of a FISH assay depends on the size of the fluores-cently labeled DNA probe used. Therefore, a conventional FISH
Figure 1. The human genome. (A) Organization of the human genome. Circles represent the approximate proportion of the various sequencecategories. Grey circle indicates the whole genome. (B) Gene model with exons, introns, and promoter and interspersed repetitive elements. Pink andred ovals indicate enhancer and promoter; dark blue large boxes, coding exons; light blue smaller boxes, 5� and 3� untranslated regions; and green andyellow arrows, SINEs and LINEs, respectively.
Hematology 2013 317

assay will only interrogate � 0.01% of the genome at aresolution of � 100 Kbp (Figure 2A).
To improve the genomic coverage of molecular cytogeneticstechniques, a large number of chip or array platforms have beendeveloped in the last decade; for example, bacterial artificial
chromosome comparative genomic hybridization, or oligonucleo-tide SNP arrays, which interrogate between 3000 and � 500 000individual genomic loci.16 Only the preselected loci on the chips canbe assayed. Therefore, novel SNPs and small indels cannot be“seen” on these platforms (Figure 2A).
Figure 2. Genome analysis methods. (A) Coverage and resolution. (B) Daily sequencing capacity per machine.
318 American Society of Hematology

SequencingDNA sequencing is the genome analysis method with the highestresolution available. However, until very recently, our DNAsequencing technology was only able to cover minuscule stretchesof the human genome in a single experiment.
Sanger sequencing. The first DNA sequencing technology thatallowed the reliable sequencing of more than a few dozen base pairsin a single experiment was the dideoxy chain termination methoddeveloped by Fred Sanger in the 1970s.17 A typical Sanger DNAsequencing experiment is able to “read” a sequence of � 1000 bp inlength, less than one-millionth of the human genome. The DNAfragments to be sequenced have to be cloned or PCR amplified, alabor-intensive process. For this and other reasons, Sanger sequenc-ing is quite an expensive method of sequencing, typically costingseveral dollars ($1-$10) per 1000 bp. This method was used tocomplete the sequencing of first human genome at a cost of morethan 3 billion dollars over a period of more than 10 years.1-3 It isquite apparent that Sanger sequencing can only be used economi-cally to analyze known mutational hotspots (Figure 2A).
NGS. Using sequencing to “explore” large genomic regions or evenentire human genomes for mutations in cancer and other geneticconditions was only made possible through the invention of NGStechnologies in the latter half of the last decade18,19 It was not untiljust 5 years ago that the NGS technologies had matured sufficientlyto allow the almost routine assembly-line sequencing of completegenomes8,20 (Figure 2B).
There are two features that enable the enormous sequence output ofall current NGS technologies: (1) a highly simplified workflow toproduce a library of clonally amplified DNA fragments that can bedirectly sequenced, and (2) an extremely high degree of sequencereaction parallelization, which goes hand in hand with the miniatur-ization of the individual sequencing reaction. In this process, thelength of the individual sequence read had to suffer and is, with 100to 200 bases, much shorter than the individual read length of� 1000 bases of a Sanger sequencing run.
At the moment, there is a fierce competition between different NGSplatforms. The mostly widely used NGS platforms are: Roche 454,Illumina, ABI solid, and Ion Torrent, with the Illumina platformcurrently contributing most of the NGS data worldwide. However,considering the dynamics of the field, this could change rapidly.
For example, currently the Illumina sequencing machine with thehighest capacity (HiSeq 2500) is capable of generating �600 Gbpof sequences in a single 11-day run.21 The output of such a run iscomposed of 6 billion 100-bp-long single reads. This is equivalentto 100 diploid human genomes or to 64 human exomes at 50 to100 � coverage each. The estimated cost for the sequencingreactions only for a human exome at 50 to 100 � coverage will beless than $450 on such a machine, excluding the cost for the librarypreparation and exome enrichment.
Analysis of cancer genomes using NGSAlthough it is relatively affordable now to generate the amount ofsequence data that is required to cover an exome or a whole genomeat sufficient depth, the process of extracting useful information fromthis sequence is still a great challenge (Figure 2B). In the followingparagraphs, I give a broad overview of this process using exomesequencing of a leukemia sample on the Illumina platform as anexample.
Sample preparation and exome capturingOne of the most common strategies in the field of cancer genomicsis currently the complete sequencing of the exome (whole exomesequencing [WES]).22 For WES, a sequencing library is preparedfrom genomic DNA (Figure 3A) and the 1% to 2% of the fragmentsthat represent the exons are captured with oligonucleotide probes(Figure 3A). Exome capturing kits became commercially available� 3 to 4 years ago. Usually, an exome capturing kit has a targetregion of 50 Mbp.7 The library construction and exome capturingcan be completed in 2 to 4 days. The sequencing takes place in amicroscope slide-sized device, the flow cell. In the newest ma-chines, up to 1.5 billion fragments can be sequenced in parallel in asingle flow cell. Usually, 100 bases are sequenced from either sideof the fragments in a so-called paired-end run. Typically, 5 to 10gigabases of primary sequence are generated from a single exomelibrary, which corresponds to between 25 and 50 million sequencedfragments. This results in a 100- to 200-fold average coverage ofevery single base in the exome. Although this might appear to bemore than should be necessary to discover mutations, it should benoted that the sequence reads are not distributed evenly across allexons and all genes. Even at a 100-fold average coverage, � 10% ofthe exome will be covered with � 10 reads per base, which makesmutation detection less reliable in these regions.
Analysis strategiesLow level analysis. Once the sequence of an exome is available,the next challenge is to extract useful information from this massiveamount of data. The first step in the analysis process is to align themillions of reads to a reference genome (Figure 4). This alignmentstep requires special algorithms (eg, Burrows-Wheeler aligners suchas bowtie or bwa) because the familiar BLAST (basic localalignment search tool) searches are too computationally intensivefor aligning so many sequences.23 Once alignment files (which canbe 100 or more gigabytes in size per exome) have been generated,24
the alignments can be visualized with software tools such as the
Figure 3. Whole exome sequencing. (A) NGS library construction andexome capturing. Grey indicates DNA; blue, exons; and green and red,sequencing adaptors. (B) Alignment of reads to genome after exomecapturing and sequencing. Red dot in sequencing read indicates amismatch to reference sequence.
Hematology 2013 319
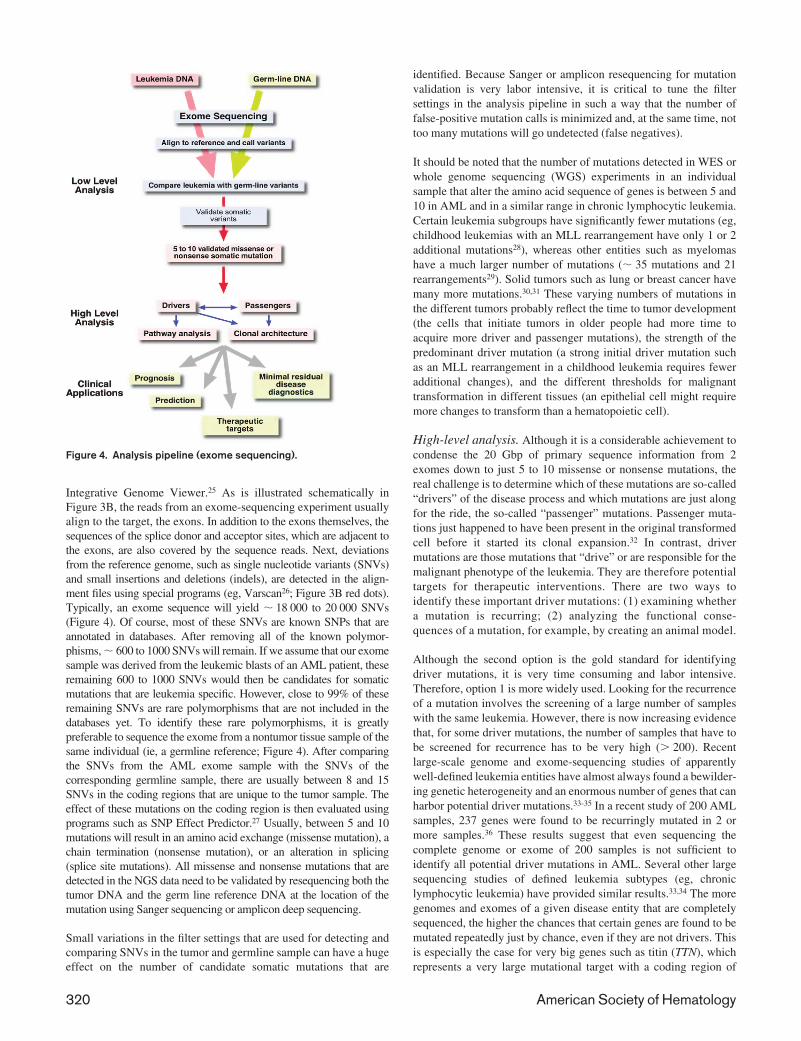
Integrative Genome Viewer.25 As is illustrated schematically inFigure 3B, the reads from an exome-sequencing experiment usuallyalign to the target, the exons. In addition to the exons themselves, thesequences of the splice donor and acceptor sites, which are adjacent tothe exons, are also covered by the sequence reads. Next, deviationsfrom the reference genome, such as single nucleotide variants (SNVs)and small insertions and deletions (indels), are detected in the align-ment files using special programs (eg, Varscan26; Figure 3B red dots).Typically, an exome sequence will yield � 18 000 to 20 000 SNVs(Figure 4). Of course, most of these SNVs are known SNPs that areannotated in databases. After removing all of the known polymor-phisms, � 600 to 1000 SNVs will remain. If we assume that our exomesample was derived from the leukemic blasts of an AML patient, theseremaining 600 to 1000 SNVs would then be candidates for somaticmutations that are leukemia specific. However, close to 99% of theseremaining SNVs are rare polymorphisms that are not included in thedatabases yet. To identify these rare polymorphisms, it is greatlypreferable to sequence the exome from a nontumor tissue sample of thesame individual (ie, a germline reference; Figure 4). After comparingthe SNVs from the AML exome sample with the SNVs of thecorresponding germline sample, there are usually between 8 and 15SNVs in the coding regions that are unique to the tumor sample. Theeffect of these mutations on the coding region is then evaluated usingprograms such as SNP Effect Predictor.27 Usually, between 5 and 10mutations will result in an amino acid exchange (missense mutation), achain termination (nonsense mutation), or an alteration in splicing(splice site mutations). All missense and nonsense mutations that aredetected in the NGS data need to be validated by resequencing both thetumor DNA and the germ line reference DNA at the location of themutation using Sanger sequencing or amplicon deep sequencing.
Small variations in the filter settings that are used for detecting andcomparing SNVs in the tumor and germline sample can have a hugeeffect on the number of candidate somatic mutations that are
identified. Because Sanger or amplicon resequencing for mutationvalidation is very labor intensive, it is critical to tune the filtersettings in the analysis pipeline in such a way that the number offalse-positive mutation calls is minimized and, at the same time, nottoo many mutations will go undetected (false negatives).
It should be noted that the number of mutations detected in WES orwhole genome sequencing (WGS) experiments in an individualsample that alter the amino acid sequence of genes is between 5 and10 in AML and in a similar range in chronic lymphocytic leukemia.Certain leukemia subgroups have significantly fewer mutations (eg,childhood leukemias with an MLL rearrangement have only 1 or 2additional mutations28), whereas other entities such as myelomashave a much larger number of mutations (� 35 mutations and 21rearrangements29). Solid tumors such as lung or breast cancer havemany more mutations.30,31 These varying numbers of mutations inthe different tumors probably reflect the time to tumor development(the cells that initiate tumors in older people had more time toacquire more driver and passenger mutations), the strength of thepredominant driver mutation (a strong initial driver mutation suchas an MLL rearrangement in a childhood leukemia requires feweradditional changes), and the different thresholds for malignanttransformation in different tissues (an epithelial cell might requiremore changes to transform than a hematopoietic cell).
High-level analysis. Although it is a considerable achievement tocondense the 20 Gbp of primary sequence information from 2exomes down to just 5 to 10 missense or nonsense mutations, thereal challenge is to determine which of these mutations are so-called“drivers” of the disease process and which mutations are just alongfor the ride, the so-called “passenger” mutations. Passenger muta-tions just happened to have been present in the original transformedcell before it started its clonal expansion.32 In contrast, drivermutations are those mutations that “drive” or are responsible for themalignant phenotype of the leukemia. They are therefore potentialtargets for therapeutic interventions. There are two ways toidentify these important driver mutations: (1) examining whethera mutation is recurring; (2) analyzing the functional conse-quences of a mutation, for example, by creating an animal model.
Although the second option is the gold standard for identifyingdriver mutations, it is very time consuming and labor intensive.Therefore, option 1 is more widely used. Looking for the recurrenceof a mutation involves the screening of a large number of sampleswith the same leukemia. However, there is now increasing evidencethat, for some driver mutations, the number of samples that have tobe screened for recurrence has to be very high (� 200). Recentlarge-scale genome and exome-sequencing studies of apparentlywell-defined leukemia entities have almost always found a bewilder-ing genetic heterogeneity and an enormous number of genes that canharbor potential driver mutations.33-35 In a recent study of 200 AMLsamples, 237 genes were found to be recurringly mutated in 2 ormore samples.36 These results suggest that even sequencing thecomplete genome or exome of 200 samples is not sufficient toidentify all potential driver mutations in AML. Several other largesequencing studies of defined leukemia subtypes (eg, chroniclymphocytic leukemia) have provided similar results.33,34 The moregenomes and exomes of a given disease entity that are completelysequenced, the higher the chances that certain genes are found to bemutated repeatedly just by chance, even if they are not drivers. Thisis especially the case for very big genes such as titin (TTN), whichrepresents a very large mutational target with a coding region of
Figure 4. Analysis pipeline (exome sequencing).
320 American Society of Hematology

� 100 kbp. Therefore, recurrence of mutations in a gene does notnecessarily allow the conclusion that these mutations are drivers.
To explore the functional significance of a putative driver mutation,it will become necessary to establish an animal or cell line model.However, even a negative result for a given mutation will not allowthe conclusion that this mutation is not a driver mutation. It isbecoming more and more apparent that a single driver mutationwill, in most cases, not be sufficient to initiate leukemia on its own,but rather that the concerted action of several driver mutations is thebasis of most leukemias. Modeling the interplay of several drivermutations is extremely difficult and time consuming with thetechnologies that are currently at our disposal. We already haveevidence that certain driver mutations are dependent on each otherand presumably synergize. For example, normal karyotype AMLwith a biallelic mutation of the CEBPA gene has very specific zincfinger 1 mutations in the transcription factor GATA2.37
Clinical applicationsOf course, what we would really like to know is which mutationshave an impact on the clinical course of the disease (prognosticsignificance) and which mutations should guide our treatmentdecision (predictive significance). Ideally, we would also like toidentify mutations that are targetable for therapeutic interventions.The development of algorithms and expert systems that are able toprovide this kind of information to the physician after the analysis ofNGS data is still in its infancy. For example, it will becomenecessary to group the many potential driver mutations accordingto cellular pathways and to predict which drugs might be mostsuitable for treatment (Figure 4).
WES versus WGSIn the above description of analysis of cancer genomes using NGS,we mainly focused on the information that can be derived fromWES experiments. In a WES experiment, one will find missense andnonsense mutations in the coding region, as well as splice sitemutations. However, we need to be aware of the fact that the exomeconstitutes just 1.5% of the genome, albeit the portion of thegenome we understand best and that which appears to be the mostimportant functionally. In WGS projects, many more somaticaberrations (� 60 times more) can be identified in tumor samples,including not only point mutations and small indels, but also largergenomic rearrangements such as chromosomal translocations, dele-tions, and duplications.38 However, for practical purposes, atpresent, only the 1.3% of WGS mutations that affect coding regions,splice sites or certain large genomic rearrangements are consideredto be potential drivers and are studied in more detail. Approximately8% to 9% of the somatic aberrations detected by WGS affectconserved or regulatory genomic elements. Occasionally, suchmutations have been shown to constitute driver mutations.39 How-ever, because our knowledge of the exact function of conservedregions and regulatory elements is very limited, we have a verylimited capacity to predict or evaluate the functional consequencesof these mutations. Close to 90% of the somatic mutations detectedby WGS of tumor samples affect nonconserved single copysequences or repetitive elements. Therefore, although WGS doesdetect more somatic aberrations than WES in a tumor sample,almost all of these additional aberrations are of unknown signifi-cance and can presently not be interpreted properly. It should benoted, however, that one very important class of aberrations,chromosomal translocations, can be detected by WGS but not byWES.
Transcriptome sequencingSequencing the transcriptome of a malignant cell can provide veryvaluable insights and additional information that can also be usefulfor the interpretation of WGS or WES data. For example, chromo-somal translocations that result in the formation of fusion genes canbe identified by transcriptome sequencing. In addition, a transcrip-tome sequence will also provide a “digital” expression profile,which might point to genes that are overexpressed due to atranslocation or a mutation affecting a regulatory element. Con-versely, mutations present in genes that are expressed at low levelsmight be overlooked if only the transcriptome of a leukemia issequenced and the coverage in these genes is not adequate.40
Gene panel sequencingAn alternative to WGS or WES is the deep sequencing of a panel ofgenes that is known to be recurringly mutated and have prognosticor predictive significance in a given cancer. Custom gene panelshave the advantage of allowing high read depths of the genesincluded in the panel. The disadvantages are the relatively highinitial costs in designing a custom gene panel, the fact that addingadditional genes to the panel is cumbersome and expensive, and thatone is restricted to analyzing the genes in the panel. Certain types ofaberrations such as deletions and larger rearrangements cannotreadily be detected by a gene panel. When one is considering genepanel sequencing, one also has to keep in mind that the number ofpotential mutational target genes in most malignancies is very largeand still not completely known.
Clonal architecture of leukemiaNGS has also given us a unique insight into the often complicatedclonal architecture of leukemias. These analyses showed, forexample, that minor clones that were already present at diagnosiscan expand after chemotherapy and lead to a relapse.41
Limitations of NGSIt is important to understand that even though NGS is producing anenormous amount of data in a single experiment, we will only findthe “pearls” in this vast sea of data if we know exactly what we arelooking for and if we understand how the sequence was generated.Therefore, the 10 gigabases of exome sequence from a leukemiapatient will not allow us to detect a t(8;21)(q22;q22) translocation,whereas a WGS or transcriptome sequencing experiment woulddetect such a rearrangement. Even in the complete genome se-quence of a tumor, we will not recognize the importance of certainmutations in the noncoding portion of the genome simply becausewe do not understand the function of 98% of our genome sequence.
Ethical considerations and future directionsThe introduction of NGS methodologies into routine tumor diagnos-tics will also require that several logistical and ethical issues areaddressed. NGS will generate massive amounts of data that have tobe stored securely to prevent breaches of patient privacy42 and, atthe same time, a global data-sharing infrastructure has to be put intoplace that respects patient privacy and still allows a global dataexchange on genotype phenotype correlations. In addition, ethicallycorrect procedures (ie, appropriate consent forms and guidelines)have to be developed to adequately address incidental findings thatare bound to occur (eg, what should be done if a BRCA1 germlinemutation is found in the course of WES of a leukemia sample?).43
Even though the more than exponential increases in the daily outputof sequencing machines has slowed a little in the past year, we have
Hematology 2013 321

now reached a point where a human genome and certainly severalexomes can be sequenced in a few hours (Figure 2B). With thisenormous sequencing capacity available at a reasonable cost, wewill see many new applications of NGS, such as in minimal residualdisease diagnostics to accurately monitor disease burden and NGSas a partial replacement of more traditional genome analysismethods such as cytogenetics and SNP arrays.
DisclosuresConflict-of-interest disclosure: The author declares no competingfinancial interests. Off-label drug use: None disclosed.
CorrespondenceStefan K. Bohlander, Department of Molecular Medicine andPathology, Faculty of Medical and Health Sciences, University ofAuckland, 85 Park Road, Grafton, Private Bag 92019, Auckland1142, New Zealand; Phone: �64-9-923-8348; Fax: �64-9-367-7121; e-mail: [email protected].
References1. Lander ES, Linton LM, Birren B, et al. Initial sequencing and analysis
of the human genome. Nature. 2001;409(6822):860-921.2. Venter JC, Adams MD, Myers EW, et al. The sequence of the
human genome. Science. 2001;291(5507):1304-1351.3. International Human Genome Sequencing Consortium. Finish-
ing the euchromatic sequence of the human genome. Nature.2004;431:931-945.
4. ENCODE Project Consortium, Bernstein BE, Birney E, Dun-ham I, Green ED, Gunter C, Snyder M. An integrated encyclo-pedia of DNA elements in the human genome. Nature. 2012;489(7414):57-74.
5. Hansen TB, Jensen TI, Clausen BH, et al. Natural RNA circlesfunction as efficient microRNA sponges. Nature. 2013;495(7441):384-388.
6. Mortazavi A, Williams BA, McCue K, Schaeffer L, Wold B.Mapping and quantifying mammalian transcriptomes by RNA-Seq. Nat Methods. 2008;5(7):621-628.
7. Coffey AJ, Kokocinski F, Calafato MS, et al. The GENCODEexome: sequencing the complete human exome. Eur J HumGenet. 2011;19(7):827-831.
8. Wheeler DA, Srinivasan M, Egholm M, et al. The completegenome of an individual by massively parallel DNA sequenc-ing. Nature. 2008;452(7189):872-876.
9. Fu W, O’Connor TD, Jun G, et al. Analysis of 6,515 exomesreveals the recent origin of most human protein-coding vari-ants. Nature. 2013;493(7431):216-220.
10. Scherer SW, Lee C, Birney E, et al. Challenges and standards inintegrating surveys of structural variation. Nat Genet. 2007;39(7):S7-15.
11. Schuster SC, Miller W, Ratan A, et al. Complete Khoisan andBantu genomes from southern Africa. Nature. 2010;463(7283):943-947.
12. Perry GH, Dominy NJ, Claw KG, et al. Diet and the evolutionof human amylase gene copy number variation. Nat Genet.2007;39(10):1256-1260.
13. Caspersson T, Farber S, Foley GE, et al. Chemical differentiationalong metaphase chromosomes. Exp Cell Res. 1968;49(1):219-222.
14. Rowley JD. Letter: A new consistent chromosomal abnormality inchronic myelogenous leukaemia identified by quinacrine fluores-cence and Giemsa staining. Nature. 1973;243(5405):290-293.
15. Lichter P, Tang CJ, Call K, et al. High-resolution mapping ofhuman chromosome 11 by in situ hybridization with cosmidclones. Science. 1990;247(4938):64-69.
16. Maciejewski JP, Mufti GJ. Whole genome scanning as acytogenetic tool in hematologic malignancies. Blood. 2008;112(4):965-974.
17. Sanger F, Nicklen S, Coulson AR. DNA sequencing withchain-terminating inhibitors. Proc Natl Acad Sci U S A.1977;74(12):5463-5467.
18. Margulies M, Egholm M, Altman WE, et al. Genome sequenc-ing in microfabricated high-density picolitre reactors. Nature.2005;437(7057):376-380.
19. Bennett ST, Barnes C, Cox A, Davies L, Brown C. Toward the1,000 dollars human genome. Pharmacogenomics. 2005;6(4):373-382.
20. Bentley DR, Balasubramanian S, Swerdlow HP, et al. Accuratewhole human genome sequencing using reversible terminatorchemistry. Nature. 2008;456(7218):53-59.
21. Illumina HiSeq 2500 Specifications web page. Available from:http://www.illumina.com/systems/hiseq_2500_1500/performance_specifications.ilmn. Accessed April 25, 2013.
22. Parla JS, Iossifov I, Grabill I, Spector MS, Kramer M,McCombie WR. A comparative analysis of exome capture.Genome Biol. 2011;12(9):R97.
23. Li H, Durbin R. Fast and accurate short read alignment withBurrows-Wheeler transform. Bioinformatics. 2009;25(14):1754-1760.
24. Li H, Handsaker B, Wysoker A, et al. The Sequence Alignment/Map format and SAMtools. Bioinformatics. 2009;25(16):2078-2079.
25. Robinson JT, Thorvaldsdottir H, Winckler W, et al. Integrativegenomics viewer. Nat Biotechnol. 2011;29(1):24-26.
26. Koboldt DC, Chen K, Wylie T, et al. VarScan: variant detectionin massively parallel sequencing of individual and pooledsamples. Bioinformatics. 2009;25(17):2283-2285.
27. Cingolani P, Platts A, Wang le L, et al. A program forannotating and predicting the effects of single nucleotidepolymorphisms, SnpEff: SNPs in the genome of Drosophilamelanogaster strain w1118; iso-2; iso-3. Fly (Austin). 2012;6(2):80-92.
28. Andersson AK, Ma J, Wang J, et al. Whole genome sequenceanalysis of 22 MLL rearranged infant acute lymphoblasticleukemias reveals remarkably few somatic mutations: a reportfrom the St Jude Children’s Research Hospital-WashingtonUniversity Pediatric Cancer Genome Project [abstract]. Blood(ASH Annual Meeting Abstracts). 2011;118(21):69.
29. Chapman MA, Lawrence MS, Keats JJ, et al. Initial genomesequencing and analysis of multiple myeloma. Nature. 2011;471(7339):467-472.
30. Pleasance ED, Stephens PJ, O’Meara S, et al. A small-cell lungcancer genome with complex signatures of tobacco exposure.Nature. 2010;463(7278):184-190.
31. Stephens PJ, Tarpey PS, Davies H, et al. The landscape ofcancer genes and mutational processes in breast cancer. Nature.2012;486(7403):400-404.
32. Welch JS, Ley TJ, Link DC, et al. The origin and evolution ofmutations in acute myeloid leukemia. Cell. 2012;150(2):264-278.
33. Puente XS, Pinyol M, Quesada V, et al. Whole-genomesequencing identifies recurrent mutations in chronic lympho-cytic leukaemia. Nature. 2011;475(7354):101-105.
34. Quesada V, Conde L, Villamor N, et al. Exome sequencingidentifies recurrent mutations of the splicing factor SF3B1 gene inchronic lymphocytic leukemia. Nat Genet. 2012;44(1):47-52.
35. Zhang J, Ding L, Holmfeldt L, et al. The genetic basis of earlyT-cell precursor acute lymphoblastic leukaemia. Nature. 2012;481(7380):157-163.
322 American Society of Hematology

36. Cancer Genome Atlas Research Network. Genomic and epig-enomic landscapes of adult de novo acute myeloid leukemia.N Engl J Med. 2013;368(22):2059-2074.
37. Greif PA, Dufour A, Konstandin NP, et al. GATA2 zinc finger1 mutations associated with biallelic CEBPA mutations define aunique genetic entity of acute myeloid leukemia. Blood.2012;120(2):395-403.
38. Mardis ER, Ding L, Dooling DJ, et al. Recurring mutationsfound by sequencing an acute myeloid leukemia genome.N Engl J Med. 2009;361(11):1058-1066.
39. Horn S, Figl A, Rachakonda PS, et al. TERT promotermutations in familial and sporadic melanoma. Science. 2013;339(6122):959-961.
40. Greif PA, Eck SH, Konstandin NP, et al. Identification ofrecurring tumor-specific somatic mutations in acute myeloidleukemia by transcriptome sequencing. Leukemia. 2011;25(5):821-827.
41. Ding L, Ley TJ, Larson DE, et al. Clonal evolution in relapsedacute myeloid leukaemia revealed by whole-genome sequenc-ing. Nature. 2012;481(7382):506-510.
42. Gymrek M, McGuire AL, Golan D, Halperin E, Erlich Y.Identifying personal genomes by surname inference. Science.2013;339(6117):321-324.
43. Green RC, Berg JS, Grody WW, et al. ACMG recommenda-tions for reporting of incidental findings in clinical exome andgenome sequencing. Genet Med. 2013;15(7):565-574.
Hematology 2013 323