abcde - keysight€¦ · chapter 1 ho w and when to calibrate y our ... sp ectrum analyzer...
TRANSCRIPT
User's Guide
HP 8572A EMI Receiver
ABCDE
HP Part No. 08572-90003
Printed in USA April 1992

Notice
The information contained in this document is subject to changewithout notice.
Hewlett-Packard makes no warranty of any kind with regard to thismaterial, including, but not limited to, the implied warranties ofmerchantability and �tness for a particular purpose. Hewlett-Packardshall not be liable for errors contained herein or for incidentalor consequential damages in connection with the furnishing,performance, or use of this material.
Restricted Rights Legend.
Use, duplication, or disclosure by the U.S. Government is subject torestrictions as set forth in subparagraph (c) (1) (ii) of the Rightsin Technical Data and Computer Software clause at DFARS252.227-7013 for DOD agencies, and subparagraphs (c) (1) and (c)(2) of the Commercial Computer Software Restricted Rights clause atFAR 52.227-19 for other agencies.
c Copyright Hewlett-Packard Company 1992
All Rights Reserved. Reproduction, adaptation, or translationwithout prior written permission is prohibited, except as allowedunder the copyright laws.1400 Fountain Grove Parkway, Santa Rosa, CA 95403-1799, USA
Certification Hewlett-Packard Company certi�es that this product met itspublished speci�cations at the time of shipment from the factory.Hewlett-Packard further certi�es that its calibration measurementsare traceable to the United States National Institute of Standardsand Technology, to the extent allowed by the Institute's calibrationfacility, and to the calibration facilities of other InternationalStandards Organization members.
Warranty This Hewlett-Packard instrument product is warranted againstdefects in material and workmanship for a period of one year fromdate of shipment. During the warranty period, Hewlett-PackardCompany will, at its option, either repair or replace products whichprove to be defective.
For warranty service or repair, this product must be returned to aservice facility designated by Hewlett-Packard. Buyer shall prepayshipping charges to Hewlett-Packard and Hewlett-Packard shall payshipping charges to return the product to Buyer. However, Buyershall pay all shipping charges, duties, and taxes for products returnedto Hewlett-Packard from another country.
Hewlett-Packard warrants that its software and �rmware designatedby Hewlett-Packard for use with an instrument will executeits programming instructions when properly installed on thatinstrument. Hewlett-Packard does not warrant that the operationof the instrument, or software, or �rmware will be uninterrupted orerror-free.
Limitation of Warranty
The foregoing warranty shall not apply to defects resulting fromimproper or inadequate maintenance by Buyer, Buyer-suppliedsoftware or interfacing, unauthorized modi�cation or misuse,operation outside of the environmental speci�cations for theproduct, or improper site preparation or maintenance.
NO OTHER WARRANTY IS EXPRESSED OR IMPLIED.HEWLETT-PACKARD SPECIFICALLY DISCLAIMS THEIMPLIED WARRANTIES OF MERCHANTABILITY ANDFITNESS FOR A PARTICULAR PURPOSE.
Exclusive Remedies
THE REMEDIES PROVIDED HEREIN ARE BUYER'S SOLEAND EXCLUSIVE REMEDIES. HEWLETT-PACKARD SHALLNOT BE LIABLE FOR ANY DIRECT, INDIRECT, SPECIAL,INCIDENTAL, OR CONSEQUENTIAL DAMAGES, WHETHERBASED ON CONTRACT, TORT, OR ANY OTHER LEGALTHEORY.
iii

Assistance Product maintenance agreements and other customer assistanceagreements are available for Hewlett-Packard products.
For any assistance, contact your nearest Hewlett-Packard Sales andService O�ce.
iv
Safety Symbols The following safety symbols are used throughout this manual.Familiarize yourself with each of the symbols and its meaning beforeoperating this instrument.
CAUTION The CAUTION sign denotes a hazard. It calls attention to aprocedure which, if not correctly performed or adhered to, couldresult in damage to or destruction of the product or the user'swork. Do not proceed beyond a CAUTION sign until the indicatedconditions are fully understood and met.
WARNING The WARNING sign denotes a hazard. It calls attention to a
procedure which, if not correctly performed or adhered to, could result
in injury to the user. Do not proceed beyond a WARNING sign until
the indicated conditions are fully understood and met.
DANGER The DANGER sign denotes an imminent hazard to people. It warns
the reader of a procedure which, if not correctly performed or adhered
to, could result in injury or loss of life. Do not proceed beyond a
DANGER sign until the indicated conditions are fully understood and
met.
v

General Safety Considerations
WARNING The instructions in this document are for use by qualified personnel
only. To avoid electrical shock, do not perform any servicing unless
you are qualified to do so.
The opening of covers or removal of parts is likely to expose
dangerous voltages. Disconnect the instrument from all voltage
sources while it is being opened.
The power cord is connected to internal capacitors that may remain
live for five seconds after disconnecting the plug from its power
supply.
This is a Safety Class 1 Product (provided with a protective earthing
ground incorporated in the power cord). The mains plug shall only
be inserted in a socket outlet provided with a protective earth
contact. Any interruption of the protective conductor inside or
outside of the instrument is likely to make the instrument dangerous.
Intentional interruption is prohibited.
For continued protection against fire hazard, replace fuse only with
same type and ratings, (type nA/nV). The use of other fuses or
materials is prohibited.
WARNING Before this instrument is switched on, make sure it has been
properly grounded through the protective conductor of the ac power
cable to a socket outlet provided with protective earth contact.
Any interruption of the protective (grounding) conductor, inside or
outside the instrument, or disconnection of the protective earth
terminal can result in personal injury.
Before this instrument is switched on, make sure its primary power
circuitry has been adapted to the voltage of the ac power source.
Failure to set the ac power input to the correct voltage could cause
damage to the instrument when the ac power cable is plugged in.
vi
In This Book . . .
Chapter 1 How and when to calibrate yourEMI receiver system.
Chapter 2 How to perform operation veri�cation.
Chapter 3 How to set up your test equipment for operationveri�cation.
Chapter 4 How to make typical measurements with yourEMI receiver system.
Chapter 5 How to make measurements with downloadableprograms.
vii

Contents
1. Calibrating Your ReceiverWhen to Calibrate Your Receiver . . . . . . . . . 1-2Calibrating Receiver INPUT 1 and INPUT 2 . . . 1-3Calibrating Receiver INPUT 3 . . . . . . . . . . 1-5Preselector Peaking for Receiver INPUT 3 . . . . . 1-7Correcting Receiver INPUT 3 Using a Calibration
Table . . . . . . . . . . . . . . . . . . . 1-8Manual Measurements Using Receiver INPUT 3 . 1-11Automated Measurements Using Receiver INPUT 3 1-12
Spectrum Analyzer Corrected Mode . . . . . . . 1-14
2. Operation Veri�cationStep 1. Set up the hardware for operation veri�cation
testing . . . . . . . . . . . . . . . . . . . 2-2Step 2. Load the software . . . . . . . . . . . . 2-3Step 3. Select the EMI receiver system model . . . 2-5Step 4. Enter the EMI receiver system test information 2-6Step 5. Choose the output destination for your test
results . . . . . . . . . . . . . . . . . . . 2-7Step 6. Select \Test all model numbers" . . . . . . 2-8Step 7. Select equipment from the UUT Con�guration
menu . . . . . . . . . . . . . . . . . . . 2-9Step 8. Assign serial numbers to all equipment . . . 2-10Step 9. Verify the test equipment . . . . . . . . . 2-11Step 10. Con�rm the list of accessories . . . . . . 2-12Step 11. Run the operation veri�cation tests . . . . 2-13Optional: Installing the software on an SRM or HFS
hard disk . . . . . . . . . . . . . . . . . . 2-15Optional: Assigning the address type . . . . . . . 2-16Optional: Selecting the EMI receiver system address 2-17Optional: Adding option 049 . . . . . . . . . . . 2-18Optional: Modifying the temperature setting . . . 2-19Optional: Modifying the humidity setting . . . . . 2-20Optional: Selecting the line frequency . . . . . . . 2-21Optional: Changing the default equipment . . . . . 2-22Optional: Entering power sensor calibration factors . 2-26
HP 8572A EMI Receiver User's Guide Contents-1
3. Test DescriptionsCalibrator Amplitude Accuracy . . . . . . . . . 3-2Log Fidelity . . . . . . . . . . . . . . . . . . 3-5Linear Fidelity . . . . . . . . . . . . . . . . . 3-7Reference Level Switching Uncertainty . . . . . . 3-9Receiver Calibration INPUT 1 . . . . . . . . . . 3-12Amplitude Accy. INPUT 1 (10 dB AT and 0 dB AT),
20 Hz-9 kHz . . . . . . . . . . . . . . . . 3-15Amplitude Accy. INPUT 1 (10 dB AT and 0 dB AT) 3-17Disp. Average Noise INPUT 1 . . . . . . . . . . 3-19Sensitivity INPUT 1, 20 Hz to 9 kHz . . . . . . . 3-21Residual Responses INPUT 1 . . . . . . . . . . 3-23Bandwidth Accuracy . . . . . . . . . . . . . . 3-25Pulse Response . . . . . . . . . . . . . . . . . 3-28Calibration INPUT 2 . . . . . . . . . . . . . . 3-33Amplitude Accy. INPUT 2 (10 dB AT and 0 dB AT) 3-36Disp. Average Noise INPUT 2 . . . . . . . . . . 3-39Residual Responses INPUT 2 . . . . . . . . . . 3-41Amplitude Accy. INPUT 3 . . . . . . . . . . . 3-43Disp. Average Noise INPUT 3, 10 Hz RBW . . . . 3-48Residual Responses INPUT 3 . . . . . . . . . . 3-50
4. Making Typical MeasurementsTesting for Overload . . . . . . . . . . . . . . 4-13 dB Linearity Check . . . . . . . . . . . . . 4-2
Narrowband/Broadband Signals . . . . . . . . . 4-2Commercial Compliance Measurements . . . . . . 4-5Detector Selection . . . . . . . . . . . . . . 4-5Measurement Examples . . . . . . . . . . . . 4-9
CE03 (MIL-STD) Measurement . . . . . . . . . 4-23RE02 (MIL-STD) Measurement . . . . . . . . . 4-26CISPR 22 Measurements . . . . . . . . . . . . 4-28
5. Downloadable Program (DLP) MeasurementsExample: Quasi-peak measurements on broadband
signals, using a DLP . . . . . . . . . . . . . 5-1
Index
Contents-2 HP 8572A EMI Receiver User's Guide
Figures
1-1. Sample Calibration Table . . . . . . . . . . . 1-91-2. Calibration Data Graph . . . . . . . . . . . . 1-134-1. Testing for Overload . . . . . . . . . . . . . 4-14-2. Narrowband Spectrum . . . . . . . . . . . . 4-24-3. Broadband Spectrum . . . . . . . . . . . . . 4-34-4. Methods for Narrowband and Broadband Analysis 4-44-5. Signal Detection and Processing . . . . . . . . 4-64-6. Average Detection Using Video Filtering . . . . 4-74-7. Quasi-Peak Detection . . . . . . . . . . . . . 4-84-8. Quasi-Peak Detector Output . . . . . . . . . . 4-94-9. Peak Measurement of a CW Signal . . . . . . . 4-124-10. Peak Measurement of a Broadband Signal . . . . 4-144-11. Quasi-Peak Measurement of a CW Signal . . . . 4-184-12. Quasi-Peak Measurement of a Broadband Signal . 4-204-13. Composite Signal . . . . . . . . . . . . . . . 4-214-14. Average Measurement . . . . . . . . . . . . . 4-234-15. CE03 Power Lead Test Setup (Air Force and Navy) 4-244-16. Current Probes as Transducers . . . . . . . . . 4-254-17. Bandwidth Correction Factor . . . . . . . . . 4-264-18. RE02 Test Setup . . . . . . . . . . . . . . . 4-274-19. Characteristic Appearance of Radiated Emissions . 4-304-20. Equipment Under Test (EUT) Turned O� . . . . 4-305-1. Quasi-Peak Measurement Using the HP 85867A DLP 5-3
Tables
1-1. Frequency Bands . . . . . . . . . . . . . . . 1-71-2. receiver INPUT 3 Frequency Bands . . . . . . . 1-102-1. Test Equipment . . . . . . . . . . . . . . . 2-232-2. Test Equipment Variable Names . . . . . . . . 2-24
HP 8572A EMI Receiver User's Guide Contents-3

1
Calibrating Your Receiver
In this chapter, you'll learn how and when to calibrate yourHP 8572A microwave EMI receiver:
how often to calibrate your receiver
how to calibrate receiver INPUT 1 and receiver INPUT 2
how to calibrate receiver INPUT 3
how to perform preselector peaking for receiver INPUT 3
how use a calibration table to calibrate receiver INPUT 3
how to perform manual and automated measurements
HP 8572A EMI Receiver User's Guide Calibrating Your Receiver 1-1

When to Calibrate Your Receiver
Note To meet speci�ed absolute amplitude accuracy, your receiver mustbe calibrated. For accurate calibration, ambient temperature mustbe 20 to 30 degrees centigrade. Your receiver must be stabilized atroom temperature for at least two hours, to allow comb amplitudeto stabilize.
Calibrate your HP 8572A microwave EMI receiver:
at the start of each day
after power is cycled on the RF preselector
for each change in:
resolution bandwidthfrequency bandspectrum analyzer or preselector attenuationlogarithmic/linear scaleAMPTD CAL setting
In addition to these calibrations, you also should verify theperformance of the HP 8572A microwave EMI receiver periodically.
Complete RF preselector comb characterization and all EMIreceiver system performance tests every six months to be sure theEMI receiver system continues to meet its speci�cations. Duringperformance testing, use the entire EMI receiver system (including allcables).
This periodic calibration requires extensive test equipment,and can be time consuming. For your convenience, calibrationand performance veri�cation is available through your localHewlett-Packard service center.
1-2 Calibrating Your Receiver HP 8572A EMI Receiver User's Guide
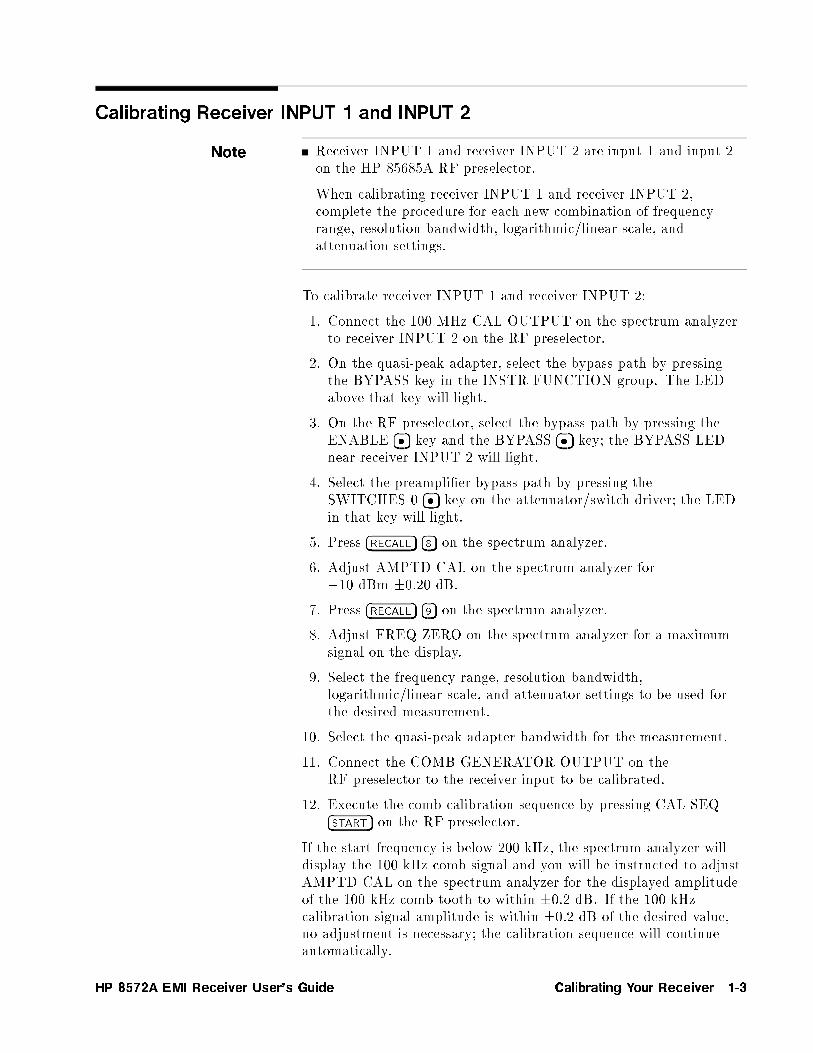
Calibrating Receiver INPUT 1 and INPUT 2
Note Receiver INPUT 1 and receiver INPUT 2 are input 1 and input 2on the HP 85685A RF preselector.
When calibrating receiver INPUT 1 and receiver INPUT 2,complete the procedure for each new combination of frequencyrange, resolution bandwidth, logarithmic/linear scale, andattenuation settings.
To calibrate receiver INPUT 1 and receiver INPUT 2:
1. Connect the 100 MHz CAL OUTPUT on the spectrum analyzerto receiver INPUT 2 on the RF preselector.
2. On the quasi-peak adapter, select the bypass path by pressingthe BYPASS key in the INSTR FUNCTION group. The LEDabove that key will light.
3. On the RF preselector, select the bypass path by pressing theENABLE ��� key and the BYPASS ��� key; the BYPASS LEDnear receiver INPUT 2 will light.
4. Select the preampli�er bypass path by pressing theSWITCHES 0 ��� key on the attenuator/switch driver; the LEDin that key will light.
5. Press �RECALL� �8� on the spectrum analyzer.
6. Adjust AMPTD CAL on the spectrum analyzer for�10 dBm �0.20 dB.
7. Press �RECALL� �9� on the spectrum analyzer.
8. Adjust FREQ ZERO on the spectrum analyzer for a maximumsignal on the display.
9. Select the frequency range, resolution bandwidth,logarithmic/linear scale, and attenuator settings to be used forthe desired measurement.
10. Select the quasi-peak adapter bandwidth for the measurement.
11. Connect the COMB GENERATOR OUTPUT on theRF preselector to the receiver input to be calibrated.
12. Execute the comb calibration sequence by pressing CAL SEQ�START� on the RF preselector.
If the start frequency is below 200 kHz, the spectrum analyzer willdisplay the 100 kHz comb signal and you will be instructed to adjustAMPTD CAL on the spectrum analyzer for the displayed amplitudeof the 100 kHz comb tooth to within �0.2 dB. If the 100 kHzcalibration signal amplitude is within �0.2 dB of the desired value,no adjustment is necessary; the calibration sequence will continueautomatically.
HP 8572A EMI Receiver User's Guide Calibrating Your Receiver 1-3

After adjusting AMPTD CAL to within �0.2 dB, pressCAL SEQ �START� on the RF preselector to continue the calibrationroutine. If the stop frequency is above 200 kHz, the calibrationsequence is performed over the frequency span above 200 kHz.
The comb generator CAL SEQ LED ashes while the calibrationsequence is running. When the calibration sequence ends, the CALSEQ LED stays on, indicating that the system is calibrated over thecurrent frequency range. If the receiver frequency is increased beyondthe calibrated frequency range, the CAL SEQ LED turns o�, toindicate an uncalibrated state.
Note The CAL SEQ LED does not turn o� when settings other thanstart or stop frequency are changed. Therefore, it is possible for anuncalibrated state to exist for the current settings of resolutionbandwidth, attenuation, or amplitude scale while the CAL SEQLED is turned on. Be sure the receiver is calibrated for the currentinstrument settings.
If you change resolution bandwidth, logarithmic/linear scale, orattenuation, or readjust AMPTD CAL, repeat steps 9 through 12with the new settings.
1-4 Calibrating Your Receiver HP 8572A EMI Receiver User's Guide

Calibrating Receiver INPUT 3
Note Receiver INPUT 3 is the preampli�er input on the HP 8449B OptH02 preampli�er.
When calibrating receiver INPUT 3,
Complete the calibration procedure for frequency range,resolution bandwidth, logarithmic/linear scale, and attenuationsettings.
Apply amplitude correction factors from the calibration table onpage 1-10.
Execute a PRESEL PEAK (preselector peak) for each signal inpreselected band 1 through band 4 (2 GHz to 22 GHz).
To calibrate receiver INPUT 3:
1. Connect the 100 MHz CAL OUTPUT on the spectrum analyzerto receiver INPUT 2.
2. On the RF preselector, select the bypass path by pressing theENABLE ��� key and the BYPASS ��� key; the BYPASS LEDnear receiver INPUT 2 will light.
3. Select the preampli�er bypass path by pressing theSWITCHES 0 ��� key on the attenuator/switch driver; the LEDin that key will light.
4. Press �RECALL� �8� on the spectrum analyzer.
5. Select the resolution bandwidth and logarithmic/linear scalesettings for the measurement.
6. Adjust AMPTD CAL on the spectrum analyzer for�10 dBm �0.20 dB.
7. Press �RECALL� �9� on the spectrum analyzer.
8. Adjust FREQ ZERO on the spectrum analyzer for maximumtrace amplitude.
9. Press the SWITCHES 0 ��� key on the attenuator/switch driveruntil the LED turns o�.
10. Press �SHIFT� �PRESEL PEAK� on the spectrum analyzer.
11. To correct for receiver frequency response, subtract the gainfactor from the displayed signal amplitude. See \CorrectingReceiver INPUT 3 Using a Calibration Table").
Steps 1 through 6 perform a modi�ed �RECALL� �8� amplitudeadjustment through the bypass path. Pressing �SHIFT� �PRESEL PEAK�in step 10 will optimize 2 GHz to 22 GHz RF preselector �ltertracking for best overall response. To obtain true signal amplitude,complete a �PRESEL PEAK� for each signal.
HP 8572A EMI Receiver User's Guide Calibrating Your Receiver 1-5
Note If you change resolution bandwidth, or logarithmic/linear scalesettings, or readjust AMPTD CAL on the spectrum analyzer,repeat this procedure with the new settings.
1-6 Calibrating Your Receiver HP 8572A EMI Receiver User's Guide

Preselector Peaking for Receiver INPUT 3
To obtain the speci�ed absolute amplitude accuracy for the 2 GHzto 22 GHz frequency bands, the tracking preselector must bepeaked for each signal. If this is not done, displayed signals above2 GHz are likely to be displayed as much as 5 dB to 7 dB lower.This discrepancy could cause amplitude errors of �0.7 to �1 dB,which becomes signi�cant given the �2 dB amplitude accuracyspeci�cation.
To determine the true amplitude of a signal, place the marker on thepeak of the signal and press �PRESEL PEAK�. The spectrum analyzerautomatically �ne tunes its preselector �lter, using a digital-to-analogconverter (DAC), for maximum signal amplitude, so the signal is notattenuated by the �lter skirts.
Use the factory-default preselector DAC setting of 32 (obtained byexecuting �SHIFT� �PRESEL PEAK�) for best overall frequency responsewhen viewing an entire swept frequency band.
Because the relative tuning of the preselector �lter changes atdi�erent points in any given frequency span, the optimum preselectorpeak DAC value can di�er by several DAC numbers, for di�erentfrequencies in a given frequency span, causing as much as 1 dBamplitude error. To avoid this, execute �PRESEL PEAK� at eachfrequency of interest.
Table 1-1. Frequency Bands
FrequencyBand
FrequencyRange n
YTOFrequencyRange
0 A1 0.0{2.5 GHz 1 3.62{6.12GHz
1 B 2.0{5.8 GHz 1 2.32{6.12GHz
2 C 5.8{12.5GHz
2 2.74{6.09GHz
3 D 12.5{18.6GHz
3 4.06{6.09GHz
4 E 18.6{22.0GHz
4 4.57{5.42GHz
1 Low Band (preselector peaking is not required).
HP 8572A EMI Receiver User's Guide Calibrating Your Receiver 1-7

Correcting Receiver INPUT 3 Using a Calibration Table
To obtain speci�ed absolute amplitude accuracy for signalsmeasured through receiver INPUT 3, apply the frequency-dependentcorrection factors to signal amplitude measurements. Because of thepreampli�er gain, signals will be displayed on the receiver display atan amplitude higher than the actual signal amplitude.
Figure 1-1 is a sample calibration table. The calibration data correctsfor preampli�er gain, preampli�er frequency response, and spectrumanalyzer frequency response for both 0 dB and 10 dB spectrumanalyzer attenuation after the receiver calibration routine has beencompleted. Calibration factors are provided every 50 MHz from1.0 GHz to 22 GHz for each frequency band.
Calibration data is provided in two forms in the calibration table:gain in dB, and correction factor with a speci�c reference level o�set.
1-8 Calibrating Your Receiver HP 8572A EMI Receiver User's Guide
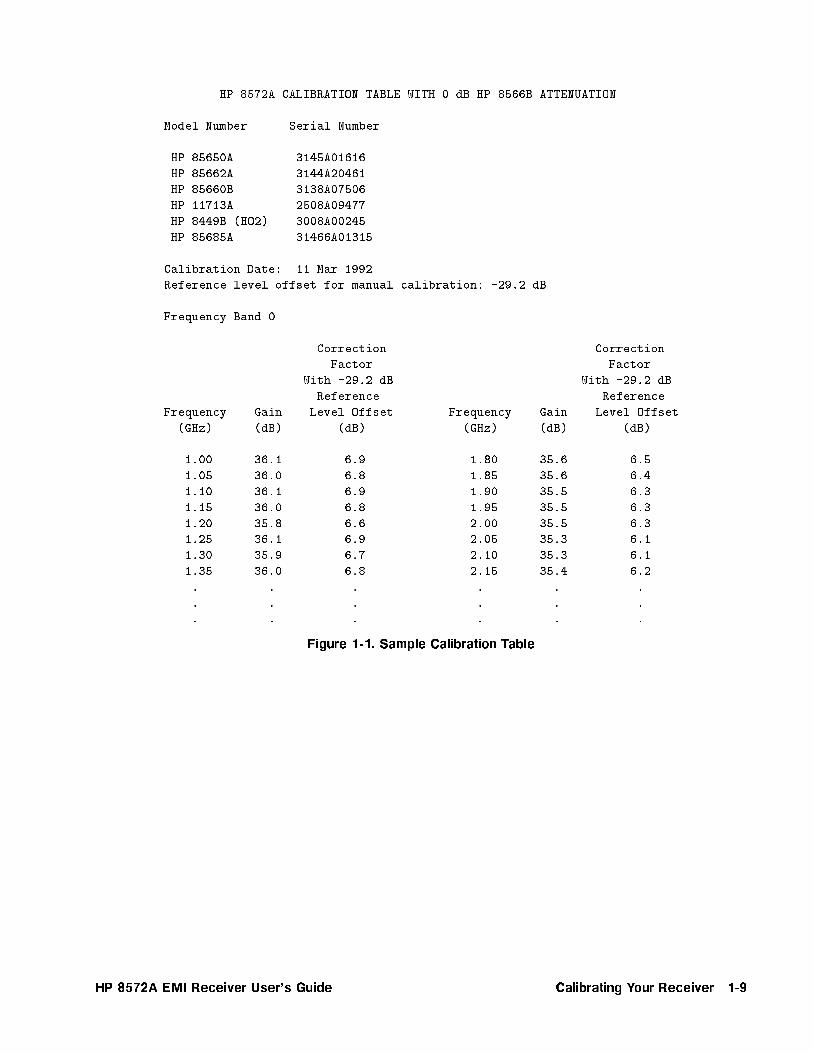
HP 8572A CALIBRATION TABLE WITH 0 dB HP 8566B ATTENUATION
Model Number Serial Number
HP 85650A 3145A01616
HP 85662A 3144A20461
HP 85660B 3138A07506
HP 11713A 2508A09477
HP 8449B (HO2) 3008A00245
HP 85685A 31466A01315
Calibration Date: 11 Mar 1992
Reference level offset for manual calibration: -29.2 dB
Frequency Band 0
Correction Correction
Factor Factor
With -29.2 dB With -29.2 dB
Reference Reference
Frequency Gain Level Offset Frequency Gain Level Offset
(GHz) (dB) (dB) (GHz) (dB) (dB)
1.00 36.1 6.9 1.80 35.6 6.5
1.05 36.0 6.8 1.85 35.6 6.4
1.10 36.1 6.9 1.90 35.5 6.3
1.15 36.0 6.8 1.95 35.5 6.3
1.20 35.8 6.6 2.00 35.5 6.3
1.25 36.1 6.9 2.05 35.3 6.1
1.30 35.9 6.7 2.10 35.3 6.1
1.35 36.0 6.8 2.15 35.4 6.2
. . . . . .
. . . . . .
. . . . . .
Figure 1-1. Sample Calibration Table
HP 8572A EMI Receiver User's Guide Calibrating Your Receiver 1-9
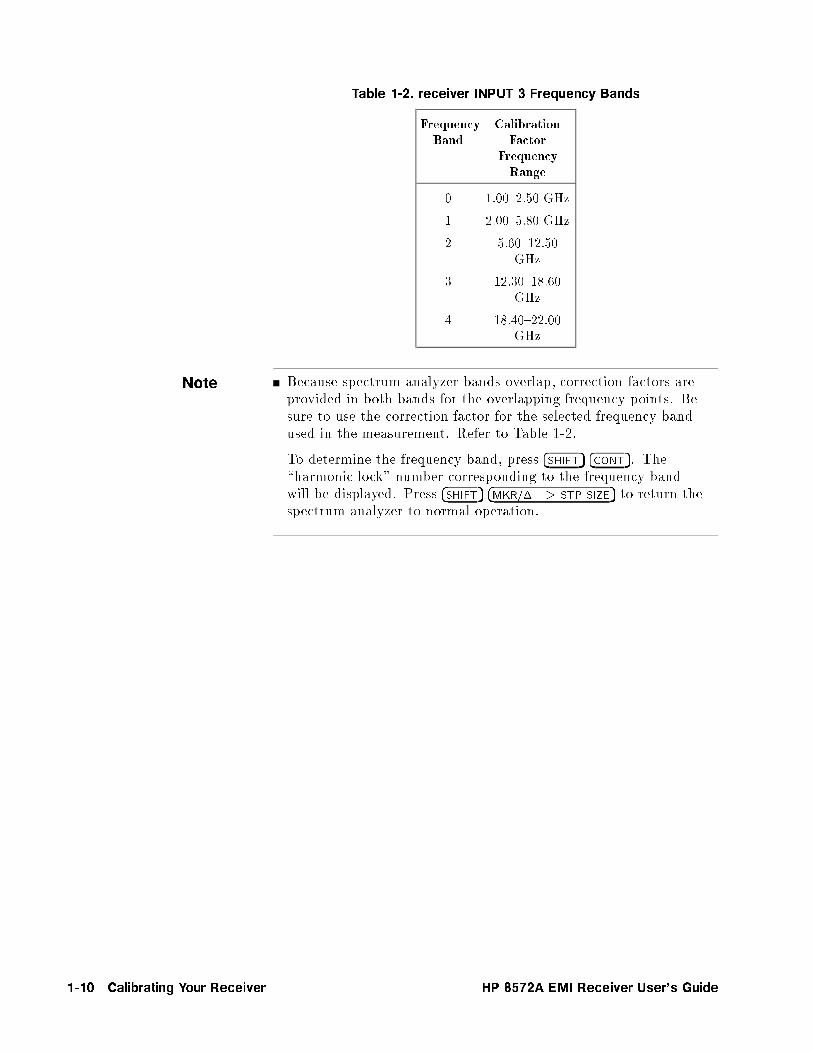
Table 1-2. receiver INPUT 3 Frequency Bands
FrequencyBand
CalibrationFactor
FrequencyRange
0 1.00{2.50 GHz
1 2.00{5.80 GHz
2 5.60{12.50GHz
3 12.30{18.60GHz
4 18.40{22.00GHz
Note Because spectrum analyzer bands overlap, correction factors areprovided in both bands for the overlapping frequency points. Besure to use the correction factor for the selected frequency bandused in the measurement. Refer to Table 1-2.
To determine the frequency band, press �SHIFT� �CONT�. The\harmonic lock" number corresponding to the frequency bandwill be displayed. Press �SHIFT� �MKR/� --> STP SIZE� to return thespectrum analyzer to normal operation.
1-10 Calibrating Your Receiver HP 8572A EMI Receiver User's Guide

Manual Measurements Using Receiver INPUT 3
1. Calibrate receiver INPUT 3. Refer to \Calibrating ReceiverINPUT 3".
2. Enter the reference level o�set for manual calibration (from thecalibration table).
For example, to enter �29.2 dB press �SHIFT� �REFERENCE LEVEL� �2��9� �.� �2� ��dBm�. Notice that the correct reference level o�set isdisplayed on the left side of the display.
3. Place the marker on the peak of the signal of interest and press�PRESEL PEAK�.
4. To determine the actual signal power level, subtract the correctionfactor from the displayed amplitude reading (the correction factorusually will be less than 7 dB).
5. For frequencies not given in the table, interpolate between tablevalues.
Because the actual amplitude of all signals always will be lower thanthe displayed amplitude, the correction factor acts as an additionalguard band. If any signals are above or near the test limit, subtractthe calibration factor from the displayed signal level to determinethe correct signal amplitude. If you use the reference level o�set,you will not need to apply the correction factor to signals several dBbelow the test limits, because the amplitude will be lower than thedisplayed amplitude.
Note Execute �PRESEL PEAK� for each signal in frequency band 1 throughfrequency band 4. You must select the RF preselector bypass pathwhen performing measurements using receiver INPUT 3.
HP 8572A EMI Receiver User's Guide Calibrating Your Receiver 1-11
Automated Measurements Using Receiver INPUT 3
Note To determine the corrected signal level, subtract the gain from themeasured signal amplitude.
Be sure to calibrate your receiver before making this measurement.Follow all the amplitude accuracy considerations discusse in \Whento Calibrate Your Receiver" at the beginning of this chapter.
Calibration data is supplied on two disks, for HP 9000 Series 200/300controllers using the HP BASIC programming language (see HP8571A/8572A EMI Receiver 1 GHz to 22 GHz Calibration DataManual). Both the single-sided and the double-sided disk contain thesame two �les:
BDAT for use with operation veri�cation software.
Gain Table provided as ASCII data in CITI�le data format. Itcan be used by the HP 85869A EMI MeasurementSoftware with Revision A.03.00 or later.
A \Software Toolbox" disk containing utilities, example programs,documentation, and sample data �les for CITI�le format is available;order HP part number 85103-10002.
Be sure to use the correction factor for the appropriate spectrumanalyzer attenuation setting; data is provided for 0 dB and 10 dBattenuation.
To give you a general view of receiver response, the calibration dataalso is plotted on the display as a 20-point moving average. Thisgraphic format shows correction factors for both 0 dB and 10 dBspectrum analyzer attenuation. Figure 1-2 is an example of thisformat. Use the calibration table, shown in Figure 1-1, to determineactual signal amplitude.
1-12 Calibrating Your Receiver HP 8572A EMI Receiver User's Guide
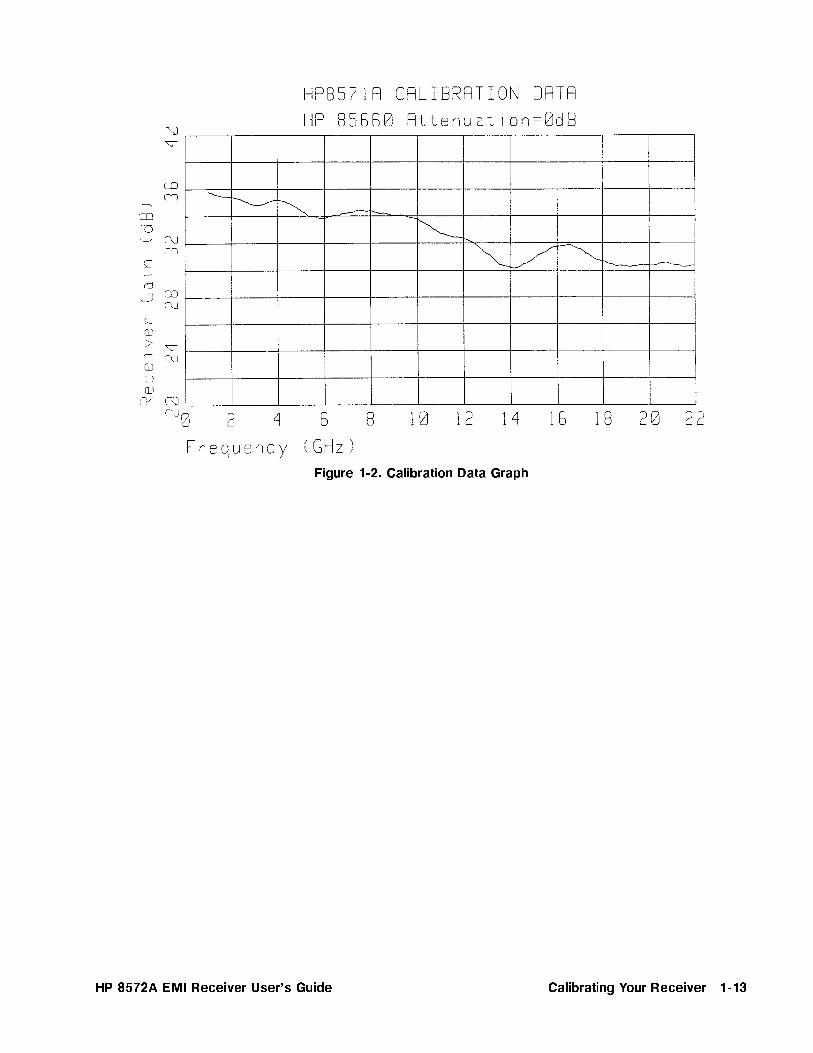
Figure 1-2. Calibration Data Graph
HP 8572A EMI Receiver User's Guide Calibrating Your Receiver 1-13
Spectrum Analyzer Corrected Mode
Warning Do not use the spectrum analyzer corrected mode with the HP 8572A
microwave EMI receiver.
When corrected mode is on, CORR'D appears on the lower left side ofthe display. To turn o� corrected mode, press �SHIFT� �STOP FREQ�.
The calibration procedures in this chapter ensure the speci�edamplitude accuracy. There is no additional bene�t from using thespectrum analyzer corrected mode.
1-14 Calibrating Your Receiver HP 8572A EMI Receiver User's Guide
2
Operation Verification
In this chapter, you will learn how to install the EMI receiver systemoperation veri�cation test software, and how to perform all requiredand optional tests. The software is designed to provide a high levelof con�dence that the EMI receiver system meets its speci�cationswithout requiring excessive test equipment or test time.
Chapter 3, \Test Descriptions," describes each operation veri�cationtest in detail. Refer to that chapter for information regarding anindividual test.
Note To perform the full range of operation veri�cation tests, you willneed all the test equipment listed in Table 2-1. The operationveri�cation software directly supports only the recommendedtest equipment. If you use other models of test equipment, youmay need to modify the operation veri�cation program. For yourconvenience, calibration and performance veri�cation are availablethrough your local Hewlett-Packard service center.
It takes about four hours to complete all the operation veri�cationtests for the HP 8572A microwave EMI receiver.
Because the program supports several input devices (keyboard ormouse), you may notice minor text di�erences in the menus andsoftkeys displayed on the screen.
Before starting the tests, make backup copies of the operationveri�cation software disks; store the backup disks in a safe place. Ifan original disk is damaged, or if program data is altered or lost,you will have this backup set. Operation veri�cation software issold in complete sets only; you cannot order an individual disk.
HP 8572A EMI Receiver User's Guide Operation Verification 2-1

Step 1. Set up the hardware for operation verification testing
Operation veri�cation software runs on HP 9000 Series 300computers. The computer must have:
A minimum of 2.5 to 4 megabytes of RAM, depending on thecomputer's display con�guration.
An HP-IB interface.
A 3.5 inch double-sided exible disk drive.
1. Connect the EMI receiver system to the computer connector.
If the computer has an HP 98624A HP-IB interface:
a. Connect your EMI receiver system to HP-IB SELECTCODE 8.
b. Check that the address switch on the HP 98624A HP-IBinterface matches the HP-IB controller device address.
c. If necessary, refer to the HP 9000 Series 200/300 PeripheralInstallation Guide, Volume 1.
If the computer does not have an HP 98624A HP-IB interface:
a. Connect the EMI receiver system to the connector markedHP-IB SELECT CODE 7.
2. Connect the HP-IB cables from the test equipment to theHP-IB SELECT CODE 7 connector on the computer.
3. Connect the HP-IB of the external disk drive to the computerconnector labeled HP-IB SELECT CODE 7, using a 0.5 meterHP-IB cable (HP 10833D BNC 0.5 meter HP-IB cable, or similarcable).
Occasionally, disk drives exhibit unpredictable behavior whensharing the HP-IB with instruments. If this occurs, connect thedisk drive to a separate HP-IB interface.
4. Set the external test equipment and the EMI receiver system lineswitches to ON. Allow the equipment to warm up as speci�ed forthe operation veri�cation tests.
5. Turn on the computer and the disk drive.
2-2 Operation Verification HP 8572A EMI Receiver User's Guide

Step 2. Load the software
To run the operation veri�cation test software, you must havea version of the BASIC programming language loaded on thecomputer. You also will need several speci�c binaries (BIN �les|seebelow).
1. Load BASIC 5.13 or later, with the appropriate BIN �les, on theHP 9000 Series 300 computer. If necessary, refer to an HP BASICreference manual.
These BIN �les should be loaded:
CLOCK EDIT KBDCOMPLEX ERR MATCRTA GRAPH MSCRTB GRAPHX PDEVz
CRTX HFS* SRMy
CS80 HPIB TRANSDISC IO XREFz
*Optional|required only for HFS (hierarchical �le system) environment.yOptional|required only for SRM (shared resource management)environment.zOptional|required only for Debug.
Caution Before starting the tests, make backup copies of the operationveri�cation software disks; store the backup disks in a safe place. Ifan original disk is damaged, or if program data is altered or lost,you will have this backup set. Operation veri�cation software issold in complete sets only; you cannot order an individual disk.
Make backup copies of all write-protected disks. Be sure toinitialize the backup disks as follows:
INITIALIZE ":,700,0",2,3.
Format Option 3 must be used, but the MSVS and interleavefactor are speci�c to your system.
HP 8572A EMI Receiver User's Guide Operation Verification 2-3

Assign the MASS STORAGE IS (MSI) to the drive you will use asthe default drive.
For example:
MSI ":,700,0"
Insert disk 1 into the disk drive.
Type LOAD "OPV",1 and press �ENTER�.
When prompted, remove disk 1 from the disk drive and insert disk2.
Press �CONTINUE�.
2-4 Operation Verification HP 8572A EMI Receiver User's Guide

Step 3. Select the EMI receiver system model
Note The Test Executive Program will guide you through the steps toset up your system for the operations veri�cation tests.
The EMI operation veri�cation software provides operationveri�cation tests for the HP 8572A microwave EMI receiver. If yourEMI receiver system is an Option 049, you will enter this informationwhen you perform \Step 4. Enter the EMI receiver system testinformation".
d a
c b
=== SPECIFIC MODEL? ===
HP8571ANNNNNNNNNNNNNNNNNNNNNNNHP8572A
1. Use �+� and �*� to highlightNNNNNNNNNNNNNNNNNNNNNNNNNNHP 8572A .
2. Press �ENTER� to select the UUT. The computer will display a titlepage for the EMI receiver system operation veri�cation test.
3. To continue, press any key on the computer except �PAUSE�.
HP 8572A EMI Receiver User's Guide Operation Verification 2-5
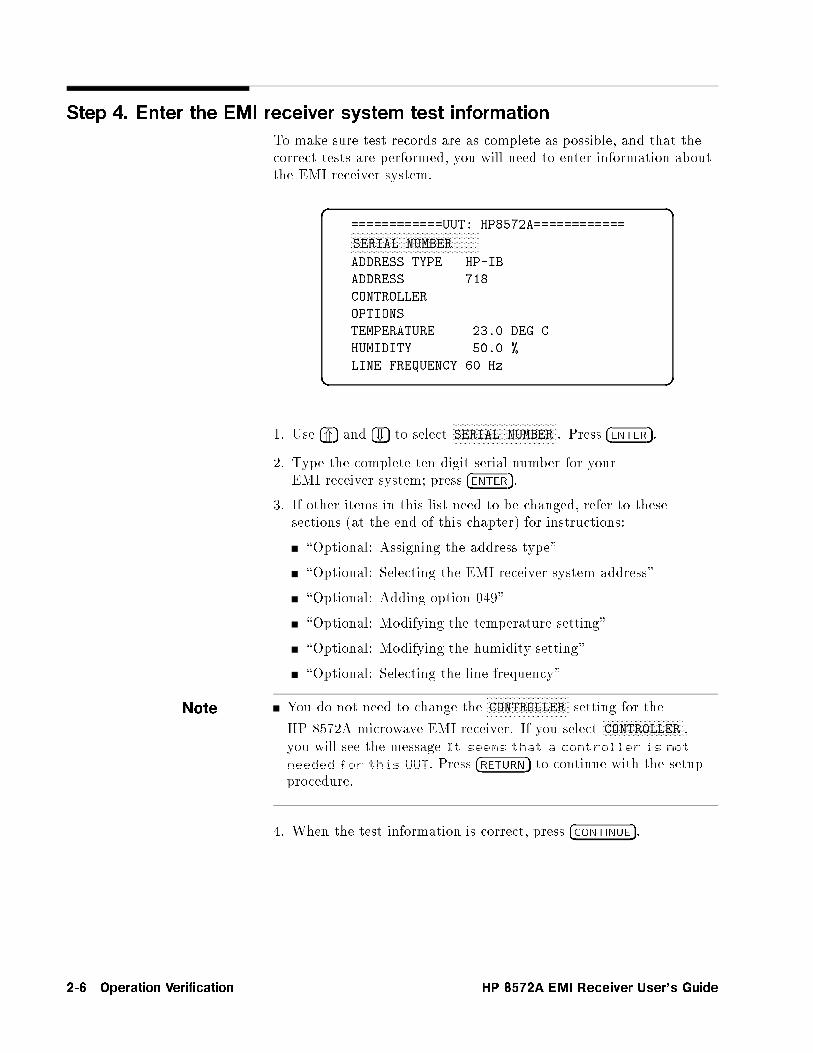
Step 4. Enter the EMI receiver system test information
To make sure test records are as complete as possible, and that thecorrect tests are performed, you will need to enter information aboutthe EMI receiver system.
d a
c b
============UUT: HP8572A============NNNNNNNNNNNNNNNNNNNNNNNNNNNNNNNNNNNNNNNNNNNNNNNNNNSERIAL NUMBER
ADDRESS TYPE HP-IB
ADDRESS 718
CONTROLLER
OPTIONS
TEMPERATURE 23.0 DEG C
HUMIDITY 50.0 %
LINE FREQUENCY 60 Hz
1. Use �*� and �+� to selectNNNNNNNNNNNNNNNNNNNNNNNNNNNNNNNNNNNNNNNNNSERIAL NUMBER . Press �ENTER�.
2. Type the complete ten-digit serial number for yourEMI receiver system; press �ENTER�.
3. If other items in this list need to be changed, refer to thesesections (at the end of this chapter) for instructions:
\Optional: Assigning the address type"
\Optional: Selecting the EMI receiver system address"
\Optional: Adding option 049"
\Optional: Modifying the temperature setting"
\Optional: Modifying the humidity setting"
\Optional: Selecting the line frequency"
Note You do not need to change theNNNNNNNNNNNNNNNNNNNNNNNNNNNNNNNNCONTROLLER setting for the
HP 8572A microwave EMI receiver. If you selectNNNNNNNNNNNNNNNNNNNNNNNNNNNNNNNNCONTROLLER ,
you will see the message It seems that a controller is not
needed for this UUT. Press �RETURN� to continue with the setupprocedure.
4. When the test information is correct, press �CONTINUE�.
2-6 Operation Verification HP 8572A EMI Receiver User's Guide
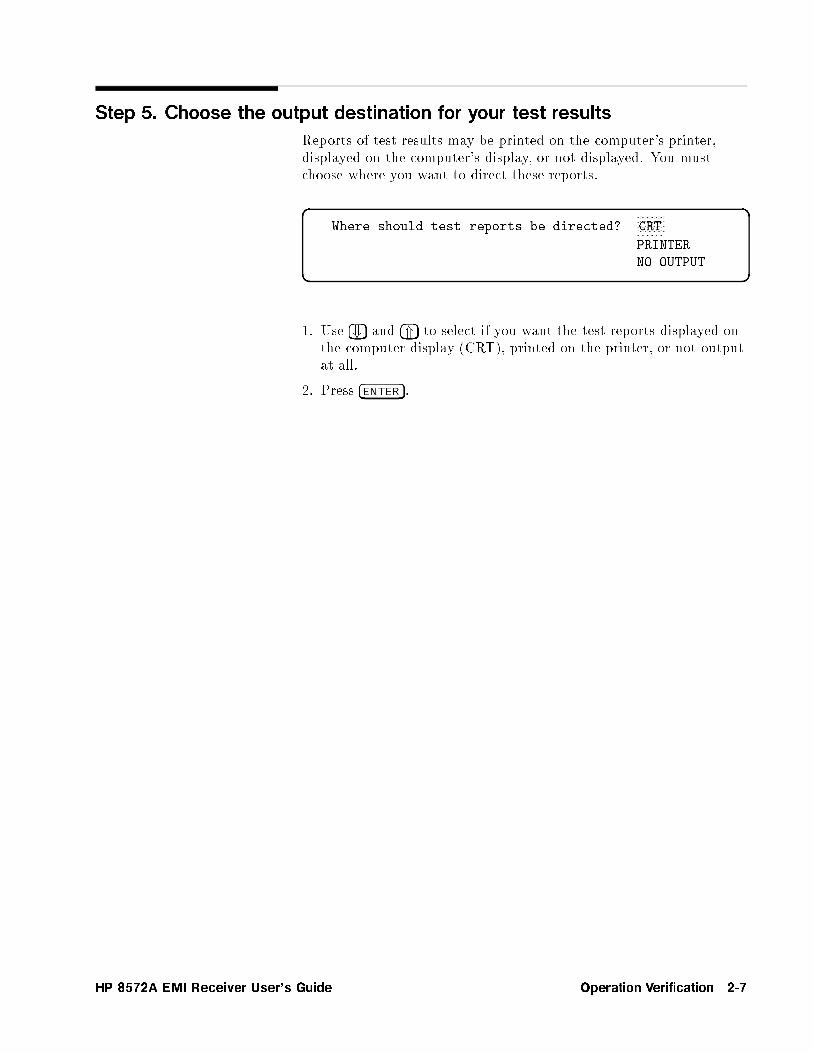
Step 5. Choose the output destination for your test results
Reports of test results may be printed on the computer's printer,displayed on the computer's display, or not displayed. You mustchoose where you want to direct these reports.
d a
c b
Where should test reports be directed?NNNNNNNNNNNCRT
PRINTER
NO OUTPUT
1. Use �+� and �*� to select if you want the test reports displayed onthe computer display (CRT), printed on the printer, or not outputat all.
2. Press �ENTER�.
HP 8572A EMI Receiver User's Guide Operation Verification 2-7
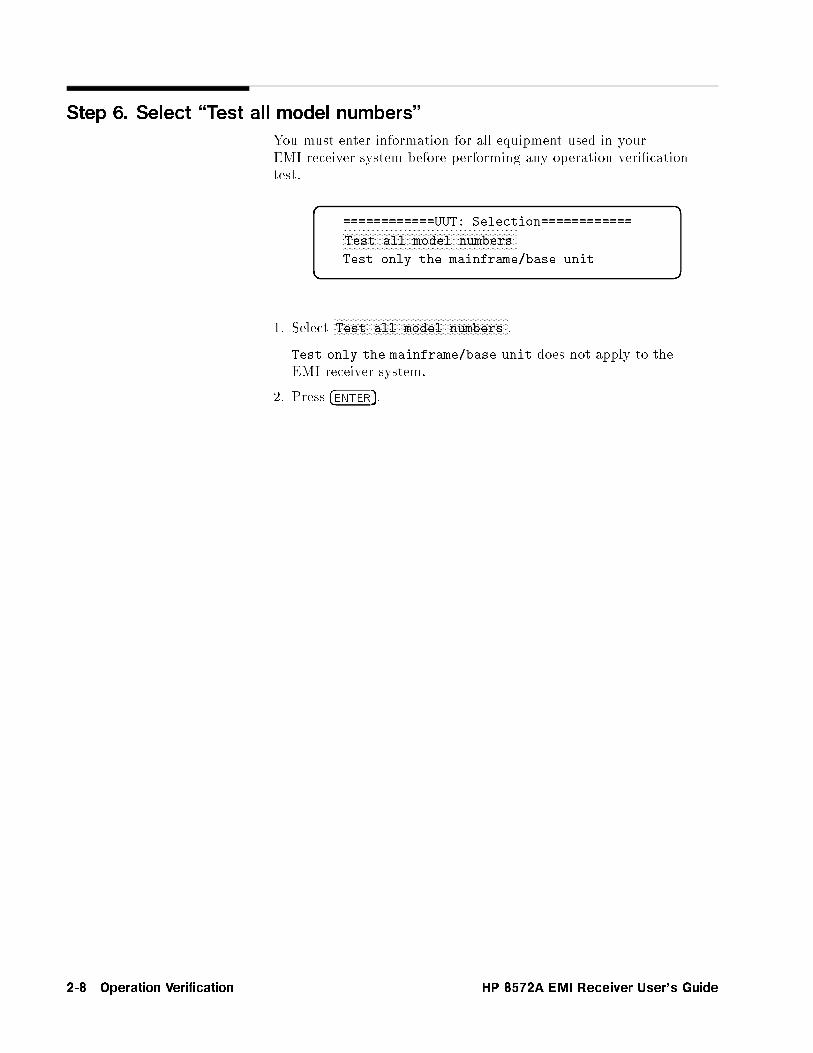
Step 6. Select \Test all model numbers"
You must enter information for all equipment used in yourEMI receiver system before performing any operation veri�cationtest.
d a
c b
============UUT: Selection============NNNNNNNNNNNNNNNNNNNNNNNNNNNNNNNNNNNNNNNNNNNNNNNNNNNNNNNNNNNNNNNNNNNNTest all model numbers
Test only the mainframe/base unit
1. SelectNNNNNNNNNNNNNNNNNNNNNNNNNNNNNNNNNNNNNNNNNNNNNNNNNNNNNNNNNNNNNNNNNNNNTest all model numbers .
Test only the mainframe/base unit does not apply to theEMI receiver system.
2. Press �ENTER�.
2-8 Operation Verification HP 8572A EMI Receiver User's Guide

Step 7. Select equipment from the UUT Configuration menu
After you selectNNNNNNNNNNNNNNNNNNNNNNNNNNNNNNNNNNNNNNNNNNNNNNNNNNNNNNNNNNNNNNNNNNNNTest all model numbers from the UUT Selection
menu, you will see a display similar to this:
d a
c b
==========UUT: Configuration==========NNNNNNNNNNNNNNNNNNNNNNNNNNNNNNNNNNNNNNNNNNNNNNNNNNNNNNNNNNNBASE UNIT HP8572A
UUT RF HP85660B
UUT IF HP85662A
UUT SW HP11713A
UUT AMP HP8449B(H02)
1. Use �*� and �+� to select a piece of equipment from the UUTCon�guration menu.
2. Press �ENTER�.
HP 8572A EMI Receiver User's Guide Operation Verification 2-9

Step 8. Assign serial numbers to all equipment
Before you can begin performance veri�cation testing, you mustenter a serial number for each piece of equipment on the UUTCon�guration menu. At this menu, you also will identify addresstype, address, and any options for each piece of equipment in thereceiver under test.
d a
c b
==========UUT: Configuration==========
MODEL NUMBER HP8572ANNNNNNNNNNNNNNNNNNNNNNNNNNNNNNNNNNNNNNNNNSERIAL NUMBER
ADDR TYPE HP-IB
ADDRESS 718
OPTIONS
1. Use �+� and �*� to selectNNNNNNNNNNNNNNNNNNNNNNNNNNNNNNNNNNNNNNNNNSERIAL NUMBER .
2. Press �ENTER�.
3. Enter the serial number of the instrument you selected in \Step 7.Select equipment from the UUT Con�guration menu".
4. Press �ENTER�.
5. If you need to change other receiver con�guration on this list, use�*� and �+� to select the item to be changed; refer to these sections(at the end of this chapter) for instructions:
\Optional: Assigning the address type"
\Optional: Selecting the EMI receiver system address"
\Optional: Adding option 049"
6. When all the con�guration information is correct, press�CONTINUE�.
2-10 Operation Verification HP 8572A EMI Receiver User's Guide

Step 9. Verify the test equipment
Note The Test Executive Program will take a few moments to check theequipment for the tests that need to be performed.
d a
c b
EQUIPMENT USED (MODEL/ADDRESS):
HP436A 713
HP8481D
HP8482AHP8161A 712
HP83830A 716
HP3335A 704
HP5316A 720 NNNNNNNNNNNNNNNNNNNNNNNNNNCONTINUE
1. Verify that the model numbers and addresses match theequipment available for testing.
2. If the displayed test equipment model numbers and addressesmatch your test equipment model numbers and addresses, selectNNNNNNNNNNNNNNNNNNNNNNNNNNCONTINUE , and press �ENTER�. Go on to \Step 11. Run theoperation veri�cation tests".
3. If the displayed test equipment model numbers and addressesdo not match your test equipment, you must change your testequipment and addresses, or you must edit the display to thealternate equipment you are using:
To change your test equipment and its addresses to match thedisplayed test equipment and addresses:
Make the equipment changes to match the displayed models.
SelectNNNNNNNNNNNNNNNNNNNNNNNNNNCONTINUE on the display.
Press �ENTER�.
Go on to \Step 11. Run the operation veri�cation tests".
To change the displayed list of test equipment and addresses tomatch your test equipment:
Refer to \Optional: Changing the default equipment" at theend of this chapter.
Table 2-1 in that section lists default and alternate models ofsupported test equipment. Only listed alternate models ofeach instrument may substitute for the default model number.
HP 8572A EMI Receiver User's Guide Operation Verification 2-11

Step 10. Confirm the list of accessories
The screen will display a list of accessories used with theEMI receiver system for the operation veri�cation tests.
d a
c b
=============== ACCESSORIES USED ===============
Semirigid coax cable type N (m) to N (m) HP 85685-20005
122 cm flexible coax cable BNC (m) to BNC (m) HP 10503A (3 required)
Flexible coax calibration cable type N (m) to N (m) HP 8120-4781
Adapter type N (m) to BNC (f) HP 1250-1535
91 cm flexible coax cable type N (m) to N (m) HP 8120-5140
NNNNNNNNNNNNNNNNNNNNNNNNNNCONTINUE
SelectNNNNNNNNNNNNNNNNNPRINT if you want a copy of this accessory list. Select
NNNNNNNNNNNNNNNNNNNNNNNNNNCONTINUE to go on to the next step of the setup procedure.
2-12 Operation Verification HP 8572A EMI Receiver User's Guide

Step 11. Run the operation verification tests
d a
c b
============== TEST LIST ==============
Calibrator Amplitude Accuracy
Log Fidelity
Linear Fidelity
Reference Level Switching UncertaintyReceiver Calibration Input 1
Amplitude Accy. Input 1 (10 dB AT)
Amplitude Accy. Input 1 (10 dB AT), 20 Hz-9 kHz
Amplitude Accy. Input 1 (0 dB AT)
Amplitude Accy. Input 1 (0 dB AT), 20 Hz-9 kHz
Disp. Average Noise Input 1, 10 Hz RBW
Sensitivity Input 1, 20 Hz to 9 kHz
Residual Responses Input 1
Bandwidth Accuracy
Calibration Input 2
Pulse Response
Amplitude Accy. Input 2 (10 dB AT)
Amplitude Accy. Input 2 (0 dB AT)
Disp. Average Noise Input 2
Residual Responses Input 2
Amplitude Accy. Input 3
Disp. Average Noise Input 3, 10 Hz RBW
Residual Responses Input 3
HP 8572A microwave EMI receiver tests
The display shows the operation veri�cation tests. The screen maynot show all the tests; use �*� and �+� to view the entire list. Theseoperation veri�cation tests are organized in a speci�c sequence,designed to minimize changes in equipment setups.
1. Use �+� and �*� to select the �rst test.
2. Press �ENTER� to begin running the test.
3. Follow the on-screen instructions to set up the test equipment.Chapter 3 has illustrations of test setups and individual testdescriptions.
4. Repeat steps 1, 2, and 3 until all operation veri�cation tests arecompleted.
5. When you have completed the tests, or when you want to exit theprogram, press �CONTINUE�.
HP 8572A EMI Receiver User's Guide Operation Verification 2-13
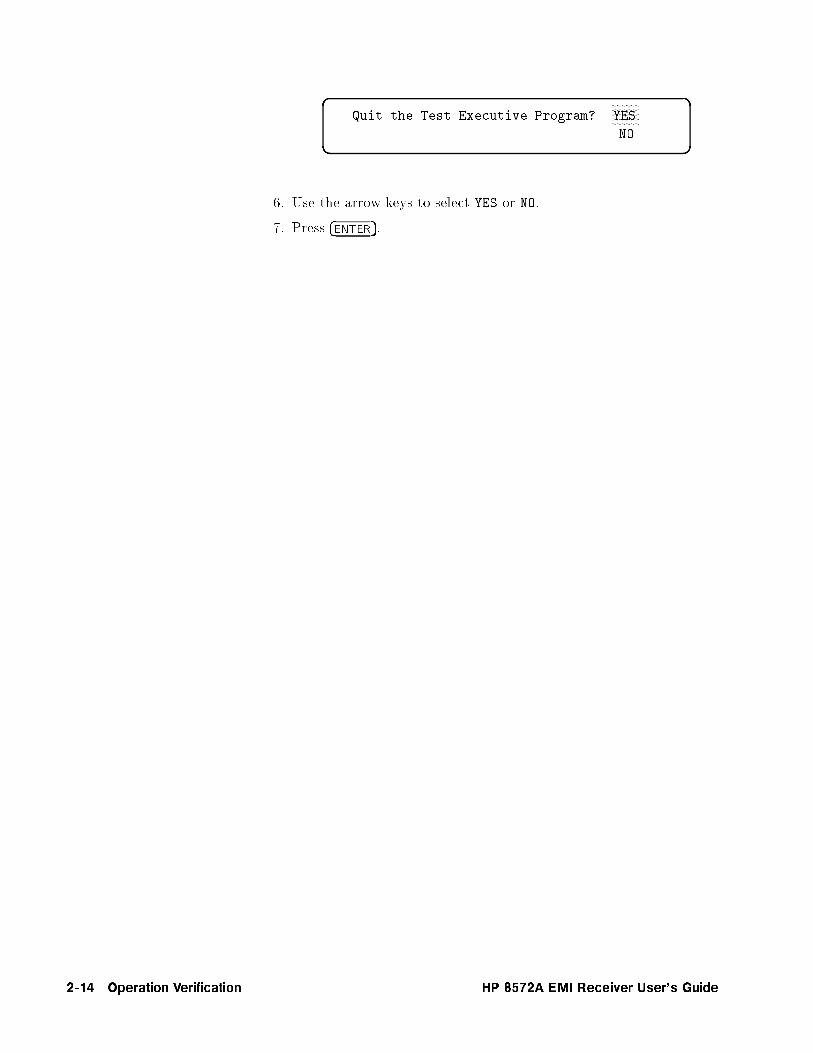
d a
c b
Quit the Test Executive Program?NNNNNNNNNNNYES
NO
6. Use the arrow keys to select YES or NO.
7. Press �ENTER�.
2-14 Operation Verification HP 8572A EMI Receiver User's Guide
Optional: Installing the software on an SRM or HFS hard disk
The operation veri�cation software may be installed on a sharedresource manager (SRM) or hierarchical �le structure (HFS) harddisk system. For information about creating directories and copying�les, refer to the appropriate SRM or HFS hard disk manual.
To install the test software:
1. Create a directory to contain the operation veri�cation programand its associated �les.
2. Copy all operation veri�cation program �les from the two 3.5 inchdisks to this directory.
HP 8572A EMI Receiver User's Guide Operation Verification 2-15
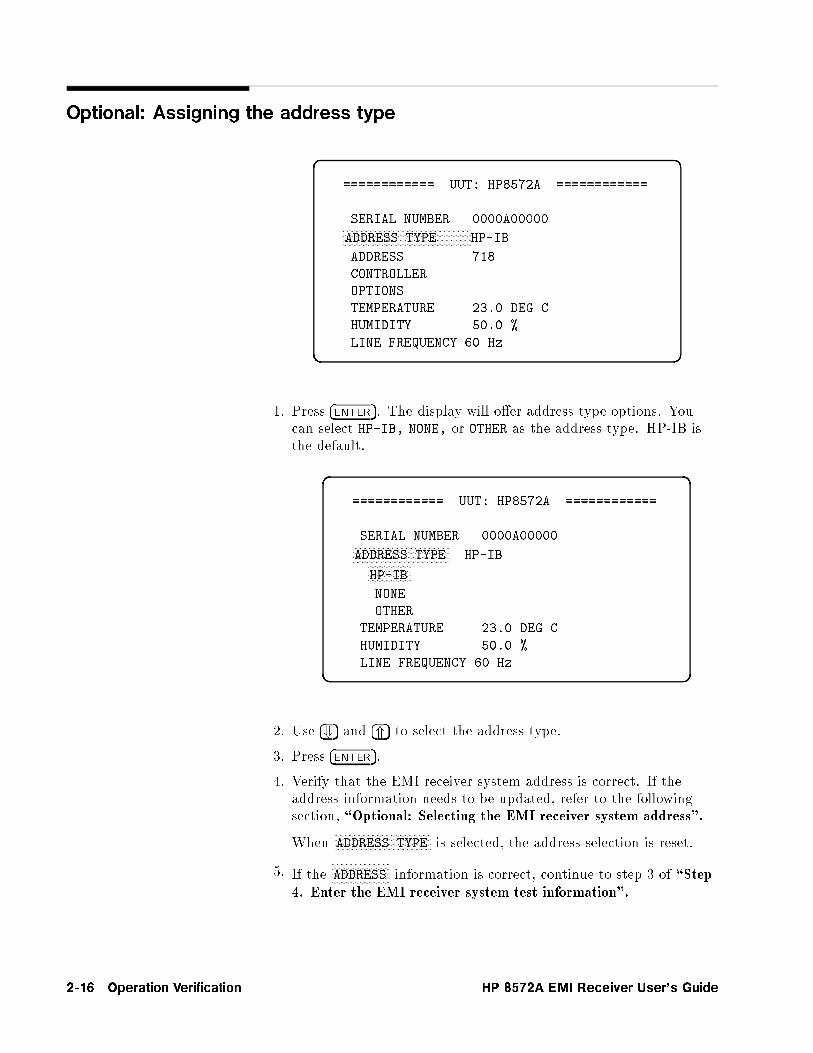
Optional: Assigning the address type
d a
c b
============ UUT: HP8572A ============
SERIAL NUMBER 0000A00000NNNNNNNNNNNNNNNNNNNNNNNNNNNNNNNNNNNNNNNNNNNNNNNNNNADDRESS TYPE HP-IB
ADDRESS 718
CONTROLLEROPTIONS
TEMPERATURE 23.0 DEG C
HUMIDITY 50.0 %
LINE FREQUENCY 60 Hz
1. Press �ENTER�. The display will o�er address type options. Youcan select HP-IB, NONE, or OTHER as the address type. HP-IB isthe default.
d a
c b
============ UUT: HP8572A ============
SERIAL NUMBER 0000A00000NNNNNNNNNNNNNNNNNNNNNNNNNNNNNNNNNNNNNNADDRESS TYPE HP-IBNNNNNNNNNNNNNNNNN
HP-IB
NONE
OTHER
TEMPERATURE 23.0 DEG C
HUMIDITY 50.0 %
LINE FREQUENCY 60 Hz
2. Use �+� and �*� to select the address type.
3. Press �ENTER�.
4. Verify that the EMI receiver system address is correct. If theaddress information needs to be updated, refer to the followingsection, \Optional: Selecting the EMI receiver system address".
WhenNNNNNNNNNNNNNNNNNNNNNNNNNNNNNNNNNNNNNNADDRESS TYPE is selected, the address selection is reset.
5. If theNNNNNNNNNNNNNNNNNNNNNNNADDRESS information is correct, continue to step 3 of \Step
4. Enter the EMI receiver system test information".
2-16 Operation Verification HP 8572A EMI Receiver User's Guide
Optional: Selecting the EMI receiver system address
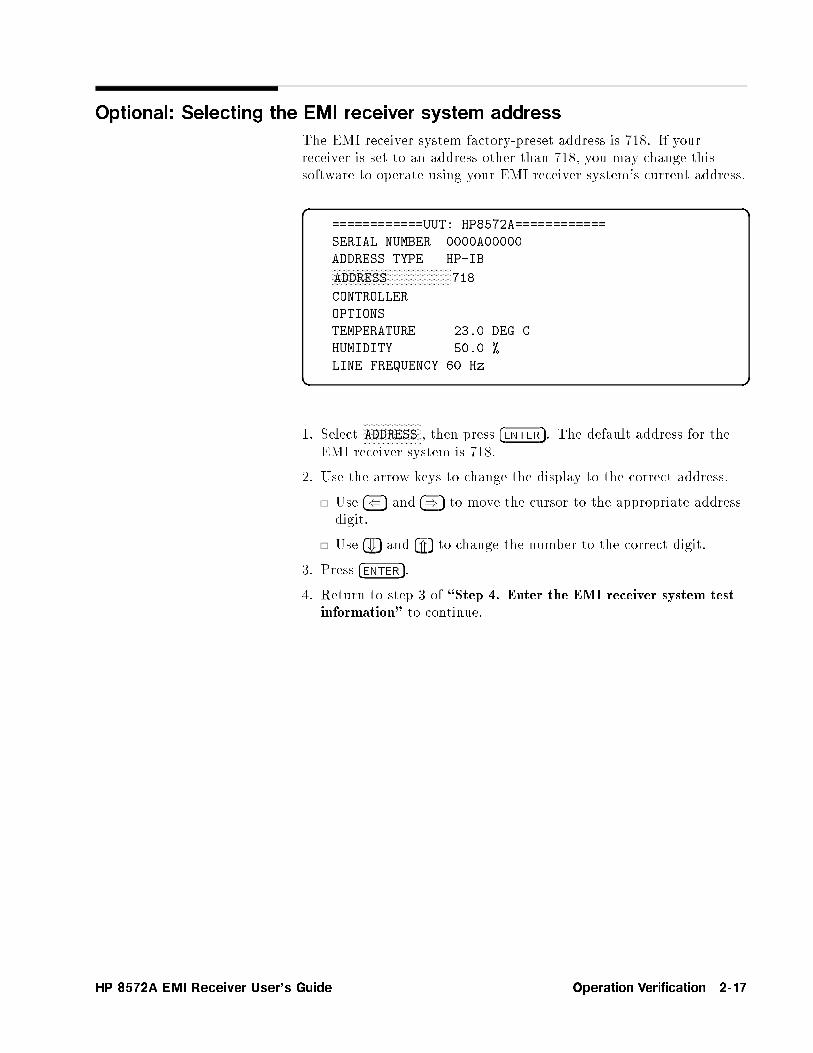
The EMI receiver system factory-preset address is 718. If yourreceiver is set to an address other than 718, you may change thissoftware to operate using your EMI receiver system's current address.
d a
c b
============UUT: HP8572A============
SERIAL NUMBER 0000A00000
ADDRESS TYPE HP-IBNNNNNNNNNNNNNNNNNNNNNNNNNNNNNNNNNNNNNNNNNNNNNNNADDRESS 718
CONTROLLER
OPTIONS
TEMPERATURE 23.0 DEG C
HUMIDITY 50.0 %
LINE FREQUENCY 60 Hz
1. SelectNNNNNNNNNNNNNNNNNNNNNNNADDRESS , then press �ENTER�. The default address for the
EMI receiver system is 718.
2. Use the arrow keys to change the display to the correct address.
Use �(� and �)� to move the cursor to the appropriate addressdigit.
Use �+� and �*� to change the number to the correct digit.
3. Press �ENTER�.
4. Return to step 3 of \Step 4. Enter the EMI receiver system testinformation" to continue.
HP 8572A EMI Receiver User's Guide Operation Verification 2-17

Optional: Adding option 049
If you have an Option 049 EMI receiver system, enter the optioninformation to ensure that your EMI receiver system is testedcompletely.
d a
c b
============UUT: HP8572A============
SERIAL NUMBER 0000A00000
ADDRESS TYPE HP-IB
ADDRESS 718
CONTROLLERNNNNNNNNNNNNNNNNNNNNNNNNNNNNNNNNNNNNNNNNNNNNOPTIONS
TEMPERATURE 23.0 DEG C
HUMIDITY 50.0 %
LINE FREQUENCY 60 Hz
1. SelectNNNNNNNNNNNNNNNNNNNNNNNOPTIONS , then press �ENTER�. The screen will display the
option selections.
d a
c b
============UUT: HP8572A============
SERIAL NUMBER 0000A00000
ADDRESS TYPE HP-IB
ADDRESS 718
CONTROLLERNNNNNNNNNNNNNNNNNNNNNNNNNNNNNNNNNNNNNNNNNNNNOPTIONS
==========UUT OPTIONS===========NNNNNNNNNNNNNNNNNNNNNNNNNNNNNNNNNNNNNNNNNNNNNNNNNNNNNNNNNNNNNNNNNNNNNNNNNNNNNNNNNNNNNNNNNNNNNNNNNNNNNNNNNNNNNNNNNNNNNNNNNNNNNNNNNNNNNNNNNNNNNNNNNNNNNNNNNNNNNNNNNNNNNNNNNNNNNNNNNN049 NO Deletes the HP 8449B in HP 8571A/HP 8572A systems
LINE FREQUENCY 60 Hz
2. Press �ENTER� to changeNNNNNNNNNO to
NNNNNNNNNNNYES . (Pressing �ENTER� again
togglesNNNNNNNNNNNYES back to
NNNNNNNNNO .
The HP 8449B Opt H02 preselector is deleted from your EMIreceiver system con�guration.
3. Press �CONTINUE�.
4. Return to step 3 of \Step 4. Enter the EMI receiver system testinformation" to continue.
2-18 Operation Verification HP 8572A EMI Receiver User's Guide

Optional: Modifying the temperature setting
You may enter the ambient room temperature in which theEMI receiver system is operating. This temperature becomes part ofthe test record.
d a
c b
============= UUT: HP8572A ============
SERIAL NUMBER 0000A00000
ADDRESS TYPE HP-IB
ADDRESS 718
CONTROLLER
OPTIONSNNNNNNNNNNNNNNNNNNNNNNNNNNNNNNNNNNNNNNNNNNNNNNNTEMPERATURE 23.0 DEG C
HUMIDITY 50.0 %
LINE FREQUENCY 60 Hz
1. Press �ENTER�. The default temperature is 23.0 degrees celsius.Enter temperatures in celsius only.
2. Use the arrow keys to change to the correct temperature.
Use �(� and �)� to move the cursor to the digit to be changed.
Use �+� and �*� to change to the correct temperature.
3. Press �ENTER�.
4. Return to step 3 of \Step 4. Enter the EMI receiver system testinformation" to continue.
HP 8572A EMI Receiver User's Guide Operation Verification 2-19
Optional: Modifying the humidity setting
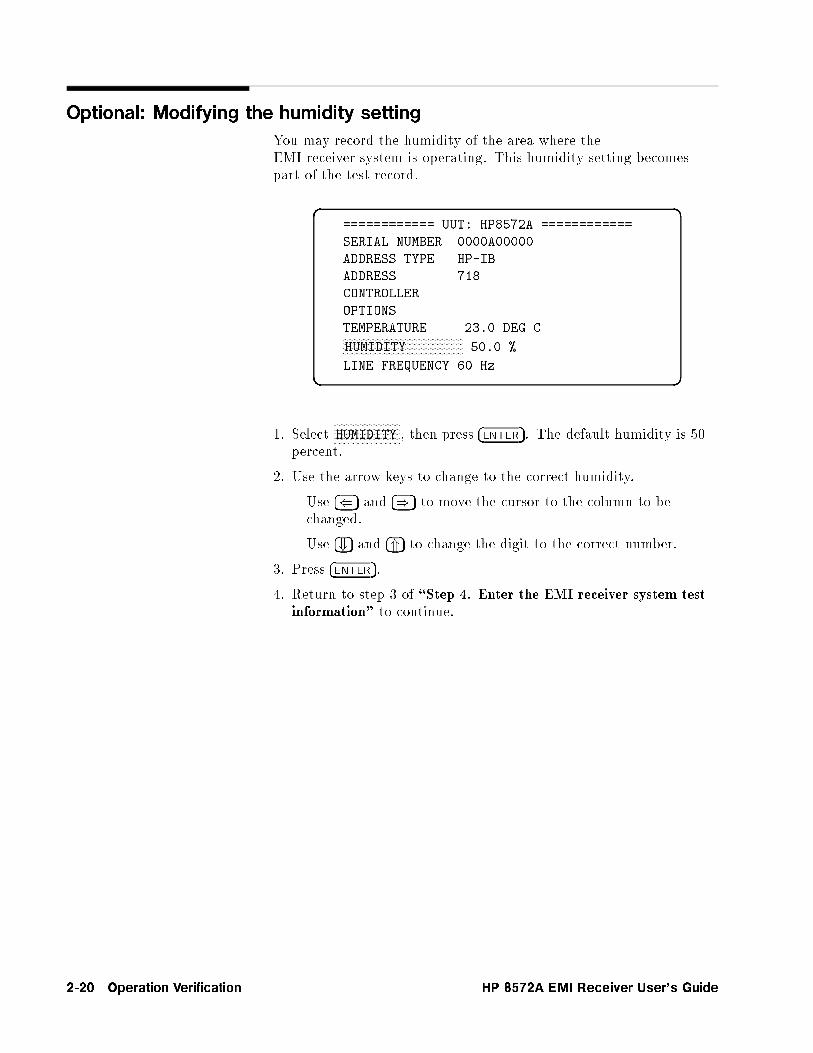
You may record the humidity of the area where theEMI receiver system is operating. This humidity setting becomespart of the test record.
d a
c b
============ UUT: HP8572A ============
SERIAL NUMBER 0000A00000
ADDRESS TYPE HP-IB
ADDRESS 718
CONTROLLER
OPTIONS
TEMPERATURE 23.0 DEG CNNNNNNNNNNNNNNNNNNNNNNNNNNNNNNNNNNNNNNNNNNNNNNNHUMIDITY 50.0 %
LINE FREQUENCY 60 Hz
1. SelectNNNNNNNNNNNNNNNNNNNNNNNNNNHUMIDITY , then press �ENTER�. The default humidity is 50
percent.
2. Use the arrow keys to change to the correct humidity.
Use �(� and �)� to move the cursor to the column to bechanged.
Use �+� and �*� to change the digit to the correct number.
3. Press �ENTER�.
4. Return to step 3 of \Step 4. Enter the EMI receiver system testinformation" to continue.
2-20 Operation Verification HP 8572A EMI Receiver User's Guide

Optional: Selecting the line frequency
You may record the line frequency the EMI receiver system is usingto operate. This line frequency setting becomes part of the testrecord.
d a
c b
============ UUT: HP8572A ============
SERIAL NUMBER 0000A00000
ADDRESS TYPE HP-IB
ADDRESS 718
CONTROLLER
OPTIONS
TEMPERATURE 23.0 DEG C
HUMIDITY 50.0 %NNNNNNNNNNNNNNNNNNNNNNNNNNNNNNNNNNNNNNNNNNNNNNNLINE FREQUENCY 60 Hz
1. SelectNNNNNNNNNNNNNNNNNNNNNNNNNNNNNNNNNNNNNNNNNNNNLINE FREQUENCY , then press �ENTER�.
d a
c b
============ UUT: HP8572A ============
SERIAL NUMBER 0000A00000
ADDRESS TYPE HP-IB
ADDRESS 718
CONTROLLER
OPTIONS
TEMPERATURE 23.0 DEG C
HUMIDITY 50.0 %NNNNNNNNNNNNNNNNNNNNNNNNNNNNNNNNNNNNNNNNNNNNNNNLINE FREQUENCY 60 HzNNNNNNNNNNNNNNNNN
60 Hz
50 Hz
400 Hz
2. Use the arrow keys to select the line frequency that theEMI receiver system is using. The default line frequency is 60Hertz.
3. Press �ENTER�.
4. Return to step 3 of \Step 4. Enter the EMI receiver system testinformation" to continue.
HP 8572A EMI Receiver User's Guide Operation Verification 2-21

Optional: Changing the default equipment
If your test equipment model numbers and addresses are di�erentfrom the default test equipment (displayed when you veri�ed the testequipment), you must change the settings. Refer to \Step 9. Verifythe test equipment". This operation veri�cation software supportsonly the equipment listed in Table 2-1. You must have BASIC 5.13or later, with the appropriate binaries (BIN �les) installed, to changethese default settings.
The TSCRIPT �le contains the default test equipment modelnumbers and addresses. In this procedure, you will edit, save, andrun the TSCRIPT �le.
Print the default equipment list
If you have a printer connected to your computer, you can print thedefault test equipment list. To print the list:
1. Use �+� and �*� to selectNNNNNNNNNNNNNNNNNPRINT on the display.
2. Press �ENTER�.
Exit the operation veri�cation software
3. Use �+� and �*� to selectNNNNNNNNNNNNNNNNNNNNNNNNNNCONTINUE on the display.
4. Press �ENTER� to display the operation veri�cation test menu.
5. Press �CONTINUE�. You will be asked if you want to quit the TestExecutive Program.
6. The default selection is YES. Press �ENTER� to exit the operationveri�cation test software.
Load the default test equipment (TSCRIPT) �le
7. Insert operation veri�cation disk 1 in the default disk drive.
8. Type GET "TSCRIPT" and press �RETURN� (or the equivalentkey). Wait for the asterisk in the lower right portion of thecomputer display to disappear.
9. Type EDIT and press �RETURN�. Wait for the TSCRIPT �le toappear on the computer display.
Edit the default test equipment list
10. Scroll to CALIBRATION_STANDARDS(. This section of theTSCRIPT �le shows the default list of test equipment. Thevariable names with corresponding descriptions are shown inTable 2-2.
Table 2-1 lists the supported test equipment you need to performall the operation veri�cation tests on the HP 8572A microwaveEMI receiver. The equipment is grouped according to function;each group of equipment is separated by a horizontal line. At
2-22 Operation Verification HP 8572A EMI Receiver User's Guide

least one piece of test equipment must be selected from eachgroup.
Table 2-1. Test Equipment
Default Test Equipment Model Number DefaultAddress
* Power meter HP 436A power meter 713
Power meter HP 437B power meter 713
Power meter HP 438A dual-channelpower meter
713
* Power sensor HP 8481D N(m) powersensor
None
* Power sensor HP 8482A N(m) powersensor
None
* Power sensor HP 8484A N(m) powersensor
None
Power sensor HP 8485D APC-3.5 mm(m)power sensor
None
Pulse generator HP 8160A programmablepulse generator
712
* Pulse generator HP 8161A programmablepulse generator
712
Pulse/Functiongenerator
HP 8116A pulse/functiongenerator
712
* Synthesizedsweeper
HP 83630A synthesizedsweeper1
716
Synthesizedsweeper
HP 83640A synthesizedsweeper1
716
Synthesizedsweeper
HP 83650A synthesizedsweeper1
716
Synthesizedsweeper
HP 8340A synthesizedsweeper
716
Synthesizedsweeper
HP 8340B synthesizedsweeper
716
* Synthesizer/Levelgenerator
HP 3335A synthesizer/levelgenerator
704
* Universal counter HP 5316A universal counter2 720
Universal counter HP 5316B universal counter2 720
* This is the factory-set default test instrument that the operationveri�cation software identi�es. This default instrument may bechanged to any supported equipment shown in this table.
1 When using an HP 8360 Series synthesized sweeper, you must select Analyzrunder Adrs Menu Programming Language, for the operation veri�cation software tocommunicate over the HP-IB.
2 You need this instrument only if you are using an HP 8116A pulse/function generator.
HP 8572A EMI Receiver User's Guide Operation Verification 2-23
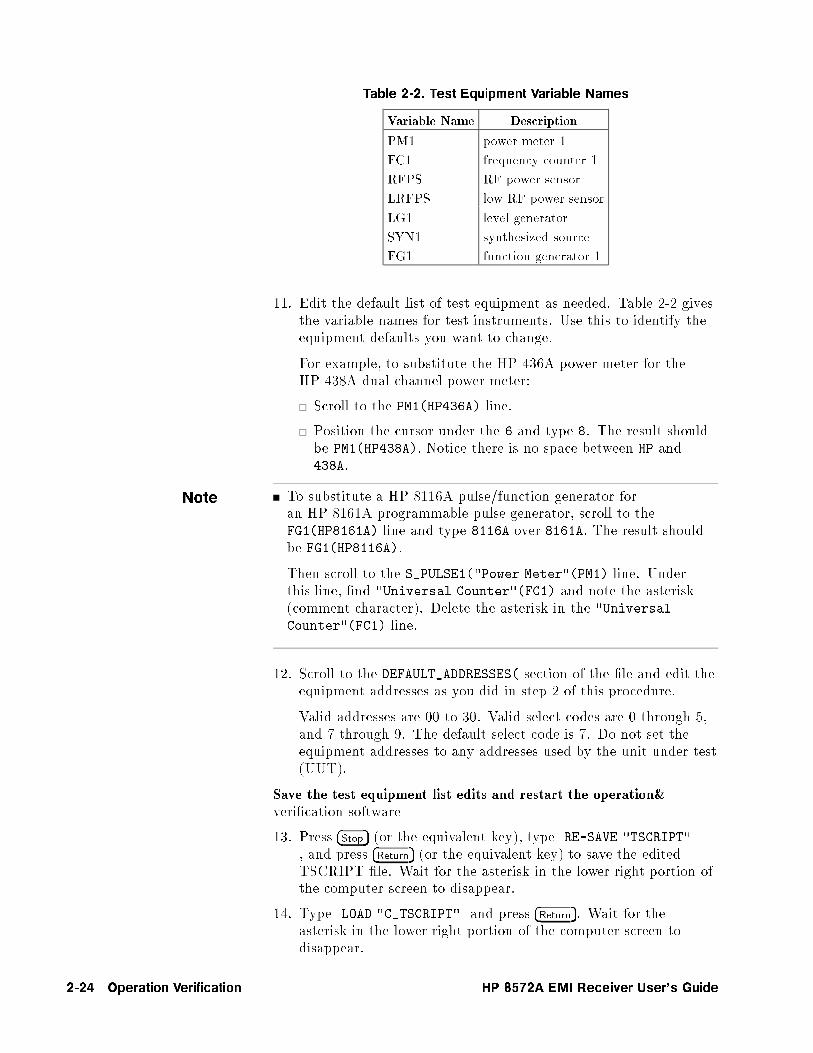
Table 2-2. Test Equipment Variable Names
Variable Name Description
PM1 power meter 1
FC1 frequency counter 1
RFPS RF power sensor
LRFPS low RF power sensor
LG1 level generator
SYN1 synthesized source
FG1 function generator 1
11. Edit the default list of test equipment as needed. Table 2-2 givesthe variable names for test instruments. Use this to identify theequipment defaults you want to change.
For example, to substitute the HP 436A power meter for theHP 438A dual-channel power meter:
Scroll to the PM1(HP436A) line.
Position the cursor under the 6 and type 8. The result shouldbe PM1(HP438A). Notice there is no space between HP and438A.
Note To substitute a HP 8116A pulse/function generator foran HP 8161A programmable pulse generator, scroll to theFG1(HP8161A) line and type 8116A over 8161A. The result shouldbe FG1(HP8116A).
Then scroll to the S_PULSE1("Power Meter"(PM1) line. Underthis line, �nd "Universal Counter"(FC1) and note the asterisk(comment character). Delete the asterisk in the "UniversalCounter"(FC1) line.
12. Scroll to the DEFAULT_ADDRESSES( section of the �le and edit theequipment addresses as you did in step 2 of this procedure.
Valid addresses are 00 to 30. Valid select codes are 0 through 5,and 7 through 9. The default select code is 7. Do not set theequipment addresses to any addresses used by the unit under test(UUT).
Save the test equipment list edits and restart the operation&veri�cation software
13. Press �Stop� (or the equivalent key), type RE-SAVE "TSCRIPT"
, and press �Return� (or the equivalent key) to save the editedTSCRIPT �le. Wait for the asterisk in the lower right portion ofthe computer screen to disappear.
14. Type LOAD "C_TSCRIPT" and press �Return�. Wait for theasterisk in the lower right portion of the computer screen todisappear.
2-24 Operation Verification HP 8572A EMI Receiver User's Guide

15. Type RUN and press �Return�. When the message TEST SCRIPT
CONVERSION COMPLETED appears on the computer screen, theoperation veri�cation software is ready to load and run.
16. Continue at the beginning of the operation veri�cation software.Refer to \Step 3. Select the EMI receiver system model".
HP 8572A EMI Receiver User's Guide Operation Verification 2-25
Optional: Entering power sensor calibration factors
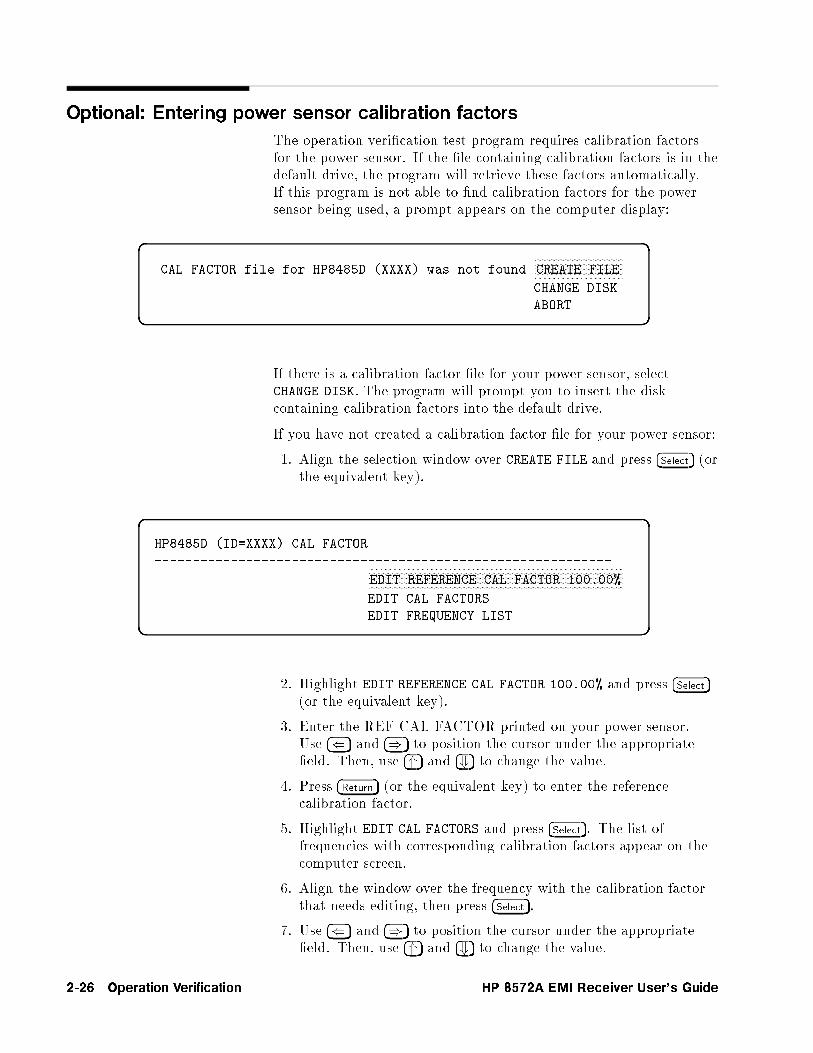
The operation veri�cation test program requires calibration factorsfor the power sensor. If the �le containing calibration factors is in thedefault drive, the program will retrieve these factors automatically.If this program is not able to �nd calibration factors for the powersensor being used, a prompt appears on the computer display:
d a
c b
CAL FACTOR file for HP8485D (XXXX) was not foundNNNNNNNNNNNNNNNNNNNNNNNNNNNNNNNNNNNCREATE FILE
CHANGE DISK
ABORT
If there is a calibration factor �le for your power sensor, selectCHANGE DISK. The program will prompt you to insert the diskcontaining calibration factors into the default drive.
If you have not created a calibration factor �le for your power sensor:
1. Align the selection window over CREATE FILE and press �Select� (orthe equivalent key).
d a
c b
HP8485D (ID=XXXX) CAL FACTOR
------------------------------------------------------------NNNNNNNNNNNNNNNNNNNNNNNNNNNNNNNNNNNNNNNNNNNNNNNNNNNNNNNNNNNNNNNNNNNNNNNNNNNNNNNNNNNNNNNNNNNNNNNNNNNNEDIT REFERENCE CAL FACTOR 100.00%
EDIT CAL FACTORS
EDIT FREQUENCY LIST
2. Highlight EDIT REFERENCE CAL FACTOR 100.00% and press �Select�(or the equivalent key).
3. Enter the REF CAL FACTOR printed on your power sensor.Use �(� and �)� to position the cursor under the appropriate�eld. Then, use �*� and �+� to change the value.
4. Press �Return� (or the equivalent key) to enter the referencecalibration factor.
5. Highlight EDIT CAL FACTORS and press �Select�. The list offrequencies with corresponding calibration factors appear on thecomputer screen.
6. Align the window over the frequency with the calibration factorthat needs editing, then press �Select�.
7. Use �(� and �)� to position the cursor under the appropriate�eld. Then, use �*� and �+� to change the value.
2-26 Operation Verification HP 8572A EMI Receiver User's Guide
8. Press �Return� (or equivalent key) to enter the calibration factor.
9. Repeat steps 6 through 8 until all calibration factors are entered.
10. Press �Home� (or the equivalent key) to exit the CAL FACTOR
display.
11. Highlight EDIT FREQUENCY LIST. The list of frequencies appearson the computer screen.
12. Place the selection bar where you want to add, insert, delete, oredit a frequency, then press �Select�.
13. Highlight ADD, INSERT, DELETE, or EDIT, then press �Select�.
14. Use the �(� and �)� to position the cursor under theappropriate �eld. Then use �*� and �+� to change the frequency.
15. Press �Home� to exit the FREQUENCY LIST display.
Note Frequencies are sorted in ascending order when you exit theFREQUENCY LIST display.
Choose YES if you want to edit the calibration factors. If you wantto store the modi�ed calibration factor �le, insert the disk to beused to store calibration data in the default drive.
Choose NO to quit editing, and to go on to the next step.
Press �CONTINUE� to exit the program.
HP 8572A EMI Receiver User's Guide Operation Verification 2-27

3
Test Descriptions
In this chapter, you'll �nd equipment setup diagrams, parts lists, andtest descriptions for each operation veri�cation test available for anHP 8572A microwave EMI receiver.
HP 8572A EMI Receiver User's Guide Test Descriptions 3-1
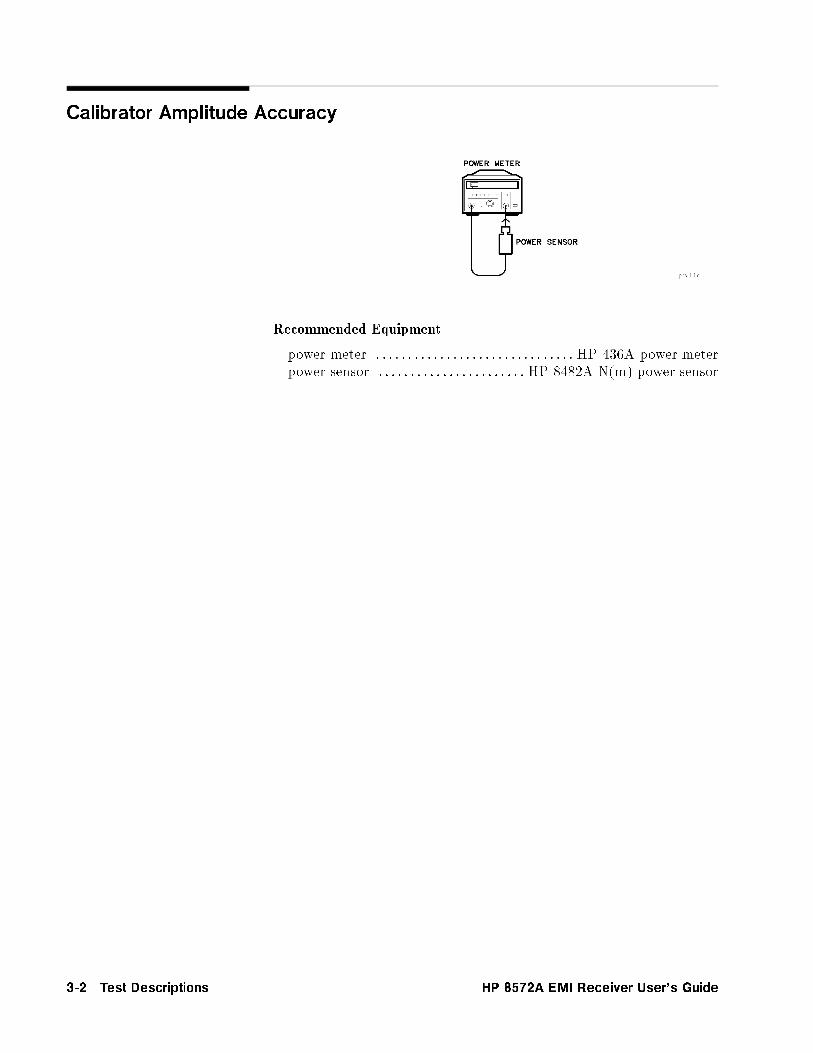
Calibrator Amplitude Accuracy
Recommended Equipment
power meter : : : : : : : : : : : : : : : : : : : : : : : : : : : : : : : HP 436A power meterpower sensor : : : : : : : : : : : : : : : : : : : : : : : HP 8482A N(m) power sensor
3-2 Test Descriptions HP 8572A EMI Receiver User's Guide
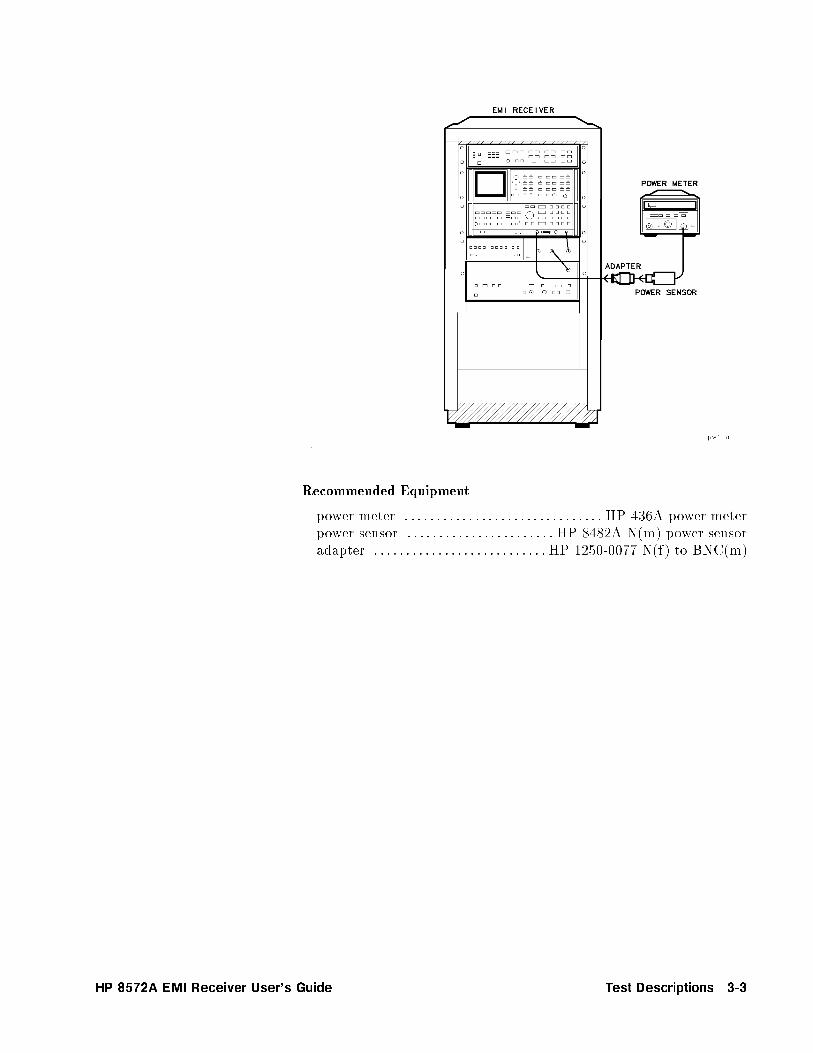
Recommended Equipment
power meter : : : : : : : : : : : : : : : : : : : : : : : : : : : : : : : HP 436A power meterpower sensor : : : : : : : : : : : : : : : : : : : : : : : HP 8482A N(m) power sensoradapter : : : : : : : : : : : : : : : : : : : : : : : : : : : HP 1250-0077 N(f) to BNC(m)
HP 8572A EMI Receiver User's Guide Test Descriptions 3-3

Purpose This test measures the 100 MHz calibrator of theEMI receiver system for amplitude accuracy.
Description \Calibrator Amplitude Accuracy" relies on the accuracyof the power meter and power sensor. First, the power meter iscalibrated. Then the power sensor is connected to the 100 MHzcalibrator output. The calibrator amplitude is measured andcorrected using the calibration factor of the power sensor.
Note \Optional: Entering power sensor calibration factors," in chapter 2,discusses requirements for entering calibration factors for the powersensor being used.
3-4 Test Descriptions HP 8572A EMI Receiver User's Guide

Log Fidelity
Recommended Equipment
synthesizer/level generator : :HP 3335A synthesizer/level generatorcable : : :HP 10503A 122 cm (48 in) 50 coax BNC(m) to BNC(m)
HP 8572A EMI Receiver User's Guide Test Descriptions 3-5

Purpose This test measures the relative on-screen log scale �delity.Log scale �delity is measured in the display CRT's upper ninedivisions.
Note You must complete this test before you perform any amplitudeaccuracy test.
Description \Log Fidelity" relies on the attenuator accuracy of theHP 3335A synthesizer/level generator. Although log �delity is notdirectly speci�ed for the HP 8572A microwave EMI receiver, it is oneof the contributors to absolute amplitude accuracy in log scale mode.
The unit under test is set for a reference level of +13 dBm and theresolution bandwidth or QPA (CISPR) bandwidth to be tested.The level-generator amplitude is adjusted to set the signal at thereference level.The di�erence between the level generator and markeramplitudes establishes a reference error at this point.
The level generator is stepped down in 2 dB increments until thesignal is 70 dB below top screen or 10 dB above the displayedaverage noise, whichever is higher. The amplitude di�erence betweenthe level generator and the displayed trace average is measured ateach level generator step. The di�erence between the amplitude errorat each level generator step and the reference error is the log �delityof the EMI receiver system.
Test Settings
Function Settings
RF FREQ 30 MHz
RFPS (atten) 43 dB
EMI receiver system (input) receiver INPUT 1
SA (atten) 10 dB
QPA �lter 200 Hz, 9 kHz, 120 kHz
RES BW 3 kHz, 10 kHz, 100 kHz, 1 MHz
Scale Log 10 dB
REF LEVEL 13 dBm
Log �delity for the EMI receiver system is tested to the followinglimits:
Log Fidelity Test Limits
Signal Level(dB below top screen)
Log Fidelity(dB)
0 dB Reference
> 0 dB to � 70 dB �0.60 dB
3-6 Test Descriptions HP 8572A EMI Receiver User's Guide
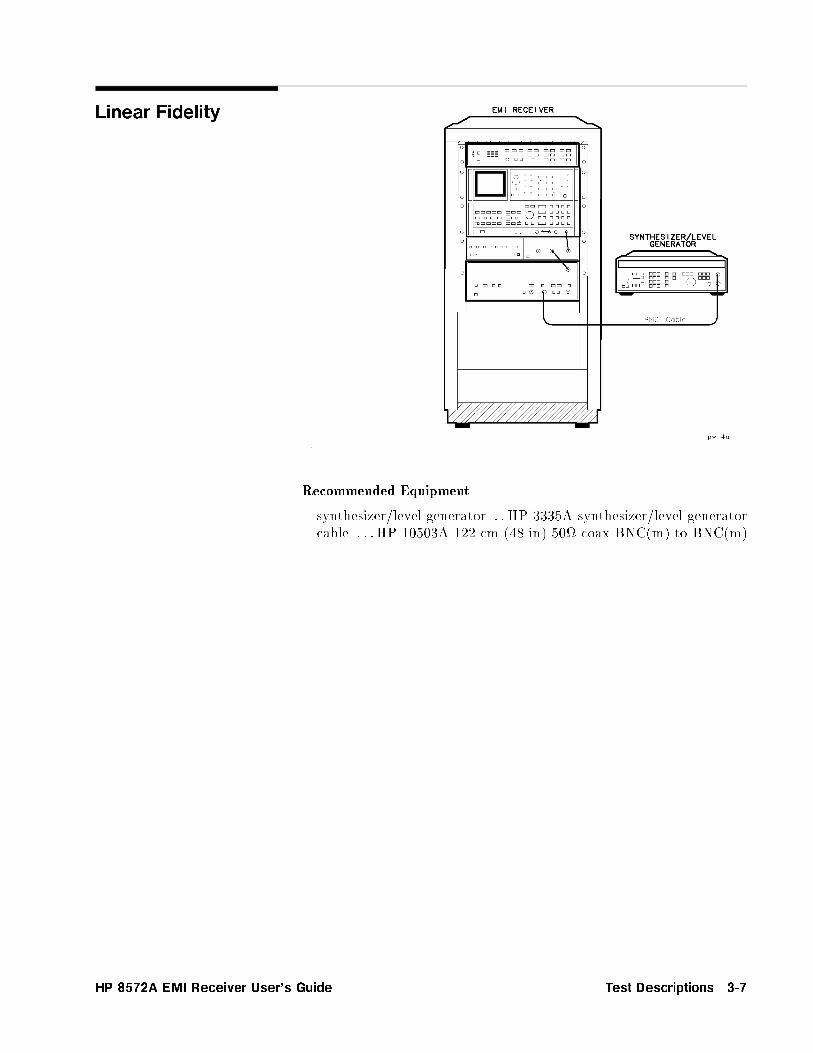
Linear Fidelity
Recommended Equipment
synthesizer/level generator : :HP 3335A synthesizer/level generatorcable : : :HP 10503A 122 cm (48 in) 50 coax BNC(m) to BNC(m)
HP 8572A EMI Receiver User's Guide Test Descriptions 3-7
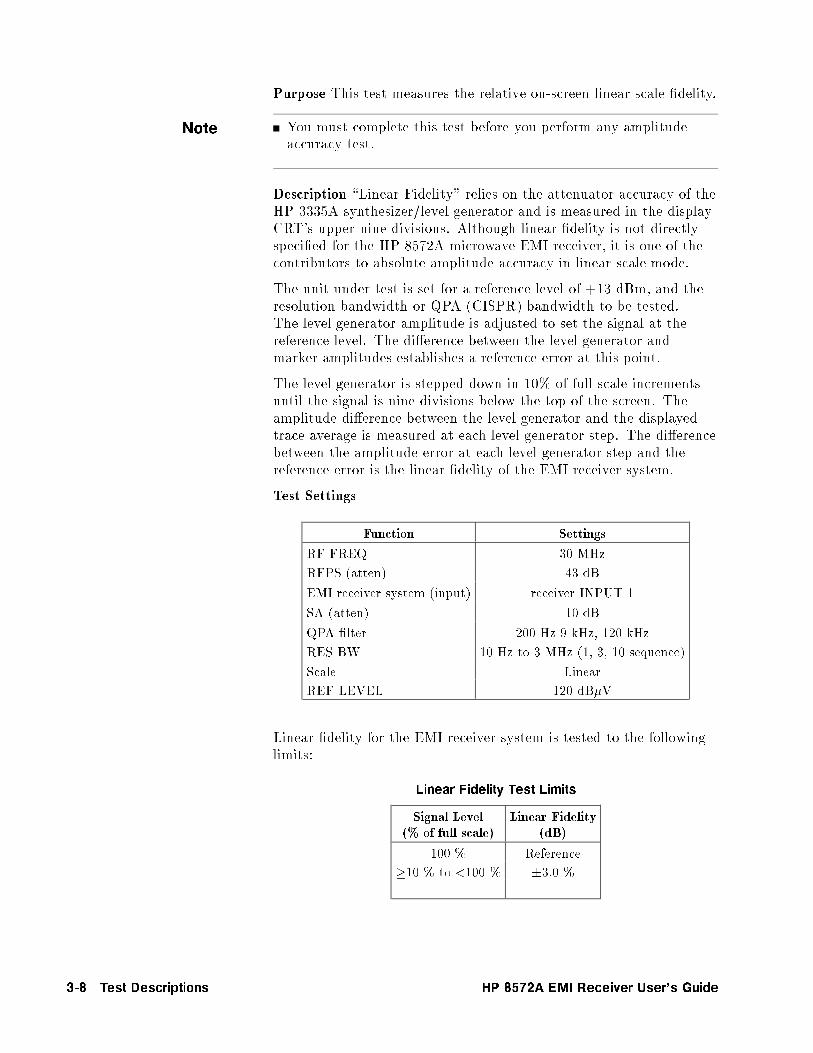
Purpose This test measures the relative on-screen linear scale �delity.
Note You must complete this test before you perform any amplitudeaccuracy test.
Description \Linear Fidelity" relies on the attenuator accuracy of theHP 3335A synthesizer/level generator and is measured in the displayCRT's upper nine divisions. Although linear �delity is not directlyspeci�ed for the HP 8572A microwave EMI receiver, it is one of thecontributors to absolute amplitude accuracy in linear scale mode.
The unit under test is set for a reference level of +13 dBm, and theresolution bandwidth or QPA (CISPR) bandwidth to be tested.The level generator amplitude is adjusted to set the signal at thereference level. The di�erence between the level generator andmarker amplitudes establishes a reference error at this point.
The level generator is stepped down in 10% of full scale incrementsuntil the signal is nine divisions below the top of the screen. Theamplitude di�erence between the level generator and the displayedtrace average is measured at each level generator step. The di�erencebetween the amplitude error at each level generator step and thereference error is the linear �delity of the EMI receiver system.
Test Settings
Function Settings
RF FREQ 30 MHz
RFPS (atten) 43 dB
EMI receiver system (input) receiver INPUT 1
SA (atten) 10 dB
QPA �lter 200 Hz 9 kHz, 120 kHz
RES BW 10 Hz to 3 MHz (1, 3, 10 sequence)
Scale Linear
REF LEVEL 120 dB�V
Linear �delity for the EMI receiver system is tested to the followinglimits:
Linear Fidelity Test Limits
Signal Level(% of full scale)
Linear Fidelity(dB)
100 % Reference
�10 % to <100 % �3.0 %
3-8 Test Descriptions HP 8572A EMI Receiver User's Guide

Reference Level Switching Uncertainty
Recommended Equipment
synthesizer/level generator : :HP 3335A synthesizer/level generatorcable : : :HP 10503A 122 cm (48 in) 50 coax BNC(m) to BNC(m)
HP 8572A EMI Receiver User's Guide Test Descriptions 3-9
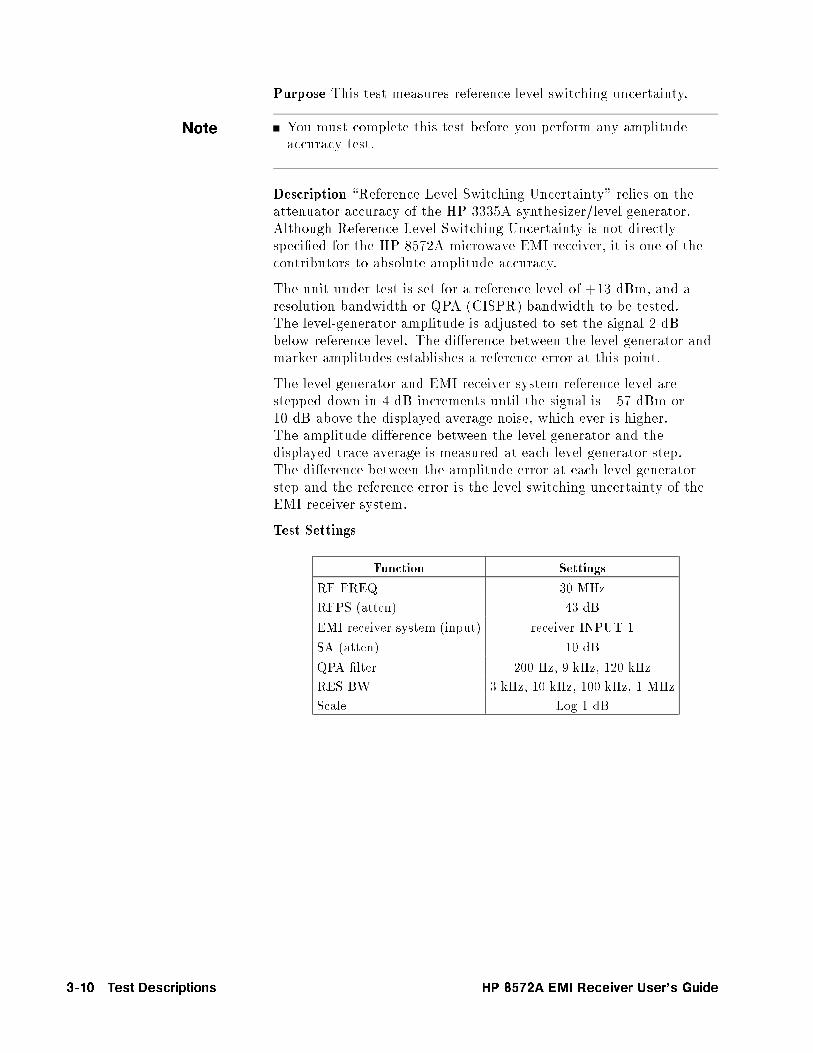
Purpose This test measures reference level switching uncertainty.
Note You must complete this test before you perform any amplitudeaccuracy test.
Description \Reference Level Switching Uncertainty" relies on theattenuator accuracy of the HP 3335A synthesizer/level generator.Although Reference Level Switching Uncertainty is not directlyspeci�ed for the HP 8572A microwave EMI receiver, it is one of thecontributors to absolute amplitude accuracy.
The unit under test is set for a reference level of +13 dBm, and aresolution bandwidth or QPA (CISPR) bandwidth to be tested.The level-generator amplitude is adjusted to set the signal 2 dBbelow reference level. The di�erence between the level generator andmarker amplitudes establishes a reference error at this point.
The level generator and EMI receiver system reference level arestepped down in 4 dB increments until the signal is �57 dBm or10 dB above the displayed average noise, which ever is higher.The amplitude di�erence between the level generator and thedisplayed trace average is measured at each level generator step.The di�erence between the amplitude error at each level generatorstep and the reference error is the level switching uncertainty of theEMI receiver system.
Test Settings
Function Settings
RF FREQ 30 MHz
RFPS (atten) 43 dB
EMI receiver system (input) receiver INPUT 1
SA (atten) 10 dB
QPA �lter 200 Hz, 9 kHz, 120 kHz
RES BW 3 kHz, 10 kHz, 100 kHz, 1 MHz
Scale Log 1 dB
3-10 Test Descriptions HP 8572A EMI Receiver User's Guide
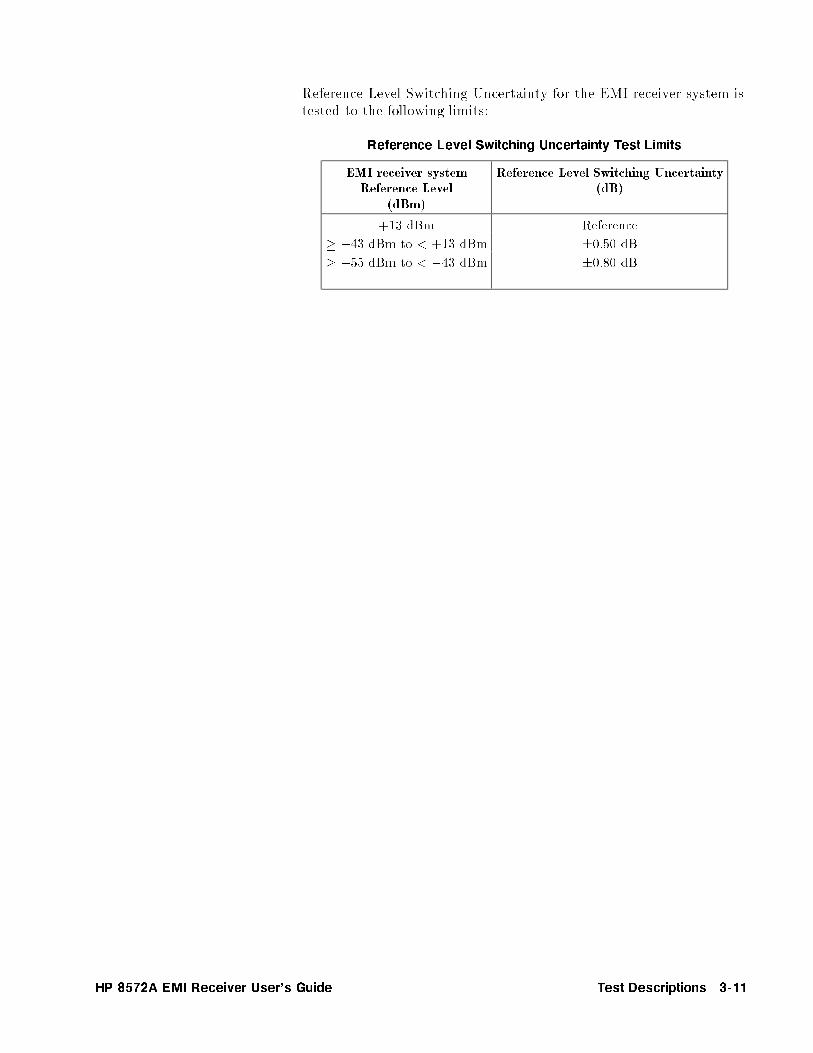
Reference Level Switching Uncertainty for the EMI receiver system istested to the following limits:
Reference Level Switching Uncertainty Test Limits
EMI receiver systemReference Level
(dBm)
Reference Level Switching Uncertainty(dB)
+13 dBm Reference
� �43 dBm to < +13 dBm �0.50 dB
� �55 dBm to < �43 dBm �0.80 dB
HP 8572A EMI Receiver User's Guide Test Descriptions 3-11
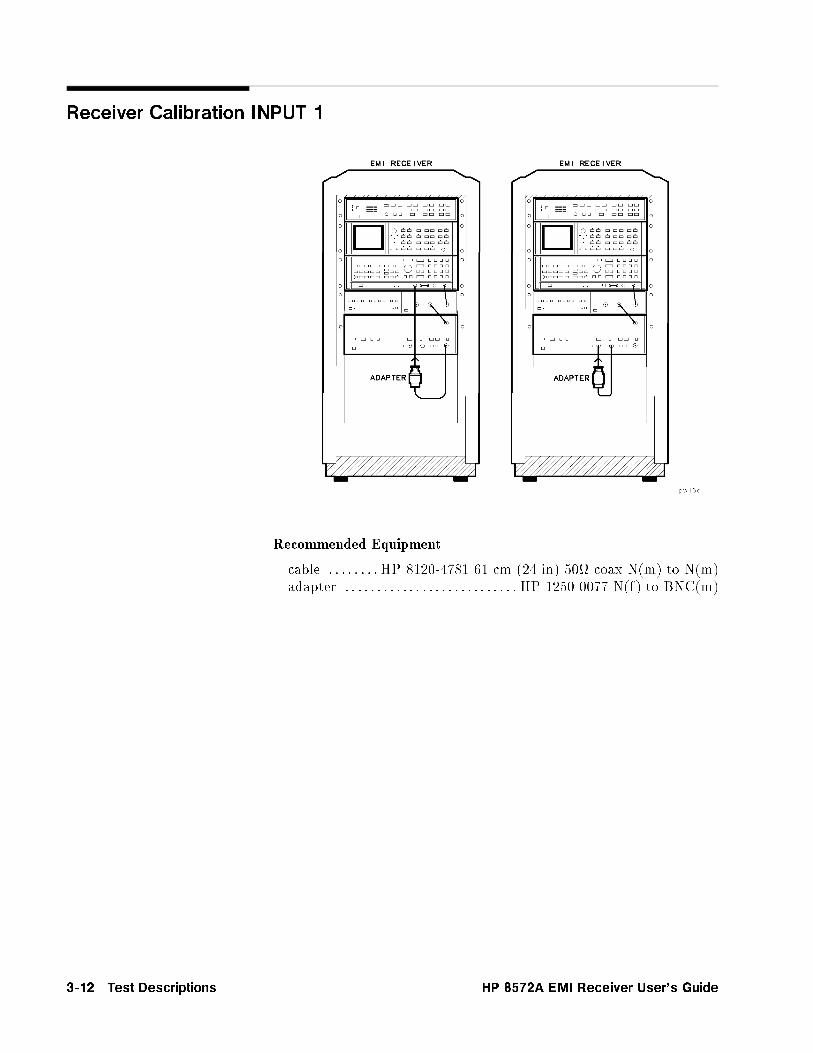
Receiver Calibration INPUT 1
Recommended Equipment
cable : : : : : : : :HP 8120-4781 61 cm (24 in) 50 coax N(m) to N(m)adapter : : : : : : : : : : : : : : : : : : : : : : : : : : : HP 1250-0077 N(f) to BNC(m)
3-12 Test Descriptions HP 8572A EMI Receiver User's Guide

Purpose This test calibrates receiver INPUT 1 of theEMI receiver system.
Description Two calibration routines are performed during \ReceiverCalibration INPUT 1". The settings used during each of these twocalibration routines are shown in the tables on the following pages.
Receiver Calibration INPUT 1 consists of two setups. The �rst setupcalibrates the spectrum analyzer with the RF preselector in bypassmode. Recall-9 calibrates the spectrum analyzer's center frequencyfor narrow resolution bandwidths of 10 Hz through 1 kHz.
In the second setup, receiver INPUT 1 is calibrated at predeterminedpoints for amplitude accuracy using the comb generator output.These points are chosen by the internal calibration sequence (CALSEQ) in the RF preselector. receiver INPUT 1 is calibrated between9 kHz and 50 MHz.
To make calibrated measurements with the EMI receiver system,CAL SEQ must be run for each set of EMI receiver system settings.This test runs CAL SEQ at the settings that will be used insubsequent tests. The resulting calibration factors are stored in thecontroller memory and loaded into the RF preselector when they areneeded.
Test Settings
Settings for Amplitude Accy. INPUT 1 (10 dB AT and
0 dB AT), 20 Hz-9 kHz
Function Settings (Manual)
RF FREQ 20 Hz to 9 kHz
RES BW 10 Hz
RFPS (atten) 0 dB
SA (atten) 10 dB or 0 dB
Scale Log 2 dB
Settings for Amplitude Accy. INPUT 1 (10 dB AT and
0 dB AT)
Function Band A (Manual) Band B (Auto) Band C (Auto)
RF FREQ 9 kHz to 150 kHz 200 kHz to 30 MHz 30 MHz to 50 MHz
QPA Filter 200 Hz 9 kHz 120 kHz
RES BW 3 kHz 100 kHz 1 MHz
RFPS (atten) 0 dB 0 dB 0 dB
SA (atten) 10 dB or 0 dB 10 dB or 0 dB 10 dB or 0 dB
Scale Linear Linear Linear
HP 8572A EMI Receiver User's Guide Test Descriptions 3-13
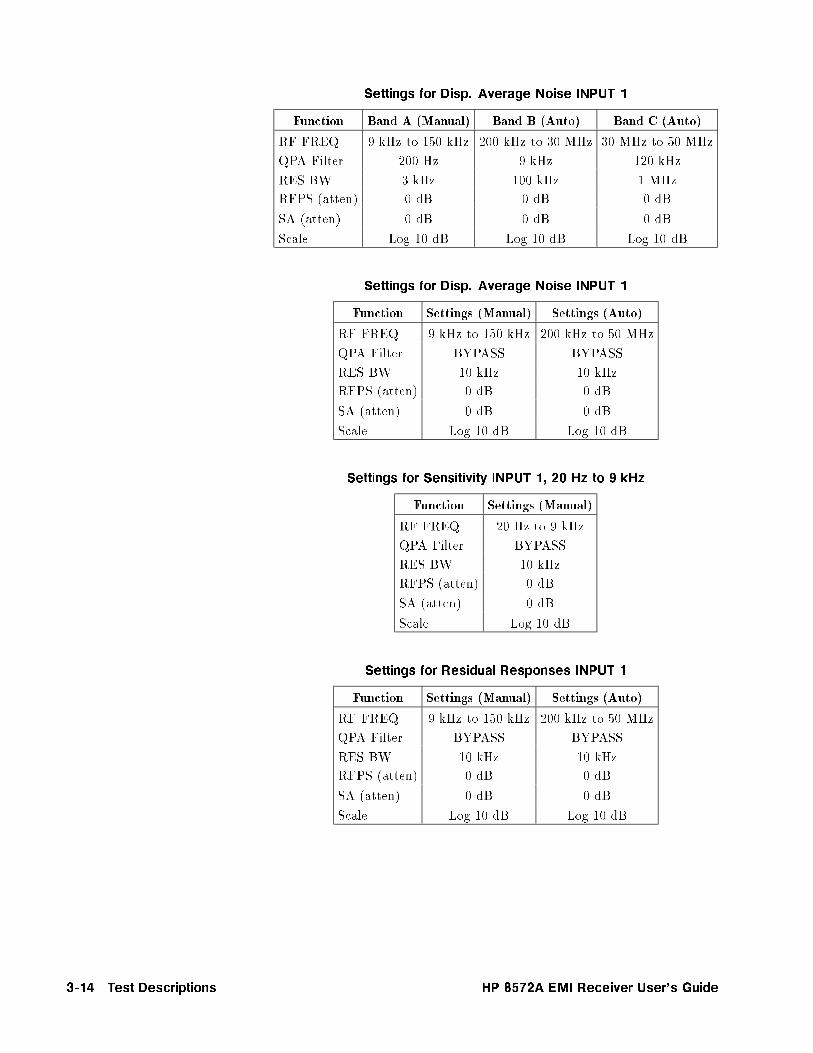
Settings for Disp. Average Noise INPUT 1
Function Band A (Manual) Band B (Auto) Band C (Auto)
RF FREQ 9 kHz to 150 kHz 200 kHz to 30 MHz 30 MHz to 50 MHz
QPA Filter 200 Hz 9 kHz 120 kHz
RES BW 3 kHz 100 kHz 1 MHz
RFPS (atten) 0 dB 0 dB 0 dB
SA (atten) 0 dB 0 dB 0 dB
Scale Log 10 dB Log 10 dB Log 10 dB
Settings for Disp. Average Noise INPUT 1
Function Settings (Manual) Settings (Auto)
RF FREQ 9 kHz to 150 kHz 200 kHz to 50 MHz
QPA Filter BYPASS BYPASS
RES BW 10 kHz 10 kHz
RFPS (atten) 0 dB 0 dB
SA (atten) 0 dB 0 dB
Scale Log 10 dB Log 10 dB
Settings for Sensitivity INPUT 1, 20 Hz to 9 kHz
Function Settings (Manual)
RF FREQ 20 Hz to 9 kHz
QPA Filter BYPASS
RES BW 10 kHz
RFPS (atten) 0 dB
SA (atten) 0 dB
Scale Log 10 dB
Settings for Residual Responses INPUT 1
Function Settings (Manual) Settings (Auto)
RF FREQ 9 kHz to 150 kHz 200 kHz to 50 MHz
QPA Filter BYPASS BYPASS
RES BW 10 kHz 10 kHz
RFPS (atten) 0 dB 0 dB
SA (atten) 0 dB 0 dB
Scale Log 10 dB Log 10 dB
3-14 Test Descriptions HP 8572A EMI Receiver User's Guide
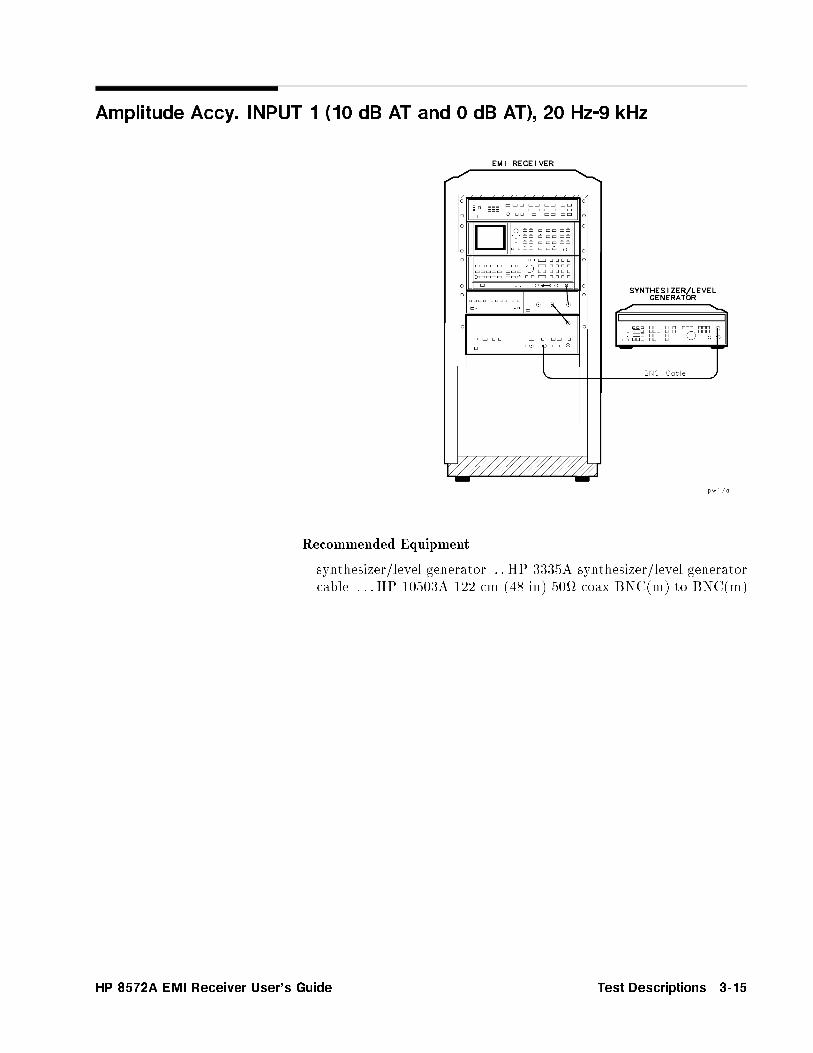
Amplitude Accy. INPUT 1 (10 dB AT and 0 dB AT), 20 Hz-9 kHz
Recommended Equipment
synthesizer/level generator : :HP 3335A synthesizer/level generatorcable : : :HP 10503A 122 cm (48 in) 50 coax BNC(m) to BNC(m)
HP 8572A EMI Receiver User's Guide Test Descriptions 3-15

Purpose This test measures absolute amplitude accuracy throughreceiver INPUT 1.
Note Depending on the order in which you perform the operationveri�cation tests, the software may invoke a calibration adjustmentautomatically, before running this test. Refer to \ReceiverCalibration INPUT 1".
To assure test accuracy, you must complete \Receiver CalibrationINPUT 1", \Log Fidelity", \Linear Fidelity", and \Reference LevelSwitching Uncertainty" (20 Hz to 9 kHz) before you perform thistest.
Description
\Amplitude Accy. INPUT 1 (10 dB AT and 0 dB AT),20 Hz-9 kHz" relies on the amplitude accuracy of the HP 3335Asynthesizer/level generator and is measured by injecting a referencepower from the HP 3335A synthesizer/level generator directlyinto the system. Di�erences in the amplitude measured by theEMI receiver system are compared to the amplitude setting of theHP 3335A synthesizer/level generator. The amplitude accuracy ofthe EMI receiver system is the di�erence between the amplitudesetting of the HP 3335A synthesizer/level generator and theEMI receiver system's measurement.
\Log Fidelity", \Linear Fidelity", \Reference Level SwitchingUncertainty", and the accuracy of the EMI receiver system's internalcalibration sequence contribute to the amplitude accuracy of theEMI receiver system in any valid setting. These error contributorsare measured in separate tests.
Test Settings
Amplitude accuracy is tested at both 10 dB and 0 dB spectrumanalyzer input attenuation. The settings used during this test are:
Function Settings
RF FREQ 20 Hz to 9 kHz
RES BW 10 Hz
QPA �lter BYPASS
RFPS (atten) 0 dB
SA (atten) 10 dB or 0 dB
Scale Log 1 dB
3-16 Test Descriptions HP 8572A EMI Receiver User's Guide

Amplitude Accy. INPUT 1 (10 dB AT and 0 dB AT)
Recommended Equipment
synthesizer/level generator : :HP 3335A synthesizer/level generatorcable : : :HP 10503A 122 cm (48 in) 50 coax BNC(m) to BNC(m)
HP 8572A EMI Receiver User's Guide Test Descriptions 3-17

Purpose This test measures absolute amplitude accuracy throughreceiver INPUT 1.
Note Depending on the order in which you perform the operationveri�cation tests, the software may invoke a calibration adjustmentautomatically, before running this test. Refer to \ReceiverCalibration INPUT 1".
To assure test accuracy, you must complete \Receiver CalibrationINPUT 1", \Log Fidelity", \Linear Fidelity", and \Reference LevelSwitching Uncertainty" before you perform this test.
Description \Amplitude Accy. INPUT 1 (10 dB AT and0 dB AT)" relies on the amplitude accuracy of the HP 3335Asynthesizer/level generator and is measured by injecting a referencepower from the HP 3335A synthesizer/level generator directlyinto the system. Di�erences in the amplitude measured by theEMI receiver system are compared to the amplitude setting of theHP 3335A synthesizer/level generator. The amplitude accuracy ofthe EMI receiver system is the di�erence between the amplitudesetting of the HP 3335A synthesizer/level generator and theEMI receiver system's measurement.
\Log Fidelity", \Linear Fidelity", \Reference Level SwitchingUncertainty", and the accuracy of the EMI receiver system's internalcalibration sequence contribute to the amplitude accuracy of theEMI receiver system in any valid setting. These error contributorsare measured in separate tests.
Test Settings
Amplitude accuracy is tested at both 10 dB and 0 dB spectrumanalyzer input attenuation. The settings used during this test are:
Settings for Amplitude Accy. INPUT 1 (10 dB AT and
0 dB AT)
Function Band A Band B Band C
RF FREQ 9 kHz to 150 kHz 150 kHz to 30 MHz 30 MHz to 50 MHz
QPA �lter 200 Hz 9 kHz 120 kHz
RES BW 3 kHz 100 kHz 1 MHz
RFPS (atten) 0 dB 0 dB 0 dB
SA (atten) 10 dB or 0 dB 10 dB or 0 dB 10 dB or 0 dB
Scale Linear Linear Linear
3-18 Test Descriptions HP 8572A EMI Receiver User's Guide

Disp. Average Noise INPUT 1
Recommended Equipment
50 load : : : : : : : : : : : : : : : : : : : HP 11593A 50 BNC(m) termination
HP 8572A EMI Receiver User's Guide Test Descriptions 3-19
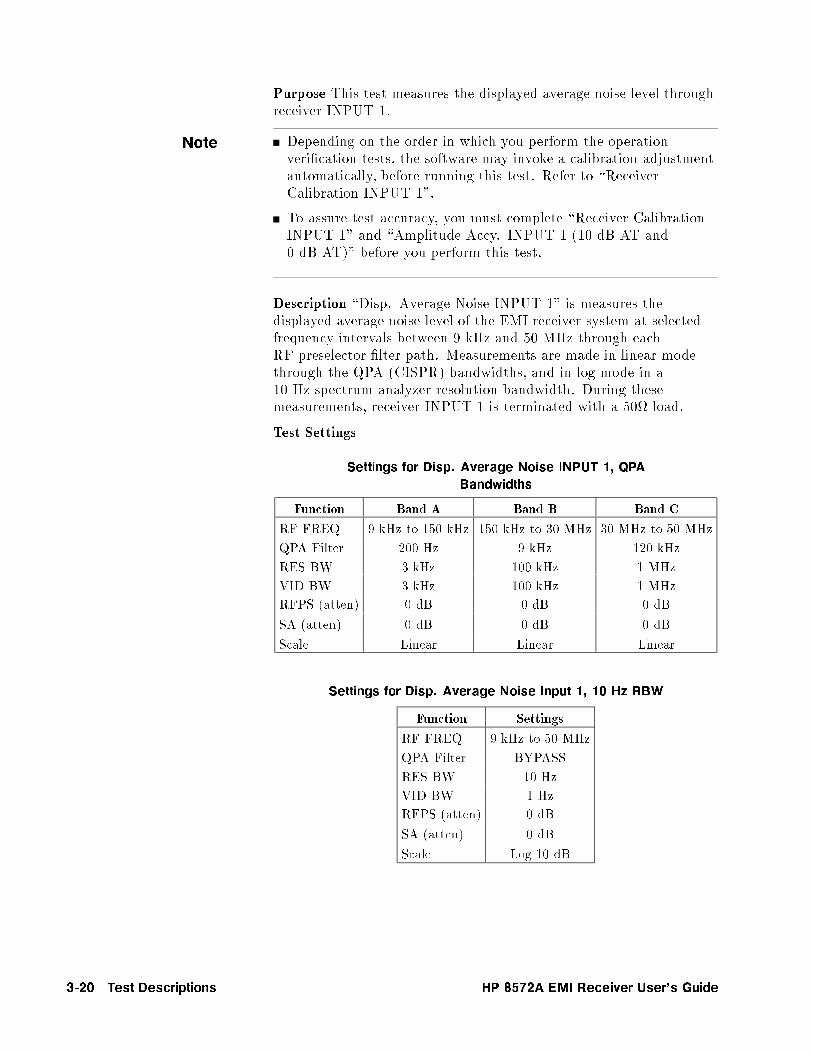
Purpose This test measures the displayed average noise level throughreceiver INPUT 1.
Note Depending on the order in which you perform the operationveri�cation tests, the software may invoke a calibration adjustmentautomatically, before running this test. Refer to \ReceiverCalibration INPUT 1".
To assure test accuracy, you must complete \Receiver CalibrationINPUT 1" and \Amplitude Accy. INPUT 1 (10 dB AT and0 dB AT)" before you perform this test.
Description \Disp. Average Noise INPUT 1" is measures thedisplayed average noise level of the EMI receiver system at selectedfrequency intervals between 9 kHz and 50 MHz through eachRF preselector �lter path. Measurements are made in linear modethrough the QPA (CISPR) bandwidths, and in log mode in a10 Hz spectrum analyzer resolution bandwidth. During thesemeasurements, receiver INPUT 1 is terminated with a 50 load.
Test Settings
Settings for Disp. Average Noise INPUT 1, QPA
Bandwidths
Function Band A Band B Band C
RF FREQ 9 kHz to 150 kHz 150 kHz to 30 MHz 30 MHz to 50 MHz
QPA Filter 200 Hz 9 kHz 120 kHz
RES BW 3 kHz 100 kHz 1 MHz
VID BW 3 kHz 100 kHz 1 MHz
RFPS (atten) 0 dB 0 dB 0 dB
SA (atten) 0 dB 0 dB 0 dB
Scale Linear Linear Linear
Settings for Disp. Average Noise Input 1, 10 Hz RBW
Function Settings
RF FREQ 9 kHz to 50 MHz
QPA Filter BYPASS
RES BW 10 Hz
VID BW 1 Hz
RFPS (atten) 0 dB
SA (atten) 0 dB
Scale Log 10 dB
3-20 Test Descriptions HP 8572A EMI Receiver User's Guide
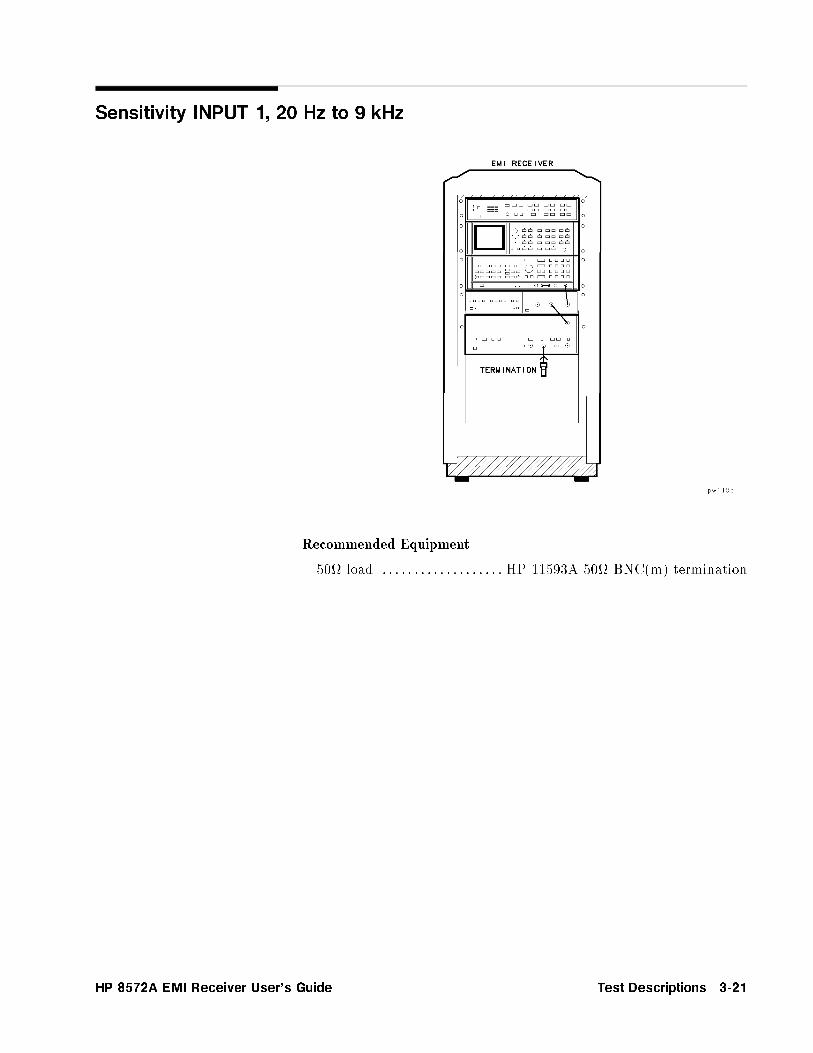
Sensitivity INPUT 1, 20 Hz to 9 kHz
Recommended Equipment
50 load : : : : : : : : : : : : : : : : : : : HP 11593A 50 BNC(m) termination
HP 8572A EMI Receiver User's Guide Test Descriptions 3-21

Purpose This test measures the sensitivity of receiver INPUT 1 from20 Hz{9 kHz.
Note Depending on the order in which you perform the operationveri�cation tests, the software may invoke a calibration adjustmentautomatically, before running this test. Refer to \ReceiverCalibration INPUT 1".
To assure test accuracy, you must complete \Receiver CalibrationINPUT 1" and \Amplitude Accy. INPUT 1 (10 dB AT and0 dB AT)" before you perform this test.
Description \Sensitivity INPUT 1, 20 Hz to 9 kHz" measures thesensitivity of the EMI receiver system at selected frequency intervalsbetween 20 Hz and 9 kHz. Measurements are made in log modewith a 10 Hz resolution bandwidth. During these measurements,receiver INPUT 1 is terminated with a 50 load.
Test Settings
Settings for Sensitivity INPUT 1, 20 Hz to 9 kHz
Function Settings
RF FREQ 20 Hz to 9 kHz
QPA �lter BYPASS
RES BW 10 Hz
VID BW 1 Hz
RFPS (atten) 0 dB
SA (atten) 0 dB
Scale Log 10 dB
3-22 Test Descriptions HP 8572A EMI Receiver User's Guide
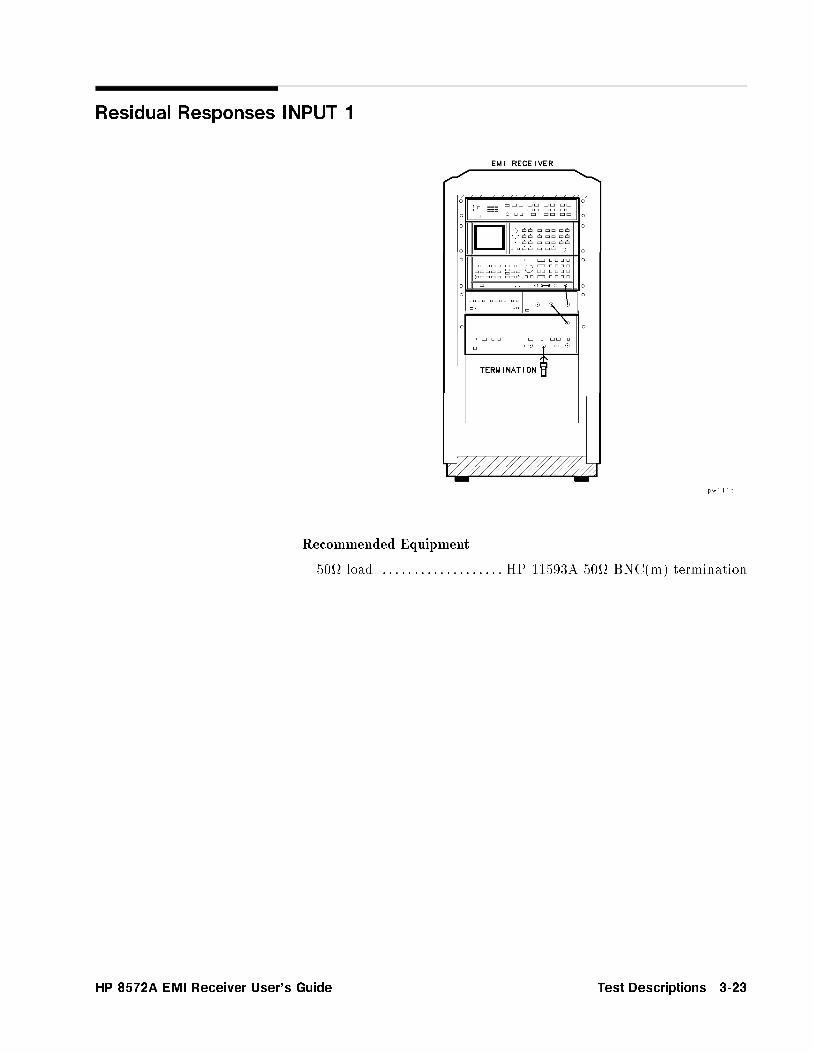
Residual Responses INPUT 1
Recommended Equipment
50 load : : : : : : : : : : : : : : : : : : : HP 11593A 50 BNC(m) termination
HP 8572A EMI Receiver User's Guide Test Descriptions 3-23

Purpose This test measures residual responses throughreceiver INPUT 1.
Note Depending on the order in which you perform the operationveri�cation tests, the software may invoke a calibration adjustmentautomatically, before running this test. Refer to \ReceiverCalibration INPUT 1".
To assure test accuracy, you must complete \Receiver CalibrationINPUT 1" and \Amplitude Accy. INPUT 1 (10 dB AT and0 dB AT)" before you perform this test.
Description \Residual Responses INPUT 1" measures theEMI receiver system for residual responses between 9 kHz and50 MHz. The measurements are made with both the RF preselectorand spectrum analyzer in 0 dB input attenuation, receiver INPUT 1terminated with a 50 load, and the quasi-peak adapter in bypassmode.
3-24 Test Descriptions HP 8572A EMI Receiver User's Guide

Bandwidth Accuracy
Bandwidth Accuracy, Setup 1
Recommended Equipment
synthesizer/level generator : :HP 3335A synthesizer/level generatorcable : : :HP 10503A 122 cm (48 in) 50 coax BNC(m) to BNC(m)
HP 8572A EMI Receiver User's Guide Test Descriptions 3-25
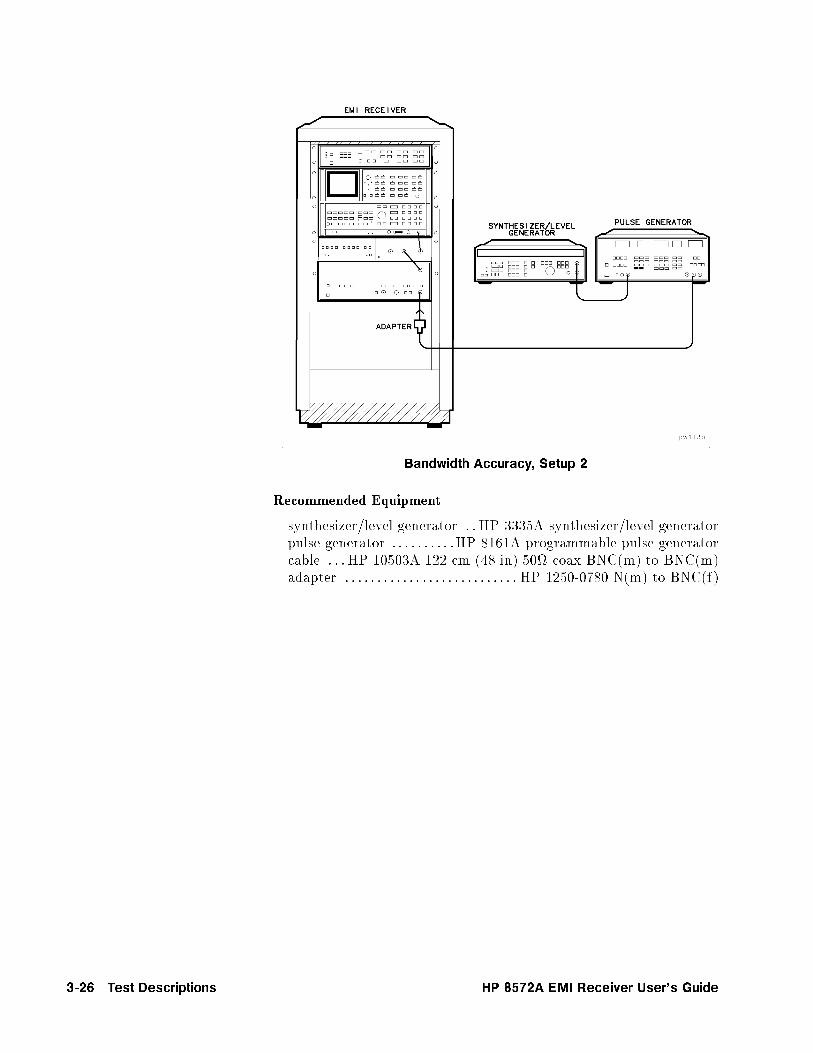
Bandwidth Accuracy, Setup 2
Recommended Equipment
synthesizer/level generator : :HP 3335A synthesizer/level generatorpulse generator : : : : : : : : : :HP 8161A programmable pulse generatorcable : : :HP 10503A 122 cm (48 in) 50 coax BNC(m) to BNC(m)adapter : : : : : : : : : : : : : : : : : : : : : : : : : : : HP 1250-0780 N(m) to BNC(f)
3-26 Test Descriptions HP 8572A EMI Receiver User's Guide
Purpose This test measures the bandwidth accuracy of theEMI receiver system.
Description Bandwidth Accuracy measures the 6 dB bandwidthand 60 dB bandwidth of the 10 Hz to 3 MHz resolution bandwidthsin the receivers. The 6 dB bandwidth accuracy is speci�ed only forthe 10 Hz to 300 Hz resolution bandwidths. The impulse bandwidthis speci�ed for the wider resolution bandwidths. However, theselectivity is speci�ed for all bandwidths, so the 6 dB bandwidth ismeasured for all bandwidths.
Resolution bandwidth settings of 10 Hz, 30 Hz, 100 Hz, and 300 Hzare speci�ed as 6 dB bandwidths and are tested separately.
In the �rst setup, the 1 kHz to 3 MHz impulse bandwidths aremeasured in the EMI receiver system. The receiver's amplituderesponse to the same pulsed-RF signal is measured both in pulsemode and in line mode. Amplitude di�erence and pulse repetitionfrequency are measured by a frequency counter. A synthesizer is usedto correct IF gain, log �delity, and bandwidth switching errors in theamplitude response.
Then, the pulse generator output is connected directly to thereceiver's input. The RF preselector must be put in bypass modewhen testing impulse bandwidths of 300 kHz to 3 MHz. If this isnot done, the bandwidth of the RF preselector will predominate,resulting in a narrower measured impulse bandwidth. These widerbandwidths are not used under 30 MHz, where the bandwidth of theRF preselector is wide enough not to a�ect the measurement.
The amplitude response corrections are then made. Thesynthesizer frequency is set to the original test frequency. TheEMI receiver system is set as it was for the line-mode measurementand the synthesizer amplitude is adjusted to match the amplitudemeasured previously. The EMI receiver system is then set as it wasfor the pulse-mode measurement and the synthesizer amplitudeis adjusted to match the amplitude measured previously. Thesetwo synthesizer amplitude settings are recorded and used in thecalculation of the impulse bandwidth.
HP 8572A EMI Receiver User's Guide Test Descriptions 3-27

Pulse Response
Power Meter Calibration
Recommended Equipment
power meter : : : : : : : : : : : : : : : : : : : : : : : : : : : : : : : HP 436A power meterpower sensor : : : : : : : : : : : : : : : : : : : : : : : HP 8482A N(m) power sensor
3-28 Test Descriptions HP 8572A EMI Receiver User's Guide

Power Level Setup
Recommended Equipment
synthesizer/level generator : :HP 3335A synthesizer/level generatorpulse generator : : : : : : : : : :HP 8161A programmable pulse generatorpower meter : : : : : : : : : : : : : : : : : : : : : : : : : : : : : : : HP 436A power meterpower sensor : : : : : : : : : : : : : : : : : : : : : : : HP 8482A N(m) power sensor3 dB attenuator : : : :HP 8491A Option 003 coaxial �xed attenuatormodulator : : : :HP 0955-0533 solid-state switch, SPST (Modulator)cables (3 required) : :HP 10503A 122 cm (48 in) 50 coax BNC(m)to BNC(m)adapter : : : : : : : : : : : : : : : : : : : : : : : : : : : : : : : HP 1250-0777 N(f) to N(f)adapter : : : : : : : : : : : : : : : : : : : : : : : : : : : HP 1250-0780 N(m) to BNC(f)
HP 8572A EMI Receiver User's Guide Test Descriptions 3-29

Pulse Response Measurement
Recommended Equipment
synthesizer/level generator : :HP 3335A synthesizer/level generatorpulse generator : : : : : : : : : :HP 8161A programmable pulse generator3 dB attenuator : : : :HP 8491A Option 003 coaxial �xed attenuatormodulator : : : :HP 0955-0533 solid-state switch, SPST (Modulator)cables (3 required) : :HP 10503A 122 cm (48 in) 50 coax BNC(m)to BNC(m)adapter : : : : : : : : : : : : : : : : : : : : : : : : : : : : : : : HP 1250-0777 N(f) to N(f)adapter : : : : : : : : : : : : : : : : : : : : : : : : : : : HP 1250-0780 N(m) to BNC(f)
3-30 Test Descriptions HP 8572A EMI Receiver User's Guide
Purpose This test measures the EMI receiver system's response to apulsed RF input signal relative to that of a CW input signal and thesystem response as a function of pulse repetition frequency, accordingto CISPR* requirements.
Description \Pulse Response" is performed with a pulsed RF inputsignal rather than a video pulse, because the necessary equipmentis readily available, easily calibrated, and exible to use. PulsedRF setup considerations and the relationship between the twotechniques are explained in HP Application Note 150-2, and inCISPR Publication 16, Appendix Q.
The output of the HP 3335A synthesizer/level generator ismodulated by the pulse generator using the pulse modulator toyield a pulsed RF signal. The system is tested, through each of thethree 6 dB bandwidth �lters of the HP 85650A quasi-peak adapter,with a pulse repetition frequency (PRF) corresponding to CISPRspeci�cations.
Power Meter CalibrationThe measurements start with a calibration ofthe power meter. If the power meter has beencalibrated recently, the test skips this routine.
Input Amplitude CalibrationThe pulse generator is set to dc bias the modulatorin its ON state. The HP 3335A synthesizer/levelgenerator's frequency is set and the amplitude isadjusted so that the power at the output of the3 dB attenuator is �6.99 dBm (100 dBuV) asmeasured with the power sensor. This referencesetting is used in the \Pulsed RF Signal" and\CW Measurement" sections to set input powerappropriate for the unit under test. The 3 dBattenuator provides a controlled source match.
* CISPR is the acronym for Comit�e International Sp�ecial des Perturbations
Radio�electriques (International Special Committee on Radio Interference)of the International Electrotechnical Commission. Publication 16,\CISPR Speci�cation for Radio Interference Measuring Apparatus andMeasurement Methods," stipulates performance requirements for radiointerference measuring apparatus.
HP 8572A EMI Receiver User's Guide Test Descriptions 3-31

Isolation Check The power sensor is disconnected, the 3 dBattenuator is connected to the input of the unitunder test, and the HP 85650A quasi-peak adapteris put into bypass mode. The input signal ismeasured with the EMI receiver system. Thepulse generator is set to dc bias the modulator inits OFF state and the signal is measured again.The two readings are compared, to verify thatthe modulator's isolation is greater than 70 dBc.This ensures accuracy of the pulsed RF spectralintensity in low pulse repetition frequencies bylimiting the carrier source feedthrough component.
Pulsed RF Signal The pulse generator is set to the desired pulserepetition frequency (PRF) and nominal pulsewidth. The HP 3335A synthesizer/level generatoramplitude is set to yield the CISPR-speci�edspectral intensity of the main lobe at the inputof the unit under test. The required setting forthe HP 3335A synthesizer/level generator isdetermined from the CISPR-speci�ed spectralintensity, the pulse width, and the reference settingdetermined above. If the HP 8116A pulse/functiongenerator is used, the test measures the nullspacing of the pulse spectrum to set the pulsewidth more accurately than the nominal value onthe HP 8116A pulse/function generator.
Pulse MeasurementThe HP 85650A quasi-peak adapter is set tonormal mode and the detector is turned ON.Time is allowed for the detector to settle. Thepulse modulated signal then is measured withthe EMI receiver system. The pulse repetitionfrequency is varied to measure the pulseresponse at the CISPR speci�ed pulse repetitionfrequencies.
CW MeasurementThe pulse generator is set to dc bias themodulator in its ON state. The HP 3335Asynthesizer/level generator amplitude is set toyield 60 dBuV . The CW signal is measured withthe EMI receiver system.
Power Sensor Calibration Factors\Optional: Entering power sensor calibrationfactors" in Chapter 2 explains the requirements forentering calibration factors for the power sensorbeing used.
3-32 Test Descriptions HP 8572A EMI Receiver User's Guide

Calibration INPUT 2
Recommended Equipment
cable : : : : : : : : HP 8120-4781 61 cm (24 in) 50 coax N(m) to N(m)adapter : : : : : : : : : : : : : : : : : : : : : : : : : : : HP 1250-0077 N(f) to BNC(m)
HP 8572A EMI Receiver User's Guide Test Descriptions 3-33

Purpose This test calibrates receiver INPUT 2 of theEMI receiver system.
Description \Calibration INPUT 2" consists of two setups. The�rst setup calibrates the spectrum analyzer with the RF preselectorin bypass mode. Recall-9 calibrates the spectrum analyzer's centerfrequency for narrow resolution bandwidths of 10 Hz through 1 kHz.
In the second setup, receiver INPUT 2 is calibrated at predeterminedpoints for amplitude accuracy using the comb generator output.These points are chosen by the internal calibration sequence (CALSEQ) in the RF preselector. receiver INPUT 2 is calibrated between20 MHz and 2 GHz.
To make calibrated measurements with the EMI receiver system,CAL SEQ must be run for each set of EMI receiver system settings.This test runs CAL SEQ at the settings that will be used insubsequent tests. The resulting calibration factors are stored in thecontroller memory and loaded into the RF preselector when they areneeded.
3-34 Test Descriptions HP 8572A EMI Receiver User's Guide

Test Settings
Settings for Amplitude Accy. INPUT 2 (10 dB AT and
0 dB AT)
Function Band B (Auto) Band C (Auto) Band D (Auto)
RF FREQ 20 MHz to 30 MHz 30 MHz to 300 MHz 300 MHz to 2.0 GHz
QPA �lter 9 kHz 120 kHz 120 kHz
RES BW 100 kHz 1 MHz 1 MHz
RFPS (atten) 0 dB 0 dB 0 dB
SA (atten) 10 dB or 0 dB 10 dB or 0 dB 10 dB or 0 dB
Scale Linear Linear Linear
Settings for Disp. Average Noise Input 2, 10 Hz RBW
Function Settings (Auto)
RF FREQ 20 MHz to 2.0 GHz
QPA �lter BYPASS
RES BW 30 kHz
RFPS (atten) 0 dB
SA (atten) 0 dB
Scale Log 10 dB
Settings for Residual Responses INPUT 2
Function Settings (Auto)
RF FREQ 20 MHz to 2.0 GHz
QPA �lter BYPASS
RES BW 30 kHz
RFPS (atten) 0 dB
SA (atten) 0 dB
Scale Log 10 dB
HP 8572A EMI Receiver User's Guide Test Descriptions 3-35

Amplitude Accy. INPUT 2 (10 dB AT and 0 dB AT)
Power Meter Calibration
Recommended Equipment
power meter : : : : : : : : : : : : : : : : : : : : : : : : : : : : : : : HP 436A power meterpower sensor : : : : : : : : : : : : : : : : : : : : : : : HP 8481D N(m) power sensorattenuator : : : : : : :HP 11708A APC-3.5 mm(f) to N(m) 30 dB �xedattenuator
3-36 Test Descriptions HP 8572A EMI Receiver User's Guide

Amplitude Accy. INPUT 2 (10 dB AT)
Recommended Equipment
synthesized sweeper : : : : : : : : : : :HP 8360 Series synthesized sweeperpower meter : : : : : : : : : : : : : : : : : : : : : : : : : : : : : : : HP 436A power meterpower sensor : : : : : : : : : : : : : : : : : : : : : : : HP 8481D N(m) power sensorpower splitter : : : : : : : : : : : : : : : : : : : : : : : : : : HP 11667A power splittercable : : : : : : : : : : : : : HP 8120-5140 91 cm (36 in) 50 N(m) to N(m)adapter : : : : : : : : : : : : : : : : : : : : : : : : :HP 1250-1745 APC-3.5(f) to N(f)adapter : : : : : : : : : : : : : : : : : : : : : : : : : : : : : HP 1250-1475 N(m) to N(m)
HP 8572A EMI Receiver User's Guide Test Descriptions 3-37

Purpose This test measures absolute amplitude accuracy throughreceiver INPUT 2.
Note To assure test accuracy, you must complete \CalibrationINPUT 2", \Log Fidelity", \Linear Fidelity", and \Reference LevelSwitching Uncertainty" before you perform this test.
Description \Amplitude Accy. INPUT 2 (10 dB AT and0 dB AT)" relies on the calibration accuracy of the HP 8481A N(m)power sensor. First, the power meter is calibrated. Then, asynthesized source is used as a signal source for this test. Thesignal is sent through a power splitter. One output is measuredwith a power sensor, and the other output is measured withreceiver INPUT 2 through an HP 1250-1475 N(m) to N(m) adapter.The EMI receiver system amplitude response is compared to thepower meter response. The di�erence between the corrected powermeter response and the EMI receiver system measurement is theamplitude accuracy of the EMI receiver system.
\Log Fidelity", \Linear Fidelity", \Reference Level SwitchingUncertainty", and the accuracy of the EMI receiver system's internalcalibration sequence contribute to the amplitude accuracy of theEMI receiver system in any valid setting. These error contributorsare measured in separate tests.
Amplitude accuracy is tested at both 10 dB and 0 dB spectrumanalyzer input attenuation.
Note \Optional: Entering power sensor calibration factors," in chapter2, lists requirements for entering calibration factors for the powersensor being used.
Test Settings
Function Band B Band C Band D
RF FREQ 20 MHz to 30 MHz 30 MHz to 300 MHz 300 MHz to 2.0 GHz
QPA �lter 9 kHz 120 kHz 120 kHz
RES BW 100 kHz 1 MHz 1 MHz
RFPS (atten) 0 dB 0 dB 0 dB
SA (atten) 10 dB or 0 dB 10 dB or 0 dB 10 dB or 0 dB
Scale Linear Linear Linear
3-38 Test Descriptions HP 8572A EMI Receiver User's Guide

Disp. Average Noise INPUT 2
Recommended Equipment
50 load : : : : : : : : : : : : : : : : : : : : : : : : :HP 908A 50 N(m) termination
HP 8572A EMI Receiver User's Guide Test Descriptions 3-39
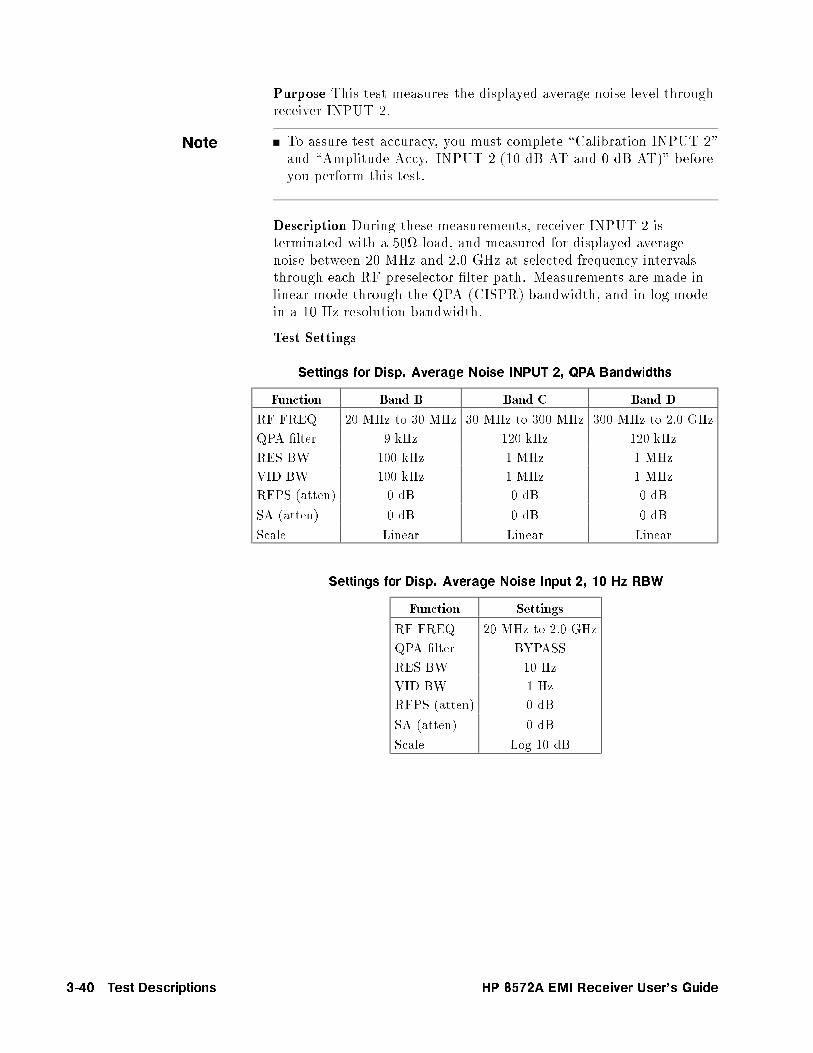
Purpose This test measures the displayed average noise level throughreceiver INPUT 2.
Note To assure test accuracy, you must complete \Calibration INPUT 2"and \Amplitude Accy. INPUT 2 (10 dB AT and 0 dB AT)" beforeyou perform this test.
Description During these measurements, receiver INPUT 2 isterminated with a 50 load, and measured for displayed averagenoise between 20 MHz and 2.0 GHz at selected frequency intervalsthrough each RF preselector �lter path. Measurements are made inlinear mode through the QPA (CISPR) bandwidth, and in log modein a 10 Hz resolution bandwidth.
Test Settings
Settings for Disp. Average Noise INPUT 2, QPA Bandwidths
Function Band B Band C Band D
RF FREQ 20 MHz to 30 MHz 30 MHz to 300 MHz 300 MHz to 2.0 GHz
QPA �lter 9 kHz 120 kHz 120 kHz
RES BW 100 kHz 1 MHz 1 MHz
VID BW 100 kHz 1 MHz 1 MHz
RFPS (atten) 0 dB 0 dB 0 dB
SA (atten) 0 dB 0 dB 0 dB
Scale Linear Linear Linear
Settings for Disp. Average Noise Input 2, 10 Hz RBW
Function Settings
RF FREQ 20 MHz to 2.0 GHz
QPA �lter BYPASS
RES BW 10 Hz
VID BW 1 Hz
RFPS (atten) 0 dB
SA (atten) 0 dB
Scale Log 10 dB
3-40 Test Descriptions HP 8572A EMI Receiver User's Guide

Residual Responses INPUT 2
Recommended Equipment
50 load : : : : : : : : : : : : : : : : : : : : : : : : :HP 908A 50 N(m) termination
HP 8572A EMI Receiver User's Guide Test Descriptions 3-41

Purpose This test measures the residual responses throughreceiver INPUT 2 between 20 MHz and 100 MHz.
Note To assure test accuracy, you must complete \Calibration INPUT 2"and \Amplitude Accy. INPUT 2 (10 dB AT and 0 dB AT)" beforeyou perform this test.
Description The measurements are made with both theRF preselector and the spectrum analyzer in 0 dB input attenuation;receiver INPUT 2 is terminated with a 50 load, and the quasi-peakadapter is in bypass mode.
3-42 Test Descriptions HP 8572A EMI Receiver User's Guide

Amplitude Accy. INPUT 3
Power Meter Calibration
Recommended Equipment
power meter : : : : : : : : : : : : : : : : : : : : : : : : : : : : : : : HP 436A power meterpower sensor : : : : : : : : : : : :HP 8485D APC-3.5 mm(m) power sensorattenuator : : : : : : :HP 11708A APC-3.5 mm(f) to N(m) 30 dB �xedattenuatoradapter : : : : : : : : : : : : : : : : : : : : : HP 08485-60005 APC 3.5(f ) to N(m)
HP 8572A EMI Receiver User's Guide Test Descriptions 3-43

Amplitude Accy. INPUT 3
Recommended Equipment
cable : : : : : : : :HP 8120-4781 61 cm (24 in) 50 coax N(m) to N(m)adapter : : : : : : : : : : : : : : : : : : : : : : : : : : : HP 1250-0077 N(f) to BNC(m)
3-44 Test Descriptions HP 8572A EMI Receiver User's Guide

Amplitude Accy. INPUT 3
Recommended Equipment
synthesized sweeper : : : : : : : : : : :HP 8360 Series synthesized sweeperpower meter : : : : : : : : : : : : : : : : : : : : : : : : : : : : : : : HP 436A power meterpower sensor : : : : : : : : : : : :HP 8485D APC-3.5 mm(m) power sensorpower splitter : : : : : : : : : : : : : : : : : : : : : : : : : : HP 11667B power splittercable : : : : : : : HP 8120-4921 91 cm (36 in) 50 APC-3.5 mm(m) toAPC-3.5 mm(m)adapter : : : : : : : : : : : : : : : : : :HP 1250-1749 APC-3.5(f) to APC-3.5(f )
HP 8572A EMI Receiver User's Guide Test Descriptions 3-45

Purpose This test measures absolute amplitude accuracy throughreceiver INPUT 3.
Note To assure test accuracy, you will need the amplitudecharacterization data (INPUT 3, 0 dB AT) in the HP8571A/8572A EMI Receiver 1 GHz to 22 GHz Calibration DataManual.
You must complete \Log Fidelity", \Linear Fidelity", and\Reference Level Switching Uncertainty" before running this test.
Description \Amplitude Accy. INPUT 3" relies on the calibrationaccuracy of the HP 8481A N(m) power sensor. This test uses threesetups. First, the power meter is calibrated.
The second setup calibrates the spectrum analyzer with theRF preselector in bypass mode using recall-8 on the spectrumanalyzer. Recall-9 is used to calibrate the spectrum analyzer's centerfrequency for narrow resolution bandwidths of 10 Hz through 1 kHz.
The third setup uses a synthesized source as a signal source forthe test. The signal is sent through a power splitter. One outputis measured by receiver INPUT 3. The EMI receiver systemamplitude response is corrected using the appropriate amplitudecharacterization data. The corrected power meter response iscompared to the corrected EMI receiver system amplitude response.The di�erence between the corrected power meter response and thecorrected EMI receiver system amplitude response is the amplitudeaccuracy of the EMI receiver system.
\Log Fidelity", \Linear Fidelity", \Reference Level SwitchingUncertainty", and the accuracy of the EMI receiver system's internalcalibration sequence contribute to the amplitude accuracy of theEMI receiver system in any valid setting. These error contributorsare measured in separate tests.
Note \Optional: Entering power sensor calibration factors," in chapter2, lists requirements for entering calibration factors for the powersensor being used.
3-46 Test Descriptions HP 8572A EMI Receiver User's Guide
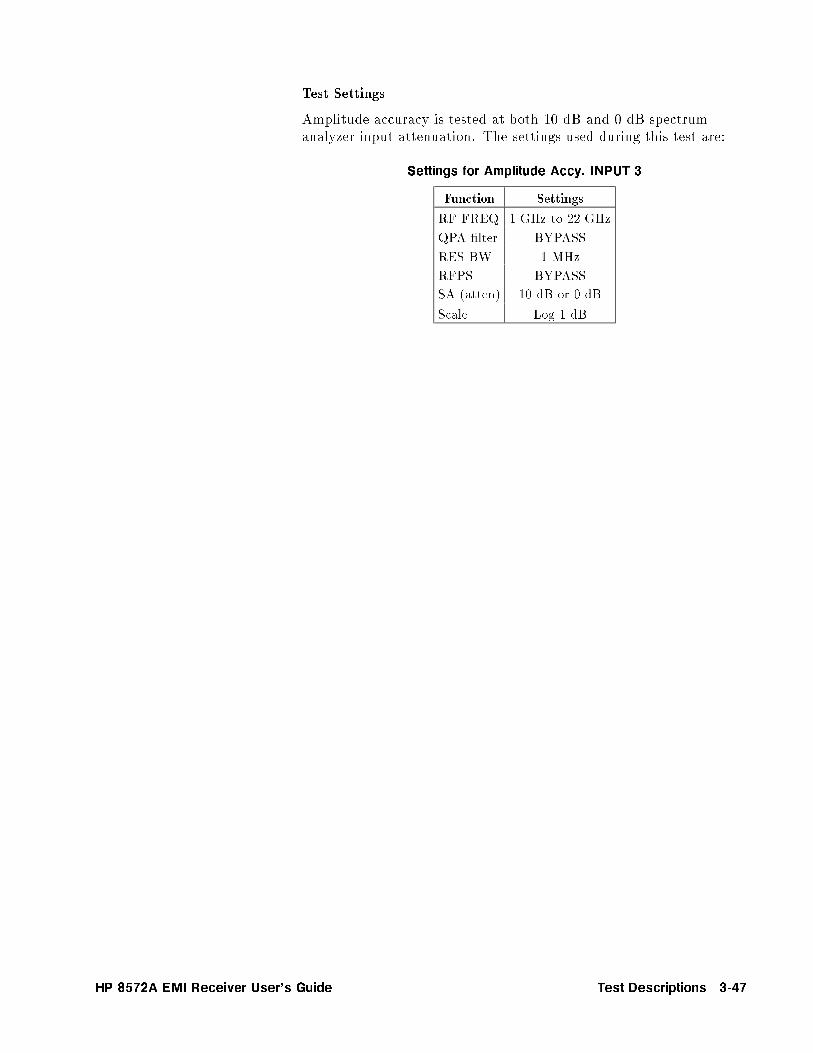
Test Settings
Amplitude accuracy is tested at both 10 dB and 0 dB spectrumanalyzer input attenuation. The settings used during this test are:
Settings for Amplitude Accy. INPUT 3
Function Settings
RF FREQ 1 GHz to 22 GHz
QPA �lter BYPASS
RES BW 1 MHz
RFPS BYPASS
SA (atten) 10 dB or 0 dB
Scale Log 1 dB
HP 8572A EMI Receiver User's Guide Test Descriptions 3-47
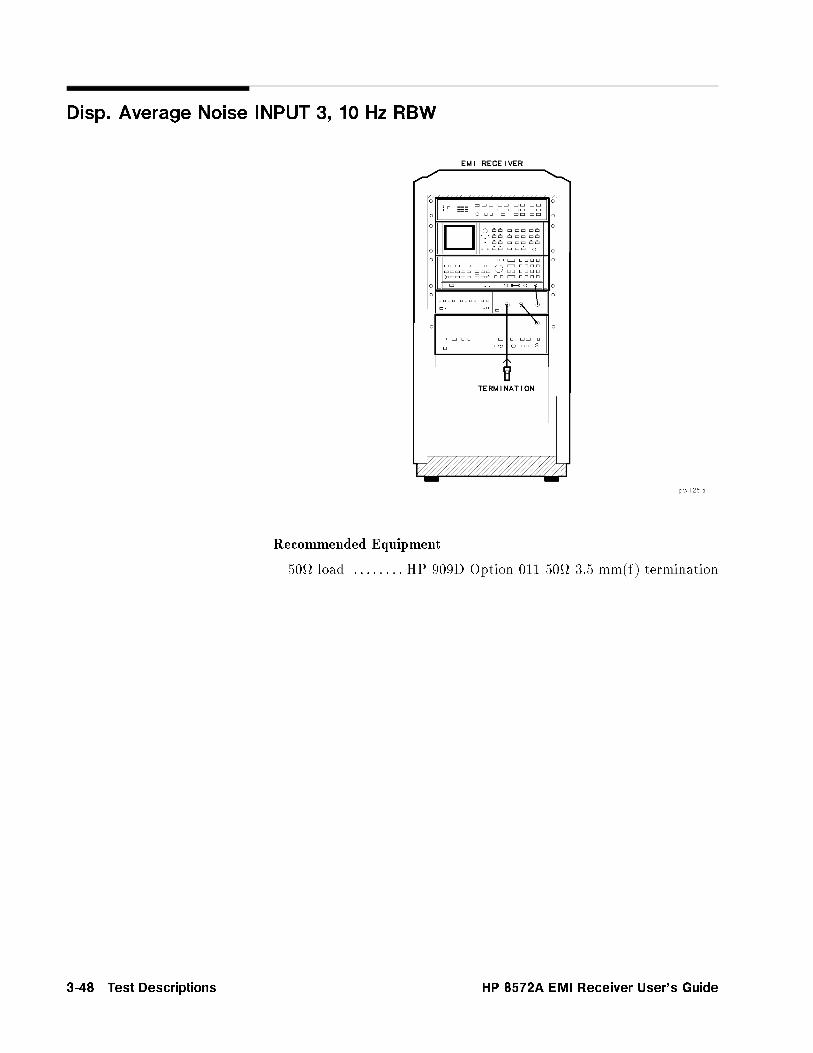
Disp. Average Noise INPUT 3, 10 Hz RBW
Recommended Equipment
50 load : : : : : : : : HP 909D Option 011 50 3.5 mm(f) termination
3-48 Test Descriptions HP 8572A EMI Receiver User's Guide
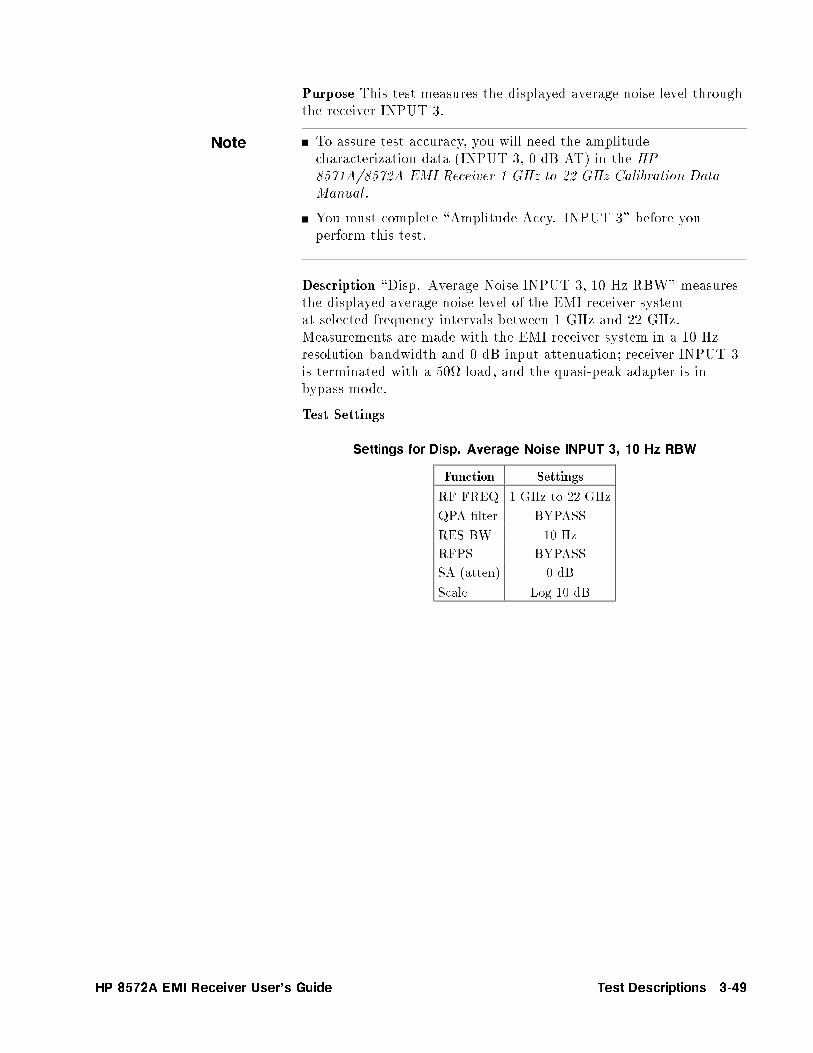
Purpose This test measures the displayed average noise level throughthe receiver INPUT 3.
Note To assure test accuracy, you will need the amplitudecharacterization data (INPUT 3, 0 dB AT) in the HP8571A/8572A EMI Receiver 1 GHz to 22 GHz Calibration DataManual .
You must complete \Amplitude Accy. INPUT 3" before youperform this test.
Description \Disp. Average Noise INPUT 3, 10 Hz RBW" measuresthe displayed average noise level of the EMI receiver systemat selected frequency intervals between 1 GHz and 22 GHz.Measurements are made with the EMI receiver system in a 10 Hzresolution bandwidth and 0 dB input attenuation; receiver INPUT 3is terminated with a 50 load, and the quasi-peak adapter is inbypass mode.
Test Settings
Settings for Disp. Average Noise INPUT 3, 10 Hz RBW
Function Settings
RF FREQ 1 GHz to 22 GHz
QPA �lter BYPASS
RES BW 10 Hz
RFPS BYPASS
SA (atten) 0 dB
Scale Log 10 dB
HP 8572A EMI Receiver User's Guide Test Descriptions 3-49

Residual Responses INPUT 3
Recommended Equipment
50 load : : : : : : : : HP 909D Option 011 50 3.5 mm(f) termination
3-50 Test Descriptions HP 8572A EMI Receiver User's Guide

Purpose This test measures the residual responses throughreceiver INPUT 3 between 1 GHz and 22 GHz.
Note To assure test accuracy, you will need the amplitudecharacterization data (INPUT 3, 0 dB AT) in the HP8571A/8572A EMI Receiver 1 GHz to 22 GHz Calibration DataManual .
You must complete \Amplitude Accy. INPUT 3" before youperform this test.
Description The measurements are made with the spectrum analyzerin 0 dB input attenuation, receiver INPUT 3 terminated with a 50load, and the quasi-peak adapter in bypass mode.
HP 8572A EMI Receiver User's Guide Test Descriptions 3-51


4
Making Typical Measurements
In this chapter, you'll �nd instructions for making typicalmeasurements with the HP 8572A microwave EMI receiver:
testing for overload
testing narrowband and broadband signals
making commercial compliance measurements
performing MIL-STD 461 conducted emission tests
performing MIL-STD 461 RE02 radiated emission tests
making CISPR 22 measurements
Testing for Overload In dealing with broadband signals such as pulses, the levels displayedon the CRT can represent only a small fraction of the total energyapplied to the receiver's input. Therefore, while the level displayedon the CRT may appear within safety limits, the peak valueactually applied may be beyond the 1 dB compression point. Toavoid this error, analyze the signal response with the 3 dB linearitycheck overload test to determine if the receiver is overloaded. SeeFigure 4-1.
Figure 4-1. Testing for Overload
HP 8572A EMI Receiver User's Guide Making Typical Measurements 4-1

3 dB Linearity Check Use the 3 dB linearity check key on the RF preselector to check foroverload. Press the 3 dB LIN key and observe the amplitude level ofthe signals displayed on the spectrum analyzer. The change in theobserved peak level of signals (at least 10 dB above the noise oor)should be less than 1 dB. If change in amplitude occurs, increasethe RF preselector input attenuation by 10 dB and repeat the 3 dBtest. Continue to add attenuation until the signals behave linearly.Use the least amount of attenuation necessary to cause linearsignal-amplitude change.
Narrowband/Broadband Signals
The classi�cation of a signal as narrowband or broadband dependson the signal's occupied frequency spectrum relative to the resolutionbandwidth of the measuring receiver.
Narrowband Signals Emissions occupying a narrow frequencyspectrum relative to the resolution bandwidth are de�ned asnarrowband. A CW signal is an example of a narrowband signal. SeeFigure 4-2. Common measurement units for narrowband signals aredB�V (dB above 1 �V) and dB�V/m (�eld strength).
Figure 4-2. Narrowband Spectrum
4-2 Making Typical Measurements HP 8572A EMI Receiver User's Guide

Broadband Signals Emissions occupying a broad frequency spectrumrelative to the resolution bandwidth are characterized as broadband.Sources of broadband signals can be impulse emissions fromautomobile ignitions systems, digital circuits, switching powersupplies, and random noise. See Figure 4-3.
Figure 4-3. Broadband Spectrum
Broadband emissions measurement requires normalization to areference bandwidth, for example, 1 MHz. Common broadbandmeasurement units are dB�V/MHz and dB�V/m/MHz (�eldstrength).
HP 8572A EMI Receiver User's Guide Making Typical Measurements 4-3
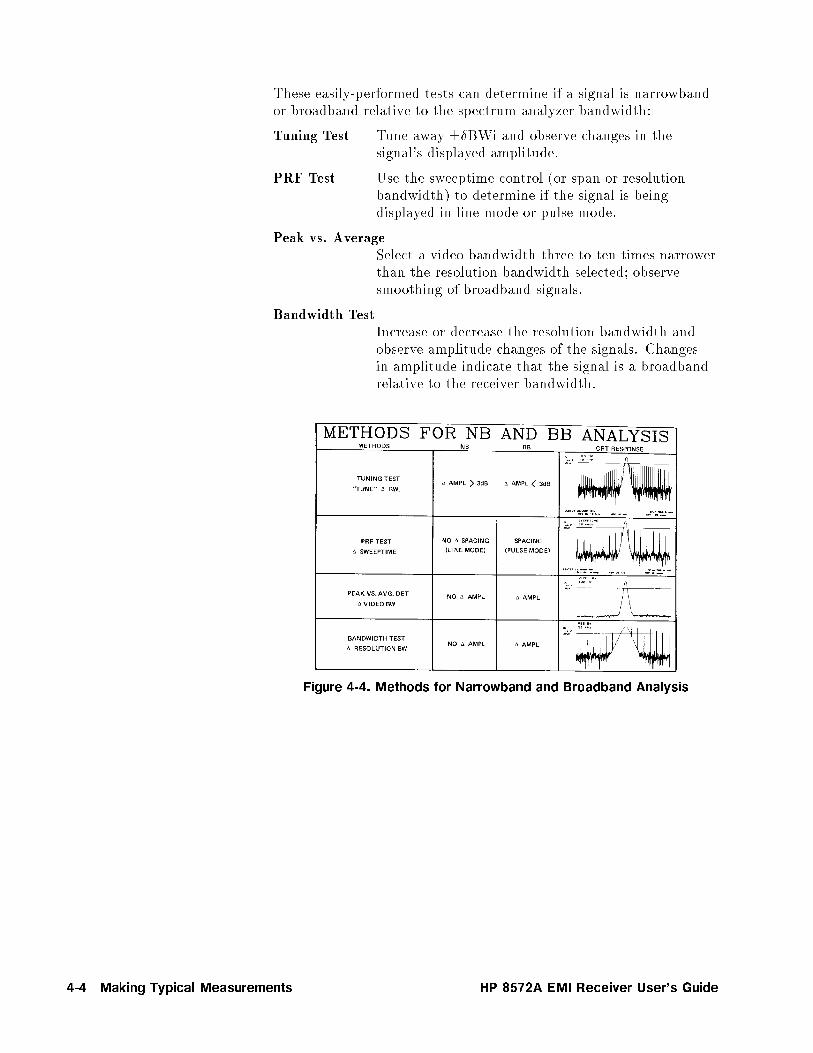
These easily-performed tests can determine if a signal is narrowbandor broadband relative to the spectrum analyzer bandwidth:
Tuning Test Tune away ��BWi and observe changes in thesignal's displayed amplitude.
PRF Test Use the sweeptime control (or span or resolutionbandwidth) to determine if the signal is beingdisplayed in line mode or pulse mode.
Peak vs. AverageSelect a video bandwidth three to ten times narrowerthan the resolution bandwidth selected; observesmoothing of broadband signals.
Bandwidth TestIncrease or decrease the resolution bandwidth andobserve amplitude changes of the signals. Changesin amplitude indicate that the signal is a broadbandrelative to the receiver bandwidth.
Figure 4-4. Methods for Narrowband and Broadband Analysis
4-4 Making Typical Measurements HP 8572A EMI Receiver User's Guide

Commercial Compliance Measurements
Detector Selection The three commonly used detection modes for making EMCmeasurements are:
Peak Detection
Average Detection
Quasi-Peak Detection
Peak Detection A peak measurement is the measured peak voltagereferenced to the RMS value for a sinusoidal calibration signal. Forpeak detection on the EMI receiver, set the video bandwidth widerthan the resolution bandwidth and place the analyzer in normaldetection mode.
Average Detection After the incoming RF input has been mixeddown to the IF (see Figure 4-5), �ltered by the resolution bandwidth�lters, and ampli�ed logarithmically (dB) or linearly (volts), itreaches the envelope detector and video �lter. Envelope detection�nds the peak voltage of the signal. The video �lter is a low-pass�lter that integrates (averages) the higher frequency components(such as noise) at the output of the detector.
HP 8572A EMI Receiver User's Guide Making Typical Measurements 4-5

Figure 4-5. Signal Detection and Processing
4-6 Making Typical Measurements HP 8572A EMI Receiver User's Guide

For e�ective averaging, the bandwidth of the video �lter must besmaller than the resolution bandwidth. The higher the ratio ofresolution bandwidth to video bandwidth, the greater the averagingwill be. See Figure 4-6.
Figure 4-6. Average Detection Using Video Filtering
Because the video �lter is in a series with the resolution bandwidth,�lter sweep time is a�ected by the video bandwidth. Thus, narrowvideo bandwidths require long sweep times.
HP 8572A EMI Receiver User's Guide Making Typical Measurements 4-7
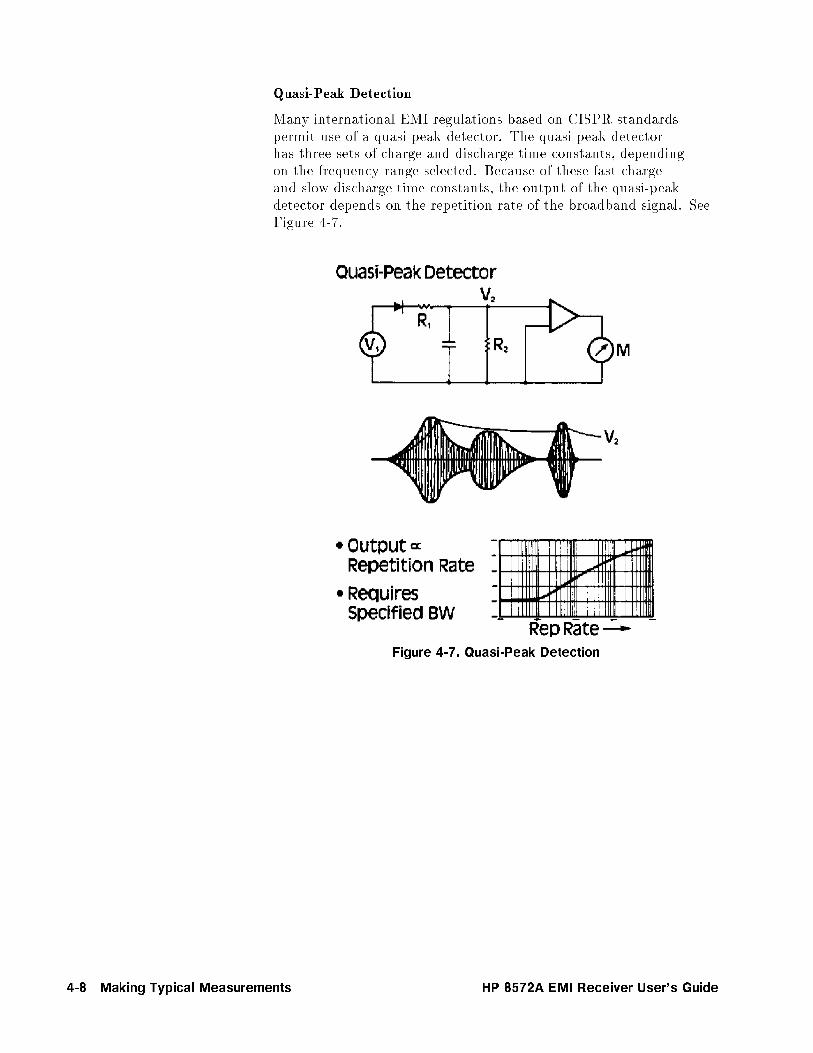
Quasi-Peak Detection
Many international EMI regulations based on CISPR standardspermit use of a quasi-peak detector. The quasi-peak detectorhas three sets of charge and discharge time constants, dependingon the frequency range selected. Because of these fast chargeand slow discharge time constants, the output of the quasi-peakdetector depends on the repetition rate of the broadband signal. SeeFigure 4-7.
Figure 4-7. Quasi-Peak Detection
4-8 Making Typical Measurements HP 8572A EMI Receiver User's Guide
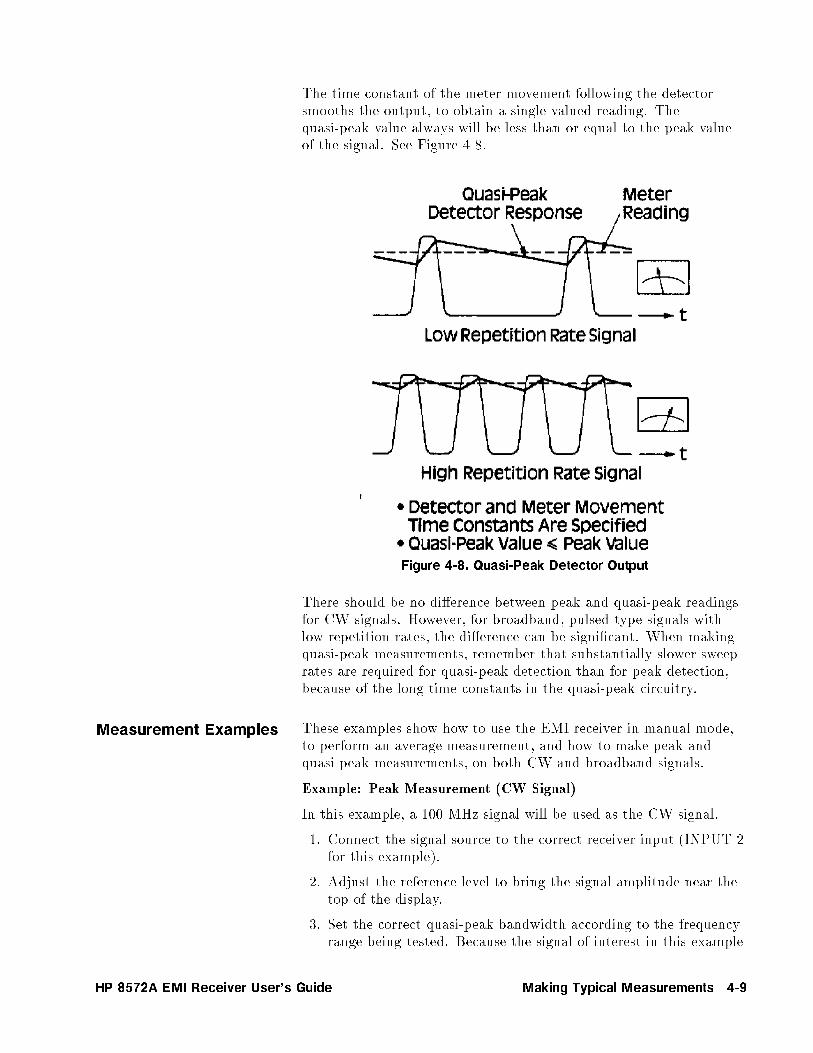
The time constant of the meter movement following the detectorsmooths the output, to obtain a single-valued reading. Thequasi-peak value always will be less than or equal to the peak valueof the signal. See Figure 4-8.
Figure 4-8. Quasi-Peak Detector Output
There should be no di�erence between peak and quasi-peak readingsfor CW signals. However, for broadband, pulsed type signals withlow repetition rates, the di�erence can be signi�cant. When makingquasi-peak measurements, remember that substantially slower sweeprates are required for quasi-peak detection than for peak detection,because of the long time constants in the quasi-peak circuitry.
Measurement Examples These examples show how to use the EMI receiver in manual mode,to perform an average measurement, and how to make peak andquasi-peak measurements, on both CW and broadband signals.
Example: Peak Measurement (CW Signal)
In this example, a 100 MHz signal will be used as the CW signal.
1. Connect the signal source to the correct receiver input (INPUT 2for this example).
2. Adjust the reference level to bring the signal amplitude near thetop of the display.
3. Set the correct quasi-peak bandwidth according to the frequencyrange being tested. Because the signal of interest in this example
HP 8572A EMI Receiver User's Guide Making Typical Measurements 4-9
is 100 MHz, press �.03-1 GHz� on the quasi-peak detector. This setsthe quasi-peak bandwidth to 120 kHz.
4. Press the NORMAL key on the quasi-peak adapter.
5. Set the spectrum analyzer resolution and video bandwidthsaccording to the table on the front of the quasi-peak adapter.For a 100 MHz signal, set the bandwidths to 1 MHz.
Note Making the spectrum analyzer's resolution bandwidth muchgreater than the quasi-peak bandwidth, the quasi-peak bandwidthbecomes the limiting bandwidth in the IF. If the resolutionbandwidth is less than the quasi-peak bandwidth, the resolutionbandwidth becomes the limiting bandwidth in the IF and thespecial quasi-peak bandwidth �lter would have no e�ect.
6. Set the spectrum analyzer center frequency to 100 MHz and thespan to 1 MHz.
7. The table on the front of the quasi-peak adapter section showsthe sweep time to use with quasi-peak detection OFF. Withfrequency in the 0.03 to 1 GHz band and span set to 1 MHz, thesweep time must be set to a value no faster than 1 ms.
A sweep time faster than the value indicated on the table willcause an incorrect amplitude reading.
8. Press �SHIFT� C on the spectrum analyzer, to read amplitude indB�V.
9. To select the preampli�er BYPASS path, press 0 ��� on theswitch driver. The LED in the key will light.
10. Disconnect the signal source. Connect the preselector combgenerator output to the input of the preselector section to beused in the measurement.
11. Set the spectrum analyzer start frequency to 30 MHz and stopfrequency to 200 MHz (170 MHz span).
Note Before calibrating the system:
Make sure all equipment settings are correct. Do not changethe resolution bandwidth, scale, attenuation, or input port aftercalibration. (The start and stop frequencies may be changed aftercalibration if the frequency range stays within the range at whichthe receiver was calibrated.)
Manually set critical system parameters manually, such asresolution bandwidth. Parameters that are set manually will notchange during the calibration routine; parameters that are still inthe auto-coupled mode may change during the calibration routine.
4-10 Making Typical Measurements HP 8572A EMI Receiver User's Guide

12. Press CAL SEQ �START� on the preselector. Selected comb teethare measured by the spectrum analyzer section. Any variationbetween the measured comb tooth amplitude and the valuestored in the preselector section is corrected by an internalpreselector section gain adjustment. The CAL SEQ LED asheswhile the calibration routine runs.
Note After calibration, the CAL SEQ LED stays on, indicating thatthe system is calibrated over the current frequency range. If thefrequency range is increased beyond the calibrated frequency range,the light turns o� to indicate an uncalibrated state. However, theCAL SEQ light does not turn o� when parameters other than thefrequency range (start and stop frequency) are changed. Therefore,you may have an uncalibrated state while the CAL SEQ light is on.
Be sure the receiver is calibrated for the current instrumentsettings.
13. Disconnect the preselector section's comb generator output andreconnect the signal source to receiver INPUT 2.
Use the same cable during measurements that you used forcalibration; the system has compensated for the loss in this cable.Remember to account for the losses in the calibration cable ifyou do not use that same during the actual measurement. Usingother cables may introduce an amplitude error.
14. Set the spectrum analyzer span to 1 MHz and center frequencyto 100 MHz.
HP 8572A EMI Receiver User's Guide Making Typical Measurements 4-11

15. Press �PEAK SEARCH� on the spectrum analyzer and read themarker amplitude on the display. If an antenna is connected tothe system, the antenna factors would be added to the reading togive actual �eld strength reading. Refer to Figure 4-9.
Figure 4-9. Peak Measurement of a CW Signal
16. Use the 3 dB attenuator in the preselector to check linearity for again compression or overload condition. The attenuator changesthe gain by adding 3 dB of attenuation. If the amplitude changeson the display, suspect an overload or gain compression.
If this test indicates an overload or gain compression:
Press �*� on the RF preselector to add 10 dB of attenuation.
Repeat the linearity check with the 3 dB attenuator. Addattenuation if necessary until the overload or gain compressionis eliminated.
If the attenuation is increased, the receiver should berecalibrated with the new attenuator setting for best accuracy.
Example: Peak Measurement (Broadband Signal)
This measurement uses a pulse generator, and measures the15 MHz-to-16 MHz region where conducted measurements areperformed. The results are shown in Figure 4-10.
1. Press �INSTR PRESET� on the quasi-peak adapter and on thepreselector.
2. Select receiver INPUT 1.
3. Press the 0 ��� key on the switch driver to select the preampli�erBYPASS path. The LED in the key will light.
4. Connect the signal source to receiver INPUT 1.
4-12 Making Typical Measurements HP 8572A EMI Receiver User's Guide

5. Set the EMI receiver as follows:
�START FREQ� : : : : : : : : : : : : : : : : : : : : : : : : : : : : : : : : : 15 MHz�STOP FREQ� : : : : : : : : : : : : : : : : : : : : : : : : : : : : : : : : : : 16 MHz�RES BW� : : : : : : : : : : : : : : : : : : : : : : : : : : : : : : : : : : : : : 100 kHz�VIDEO BW� : : : : : : : : : : : : : : : : : : : : : : : : : : : : : : : : : : : 100 kHz�SWEEP TIME� : : : : : : : : : : : : : : : : : : : : : : : : : : : : : : : : : : 100 msQPA BW : : : : : : : : : : : : : : : : : : : : : : : : : : : : : : : : : : : : : : 9 kHzQPA : : : : : : : : : : : : : : : : : : : : : : : : : : : : : : : : : : : : : : NORMAL
6. Because the signal of interest is in the 0.15 to 30 MHz region,the 9 kHz quasi-peak bandwidth (QPA BW) is selected. Referto the table on the front of the quasi-peak adapter, and set thespectrum analyzer resolution and video bandwidths to 100 kHz.
7. According to the table, sweep time with the quasi-peak detectorin NORMAL (or o�) is 100 ms/MHz. Because the selected spanis 1 MHz, the sweep time for this measurement must be at least100 ms.
8. To read amplitude in dB�V, press �SHIFT� C on the spectrumanalyzer.
9. Adjust the reference level to bring the signal near the top of thedisplay.
10. Disconnect the signal source. Connect the preselector combgenerator output to the receiver input used in the measurement.
Note Before calibrating the system:
Make sure all equipment settings are correct. Do not changethe resolution bandwidth, scale, attenuation, or input port aftercalibration. (The start and stop frequencies may be changed aftercalibration if the frequency range stays within the range at whichthe receiver was calibrated.)Manually set critical system parameters manually, such asresolution bandwidth. Parameters that are set manually will notchange during the calibration routine; parameters that are still inthe auto-coupled mode may change during the calibration routine.
11. Press CAL SEQ �START� on the preselector. Selected comb teethare measured by the spectrum analyzer section. Any variationbetween the measured comb tooth amplitude and the valuestored in the preselector section is corrected by an internalpreselector section gain adjustment. The CAL SEQ LED asheswhile the calibration routine runs.
Note After calibration, the CAL SEQ LED stays on, indicating thatthe system is calibrated over the current frequency range. If thefrequency range is increased beyond the calibrated frequency range,the light turns o� to indicate an uncalibrated state. However, theCAL SEQ light does not turn o� when parameters other than the
HP 8572A EMI Receiver User's Guide Making Typical Measurements 4-13

frequency range (start and stop frequency) are changed. Therefore,you may have an uncalibrated state while the CAL SEQ light is on.
Be sure the receiver is calibrated for the current instrumentsettings.
12. Disconnect the preselector section's comb generator output andreconnect the signal source to receiver INPUT 1.
Use the same cable during measurements that you used forcalibration; the system has compensated for the loss in this cable.Remember to account for the losses in the calibration cable ifyou do not use that same during the actual measurement. Usingother cables may introduce an amplitude error.
13. Press �MAX HOLD� on the spectrum analyzer. Allow the display to�ll in.
14. Press �PEAK SEARCH� on the spectrum analyzer and read themarker amplitude on the display. Refer to Figure 4-10.
Figure 4-10. Peak Measurement of a Broadband Signal
Example: Microwave Peak Measurement (CW Signal)
This example makes peak or average measurements on a microwavesignal in the 2 GHz to 22 GHz range.
1. Connect the 100 MHz calibration signal from the spectrumanalyzer to receiver INPUT 2. Select receiver INPUT 2.
2. Select the preampli�er BYPASS path by pressing 0 ��� on theswitch driver. The LED in the key will light.
3. Select the RF preselector BYPASS path by pressing theENABLE key and the BYPASS key.
4-14 Making Typical Measurements HP 8572A EMI Receiver User's Guide

4. Select the resolution bandwidth for the measurement. For thisexample, use 1 MHz.
5. Select 0 dB or 10 dB spectrum analyzer attenuation.
6. Set the center frequency to 100 MHz and the span to 5 MHz.Press �PEAK SEARCH�, and place a marker on the peak of thesignal.
7. Select the vertical scale desired for the measurement. Formeasurements with the peak detector, the log scale is normallyused. For average measurements, use the linear scale.
8. Adjust AMPTD CAL on the front panel of the spectrumanalyzer until the marker reads -10.0 dBm.
9. Connect the signal source to the receiver INPUT 3.
10. Select receiver INPUT 3 by pressing the 0 ��� key on the switchdriver. This input is selected when the 0 LED light is OFF.
11. Set resolution bandwidth and vertical scale to the same settingsused for calibration.
12. Set spectrum analyzer attenuation to the same value used forcalibration.
Select dBuV units using the KSC command.
Find the reference level o�set on the EMI receiver's calibrationchart. Enter this value in the receiver with �SHIFT� �REF LEVEL�.Because this o�set accounts for the gain of the preampli�er,use �-dBm� to make the resulting reference level o�set a negativenumber.
13. Tune the receiver to the signal with �CENTER FREQUENCY� and�SPAN�.
14. Use �PEAK SEARCH� to place a marker on the top of the signal tobe measured.
15. Press �PRESEL PEAK� on the spectrum analyzer. The receiverautomatically will select the optimum preselector DAC setting togive the maximum response.
If you are making an average measurement, set the verticalscale to LINEAR, and reduce the video bandwidth to 10 Hz.
16. Measure the signal amplitude using the marker.
17. Look up the measured frequency on the EMI receiver'scalibration table. If necessary, interpolate between two points inthe table to obtain the desired amplitude correction value.
18. Subtract the amplitude correction value from the marker readingobtained in step 16. This value corrects for the frequencyresponse of the receiver.
Example: Quasi-Peak Measurement (CW Signal)
This example uses a 100 MHz signal as the CW signal.
HP 8572A EMI Receiver User's Guide Making Typical Measurements 4-15
1. Press �INSTR PRESET� on the quasi-peak adapter and on thepreselector.
2. Connect the signal source to the correct receiver input (receiver INPUT 2 for this example).
3. To select the preampli�er BYPASS path, press 0 ��� on theswitch driver. The LED in the key will light.
4. Set the quasi-peak bandwidth according to the frequency rangebeing tested. Because the signal of interest is 100 MHz, press�.03-1 GHz�; this sets the quasi-peak bandwidth to 120 kHz.
5. Press the NORMAL key on the quasi-peak adapter.
6. Set the spectrum analyzer resolution and video bandwidthsaccording to the table on the front of the quasi-peak adapter.For a 100 MHz signal, set the bandwidths to 1 MHz.
Note If you make the spectrum analyzer's resolution bandwidth muchgreater than the quasi-peak bandwidth, the quasi-peak bandwidthbecomes the limiting bandwidth in the IF. If the resolutionbandwidth is less than the quasi-peak bandwidth, the resolutionbandwidth becomes the limiting bandwidth in the IF and thespecial quasi-peak bandwidth �lter would have no e�ect.
7. Set the spectrum analyzer center frequency to 100 MHz and thespan to 1 MHz.
8. Press the LIN key on the spectrum analyzer.
9. Change the reference level to bring the signal amplitude near thetop of the display.
10. On the spectrum analyzer, press �SHIFT� C, to read the amplitudein dB�V.
11. Disconnect the signal source and connect the preselectorsection's comb generator output to the receiver input used in themeasurement.
Note Before calibrating the system:
Make sure all equipment settings are correct. Do not changethe resolution bandwidth, scale, attenuation, or input port aftercalibration. (The start and stop frequencies may be changed aftercalibration if the frequency range stays within the range at whichthe receiver was calibrated.)
Manually set critical system parameters manually, such asresolution bandwidth. Parameters that are set manually will notchange during the calibration routine; parameters that are still inthe auto-coupled mode may change during the calibration routine.
4-16 Making Typical Measurements HP 8572A EMI Receiver User's Guide
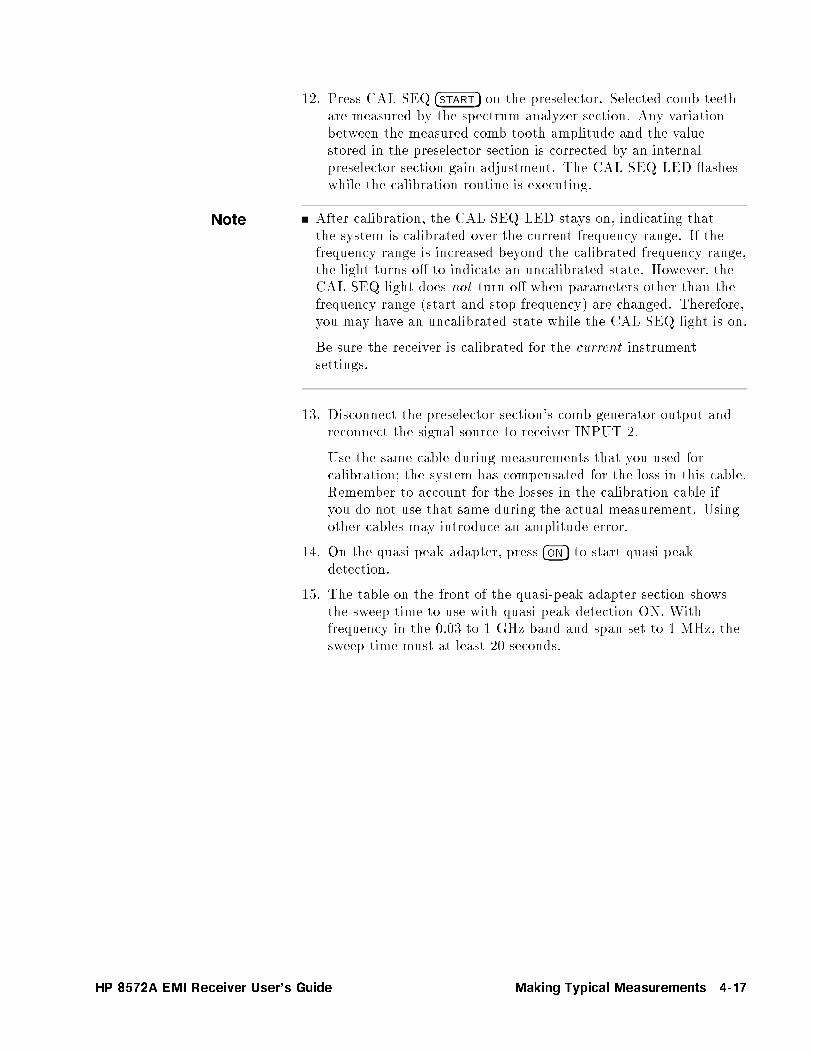
12. Press CAL SEQ �START� on the preselector. Selected comb teethare measured by the spectrum analyzer section. Any variationbetween the measured comb tooth amplitude and the valuestored in the preselector section is corrected by an internalpreselector section gain adjustment. The CAL SEQ LED asheswhile the calibration routine is executing.
Note After calibration, the CAL SEQ LED stays on, indicating thatthe system is calibrated over the current frequency range. If thefrequency range is increased beyond the calibrated frequency range,the light turns o� to indicate an uncalibrated state. However, theCAL SEQ light does not turn o� when parameters other than thefrequency range (start and stop frequency) are changed. Therefore,you may have an uncalibrated state while the CAL SEQ light is on.
Be sure the receiver is calibrated for the current instrumentsettings.
13. Disconnect the preselector section's comb generator output andreconnect the signal source to receiver INPUT 2.
Use the same cable during measurements that you used forcalibration; the system has compensated for the loss in this cable.Remember to account for the losses in the calibration cable ifyou do not use that same during the actual measurement. Usingother cables may introduce an amplitude error.
14. On the quasi-peak adapter, press �ON� to start quasi-peakdetection.
15. The table on the front of the quasi-peak adapter section showsthe sweep time to use with quasi-peak detection ON. Withfrequency in the 0.03 to 1 GHz band and span set to 1 MHz, thesweep time must at least 20 seconds.
HP 8572A EMI Receiver User's Guide Making Typical Measurements 4-17
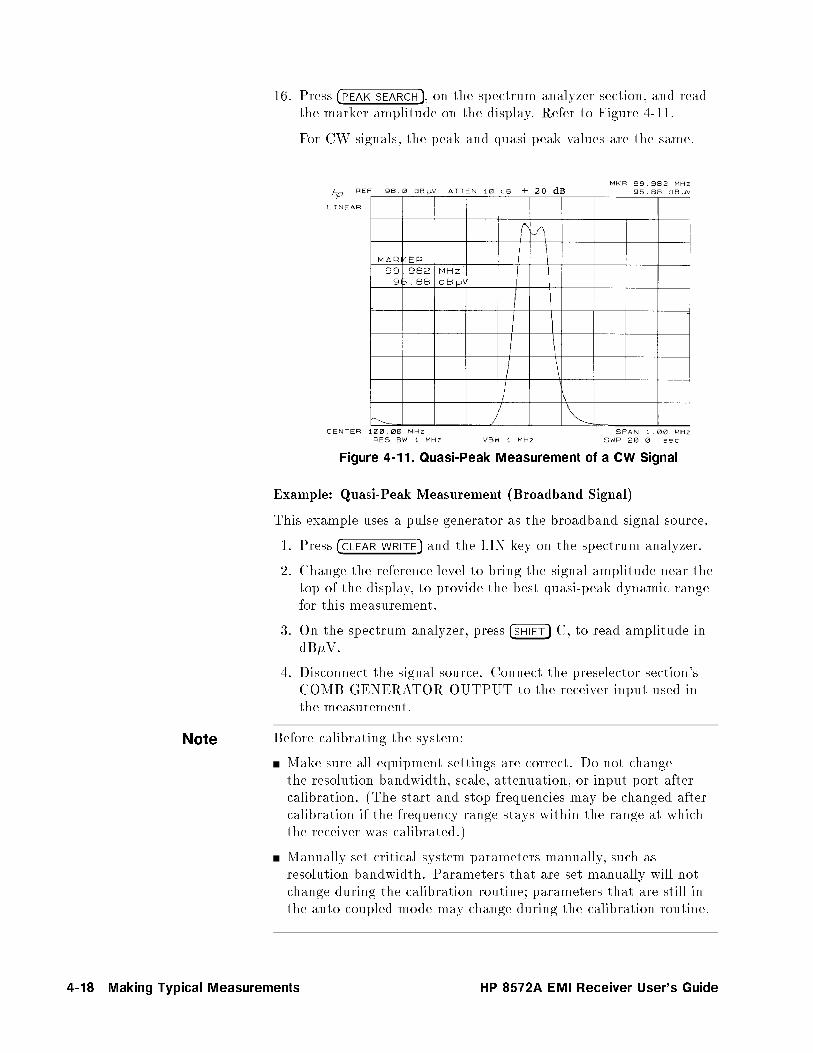
16. Press �PEAK SEARCH�, on the spectrum analyzer section, and readthe marker amplitude on the display. Refer to Figure 4-11.
For CW signals, the peak and quasi-peak values are the same.
Figure 4-11. Quasi-Peak Measurement of a CW Signal
Example: Quasi-Peak Measurement (Broadband Signal)
This example uses a pulse generator as the broadband signal source.
1. Press �CLEAR WRITE� and the LIN key on the spectrum analyzer.
2. Change the reference level to bring the signal amplitude near thetop of the display, to provide the best quasi-peak dynamic rangefor this measurement.
3. On the spectrum analyzer, press �SHIFT� C, to read amplitude indB�V.
4. Disconnect the signal source. Connect the preselector section'sCOMB GENERATOR OUTPUT to the receiver input used inthe measurement.
Note Before calibrating the system:
Make sure all equipment settings are correct. Do not changethe resolution bandwidth, scale, attenuation, or input port aftercalibration. (The start and stop frequencies may be changed aftercalibration if the frequency range stays within the range at whichthe receiver was calibrated.)
Manually set critical system parameters manually, such asresolution bandwidth. Parameters that are set manually will notchange during the calibration routine; parameters that are still inthe auto-coupled mode may change during the calibration routine.
4-18 Making Typical Measurements HP 8572A EMI Receiver User's Guide

5. Press CAL SEQ �START� on the preselector. Selected comb teethare measured by the spectrum analyzer section. Any variationbetween the measured comb tooth amplitude and the valuestored in the preselector section is corrected by an internalpreselector section gain adjustment. The CAL SEQ LED asheswhile the calibration routine runs.
Note After calibration, the CAL SEQ LED stays on, indicating thatthe system is calibrated over the current frequency range. If thefrequency range is increased beyond the calibrated frequency range,the light turns o� to indicate an uncalibrated state. However, theCAL SEQ light does not turn o� when parameters other than thefrequency range (start and stop frequency) are changed. Therefore,you may have an uncalibrated state while the CAL SEQ light is on.
Be sure the receiver is calibrated for the current instrumentsettings.
6. Disconnect the preselector section's comb generator output andreconnect the signal source to receiver INPUT 1.
Use the same cable during measurements that you used forcalibration; the system has compensated for the loss in this cable.Remember to account for the losses in the calibration cable ifyou do not use that same during the actual measurement. Usingother cables may introduce an amplitude error.
7. The table on the front of the quasi-peak adapter section showsthe sweep time to use with quasi-peak detection ON. With asignal in the 0.03 to 1 GHz band and span set to 1 MHz, thesweep time must at least 200 seconds.
Note An alternate method of receiver operation is the \�xed-tuned" mode.In this mode the span is set to 0 Hz, enabling the receiver to sweepat any speed, allowing the measurements can be performed quickly.While in �xed-tuned mode, the receiver measures only the frequencyat which it is tuned (center frequency).
a. Find the frequency of the largest signal in the 15 MHz-to-16 MHzregion by pressing �MAX HOLD� on the spectrum analyzer andallowing the display to �ll in.
b. Press �PEAK SEARCH�. Note the marker frequency.
c. Press �MKR -> CF�. Tune the center frequency of the receiver to themarker frequency noted in the previous step.
d. Press �FREQUENCY SPAN� �0� �Hz� to set the receiver to zero span(time domain). The VOLUME control can be used to listen to thesignal.
e. Set the sweep time to any desired speed and proceed to the nextstep in the measurement.
HP 8572A EMI Receiver User's Guide Making Typical Measurements 4-19

8. On the quasi-peak adapter, press �ON� to start the quasi-peakdetector.
Note Though the peak values of the pulsed signals remain the same,as the repetition rate decreases the quasi-peak amplitude alsodecreases.
Measurements will be accurate only if the signal of interest is abovethe �rst graticule from the bottom of the display. If the quasi-peakamplitude is below the �rst graticule, select �X10� on the quasi-peakadapter. This video ampli�er boosts the signal by a factor of ten,allowing accurate measurements.
If you use the quasi-peak adapter �X10� ampli�er, subtract 20 dBfrom the marker amplitude shown on the display. Whenever avoltage is multiplied by a factor of ten, in terms of dB there is a 20dB di�erence.
9. Press �MAX HOLD� on the spectrum analyzer and allow the receiverto sweep for several seconds.
10. Press �PEAK SEARCH� and read the marker amplitude on thedisplay. Refer to Figure 4-12.
Figure 4-12. Quasi-Peak Measurement of a Broadband Signal
4-20 Making Typical Measurements HP 8572A EMI Receiver User's Guide

Example: Average Measurement (Broadband/Narrowband Signal)
This example makes an average measurement on a composite signalcontaining both narrowband and broadband signals, as shown inFigure 4-13.
Figure 4-13. Composite Signal
1. Press �INSTR PRESET� on the quasi-peak adapter and on thepreselector.
2. Select receiver INPUT 1.
3. Press the 0 ��� key on the switch driver to select the preampli�erBYPASS path. The LED in the key will light.
4. Connect the signal source to receiver INPUT 1.
5. Set the EMI receiver as follows:
�START FREQ� : : : : : : : : : : : : : : : : : : : : : : : : : : : : : : : : : 15 MHz�STOP FREQ� : : : : : : : : : : : : : : : : : : : : : : : : : : : : : : : : : : 16 MHz�RES BW� : : : : : : : : : : : : : : : : : : : : : : : : : : : : : : : : : : : : : 100 kHz�VIDEO BW� : : : : : : : : : : : : : : : : : : : : : : : : : : : : : : : : : : : 100 kHz�SWEEP TIME� : : : : : : : : : : : : : : : : : : : : : : : : : : : : : : : : : : 100 msQPA BW : : : : : : : : : : : : : : : : : : : : : : : : : : : : : : : : : : : : : : 9 kHzQPA : : : : : : : : : : : : : : : : : : : : : : : : : : : : : : : : : : : : : : NORMALAmplitude scale : : : : : : : : : : : : : : : : : : : : : : : : : : : : : : : : : :LIN
6. Because the signal of interest is in the 0.15 to 30 MHz region,the 9 kHz quasi-peak bandwidth (QPA BW) is selected. Referto the table on the front of the quasi-peak adapter, and set thespectrum analyzer resolution and video bandwidths to 100 kHz.
7. According to the table, sweep time with the quasi-peak detectorin NORMAL (or o�) is 100 ms/MHz. Because the selected spanis 1 MHz, the sweep time for this measurement must be at least100 ms.
HP 8572A EMI Receiver User's Guide Making Typical Measurements 4-21

8. To read amplitude in dB�V, press �SHIFT� C on the spectrumanalyzer.
9. Adjust the reference level to bring the signal near the top of thedisplay.
10. Disconnect the signal source. Connect the preselector combgenerator output to the receiver input used in the measurement.
Note Before calibrating the system:
Make sure all equipment settings are correct. Do not changethe resolution bandwidth, scale, attenuation, or input port aftercalibration. (The start and stop frequencies may be changed aftercalibration if the frequency range stays within the range at whichthe receiver was calibrated.)Manually set critical system parameters manually, such asresolution bandwidth. Parameters that are set manually will notchange during the calibration routine; parameters that are still inthe auto-coupled mode may change during the calibration routine.
11. Press CAL SEQ �START� on the preselector. Selected comb teethare measured by the spectrum analyzer section. Any variationbetween the measured comb tooth amplitude and the valuestored in the preselector section is corrected by an internalpreselector section gain adjustment. The CAL SEQ LED asheswhile the calibration routine runs.
Note After calibration, the CAL SEQ LED stays on, indicating thatthe system is calibrated over the current frequency range. If thefrequency range is increased beyond the calibrated frequency range,the light turns o� to indicate an uncalibrated state. However, theCAL SEQ light does not turn o� when parameters other than thefrequency range (start and stop frequency) are changed. Therefore,you may have an uncalibrated state while the CAL SEQ light is on.
Be sure the receiver is calibrated for the current instrumentsettings.
12. Disconnect the preselector section's comb generator output andreconnect the signal source to receiver INPUT 1.
Use the same cable during measurements that you used forcalibration; the system has compensated for the loss in this cable.Remember to account for the losses in the calibration cable ifyou do not use that same during the actual measurement. Usingother cables may introduce an amplitude error.
13. Press the �AUTO� key corresponding to the sweep time. Thisallows the sweep time to slow down automatically in the nextstep.
4-22 Making Typical Measurements HP 8572A EMI Receiver User's Guide
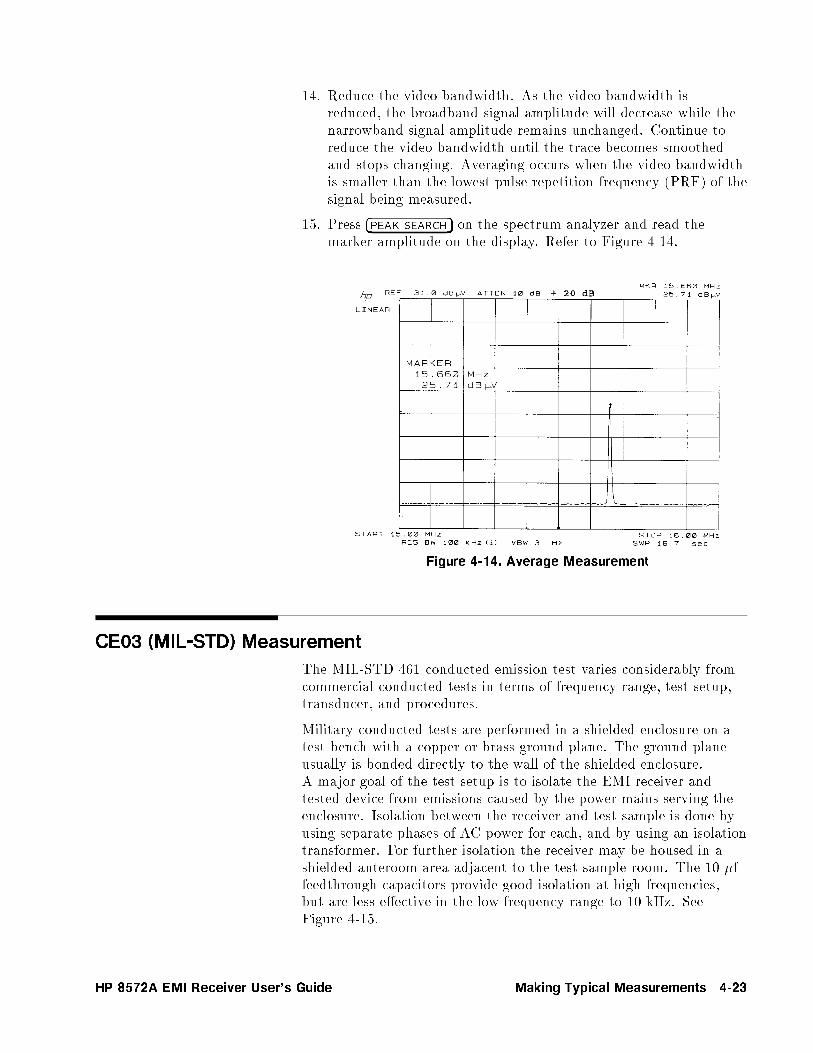
14. Reduce the video bandwidth. As the video bandwidth isreduced, the broadband signal amplitude will decrease while thenarrowband signal amplitude remains unchanged. Continue toreduce the video bandwidth until the trace becomes smoothedand stops changing. Averaging occurs when the video bandwidthis smaller than the lowest pulse repetition frequency (PRF) of thesignal being measured.
15. Press �PEAK SEARCH� on the spectrum analyzer and read themarker amplitude on the display. Refer to Figure 4-14.
Figure 4-14. Average Measurement
CE03 (MIL-STD) Measurement
The MIL-STD 461 conducted emission test varies considerably fromcommercial conducted tests in terms of frequency range, test setup,transducer, and procedures.
Military conducted tests are performed in a shielded enclosure on atest bench with a copper or brass ground plane. The ground planeusually is bonded directly to the wall of the shielded enclosure.A major goal of the test setup is to isolate the EMI receiver andtested device from emissions caused by the power mains serving theenclosure. Isolation between the receiver and test sample is done byusing separate phases of AC power for each, and by using an isolationtransformer. For further isolation the receiver may be housed in ashielded anteroom area adjacent to the test sample room. The 10 �ffeedthrough capacitors provide good isolation at high frequencies,but are less e�ective in the low frequency range to 10 kHz. SeeFigure 4-15.
HP 8572A EMI Receiver User's Guide Making Typical Measurements 4-23

Figure 4-15. CE03 Power Lead Test Setup (Air Force and Navy)
Current probes are used as the transducer for most militaryconducted emission tests. The probe, which is clamped around thewire of interest, is exposed to the magnetic �eld produced by thecurrent in the wire. The resulting output voltage of the probe isproportional to the current level, frequency, and probe characteristicssuch as permeability, cross-sectional area and number of turns.
To determine the current level associated with a particular voltagethe transfer impedance (Z� ) of the probe must be known. Bysubtracting the transfer impedance (dB) from the voltage (dB�V)measured on the receiver, the equivalent current (dB�A) can becalculated. As an alternate, a composite limit in dB�V may bedetermined by adding Z� (dB) to the limit (dB�A). Be careful notto exceed the current rating limitations of the probe as this couldsaturate the core of the probe and result in measurement errors.Matching transformers or inverse ampli�ers may be employed toachieve a Z� of 0 dB over a wide frequency range. See Figure 4-16.
4-24 Making Typical Measurements HP 8572A EMI Receiver User's Guide

Figure 4-16. Current Probes as Transducers
Emissions may be de�ned as narrowband or broadband, relativeto the bandwidth of the receiver. MIL-STD 461 generally hasdi�erent limits for narrowband and broadband signals, requiringdiscrimination between the two and di�erent measurement units.
A narrowband emission is by de�nition narrower than the receiver'sbandwidth and its amplitude will not vary with bandwidth. Theamplitude of a broadband emission, however, will vary withbandwidth and the measurement taken must be referred to aparticular bandwidth. Thus, narrowband measurements are madein units of voltage, current, or �eld strength while broadbandmeasurements are made in these same units referred to a bandwidth,usually 1 MHz. If broadband measurements are made in a bandwidthdi�erent from the reference bandwidth, a correction factor must beadded to the measurement.
For coherent broadband signals, use a 20log correction factor. Forincoherent (random) broadband signals, a 10log relationship is valid.Because it can be di�cult to discriminate between coherent andincoherent signals, use of the 20log factor will ensure �nding theworst case result. See Figure 4-17.
HP 8572A EMI Receiver User's Guide Making Typical Measurements 4-25

Figure 4-17. Bandwidth Correction Factor
RE02 (MIL-STD) Measurement
MIL-STD 461 RE02 is designed to measure radiated emissions.In many respects, it is similar to the CE03. This test measuresinterference radiating from a test device over a frequency range of 14kHz to 10 GHz.
The RE02 setup shown in Figure 4-18 is for non-portable equipmentthat is permanently connected to a vehicle, system, or installation.For portable equipment such as hand tools, o�ce machines, andmanpack-operable equipment, the test sample is placed on aone-meter-high non-metallic test stand facing the antenna. The testis made in a shielded enclosure with the receiving antenna at leastone meter away from all walls of the enclosure. The measurementequipment should be placed outside the enclosure or in a shieldedanteroom to prevent this equipment from interfering with themeasurement.
4-26 Making Typical Measurements HP 8572A EMI Receiver User's Guide
Figure 4-18. RE02 Test Setup
The RE02 requirements are applicable to radiated emissions fromequipment and subsystems, cables, and interconnecting wiring.Emissions from antennas are not included. As with other tests,the intent of the procedure is to simulate the actual installationconditions of the equipment. RE02 limits and procedures are:
Narrowband test: 14 kHz to 10 GHz.
Broadband test: 14 kHz to 1 GHz.
Does not apply to radiation from antennas.
Vertical and horizontal polarization must be tested above 30 MHz.
Probe with a loop to �nd the point of maximum emission andorient this point one meter from antenna.
For large equipment or systems, the antenna should be moved totest a one-meter distance from various points.
Typical antennas:
14 kHz to 30 MHz (active rod) : : : : : : : : : : : : : : : : : : : : : :HP 11966B
30 to 300 MHz (biconical) : : : : : : : : : : : : : : : : : : : : : : : : : : HP 11966C
200 MHz to 2 GHz (double-ridged horn) : : : : : : : : : : : : : HP 11966I
1 to 18 GHz (double-ridged horn) : : : : : : : : : : : : : : : : : : :HP 11966E
HP 8572A EMI Receiver User's Guide Making Typical Measurements 4-27

CISPR 22 Measurements
An advantage of using the EMI receiver for making EMImeasurements is the receiver's quick-look/full-span capability. Thisallows you to identify problem areas quickly, then zoom in for furtheranalysis.
Example: Conducted Emission Measurement
The �rst step in making a conducted emission measurement is to usepeak detection to locate problem areas. The suggested settings forthe quasi-peak adapter are:
INSTR FUNCTION : : : : : : : : : : : : : : : : : : : : : : : : : : : : : : : : : : : NORMAL
FREQUENCY BAND : : : : : : : : : : : : : : : : : : : : : : : : : : :150 kHz{30 MHz
QUASI-PEAK DETECTOR : : : : : : : : : : : : : : : : : : : : : : : : : : : : : : : : �OFF�
If you observe emissions that exceed the regulatory limits at somefrequencies, you may zoom in for further analysis. After you adjustthe reference level and set the span and sweep time, turn on thequasi-peak detector.
�RES BW� : : : : : : : : : : : : : : : : : : : : : : : : : : : : : : : : : : : : : : : : : : : : : : : : : 100 kHz
�VIDEO BW� : : : : : : : : : : : : : : : : : : : : : : : : : : : : : : : : : : : : : : : : : : : : : : : 100 kHz
�START FREQ� : : : : : : : : : : : : : : : : : : : lower frequency of regulatory limit
(450 kHz for the FCC, 150 kHz for VDE/CISPR)
�STOP FREQ� : : : : : : : : : : : : : : : : : : : : : : : : : : : : : : : : : : : : : : : : : : : : : : 30 MHz
�ATTEN� : : : : : : : : : : : : : : : : : : : : : : : : : : : : : : : : : : : : : : : : : : : : : : : : : : : : 10 dB
Receiver Input : : : : : : : : : : : : : : : : : : : : : : : : : : : : : : : : : : : : : : : : : : : : Input 1
�SWEEP TIME� : : : : : : : : : : : : : : : : : : : : : : : : : : : : : : : : :�.1 sec/MHz x span
(for example, 3 seconds for a 30 MHz span)
If the amplitude is below the limit, then the equipment under test(EUT) passes the test.
4-28 Making Typical Measurements HP 8572A EMI Receiver User's Guide

Example: Radiated Emission Measurements
The procedure used to make radiated emission measurementsdepends on the nature of the test site. If you make measurements ina semi-anechoic enclosure or at a remote site where ambient signalsare below the limits, you may use a quick-look/full-span proceduresimilar to the procedure used to make conducted measurements. If,on the other hand, you make measurements at an open site wherenumerous ambient signals are above the limits, then you must useone of these two procedures:
Make preliminary measurements in a shielded enclosure whereambient signals are not present. Frequencies at which emissionsare noted are then rechecked at an open site. (For CISPRmeasurements, a shielded enclosure can be used to locate emissions,but not to measure emission amplitudes.)
or
Select a relatively narrow span (for example, 1 MHz) then tune thecenter frequency, keeping track of emissions as they are observed.The relatively narrow span is required in order to distinguishbetween ambient and signals from the EUT.
At open sites, ambient signals must be distinguished from signalsemitted by the EUT.
Compile a list of ambient signals that are always or almostalways present in a given environment. This allows some signalsto be recognized as ambients based solely on the frequency ofobservation.
Sounds produced by emissions from a particular EUT may beunique and recognizable. Similarly, ambient signals can often beidenti�ed by sound alone. For this reason, a speaker is built intothe quasi-peak adapter.
HP 8572A EMI Receiver User's Guide Making Typical Measurements 4-29
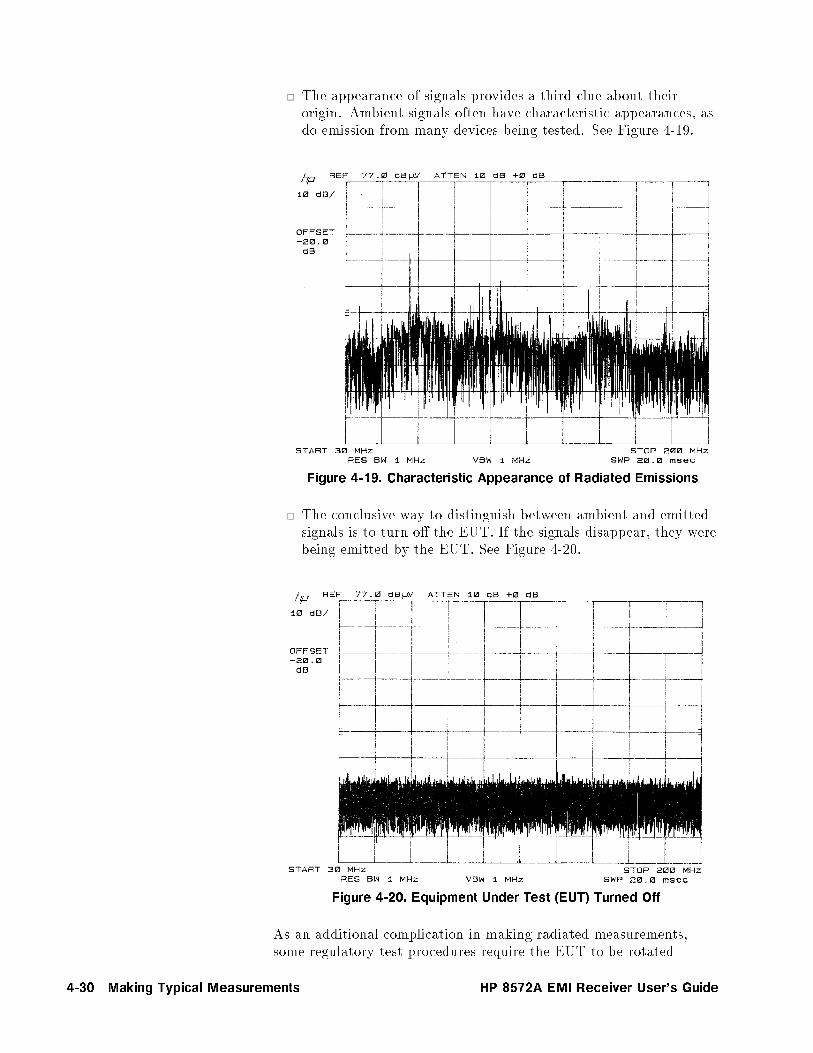
The appearance of signals provides a third clue about theirorigin. Ambient signals often have characteristic appearances, asdo emission from many devices being tested. See Figure 4-19.
Figure 4-19. Characteristic Appearance of Radiated Emissions
The conclusive way to distinguish between ambient and emittedsignals is to turn o� the EUT. If the signals disappear, they werebeing emitted by the EUT. See Figure 4-20.
Figure 4-20. Equipment Under Test (EUT) Turned Off
As an additional complication in making radiated measurements,some regulatory test procedures require the EUT to be rotated
4-30 Making Typical Measurements HP 8572A EMI Receiver User's Guide
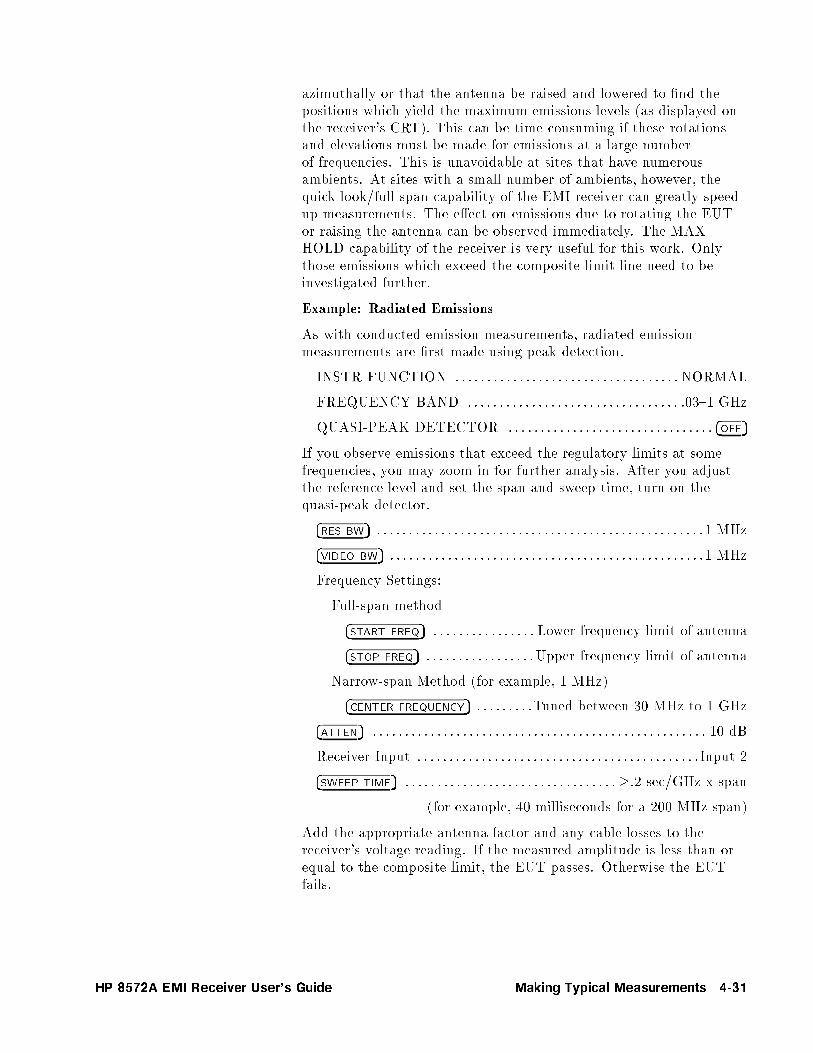
azimuthally or that the antenna be raised and lowered to �nd thepositions which yield the maximum emissions levels (as displayed onthe receiver's CRT). This can be time consuming if these rotationsand elevations must be made for emissions at a large numberof frequencies. This is unavoidable at sites that have numerousambients. At sites with a small number of ambients, however, thequick-look/full-span capability of the EMI receiver can greatly speedup measurements. The e�ect on emissions due to rotating the EUTor raising the antenna can be observed immediately. The MAXHOLD capability of the receiver is very useful for this work. Onlythose emissions which exceed the composite limit line need to beinvestigated further.
Example: Radiated Emissions
As with conducted emission measurements, radiated emissionmeasurements are �rst made using peak detection.
INSTR FUNCTION : : : : : : : : : : : : : : : : : : : : : : : : : : : : : : : : : : : NORMAL
FREQUENCY BAND : : : : : : : : : : : : : : : : : : : : : : : : : : : : : : : : : .03{1 GHz
QUASI-PEAK DETECTOR : : : : : : : : : : : : : : : : : : : : : : : : : : : : : : : : �OFF�
If you observe emissions that exceed the regulatory limits at somefrequencies, you may zoom in for further analysis. After you adjustthe reference level and set the span and sweep time, turn on thequasi-peak detector.
�RES BW� : : : : : : : : : : : : : : : : : : : : : : : : : : : : : : : : : : : : : : : : : : : : : : : : : : :1 MHz
�VIDEO BW� : : : : : : : : : : : : : : : : : : : : : : : : : : : : : : : : : : : : : : : : : : : : : : : : :1 MHz
Frequency Settings:
Full-span method
�START FREQ� : : : : : : : : : : : : : : : : Lower frequency limit of antenna
�STOP FREQ� : : : : : : : : : : : : : : : : :Upper frequency limit of antenna
Narrow-span Method (for example, 1 MHz)
�CENTER FREQUENCY� : : : : : : : : :Tuned between 30 MHz to 1 GHz
�ATTEN� : : : : : : : : : : : : : : : : : : : : : : : : : : : : : : : : : : : : : : : : : : : : : : : : : : : : 10 dB
Receiver Input : : : : : : : : : : : : : : : : : : : : : : : : : : : : : : : : : : : : : : : : : : : : Input 2
�SWEEP TIME� : : : : : : : : : : : : : : : : : : : : : : : : : : : : : : : : : �.2 sec/GHz x span
(for example, 40 milliseconds for a 200 MHz span)
Add the appropriate antenna factor and any cable losses to thereceiver's voltage reading. If the measured amplitude is less than orequal to the composite limit, the EUT passes. Otherwise the EUTfails.
HP 8572A EMI Receiver User's Guide Making Typical Measurements 4-31


5
Downloadable Program (DLP) Measurements
In this chapter, you'll learn how to perform EMI measurements withthe HP 85867A downloadable program (DLP). This DLP is loadedinto the memory of every HP 8572A EMI receiver.
Example: Quasi-peak measurements on broadband signals, using a DLP
Note Complete manual calibration over the desired frequency rangebefore starting the DLP.
The source used is a pulse generator in the 5 MHz range.
In this example, only receiver INPUT 1 is calibrated (for CISPRband B). Separate calibration data can be stored for both INPUT1 and INPUT 2 of the preselector section. This lets you calibratethe system over a wide frequency range. You may prefer tocalibrate each input to correspond to a particular band beforemaking measurements, because you then would not have tocalibrate the system many times, over smaller frequency ranges.
1. Place the DLP overlay on the spectrum analyzer section numerickeypad.
2. Press �INSTR PRESET� on the quasi-peak adapter and on thepreselector.
3. Press the INPUT 1 selection key on the preselector.
4. Place the preampli�er in BYPASS mode by pressing the switchdriver 0 ��� key. The LED in the key will light.
5. Connect the signal source to receiver INPUT 1.
6. Set the receiver to these settings:
�START FREQ� . . . . . . . . . . . . . . . . . . . . . . . . . . . . . . 150 kHz�STOP FREQ� . . . . . . . . . . . . . . . . . . . . . . . . . . . . . . . 30 MHz�REW BW� . . . . . . . . . . . . . . . . . . . . . . . . . . . . . . . . . 100 kHz�VIDEO BW� . . . . . . . . . . . . . . . . . . . . . . . . . . . . . . . . 100 kHzQPA BW . . . . . . . . . . . . . . . . . . . . . . . . . . . . . . . . . . 9 kHzQPA . . . . . . . . . . . . . . . . . . . . . . . . . . . . . . . . . . . NORMALScale . . . . . . . . . . . . . . . . . . . . . . . . . . . . . . . . . . . . . . . . LIN
HP 8572A EMI Receiver User's Guide Downloadable Program (DLP) Measurements 5-1
Because the signal of interest is in the 0.15 to 30 MHz region (5MHz), the 9 kHz quasi-peak bandwidth (QPA BW) is selected.According to the table on the front of the quasi-peak adapter,resolution and video bandwidths are 100 kHz.
7. To read amplitude in dB�V, press �SHIFT� C on the spectrumanalyzer.
8. Adjust the reference level to bring the signal near the top of thedisplay.
9. Disconnect the signal source. Connect the RF preselector combgenerator output to receiver INPUT 1.
Note Before calibrating the system:
Make sure all equipment settings are correct. Do not changeresolution bandwidth, scale, attenuation, or input port aftercalibration. (The start and stop frequencies may be changed aftercalibration if the frequency range stays within the range at whichthe receiver was calibrated.)
To ensure best amplitude accuracy when making measurements,recalibrate the system whenever you change a parameter.
Manually set critical system parameters, such as resolutionbandwidth. Parameters that are set manually will not changeduring the calibration routine; parameters that are still in theauto-coupled mode may change during the calibration routine.
On the preselector, press CAL SEQ �START�. The spectrumanalyzer will measure selected comb teeth. Any variation betweenthe measured comb tooth stored in the preselector section iscorrected by an internal preselector section gain adjustment. TheCAL SEQ LED ashes while the calibration routine runs.
Note After calibration, the CAL SEQ LED stays on, indicating thatthe system is calibrated over the current frequency range. If thefrequency range is increased beyond the calibrated range, thelight turns o�, to indicate an uncalibrated state. However, theCAL SEQ light does not turn o� when parameters other than thefrequency range (start and stop frequency) are changed. Therefore,you may have an uncalibrated state while the CAL SEQ light isstill on.
Be sure the receiver is calibrated for the current instrumentsettings.
Disconnect the preselector section's comb generator output andreconnect the signal source to Input 1 of the preselector section.
Use the same cable during measurements that you used forcalibration, because the system has compensated for the loss in this
5-2 Downloadable Program (DLP) Measurements HP 8572A EMI Receiver User's Guide
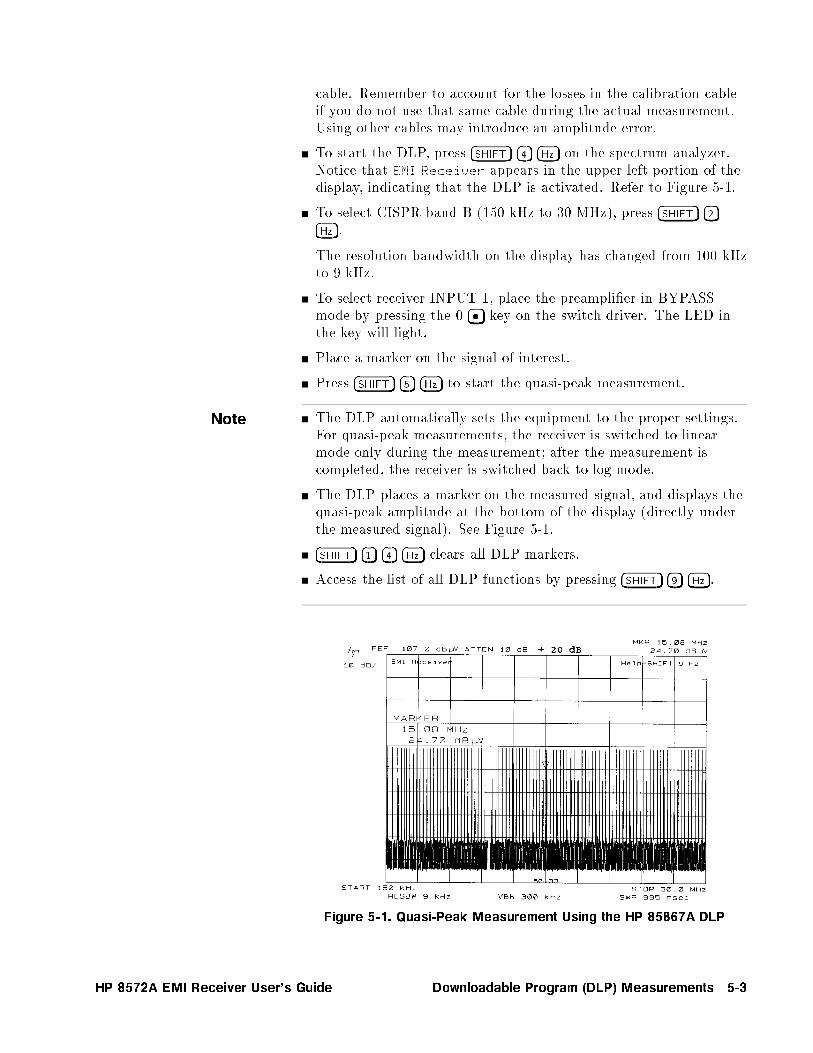
cable. Remember to account for the losses in the calibration cableif you do not use that same cable during the actual measurement.Using other cables may introduce an amplitude error.
To start the DLP, press �SHIFT� �4� �Hz� on the spectrum analyzer.Notice that EMI Receiver appears in the upper left portion of thedisplay, indicating that the DLP is activated. Refer to Figure 5-1.
To select CISPR band B (150 kHz to 30 MHz), press �SHIFT� �2��Hz�.
The resolution bandwidth on the display has changed from 100 kHzto 9 kHz.
To select receiver INPUT 1, place the preampli�er in BYPASSmode by pressing the 0 ��� key on the switch driver. The LED inthe key will light.
Place a marker on the signal of interest.
Press �SHIFT� �5� �Hz� to start the quasi-peak measurement.
Note The DLP automatically sets the equipment to the proper settings.For quasi-peak measurements, the receiver is switched to linearmode only during the measurement; after the measurement iscompleted, the receiver is switched back to log mode.
The DLP places a marker on the measured signal, and displays thequasi-peak amplitude at the bottom of the display (directly underthe measured signal). See Figure 5-1.
�SHIFT� �1� �4� �Hz� clears all DLP markers.
Access the list of all DLP functions by pressing �SHIFT� �9� �Hz�.
Figure 5-1. Quasi-Peak Measurement Using the HP 85867A DLP
HP 8572A EMI Receiver User's Guide Downloadable Program (DLP) Measurements 5-3

Position the marker on another signal, and perform anotherquasi-peak measurement. Up to six quasi-peak values can bemeasured.
5-4 Downloadable Program (DLP) Measurements HP 8572A EMI Receiver User's Guide
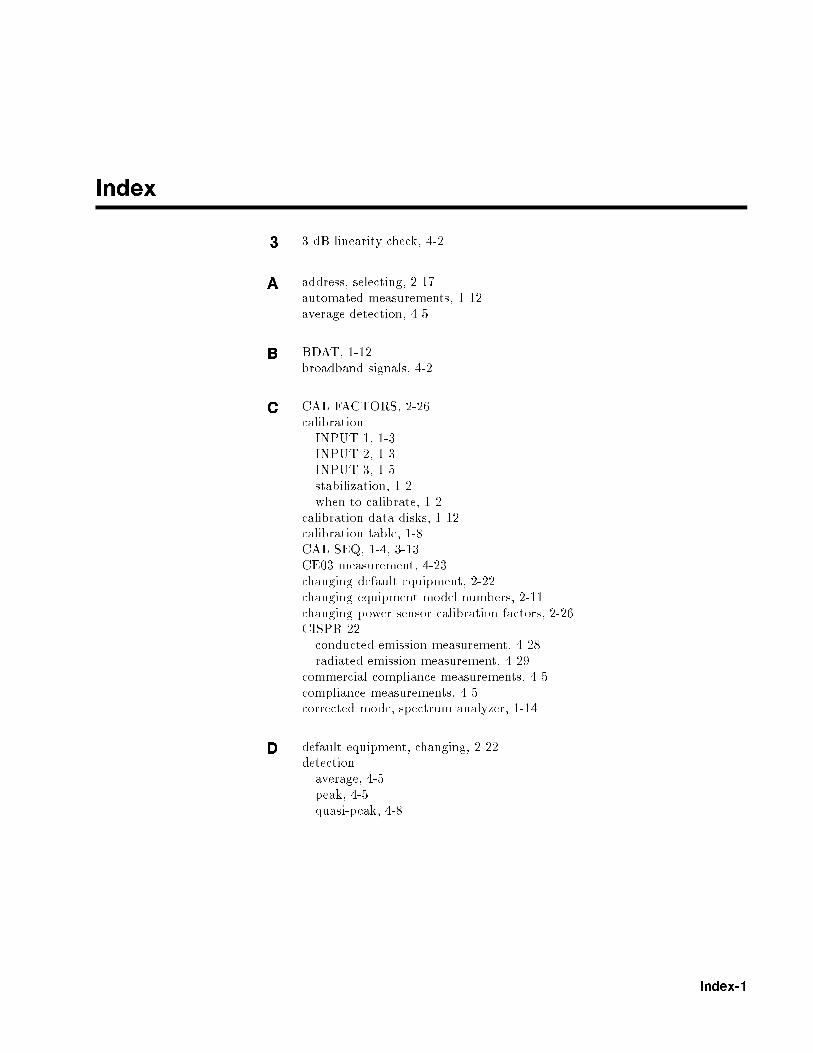
Index
3 3 dB linearity check, 4-2
A address, selecting, 2-17automated measurements, 1-12average detection, 4-5
B BDAT, 1-12broadband signals, 4-2
C CAL FACTORS, 2-26calibrationINPUT 1, 1-3INPUT 2, 1-3INPUT 3, 1-5stabilization, 1-2when to calibrate, 1-2
calibration data disks, 1-12calibration table, 1-8CAL SEQ, 1-4, 3-13CE03 measurement, 4-23changing default equipment, 2-22changing equipment model numbers, 2-11changing power sensor calibration factors, 2-26CISPR 22conducted emission measurement, 4-28radiated emission measurement, 4-29
commercial compliance measurements, 4-5compliance measurements, 4-5corrected mode, spectrum analyzer, 1-14
D default equipment, changing, 2-22detectionaverage, 4-5peak, 4-5quasi-peak, 4-8
Index-1
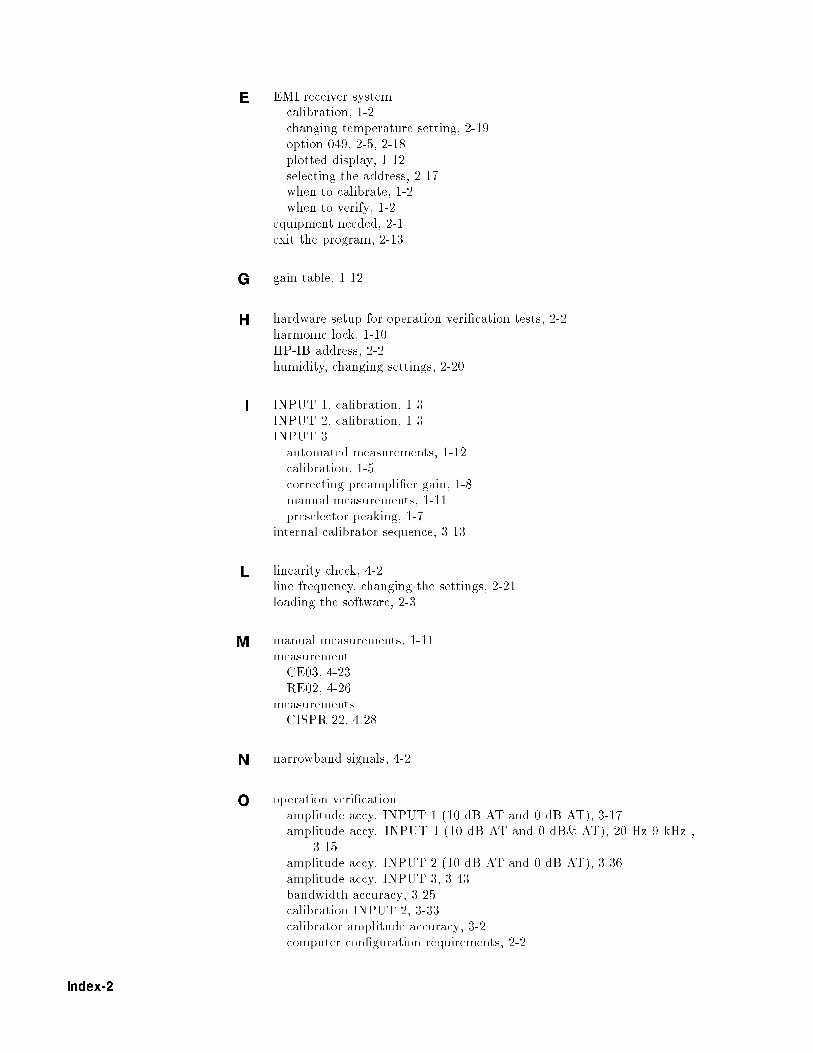
E EMI receiver systemcalibration, 1-2changing temperature setting, 2-19option 049, 2-5, 2-18plotted display, 1-12selecting the address, 2-17when to calibrate, 1-2when to verify, 1-2
equipment needed, 2-1exit the program, 2-13
G gain table, 1-12
H hardware setup for operation veri�cation tests, 2-2harmonic lock, 1-10HP-IB address, 2-2humidity, changing settings, 2-20
I INPUT 1, calibration, 1-3INPUT 2, calibration, 1-3INPUT 3automated measurements, 1-12calibration, 1-5correcting preampli�er gain, 1-8manual measurements, 1-11preselector peaking, 1-7
internal calibrator sequence, 3-13
L linearity check, 4-2line frequency, changing the settings, 2-21loading the software, 2-3
M manual measurements, 1-11measurementCE03, 4-23RE02, 4-26
measurementsCISPR 22, 4-28
N narrowband signals, 4-2
O operation veri�cationamplitude accy. INPUT 1 (10 dB AT and 0 dB AT), 3-17amplitude accy. INPUT 1 (10 dB AT and 0 dB& AT), 20 Hz-9 kHz ,
3-15amplitude accy. INPUT 2 (10 dB AT and 0 dB AT), 3-36amplitude accy. INPUT 3, 3-43bandwidth accuracy, 3-25calibration INPUT 2, 3-33calibrator amplitude accuracy, 3-2computer con�guration requirements, 2-2
Index-2
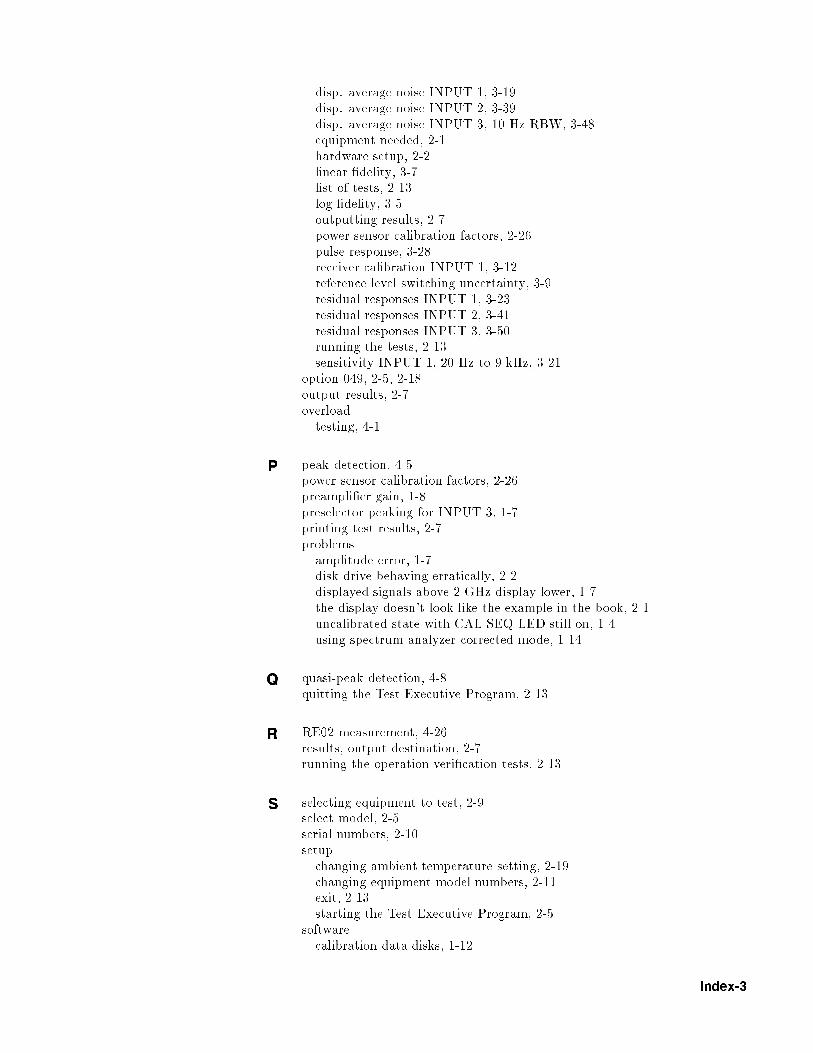
disp. average noise INPUT 1, 3-19disp. average noise INPUT 2, 3-39disp. average noise INPUT 3, 10 Hz RBW, 3-48equipment needed, 2-1hardware setup, 2-2linear �delity, 3-7list of tests, 2-13log �delity, 3-5outputting results, 2-7power sensor calibration factors, 2-26pulse response, 3-28receiver calibration INPUT 1, 3-12reference level switching uncertainty, 3-9residual responses INPUT 1, 3-23residual responses INPUT 2, 3-41residual responses INPUT 3, 3-50running the tests, 2-13sensitivity INPUT 1, 20 Hz to 9 kHz, 3-21
option 049, 2-5, 2-18output results, 2-7overloadtesting, 4-1
P peak detection, 4-5power sensor calibration factors, 2-26preampli�er gain, 1-8preselector peaking for INPUT 3, 1-7printing test results, 2-7problemsamplitude error, 1-7disk drive behaving erratically, 2-2displayed signals above 2 GHz display lower, 1-7the display doesn't look like the example in the book, 2-1uncalibrated state with CAL SEQ LED still on, 1-4using spectrum analyzer corrected mode, 1-14
Q quasi-peak detection, 4-8quitting the Test Executive Program, 2-13
R RE02 measurement, 4-26results, output destination, 2-7running the operation veri�cation tests, 2-13
S selecting equipment to test, 2-9select model, 2-5serial numbers, 2-10setupchanging ambient temperature setting, 2-19changing equipment model numbers, 2-11exit, 2-13starting the Test Executive Program, 2-5
softwarecalibration data disks, 1-12
Index-3
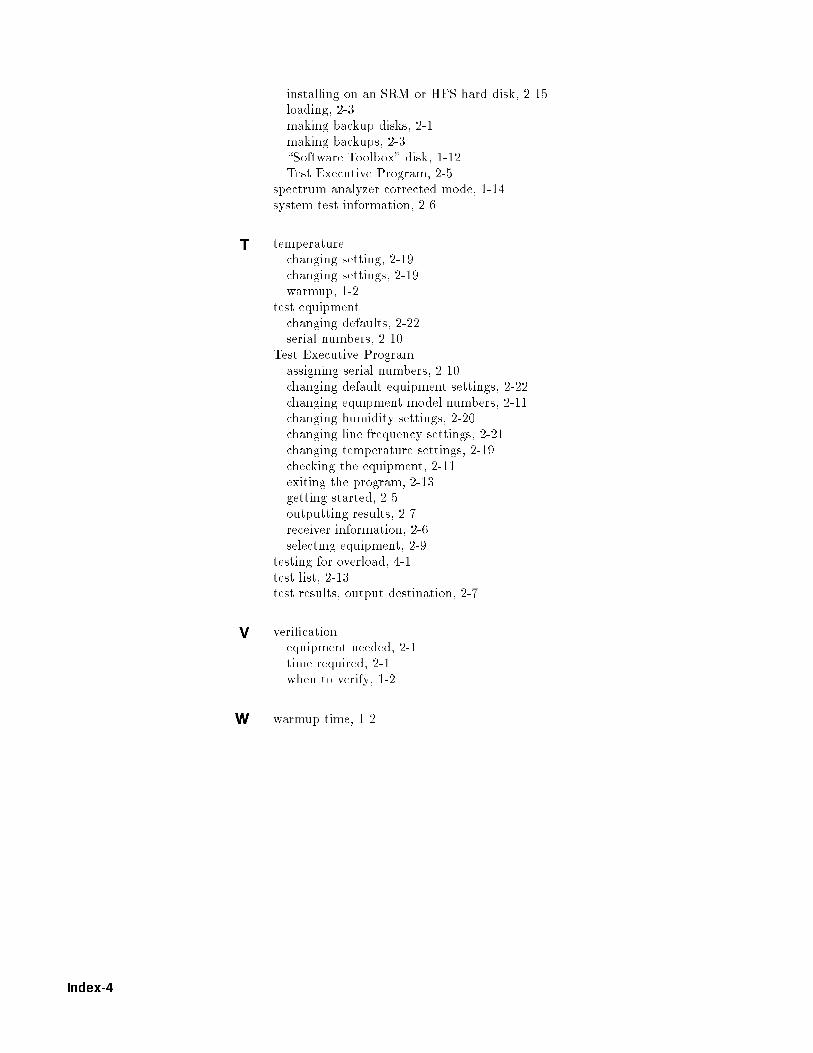
installing on an SRM or HFS hard disk, 2-15loading, 2-3making backup disks, 2-1making backups, 2-3\Software Toolbox" disk, 1-12Test Executive Program, 2-5
spectrum analyzer corrected mode, 1-14system test information, 2-6
T temperaturechanging setting, 2-19changing settings, 2-19warmup, 1-2
test equipmentchanging defaults, 2-22serial numbers, 2-10
Test Executive Programassigning serial numbers, 2-10changing default equipment settings, 2-22changing equipment model numbers, 2-11changing humidity settings, 2-20changing line frequency settings, 2-21changing temperature settings, 2-19checking the equipment, 2-11exiting the program, 2-13getting started, 2-5outputting results, 2-7receiver information, 2-6selecting equipment, 2-9
testing for overload, 4-1test list, 2-13test results, output destination, 2-7
V veri�cationequipment needed, 2-1time required, 2-1when to verify, 1-2
W warmup time, 1-2
Index-4