abcd: aircraft based concept developments - eurocontrol · 1 abcd: aircraft based concept...
TRANSCRIPT

1
ABCD: Aircraft Based Concept Developments
WORK PACKAGE 3 – DELIVERABLE D3
Report on the benefits (based on simulation results) and costs of an ABCD implementation at airline level
This document presents a synthesis of information aiming to
support discussions concerning ABCD concept and processes. It does not
represent the position of EUROCONTROL Agency.

A D V A N C E D L O G I S T I C S G R
Madrid � Barcelona
EUROCONTROL
ABCD: Aircraft-Based Concept Developments
Date: 15/09/2008 Issue: 0 Rev: Page: 2
2
DOCUMENT IDENTIFICATION SHEET
DOCUMENT DESCRIPTION
Document Title ABCD: Aircraft Based Concept Developments
Deliverable D3: Report on the benefits (based on si mulation results) and costs of an ABCD implementation at airline level
Abstract
This deliverable first reports on the preparation, execution and results of the TACOT simulations directed towards the analysis of the benefits and costs of the implementation of ABCD by a low-cost or regional airline. The result analysis is an input to the Cost Benefit Analysis, which is presented after it.
Keywords CFMU Airport ATC ATFM Capacity Airlines Benefit CTOT Delay EOBT FPL Messages ABCD Anticipation Regulation TACOT simulation
CONTACT PERSON: TEL: DIVISION:
DOCUMENT STATUS AND TYPE
STATUS CATEGORY CLASSIFICATION Working Draft � Executive Task � General Public � Draft � Specialist Task � EATMP � Proposed Issue � Lower Layer Task � Restricted � Released Issue �
ELECTRONIC BACKUP
INTERNAL REFERENCE NAME:
HOST SYSTEM MEDIA SOFTWARE Microsoft Windows Type:
Media Identification:

A D V A N C E D L O G I S T I C S G R
Madrid � Barcelona
EUROCONTROL
ABCD: Aircraft-Based Concept Developments
Date: 15/09/2008 Issue: 0 Rev: Page: 3
3
DOCUMENT CHANGE RECORD
The following table records the complete history of the successive editions of the present document.
EDITION DATE DESCRIPTION OF EVOLUTION SECTIONS /
PAGES AFFECTED
0.1 19/09/2008 Working Draft Creation All
0.2 05/01/2009 General Public Version All

A D V A N C E D L O G I S T I C S G R
Madrid � Barcelona
EUROCONTROL
ABCD: Aircraft-Based Concept Developments
Date: 15/09/2008 Issue: 0 Rev: Page: 4
4
- This page is intentionally blank –

A D V A N C E D L O G I S T I C S G R
Madrid � Barcelona
EUROCONTROL
ABCD: Aircraft-Based Concept Developments
Date: 15/09/2008 Issue: 0 Rev: Page: 5
5
SUMMARY
The present deliverable (D3), presents the results for Work Package 3 “Cost Benefit Analysis”, as part of the ABCD project.
The purpose of this Work Package was to assess, through a Cost Benefit Analysis, the economic viability of the ABCD tool when implemented at airline level. This deliverable therefore proposes an analysis of the envisaged benefits and costs for the implementation of ABCD by an airline (typically a low-cost or regional airline).
To estimate the potential benefits that ABCD could bring to the airline, fast-time ATFM simulations using TACOT platform were performed on real traffic. The objective was to study the impact of an earlier notification of delay messages of one airline on the ATFM delay of this one. For this purpose, a comparative assessment was carried out between the baseline situation (replaying the real situation) and several alternative situations where the anticipation of the delay messages was increased by a specific amount of time (-10, -20, -30, -45, -60, -90, -120). The traffic sample to be simulated was composed of eight days, representative of a whole year in terms of ATFM delay and total traffic. Those simulations provided a certain number of output data, such as some statistic indicators or raw flight data.
The analysis of the simulation results was focused on the impact of the alternative scenarios on the ATFM delay and ATFM message at airline level, and on the lost slots at network level. The baseline scenario was used as a reference scenario.
The following conclusions were drawn from the result analysis:
� The total ATFM delay incurred by the airline would be lower if delays were notified earlier than today;
� There is increased value to earn when the level of traffic is high, because 1) more flights are regulated and are in a position to benefit from the use of ABCD and 2) more flights suffer from long ATFM delays, which are more sensitive to the anticipation parameter;
� The relationship between ATFM delay reduction and anticipation for one airline is nonlinear because air transport is stochastic by essence and the slot allocation mechanism depends on a wide range of external parameters. As ATFM delays cannot be easily predicted, benefits cannot be accurately assessed: two cases were therefore analysed, including a worst-case assuming minimal gains, in order to be as conservative as possible in the Cost Benefit Analysis;
� In all cases, benefits outstrip costs over the product lifecycle, even in the most adverse situation because 1) investment costs are limited: ABCD is straightforward to develop, implement and operate and is a standalone product designed to have the minimum impact on the current environment and 2) ABCD should yield substantial benefits because of the high delay cost

A D V A N C E D L O G I S T I C S G R
Madrid � Barcelona
EUROCONTROL
ABCD: Aircraft-Based Concept Developments
Date: 15/09/2008 Issue: 0 Rev: Page: 6
6
and because of the cumulative effect resulting from a continuous use of the tool.
Therefore it can be stated confidently that such a tool is worth the investment. Additional work is in progress to assess benefits more accurately and confirm that they are undervalued by the estimates currently used in the CBA. Positive results have been obtained so far.
In particular, the impact of ATFM delay reduction on reactionary delays was not evaluated yet but is likely to bring extra gains of the same order, because the air transport network is becoming increasingly sensitive to primary delays. This is all the more true in the case of low-cost and regional carriers, whose aircraft are subject to tight schedules, hence prone to knock-on effects in case of long, early ATFM delays.

A D V A N C E D L O G I S T I C S G R
Madrid � Barcelona
EUROCONTROL
ABCD: Aircraft-Based Concept Developments
Date: 15/09/2008 Issue: 0 Rev: Page: 7
7
TABLE OF CONTENTS
1 INTRODUCTION............................................................................................. 10
1.1 ABCD OVERVIEW ..........................................................................................10 1.2 PROJECT BACKGROUND .................................................................................10 1.3 WP3 PURPOSE AND SCOPE............................................................................13 1.4 PURPOSE OF THE DOCUMENT .........................................................................14 1.5 STRUCTURE OF THE DOCUMENT .....................................................................15
2 SCOPE AND OBJECTIVES OF THE SIMULATIONS FOR THE ABC D BENEFIT ANALYSIS AT AIRLINE LEVEL.................. ........................................... 17
2.1 BACKGROUND ...............................................................................................17 2.2 OBJECTIVES OF THE SIMULATIONS ..................................................................18
3 SIMULATION METHODOLOGY............................. ........................................ 19
3.1 PRINCIPLES...................................................................................................19 3.2 REQUIREMENTS.............................................................................................19 3.3 SIMULATION METHODOLOGY STRUCTURE ........................................................20
4 SIMULATION PREPARATION ............................. .......................................... 21
4.1 TRAFFIC SAMPLE ...........................................................................................21 4.1.1 Traffic Scope...................................................................................... 21 4.1.2 Selection of the days to be simulated................................................. 22
4.2 DEFINITION OF THE SCENARIOS ......................................................................25 4.2.1 Baseline Scenario Design .................................................................. 25 4.2.2 Alternative Scenario Design ............................................................... 25
4.3 REQUIRED OUTPUTS ......................................................................................26
5 SIMULATION EXECUTION ............................... ............................................. 29
6 ANALYSIS OF SIMULATION RESULTS..................... ................................... 30
6.1 FEATURES OF THE SIMULATED DAYS ...............................................................30 6.2 ATFM DELAY FOR THE FLIGHTS OF AIRLINE XXX.............................................32
6.2.1 ATFM delay........................................................................................ 32 6.2.2 Delayed flights ................................................................................... 38
6.3 ATFM MESSAGES..........................................................................................39 6.3.1 SRM messages.................................................................................. 39 6.3.2 SLC messages................................................................................... 40
6.4 THE USE OF THE ATFM CAPACITY ..................................................................41 6.4.1 Definition............................................................................................ 41 6.4.2 Results Analysis................................................................................. 41
7 COST BENEFIT ANALYSIS .............................. ............................................. 43
7.1 INTRODUCTION ..............................................................................................43 7.2 IDENTIFICATION AND QUANTIFICATION OF ABCD BENEFITS ..............................44
7.2.1 Identification of ABCD Benefits .......................................................... 44 7.2.2 Quantification of ABCD Benefits......................................................... 48
7.3 IDENTIFICATION AND QUANTIFICATION OF ABCD COSTS...................................54

A D V A N C E D L O G I S T I C S G R
Madrid � Barcelona
EUROCONTROL
ABCD: Aircraft-Based Concept Developments
Date: 15/09/2008 Issue: 0 Rev: Page: 8
8
7.4 COST BENEFIT ANALYSIS ...............................................................................56 7.4.1 Assumptions ...................................................................................... 56 7.4.2 Indicators ........................................................................................... 57 7.4.3 Results of the CBA............................................................................. 58
8 OPEN ISSUES ................................................................................................ 60
8.1 LIMITS...........................................................................................................60 8.2 ADDITIONAL SIMULATIONS ..............................................................................61
8.2.1 Principles and objectives.................................................................... 61 8.2.2 Early results ....................................................................................... 62
9 CONCLUSIONS AND NEXT STEPS ......................... ..................................... 64
9.1 CONCLUSIONS...............................................................................................64 9.2 NEXT STEPS ..................................................................................................65
DICTIONARY OF ABBREVIATIONS........................ .............................................. 67
REFERENCE DOCUMENTS .................................................................................. 69
ANNEX 1 – ATFCM TECHNICAL OVERVIEW................. ...................................... 71
ANNEX 2 –INDICATORS CONTAINED IN THE SIMULATION SUM MARY FILE .. 75
ANNEX 3 – SELECTION OF THE DAYS TO BE SIMULATED .... .......................... 77
ANNEX 4 – SIMULATIONS RESULTS PER DAY FOR AIRLINE X XX................... 79
ANNEX 5 – ATFM DELAY > 15’ (FLIGHTS WITH / WITHOUT DLA)..................... 84
ANNEX 6 – ATFM DELAY FOR THE SET OF THE AIRLINES EX CEPT AIRLINE XXX......................................................................................................................... 86
ANNEX 7 – METHODOLOGY FOR DETERMINING ABCD USE RATE ................ 88

A D V A N C E D L O G I S T I C S G R
Madrid � Barcelona
EUROCONTROL
ABCD: Aircraft-Based Concept Developments
Date: 15/09/2008 Issue: 0 Rev: Page: 9
9
TABLE OF FIGURES
Figure 1 : ATFM delay per flight vs DLA anticipation (Non-Weather regulations)..... 17 Figure 2 : Flights distribution according to delay message anticipation.................... 17 Figure 3 : ABCD simulation methodology................................................................ 20 Figure 4 : Flights distribution and ATFM delay per flight according to DLA anticipation
......................................................................................................................... 21 Figure 5 : Daily Traffic in Europe and Daily ATFM delay incurred by Airline XXX, in
chronological order........................................................................................... 23 Figure 6 : Days Selection ........................................................................................ 24 Figure 7 : ATFM delay vs. delay messages anticipation .......................................... 33 Figure 8 : ATFM delay > 15’ vs. delay messages anticipation ................................. 35 Figure 9 : ATFM delay > 15’ vs. delay messages anticipation focusing on 5 days ... 36 Figure 10 : ATFM delay > 15’ for flight with DLA vs. delay messages anticipation... 37 Figure 11 : ATFM delay > 15’ for flight without DLA vs. delay messages anticipation
......................................................................................................................... 37 Figure 12 : Number of delayed flights (of Airline XXX) vs. anticipation scenario ...... 38 Figure 13 : ATM Stakeholders................................................................................. 44 Figure 14 Relative gain for total ATFM delay > 15’ (for Airline XXX flights sending
DLA messages)................................................................................................ 51 Figure 15 : ATFM delay > 15’ for flight with DLA vs. delay messages anticipation,
focusing on 6 days ........................................................................................... 84 Figure 16 : ATFM delay > 15’ for flight without DLA vs. delay messages anticipation,
focusing on 6 days ........................................................................................... 85 Figure 17 : Relative variation with respect to the BL of the total ATFM delay (ATFM
delay ofAirline XXX excluded) .......................................................................... 86
TABLE OF TABLES
Table 1 : Features of the selected days................................................................... 25 Table 2 : Main characteristics of the simulated days (Baseline)............................... 31 Table 3 : Evolution of the number of SRM messages sent to Airline XXX................ 40 Table 4 : Evolution of the number of SLC messages sent to Airline XXX................. 40 Table 5 : Evolution of the number of penalizing lost slots ........................................ 42 Table 6 : ATFM delay gains, average vs. worst case............................................... 52 Table 7 : ABCD use rate ......................................................................................... 53 Table 8 : Estimated daily gain (in min) for Airline XXX flights - ATFM delay > 15’.... 53 Table 9 : ABCD Costs ............................................................................................. 56 Table 10 : Cost and Benefits of ABCD .................................................................... 58 Table 11 : Economic indicators values for a discount rate of 10% ........................... 59 Table 12 : Economic indicators values for a discount rate of 15% ........................... 59 Table 13 : Early results of static simulations............................................................ 62 Table 14 : Relative variation with respect to the BL of the total ATFM delay (ATFM
delay of Airline XXX excluded) ......................................................................... 86

A D V A N C E D L O G I S T I C S G R
Madrid � Barcelona
EUROCONTROL
ABCD: Aircraft-Based Concept Developments
Date: 15/09/2008 Issue: 0 Rev: Page: 10
10
1 INTRODUCTION
Air transport punctuality is the “end product” of a complex interrelated chain of operational and strategic processes carried out by different stakeholders (aircraft operators, airports, air navigation providers, etc.) during different time phases and at different levels up to the day of operations. Punctuality is affected by the lack of predictability of operations in the scheduling phases and by the variability of operational performance on the day of operations. Furthermore, part of the unpredictability of a given flight derives from the lack of information about the status of the previous flights using the same aircraft.
1.1 ABCD overview
Aircraft-Based Concept Developments (ABCD) proposes to improve flight predictability by linking individual flight plans using the same aircraft through the aircraft registration information.
As a support to flight plan management, the ABCD tool will:
• provide the airline with a better picture of aircraft operations
• help the airline to detect reactionary delays1 and to notify them to the CFMU as soon as possible.
The objective induced by ABCD is twofold: on the one hand to decrease the total ATFM delay of the airline, and on the other hand to optimize the use of the available ATM capacity.
1.2 Project background
In 2007, ADV Systems and ALG carried out together the first part of the ABCD project [1]. They stressed the following points:
• Qualitative (interviews and analysed examples) and quantitative analyses showed that ABCD implementation could impr ove the traffic predictability and bring tangible benefits to ATM s takeholders (airlines, CFMU, airports):
- Quantitative macroscopic analyses have suggested that, whatever the information media used for the notification of a delay message, the earlier the notification of the delay messages the lower the ATFM delay. They have also shown that airlines do not generally notify delay messages more than 20 to 40 minutes in advance.
1 A reactionary delay is a delay due to the previous flight on the aircraft journey.

A D V A N C E D L O G I S T I C S G R
Madrid � Barcelona
EUROCONTROL
ABCD: Aircraft-Based Concept Developments
Date: 15/09/2008 Issue: 0 Rev: Page: 11
11
- Thanks to the linkage of flight plans, allowed by the aircraft registration number, the ABCD concept would permit to better anticipate delay messages than nowadays. Delay messages would be notified earlier to the CFMU, which would result for the delayed flights into a decrease of their ATFM delay.
- The reduction of ATFM delays would provide aircraft operators with a financial gain related to the cost of delay. For the CFMU and ATM stakeholders, ATFM delay reduction would mean a better use of the available capacity.
- Thus, the implementation of an ABCD related tool would bring airlines financial gains and allow the CFMU a better use of the available capacity. ABCD would therefore improve the efficiency of the airlines, ATM and airport operations.
• However, it has to be acknowledged that ABCD concep t implementation should not be imposed to all actors.
For low cost and regional airlines:
The interviews have established that the implementation of ABCD provides them with an efficient tool to recalculate automatically new EOBT for subsequent flights, using the same aircraft as an initial delayed flight, once the delay on the initial flight has been detected and found to be propagated throughout the subsequent flights.
Low-cost and regional airlines therefore consider that ABCD would facilitate their delay management and optimize their slot allocation process and thus they stated their interest in the ABCD concept implementation.
For major or flag carrier airlines:
In the case of major disruptions, those airlines have the ability and the resources of swapping aircraft for a given flight incurring too much delay. In some cases, they even have some tools comparable to what ABCD provides and it appears that they want to keep the ability of swapping aircraft readily. Thus, they are reluctant to use an ABCD tool when they have their own ABCD-like tool. Therefore, it is clear that the implementation of ABCD should not be imposed to all airlines.
At the end of this first phase of the project, it was decided to carry on the study in order to undertake a precise analysis of the benefits brought by ABCD and to move on to the tool development.
The second phase of the ABCD project to be performed during 2008 and part of 2009 is therefore driven by two objectives:
• The first goal consists in specifying and prototyping an ABCD tool. Firstly, a Cost Benefit Analysis will be conducted at the airline level when the tool is implemented by an airline. The benefits will be evaluated using as input data

A D V A N C E D L O G I S T I C S G R
Madrid � Barcelona
EUROCONTROL
ABCD: Aircraft-Based Concept Developments
Date: 15/09/2008 Issue: 0 Rev: Page: 12
12
results from TACOT (2) simulations on real traffic [3]. Those simulations will help to build a sturdy and realistic ABCD Benefits Model based on real quantitative values that will complement the estimates and interviews with airlines that have been done in the previous works. In particular, the simulations will allow a precise estimation of the delay benefits which will be translated into financial gain. In the same way, the technical implementation of an ABCD concept requires to specify how this concept would technically fit with existing ATM systems and especially the airline systems. In particular, the way, information and data from existing systems could be used in order to implement this concept, will be analyzed and a concrete implementation model will be proposed. In particular, the study will produce some functional and operational specifications which will help to produce an ABCD prototype PC based tool.
• The second objective of the project intends to prove, thanks to TACOT simulations, that the earlier the notification of delay messages to the CFMU, the lower the number of unused ATFM slots. Indeed, it was stressed that the overall proportion of lost ATFM slots is not negligible. Because the lack of anticipation was identified as a possible cause for unused ATFM slots, and because an ABCD-like tool could improve the anticipation of its users, a missed slot analysis was recommended in addition to the development of ABCD [2]. Consequently, it would demonstrate that improving delay message anticipation is beneficial to everybody, airspace users, as well as network management. In that sense, it would point to the virtues induced at central level by the local use of a distributed system like ABCD.
This second phase of project is structured as a set of seven work packages that develop, simulate and validate the ABCD concept. As said previously, this study revolves around two themes: the first one, which includes WP3, 4, 5, 6 and 7, focuses on ABCD development. The second axis, WP8 and WP9, focuses on the impact of the delay message anticipation on unused slots. Below is presented the set of Work Packages:
• WP3: Cost Benefits Analysis.
• WP4: ABCD tool prototype definition.
• WP5: ABCD tool prototype development.
• WP6: Tool upgrade at CFMU level.
• WP7: Final ABCD Report.
• WP8: Simulation definition for the unused ATFM slots study.
• WP9: Simulation results analysis for the unused ATFM slots study.
2 TACT Automated COmmand Tool (TACOT) is a simulation platform for fast-time ATFM simulations

A D V A N C E D L O G I S T I C S G R
Madrid � Barcelona
EUROCONTROL
ABCD: Aircraft-Based Concept Developments
Date: 15/09/2008 Issue: 0 Rev: Page: 13
13
The unused ATFM slots study (WP8 and WP9) was carried out in parallel with the Cost Benefit Analysis, and the results were presented in the deliverables D8 and D9. Simulations have particularly demonstrated the following points:
� Improving anticipation of the notification of delay messages by airlines could provide at central level (CFMU) reductions on the total daily ATFM delay up to 30% and decreases on the number of delayed flights of 15%.
� Regarding usage slot benefits, improving anticipation could bring at central level (CFMU) reductions of: 20% on the number of lost slots, up to 50% on the number of penalising lost slots and up to 30% on the number of period end slots.
� The implementation of ABCD will bring at central level (CFMU) an improvement of efficiency on the slot management activities, since the usage of slots will increase (reduction of the number of lost slots - penalizing or not - and reduction the number of period end slots) while the overload levels will remain stable.
� The gains stated at the central level (CFMU) are also applied at the local level (FMP). Even during the course of one event (i.e. one regulation): a congestion issue is solved much more efficiently by the system if flight information is known as soon as possible.
� The recommendations drawn from the Analysis of Unused ATFM Slots (“the sooner, the better”) were therefore validated: the earlier the notification of delay messages to the CFMU, the lower the number of unused ATFM slots and the lower of overall ATFM delay, while maintaining the same level of overloads.
1.3 WP3 Purpose and scope
The present Work Package – Cost Benefit Analysis - consists in running a Cost Benefit Analysis on the ABCD tool implemented by an airline.
� Even though the benefits brought by the ABCD concept were demonstrated in the previous study, the analysis of these benefits was only qualitative (through airlines interviews) and macroscopic. The magnitude of the benefits was therefore not determined precisely. The first goal of this Work Package will be to evaluate the possible benefits brought by the ABCD concept to an airline (low cost carrier)3, by performing TACOT simulations on real traffic. Those simulations will enable to measure the gain i n ATFM delay when an airline notifies its delays earlier to the CFMU , resulting in a financial benefit for the airline.
� The other purpose of the WP3 is to calculate precisely the costs supported by the airline for the ABCD implementation.
3 The airline chosen for the Cost Benefit Analysis will be called "Airline XXX" in the rest of the document.

A D V A N C E D L O G I S T I C S G R
Madrid � Barcelona
EUROCONTROL
ABCD: Aircraft-Based Concept Developments
Date: 15/09/2008 Issue: 0 Rev: Page: 14
14
To meet with the first objective – ABCD Benefits Estimation at local level - three main tasks are considered (but only two performed by the ADV team):
- Simulation Preparation : the main idea of the simulations is based on the comparison between a scenario replaying the reality – called Baseline Scenario – and alternative scenarios built through a modification of the airline DLA timestamp to simulate a better anticipation of delay messages. It is therefore necessary to prepare the simulations by defining the scope of the simulations, the days to be simulated, the different scenarios and the outputs required.
During this phase of preparation, it is also important to work in coordination with the TACOT facility managers in order to take into account the possibilities and limitations of the simulation platform and to adapt accordingly the scenarios.
- Simulation Execution : the simulations will be performed by the TACOT facility managers who will monitor the simulations execution, provide early feedback and adjust the simulations if needed (for instance reconfigure the simulator, add/remove I/O, adapt scenarios, provide additional scenarios…) based on the ABCD project requirements.
The baseline scenario will be simulated to replay as well as possible real operations and serve as a reference for the alternative scenarios; and the anticipation scenarios will be simulated.
- Result Analysis : for each alternative scenario, the outputs defined in the simulation preparation will be analysed and compared with those resulting from the baseline scenario. The emphasis will be put on the total ATFM delay incurred by the airline, and the potential benefits linked to ABCD use could be computed thanks to those comparative results.
1.4 Purpose of the document
The present document, which constitutes the third deliverable of the second phase of the ABCD project, consolidates the results of WP3 – Cost Benefits Analysis , and intends to:
• Recall the concept of ABCD, as well as the project background;
• Present the purposes and scope of the simulations;
• Propose a methodology for the simulations to be performed by the TACOT facility managers;
• Explain how the simulations have been prepared: selection of traffic sample (scope and set of selected days), justification of the selection, description of the Baseline and the Alternative scenarios and definition of the outputs required;

A D V A N C E D L O G I S T I C S G R
Madrid � Barcelona
EUROCONTROL
ABCD: Aircraft-Based Concept Developments
Date: 15/09/2008 Issue: 0 Rev: Page: 15
15
• Report on the simulation execution
• Present the analysis of the simulation results;
• Conduct a CBA from the results analysis;
• Show the simulations limitations and present further simulations
• Summarise conclusions for the Cost Benefit Analysis
1.5 Structure of the document
The document is split in 9 sections and 7 annexes:
• Section 1 – Introduction – recalls the context of the study and presents the purpose and structure of the present document;
• Section 2 – Scope and objectives of the simulations for the ABCD benefit analysis at airline level – presents principles from previous studies and establishes the scope and objectives for the simulations;
• Section 3 – Simulation methodology – proposes the methodology for the preparation, validation and execution of the simulations;
• Section 4 – Simulation preparation – presents the proposed scenarios to be simulated: Baseline and alternative scenarios definition, the selection and justification of the traffic sample; the list of outputs required from simulations for each scenario;
• Section 5 – Simulation execution – reports on the execution of the simulations;
• Section 6 – Analysis of simulation results – presents the analysis performed from the simulation results. It is structured in two stages of analysis: ATFM delay and unused slot;
• Section 7 – Cost Benefit Analysis – uses the analysis of simulation results to compute possible benefits linked to a local implementation of ABCD; proposes an estimation of the cost incurred by an airline to implement the ABCD tool;
• Section 8 – Open issues – indicates the main limitations of the simulations, and proposes some solutions to deal with those problems, as well as some early results;
• Section 9 – Conclusions and next steps – summarises main conclusions and following activities regarding the scope of the unused ATM slots analysis;
• Annex 1 – ATFCM technical overview – overview of necessary slot allocation process and Computer Slot Allocation Process (CASA) concepts in order to understand analysis presented in the document;
• Annex 2 – Indicators contained in the simulation summary file – gives the list of indicators automatically generated by the TACOT simulator;

A D V A N C E D L O G I S T I C S G R
Madrid � Barcelona
EUROCONTROL
ABCD: Aircraft-Based Concept Developments
Date: 15/09/2008 Issue: 0 Rev: Page: 16
16
• Annex 3 – Selection of the days to be simulated – explains the method used to set up the lots of days and select a representative day in each lot;
• Annex 4 – Simulations results per day – provides for each day of traffic and each scenario a set of statistics;
• Annex 5 – ATFM delay > 15’ (flight with / without DLA) – illustrates the impact of the anticipation scenarios on the ATFM delay greater than 15 minutes, by making the distinction between flights with DLA, and flights without;
• Annex 6 – ATFM delay for the set of the airline except Airline XXX – shows how the total ATFM delay in the ECAC area (without Airline XXX ATFM delay) is impacted by a better anticipation of DLA messages;
• Annex 7 – Methodology for determining ABCD use rate – provides the methodology to determine which DLA could have been anticipated thanks to the ABCD use;

A D V A N C E D L O G I S T I C S G R
Madrid � Barcelona
EUROCONTROL
ABCD: Aircraft-Based Concept Developments
Date: 15/09/2008 Issue: 0 Rev: Page: 17
17
2 SCOPE AND OBJECTIVES OF THE SIMULATIONS FOR THE A BCD BENEFIT ANALYSIS AT AIRLINE LEVEL
2.1 Background
In 2007, the ABCD team conducted a statistical analysis on the impact of the delay message anticipation in order to establish a correlation between ATFM delay and delay message anticipation. As shown by the following graph, when flights are affected by non-weather regulations, the earlier an airline notifies a delay message to the CFMU, the smaller imposed ATFM delay is.
10
12
14
16
18
20
22
0 20 40 60 80 100 120 140 160Anticipation in minutes
AT
FM
del
ay in
min
utes
Average ATFM delay 18,2
Figure 1 : ATFM delay per flight vs. DLA anticipati on (Non-Weather regulations)
Furthermore, it was stressed through this study that DLA messages are often notified at short notice by airlines:
483
170
106 84 82 77 57 46
3953
6168
7581
86 89
0
100
200
300
400
500
600
10 30 50 70 90 110 130 150
Anticipat ion in minutes
Number of Occurences
0
20
40
60
80
100
%
Figure 2 : Flights distribution according to delay message anticipation

A D V A N C E D L O G I S T I C S G R
Madrid � Barcelona
EUROCONTROL
ABCD: Aircraft-Based Concept Developments
Date: 15/09/2008 Issue: 0 Rev: Page: 18
18
Consequently, ATFM slots already allocated to delayed flights may not be recovered by the ATFM system.
The late notification of a DLA/CHG message is possibly due to a lack of anticipation. For some airlines – particularly low-cost and regional airlines - the project identified the need for a decision-making support system that would help them anticipate better – in particular through the monitoring of delay propagation, when the same aircraft is used intensively and flies successive legs during the day of operation.
2.2 Objectives of the simulations
As the implementation of ABCD, thanks to the linkage of flight plans through aircraft identification, will contribute to detect as soon as possible reactionary delay and therefore enable the airline to notify earlier its delay messages, it could be stated that the use of ABCD will allow decreasing ATFM delays.
Consequently, simulations have to be performed in order to show first that:
A better anticipation of DLA messages by an airline leads to a reduction of its total ATFM delay.
In a second step, simulation results will contribute to estimate the potential benefits brought to an airline over one year when implementing the ABCD tool. To bridge the gap between these two steps (simulation results and potential benefits of ABCD), a methodology is required, and is described and used accurately in section 7.2.
Since ABCD aims at helping airlines to communicate earlier their delay messages to the CFMU, simulations will mainly “play” on the DLA timestamp.
The simulation purpose is therefore to simulate an earlier notification of all the delay messages of an airline.
These simulations are followed by additional simulations, aimed at supporting the firm simulation results. Since those additional simulations are performed during the report writing, only early results can be provided at the end of the document (cf. section 8.2).

A D V A N C E D L O G I S T I C S G R
Madrid � Barcelona
EUROCONTROL
ABCD: Aircraft-Based Concept Developments
Date: 15/09/2008 Issue: 0 Rev: Page: 19
19
3 SIMULATION METHODOLOGY
3.1 Principles
Simulations will be performed at EEC by an ATFM fast-time simulator, called TACOT, which emulates the CFMU operational system (ETFMS – CASA).
The simulations are based on the following principles:
• The study will focus on the flights of one airline, typically a low cost;
• The simulations will be performed on a sample of traffic days representative of a year;
• A Baseline scenario used as a reference situation will replay the real traffic operations;
• Alternative scenarios will be simulated, built each one on a unique shift in the timestamp of all the DLA sent by the airline;
• A comparative assessment will be performed between baseline and alternative scenarios;
3.2 Requirements
The proposed simulation methodology for the TACOT simulations, to be performed to support the CBA at airline level, should comply with the following requirements , which have been agreed with the TACOT facility managers:
i. As said in the introduction, the simulations for the ABCD benefits analysis at airline level are performed in parallel with the unused slots analysis simulations:
- Though the scope of the simulations is different for WP3 and WP8, required outputs, simulation methodology and specifications will be mainly common for both simulations activities;
- It will enable to reduce the number and the total running time of the TACOT simulation executions, and to keep in a easier way the management of the outputs from TACOT;
ii. The selected traffic sample for both activity (WP3 and WP8 & 9) will contain about 10 days, considering the fact that some of these days will be common to both activities. In addition, it is required to select those days in 2 AIRAC cycles maximum.
iii. A baseline scenario and a set of alternative anticipation scenarios will be simulated, in order to perform the required comparative assessment:
- Baseline and alternative scenarios will be run for each day of the selected traffic sample;

A D V A N C E D L O G I S T I C S G R
Madrid � Barcelona
EUROCONTROL
ABCD: Aircraft-Based Concept Developments
Date: 15/09/2008 Issue: 0 Rev: Page: 20
20
- Baseline scenario design and specifications will be common for WP3 and WP8, so each run of the baseline scenario will provide outputs for WP3 and WP8 at the same time.
- On the other hand, alternative scenarios will be prepared separately for WP3 and WP8, therefore independent runs will be required for each WP;
3.3 Simulation methodology structure
The proposed simulation methodology is structured in two phases:
1. First Simulation Cycle
A first phase for the simulation preparation is required. Baseline and alternative scenarios will be run for 2 days of the selected traffic sample in order to:
- calibrate the TACOT platform and validate this calibration
- validate the baseline scenario
- confirm the selected set of alternative scenarios
- validate for each scenario the traffic scope, the scenario design, required outputs
2. Second Simulation Cycle
Once the simulation methodology is validated, the set of scenarios will be run for the rest of the days of the selected traffic sample.
The following graph illustrates the methodology:
Baseline
Scenario
Execution
Analysis
of Results
Baseline Scenario
Alternative
Scenarios
Execution
Analysis
of Results
Baseline Scenario
Baseline &
Alternative
ScenariosExecution
Analysis of
results
Baseline & Alternative
Scenarios
FIRST SIMULATION CYCLE - only 2 selected days SECOND SIMULATION CYCLE -rest of the days
Platform calibration &
Baseline Scenario validation
Alternative Scenarios validation
Validated Scenarios and
Simulation requirements
WP3
WP8
Figure 3 : ABCD simulation methodology

A D V A N C E D L O G I S T I C S G R
Madrid � Barcelona
EUROCONTROL
ABCD: Aircraft-Based Concept Developments
Date: 15/09/2008 Issue: 0 Rev: Page: 21
21
4 SIMULATION PREPARATION
The goal of this section is to explain how simulations have been prepared by the ABCD team in close cooperation with the TACOT facility managers, and how the scenarios specifications have been set up.
First, the traffic scope is defined and the traffic days to be simulated are presented, including a justification of their selection. Then, the baseline and alternative scenarios are designed. Lastly, are presented the output data requested from simulations for each scenario.
4.1 Traffic sample
4.1.1 Traffic Scope
The simulations will focus on the flights with the following particularities:
1. The flights shall be operated by Airline XXX. It means concretely that the flights that will be considered in the simulations shall have a call sign beginning with the letters “XXX”.
Several reasons lead to choose this airline:
- First, Airline XXX is a low-cost company, operating in ECAC area.
- Second, a study has demonstrated that this airline tends to notify delays late, as shown by the following graph:
0%
5%
10%
15%
20%
25%
30%
> -60 -60 -45 -30 -15 0 15 30 45 60 75 90 105
Anticipation of DLA / previous EOBT
Flig
hts
dist
ribut
ion
0
10
20
30
40
50
60
70
80
Ave
rage
AT
FM
del
ay p
er a
/c
Anticipation of DLA msg ATFM Delay per a/c resulting from a DLA message
EOBTDelay notification after EOBT Delay notification before EOBTEOBTDelay notification after EOBT Delay notification before EOBT
Figure 4 : Flights distribution and ATFM delay per flight according to DLA anticipation

A D V A N C E D L O G I S T I C S G R
Madrid � Barcelona
EUROCONTROL
ABCD: Aircraft-Based Concept Developments
Date: 15/09/2008 Issue: 0 Rev: Page: 22
22
On the horizontal axis is presented the anticipation of DLA messages with respect to the current EOBT, that is to say the difference between the current EOBT (the one just before the DLA) and DLA timestamp (i.e. the time the DLA message is sent). Theoretically, this difference should be positive, but it appears that some flights inform the CFMU about a delay after missing their planned EOBT.
This graph shows the evolution of two parameters according to the DLA anticipation: on the one hand the distribution of flights (yellow curve), on the other hand the average ATFM delay per flight (orange bar).
This analysis also proves that when Airline XXX notifies its delay messages very late, the average ATFM delay resulting from the DLA is high. A better anticipation of delay messages is therefore likely to lead to a decrease in ATFM delay.
2. These flights shall notify a delay , i.e. at least one delay message (DLA) is sent by the AO to the CFMU to provide a new EOBT (later than the first one)
It should be noted that CHG messages, which can be used by aircraft operator to modify a new EOBT, are not taken into account since an analysis showed that Airline XXX rarely used CHG messages to modify the EOBT.
4.1.2 Selection of the days to be simulated
In the perspective of the Cost Benefit Analysis, it is necessary to select a sample of days of traffic, which will enable to process the simulation results over one year (2007). Given the requirements presented in section 3, the traffic sample shall be composed of eight days of traffic.
Each selected day should be representative of a family of days sharing some common features. Two criteria have been identified to build and differentiate the lots: the total daily ATFM delay incurred by Airline XXX and the total daily traffic in Europe . The first one is the most obvious, since it seems logical that the gain in ATFM delay depends on the actual ATFM delay. The second criterion, the total Europe traffic, should be a parameter impacting on the number of regulations, and therefore on the ATFM delay. This choice is interesting since the first criterion is specific to the airline, whereas the second one takes into account the external environment.
The following graph shows in blue the total daily traffic in Europe, and in pink the daily ATFM delay incurred by Airline XXX, for the year 2007.

A D V A N C E D L O G I S T I C S G R
Madrid � Barcelona
EUROCONTROL
ABCD: Aircraft-Based Concept Developments
Date: 15/09/2008 Issue: 0 Rev: Page: 23
23
0
5 000
10 000
15 000
20 000
25 000
30 000
35 000
Jan-07
Feb-07
Mar-07Apr-0
7
May-07Jun-07
Jul-07
Aug-07
Sep-07
Oct-07
Nov-07
Dec-07
2007 in chronological order
Tot
al E
urop
e T
raffi
c
0
2000
4000
6000
8000
10000
12000
Dai
ly A
TF
M d
elay
incu
rred
by
Airl
ine
XX
X
Figure 5 : Daily Traffic in Europe and Daily ATFM de lay incurred by Airline XXX, in chronological order
Even if both curves follows more or less the same trend (increase of traffic and ATFM delay between June and September), it has to be stressed that the ATFM delay of Airline XXX is not completely correlated with the traffic in Europe.
That is why it is interesting to select both criteria.
The following methodology has been used for the selection of the traffic sample:
1. The days with the lowest total ATFM delay (more precisely with a total ATFM delay below 2000 minutes) for Airline XXX have been eliminated, since the possible gain related to these days would be very low in terms of ATFM delay. The study therefore focuses on the rest of the days, with a daily ATFM delay not too low.
2. Eight lots of days have been defined according to both criteria before-mentioned, and thanks to a statistical method, which guarantees a minimal variance to each lot.
• Total ATFM delay incurred by Airline XXX: four lots have been set up according to four levels of ATFM delay (Low / medium / High / Very High)

A D V A N C E D L O G I S T I C S G R
Madrid � Barcelona
EUROCONTROL
ABCD: Aircraft-Based Concept Developments
Date: 15/09/2008 Issue: 0 Rev: Page: 24
24
• Total Traffic in Europe: Each lot derived from the first criterion has been divided into two sub-lots, corresponding to two levels of traffic (Low / High)
The lots are presented in annex 3.
3. Lastly, one representative day has been selected in each lot thanks to a statistical method. Given the requirements of the simulations, the selected days belong to AIRAC cycles number 296 (from 07/06/07 to 04/07/07) and 297 (from 05/07/07 to 01/08/07).
The selected days are presented on
0
5 000
10 000
15 000
20 000
25 000
30 000
35 000
Airline XXX ATFM delay increasing
Dai
ly E
urop
ean
Tra
fic
0
2000
4000
6000
8000
10000
12000
14000
AT
FM
del
ay o
f Airl
ine
XX
X
European TrafficATFM Delay incurred by Airline XXX
28/07/2007
18/07/2007
09/06/2007
22/06/2007
21/06/2007
20/07/2007
18/06/2007
30/06/2007
Figure 6, which proves that all types of traffic and ATFM delay have been considered.
0
5 000
10 000
15 000
20 000
25 000
30 000
35 000
Airline XXX ATFM delay increasing
Dai
ly E
urop
ean
Tra
fic
0
2000
4000
6000
8000
10000
12000
14000
AT
FM
del
ay o
f Airl
ine
XX
X
European TrafficATFM Delay incurred by Airline XXX
28/07/2007
18/07/2007
09/06/2007
22/06/2007
21/06/2007
20/07/2007
18/06/2007
30/06/2007
Figure 6 : Days Selection

A D V A N C E D L O G I S T I C S G R
Madrid � Barcelona
EUROCONTROL
ABCD: Aircraft-Based Concept Developments
Date: 15/09/2008 Issue: 0 Rev: Page: 25
25
Finally, the traffic sample is composed of eight days of traffic , which all belong to AIRAC cycles number 296 (from 07/06/07 to 04/07/07) and 297 (from 05/07/07 to 01/08/07). The table below presents the selected days, with various features such as the daily ATFM delay incurred by Airline XXX, the daily traffic in Europe or else the size of the lot represented by the day.
Selected Days
AIRAC Cycle
Weekday / Weekend Type of
delay
Daily ATFM delay (min) incurred by Airline XXX
Eur. Traffic (nb of a/c)
Lot Size (nb of days)
28/07/2007 297 WE Low ATFM delay
2479 27684 23
18/07/2007 297 WD Low ATFM delay
2560 31383 53
09/06/2007 296 WE Medium ATFM delay
4101 25869 11
18/06/2007 296 WD Medium ATFM delay 3735 32066 23
30/06/2007 297 WE High ATFM delay
5582 27080 7
21/06/2007 296 WD High ATFM delay
5353 32536 9
22/06/2007 296 WD Very High ATFM delay
8171 32526 2
20/07/2007 297 WD Very High ATFM delay
11780 32303 1
Table 1 : Features of the selected days
4.2 Definition of the Scenarios
4.2.1 Baseline Scenario Design
The baseline scenario, which should represent the real traffic situation of the selected days, is envisaged as the reference scenario to which the alternative scenarios will be compared, in order to assess the effect of the delay messages anticipation on the ATFM delay of the airline. Therefore, as the reference scenario, consistency with real situation is required.
In addition; the baseline scenario should be used to calibrate the platform, and to validate the simulation methodology and the required TACOT outputs.
The baseline scenario is unique for WP3 and WP8, not requiring different preparation and able to be run for both simulation activities at the same time.
4.2.2 Alternative Scenario Design
This section indicates which input data shall be modified and how, according to the simulation scenario:

A D V A N C E D L O G I S T I C S G R
Madrid � Barcelona
EUROCONTROL
ABCD: Aircraft-Based Concept Developments
Date: 15/09/2008 Issue: 0 Rev: Page: 26
26
The alternative scenarios design principle consists in assuming that the Airline XXX flights notify earlier their DLA messages to the CFMU.
Consequently, alternative scenarios have been set up in such a way as to vary the timestamp of a DLA message. In each scenario, it is assumed that each one of the delay messages sent by the aircraft to the CFMU is notified X minutes in advance with respect to the baseline scenario. X is therefore the parameter that varies from a scenario to another one. The change of the timestamp will be of course applied only to the Airline XXX flights with DLA.
Thus, the data that shall be changed in the operati onal log is the filing time (timestamp) of one type of input 4 message, the DLA (delay) messages identified as IMDLA in the log. The contents of the message shall not be changed, unless otherwise specified.
The following table summarizes how the alternative scenarios are designed:
Input message : DLA message
Scope : DLA corresponding to the flights considered in the section “Traffic scope”, i.e. to the Airline XXX flights sending at least one DLA in the baseline scenario
Change : Timestamp of the message
Change in the contents :
None
Conditions, restrictions :
Check if the timestamp of the DLA message is later that the timestamp of the flight plan message
7 alternative scenarios are envisaged:
Scenario Anticipation (X minutes in advance with respect to the baseline
scenario)
1 10 min
2 20 min
3 30 min
4 45 min
5 60 min
6 90 min
7 120 min
4 From the perspective of CFMU.

A D V A N C E D L O G I S T I C S G R
Madrid � Barcelona
EUROCONTROL
ABCD: Aircraft-Based Concept Developments
Date: 15/09/2008 Issue: 0 Rev: Page: 27
27
• First scenarios will be closer to each other in anticipation time because it is expected that the variation in ATFM delay will be more significant for them.
• As shown by the previous statistical studies (Figure 1 and Figure 4), it is expected that the ATFM delay of most Airline XXX flights will no longer substantially decrease for an improvement of DLA anticipation greater than 2 hours. That is why no scenario beyond 120 minutes of anticipation shift will be considered.
4.3 Required outputs
The required outputs are common to the baseline and alternative scenarios.
� The outputs resulting from the baseline scenario simulation are used to validate the simulation methodology and the calibration of the TACOT platform: they will be compared to the real operational data obtained from the archived CFMU files in order to detect possible inconsistencies in the simulations.
� The outputs of alternative scenarios will be compared with those of the baseline scenario.
Below is presented the complete set of output data requested for the simulations for each scenario (BL, -10, -20, -30, -45, -60, -90 and -120):
• Statistics indicators concerning Airline XXX flight s
Indicators Scope of each indicator
Nb of flights Airline XXX flights Nb of regulated flights Airline XXX flights Nb of delayed flights (= nb of flights with an ATFM delay >0)
Airline XXX flights
Nb of flights sending at least one DLA Airline XXX flights Nb of regulated flights sending at least 1 DLA Airline XXX flights Nb of delayed flights sending at least one DLA Airline XXX flights ATFM delay : Total / Mean / Median / Max / standard deviation
1. Airline XXX flights, 2. Airline XXX flights sending a DLA/CHG
Distribution of the ATFM delay 1. Airline XXX flights, 2. Airline XXX flights sending a DLA/CHG

A D V A N C E D L O G I S T I C S G R
Madrid � Barcelona
EUROCONTROL
ABCD: Aircraft-Based Concept Developments
Date: 15/09/2008 Issue: 0 Rev: Page: 28
28
Distribution of the initial ATFM delay incurred by Airline XXX (ATFM delay due to the SAM)
1. Airline XXX flights, 2. Airline XXX flights sending a DLA/CHG
Nb of SRM sent 1. Airline XXX flights, 2. Airline XXX flights sending a DLA/CHG
Nb of SLC sent 1. Airline XXX flights, 2. Airline XXX flights sending a DLA/CHG
Nb of lost slots: non penalising and penalising Total
Distribution of the DLA anticipation (Anticipation of DLA with respect to the previous EOBT / with respect to the EOBT contained in the DLA)
1. Airline XXX flights, 2. Regulated flights of Airline XXX.
• Raw Flight Data. This file provides for each message (DLA, CHG, FPL, CNL, REA, SAM, SLC, SRM) related to Airline XXX flights some specific information contained in the message, such as :
- message timestamp,
- the identification of the flight related to the message,
- ADEP and ADES,
- EOBT and EOBD
- CTOT
- Taxitime
• ALL_FT file. This file contains the complete list of flights of the day with the associated indicators and parameters per flight, providing information about the flight trajectory, the flight status, the messages exchanged with the CFMU, as well as information related to any ATFM measures imposed on the flight
• ARCHIVED_OPLOG file : The OPLOG file is the operational log of all the messages exchanged between the CFMU and third parties on the day of operation. Post-operational data archived in the CFMU data warehouse (e.g. ALL-FT files) are derived from the OPLOG data.
• Regulations report. This file presents the complete list of regulations of the day and the associated indicators per regulation:
- Total ATFM delay (minutes);
- Total penalising ATFM delay (minutes);
- Number of total slots;
- Number of unused slots;

A D V A N C E D L O G I S T I C S G R
Madrid � Barcelona
EUROCONTROL
ABCD: Aircraft-Based Concept Developments
Date: 15/09/2008 Issue: 0 Rev: Page: 29
29
- Number of lost slots;
- Number of penalising lost slots.
• In addition, the TACOT facility managers provided for each simulation day a day level summary file , which contains a comparative analysis between the baseline scenario and the alternative ones (-10, -20, -30, -45, -60, -90 and -120) evaluating at day level an exhaustive list of indicators (see Annex 2)

A D V A N C E D L O G I S T I C S G R
Madrid � Barcelona
EUROCONTROL
ABCD: Aircraft-Based Concept Developments
Date: 15/09/2008 Issue: 0 Rev: Page: 30
30
5 SIMULATION EXECUTION
The present section is derived from the simulation execution report carried out by the TACOT facility managers.
TACOT simulations have been executed following the two phases structure proposed by the simulation methodology presented in section 3 of the present document :
Simulations initialisation started with the execution of cycle 1 for 2 days, 21/06/2007 and 20/07/2007, following the ensuing steps:
• Baselines scenarios were produced for the 2 selected days (21/06/2007 and 20/07/2007). The baseline scenario (20/07/2007) was validated with a new run on another TACOT server, confirming that the results were identical on both platforms. The baseline scenario consisted in the original traffic, regulation plan and global user commands (regulation modification), where the activation messages (FSA, DEP, ARR) were not included and the robot was disabled. A second simulation was performed with the robot and the activation messages for comparison to obtain the operational disturbances. This second scenario was not retained as baseline because the robot had a perturbation effect on the DLA messages: these messages were rejected by the robot if the flights were TACT Activated while they were not rejected by the ETFMS system when the robot was disabled.
• Statistics and output files for the baseline scenario were checked and validated by the ABCD team.
• The proposed set of alternative scenarios corresponding to the following shift in anticipation -10, -20, -30, -45, -60, -90 and -120 were executed for the 2 selected days (21/06/2007, 20/07/2007).
• First results were analysed and compared with the baseline scenario results.
• Simulation cycle 1 ended with the validation of the alternative scenarios and the final agreement on the simulation specifications with TACOT facility managers: traffic scope, scenarios selection, required outputs and simulation methodology
Once the simulation methodology was validated and the simulation outputs were agreed with the TACOT facility managers, cycle 2 started and the set of scenarios, baseline and alternative anticipation, were run for the rest of the days of the selected traffic sample: 09/06/2007, 22/06/2007, 30/06/2007 and 28/07/2007.
A D V A N C E D L O G I S T I C S G R
Madrid � Barcelona
EUROCONTROL
ABCD: Aircraft-Based Concept Developments
Date: 15/09/2008 Issue: 0 Rev: Page: 31
31
6 ANALYSIS OF SIMULATION RESULTS
This section presents the main results obtained from the simulations.
As explained at the beginning of the present document, fast-time simulations have been performed on 8 days of traffic with various features – in terms of ATFM delay incurred by Airline XXX and total European traffic – providing for each day of traffic a complete set of results for all the executed scenarios: the Baseline scenario (BL) and 7 alternative scenarios (shift in the DLA timestamp : -10, -20, -30, -45, -60, -90 and -120 minutes).
The present analysis is based on a comparative assessment of the results between the BL and the anticipation scenario, in order to show that an earlier notification of DLA messages by an airline leads to a reduction of its ATFM delay. This analysis is conducted in the perspective of the ABCD benefits analysis at airline level.
The chapter is structured in four parts:
� The first one provides an overview of the different characteristics of the simulated days resulting from the baseline scenario execution.
� The following three parts assess the impact of the alternative anticipation scenarios on three main fields :
1. The ATFM delay incurred by the airline.
The analysis will particularly focus on indicators such as :
- the total ATFM delay
- the ATFM delay exceeding 15 minutes per flight
- the number of delayed flights
and will make the distinction between flights with / without DLA messages.
2. The ATFM messages received by the airline
3. The use of the ATFM capacity.
The analysis will particularly focus on the lost slots.
6.1 Features of the simulated days
The following table summarizes the main characteristics of the simulation days, obtained thanks to the Baseline Scenario.

A D V A N C E D L O G I S T I C S G R
Madrid � Barcelona
EUROCONTROL
ABCD: Aircraft-Based Concept Developments
Date: 15/09/2008 Issue: 0 Rev: Page: 32
32
Statistics 28/07 18/07 09/06 18/06 30/06 21/06 22/06 20/07 Total 894 927 973 1004 971 1013 1005 946 Non cancelled 886 918 915 934 881 919 950 925 With DLA message 163 156 192 230 282 231 254 380 Regulated 220 243 334 315 371 356 431 560
Num
ber
of
Airl
ine
XX
X
fligh
ts
Delayed 129 153 214 207 237 220 290 403 Total 2535 2599 4285 3921 4254 5078 7352 13129 Mean per regulated flight 11,52 10,70 12,83 12,45 11,47 14,26 17,06 23,44 Total for flights with DLA 449 552 1109 1310 1658 1403 2384 5818 Mean per regulated flight with DLA 11,51 14,53 16,07 15,98 15,94 16,70 19,07 27,19
Airl
ine
XX
X A
TF
M
dela
y
Total exceeding 15 minutes per flight 907 737 1583 1351 1342 2238 3807 7537
Unu
sed
Slo
t
Nb of Penalising Lost Slots 744 749 737 555 861 1401 1291 1674
Table 2 : Main characteristics of the simulated day s (Baseline)
Three types of indicators are presented in this table:
- Indicators related to the number of Airline XXX flights planned on the day of operation;
- Indicators related to the Airline XXX ATFM delay;
- Indicators related to the unused slots during the day.
For each indicator, the maximum value is indicated in red, whereas the minimum value is in blue.
It can be inferred from this table that:
� The total number of flights is quite stable from a day to another one.
� However, for the rest of the indicators, the simulated days have different features: most of the time, the value of the indicator increases progressively from the left to the right.
Moreover, the table clearly highlights the “extreme” days :
� On the one hand, 28/07/07 and 18/07/07 stand out as the less penalizing days for the company in terms of ATFM delay.
� On the other hand, 20/07/07 stands out against the others days since all the values related to this day are largely above those of the other days. For instance, the 20/07 ATFM delay is nearly the double of the 22/06, which is yet
A D V A N C E D L O G I S T I C S G R
Madrid � Barcelona
EUROCONTROL
ABCD: Aircraft-Based Concept Developments
Date: 15/09/2008 Issue: 0 Rev: Page: 33
33
the second most loaded day (in terms of ATFM delay). It can be also pointed out that the difference between the 20/07 and the 21/06 is greater than the difference between the 21/06 and the rest of the days.
6.2 ATFM delay for the flights of Airline XXX
The first – and main – topic to be investigated in the scope of the simulations results analysis refers to the ATFM delay incurred by Airline XXX. The study deals on the one hand with the total delay for the airline, and on the other hand with the number of flights impacted by an ATFM delay.
6.2.1 ATFM delay
6.2.1.1 Total ATFM delay
Even if it will not be directly used in the CBA, the first indicator to be analysed in the study is the total daily ATFM delay incurred by Airline XXX .
The following graph derived from the simulations results provides a general overview of the impact of a better anticipation in DLA timestamp by Airline XXX on the evolution of the indicator.
The horizontal axis represents the shift in DLA timestamp, i.e. the different simulated scenarios (for instance, 0 corresponds to the baseline scenario, and 20 to the scenario “shift 20”, etc..), whereas the vertical axis shows the total ATFM delay incurred by Airline XXX for each day of the traffic sample.

A D V A N C E D L O G I S T I C S G R
Madrid � Barcelona
EUROCONTROL
ABCD: Aircraft-Based Concept Developments
Date: 15/09/2008 Issue: 0 Rev: Page: 34
34
ATFM delay for Airline XXX flights
0
2000
4000
6000
8000
10000
12000
14000
0 20 40 60 80 100 120
Shift in DLA timestamp(message anticipation improvement)
AT
FM
del
ay (
min
)
20/07/07
22/06/07
21/06/07
30/06/07
18/06/07
09/06/07
18/07/07
28/07/07
Figure 7 : ATFM delay vs. delay messages anticipati on
First and foremost, it has to be noted that in more than 90% of the cases5 (51 over 56) the ATFM delay decreases with respect to the baseline case (cf. Table in Annex 4).
Therefore a situation for which DLA messages are notified earlier is not equivalent to a do-nothing situation: the ATFM delay is reduced.
However it cannot be concluded that “the earlier the notification of DLA messages, the lower the ATFM delay”. Indeed the ATFM delay does not decrease continuously when the shift in the DLA timestamp increases.
Therefore there is a difference between:
� The network perspective: cf. WP8 and WP9 (Analysis of unused ATFM slots);
� The airline perspective: this Work Package.
From a network perspective, D9 has shown that anticipation is a key to the efficiency of the slot allocation mechanism: at a macroscopic level, a continuous improvement in the notification of DLA messages leads to a continuous reduction in the ATFM delay imposed by the system.
From an airline perspective, those simulations show that at a microscopic level, the relationship between anticipation and ATFM delay is not so stable. ATFM delay and
5 A case is defined in this report as a pair {alternative scenario; simulated day}

A D V A N C E D L O G I S T I C S G R
Madrid � Barcelona
EUROCONTROL
ABCD: Aircraft-Based Concept Developments
Date: 15/09/2008 Issue: 0 Rev: Page: 35
35
anticipation cannot be strongly correlated. Indeed, a small number of DLA messages (a hundred corresponding to Airline XXX flights vs. thousands of ECAC flights) are shifted in each scenario. And in some cases the “noise” created by the other flights can play against the positive effects of a better anticipation.
On the one hand and based on the current results, the reduction in ATFM delay does not seem to be predictable, given the anticipation improvement. Other parameters come and play, and may somewhat offset the benefits of an earlier notification of DLA messages.
On the other hand the results suggest that:
� The ATFM delay is statistically reduced when anticipation is improved with respect to the Baseline scenario. Additional simulations would be useful to confirm it;
� The influence of the anticipation parameter on the ATFM delay is greater when the traffic is heavy.
For instance, on the graph, 20/07/07, ranking first in terms of ATFM delay for Airline XXX stands out clearly against the other dates: the decrease in ATFM delay is marked for this day, particularly on the left side of the curve, i.e. between the baseline scenario and the “Shift – 20” Scenario: the value of the indicator decreases by 18% on this part of the graph. (Then, when DLA timestamp is shifted by more than 20 minutes with respect to the baseline scenario, the curve slope is lower.) Therefore the influence of the anticipation parameter may be strong when the traffic pressure is high.
6.2.1.2 ATFM delay > 15’
Section 6.2.1.1 has presented the overall impact of the alternative scenarios on the total ATFM delay. Let us now focus on the total ATFM delay exceeding 15 minutes per flight of Airline XXX, a very important parameter, since it will be used in the benefits analysis at airline level (section 7).
This indicator aggregates the minutes of ATFM delay in excess of 15 minutes (on a per flight basis).
The following graph, which shows the evolution of t he total ATFM delay > 15 min from the baseline scenario to the alternative anticipation s cenarios, is built the same way as the first

A D V A N C E D L O G I S T I C S G R
Madrid � Barcelona
EUROCONTROL
ABCD: Aircraft-Based Concept Developments
Date: 15/09/2008 Issue: 0 Rev: Page: 36
36
graph,
ATFM delay for Airline XXX flights
0
2000
4000
6000
8000
10000
12000
14000
0 20 40 60 80 100 120
Shift in DLA timestamp(message anticipation improvement)
AT
FM
del
ay (
min
)
20/07/07
22/06/07
21/06/07
30/06/07
18/06/07
09/06/07
18/07/07
28/07/07
Figure 7, and therefore can be analysed similarly.
Total ATFM delay > 15' (incurred by Airline XXX)
0
1000
2000
3000
4000
5000
6000
7000
8000
0 20 40 60 80 100 120
Shift in DLA timestamp (message anticipation improvement)
Tot
al A
TF
M d
elay
> 1
5' p
er fl
ight
20/07/07
22/06/07
21/06/07
30/06/07
18/06/07
09/06/07
18/07/07
28/07/07
Figure 8 : ATFM delay > 15’ vs. delay messages anti cipation

A D V A N C E D L O G I S T I C S G R
Madrid � Barcelona
EUROCONTROL
ABCD: Aircraft-Based Concept Developments
Date: 15/09/2008 Issue: 0 Rev: Page: 37
37
First of all, the pattern of the curves is quite si milar to those on the previous graph (
ATFM delay for Airline XXX flights
0
2000
4000
6000
8000
10000
12000
14000
0 20 40 60 80 100 120
Shift in DLA timestamp(message anticipation improvement)
AT
FM
del
ay (
min
)
20/07/07
22/06/07
21/06/07
30/06/07
18/06/07
09/06/07
18/07/07
28/07/07
Figure 7), although there are some emphasises:
- For the 20/07: The relative decrease in ATFM delay > 15’ between the baseline and the 20 shift scenario is more important than the one concerning the total ATFM delay of Airline XXX (decrease of 26% and 18% respectively). On the second part of the curve (i.e. between the 20 and 120 shift scenarios) the relative decrease is also more marked on the current graph than on the graph before, even though the variation remains lower than in the first part of the curve.
- For the 22/06: The ATFM delay decrease from the baseline to the 120 shift scenario is more pronounced on the current graph than on the graph before.
Moreover, the graph shows that for 20/07 and 22/06, the Airline XXX ATFM delay > 15’ decreases with the anticipation, except a light increase between the 90 and 120 shift scenarios on the 20/07, and between the baseline and 10 shift scenarios on the 22/06.
Let us now focus on the six other days, represented on the next graph:

A D V A N C E D L O G I S T I C S G R
Madrid � Barcelona
EUROCONTROL
ABCD: Aircraft-Based Concept Developments
Date: 15/09/2008 Issue: 0 Rev: Page: 38
38
Total ATFM delay > 15'(incurred by Airline XXX)
0
500
1000
1500
2000
2500
0 20 40 60 80 100 120
Shift in DLA timestamp (message anticipation improvement)
Tot
al A
TF
M d
elay
> 1
5' p
er
fligh
t
21/06/07
30/06/07
18/06/07
09/06/07
18/07/07
28/07/07
Figure 9 : ATFM delay > 15’ vs. delay messages anti cipation focusing on 5 days
The curves, except 18/07/07, are oscillating, and tend to decrease slightly. Besides, for these 5 days (21/06, 30/06, 18/06, 09/06 and 28/07), the ATFM delay of the alternative scenarios is always below the one of the baseline. The curve representing the 18/07 is so irregular that it is too difficult to draw conclusions about the influence of the anticipation of the DLA on the ATFM delay.
Nevertheless, it is important to point out that when DLA messages are notified earlier the share of long ATFM delays (longer than 15 minutes) decreases with respect to the share of short ATFM delays (shorter than 15 minutes). The decrease is more important in the case of days with heavy traffic and high ATFM delay (for those days, the share of long ATFM delays is more important).
Therefore one can say that long ATFM delays are more sensitive than short ATFM delays to any anticipation improvement. This is a confirmation that a poor anticipation is a reason for long ATFM delays, consistent with the FPFS6 logics of the slot allocation mechanism.
6.2.1.3 ATFM delay : DLA vs. non DLA
The next step in the results analysis consists in making the distinction between the ATFM delay > 15’ corresponding to flights with DLA messages and the ATFM delay > 15’ corresponding to flights without DLA messages.
6 First-Planned-First-Served

A D V A N C E D L O G I S T I C S G R
Madrid � Barcelona
EUROCONTROL
ABCD: Aircraft-Based Concept Developments
Date: 15/09/2008 Issue: 0 Rev: Page: 39
39
ATFM delay > 15', flights with DLA
0
500
1000
1500
2000
2500
3000
3500
4000
0 20 40 60 80 100 120
20/07/07
22/06/07
21/06/07
30/06/07
18/06/07
09/06/07
18/07/07
28/07/07
Figure 10 : ATFM delay > 15’ for flight with DLA vs . delay messages anticipation
ATFM delay > 15', flights without DLA
0
500
1000
1500
2000
2500
3000
3500
4000
4500
0 20 40 60 80 100 120
20/07/07
22/06/07
21/06/07
30/06/07
18/06/07
09/06/07
18/07/07
28/07/07
Figure 11 : ATFM delay > 15’ for flight without DLA vs. delay messages anticipation
The comparison between both graphs shows that the impact of a better anticipation of Airline XXX DLA messages is more significant on the ATFM delay related to the
A D V A N C E D L O G I S T I C S G R
Madrid � Barcelona
EUROCONTROL
ABCD: Aircraft-Based Concept Developments
Date: 15/09/2008 Issue: 0 Rev: Page: 40
40
flights with DLA than on the one related to the flights without DLA. Annex 5 presents the same two graphs, on a larger scale, in order to distinct more precisely the pattern of the curves having the same level of ATFM delay.
Therefore, it is important to notice that in general Airline XXX flights that send DLA messages do not impact badly on other flights of Airline XXX, when DLA messages are sent earlier.
6.2.1.4 ATFM delay : Non weather vs. Weather regula tion
In 2007, the ABCD project has studied the relationship between ATFM delay per flight and delay message anticipation by making the distinction between ATFM delay related to Non-Weather regulation, and ATFM delay related to weather regulation.
The present study therefore tried to make this difference when analysing the simulations results. However, no general trend can be drawn from the present analysis (Cf. Tables in Annex 4).
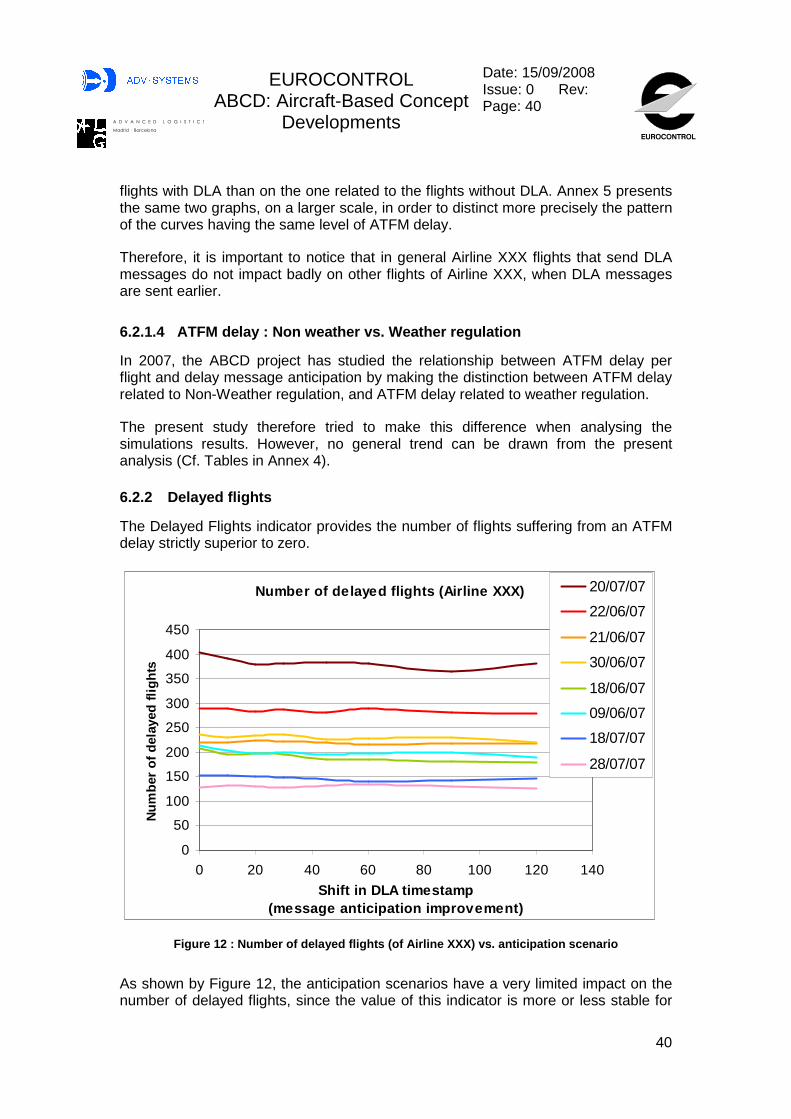
6.2.2 Delayed flights
The Delayed Flights indicator provides the number of flights suffering from an ATFM delay strictly superior to zero.
Number of delayed flights (Airline XXX)
0
50
100
150
200
250
300
350
400
450
0 20 40 60 80 100 120 140
Shift in DLA timestamp(message anticipation improvement)
Num
ber
of d
elay
ed fl
ight
s
20/07/07
22/06/07
21/06/07
30/06/07
18/06/07
09/06/07
18/07/07
28/07/07
Figure 12 : Number of delayed flights (of Airline XXX) vs. anticipation scenario
As shown by Figure 12, the anticipation scenarios have a very limited impact on the number of delayed flights, since the value of this indicator is more or less stable for

A D V A N C E D L O G I S T I C S G R
Madrid � Barcelona
EUROCONTROL
ABCD: Aircraft-Based Concept Developments
Date: 15/09/2008 Issue: 0 Rev: Page: 41
41
two days (21/06 and 28/07), and is slightly decreasing with respect to the baseline case for the other days.
6.3 ATFM messages
This second part of the analysis proposes to observe the evolution of the number of ATFM messages with the anticipation scenario, focusing more particularly on SRM and SLC messages.
The reduction in the number of ATFM messages received by the airline can be profitable to them, since it will contribute to:
• Streamline the information flows between the CFMU and the airline; hence alleviating the staff workload.
• Improve the predictability of the traffic, hence more reliable data for the airline.
6.3.1 SRM messages
A Slot Revision Message (SRM) is a message sent by the CFMU to the aircraft operator in order to assign a new slot (NEW CTOT) to a regulated aircraft. This new CTOT can either correspond to an improvement or to a worsening of the previous CTOT.
Simulations provided for each scenario and each day the number of SRM messages sent by the CFMU to Airline XXX flights. Results are presented in the following table: for each day of traffic, the first line shows the evolution of the number of SRM messages from the Baseline to the alternative scenarios, whereas the second line indicates the relative variation of this number compared to the baseline.
SRM
messages BaselineBaselineBaselineBaseline Shift Shift Shift Shift ----10101010 Shift Shift Shift Shift ----20202020 Shift Shift Shift Shift ----30303030 Shift Shift Shift Shift ----45454545 Shift Shift Shift Shift ----60606060 Shift Shift Shift Shift ----90909090
Shift Shift Shift Shift ----
120120120120
20/07/2007 1582 1585 1610 1551 1551 1486 1408 1284
0,19% 1,77% -1,96% -1,96% -6,07% -11,00% -18,84%
22/06/2007 1043 1013 992 999 1011 949 901 875
-2,88% -4,89% -4,22% -3,07% -9,01% -13,61% -16,11%
21/06/2007 567 560 584 563 547 512 519 506
-1,23% 3,00% -0,71% -3,53% -9,70% -8,47% -10,76%
30/06/2007 517 558 543 528 544 531 486 502
7,93% 5,03% 2,13% 5,22% 2,71% -6,00% -2,90%
18/06/2007 421 403 368 364 393 371 355 346
-4,28% -12,59% -13,54% -6,65% -11,88% -15,68% -17,81%
09/06/2007 544 545 565 541 515 529 524 516
0,18% 3,86% -0,55% -5,33% -2,76% -3,68% -5,15%
18/07/2007 291 286 306 313 285 311 272 280
-1,72% 5,15% 7,56% -2,06% 6,87% -6,53% -3,78%

A D V A N C E D L O G I S T I C S G R
Madrid � Barcelona
EUROCONTROL
ABCD: Aircraft-Based Concept Developments
Date: 15/09/2008 Issue: 0 Rev: Page: 42
42
28/07/2007 369 383 375 388 369 344 353 338
3,79% 1,63% 5,15% 0,00% -6,78% -4,34% -8,40%
Table 3 : Evolution of the number of SRM messages sen t to Airline XXX
When comparing the alternative scenarios results to the Baseline, it appears that in 74% of the cases, the number of SRM messages sent in an alternative scenario is equal or below the number of SRM messages sent in the baseline scenario. More precisely, most of cases with a number of SRM messages in alternative scenario superior to the one in Baseline, match scenarios with low shift in the timestamp: it means that from the shift 45 scenario until 120 scenario, the CFMU sends less SRM messages to Airline XXX. However, from an alternative scenario to another one, there is no clear variation of the indicator. Therefore, it cannot be concluded that the number of SRM messages sent to Airline XXX decreases with the anticipation improvement.
6.3.2 SLC messages
A Slot Cancellation Message is sent by the CFMU to inform the aircraft operator that a slot assigned to an aircraft is no longer subject to ATFM measures.
The table below shows that there are only two cases (belonging to the 21/06/07) over 56 for which the number of SLC messages is higher than in the baseline.
Table 4 : Evolution of the number of SLC messages sen t to Airline XXX
It can be inferred from Table 4 that:
1. not only the number of SLC messages decreases with respect to the baseline case,
SLC
messages BaselineBaselineBaselineBaseline Shift Shift Shift Shift ----10101010 Shift Shift Shift Shift ----20202020 Shift Shift Shift Shift ----30303030 Shift Shift Shift Shift ----45454545 Shift Shift Shift Shift ----60606060 Shift Shift Shift Shift ----90909090 Shift Shift Shift Shift ----120120120120
20/07/2007 111 109 103 98 97 99 94 86
-1,80% -7,21% -11,71% -12,61% -10,81% -15,32% -22,52%
22/06/2007 79 77 75 75 73 76 73 72
-2,53% -5,06% -5,06% -7,59% -3,80% -7,59% -8,86%
21/06/2007 54 55 53 55 50 51 51 49
1,85% -1,85% 1,85% -7,41% -5,56% -5,56% -9,26%
30/06/2007 56 54 55 54 55 51 50 49
-3,57% -1,79% -3,57% -1,79% -8,93% -10,71% -12,50%
18/06/2007 67 67 65 65 63 61 61 58
0,00% -2,99% -2,99% -5,97% -8,96% -8,96% -13,43%
09/06/2007 41 40 41 41 41 41 41 37
-2,44% 0,00% 0,00% 0,00% 0,00% 0,00% -9,76%
18/07/2007 47 47 47 45 44 41 43 42
0,00% 0,00% -4,26% -6,38% -12,77% -8,51% -10,64%
28/07/2007 46 42 41 40 40 39 38 36
-8,70% -10,87% -13,04% -13,04% -15,22% -17,39% -21,74%

A D V A N C E D L O G I S T I C S G R
Madrid � Barcelona
EUROCONTROL
ABCD: Aircraft-Based Concept Developments
Date: 15/09/2008 Issue: 0 Rev: Page: 43
43
2. but also the earlier the notification of DLA messages, the lower the number of SLC messages sent by the CFMU.
The impact of an earlier notification of the DLA messages is therefore more important on the number of SLC messages than on SRM messages.
The same analysis was conducted on the number of SRM / SLC messages sent to Airline XXX flights with DLA: the correlation between the number of SRM / SLC and the anticipation improvement is slightly more pronounced.
6.4 The use of the ATFM capacity
The last investigative topic, oriented towards a network level, aims at analysing the impact of a better anticipation of DLA messages by Airline XXX on the optimization of the ATFM system capacity. For this purpose, it is proposed to focus on the penalising lost slots, and to study their evolution according to the anticipation scenarios.
6.4.1 Definition
� Lost Slot
A slot S in a regulation R is considered as a lost slot if it satisfies the following criteria:
- Status = Available
- Rate type = Normal (pending slots are thus excluded)
- It exists at least one flight such as its ETO is before S slot reference time and its CTO after it. The idea is that this flight could have been placed in this slot.
It is worth pointing out that one slot can only be counted once as a lost slot, even if several flights meet the criteria. Likewise, once a flight has been identified as a potential user of a lost slot, it can not be used anymore to identify other lost slots.
� Penalising Lost Slot
The Penalising Lost Slots are defined as the lost slots in the regulation taking into account only the flights for which the regulation is the most penalising one.
6.4.2 Results Analysis
The number of penalising lost slots is interesting to assess since these slots are responsible for additional ATFM delay which could have been avoided if the slots had been used.

A D V A N C E D L O G I S T I C S G R
Madrid � Barcelona
EUROCONTROL
ABCD: Aircraft-Based Concept Developments
Date: 15/09/2008 Issue: 0 Rev: Page: 44
44
The following table shows for each day the evolution of the number of penalising lost slots according to the DLA messages anticipation improvement, as well as the relative variation of this number with respect to the baseline scenario.
Penalising
Lost Slots BaselineBaselineBaselineBaseline Shift Shift Shift Shift ----10101010 Shift Shift Shift Shift ----20202020 Shift Shift Shift Shift ----30303030 Shift Shift Shift Shift ----45454545 Shift Shift Shift Shift ----60606060 Shift Shift Shift Shift ----90909090 Shift Shift Shift Shift ----120120120120
28/07/07 744 736 751 751 759 753 750 748
-1,08% 0,94% 0,94% 2,02% 1,21% 0,81% 0,54%
18/07/07 404 414 418 392 387 384 393 389
2,48% 3,47% -2,97% -4,21% -4,95% -2,72% -3,71%
09/06/07 737 714 704 693 683 702 692 718
-3,12% -4,48% -5,97% -7,33% -4,75% -6,11% -2,58%
18/06/07 555 560 553 546 558 534 550 558
0,90% -0,36% -1,62% 0,54% -3,78% -0,90% 0,54%
30/06/07 861 855 871 830 839 838 830 816
-0,70% 1,16% -3,60% -2,56% -2,67% -3,60% -5,23%
21/06/07 1401 1380 1375 1401 1399 1410 1378 1388
-1,50% -1,86% 0,00% -0,14% 0,64% -1,64% -0,93%
22/06/07 1291 1287 1302 1308 1290 1254 1262 1281
-0,31% 0,85% 1,32% -0,08% -2,87% -2,25% -0,77%
20/07/07 1674 1677 1672 1611 1649 1629 1615 1626
0,18% -0,12% -3,76% -1,49% -2,69% -3,52% -2,87%
Table 5 : Evolution of the number of penalizing lost slots
This table points out that there is no strong correlation between DLA anticipation improvement and the use of the ATFM capacity: the number of penalizing lost slots does not decrease when the shift in DLA timestamp is enhanced. However, it should be notified that there is only one day for which the number of penalizing lost slots increases with respect to the baseline scenario, for the set of the alternative scenarios. For the other seven days, it is important to stress that the ATFM system capacity is better used in most of the cases.

A D V A N C E D L O G I S T I C S G R
Madrid � Barcelona
EUROCONTROL
ABCD: Aircraft-Based Concept Developments
Date: 15/09/2008 Issue: 0 Rev: Page: 45
45
7 COST BENEFIT ANALYSIS
7.1 Introduction
This chapter provides an analysis of the envisaged benefits & costs of implementing ABCD at airline level, using the results of the TACOT simulations presented in the previous section, in order to evaluate the economic viability of the ABCD tool.
The assessment of the interest of implementing ABCD is tested through the use of a Cost Benefit Analysis (CBA), which identifies the investment option that best conforms to the economic goal of maximising net benefits.
This obviously goes well beyond a financial evaluation or a business plan which focuses on the project's financial accounts and cash flows. While a financial evaluation would normally restate the capital costs into annual depreciation and interest expenses, a CBA measures capital costs by the cash expenditures required in future years — not by depreciation and interest. The cash stream of expenditures is compared to the stream of benefits and the annual net amounts are discounted to compute a net present value for the investment option.
The present Cost Benefit Analysis aims at comparing two scenarios: the ABCD scenario and the base scenario. The first scenario is based on the implementation of ABCD at airline level, while the latter corresponds to the picture of the ATM structure development if ABCD is not implemented by the airline. The Base scenario is therefore related to the Baseline scenario simulated in the TACOT simulations.
The comparison consists in identifying, describing and quantifying when possible, the differential costs and benefits between the studied scenarios, from the main stakeholders viewpoints.
The Cost Benefit Analysis is performed using a recognised methodology that ensures transparency and stakeholder involvement and gives a clear indication of benefits & costs for all groups of ATM stakeholders.
Figure 13 shows the different ATM stakeholders who might be affected by this kind of project.

A D V A N C E D L O G I S T I C S G R
Madrid � Barcelona
EUROCONTROL
ABCD: Aircraft-Based Concept Developments
Date: 15/09/2008 Issue: 0 Rev: Page: 46
46
Figure 13 : ATM Stakeholders
The structure of the study is broken down as follows:
� Sections 7.2 identifies and describes the ABCD benefits compared to the base case and computes whenever it is possible the quantification of these benefits,.
� Section 7.3 presents the costs of the ABCD implementation.
� Section 7.4 presents the general assumptions necessary for the CBA and shows results on ABCD profitability and cost-effectiveness from the stakeholders viewpoints.
7.2 Identification and quantification of ABCD Benef its
This section provides an overview of the different benefits expected from ABCD for each stakeholder, and quantifies for each one the possible benefits.
7.2.1 Identification of ABCD Benefits
7.2.1.1 The airline implementing ABCD
Most airlines place importance on punctuality since it directly contributes to the image of the company and can be a selection criterion for the passengers. Therefore airlines endeavor to decrease their delay.
AirspaceUsers
Air NavigationService
ProvidersSociety
Civil AircraftOperators
Airlines
Cargo
Business
Military AircraftOperators
Airport / APPATSPs
CFMU
GroundHandling
AirportOperators
Localcommunity
GeneralAviation
Passengers
Region andNation
AeronauticsIndustry
Aircraftmanufacturers
Other suppliers

A D V A N C E D L O G I S T I C S G R
Madrid � Barcelona
EUROCONTROL
ABCD: Aircraft-Based Concept Developments
Date: 15/09/2008 Issue: 0 Rev: Page: 47
47
The ABCD client airline, as the direct user of the tool, is the prime stakeholder in the concept. As ABCD enables optimizing the use of the available capacity, the delay incurred by the airline will be reduced.
Delays are usually split between tactical delays and strategic delays.
Tactical delays are delays actually experienced on the days of operations, whereas strategic delays refer to the buffers built into schedules to allow for an anticipated level of delay, depending on the level of predictability.
Furthermore tactical delays are usually split between primary and reactionary delays.
Reactionary delays are delays due to the late arrival of the previous flight or of the crew, and primary delay refers to all the others delays, including ATFM delay.
As ABCD helps to detect reactionary delays, improving the predictability of aircraft operations, it should contribute to:
- A gain in ATFM delay due to a better anticipation of DLA messages.
- A reduction in reactionary delay resulting from a lower ATFM delay incurred by the previous flight.
- The reduction of strategic delay, which is the long-term effect of lower tactical delay, i.e. increased aircraft utilization
ABCD will therefore impact on the cost effectiveness of airlines operations.
However, the simulations results only allow the quantification of the gain in ATFM delay (cf. section 7.2.2), the induced benefits (reactionary and strategic delay) can not be taken into account.
7.2.1.2 The other airlines
As ABCD is expected to improve the predictability and efficiency of the slot allocation system, it should therefore impact on the total ATFM delay incurred by the set of the flights flying through the ECAC area.
Thanks to the simulations, it is possible to measure this impact. Annex 6 focuses on the total ATFM delay incurred by all the other airlines than Airline XXX (i.e. the total ATFM delay in ECAC area minus the Airline XXX ATFM delay), and shows that an earlier notification of DLA messages by Airline XXX may lead to either a decrease or an increase in the total ATFM delay. However, there is a majority of cases for which the use of the ATFM capacity is more optimised compared to the baseline case. Furthermore, when the total ATFM delay is greater than in the baseline case, it has to be noticed that this positive variation is limited, and less important than a negative variation which would correspond to a decrease in ATFM delay.
Given those results, the assessment of the benefits for this stakeholder will be conservative, and they will be regarded as null.

A D V A N C E D L O G I S T I C S G R
Madrid � Barcelona
EUROCONTROL
ABCD: Aircraft-Based Concept Developments
Date: 15/09/2008 Issue: 0 Rev: Page: 48
48
7.2.1.3 The military
ABCD will not impact on this stakeholder.
7.2.1.4 Airport operators
Airport Operator will be able to improve service provision to their customers through better allocation of resources as they could be informed long in advance of the future potential disruption in terms of flight plan schedule consistency. These apply to both the tactical level, through stability in gate and stand allocation, as well as strategically, as better use of infrastructures supports greater passenger throughput. Airports should also be able to provide better information to their customers. Overall, the airport quality of service should be enhanced;
ABCD would improve the parking slot allocation process in the airports and would enable a better management of this process.
ABCD could therefore impact on the predictability and efficiency of airport operations.
However, these parameters cannot be quantified with the indicators derived from the simulation results, which are only relevant to airlines. Consequently, the assessment will be conservative, assuming that the benefits resulting from the ABCD implementation is null for this stakeholder.
7.2.1.5 Air Navigation Service Providers
ATC’s main goals are to maintain separations between aircraft and to expedite and maintain orderly flow of air traffic while maximising the use of available capacity.
ATC will benefit at both local and network level from ABCD, which will provide a better picture of future traffic flows, improving its management through better anticipation of the future ATFM regulations, and better slot management (reduction of unused ATFM slots). In the long term Air Traffic Control Centre will improve the balance between their resources allocation and their capacity per rapport to the traffic demand as a consequence of the increased confidence in the predictability of traffic flows.
ABCD could therefore impact on the predictability of ATC operations.
However, these parameters cannot be quantified with the indicators derived from the simulation results, which are only relevant to airlines. Consequently, the assessment will be conservative, assuming that the benefits resulting from the ABCD implementation is null for this stakeholder.
7.2.1.6 ATFM Service Providers (CFMU)
ATFM main objective is to contribute to a safe, orderly and expeditious flow of air traffic by ensuring that ATC capacity is used to the optimum extent possible, and that the traffic volume is compatible with the capacities declared by the appropriate ATS authority.

A D V A N C E D L O G I S T I C S G R
Madrid � Barcelona
EUROCONTROL
ABCD: Aircraft-Based Concept Developments
Date: 15/09/2008 Issue: 0 Rev: Page: 49
49
ABCD would provide the CFMU with a better view of the traffic, and therefore improve traffic predictability. Indeed, with the implementation of the ABCD system, the slot allocation list could be updated earlier than with the current system. It should consequently impact on the capacity by decreasing the number of lost slots (i.e. slots that are allocated to an a/c and that are eventually not used by this one, or by another one, while it could have been), which will result in delay drop. As shown in section 6.4, the number of penalizing lost slots tends to decrease when DLA messages of one airline are sent earlier to the CFMU.
ABCD will therefore impact on the predictability and efficiency of network operations.
However it is important to note that the CFMU does not seek benefits per se: those benefits are automatically redistributed to the third parties provided with the ATFM service. In particular, efficiency is also measured through the ATFM delay imposed on airlines and should not be counted twice.
7.2.1.7 Ground Handling
Ground Handlers will be able to improve the use of their resources, saving costs and providing an improved level of service.
However, these parameters cannot be quantified with the indicators derived from the simulation results, which are only relevant to airlines. Consequently, the assessment will be conservative, assuming that the benefits resulting from the ABCD implementation is null for this stakeholder.
7.2.1.8 Aeronautics Industry
This stakeholder could be impacted by ABCD implementation in the sense that they could be involved in the tool development. However this is not assumed in the present analysis.
7.2.1.9 Passengers
The passengers may be impacted by the flight planning process, even if they do know neither its existence nor its mechanism. This process creates indeed ATFM delays, and therefore contributes to degrade the airline punctuality. Owing to a weighty delay, passengers may complain to the company and demand a compensation for the delay. Even worse, the delay could impair the passenger’s view on the airline and make him decide to change operator.
With the use of ABCD, customer satisfaction will increase as the hassle created by delays and the lack of information will be reduced (through lower ATFM delays and the improved predictability of operations at the departure/destination airport).
However, the delay cost used for the assessment of the benefits for the airline already takes into account compensation costs and opportunity costs related to the potential loss of market share.

A D V A N C E D L O G I S T I C S G R
Madrid � Barcelona
EUROCONTROL
ABCD: Aircraft-Based Concept Developments
Date: 15/09/2008 Issue: 0 Rev: Page: 50
50
Therefore, in order to avoid the double counting, it will assume that the benefits resulting from the ABCD implementation is null for this stakeholder.
7.2.1.10 Society
ABCD will not impact on this stakeholder.
7.2.2 Quantification of ABCD Benefits
The determination of ABCD benefits finally boils down to the assessment of the benefits in terms of ATFM delay got by the airline investing in ABCD.
Indeed, the induced benefits for the airline (less reactionary delay, less strategic delay), as well as the benefits got by third parties cannot be quantified with the simulations results, as explained in section 7.2.1. There are regarded as null to be conservative.
This section presents and applies the methodology used to assess benefits on the basis of the indicators derived from the simulation results commented in section 6.
7.2.2.1 Methodology
7.2.2.1.1 Rationale
As mentioned in section 2.2, the ultimate goal of the simulations is to support the assessment of the benefits that the use of ABCD could bring to the airline.
The simulation facility used during the project (TACOT) is by far the most appropriate tool when one wants to assess the impact of a time-dependent parameter (here anticipation) on the slot allocation mechanism (via ATFM delay).
Nevertheless, the preparation and execution of simulations with such a platform is time-consuming. Due to time constraints, some choices had to be made:
� The use of ABCD, through flight linkage, was not simulated to keep it “straight and simple”, work in synch with the other activity (Impact of anticipation on unused ATFM slots, WP8&9) and be consistent with it;
� It was not possible to replay an extensive number of traffic days.
As a consequence, a methodology is necessary to “bridge the gap” between:
� The analysis of simulations results, with their inherent limitations;
� The production of a sturdy Cost Benefit Analysis.
This methodology intends to be conservative i.e. to underestimate the actual benefits that ABCD would deliver if operated for real.

A D V A N C E D L O G I S T I C S G R
Madrid � Barcelona
EUROCONTROL
ABCD: Aircraft-Based Concept Developments
Date: 15/09/2008 Issue: 0 Rev: Page: 51
51
This conservative methodology follows the modus operandi presented hereunder, together with the assumptions it relies on.
It has to be noted that additional simulations are anticipated (see section 9 and 10) to make sure that, inter alia, the estimates are truly conservative.
7.2.2.1.2 Modus operandi
Step 1. Evaluate the potential gains in ATFM delay resulting from the earlier notification of all the DLA messages of the airline. Based on A-01 and A-02.
Step 2. Evaluate the ABCD use rate and how earlier DLA messages can be notified thanks to this tool. The ABCD use rate is defined as the ratio between the number of effective users and number of potential users of ABCD.
An effective user of the system is a regulated flight that sent a DLA message and could have sent it earlier thanks to ABCD.
The methodology underlying the identification of effective users is annexed to the document (cf. Annex 7) and is largely based on the future specifications7 of the tool.
A potential user of the system is a regulated flight that sent a DLA message.
Step 3. Evaluate the effective gains in ATFM delay for each simulated day, i.e. the gains resulting from the use of ABCD assessed in step 2. Based on A-03 and A-04.
Step 4. Evaluate the yearly gains in ATFM delay resulting from the use of ABCD. Based on A-05.
Step 5. Translate the yearly gain in ATFM delay into the yearly financial gain resulting from the use of ABCD. Based on A-06.
7.2.2.1.3 Assumptions
A-01 Direct gains, resulting from the decrease in ATFM delay, are assessed. Induced gains, resulting from the decrease in reactionary delays and strategic delays, are not assessed. Cf. section 7.2.1.1.
A-02 Direct gains result from the decrease in ATFM delay for minutes in excess of 15 minutes (on a per flight basis). Cf. A-06.
A-03 Effective gains are generated by the effective users of ABCD. There may be induced gains for the other flights of the airline, when regulated (because of slot reallocation), but those induced gains are regarded as
7 Cf. deliverable D4, to be released in October 2008.
A D V A N C E D L O G I S T I C S G R
Madrid � Barcelona
EUROCONTROL
ABCD: Aircraft-Based Concept Developments
Date: 15/09/2008 Issue: 0 Rev: Page: 52
52
null. The assumption is conservative in the light of the simulations results (in most cases, induced gains were recorded for regulated flights that did not send DLA messages, cf. section 6.2.1.3).
A-04 Effective gains are generated on a pro rata basis, depending on the potential gains (derived from step 1) and the ABCD use rate (derived from step 2). This assumption cannot be evidenced for now but will be tested through additional simulations to check that it is conservative.
A-05 Each day of the traffic sample is representative of a number of days that would all bring equivalent benefits. A number of days do not have their representative in the traffic sample: they are counted out in the assessment, which is conservative. Cf. section 4.1.
A-06 The marginal cost of ATFM delay is assumed to be (close to) zero for short ATFM delays (less than 15 minutes), based on [4]. The marginal cost of ATFM delay for long ATFM delays (more than 15 minutes) is assumed to be 58.6€ per minute. Also based on [4], this is the figure (according to a “base cost scenario”) applicable to B737-800 aircraft, which is the standard model equipping the Airline XXX fleet. This is the marginal cost for one minute of tactical ground delay at-gate, therefore applicable to ATFM delay. It does not address the costs induced by the knock-on effects on reactionary delays and strategic delays. It includes the following cost elements: crew, maintenance and fuel costs, aircraft charges, passenger compensation costs (“hard” costs) and passenger opportunity costs (“soft” costs).
7.2.2.2 Application
Step 1: Potential gains resulting from the earlier notification of DLA messages
The assessment of potential gains is focused on the potential users of the tool, i.e. the flights sending DLA messages, and is restricted to the minutes of ATFM delay in excess of 15’, which do have a financial cost for the airline.
For each day of the traffic scope, the relative gain is plotted against anticipation (figure 14), based on the results presented in section 6.
The relative gain is defined as:
Relative gain (scenario) = (Delay baseline – Delay scenario) / (Delay baseline)
The relative gain is convenient to assess all traffic days equally, regardless of the baseline ATFM delay.

A D V A N C E D L O G I S T I C S G R
Madrid � Barcelona
EUROCONTROL
ABCD: Aircraft-Based Concept Developments
Date: 15/09/2008 Issue: 0 Rev: Page: 53
53
0%
10%
20%
30%
40%
50%
60%
70%
80%
90%
0 20 40 60 80 100 120
Shift in DLA timestamp (message anticipation improv ement) in min
Rel
ativ
e ga
in
20/07/07
22/06/07
21/06/07
30/06/07
18/06/07
09/06/07
18/07/07
28/07/07
Figure 14: Relative gain for total ATFM delay > 15’ (for Airline XXX flights sending DLA messages)
First, the gain is positive in all cases but one (June 22nd for a 10min shift). Second, the general trend for the gain is 1) to increase quite sharply; 2) to stabilize progressively, once DLA messages are shifted by more than forty minutes. It is possible than past a 40-minute shift, most flights already reach a “good” level of absolute anticipation: any further improvement does not bring substantial additional gains. Nevertheless: 1) The gain is not a monotonous function of anticipation; 2) The relationship between the gain and the traffic pattern is unobvious (given the anticipation, a heavier traffic does not always mean a higher relative gain). Therefore two cases are proposed to link potential gains to the improvement of anticipation:
� An average case based for each alternative scenario on the mean relative gain i.e. the relative gain averaged over all the simulated days, taking into account the statistical weight of each day (cf. section 4.1);
� A worst case based for each alternative scenario on a minimum relative
gain. It is derived from the mean relative gain and the standard deviation over all the simulated days8, taking into account the statistical weight of each day (cf. section 4.1).
8 The formula actually used is: minimum gain = mean gain – standard deviation * 2

A D V A N C E D L O G I S T I C S G R
Madrid � Barcelona
EUROCONTROL
ABCD: Aircraft-Based Concept Developments
Date: 15/09/2008 Issue: 0 Rev: Page: 54
54
The assessment of benefits, hence the CBA, will be made in the two cases, to provide mid and low estimates of the benefits broug ht by ABCD. The relative gains for the two cases are given by Table 6: Anticipation (min) 10 20 30 45 60 90 120
Average case 20.9% 25.4% 42.0% 53.0% 45.3% 47.2% 44.6%
Worst case -1.3% 1.3% 22.5% 24.5% 15.6% 16.8% 15.7%
Table 6 : ATFM delay gains, average vs. worst case
Step 2: ABCD use rate
The alternative scenarios improved anticipation for all flights sending DLA messages, whether they could or could not have done it thanks to ABCD. The evaluation of the ABCD use rate looks at the proportion of flights that could have used ABCD, in order to determine effective gains in ATFM delay. The methodology used to pinpoint the effective users of the system (cf. annex 7) is consistent with:
� The ABCD concept : Airline XXX flight plans are linked through the aircraft registration number, thanks to the aircraft allocation schedule provided by the airline;
� The ABCD specifications 9: The identification of a critical reactionary delay,
that ABCD would have detected, is based on the information available for the previous flight, which would have been used by ABCD for the detection. The moment the identification is possible depends on the moment the information is available, which sets a new timestamp for the notification of the DLA message.
Therefore it is possible to know whether for each potential user, there exists an alternative scenario relevant to it, that is to say a scenario that would have occurred thanks to the use of ABCD. If it does exist, then the user is said to be effective. The ratio between effective and potential users (for each scenario or all scenarios) is the ABCD use rate (for each scenario or all scenarios). It is given in table 7, for each day of the traffic scope: Scenario 10 20 30 45 60 90 120 All
Day 20/07/07 0% 3% 1% 3% 6% 7% 10% 30% 22/06/07 0% 3% 1% 3% 6% 7% 10% 30% 21/06/07 2% 2% 0% 5% 6% 0% 6% 20% 30/06/07 2% 2% 0% 5% 6% 0% 6% 20% 18/06/07 0% 2% 2% 2% 2% 4% 2% 13% 09/06/07 0% 2% 2% 2% 2% 4% 2% 13%
9 Contained in D4, to be released in October.

A D V A N C E D L O G I S T I C S G R
Madrid � Barcelona
EUROCONTROL
ABCD: Aircraft-Based Concept Developments
Date: 15/09/2008 Issue: 0 Rev: Page: 55
55
18/07/07 0% 3% 3% 6% 0% 0% 6% 18% 28/07/07 0% 3% 3% 6% 0% 0% 6% 18%
Table 7 : ABCD use rate
Depending on the day of traffic, from 13% to 30% of the regulated flights having sent a DLA message (potential users) would have sent it earlier if they had used ABCD (effective users). The ABCD use rate tends to increase in case of heavy traffic and high ATFM delay. Furthermore, the majority of effective users would have improved anticipation by at least 45 minutes. This is interesting insofar as the relative gain in ATFM delay becomes steadier past 45 minutes, meaning that the benefits resulting from the use of ABCD would become more predictable.
Step 3: Effective gains resulting from the use of ABCD
Once the ABCD use rate is set for each scenario, it is combined with the relative gain for each scenario in order to determine effective gains in ATFM delay for each day of traffic, i.e. gains that could be expected if ABCD were used. The formula used is:
Effective gain = Σ {Baseline ATFM delay * Use rate * Relative gain}
For each scenario, the use rate behaves like a corrective factor applied to the baseline ATFM delay to determine the share of it that would be impacted according to that very scenario, thanks to the use of ABCD. The relative gain corresponding to that scenario is then applied to this ATFM delay share to figure out effective gains resulting from the occurrence of such a scenario, for the average case on the one hand, for the worst case on the other hand. Gains are then summed over all the alternative scenarios to estimate effective gains for the whole Airline XXX fleet on that day of operations. They are given in table 3:
Day 20/07/07 22/06/07 21/06/07 30/06/07 08/06/07 09/06/07 18/07/07 28/07/07
Average case 463 179 66 60 34 27 17 18
Worst case 165 64 23 21 13 10 7 7
Table 8 : Estimated daily gain (in min) for Airline XXX flights - ATFM delay > 15’
Step 4: Yearly gains in ATFM delay
Each simulated traffic day were selected (cf. section 4.1) in order to be representative of a set of days that are supposed to bring benefits of the same order because they belong to the same range in terms of ATFM delay and European traffic.
For instance, the 18th of June is representative of a set of 23 days which is therefore assumed to bring 23 times as much gain as for the 18th. Yearly gains are estimated on that basis:

A D V A N C E D L O G I S T I C S G R
Madrid � Barcelona
EUROCONTROL
ABCD: Aircraft-Based Concept Developments
Date: 15/09/2008 Issue: 0 Rev: Page: 56
56
Airline XXX yearly gains (ATFM delay > 15’), average case: 4205 min
Airline XXX yearly gains (ATFM delay > 15’), worst case: 1561 min
Step 5: Yearly financial benefits
Yearly gains in ATFM delay are converted into financial benefits, assuming that the cost of one minute of ATFM delay is 58.6 €, past fifteen minutes.
Airline XXX financial benefits, average case: 246 438 € a year
Airline XXX financial benefits, worst case: 91 476 € a year
7.3 Identification and quantification of ABCD Costs
This section identifies and describes the different types of costs incurred by ABCD implementation, and for each one provides a reasonable value.
As we consider the case where ABCD is implemented at airline level, the cost of ABCD will be only borne by the airline deciding to implement the tool.
We will consider:
� The acquisition and installation costs,
� The maintenance costs,
� The training costs,
� The human resources costs
ABCD is a basic decision-making support system aiming at the management of flight planning. Based on an elementary principle – the linkage of flight plans and the use of the messages exchanged with the CFMU – this tool should be all the easier to use as this system will not impact on the other actual systems, and will be only added to the flight plan management system.
Please refer to the specifications (D4) for more detailed information on the ABCD tool principles.
Acquisition and Installation costs:
• The airline needs to buy the software whose development is quite simple and should not require more than 6 man x month. Therefore, the acquisition cost is about 72 000 Euros (6 men.months * 600 € per day * 20 working days per month).
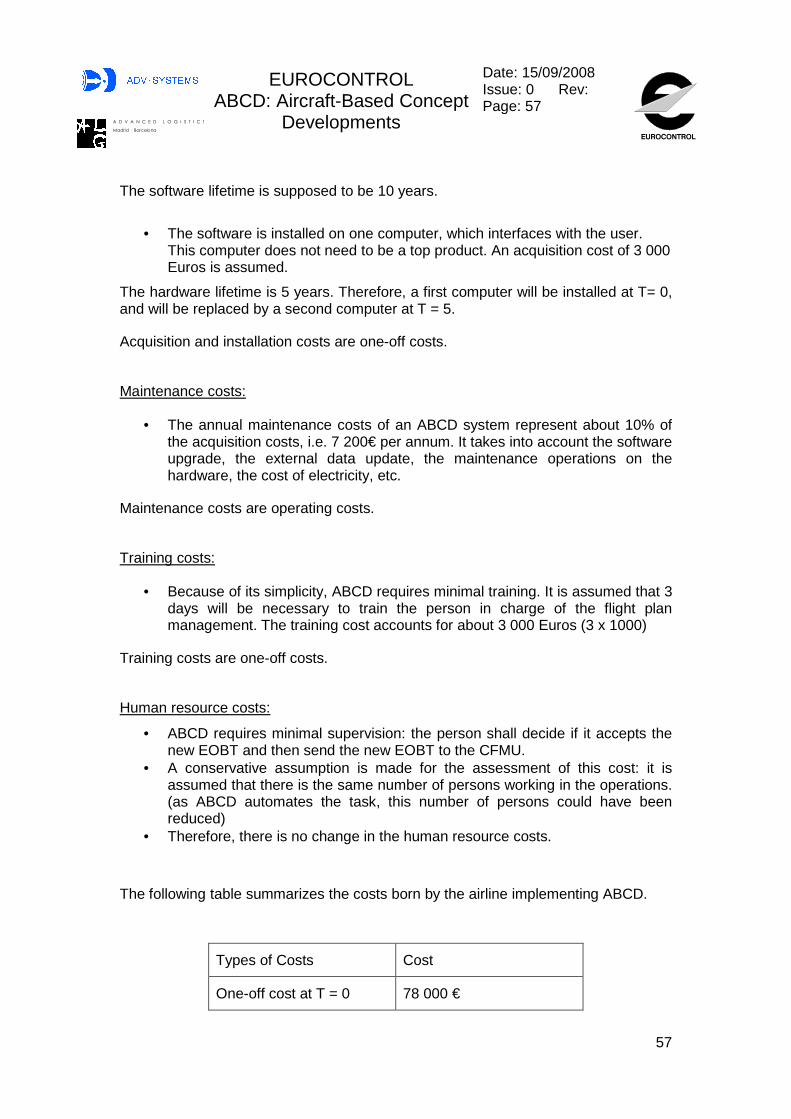
A D V A N C E D L O G I S T I C S G R
Madrid � Barcelona
EUROCONTROL
ABCD: Aircraft-Based Concept Developments
Date: 15/09/2008 Issue: 0 Rev: Page: 57
57
The software lifetime is supposed to be 10 years.
• The software is installed on one computer, which interfaces with the user.
This computer does not need to be a top product. An acquisition cost of 3 000 Euros is assumed.
The hardware lifetime is 5 years. Therefore, a first computer will be installed at T= 0, and will be replaced by a second computer at T = 5.
Acquisition and installation costs are one-off costs.
Maintenance costs:
• The annual maintenance costs of an ABCD system represent about 10% of the acquisition costs, i.e. 7 200€ per annum. It takes into account the software upgrade, the external data update, the maintenance operations on the hardware, the cost of electricity, etc.
Maintenance costs are operating costs.
Training costs:
• Because of its simplicity, ABCD requires minimal training. It is assumed that 3 days will be necessary to train the person in charge of the flight plan management. The training cost accounts for about 3 000 Euros (3 x 1000)
Training costs are one-off costs.
Human resource costs:
• ABCD requires minimal supervision: the person shall decide if it accepts the new EOBT and then send the new EOBT to the CFMU.
• A conservative assumption is made for the assessment of this cost: it is assumed that there is the same number of persons working in the operations. (as ABCD automates the task, this number of persons could have been reduced)
• Therefore, there is no change in the human resource costs.
The following table summarizes the costs born by the airline implementing ABCD.
Types of Costs Cost
One-off cost at T = 0 78 000 €

A D V A N C E D L O G I S T I C S G R
Madrid � Barcelona
EUROCONTROL
ABCD: Aircraft-Based Concept Developments
Date: 15/09/2008 Issue: 0 Rev: Page: 58
58
One-off cost at T = 5 3 000 €
Operating Cost (per annum)
7 200 € pa
Table 9 : ABCD Costs
7.4 Cost Benefit Analysis
The previous sections have enabled to quantify the ABCD benefits on the one hand, and the ABCD costs on the other hand. Given the assumptions established in those sections, the costs will be only born by the airline investigating in ABCD, and the benefits will be taken into account only for this airline.
As a result, the cost benefit analysis boils down to the cost benefit analysis for the airline implementing the ABCD system.
Implementation of ABCD should only normally take place if it can be demonstrated that the plan provides good value for money.
In this way, CBA provides a means of making a judgement about value for money, and several economic indicators can be calculated such as:
� the overall net present value,
� the benefit to cost ratio,
� the internal rate of return,
� the payback period,
which give clues on the viability of the investment. These indicators are described in section 7.4.2.
7.4.1 Assumptions
First and foremost, it is necessary to present the assumptions on which the Cost Benefit Analysis relies:
� All costs are expressed in constant 2006 Euro value.
� It is assumed that the airline will implement ABCD in 2009.

A D V A N C E D L O G I S T I C S G R
Madrid � Barcelona
EUROCONTROL
ABCD: Aircraft-Based Concept Developments
Date: 15/09/2008 Issue: 0 Rev: Page: 59
59
The financial parameters such as the discount rates and the time scales (or time horizon) have also to be defined so that the cash-out flows could be calculated and spread over the years.
� The discount rate is set at the rate of return that an organisation expects from its capital and this usually includes a risk premium. The higher the discount rate, the lower the present value of future cash flows.
It is assumed to conduct the CBA with two different discount rates : 10% and 15%.
� The analysis period has to be consistent with the lifetime of the different elements to implement.
As the lifetime of the ABCD tool is assumed to be 10 years (and the lifetime of a computer is 5 year), the CBA will be based on a time horizon of 10 years.
7.4.2 Indicators
Four economic indicators will be computed in order to assess the viability of the ABCD project.
� Net Present Value
Net Present Value (NPV) is calculated by discounting future benefits and costs to present day values using an appropriate discount rate, and subtracting the total discounted costs from the total discounted benefits over a given period of time. The advantage of this method is that it transforms gains and losses occurring in different time periods to a common unit of measurement. It recognises that the money could have been invested elsewhere and that benefits and costs are worth more if they are experienced sooner.
The formula to calculate the NPV is given by:
where Bt and Ct are the benefits and costs in year t, r is the discount rate, and T is the time horizon. It has to be reminded that benefits and costs are both defined as the difference between what would occur with and without ABCD implementation.
The NPV is the most basic criterion for accepting a project as a positive NPV indicates that an investment is worthwhile, whereas a negative NPV means that an investment generates financial benefits that do not offset the costs.
� Internal Rate of Return
As with NPV, the internal rate of return (IRR) method of investment appraisal also considers the time value of money. The IRR is the discount rate that makes the

A D V A N C E D L O G I S T I C S G R
Madrid � Barcelona
EUROCONTROL
ABCD: Aircraft-Based Concept Developments
Date: 15/09/2008 Issue: 0 Rev: Page: 60
60
present value of a series of costs equal to the present value of the returns on those costs. In other words, the IRR is the discount rate that makes the net present value of the annual cash flows arising from an investment equal to zero.
The internal rate of return (IRR) is therefore another project criterion such as:
The project is acceptable if IRR > r.
� Benefit Cost Ratio
Another frequently used criterion is the Benefit Cost (B/C) Ratio, which is the ratio of the discounted benefits to the discounted costs:
An acceptable project would have a B/C Ratio equal to or greater than 1.
� Payback Period
The payback period is the length of time before the discounted cash flows arising from a project become equal to the investment costs incurred.
7.4.3 Results of the CBA
First of all, the table below summarizes the costs and benefits quantified in sections 7.2 and 7.3:
Cost Ct / Benefit Bt per annum Prices
Average case Worst Case Bt for t in [1 ; 10 ]
246 438 € 91 476 €
C0 78 000 €
C5 3 000 €
Ct for t in [1 ; 4] and in [6 ; 10] 7 200 €
Table 10 : Cost and Benefits of ABCD

A D V A N C E D L O G I S T I C S G R
Madrid � Barcelona
EUROCONTROL
ABCD: Aircraft-Based Concept Developments
Date: 15/09/2008 Issue: 0 Rev: Page: 61
61
It has to be reminded that two methods were proposed to determine the benefits related to ABCD use: an “average” case (based on an average relative gain), and a “worst” case, more restrictive (based on a minimum relative gain).
Those costs and benefits have been used to compute the value of the different indicators, according to the discount ratio and the method (average or worst case) used to determine ABCD Benefits.
Discount Rate : 10 % Average case Worst case
Overall Net Present Value (€) 1 390 152 437 975
Benefit to Cost Ratio 12 5
Internal Rate of Return 307% 108%
Payback Period 1 2 Table 11 : Economic indicators values for a discount rate of 10%
Discount Rate : 15 % Average case Worst case
Overall Net Present Value (€) 1 121 189 343 469
Benefit to Cost Ratio 11 4
Internal Rate of Return 307% 108%
Payback Period 1 2 Table 12 : Economic indicators values for a discount rate of 15%
These results demonstrate that whatever the assumpt ions made (about the discount rate, as well as the way to calculate the gains related to ABCD), the investment is viable:
- the NPV is positive
- the BCR is superior to one
- the IRR is largely above the discount rate
- the payback year is equal or below 2 years, well below the time horizon of the project
A D V A N C E D L O G I S T I C S G R
Madrid � Barcelona
EUROCONTROL
ABCD: Aircraft-Based Concept Developments
Date: 15/09/2008 Issue: 0 Rev: Page: 62
62
8 OPEN ISSUES
8.1 Limits
Initial TACOT simulations have been performed within the framework of the Aircraft Based Concept Developments (ABCD) project, in order to study the relationship between the anticipation of delay messages and the ATFM delay and to support the two validation activities of the project:
- Activity 1 , aimed at quantifying the potential gains in ATFM delay for an airline when this airline better anticipates its delay messages. The simulations results have then contributed to assess the effective gains that the use of the ABCD tool at airline level could bring to the very airline, based on a specific methodology and conservative assumptions.
- Activity 2 , aimed at quantifying the potential gains (in terms of ATFM delay and unused slots) when all the airlines better anticipates their delay messages. This activity was independent of the ABCD use.
In activity 2 (cf. Deliverable D8 & D9) the simulation results have clearly demonstrated that the anticipation of the delay messages is a key to the efficiency of the slot allocation system: at a macroscopic level, a continuous improvement in the timestamp of the notification of DLA messages leads to a continuous reduction in the ATFM delay imposed by the system.
In activity 1 however, it appears that the simulations have some limitations:
� Although the ATFM delay is reduced when the delay messages anticipation is improved with respect to the baseline scenario, it has to be noted that there is no strong correlation between anticipation and ATFM delay: the ATFM delay does not decrease continuously when the DLA anticipation is improved.
� The actual use of ABCD, through flight linkage, is not directly taken into account in those simulations and the link between simulations results and the effective use of ABCD relies on assumptions.
� The simulations do not take into account the possible induced effect of an earlier notification of a flight delay on subsequent flights. An earlier notification could indeed allow a flight to take-off earlier (because of a lower ATFM delay) and therefore arrive earlier at its arrival point, which could impact on the EOBT of the following flight.
Given those limits, it has been decided to perform additional simulations that will introduce the linkage between two successive flights, and therefore will integrate a more realistic use of ABCD. The necessity of these additional simulations is justified by the fact that they are intended to support the results obtained in the initial simulations and make sure that the estimates were truly conservative.

A D V A N C E D L O G I S T I C S G R
Madrid � Barcelona
EUROCONTROL
ABCD: Aircraft-Based Concept Developments
Date: 15/09/2008 Issue: 0 Rev: Page: 63
63
8.2 Additional simulations
8.2.1 Principles and objectives
The present section presents and describes the additional part of the TACOT simulations. Two types of simulations are proposed in the wake of the initial simulations.
� Static Simulations
First, it is planned to carry out a static study wi th one unique alternative scenario which corresponds to a realistic use of ABCD by one airline.
In the initial simulations, several alternatives scenario were set up, which each one assumed a fixed shift in the timestamp of all the DLA messages sent by the airline (for example, scenario 1: shift – 10 minutes; scenario 2: shift – 20 minutes, …)
Now, the simulations only consider the DLA messages that could have been better anticipated thanks to the use of ABCD . This therefore requires a preliminary work, made by the ABCD team, for each traffic day: after linking the flights executed by the same aircraft10, the different messages sent or received by the airline are analysed, and the use of ABCD is simulated manually, on the basis of the specifications currently defined by the ABCD team. It enables indicating for each DLA message the shift in the initial timestamp.
As a result, the simulations principle in the static part would remain the same as in the initial part of the simulations: the timestamp of DLA messages is shifted. Nevertheless, only a part of the DLA messages is taken into account, and besides the shift in the timestamp is specific to each delay message.
This first step is static in a sense that it only studies the impact of ABCD use on ATFM delay through an improved anticipation: the existing DLA messages are shifted, without any change in their contents.
This task is therefore intended to confirm the results derived from the initial simulations, and to check that the assumptions mentioned in this document undervalue the effective gain related to ABCD use.
It is planned to execute those simulations on four or five days of traffic.
The inconvenient of the static method is that it does not take into account the induced effects of a better anticipation of DLA messages on the following flights.
� Dynamic Simulations
The second step proposed in the additional simulations envisages running dynamic simulations that will enable to observe and trace the repercussion of an initial ATFM delay on subsequent flights.
10 Thanks to aircraft schedules information provided by the airline.

A D V A N C E D L O G I S T I C S G R
Madrid � Barcelona
EUROCONTROL
ABCD: Aircraft-Based Concept Developments
Date: 15/09/2008 Issue: 0 Rev: Page: 64
64
It is therefore planned to focus on the reactionary delays linked to an initial ATFM delay, and to filter out all the other types of delays.
Contrary to initial simulations and static simulations, the objective is not to compare a baseline scenario representative of the reality with an alternative scenario, but instead to create and compare two fictive scenarios defined as follows: in both scenarios, all the DLA effectively sent are removed, and new DLA messages are introduced each time an initial ATFM delay induces reactionary delays on the subsequent flights. The difference between both scenarios relies on the timestamp of the DLA messages:
� In the first scenario (Baseline scenario), it is assumed that ABCD is not used by the airline, that is to say the delay of the flight N which impacts on flight N+1 is known at the arrival of flight N.
� In the second scenario, it is assumed that ABCD is used by the airline, i.e. the flight linkage linked to the CFMU messages analysis enables the company to detect earlier a reactionary delay.
As a result, this approach is intended to study the impact of ABCD on reactionary delays, eliminating the operational noise.
This dynamic analysis will require more preparation and a deeper analysis during the simulations.
8.2.2 Early results
As those additional simulations started during the writing of the present report, early results can be already presented.
Static simulations have been performed on 09/06/07. The ABCD team provided to the TACOT facility managers with a list of DLA messages that Airline XXX could have notified earlier to the CFMU.
The results are shown in the following table, which compares the “ATFM delay > 15 min” indicator for the baseline scenario and the static scenario.
Baseline 1 585 ATFM delay > 15' (min) Static Simulations 1 445
Gain in ATFM delay (min) 140
Financial Gain (€) 10 780 Table 13 : Early results of static simulations
The gain in ATFM delay (>15 minutes) for this days is 140 minutes, which accounts for a financial gain of 10 780 Euros for the airline.

A D V A N C E D L O G I S T I C S G R
Madrid � Barcelona
EUROCONTROL
ABCD: Aircraft-Based Concept Developments
Date: 15/09/2008 Issue: 0 Rev: Page: 65
65
In the assessment of the benefits realised in section 7.2.2, the computed gain in ATFM delay (>15 minutes) was 10 minutes for the worst case, and 27 minutes for the average case.
Those early results are therefore encouraging for the following simulations, since for the case of 09/06/07, the effective benefit obtained thanks to the initial simulations and based on a certain number of assumptions is underestimated, compared to the results derived from the static simulations.

A D V A N C E D L O G I S T I C S G R
Madrid � Barcelona
EUROCONTROL
ABCD: Aircraft-Based Concept Developments
Date: 15/09/2008 Issue: 0 Rev: Page: 66
66
9 CONCLUSIONS AND NEXT STEPS
9.1 Conclusions
WP3 intended to assess the benefits brought by ABCD in order to prove to any interested airline that such a tool would be worth the investment. Therefore a Cost Benefit Analysis was the logical output for such a deliverable, and the main input to it were the simulations performed under TACOT.
TACOT was retained because it is the best platform available to those who want to emulate accurately the behaviour of CFMU operational systems. And indeed, a reliable simulation of the slot allocation mechanism was the key to the study, which aimed to evidence that:
When ABCD is used by the airline, ATFM delays decrease because thanks to it DLA messages are notified earlier to the CFMU and as a consequence better slots are allocated to its flights, consistent with the First-Planned-First-Served principle.
Therefore the benefits assessed thanks to the simulation results only focused on the reduction of ATFM delays .
Additional benefits, which may also stem from the use of ABCD, could not be quantified at that stage, with the current simulation results. Those benefits are:
1) The reduction of reactionary delays , induced by the reduction of ATFM delays: Quoting the latest Performance Review Report, PRR 2007:
“After a significant reduction between 1999 and 2003, the sensitivity of the air transport network to primary delays has risen continuously between 2003 and 2007 (…). The reactionary/primary delay ratio reached 80% in 2007, meaning that every minute of primary delay resulted in 0.8 minute of additional reactionary delay, on average.”
Thus there is increased added value to earn through the reduction of ATFM delays, which represent almost a quarter of all primary delays (for 2007 in Europe). The direct gains resulting from any decrease in ATFM delay should then generate extra gains, because of the induced effect on the decrease in reactionary delays. Most importantly, direct and extra gains may be of the same order of magnitude, given the reactionary/primary delay ratio;
2) The reduction of strategic delays , induced by the reduction of tactical delays experienced by the airline over the long term, and consecutive to the improvement in the predictability of operations.
Those additional benefits, which could not be measured, were assumed to be null in the CBA, which is conservative.

A D V A N C E D L O G I S T I C S G R
Madrid � Barcelona
EUROCONTROL
ABCD: Aircraft-Based Concept Developments
Date: 15/09/2008 Issue: 0 Rev: Page: 67
67
Furthermore, the direct benefits, resulting from the reduction of ATFM delays, were also measured on the basis of a conservative methodology, to make sure that they would not be overestimated. Two cases were proposed:
� A average case, assuming reasonable gains, to make a mid estimate of the yields that could be expected from ABCD;
� A worst case, assuming minimal gains, to make a low estimate of the yields that could be expected from ABCD.
The raison d’être of the two cases is that the Cost Benefit Analysis does not aim fundamentally at an accurate assessment of the benefits and costs, but aims to prove that benefits outweigh costs, even when the most adverse situation is assumed.
This is what the CBA demonstrates whatever the configuration of the parameters and in particular when minimal gains are combined with a high discount rate.
Two main reasons account for it:
� The moderate implementation cost: ABCD is “affordable” since the tool is basically a piece of software operated with a standard computer and potentially alleviates labour costs because of task automation. Furthermore the integration costs are virtually nonexistent since ABCD shall not impact on existing systems (cf. D4 on specifications);
� The guarantee over the benefits: even if they are difficult to predict accurately they do exist. The ABCD scenario outperforms the base scenario, whatever the assumptions because ATFM delays are statistically reduced when anticipation is improved. And even if a small proportion of the airline fleet benefits from the tool on a day-to-day basis, the cumulated benefits over several years are significant, given the cost of delay.
Therefore evidence is given about the profit that would result from the implementation of ABCD at airline level, taking a typical low-cost carrier as the potential customer. Prospective investors can be confident about the viability of the implementation: ABCD is worth the investment.
9.2 Next steps
The simulation results used as an input to the CBA are not and cannot account for the infinite complexity of ATM. In particular, ATFM delays are not fully predictable because they are the result of a process central to ATFM, the slot allocation mechanism, which depends on a wide range of parameters, and delay (DLA) anticipation is only one of them. Furthermore it is conditioned by real-time events which are inherently unpredictable.
Therefore the current simulations have limitations, which are acknowledged. In particular:

A D V A N C E D L O G I S T I C S G R
Madrid � Barcelona
EUROCONTROL
ABCD: Aircraft-Based Concept Developments
Date: 15/09/2008 Issue: 0 Rev: Page: 68
68
� A few days were simulated because simulations run under TACOT are time-consuming;
� Flights were not linked in the simulations to keep them “straight and simple” in the early stages and streamline the preparation and execution, consistent with the analysis of unused slot (WP8 and WP9);
� The impact of anticipation on ATFM delay, given the results, could not be modelled at airline level – whereas it was possible to do it at ECAC level (when anticipation is globally improved cf. D8-D9). Indeed, the two simulation types did not play with the same flight number: at airline level, more simulation runs are necessary to get to the statistical weight reached at ECAC level. That said, the two simulation types have proven that in any situation for which one airline or all airlines notify delays earlier than today, the slot allocation system imposes less ATFM delay than in today’s situation.
In the case of one airline though, the results had to be taken with care and used on the basis of conservative assumptions, to secure the validity of the CBA.
As a consequence additional simulations will be undertaken to emulate, through flight linkage, the use of ABCD and get closer to a realistic ABCD scenario:
� DLA messages will be notified according to the proposals that ABCD would have made (compliant with the specifications, cf. D4) [static simulations];
� The impact of slot reallocation (i.e. ATFM delay reduction) on successive flights will be taken into account all along the aircraft journey [dynamic simulations, if feasible].
Therefore more realistic estimates of the ABCD benefits will be provided and should prove that the benefits assessed in the CBA , albeit already tangible, were nonetheless underestimated.

A D V A N C E D L O G I S T I C S G R
Madrid � Barcelona
EUROCONTROL
ABCD: Aircraft-Based Concept Developments
Date: 15/09/2008 Issue: 0 Rev: Page: 69
69
DICTIONARY OF ABBREVIATIONS
ABCD Aircraft Base Concept Developments
ACC Area Control Centre
ACK IFPS Acknowledgement Message
AFP ATC Flight Plan proposal
ANSP Air Navigation Service Provider
AO Aircraft Operator
APR Aircraft Operator Position Report
ARR Arrival message
ATC Air Traffic Control
ATFCM Air Traffic Flow and Capacity Management
ATFM Air Traffic Flow Management
ATO Actual Time Over
ATOT Actual Take-Off Time
CASA Computer Assisted Slot Allocation
CFMU Central Flow Management Unit
CHG Modification Message
CIR CFMU Interactive Reporting
CPR Correlated Position Report
CTO Calculated Time Over
CTOT Calculated Take-Off Time
DEP Departure message
DLA Delay Message
DPI Departure Planning Information message
EOBT Estimated Off-Block Time
ETO Estimated Time Over
ETOT Estimated Take-Off Time
FLS Flight Suspension Message
FMP Flow Management Position
FPL Flight Plan Message (ICAO format)
FSA First System Activation
ICAO International Civil Aviation Organization
IFPS Integrated Initial Flight Plan Processing System
MAN Manual
REJ Reject Message

A D V A N C E D L O G I S T I C S G R
Madrid � Barcelona
EUROCONTROL
ABCD: Aircraft-Based Concept Developments
Date: 15/09/2008 Issue: 0 Rev: Page: 70
70
RPL Repetitive Flight Plan
SAM Slot Allocation Message
SLC Slot Cancellation Message
SMM Slot Missed Message
SRM Slot Revision Message
WP Work Package

A D V A N C E D L O G I S T I C S G R
Madrid � Barcelona
EUROCONTROL
ABCD: Aircraft-Based Concept Developments
Date: 15/09/2008 Issue: 0 Rev: Page: 71
71
REFERENCE DOCUMENTS
[1] ABCD: Aircraft Based Concept Developments - Work Package n°2
[2] IRAB Evaluation of CARE projects 2007
[3] TACOT and related tools Manual
[4] Evaluating the true cost to airlines of one minute of airborne or ground delay (2003) (University of Westminster), Report commissioned by the Performance Review Commission

A D V A N C E D L O G I S T I C S G R
Madrid � Barcelona
EUROCONTROL
ABCD: Aircraft-Based Concept Developments
Date: 15/09/2008 Issue: 0 Rev: Page: 72
72
DOCUMENT FINAL PAGEDOCUMENT FINAL PAGEDOCUMENT FINAL PAGEDOCUMENT FINAL PAGE

A D V A N C E D L O G I S T I C S G R
Madrid � Barcelona
EUROCONTROL
ABCD: Aircraft-Based Concept Developments
Date: 15/09/2008 Issue: 0 Rev: Page: 73
73
ANNEX 1 – ATFCM TECHNICAL OVERVIEW
The ABCD project intends to study how AO planning processes (FPL management through aircraft registration) impacts on ATFM e.g. in terms of delay. ATFM delay is the delay given to flights by CFMU when they fly over a restricted location and therefore need to be regulated. Hence, through CASA, CFMU allocates a slot to flights and therefore imposes a delay on them. Being aware of the key points of the slot allocation process leads to a better understanding of the analysis performed in this document.
Thus, this annex intends to present an overview on Slot Allocation Procedures dealing with airlines’ communication with CFMU and on Computed Assisted Slot Allocation Process (CASA).
Slot Allocation Procedures
This section resumes the contents of EUROCONTROL ATFCM users Manual11 that describes procedures that airlines’ operational staff should follow to communicate with CFMU.
� Fill in a FPL:
It has to be done not later than 3 hours before EOBT. Response from CFMU will be either:
o ACK (FPL accepted). o MAN (errors in FPL; after manual processing will get either ACK or
REJ) o REJ (FPL rejected).
� Update a FPL:
To revise a FPL the airline need to send a DLA/CHG.
� Notify a delay:
In order to notify a delay the airline needs to send a DLA/CHG message for any change of EOBT greater than 15 minutes. However, an airline does not have to update an EOBT as a result of delay given by CTOT.
� Get a slot (CTOT):
The airline will receive 2 hours before EOBT a SAM message with a CTOT. However, if a regulation is applied after this time a slot will be issued immediately. If the airline does not receive any slot 2 hours before EOBT means that the flight is not subject to regulation.
� Update EOBT after slot reception: 11 EUROCONTROL CFMU (2004) Air Traffic Flow and Capacity Management Operations - ATFCM Users Manual

A D V A N C E D L O G I S T I C S G R
Madrid � Barcelona
EUROCONTROL
ABCD: Aircraft-Based Concept Developments
Date: 15/09/2008 Issue: 0 Rev: Page: 74
74
When an airline updates EOBT after receiving the slot: o If the new EOBT still enables the flight to depart according to its
CTOT, the slot will not be recalculated. o If a recalculation is necessary, the next available slot will be issued.
To avoid a substantial delay, especially in busy regulations, it is therefore important to update EOBT as soon as practicable.
� Slot change:
When a slot changes, the airline will receive an SRM with a new CTOT. There are several reasons why an SRM would be sent such as:
o A better slot has been found for you. o In response to a rate change in a regulation. o In response to a DLA/CHG message, etc…
If the airline can not comply with new slot, it should as soon as possible send a DLA/CHG stating the new EOBT or send an SMM, if new EOBT is not known, to ensure that the slot can be reused and to minimize your risk of substantial delay.
� Missed slot:
When an airline has missed a slot it needs to send the new EOBT via DLA/CHG message. The answer can be either via SRM, SLC or FLS messages. If the new EOBT is not known it needs to send an SMM. The answer will be an FLS (Flight Suspension message) and will remain suspended until the airline will send a DLA to provide the new EOBT.
� Last minute revision to CTOT:
Revisions to CTOTs should, where possible, be coordinated between the AO and the CFMU using the ATFCM message exchange procedures. However, it may be the case that last minute revisions to CTOTs and slot extensions when the pilot is in direct communication with ATC, are more easily or efficiently coordinated with the FMP/ CFMU by ATC.
Computer assisted slot allocation process (CASA)
This section resumes the content of EUROCONTROL Computer Assisted Slot Allocation12 going through the key points of slot allocation process required to understand the result of the analysis.
Slot allocation process consists in allocating a slot to every flight overflying a restricted location during regulation period. For each regulation, CASA builds and manages a list of slots called Slot Allocation List.
12 EUROCONTROL (2006) Tactical system software requirements - Computer assisted slot allocation (CASA)

A D V A N C E D L O G I S T I C S G R
Madrid � Barcelona
EUROCONTROL
ABCD: Aircraft-Based Concept Developments
Date: 15/09/2008 Issue: 0 Rev: Page: 75
75
Before regulation activation, CASA builds an empty slot allocation list characterized by the length of regulation period and the regulation rate that determines the number of slots during regulation period.
When regulation is activated, CASA starts receiving flight data based on RPL or FPL with a corresponding ETO requested. As stated in previous section, flights have sent their FPL to CASA at least 3 hours before their EOBT. At this point, Each flight is given a provisional slot based on the “First planned – First served” principle which means that flights should arrive over the restricted location in the same order as if there had been no restriction.
This first reservation is internal to the system, this is the pre-allocation stage. Slots are still very likely to be changed when more FPLs will enter the system or when flights will notify delays. These changes may decrease but also increase ATFM delay.
Two hours before the EOBT, each pre-allocated flight receives its allocated slot. The period from then to EOBT is called the allocation stage. Allocated slots cannot be taken by another flight. However, slots may be improved by the true revision process which is an automatic mechanism that periodically tries to improve slot allocation. Thus at this point, slots are modified only when ATFM delay is reduced by a new slot proposed.
The distinction between pre-allocated and allocated flights is very important in slot allocation process as it can be seen in following description. CASA tries to assign the slot that best fits EOBT requested by airlines provided rules stated below are respected. When CASA receives a FPL from a certain flight X:
� if slot requested is free, it is assigned to flight X.
� If slot is pre-allocated to flight Y, then the “First planned – First served” rule applies:
o if flight X was supposed to overfly the restricted location before flight Y - had there been no restriction - then slot is assigned to flight X. This may be followed by a series of modification as CASA will try to assign a new slot to flight Y. This is actually the “First Planned, First Served” principle.
o if flight X was supposed to overfly the restricted location after flight Y, CASA tries to assign another slot to flight X following the same rules
� If slot is already allocated, it cannot be taken by a flight candidate to pre-allocation. Then CASA tries to allocate another slot to flight X following the same rules.
Flights subject to various regulations are given an ATFM delay corresponding to the most penalising regulation and this delay is forced on all other regulations.
When a slot is cancelled, CASA may improve slots assigned to other flights, but only for pre-allocated flights.

A D V A N C E D L O G I S T I C S G R
Madrid � Barcelona
EUROCONTROL
ABCD: Aircraft-Based Concept Developments
Date: 15/09/2008 Issue: 0 Rev: Page: 76
76
A small part of global capacity during regulation is not used under normal circumstances as some pending slots are reserved in order to avoid deteriorating late updater flights.

A D V A N C E D L O G I S T I C S G R
Madrid � Barcelona
EUROCONTROL
ABCD: Aircraft-Based Concept Developments
Date: 15/09/2008 Issue: 0 Rev: Page: 77
77
ANNEX 2 –INDICATORS CONTAINED IN THE SIMULATION SUM MARY FILE
The following indicators are contained in the summary file generated automatically by the TACOT simulator. They concern the set of flights operated during a day in ECAC area.
- Total Delay;
- Max Fl. Delay;
- Perc. of Total Dly for flights with 1reg;
- Perc. of Total Dly for flights with 2regs;
- Perc. of Total Dly for flights with 3regs;
- Perc. of Total Dly for flights with 4regs and more;
- Perc. of Total Dly for flights with duration of -1h;
- Perc. of Total Dly for flights with duration of -2h;
- Perc. of Total Dly for flights with duration of -3h;
- Perc. of Total Dly for flights with duration of 3h+;
- Total number of flights;
- Total number of regulated flights;
- Total number of delayed flights;
- SRMs emitted Global ISO;
- Inversions ETO/CTO Inversions ETO/ATO;
- Inversions ETOT/CTOT;
- Inversions ETOT/ATOT;
- Inversions Average Magnitude ETO/CTO;
- Inversions Average Magnitude ETO/ATO;
- Inversions Average Magnitude ETOT/CTOT;
- Inversions Average Magnitude ETOT/ATOT;
- +10% Hourly Overloaded Slices PES excl. (demand);

A D V A N C E D L O G I S T I C S G R
Madrid � Barcelona
EUROCONTROL
ABCD: Aircraft-Based Concept Developments
Date: 15/09/2008 Issue: 0 Rev: Page: 78
78
- +10% Hourly Overloaded Slices PES excl. (regulated_demand);
- +10% Hourly Overloaded Slices PES excl. (load);
- Total number of Hourly Slices (load, with PES);
- Mean Overload % in +10% Hourly overloaded slices (PES excl., reg_demand);
- Mean Overload % in +10% Hourly overloaded slices (PES excl., load);
- 20min Overloaded Slices WITH PES (regu_dem);
- 20min Overloaded Slices WITH PES (load) 20min Overloaded Slices PES excl. (load);
- Total number of 20min Slices (load, with PES);
- Mean Overload % in 20min overloaded slices (PES excl.);
- Nb Lost Slots (Pen + not Pen);
- Nb Penal Lost Slots Total Nb Overloaded Slots (All regs);
- Total Nb Overloaded Slots (TERMINATED or ACTIVE regs);
- PES;
- Total Nb Slots (All regs);
- Total Nb flights surfeit (in demand hourly slices with overload % of 10 and more, PES excl.);
- Delay per flight surfeit (total delay/nb flights surfeit);
- Total Nb PES (TERMINATED or ACTIVE regs);
- Rejected DPI Accepted DPI Rejected FSA;
- Accepted FSA;
- Rejected DLA/CHG.
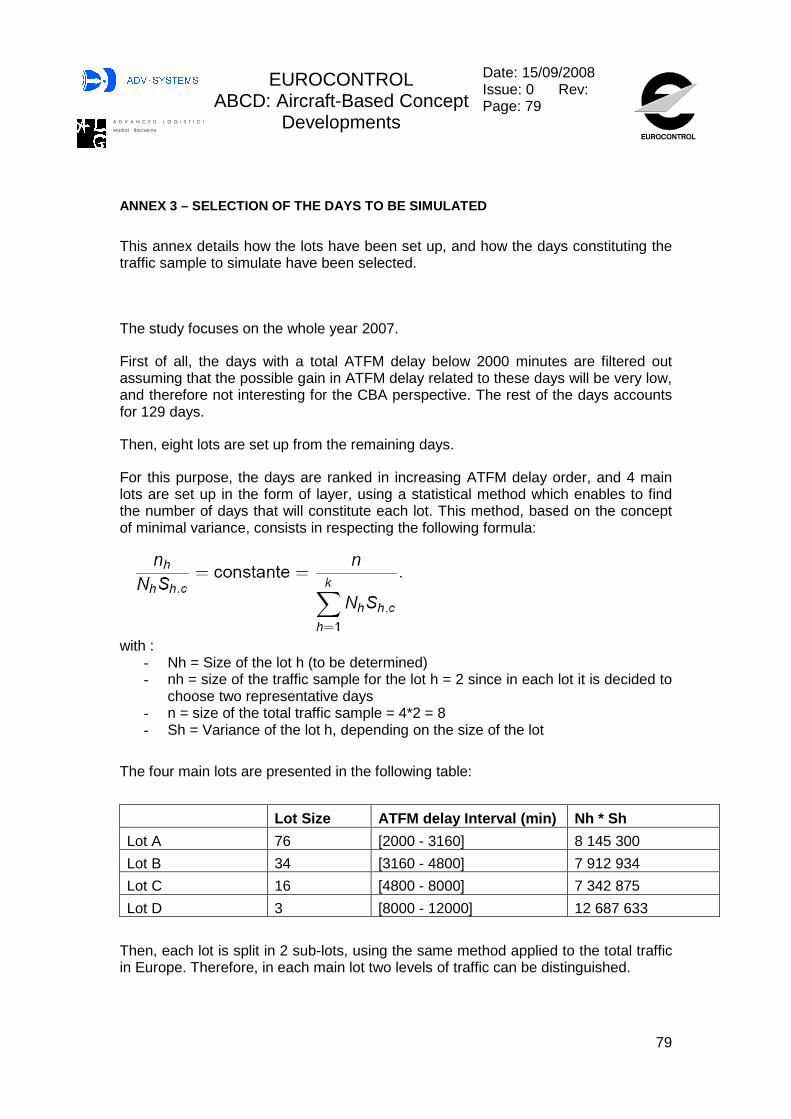
A D V A N C E D L O G I S T I C S G R
Madrid � Barcelona
EUROCONTROL
ABCD: Aircraft-Based Concept Developments
Date: 15/09/2008 Issue: 0 Rev: Page: 79
79
ANNEX 3 – SELECTION OF THE DAYS TO BE SIMULATED
This annex details how the lots have been set up, and how the days constituting the traffic sample to simulate have been selected.
The study focuses on the whole year 2007.
First of all, the days with a total ATFM delay below 2000 minutes are filtered out assuming that the possible gain in ATFM delay related to these days will be very low, and therefore not interesting for the CBA perspective. The rest of the days accounts for 129 days.
Then, eight lots are set up from the remaining days.
For this purpose, the days are ranked in increasing ATFM delay order, and 4 main lots are set up in the form of layer, using a statistical method which enables to find the number of days that will constitute each lot. This method, based on the concept of minimal variance, consists in respecting the following formula:
with :
- Nh = Size of the lot h (to be determined) - nh = size of the traffic sample for the lot h = 2 since in each lot it is decided to
choose two representative days - n = size of the total traffic sample = 4*2 = 8 - Sh = Variance of the lot h, depending on the size of the lot
The four main lots are presented in the following table:
Lot Size ATFM delay Interval (min) Nh * Sh
Lot A 76 [2000 - 3160] 8 145 300
Lot B 34 [3160 - 4800] 7 912 934
Lot C 16 [4800 - 8000] 7 342 875
Lot D 3 [8000 - 12000] 12 687 633
Then, each lot is split in 2 sub-lots, using the same method applied to the total traffic in Europe. Therefore, in each main lot two levels of traffic can be distinguished.

A D V A N C E D L O G I S T I C S G R
Madrid � Barcelona
EUROCONTROL
ABCD: Aircraft-Based Concept Developments
Date: 15/09/2008 Issue: 0 Rev: Page: 80
80
Once the eight lots have been set up, one representative day is chosen in each lot. This representative has to conform the best possible to the mean ATFM delay and mean European traffic of each lot. In addition, given the requirements of the simulations, the eight days have to be selected in only two AIRAC cycles.
The following table provides an overview of the features of the lots, as well as of the days to be simulated
Features of the lots Features of the days to be simulated
ATFM delay Interval (min) for
Airline XXX
Lot
Europe Traffic Interval
(nb of IFR flights)
Lot Size Day
Airline XXX delay
European Traffic
Lot A1 20 000 27 100 23 28/7/07 2479 27016 Category A [2000 - 3160] Lot A2 27 100 32 300 53 18/7/07 2560 30156
Lot B1 20 600 27 700 11 9/6/07 4101 25207 Category B [3160 - 4800] Lot B2 27 700 32 400 23 18/6/07 3735 30833
Lot C1 25 400 28 000 7 30/6/07 5582 26577 Category C [4800 - 8000] Lot C2 29 900 32 000 9 21/6/07 5353 31242
Lot D1 30 700 31 900 2 22/6/07 8171 31137 Category D [8000 - 12000] Lot D2 31000 31000 1 20/7/07 11780 30996

A D V A N C E D L O G I S T I C S G R
Madrid � Barcelona
EUROCONTROL
ABCD: Aircraft-Based Concept Developments
Date: 15/09/2008 Issue: 0 Rev: Page: 81
81
ANNEX 4 – SIMULATIONS RESULTS PER DAY FOR AIRLINE X XX
DLA Anticipation Improvement (min)
20 juillet 2007 (925 flights) 0 10 20 30 45 60 90 120
ATFM delay 13129 11855 10745 10555 10298 10100 9403 9704
ATFM delay (flights with DLA) 5818 4781 3859 3602 3549 3464 3103 3343
ATFM delay (flights without DLA) 7311 7074 6886 6953 6749 6636 6300 6361
ATFM delay per delayed flight 32,6 30,4 28,4 27,8 27,0 26,6 25,8 25,5
ATFM delay per delayed flight (with DLA) 34,2 31,2 25,7 25,5 24,6 24,6 22,8 22,9
ATFM delay per delayed flight (without DLA) 31,4 29,8 30,1 29,1 28,4 27,8 27,5 27,2
ATFM delay which exceeded 15 min 7537 6515 5566 5385 5073 4983 4511 4641
ATFM delay > 15, for flights without DLA 3998 3753 3669 3598 3424 3370 3158 3147
ATFM delay > 15, for flights with DLA 3539 2762 1897 1787 1649 1613 1353 1494
Comparison with Baseline of ATFM delay>15’ (DLA) /// 777 1642 1752 1890 1926 2186 2045
Number of delayed flights 403 390 379 380 382 380 365 380
Number of delayed flights with DLA 170 153 150 141 144 141 136 146
Number of delayed flights without DLA 233 237 229 239 238 239 229 234
SRM messages (All Airline XXX flights) 1582 1585 1610 1551 1551 1486 1408 1284
SRM messages (Airline XXX flights with DLA) 938 958 957 939 898 877 799 671
SLC messages (All Airline XXX flights) 111 109 103 98 97 99 94 86
SLC messages (Airline XXX flights with DLA) 76 73 68 63 63 64 61 53
ATFM delay related to a non-weather reg (mn) 6752 5806 5095 5322 5383 4947 4526 4943
ATFM delay related to a weather reg (mn) 6282 5921 5398 5018 4560 4864 4562 4494
% of XXX flights affected by a non-weather regulation 54,0% 54,1% 53,1% 54,6% 55,8% 54,7% 53,5% 53,7%
% of XXX flights affected by a weather regulation 46,0% 45,9% 46,9% 45,4% 44,2% 45,3% 46,5% 46,3%
DLA Anticipation Improvement (min)
22 juin 2007 (950 flights) 0 10 20 30 45 60 90 120
ATFM delay 7352 7555 7305 7319 6926 6843 6817 6601
ATFM delay (flights with DLA) 2384 2389 2013 2117 1963 1898 1780 1765
ATFM delay (flights without DLA) 4968 5166 5292 5202 4963 4945 5037 4836
ATFM delay per delayed flight 25,4 26,1 25,7 25,5 24,7 23,6 24,2 23,7
ATFM delay per delayed flight (with DLA) 27,7 29,5 26,5 26,1 26,2 23,1 24,4 22,9
ATFM delay per delayed flight (without DLA) 24,4 24,7 25,4 25,3 24,2 23,8 24,1 24,1
ATFM delay which exceeded 15 min 3807 3993 3832 3666 3404 3299 3288 3130
ATFM delay > 15, for flights without DLA 2437 2549 2609 2468 2330 2311 2346 2304
ATFM delay > 15, for flights with DLA 1370 1444 1223 1198 1074 988 942 826
Comparison with Baseline of ATFM delay>15’ (DLA) /// -74 147 172 296 382 428 544
Number of delayed flights 290 290 284 287 280 290 282 278
Number of delayed flights with DLA 86 81 76 81 75 82 73 77
Number of delayed flights without DLA 204 209 208 206 205 208 209 201
SRM messages (All Airline XXX flights) 1043 1013 992 999 1011 949 901 875
SRM messages (Airline XXX flights with DLA) 438 444 423 433 427 388 334 295

A D V A N C E D L O G I S T I C S G R
Madrid � Barcelona
EUROCONTROL
ABCD: Aircraft-Based Concept Developments
Date: 15/09/2008 Issue: 0 Rev: Page: 82
82
SLC messages (All Airline XXX flights) 79 77 75 75 73 76 736 72
SLC messages (Airline XXX flights with DLA) 43 40 39 40 37 39 37 37
ATFM delay related to a non-weather reg (mn) 3560 3678 3376 3438 3270 3304 3084 3096
ATFM delay related to a weather reg (mn) 4044 4148 4186 3940 3789 3773 3811 3597
% of XXX flights affected by a non-weather regulation 59,1% 59,9% 59,4% 59,4% 60,0% 60,4% 59,9% 60,3%
% of XXX flights affected by a weather regulation 40,9% 40,1% 40,6% 40,6% 40,0% 39,6% 40,1% 39,7%
DLA Anticipation Improvement (min)
21 juin 2007 (919 flights) 0 10 20 30 45 60 90 120
ATFM delay 5078 4673 4713 4857 4792 4856 4604 4815
ATFM delay (flights with DLA) 1403 1134 1099 1081 1103 1089 967 1011
ATFM delay (flights without DLA) 3675 3539 3614 3776 3689 3767 3637 3804
ATFM delay per delayed flight 23,1 21,3 21,0 21,9 21,8 22,5 21,1 22,1
ATFM delay per delayed flight (with DLA) 27,5 22,2 23,4 24,6 22,5 21,4 19,7 21,1
ATFM delay per delayed flight (without DLA) 21,7 21,1 20,4 21,2 21,6 22,8 21,5 22,4
ATFM delay which exceeded 15 min 2238 1844 1870 2024 1991 2023 1786 2014
ATFM delay > 15, for flights without DLA 1466 1333 1325 1449 1458 1544 1419 1575
ATFM delay > 15, for flights with DLA 772 511 545 575 533 479 367 439
Comparison with Baseline of ATFM delay>15’ (DLA) 261 227 197 239 293 405 333
Number of delayed flights 220 219 224 222 220 216 218 218
Number of delayed flights with DLA 51 51 47 44 49 51 49 48
Number of delayed flights without DLA 169 168 177 178 171 165 169 170
SRM messages (All Airline XXX flights) 567 560 584 563 547 512 519 506
SRM messages (Airline XXX flights with DLA) 218 206 192 191 181 163 149 140
SLC messages (All Airline XXX flights) 54 55 53 55 50 51 51 49
SLC messages (Airline XXX flights with DLA) 23 23 23 23 21 20 20 18
ATFM delay related to a non-weather reg (mn) 2597 2515 2567 2736 2651 2660 2673 2600
ATFM delay related to a weather reg (mn) 2464 2137 2120 2127 2150 2154 1914 2207
% of XXX flights affected by a non-weather regulation 66,6% 67,7% 67,1% 68,3% 68,0% 68,3% 68,5% 67,4%
% of XXX flights affected by a weather regulation 33,4% 32,3% 32,9% 31,7% 32,0% 31,7% 31,5% 32,6%
DLA Anticipation Improvement (min)
30 juin 2007 (881 flights) 0 10 20 30 45 60 90 120
ATFM delay 4254 4035 4040 3835 3577 3641 3521 3443
ATFM delay (flights with DLA) 1658 1415 1355 1232 1013 1157 975 1026
ATFM delay (flights without DLA) 2596 2620 2685 2603 2564 2484 2546 2417
ATFM delay per delayed flight 17,9 17,5 17,2 16,2 15,8 15,9 15,2 15,7
ATFM delay per delayed flight (with DLA) 22,1 20,2 18,3 16,2 14,7 16,5 14,6 15,5
ATFM delay per delayed flight (without DLA) 16,0 16,4 16,7 16,2 16,2 15,6 15,5 15,7
ATFM delay which exceeded 15 min 1342 1217 1226 1082 908 994 857 840
ATFM delay > 15, for flights without DLA 638 682 753 708 679 650 641 612
ATFM delay > 15, for flights with DLA 704 535 473 374 229 344 216 228
Comparison with Baseline of ATFM delay>15’ (DLA) /// 169 231 330 475 360 488 476
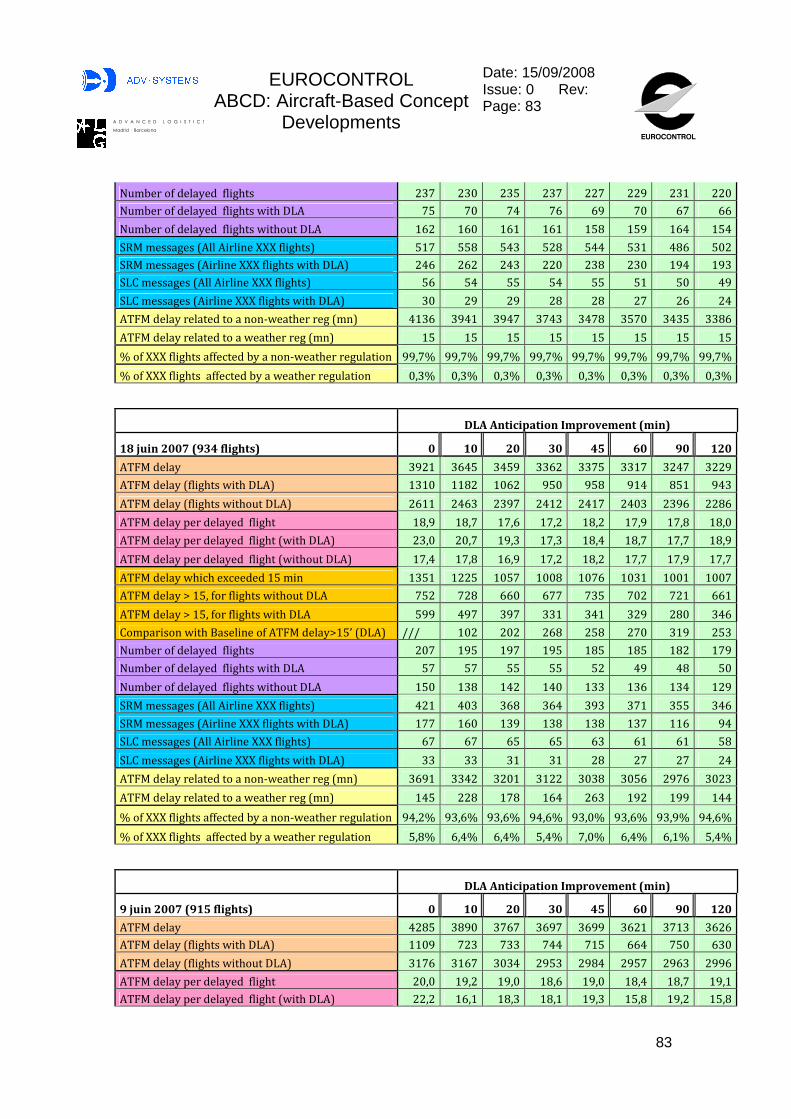
A D V A N C E D L O G I S T I C S G R
Madrid � Barcelona
EUROCONTROL
ABCD: Aircraft-Based Concept Developments
Date: 15/09/2008 Issue: 0 Rev: Page: 83
83
Number of delayed flights 237 230 235 237 227 229 231 220
Number of delayed flights with DLA 75 70 74 76 69 70 67 66
Number of delayed flights without DLA 162 160 161 161 158 159 164 154
SRM messages (All Airline XXX flights) 517 558 543 528 544 531 486 502
SRM messages (Airline XXX flights with DLA) 246 262 243 220 238 230 194 193
SLC messages (All Airline XXX flights) 56 54 55 54 55 51 50 49
SLC messages (Airline XXX flights with DLA) 30 29 29 28 28 27 26 24
ATFM delay related to a non-weather reg (mn) 4136 3941 3947 3743 3478 3570 3435 3386
ATFM delay related to a weather reg (mn) 15 15 15 15 15 15 15 15
% of XXX flights affected by a non-weather regulation 99,7% 99,7% 99,7% 99,7% 99,7% 99,7% 99,7% 99,7%
% of XXX flights affected by a weather regulation 0,3% 0,3% 0,3% 0,3% 0,3% 0,3% 0,3% 0,3%
DLA Anticipation Improvement (min)
18 juin 2007 (934 flights) 0 10 20 30 45 60 90 120
ATFM delay 3921 3645 3459 3362 3375 3317 3247 3229
ATFM delay (flights with DLA) 1310 1182 1062 950 958 914 851 943
ATFM delay (flights without DLA) 2611 2463 2397 2412 2417 2403 2396 2286
ATFM delay per delayed flight 18,9 18,7 17,6 17,2 18,2 17,9 17,8 18,0
ATFM delay per delayed flight (with DLA) 23,0 20,7 19,3 17,3 18,4 18,7 17,7 18,9
ATFM delay per delayed flight (without DLA) 17,4 17,8 16,9 17,2 18,2 17,7 17,9 17,7
ATFM delay which exceeded 15 min 1351 1225 1057 1008 1076 1031 1001 1007
ATFM delay > 15, for flights without DLA 752 728 660 677 735 702 721 661
ATFM delay > 15, for flights with DLA 599 497 397 331 341 329 280 346
Comparison with Baseline of ATFM delay>15’ (DLA) /// 102 202 268 258 270 319 253
Number of delayed flights 207 195 197 195 185 185 182 179
Number of delayed flights with DLA 57 57 55 55 52 49 48 50
Number of delayed flights without DLA 150 138 142 140 133 136 134 129
SRM messages (All Airline XXX flights) 421 403 368 364 393 371 355 346
SRM messages (Airline XXX flights with DLA) 177 160 139 138 138 137 116 94
SLC messages (All Airline XXX flights) 67 67 65 65 63 61 61 58
SLC messages (Airline XXX flights with DLA) 33 33 31 31 28 27 27 24
ATFM delay related to a non-weather reg (mn) 3691 3342 3201 3122 3038 3056 2976 3023
ATFM delay related to a weather reg (mn) 145 228 178 164 263 192 199 144
% of XXX flights affected by a non-weather regulation 94,2% 93,6% 93,6% 94,6% 93,0% 93,6% 93,9% 94,6%
% of XXX flights affected by a weather regulation 5,8% 6,4% 6,4% 5,4% 7,0% 6,4% 6,1% 5,4%
DLA Anticipation Improvement (min)
9 juin 2007 (915 flights) 0 10 20 30 45 60 90 120
ATFM delay 4285 3890 3767 3697 3699 3621 3713 3626
ATFM delay (flights with DLA) 1109 723 733 744 715 664 750 630
ATFM delay (flights without DLA) 3176 3167 3034 2953 2984 2957 2963 2996
ATFM delay per delayed flight 20,0 19,2 19,0 18,6 19,0 18,4 18,7 19,1
ATFM delay per delayed flight (with DLA) 22,2 16,1 18,3 18,1 19,3 15,8 19,2 15,8
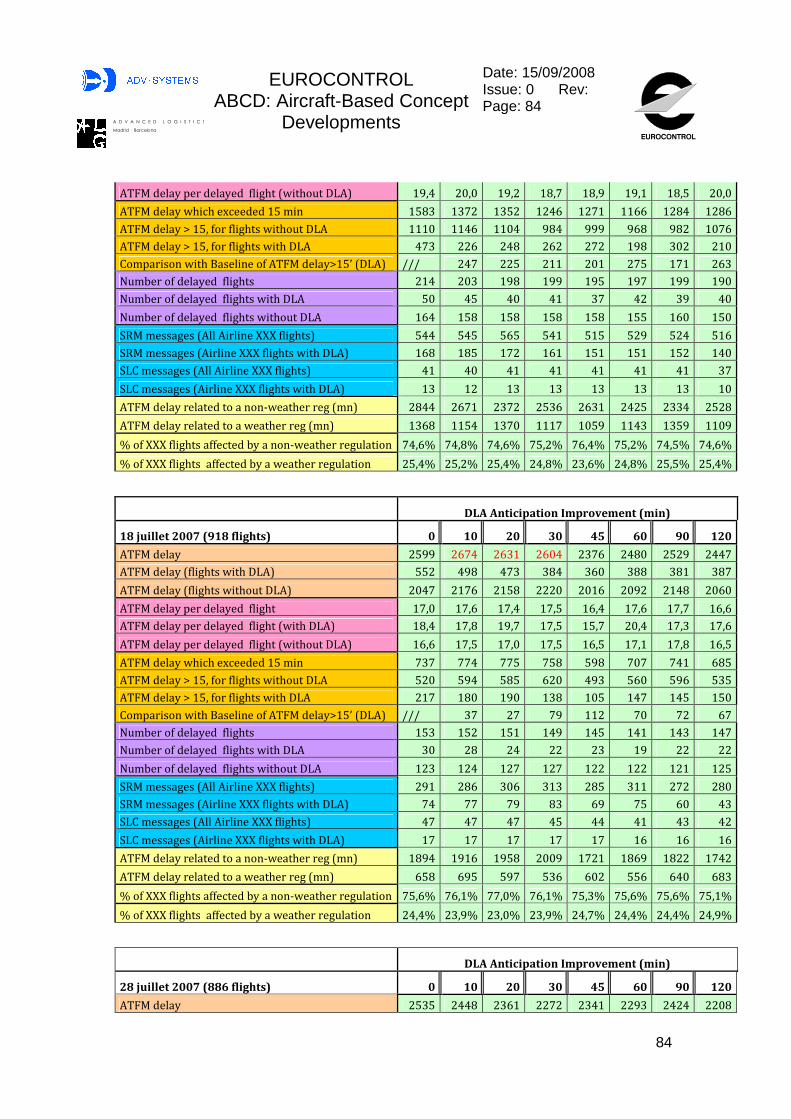
A D V A N C E D L O G I S T I C S G R
Madrid � Barcelona
EUROCONTROL
ABCD: Aircraft-Based Concept Developments
Date: 15/09/2008 Issue: 0 Rev: Page: 84
84
ATFM delay per delayed flight (without DLA) 19,4 20,0 19,2 18,7 18,9 19,1 18,5 20,0
ATFM delay which exceeded 15 min 1583 1372 1352 1246 1271 1166 1284 1286
ATFM delay > 15, for flights without DLA 1110 1146 1104 984 999 968 982 1076
ATFM delay > 15, for flights with DLA 473 226 248 262 272 198 302 210
Comparison with Baseline of ATFM delay>15’ (DLA) /// 247 225 211 201 275 171 263
Number of delayed flights 214 203 198 199 195 197 199 190
Number of delayed flights with DLA 50 45 40 41 37 42 39 40
Number of delayed flights without DLA 164 158 158 158 158 155 160 150
SRM messages (All Airline XXX flights) 544 545 565 541 515 529 524 516
SRM messages (Airline XXX flights with DLA) 168 185 172 161 151 151 152 140
SLC messages (All Airline XXX flights) 41 40 41 41 41 41 41 37
SLC messages (Airline XXX flights with DLA) 13 12 13 13 13 13 13 10
ATFM delay related to a non-weather reg (mn) 2844 2671 2372 2536 2631 2425 2334 2528
ATFM delay related to a weather reg (mn) 1368 1154 1370 1117 1059 1143 1359 1109
% of XXX flights affected by a non-weather regulation 74,6% 74,8% 74,6% 75,2% 76,4% 75,2% 74,5% 74,6%
% of XXX flights affected by a weather regulation 25,4% 25,2% 25,4% 24,8% 23,6% 24,8% 25,5% 25,4%
DLA Anticipation Improvement (min)
18 juillet 2007 (918 flights) 0 10 20 30 45 60 90 120
ATFM delay 2599 2674 2631 2604 2376 2480 2529 2447
ATFM delay (flights with DLA) 552 498 473 384 360 388 381 387
ATFM delay (flights without DLA) 2047 2176 2158 2220 2016 2092 2148 2060
ATFM delay per delayed flight 17,0 17,6 17,4 17,5 16,4 17,6 17,7 16,6
ATFM delay per delayed flight (with DLA) 18,4 17,8 19,7 17,5 15,7 20,4 17,3 17,6
ATFM delay per delayed flight (without DLA) 16,6 17,5 17,0 17,5 16,5 17,1 17,8 16,5
ATFM delay which exceeded 15 min 737 774 775 758 598 707 741 685
ATFM delay > 15, for flights without DLA 520 594 585 620 493 560 596 535
ATFM delay > 15, for flights with DLA 217 180 190 138 105 147 145 150
Comparison with Baseline of ATFM delay>15’ (DLA) /// 37 27 79 112 70 72 67
Number of delayed flights 153 152 151 149 145 141 143 147
Number of delayed flights with DLA 30 28 24 22 23 19 22 22
Number of delayed flights without DLA 123 124 127 127 122 122 121 125
SRM messages (All Airline XXX flights) 291 286 306 313 285 311 272 280
SRM messages (Airline XXX flights with DLA) 74 77 79 83 69 75 60 43
SLC messages (All Airline XXX flights) 47 47 47 45 44 41 43 42
SLC messages (Airline XXX flights with DLA) 17 17 17 17 17 16 16 16
ATFM delay related to a non-weather reg (mn) 1894 1916 1958 2009 1721 1869 1822 1742
ATFM delay related to a weather reg (mn) 658 695 597 536 602 556 640 683
% of XXX flights affected by a non-weather regulation 75,6% 76,1% 77,0% 76,1% 75,3% 75,6% 75,6% 75,1%
% of XXX flights affected by a weather regulation 24,4% 23,9% 23,0% 23,9% 24,7% 24,4% 24,4% 24,9%
DLA Anticipation Improvement (min)
28 juillet 2007 (886 flights) 0 10 20 30 45 60 90 120
ATFM delay 2535 2448 2361 2272 2341 2293 2424 2208

A D V A N C E D L O G I S T I C S G R
Madrid � Barcelona
EUROCONTROL
ABCD: Aircraft-Based Concept Developments
Date: 15/09/2008 Issue: 0 Rev: Page: 85
85
ATFM delay (flights with DLA) 449 441 389 289 275 267 313 315
ATFM delay (flights without DLA) 2086 2007 1972 1983 2066 2026 2111 1893
ATFM delay per delayed flight 19,7 18,5 18,2 17,8 17,7 17,1 18,6 17,4
ATFM delay per delayed flight (with DLA) 21,4 22,1 18,5 15,2 12,0 12,1 13,6 13,1
ATFM delay per delayed flight (without DLA) 19,3 17,9 18,1 18,2 19,0 18,1 19,7 18,4
ATFM delay which exceeded 15 min 907 809 778 693 758 715 793 691
ATFM delay > 15, for flights without DLA 677 613 623 596 708 650 725 615
ATFM delay > 15, for flights with DLA 230 196 155 97 50 65 68 76
Comparison with Baseline of ATFM delay>15’ (DLA) /// 34 75 133 180 165 162 154
Number of delayed flights 129 132 130 128 132 134 130 127
Number of delayed flights with DLA 21 20 21 19 23 22 23 24
Number of delayed flights without DLA 108 112 109 109 109 112 107 103
SRM messages (All Airline XXX flights) 369 383 375 388 369 344 353 338
SRM messages (Airline XXX flights with DLA) 135 124 129 138 115 112 106 86
SLC messages (All Airline XXX flights) 46 42 41 40 40 39 38 36
SLC messages (Airline XXX flights with DLA) 23 20 19 18 18 17 16 14
ATFM delay related to a non-weather reg (mn) 2511 2373 2265 2191 2246 2206 2315 2141
ATFM delay related to a weather reg (mn) 43 42 39 37 49 38 40 48
% of XXX flights affected by a non-weather regulation 96,8% 96,8% 96,8% 96,8% 96,8% 96,8% 96,8% 96,8%
% of XXX flights affected by a weather regulation 3,2% 3,2% 3,2% 3,2% 3,2% 3,2% 3,2% 3,2%

A D V A N C E D L O G I S T I C S G R
Madrid � Barcelona
EUROCONTROL
ABCD: Aircraft-Based Concept Developments
Date: 15/09/2008 Issue: 0 Rev: Page: 86
86
ANNEX 5 – ATFM DELAY > 15’ (FLIGHTS WITH / WITHOUT DLA)
This annex intends to illustrate the impact of the anticipation scenarios on the total ATFM delay greater than 15 minutes, by making the distinction between flights with DLA, and flights without. The curves represent the 6 days of the sample with the lowest ATFM delay.
ATFM delay > 15', flights with DLA
0
100
200
300
400
500
600
700
800
0 20 40 60 80 100 120
Shift in DLA timestamp (message anticipation impro vement)
21/06/07
30/06/07
18/06/07
09/06/07
18/07/07
28/07/07
Figure 15 : ATFM delay > 15’ for flight with DLA vs . delay messages anticipation, focusing on 6
days

A D V A N C E D L O G I S T I C S G R
Madrid � Barcelona
EUROCONTROL
ABCD: Aircraft-Based Concept Developments
Date: 15/09/2008 Issue: 0 Rev: Page: 87
87
ATFM delay > 15', flights without DLA
0
200
400
600
800
1000
1200
1400
1600
1800
0 20 40 60 80 100 120
21/06/07
30/06/07
18/06/07
09/06/07
18/07/07
28/07/07
Figure 16 : ATFM delay > 15’ for flight without DLA vs. delay messages anticipation, focusing on
6 days

A D V A N C E D L O G I S T I C S G R
Madrid � Barcelona
EUROCONTROL
ABCD: Aircraft-Based Concept Developments
Date: 15/09/2008 Issue: 0 Rev: Page: 88
88
ANNEX 6 – ATFM DELAY FOR THE SET OF THE AIRLINES EX CEPT AIRLINE XXX
This annex presents some results derived from the simulations. Focusing on the total ATFM delay in ECAC area minus the Airline XXX ATFM delay, it shows how this parameter is impacted by a better anticipation of DLA messages.
Table 14 provides for each day of traffic the relative variation of this parameter – the total European ATFM delay excluding Airline XXX ATFM delay – with respect to the baseline scenario.
Those results are also illustrated by
-4,00%
-3,00%
-2,00%
-1,00%
0,00%
1,00%
2,00%
3,00%
0 20 40 60 80 100 120
Shift in DLA timestamp (message anticipation improv ement)
varia
tion
of th
e to
tal A
TF
M d
elay
(ex
cept
for
Airl
ine
XX
X fl
igh
ts)
20-juil-07
22-juin-07
21-juin-07
30-juin-07
18-juin-07
09-juin-07
18-juil-07
28-juil-07
Figure 17.
Relative variation 10 20 30 45 60 90 120
28/07/07 1,58% 0,00% -0,39% -1,23% 1,32% 1,98% 0,86% 18/07/07 1,42% 1,18% 0,61% -1,02% -1,59% -1,02% 0,10% 09/06/07 -1,30% -1,83% -1,76% -1,87% -0,41% -1,60% -0,87% 18/06/07 -2,15% -1,30% -1,47% -0,12% -1,33% -2,11% -1,67% 30/06/07 -0,38% 0,32% -1,02% -1,07% -0,52% -1,24% -2,03% 21/06/07 -0,69% -1,25% -0,24% 0,41% -1,09% 0,06% -0,76% 22/06/07 0,55% 0,74% 0,04% 0,08% -0,13% -0,57% -0,51% 20/07/07 -0,71% -1,06% -1,02% -2,56% -2,95% -3,32% -2,67%
Table 14 : Relative variation with respect to the B L of the total ATFM delay (ATFM delay of Airline XXX excluded)

A D V A N C E D L O G I S T I C S G R
Madrid � Barcelona
EUROCONTROL
ABCD: Aircraft-Based Concept Developments
Date: 15/09/2008 Issue: 0 Rev: Page: 89
89
-4,00%
-3,00%
-2,00%
-1,00%
0,00%
1,00%
2,00%
3,00%
0 20 40 60 80 100 120
Shift in DLA timestamp (message anticipation improv ement)
varia
tion
of th
e to
tal A
TF
M d
elay
(ex
cept
for
Airl
ine
XX
X fl
igh
ts)
20-juil-07
22-juin-07
21-juin-07
30-juin-07
18-juin-07
09-juin-07
18-juil-07
28-juil-07
Figure 17 : Relative variation with respect to the BL of the total ATFM delay (ATFM delay of Airline XXX excluded)
For most of the values, the relative variation is negative. In the cases of positive relative variation, the variation is limited, and do not exceed 2%. It has also to be stressed that the negative variation is often, in absolute value, greater than the positive one. In addition, for a shift in DLA timestamp greater than 45 minutes, the European ATFM delay (excluding ATFM delay of Airline XXX) is reduced with respect to the Baseline case for nearly all the days simulated (except for the 28/07).

A D V A N C E D L O G I S T I C S G R
Madrid � Barcelona
EUROCONTROL
ABCD: Aircraft-Based Concept Developments
Date: 15/09/2008 Issue: 0 Rev: Page: 90
90
ANNEX 7 – METHODOLOGY FOR DETERMINING ABCD USE RATE
This annex presents the methodology used to perform the work upstream the simulations: it explains how to find on the one hand the delay messages that could have been better anticipated thanks to ABCD, and on the other hand the corresponding shift in the anticipation.
It is assumed that the linkage between flights executed by the same aircraft is known.
It is assumed that the minimum Turn Around Time at each airport of operations is known for the different aircraft types.
The following method is applied:
An aircraft could have notified its delay earlier thanks to ABCD if the following criteria are satisfied:
1) At least one DLA message has been sent for the flight N (from the ALL-FT)
2) At least one flight (N-1) is prior to the flight in question (from the linkage)
3) A reactionary delay is incurred by flight N due to flight N-1, which would have been detected by ABCD:
The methodology used in step 3 relies on the specif ications currently defined for ABCD:
As ABCD updates its database and warns the AO staff for a new EOBT thanks to messages issued from the previous a/c, the sequence of messages sent or received by the AO for the previous flight (N-1) has to be analysed (from the OPLOG). Only the following messages are taken into account: DLA, CHG, CNL followed by FPL, SAM, SRM, SLC, FUM, DEP and ARR, when available to the AO.
� Each message enables calculating a predicted arrival time for the flight N-1.
For example, if a SAM or SRM is received by the airline, the predicted arrival time is equal to the CTOT contained in the message plus the flight time. If a DLA or CHG is sent by the airline, the predicted arrival time is equal to the EOBT contained in the message plus the taxi-time plus the flight time.
� The earliest possible off block time for the a/c N is then calculated thanks to the predicted arrival time previously computed and the Minimum Turn Around Time.
� Case 1: the flight N is not regulated. The earliest possible off block time is compared to the existing EOBT (+ or – 15 minutes, the tolerance margin). If greater, then the flight is likely to miss its EOBT.
� Case 2: the flight N is regulated. The earliest possible off block time plus the taxi time is compared to the CTOT (with the tolerance window -5, + 10 minutes). If greater, then the flight is likely to miss its EOBT / CTOT.

A D V A N C E D L O G I S T I C S G R
Madrid � Barcelona
EUROCONTROL
ABCD: Aircraft-Based Concept Developments
Date: 15/09/2008 Issue: 0 Rev: Page: 91
91
These comparisons are valid from the time EOBT (of the flight N) minus 2h15 (confidence interval of ABCD) and remain valid until a new message is sent or received by the AO for the flight N-1.
If a SAM or SRM (related to flight N-1) is responsible of a non-respect of the departure time of the flight N, as there are still possibilities of improvement, the comparison is valid only if the slot is frozen, that is to say 30 minutes before the CTOT of the flight N.
If the flight is likely to miss its EOBT / CTOT and if the comparison is valid, then a reactionary delay is detected at this time.
4) The DLA message sent for the flight N is due to the reactionary delay detected in step 3:
The EOBT of the DLA (flight N) is compared to the earliest possible off block time (flight N) computed in step 3, and if the interval time is greater than 15 minutes, then it is assumed that the delay message has not been sent only because of the reactionary delay.
5) The DLA could have been better anticipated :
The timestamp of the actual DLA is compared to the time when ABCD could have identified a reactionary delay and proposed a new EOBT.
It corresponds to the anticipation improvement on DLA messages due to ABCD, that will be specified in the following simulations scenario.

A D V A N C E D L O G I S T I C S G R
Madrid � Barcelona
EUROCONTROL
ABCD: Aircraft-Based Concept Developments
Date: 15/09/2008 Issue: 0 Rev: Page: 92
92
END OF DOCUMENTEND OF DOCUMENTEND OF DOCUMENTEND OF DOCUMENT