abb: managing for growth and cost john fox, vp of ir tatyana
TRANSCRIPT

© ABB Group March 20, 2012 | Slide 1
ABB: Managing for growth and costJohn Fox, VP of IRTatyana Dubina, Junior Manager of IR
Frankfurt, HSBC Conference on March 22, 2012
© ABB Group March 20, 2012 | Slide 2
Safe-harbor statement
This presentation includes forward-looking information and statements including statements concerning the outlook for our businesses. These statements are based on current expectations, estimates and projections about the factors that may affect our future performance, including global economic conditions, and the economic conditions of the regions and industries that are major markets for ABB Ltd. These expectations, estimates and projections are generally identifiable by statements containing words such as “expects,” “believes,”“estimates,” “targets,” “plans” or similar expressions. However, there are many risks and uncertainties, many of which are beyond our control, that could cause our actual results to differ materially from the forward-looking information and statements made in this press release and which could affect our ability to achieve any or all of our stated targets. The important factors that could cause such differences include, among others, business risks related to the economic environment, costs associated with compliance activities, the amount of revenues we are able to generate from backlog and orders received, raw materials prices, market acceptance of new products and services, changes in governmental regulations and currency exchange rates and such other factors as may be discussed from time to time in ABB Ltd’s filings with the U.S. Securities and Exchange Commission, including its Annual Reports on Form 20-F. Although ABB Ltd believes that its expectations reflected in any such forward-looking statement are based upon reasonable assumptions, it can give no assurance that those expectations will be achieved.
© ABB Group March 20, 2012 | Slide 3
Introduction to ABB
© ABB Group March 20, 2012 | Slide 4
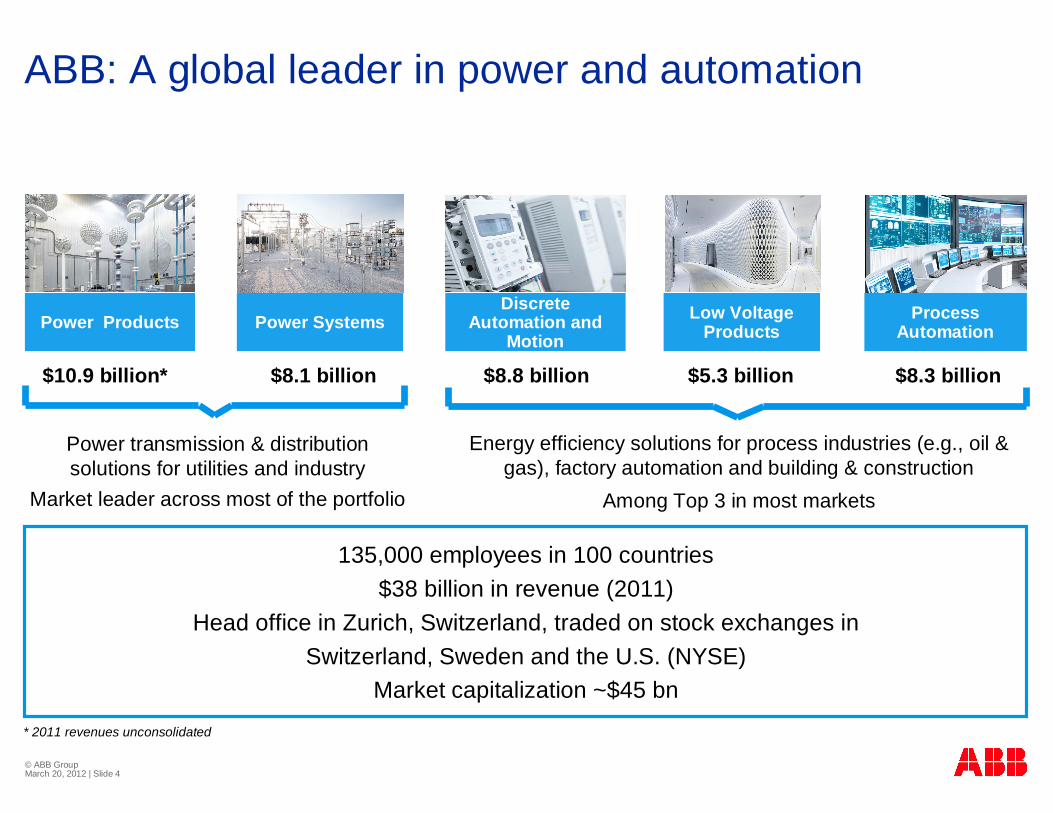
ABB: A global leader in power and automation
Power Products Power SystemsDiscrete
Automation and Motion
Process Automation
$10.9 billion* $8.1 billion $8.8 billion $8.3 billion
Low Voltage Products
$5.3 billion
* 2011 revenues unconsolidated
135,000 employees in 100 countries$38 billion in revenue (2011)
Head office in Zurich, Switzerland, traded on stock exchanges inSwitzerland, Sweden and the U.S. (NYSE)
Market capitalization ~$45 bn
Power transmission & distribution solutions for utilities and industry
Market leader across most of the portfolio
Energy efficiency solutions for process industries (e.g., oil & gas), factory automation and building & construction
Among Top 3 in most markets
© ABB Group March 20, 2012 | Slide 5
38%
24%
27%
11%
26%
20%21%
13%
20%
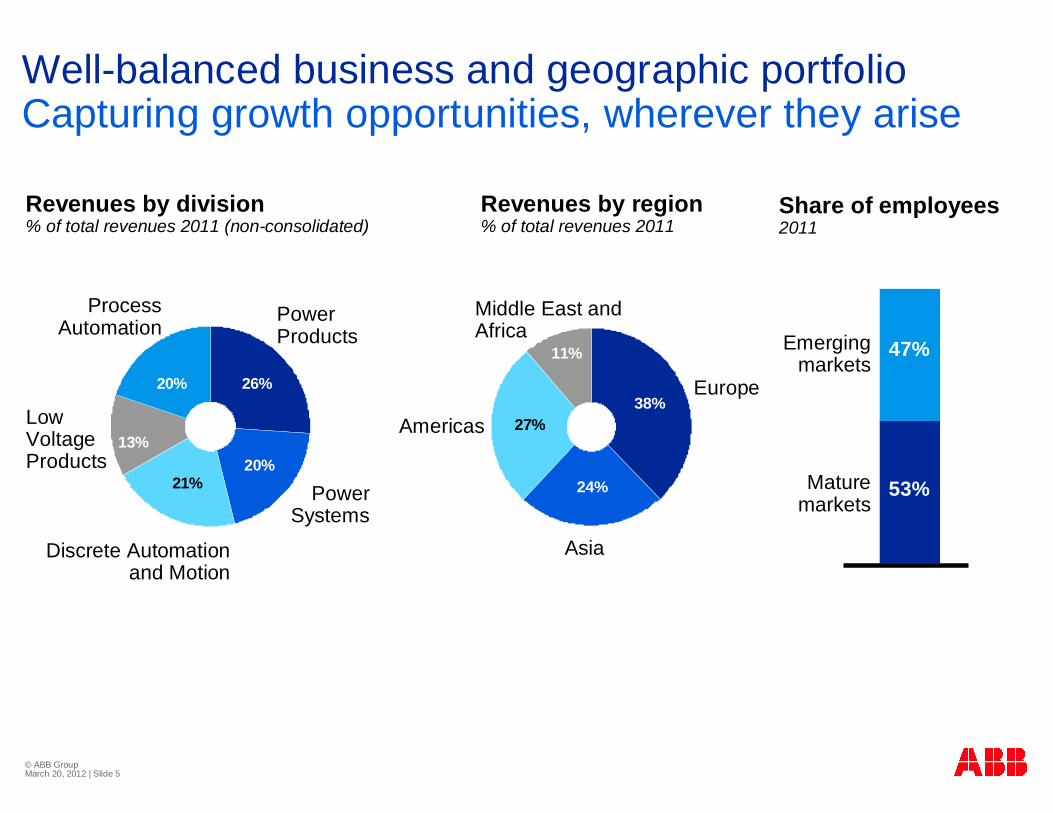
Revenues by division% of total revenues 2011 (non-consolidated)
Revenues by region% of total revenues 2011
Power Systems
Discrete Automation and Motion
Europe
Asia
Americas
Middle East and Africa
Well-balanced business and geographic portfolioCapturing growth opportunities, wherever they arise
Share of employees2011
47%
Mature markets
Emerging markets
Power Products
Process Automation
Low Voltage Products
53%
© ABB Group March 20, 2012 | Slide 6
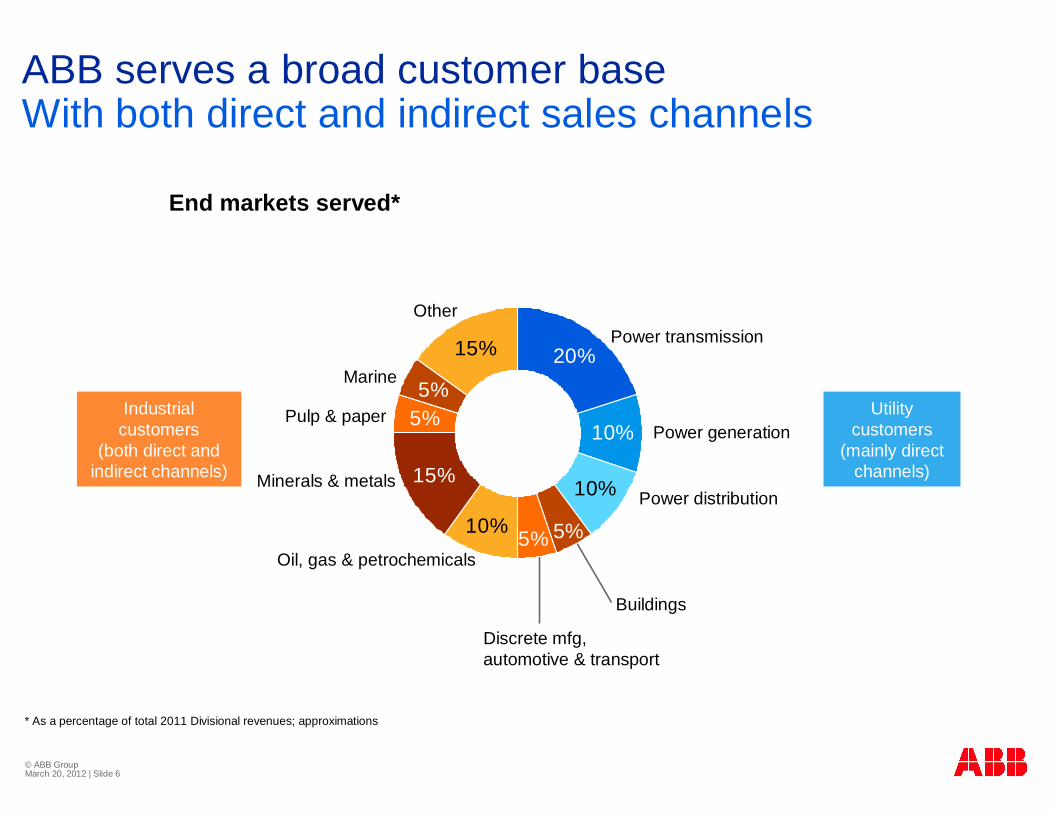
ABB serves a broad customer baseWith both direct and indirect sales channels
* As a percentage of total 2011 Divisional revenues; approximations
End markets served*
10%
15%
5%
10%
15%
20%
5%
5%5%10%
Power generation
Power distribution
Power transmission
Discrete mfg,automotive & transport
Buildings
Oil, gas & petrochemicals
Minerals & metals
Pulp & paper
Marine
Other
Utility customers
(mainly direct channels)
Industrial customers
(both direct and indirect channels)
© ABB Group March 20, 2012 | Slide 7
Priorities for 2012 and beyond
© ABB Group March 20, 2012 | Slide 8
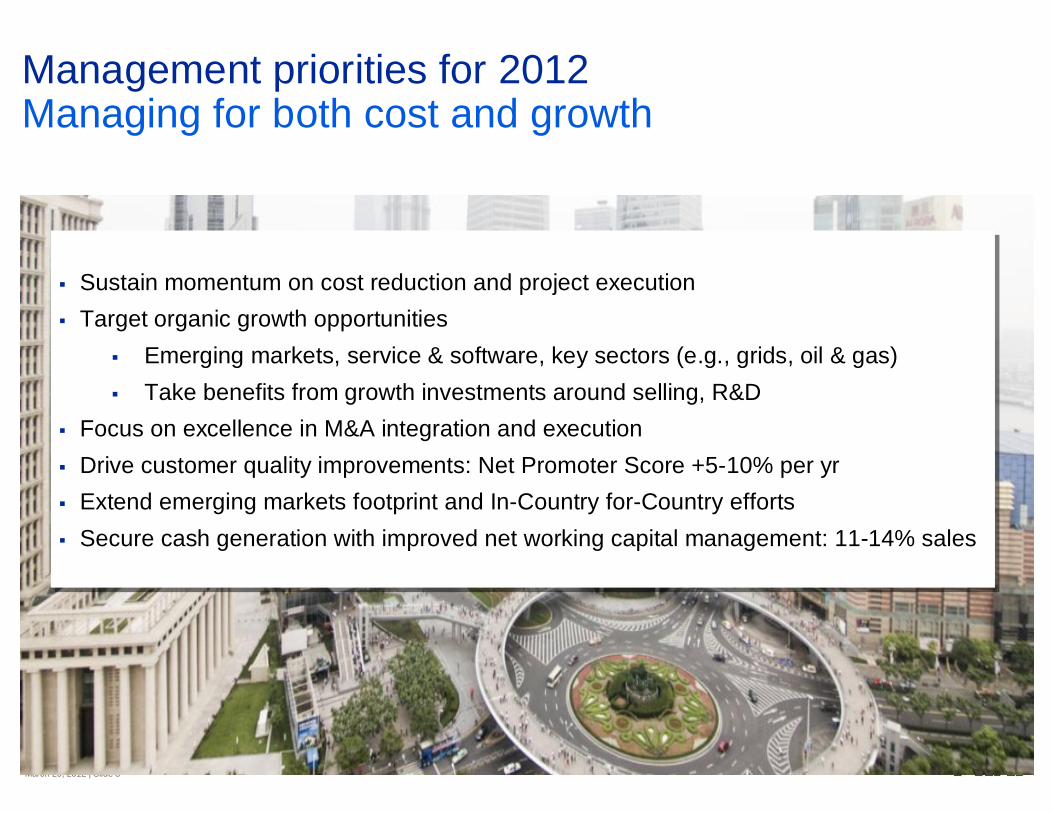
Management priorities for 2012Managing for both cost and growth
Sustain momentum on cost reduction and project executionTarget organic growth opportunities
Emerging markets, service & software, key sectors (e.g., grids, oil & gas)Take benefits from growth investments around selling, R&D
Focus on excellence in M&A integration and executionDrive customer quality improvements: Net Promoter Score +5-10% per yrExtend emerging markets footprint and In-Country for-Country effortsSecure cash generation with improved net working capital management: 11-14% sales
© ABB Group March 20, 2012 | Slide 9
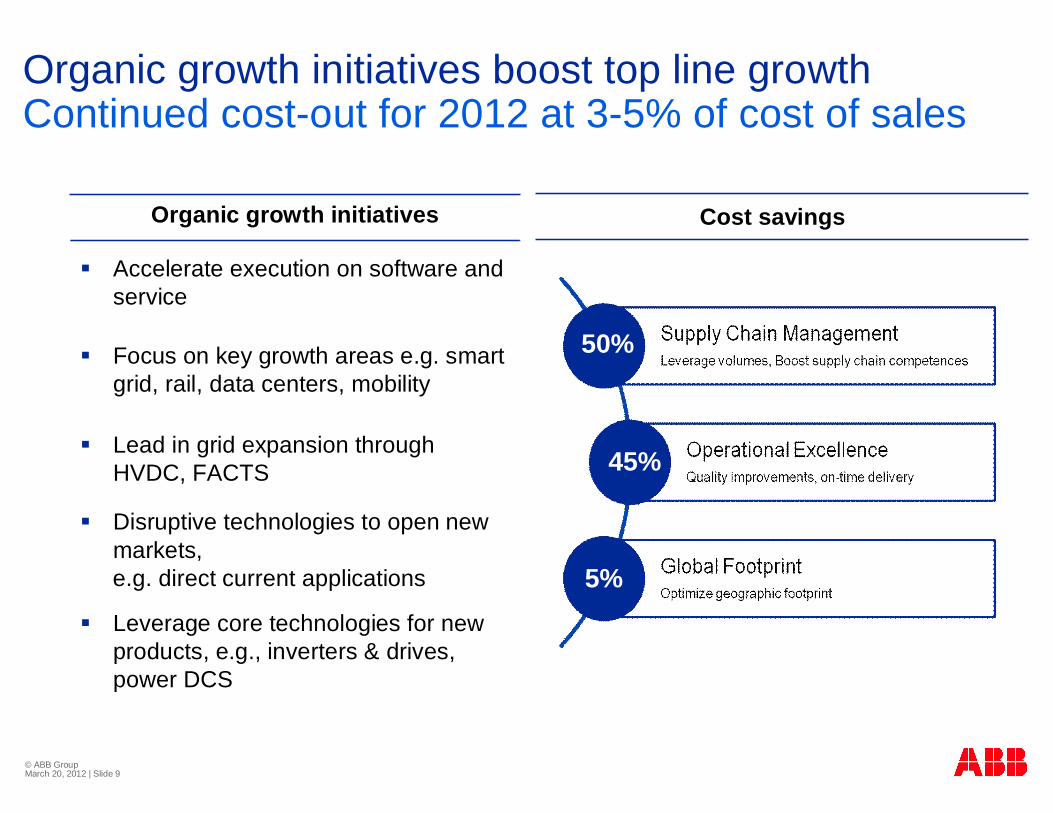
Organic growth initiatives boost top line growthContinued cost-out for 2012 at 3-5% of cost of sales
Organic growth initiatives
Accelerate execution on software and service
Focus on key growth areas e.g. smart grid, rail, data centers, mobility
Lead in grid expansion through HVDC, FACTS
Disruptive technologies to open new markets, e.g. direct current applications
Leverage core technologies for new products, e.g., inverters & drives, power DCS
50%
45%
5%
Cost savings

© ABB Group March 20, 2012 | Slide 10
Technology to remain a key focus in 2012Localized R&D, new products for new markets
R&D where the customers are:Faster to market, better match to customer needs
R&D employees in emerging markets% total R&D employees
Annual R&D spend as % of sales
EV fast-charger
GIS type ELK-14
2009 2010 2011 2015F
4.0%3.6%3.4%3.3%
2009 2010 2011 2015F
50%
27%26%25%
Emerging markets
Target R&D spend 4% of revenues by 2015—key to sustained competitiveness
Examples of new products launched in 2011
Space saver for high-voltage substationsHighly modular, easy to customize
Operating in Europe, AsiaFull charge <30 mins.Software connectivity to grid
New generation DCS upgrade for installed baseWidely used in power and water applications
Symphony DCS
Door entry systemsResidential/commercial, indoor/outdoorModular design for network configuration
© ABB Group March 20, 2012 | Slide 11
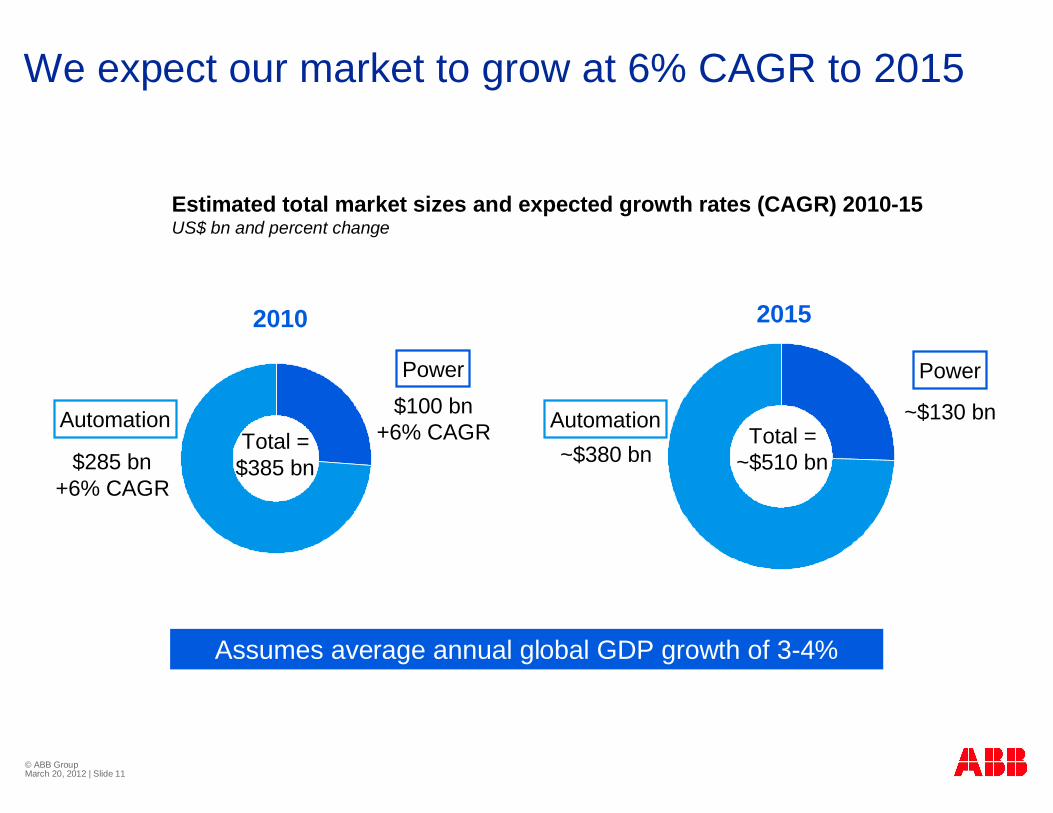
We expect our market to grow at 6% CAGR to 2015
Total =$385 bn
Power
Automation $100 bn+6% CAGR
$285 bn+6% CAGR
Estimated total market sizes and expected growth rates (CAGR) 2010-15US$ bn and percent change
Assumes average annual global GDP growth of 3-4%
Total =~$510 bn
Power
Automation ~$130 bn
~$380 bn
2010 2015
© ABB Group March 20, 2012 | Slide 12
© ABB Group March 20, 2012 | Slide 12
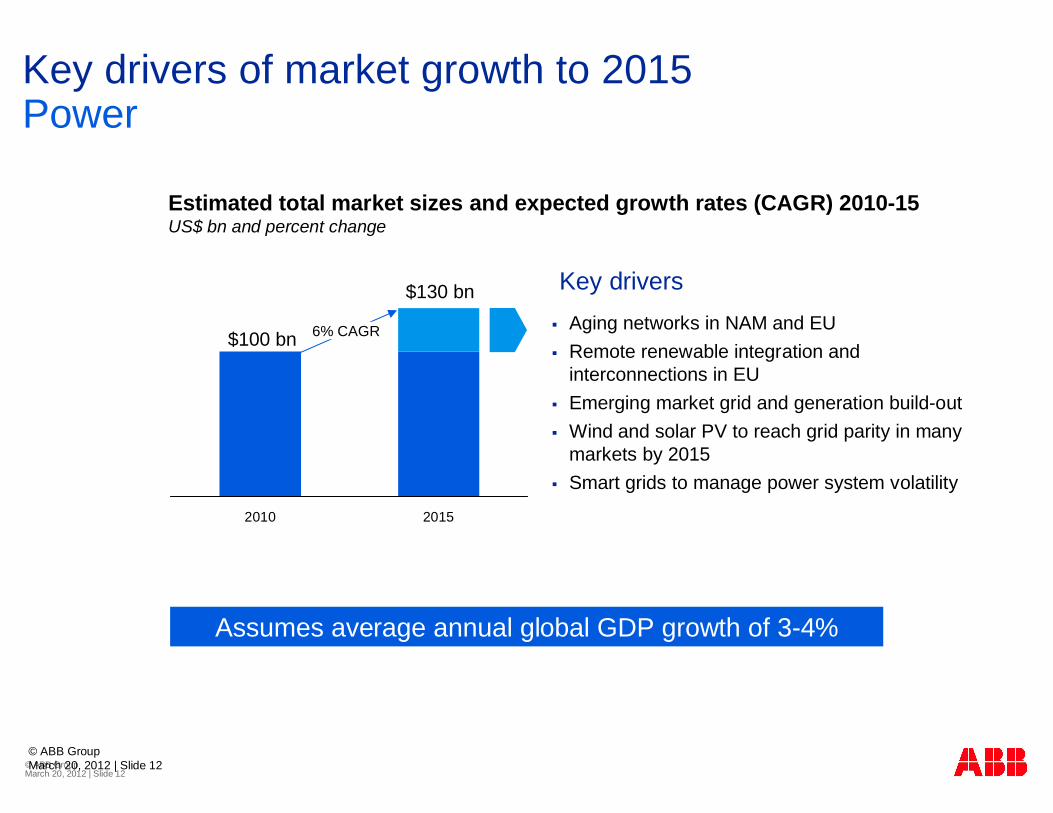
Key drivers of market growth to 2015Power
2010 2015
$100 bn
Estimated total market sizes and expected growth rates (CAGR) 2010-15US$ bn and percent change
Assumes average annual global GDP growth of 3-4%
$130 bn
6% CAGR Aging networks in NAM and EURemote renewable integration and interconnections in EUEmerging market grid and generation build-outWind and solar PV to reach grid parity in many markets by 2015Smart grids to manage power system volatility
Key drivers

© ABB Group March 20, 2012 | Slide 13
© ABB Group March 20, 2012 | Slide 13
Key drivers of market growth to 2015Automation
2010 2015
$285 bn
Estimated total market sizes and expected growth rates (CAGR) 2010-15US$ bn and percent change
$380 bn
6% CAGREnergy efficiencyCommodity demandUse of energy (oil & gas)Factory automationTransportation and mobility
Key drivers
Assumes average annual global GDP growth of 3-4%

© ABB Group March 20, 2012 | Slide 14
Growth areas: Geography, products, services
Power Products
Power Systems
Discrete Automation & Motion
Low Voltage Products
Process Automation
ABB Divisions Geography Products
Asia exportEmerging demand
New GIS designsDry transformersLP footprint design
AmericasSouth Asia, MEA
Systems data centerBuilding control (KNX)Wire devices
AmericasEmerging regions
HVDC, FACTSGrids
AmericasAsia, MEAEurope
Inverters / motionPower electronicsPLCs / control
Emerging areas Software devicesElectrical mechanical
Service
RefurbishmentSoftware Monitoring & uptime
Parts & upgradesRetrofits
Parts & upgradesMonitoring and efficiency
Parts & upgradesLife-cycle serviceEnergy appraisals
SoftwareEnergy efficiency
© ABB Group March 20, 2012 | Slide 15
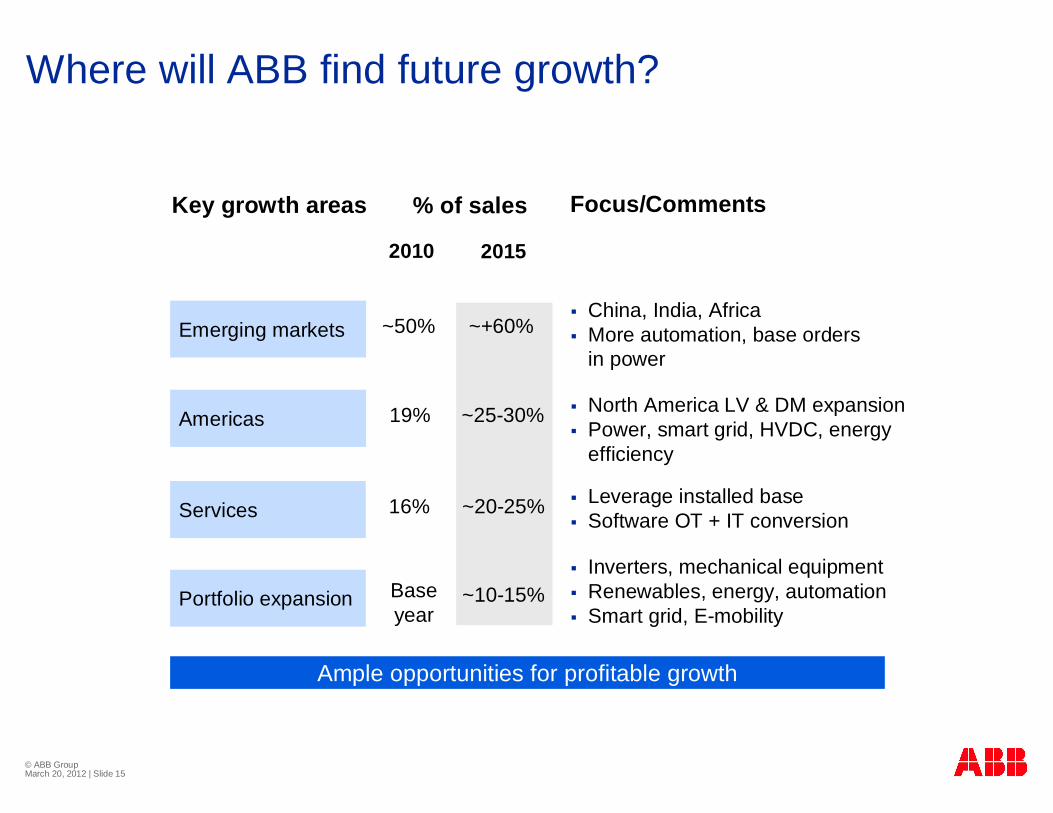
Where will ABB find future growth?
Emerging markets
Key growth areas
~50% ~+60%China, India, AfricaMore automation, base orders in power
19% ~25-30% North America LV & DM expansionPower, smart grid, HVDC, energy efficiency
16% ~20-25% Leverage installed baseSoftware OT + IT conversion
Base year
~10-15%Inverters, mechanical equipmentRenewables, energy, automationSmart grid, E-mobility
Ample opportunities for profitable growth
Americas
Services
Portfolio expansion
2010
Focus/Comments% of sales
2015
© ABB Group March 20, 2012 | Slide 16
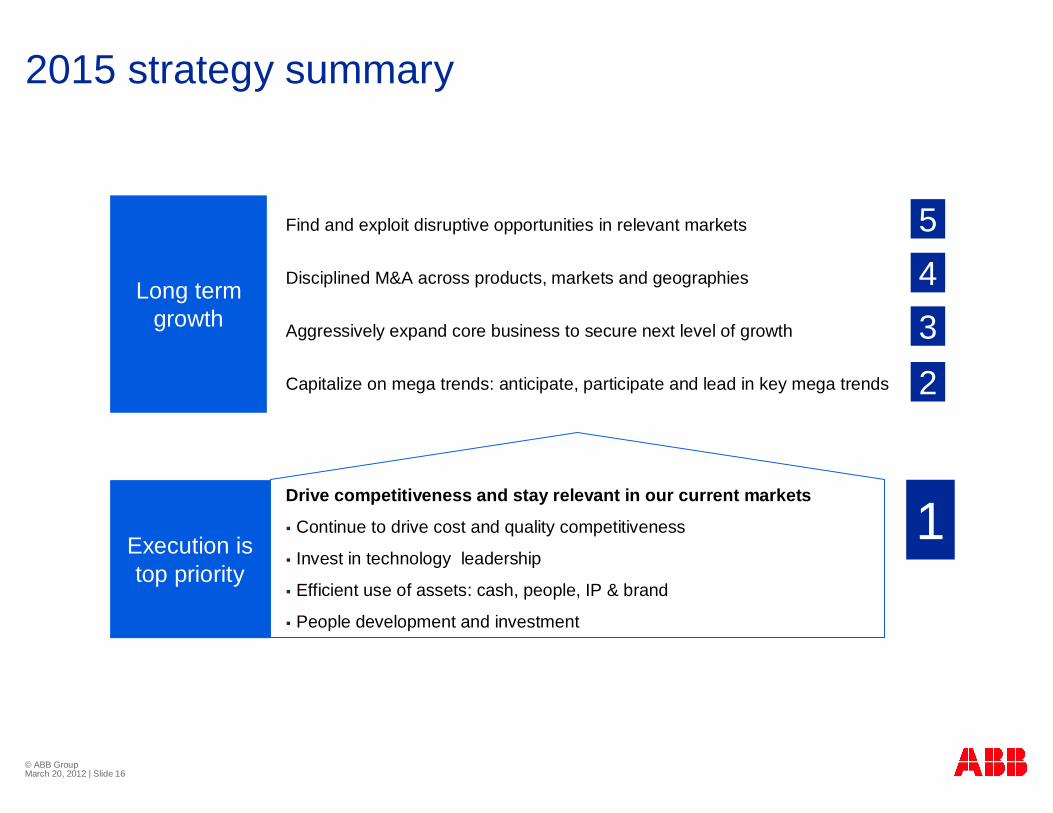
2015 strategy summary
Execution is top priority
Long term growth
Find and exploit disruptive opportunities in relevant markets
Disciplined M&A across products, markets and geographies
Aggressively expand core business to secure next level of growth
Capitalize on mega trends: anticipate, participate and lead in key mega trends
Drive competitiveness and stay relevant in our current markets
Continue to drive cost and quality competitiveness
Invest in technology leadership
Efficient use of assets: cash, people, IP & brand
People development and investment
1
2345
© ABB Group March 20, 2012 | Slide 17
2011 FY Results Summary

© ABB Group March 20, 2012 | Slide 18
2011: Successful execution against strategic targetsManaging for both cost and growth
Achieved double-digit order and revenue growth, improved operating marginExecuted strongly on cost to increase profitability despite market turbulenceLeveraged our product and regional scope to tap growth opportunitiesManaged working capital successfully to secure strong cash generationFocused M&A to build a platform for future profitable growthMaintained best-in-class balance sheetReturning cash to shareholders through an increasing, sustainable dividend over time
Achieved double-digit order and revenue growth, improved operating marginExecuted strongly on cost to increase profitability despite market turbulenceLeveraged our product and regional scope to tap growth opportunitiesManaged working capital successfully to secure strong cash generationFocused M&A to build a platform for future profitable growthMaintained best-in-class balance sheetReturning cash to shareholders through an increasing, sustainable dividend over time
© ABB Group March 20, 2012 | Slide 19
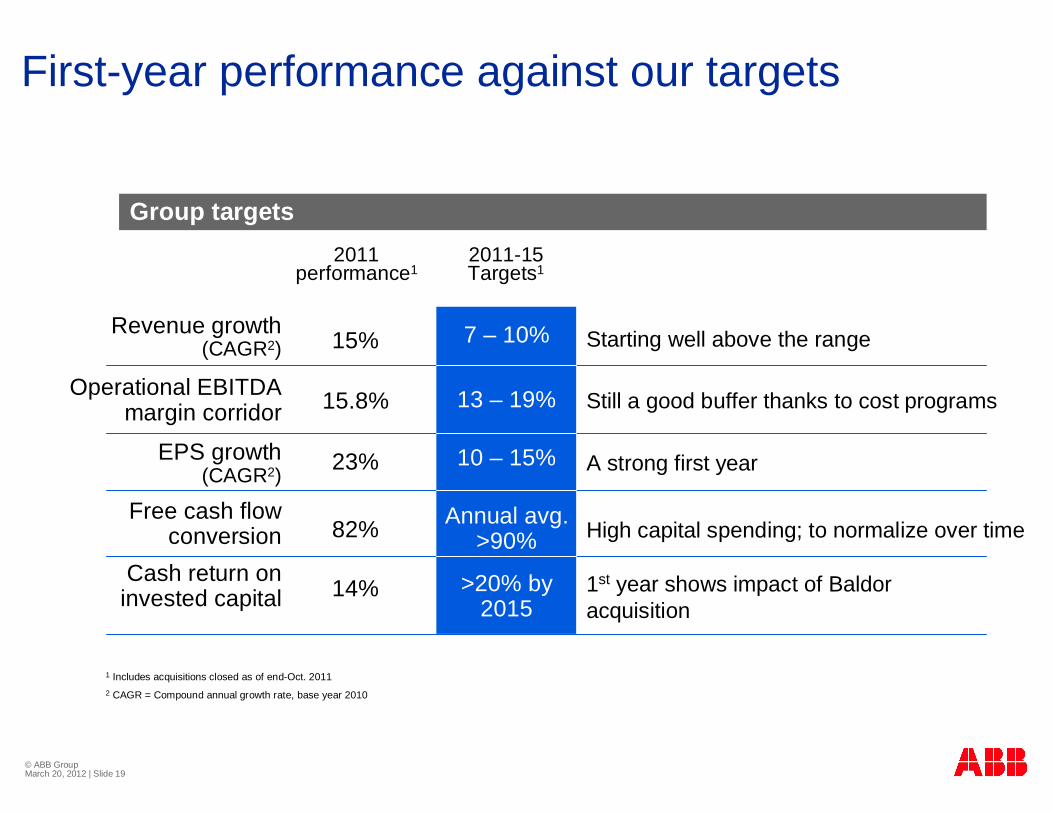
First-year performance against our targets
1 Includes acquisitions closed as of end-Oct. 20112 CAGR = Compound annual growth rate, base year 2010
Starting well above the range 7 – 10%
13 – 19%
10 – 15%
Annual avg.>90%
>20% by 2015
Group targets
Revenue growth (CAGR2)
Operational EBITDA margin corridor
EPS growth (CAGR2)
Free cash flow conversion
Cash return oninvested capital
15%
15.8%
23%
82%
14%
2011performance1
2011-15Targets1
Still a good buffer thanks to cost programs
A strong first year
High capital spending; to normalize over time
1st year shows impact of Baldor acquisition
© ABB Group March 20, 2012 | Slide 20
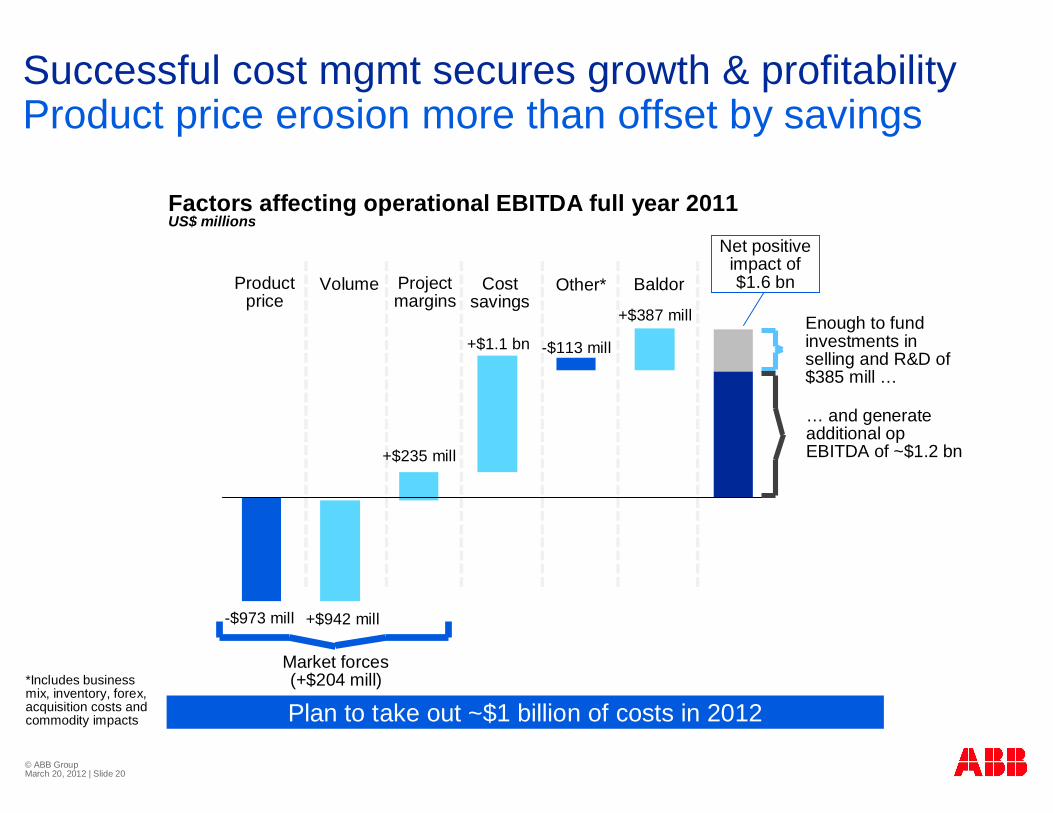
Successful cost mgmt secures growth & profitability Product price erosion more than offset by savings
Enough to fund investments in selling and R&D of $385 mill …
… and generate additional op EBITDA of ~$1.2 bn
Product price
Project margins
Volume Costsavings
Factors affecting operational EBITDA full year 2011US$ millions
Market forces(+$204 mill)
Plan to take out ~$1 billion of costs in 2012*Includes business mix, inventory, forex, acquisition costs and commodity impacts
-$973 mill +$942 mill
+$235 mill
+$1.1 bn
Other* Baldor
-$113 mill
+$387 mill
Net positive impact of $1.6 bn

© ABB Group March 20, 2012 | Slide 21
Exceeded 2011 cost savings targetSavings continued to outpace negative market impact
Approx. share of savings by categoryPercent
Sourcing
Global footprint
Operational Excellence
$1.1 bn
Approx. share of savings by division Percent
5%
11%
11%
37%
28%
8%$1.1 bn
PP
DM
PS
LP
PA
Indirect Sourcing
$1.1 bn savings offset >$970 mill of price pressure
Operational excellence measures continue to gain traction
Focus in power pays off with sector-leading profitability despite challenging price environment
© ABB Group March 20, 2012 | Slide 22
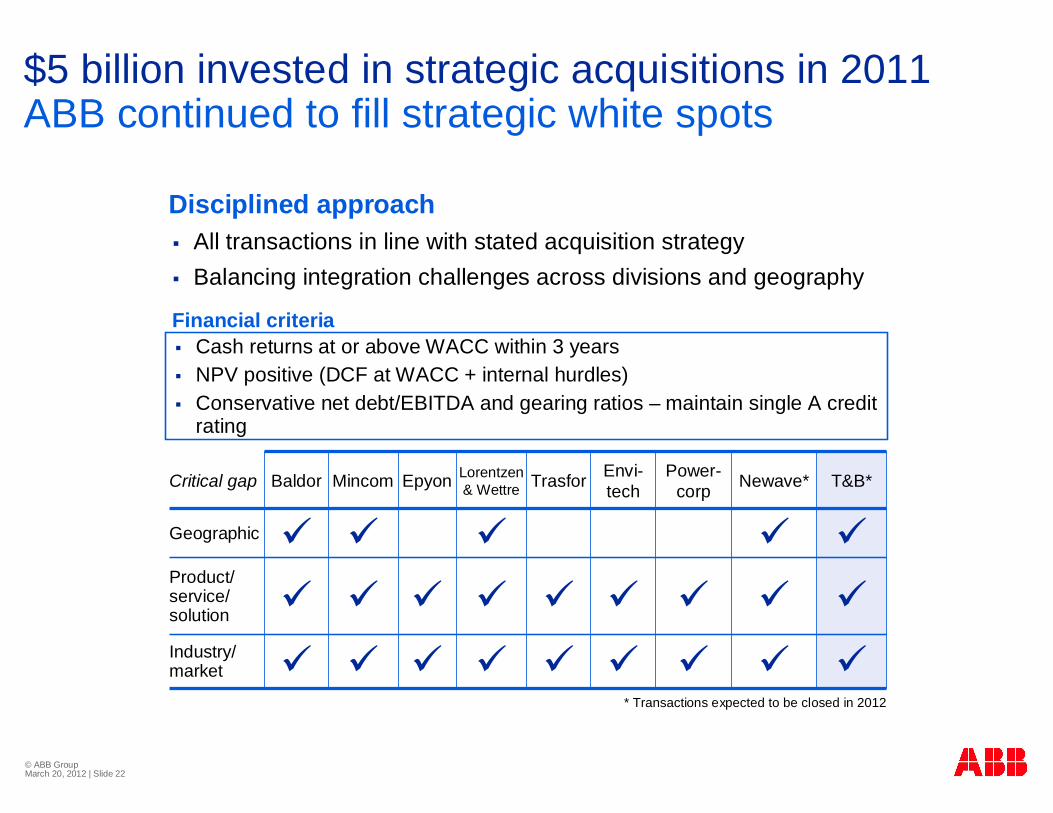
Cash returns at or above WACC within 3 yearsNPV positive (DCF at WACC + internal hurdles)Conservative net debt/EBITDA and gearing ratios – maintain single A credit rating
Critical gap Baldor Mincom Epyon Lorentzen& Wettre Trasfor Envi-
techPower-
corp Newave* T&B*
Geographic
Product/ service/solution
Industry/market
All transactions in line with stated acquisition strategyBalancing integration challenges across divisions and geography
Disciplined approach
Financial criteria
$5 billion invested in strategic acquisitions in 2011ABB continued to fill strategic white spots
* Transactions expected to be closed in 2012
© ABB Group March 20, 2012 | Slide 23
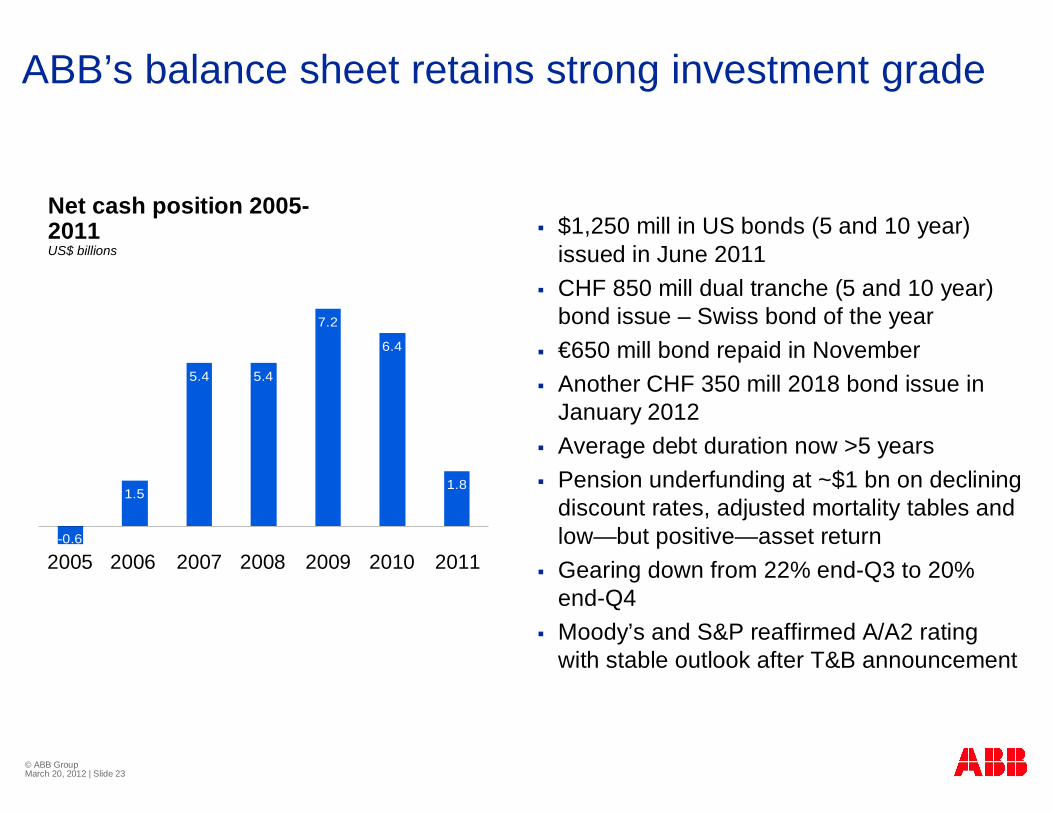
ABB’s balance sheet retains strong investment grade
Net cash position 2005-2011US$ billions
$1,250 mill in US bonds (5 and 10 year) issued in June 2011CHF 850 mill dual tranche (5 and 10 year) bond issue – Swiss bond of the year€650 mill bond repaid in NovemberAnother CHF 350 mill 2018 bond issue in January 2012Average debt duration now >5 yearsPension underfunding at ~$1 bn on declining discount rates, adjusted mortality tables and low—but positive—asset returnGearing down from 22% end-Q3 to 20% end-Q4Moody’s and S&P reaffirmed A/A2 rating with stable outlook after T&B announcement
1.5
5.4 5.4
7.2
6.4
1.8
-0.6
2005 2006 2007 2008 2009 2010 2011
© ABB Group March 20, 2012 | Slide 24
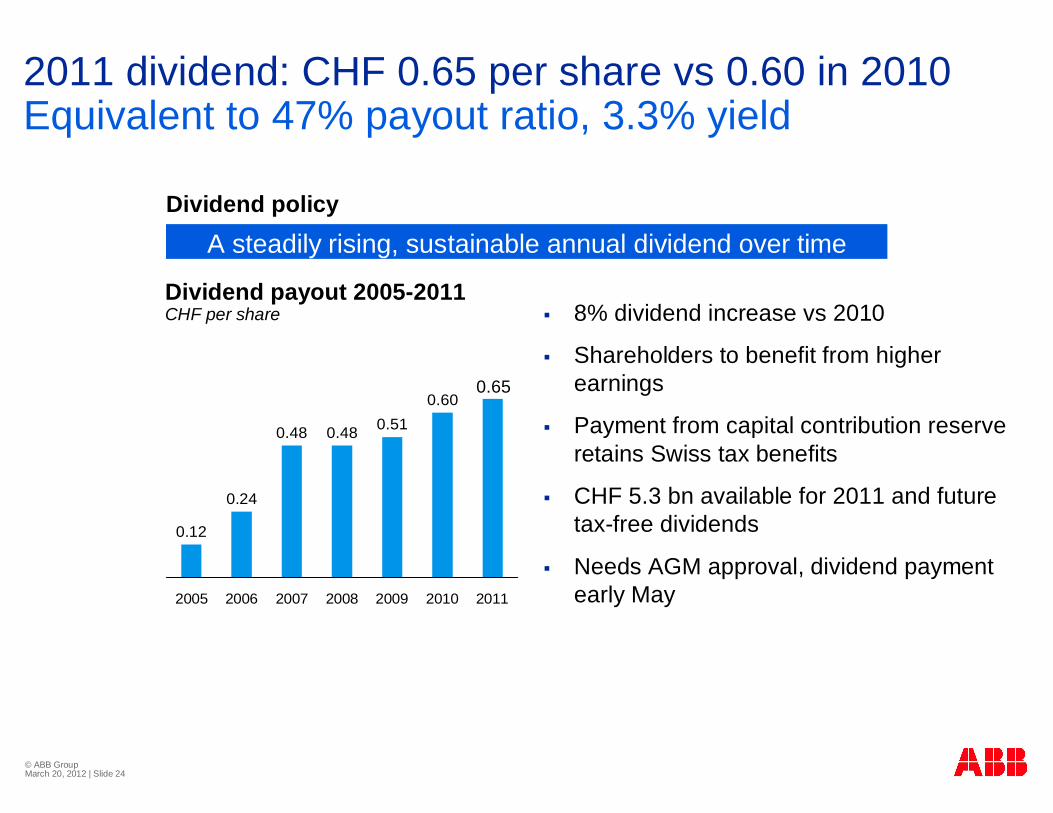
0.12
0.24
0.48 0.48
0.600.51
2005 2006 2007 2008 2009 2010 2011
2011 dividend: CHF 0.65 per share vs 0.60 in 2010Equivalent to 47% payout ratio, 3.3% yield
8% dividend increase vs 2010
Shareholders to benefit from higher earnings
Payment from capital contribution reserve retains Swiss tax benefits
CHF 5.3 bn available for 2011 and future tax-free dividends
Needs AGM approval, dividend payment early May
Dividend payout 2005-2011CHF per share
A steadily rising, sustainable annual dividend over timeDividend policy
0.65

© ABB Group March 20, 2012 | Slide 25
Outlook for 2012: Mixed view short term Ample profitable growth opportunities for FY 2012
Long-term market outlook remains positiveContinued investments in grid efficiency and industrial productivity
Short-term market view mixedUncertainty in Europe, but signs of recovery in NAM, China focus on growth
Management expectations on resultsEarly-cycle growth at low single digits
Price pressure expected to continue in parts of power (as previously guided)
Business mix expected to weigh on Q1 margins
Management focus on driving cost and productivity improvements to continue
Backlog, power distribution, oil & gas, emerging markets support profitable growth in 2012
Driving the business for both cost and growth

© ABB Group March 20, 2012 | Slide 26

© ABB Group March 20, 2012 | Slide 27
Full-year 2011: Record orders and revenues Strong cash flow, redeployed in acquisitions, dividends
YTD PerformanceUS$ millions unless otherwise stated
change vs 2010
Orders 40,210 +18%1
(organic. +11%)
Revenues 37,990 +15%1
(organic +9%)
Operational EBITDA 6,014 +25%
Operational EBITDA % 15.8%+0.5
percentage points
Net Income 3,168 + 24%
EPS (basic) 1.38 +23%
Dividend per share(CHF, proposed)
0.65 +8%
Cash from operations 3,612 -14%
Cash return on invested capital 14% -7 percentage
points
$40 bn orders for 1st time ever, record revenuesSolid delivery against growth, profitability and EPS targets Much improved project executionCost savings >$1 bn offset price pressure, funded additional selling and R&D, lifted marginsAcquired companies with strong revenue, earnings and cash generation contributionsNet income up $600 mill.Q4 cash flow close to last year’s record8% increase in dividend proposed to CHF 0.65CROI at 14%, initial impact of Baldor acquisition
1 In local currencies

© ABB Group March 20, 2012 | Slide 28
Q4: Solid top and bottom line in a challenging marketStrong cash flow generation on lower NWC
Q4 PerformanceUS$ millions unless otherwise stated
change vs 2010
Orders 10,160 +17%1
(organic 10%)
Revenues 10,571 +16%1
(organic 10%)
Operational EBITDA 1,568 +18%
Operational EBITDA % 14.8%+0.4
percentage points
Net Income 830 +19%
Cash from operations 1,674 -5%
Good order growth in N America and emerging markets, S Europe weaker on market uncertaintyOrders up in all divisionsRevenues up on execution of strong order backlog, all divisions positiveService orders & revenues up faster than Group (organic)Operational EBITDA up ~$250 mill., divisional margins impacted by business mix and price pressureCost savings remain key to maintaining marginsStrong cash generation near last year’s record—NWC reduced by $1 bn vs Q3 2011 (-2.6% of 2011 revenues)1 In local currencies
© ABB Group March 20, 2012 | Slide 29
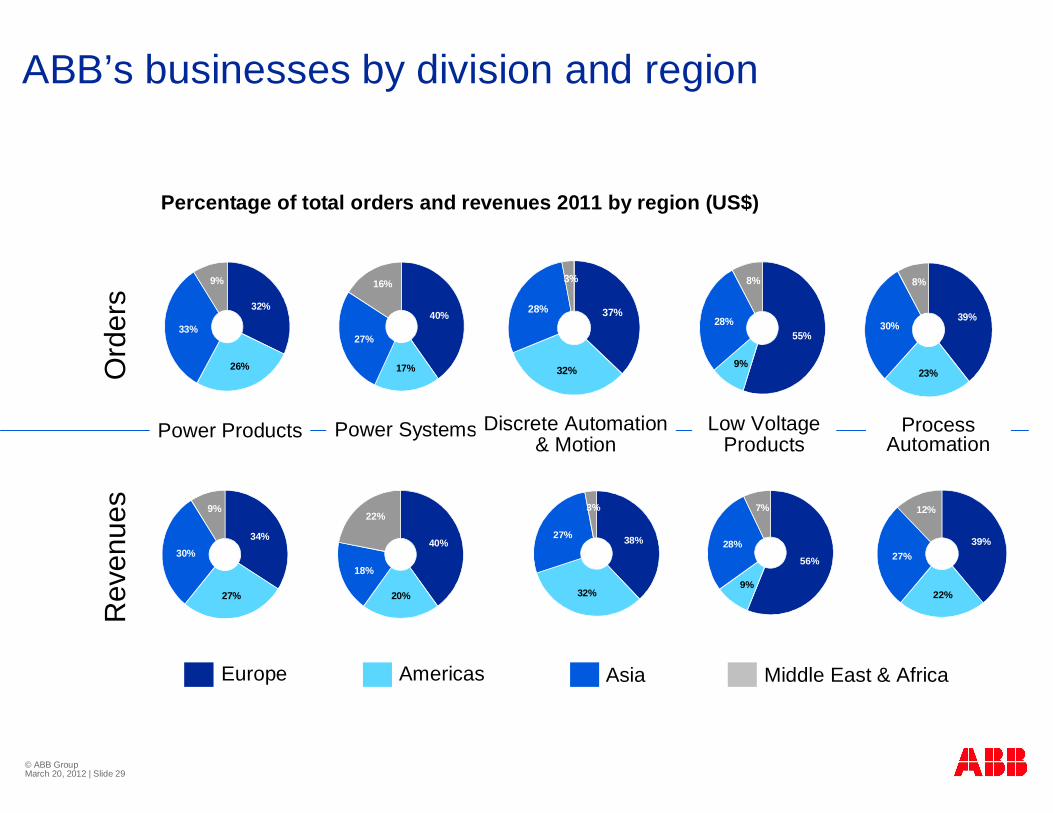
ABB’s businesses by division and regionO
rder
sR
even
ues
Percentage of total orders and revenues 2011 by region (US$)
Europe Americas Asia Middle East & Africa
39%
22%
27%
12%
40%
17%
27%
16%
37%
32%
28%
3%
55%
9%
28%
8%
39%
23%
30%
8%
34%
27%
30%
9%
40%
20%
18%
22%
38%
32%
27%
3%
56%
9%
28%
7%
32%
26%
33%
9%
Power Products Power Systems Discrete Automation& Motion
Low Voltage Products
Process Automation
© ABB Group March 20, 2012 | Slide 30
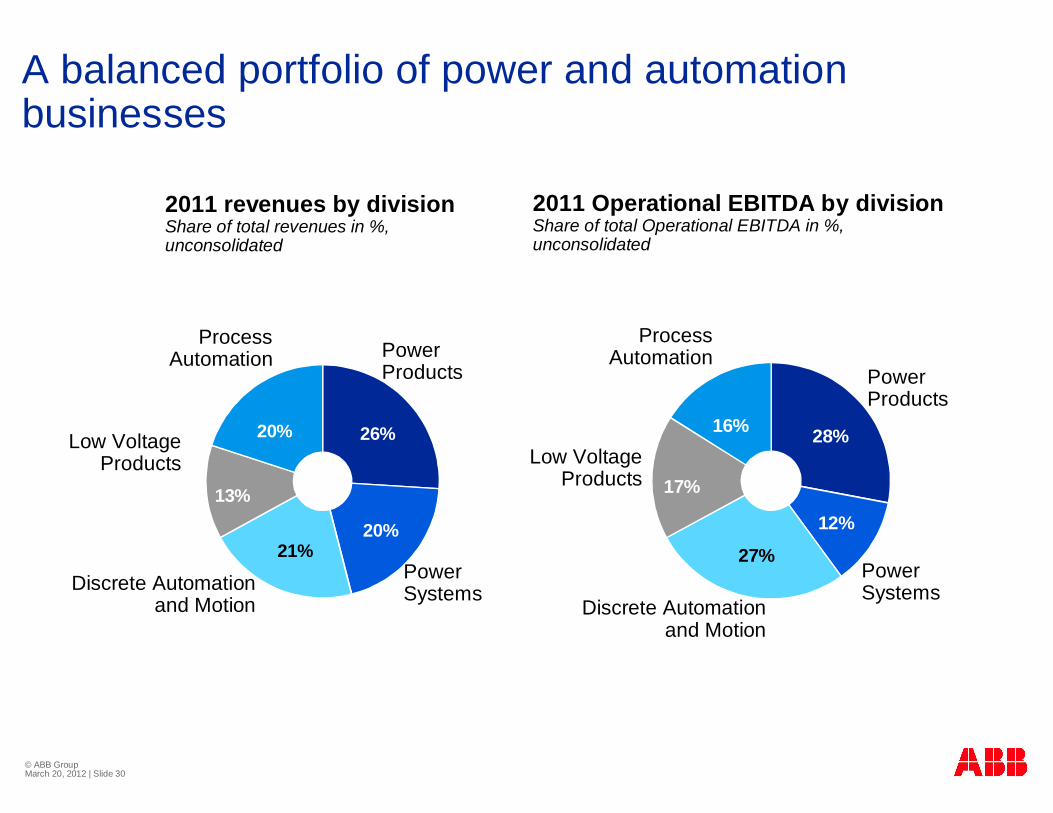
28%
12%
27%
17%
16%26%
20%21%
13%
20%
A balanced portfolio of power and automation businesses
PowerSystemsDiscrete Automation
and Motion
ProcessAutomation
PowerProducts
PowerSystems
PowerProducts
2011 revenues by divisionShare of total revenues in %, unconsolidated
2011 Operational EBITDA by divisionShare of total Operational EBITDA in %, unconsolidated
Low Voltage Products
Discrete Automation and Motion
ProcessAutomation
Low Voltage Products
© ABB Group March 20, 2012 | Slide 31
Power ProductsQ4 and full-year 2011 summary
Q4 2011 Q4 2010 US$ Local FY 2011 FY 2010 US$ Local
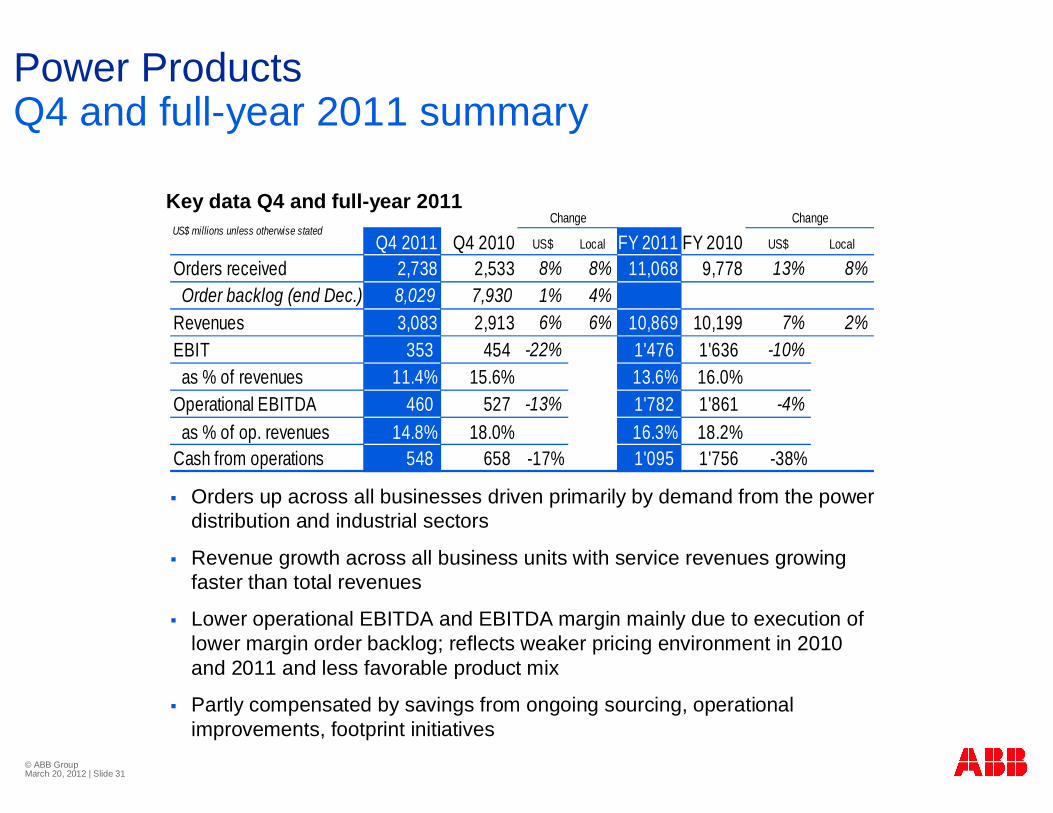
Orders received 2,738 2,533 8% 8% 11,068 9,778 13% 8% Order backlog (end Dec.) 8,029 7,930 1% 4%Revenues 3,083 2,913 6% 6% 10,869 10,199 7% 2%EBIT 353 454 -22% 1'476 1'636 -10% as % of revenues 11.4% 15.6% 13.6% 16.0%Operational EBITDA 460 527 -13% 1'782 1'861 -4% as % of op. revenues 14.8% 18.0% 16.3% 18.2%Cash from operations 548 658 -17% 1'095 1'756 -38%
ChangeUS$ millions unless otherwise stated
ChangeKey data Q4 and full-year 2011
Orders up across all businesses driven primarily by demand from the power distribution and industrial sectors
Revenue growth across all business units with service revenues growing faster than total revenues
Lower operational EBITDA and EBITDA margin mainly due to execution of lower margin order backlog; reflects weaker pricing environment in 2010 and 2011 and less favorable product mix
Partly compensated by savings from ongoing sourcing, operationalimprovements, footprint initiatives
© ABB Group March 20, 2012 | Slide 32
Power SystemsQ4 and full-year 2011 summary
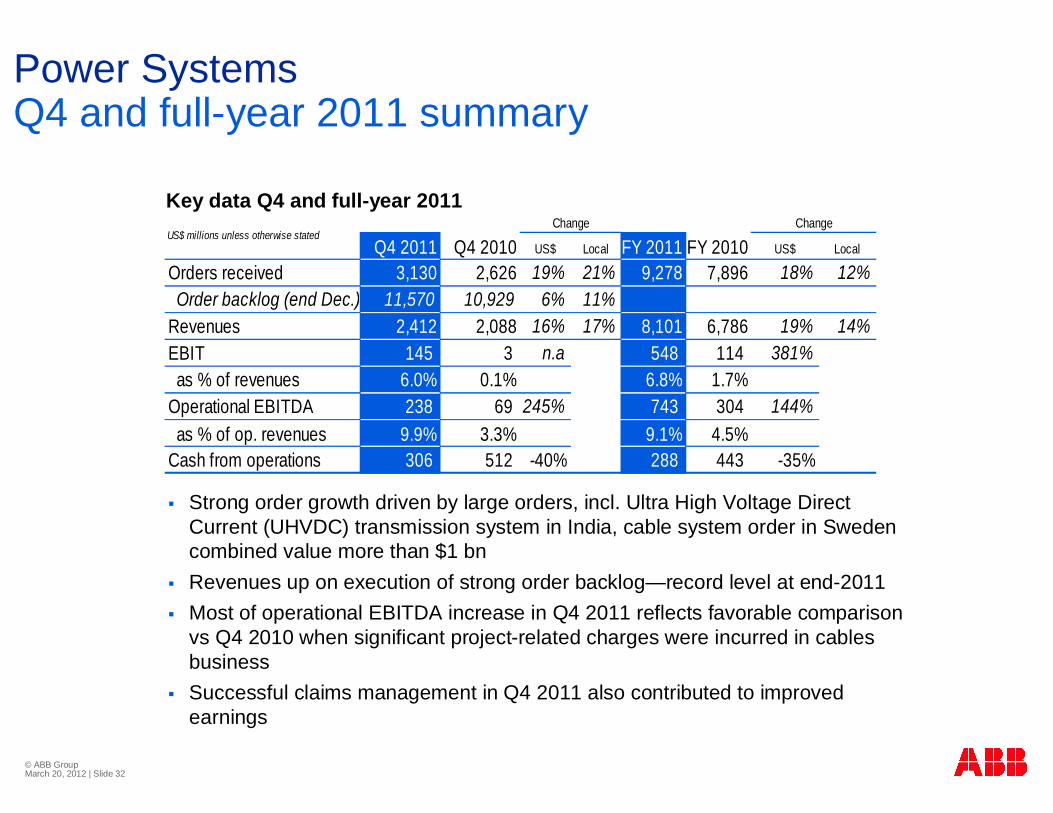
Strong order growth driven by large orders, incl. Ultra High Voltage Direct Current (UHVDC) transmission system in India, cable system order in Sweden combined value more than $1 bnRevenues up on execution of strong order backlog—record level at end-2011Most of operational EBITDA increase in Q4 2011 reflects favorable comparison vs Q4 2010 when significant project-related charges were incurred in cables business Successful claims management in Q4 2011 also contributed to improved earnings
Key data Q4 and full-year 2011
Q4 2011 Q4 2010 US$ Local FY 2011 FY 2010 US$ Local
Orders received 3,130 2,626 19% 21% 9,278 7,896 18% 12% Order backlog (end Dec.) 11,570 10,929 6% 11%Revenues 2,412 2,088 16% 17% 8,101 6,786 19% 14%EBIT 145 3 n.a 548 114 381% as % of revenues 6.0% 0.1% 6.8% 1.7%Operational EBITDA 238 69 245% 743 304 144% as % of op. revenues 9.9% 3.3% 9.1% 4.5%Cash from operations 306 512 -40% 288 443 -35%
ChangeUS$ millions unless otherwise stated
Change
© ABB Group March 20, 2012 | Slide 33
Discrete Automation and MotionQ4 and full-year 2011 summary
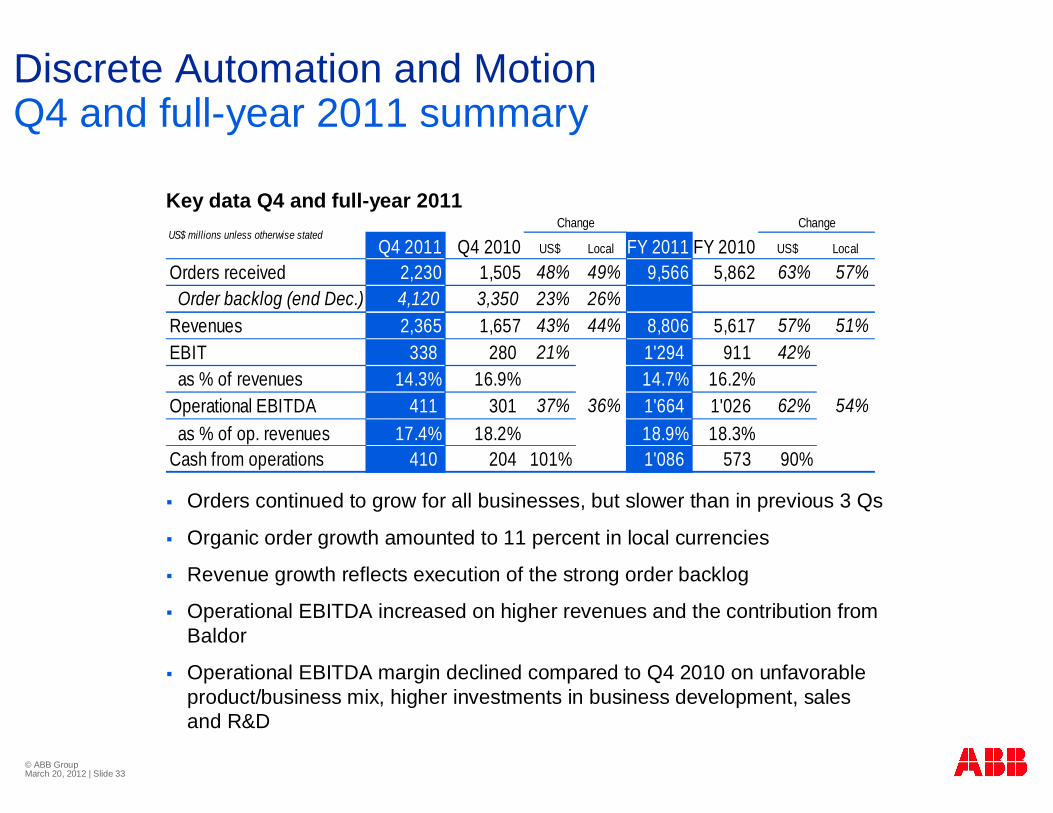
Orders continued to grow for all businesses, but slower than in previous 3 Qs
Organic order growth amounted to 11 percent in local currencies
Revenue growth reflects execution of the strong order backlog
Operational EBITDA increased on higher revenues and the contribution from Baldor
Operational EBITDA margin declined compared to Q4 2010 on unfavorable product/business mix, higher investments in business development, sales and R&D
Q4 2011 Q4 2010 US$ Local FY 2011 FY 2010 US$ Local
Orders received 2,230 1,505 48% 49% 9,566 5,862 63% 57% Order backlog (end Dec.) 4,120 3,350 23% 26%Revenues 2,365 1,657 43% 44% 8,806 5,617 57% 51%EBIT 338 280 21% 1'294 911 42% as % of revenues 14.3% 16.9% 14.7% 16.2%Operational EBITDA 411 301 37% 36% 1'664 1'026 62% 54% as % of op. revenues 17.4% 18.2% 18.9% 18.3%Cash from operations 410 204 101% 1'086 573 90%
ChangeUS$ millions unless otherwise stated
ChangeKey data Q4 and full-year 2011

© ABB Group March 20, 2012 | Slide 34
Low-Voltage ProductsQ4 and full-year 2011 summary
Orders growth rate reflects generally weaker early-cycle demand in most markets Revenue growth outpaced orders on execution of strong order backlog in low voltage systemsHigher revenues drove the increase in operational EBITDA, supported by price increases earlier in the year to offset rising raw material costsHigher share of systems revenues during the quarter resulted in a decline in operational EBITDA margin
Key data Q4 and full-year 2011
Q4 2011 Q4 2010 US$ Local FY 2011 FY 2010 US$ Local
Orders received 1,204 1,142 5% 6% 5,364 4,686 14% 9% Order backlog (end Dec.) 887 838 6% 9%Revenues 1,348 1,254 7% 7% 5,304 4,554 16% 11%EBIT 209 200 5% 904 788 15% as % of revenues 15.5% 15.9% 17.0% 17.3%Operational EBITDA 256 252 2% 1'059 926 14% as % of op. revenues 19.0% 20.1% 19.9% 20.3%Cash from operations 312 280 11% 548 717 -11%
ChangeUS$ millions unless otherwise stated
Change
© ABB Group March 20, 2012 | Slide 35
Process AutomationQ4 and full-year 2011 summary
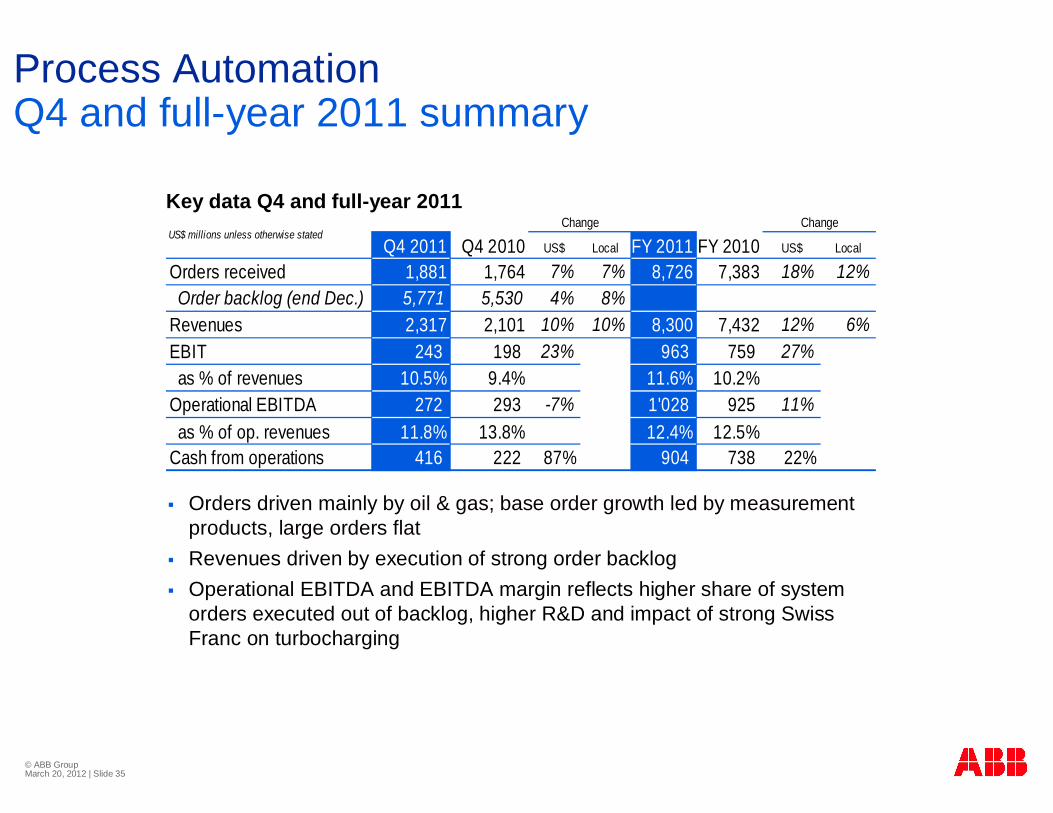
Orders driven mainly by oil & gas; base order growth led by measurement products, large orders flatRevenues driven by execution of strong order backlogOperational EBITDA and EBITDA margin reflects higher share of system orders executed out of backlog, higher R&D and impact of strong Swiss Franc on turbocharging
Key data Q4 and full-year 2011
Q4 2011 Q4 2010 US$ Local FY 2011 FY 2010 US$ Local
Orders received 1,881 1,764 7% 7% 8,726 7,383 18% 12% Order backlog (end Dec.) 5,771 5,530 4% 8%Revenues 2,317 2,101 10% 10% 8,300 7,432 12% 6%EBIT 243 198 23% 963 759 27% as % of revenues 10.5% 9.4% 11.6% 10.2%Operational EBITDA 272 293 -7% 1'028 925 11% as % of op. revenues 11.8% 13.8% 12.4% 12.5%Cash from operations 416 222 87% 904 738 22%
ChangeUS$ millions unless otherwise stated
Change

© ABB Group March 20, 2012 | Slide 36
Divisional Fact Sheets
2010-11
© ABB Group March 20, 2012 | Slide 37
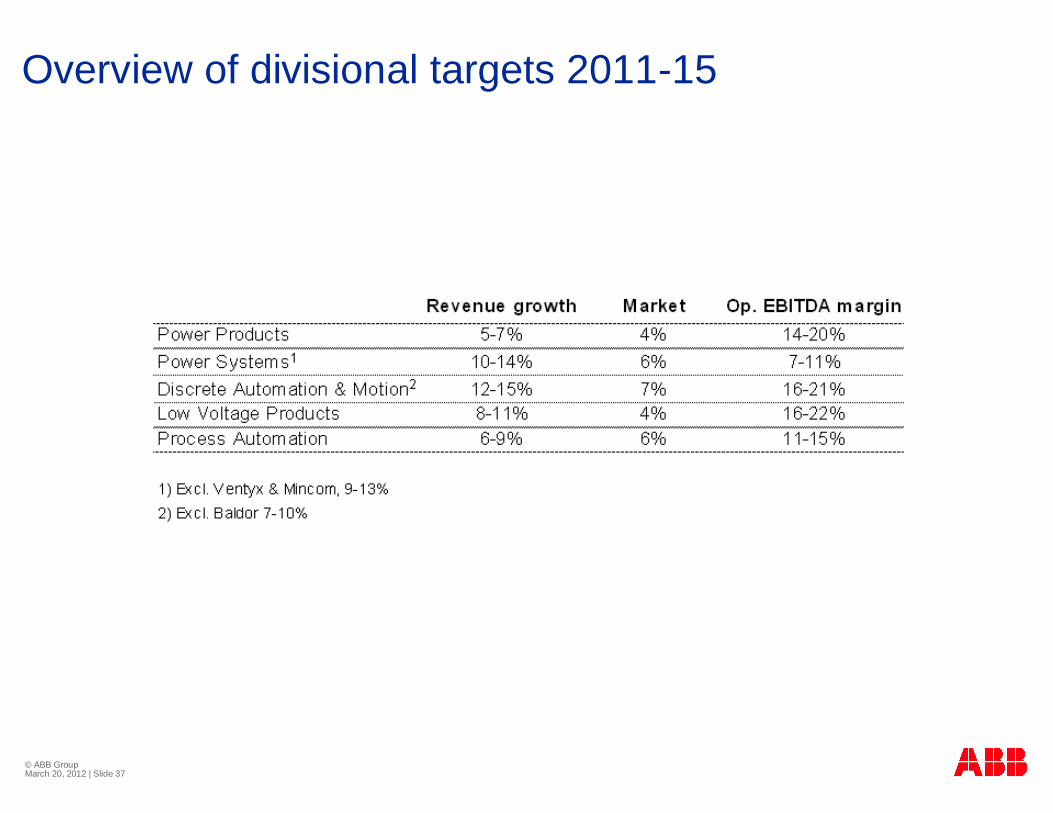
Overview of divisional targets 2011-15
© ABB Group March 20, 2012 | Slide 38
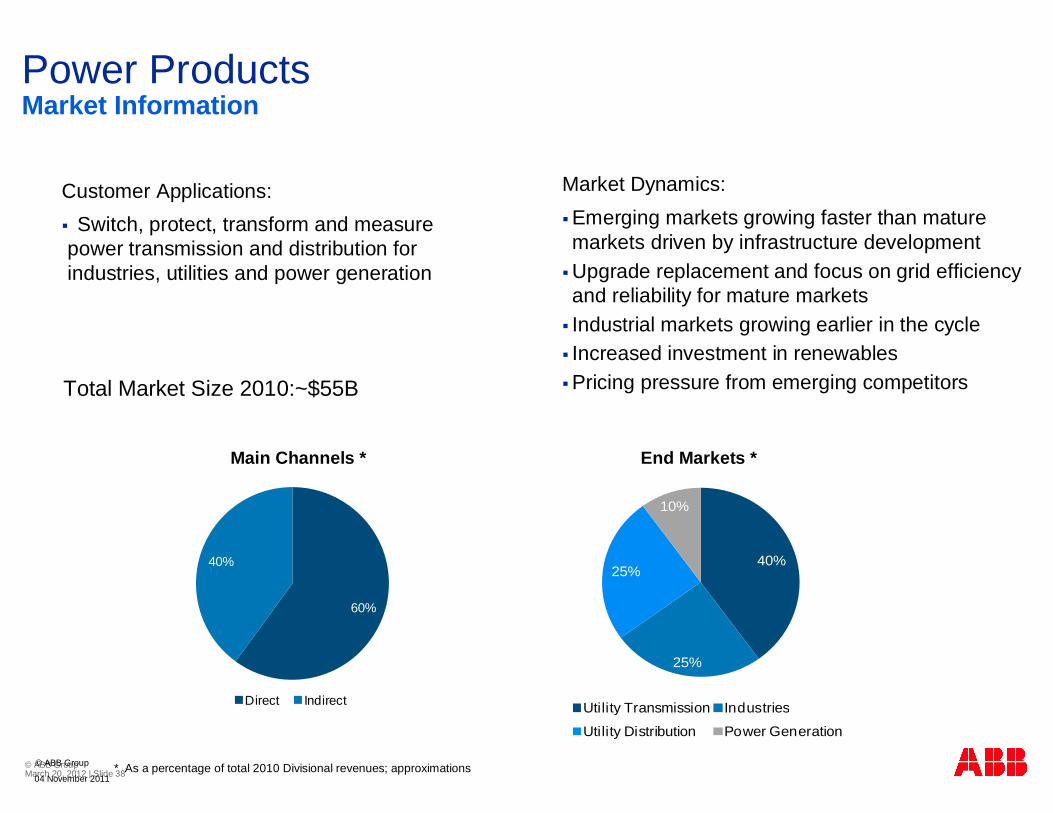
Market Dynamics:Emerging markets growing faster than mature markets driven by infrastructure development Upgrade replacement and focus on grid efficiency and reliability for mature marketsIndustrial markets growing earlier in the cycleIncreased investment in renewablesPricing pressure from emerging competitors
Power Products Market Information
40%
25%
25%
10%
Utility Transmission Industries
Utility Distribution Power Generation
60%
40%
Direct Indirect
04 November 2011
© ABB Group
Customer Applications:Switch, protect, transform and measure
power transmission and distribution for industries, utilities and power generation
Total Market Size 2010:~$55B
Main Channels * End Markets *
* As a percentage of total 2010 Divisional revenues; approximations
© ABB Group March 20, 2012 | Slide 39
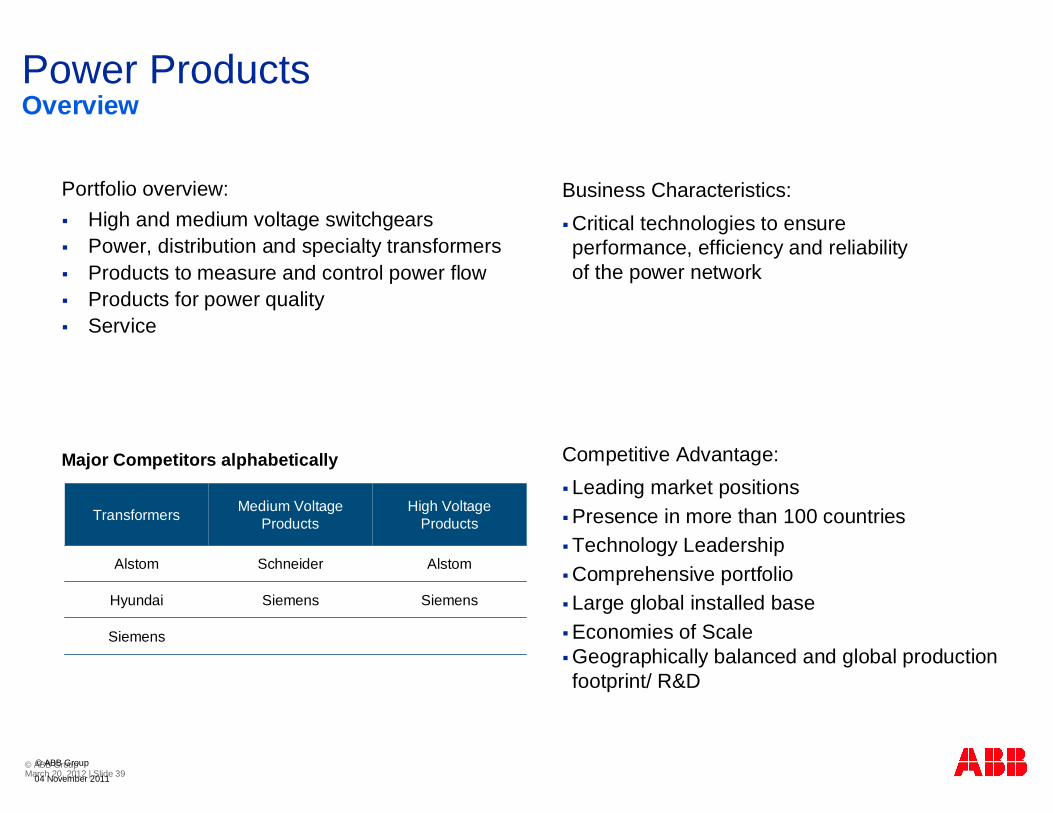
Power Products
Portfolio overview:High and medium voltage switchgearsPower, distribution and specialty transformersProducts to measure and control power flowProducts for power qualityService
Overview
Business Characteristics:Critical technologies to ensure performance, efficiency and reliability of the power network
Transformers Medium VoltageProducts
High VoltageProducts
Alstom Schneider Alstom
Hyundai Siemens Siemens
Siemens
Competitive Advantage: Leading market positionsPresence in more than 100 countriesTechnology LeadershipComprehensive portfolioLarge global installed baseEconomies of Scale Geographically balanced and global production footprint/ R&D
04 November 2011
© ABB Group
Major Competitors alphabetically
© ABB Group March 20, 2012 | Slide 40
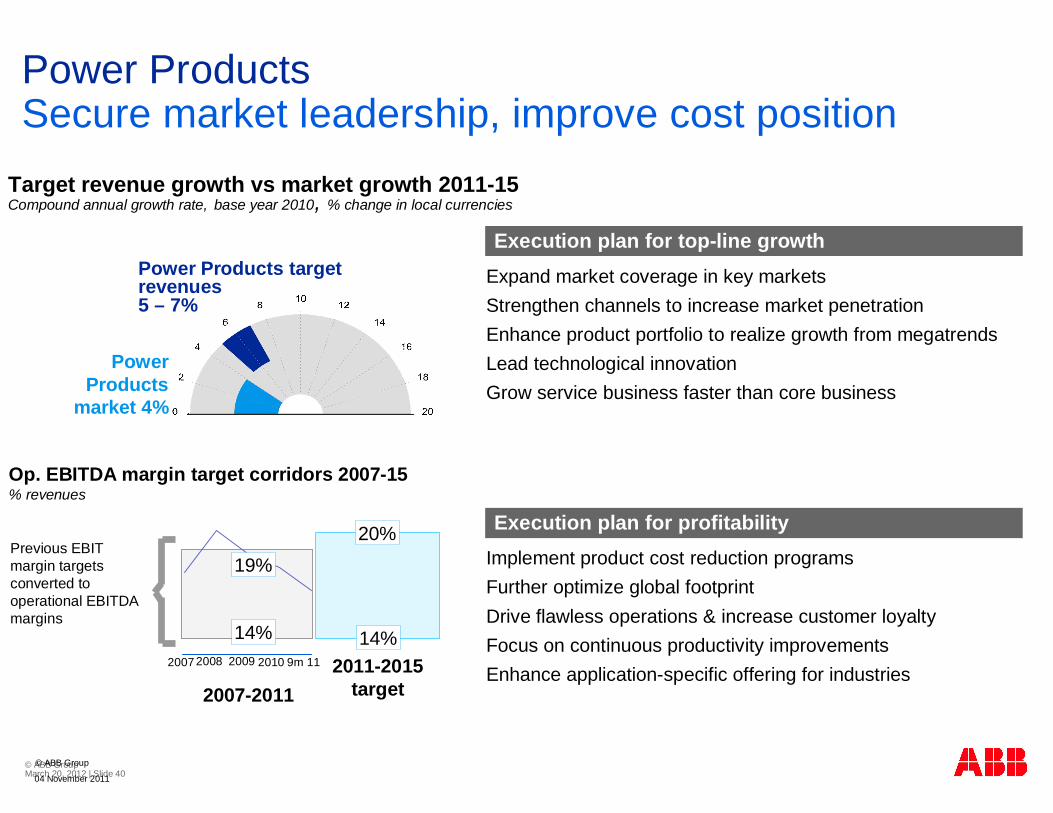
Power Products Secure market leadership, improve cost position
Execution plan for top-line growthExpand market coverage in key marketsStrengthen channels to increase market penetrationEnhance product portfolio to realize growth from megatrendsLead technological innovationGrow service business faster than core business
Execution plan for profitabilityImplement product cost reduction programsFurther optimize global footprintDrive flawless operations & increase customer loyaltyFocus on continuous productivity improvementsEnhance application-specific offering for industries
Target revenue growth vs market growth 2011-15Compound annual growth rate, base year 2010, % change in local currencies
Power Products
market 4%
Power Products target revenues5 – 7%
5
10
15
20
25
19%
14%
20%
14%
Op. EBITDA margin target corridors 2007-15% revenues
Previous EBIT margin targets converted to operational EBITDA margins
2007-2011
2007 2009 9m 112008 2010 2011-2015target
© ABB Group
04 November 2011
© ABB Group March 20, 2012 | Slide 41
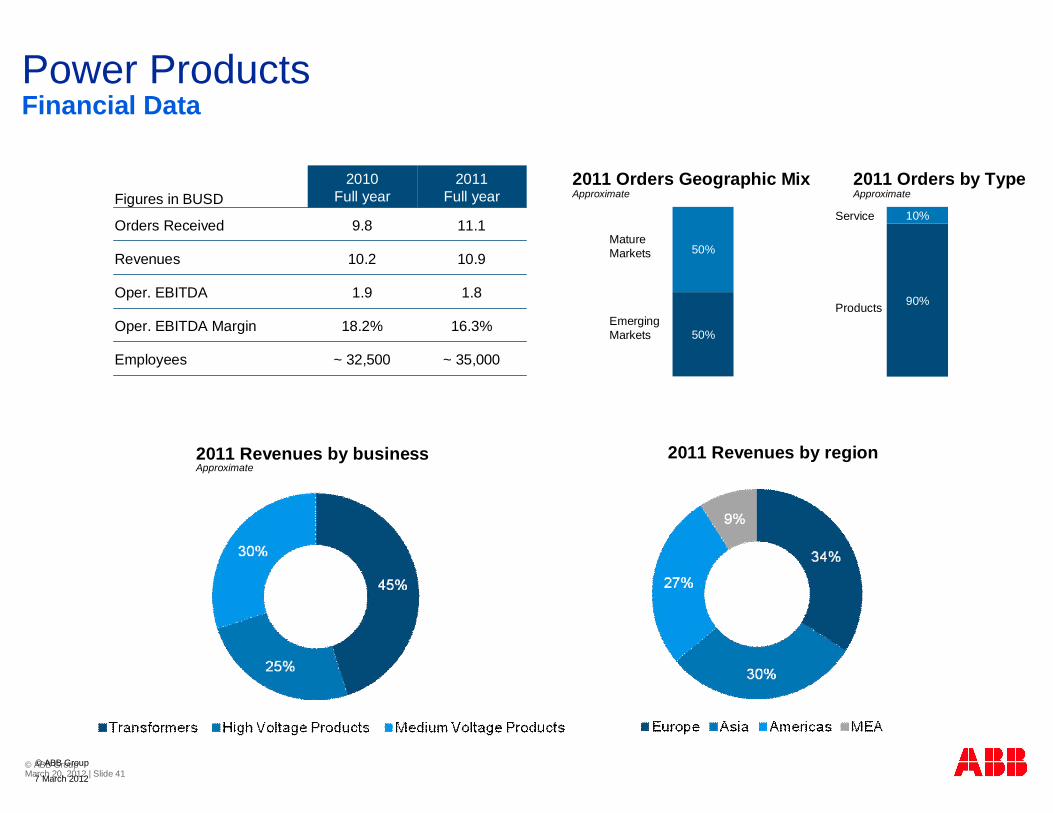
90%
10%
50%
50%
Power ProductsFinancial Data
EmergingMarkets
Mature Markets
Service
Products
MEA2011 Revenues by businessApproximate
2011 Revenues by region
© ABB Group
2011 Orders by TypeApproximate
2011 Orders Geographic MixApproximateFigures in BUSD
2010Full year
2011 Full year
Orders Received 9.8 11.1
Revenues 10.2 10.9
Oper. EBITDA 1.9 1.8
Oper. EBITDA Margin 18.2% 16.3%
Employees ~ 32,500 ~ 35,000
7 March 2012
© ABB Group March 20, 2012 | Slide 42
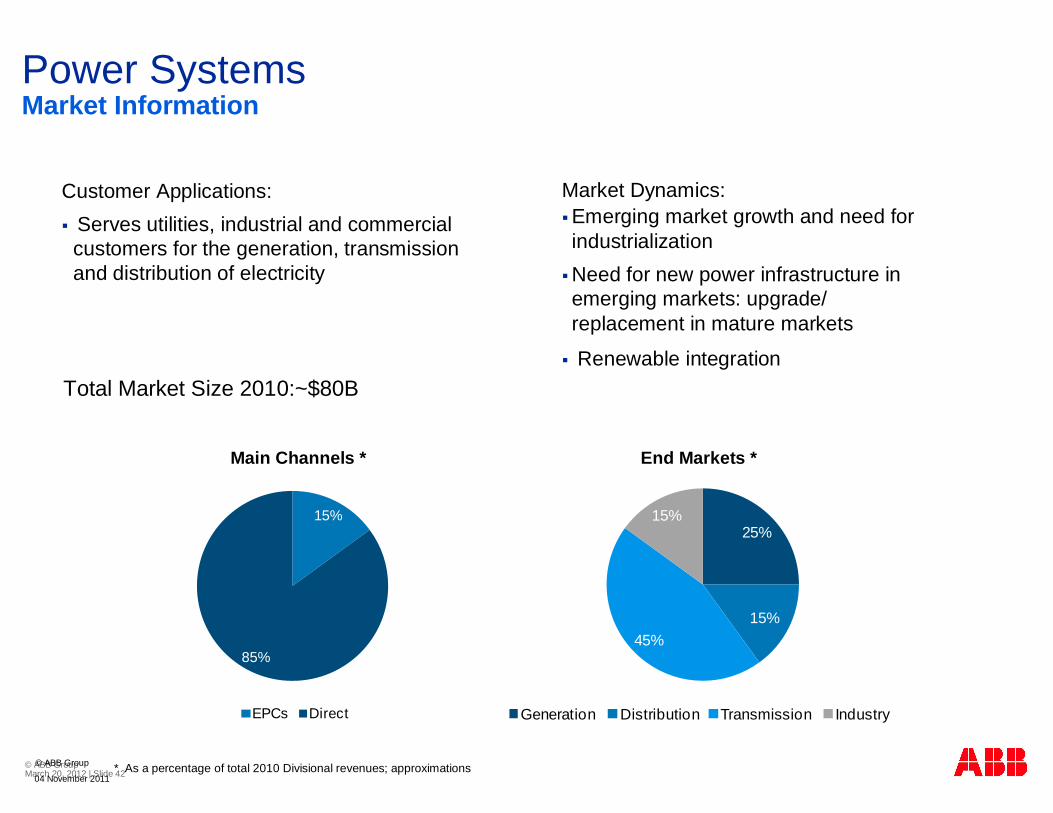
15%
85%
EPCs Direct
Power Systems
Customer Applications:Serves utilities, industrial and commercialcustomers for the generation, transmission and distribution of electricity
Market Information
Main Channels *
Market Dynamics:Emerging market growth and need for industrialization Need for new power infrastructure in emerging markets: upgrade/replacement in mature markets
Renewable integrationTotal Market Size 2010:~$80B
25%
15%45%
15%
Generation Distribution Transmission Industry
04 November 2011
© ABB Group
End Markets *
* As a percentage of total 2010 Divisional revenues; approximations
© ABB Group March 20, 2012 | Slide 43
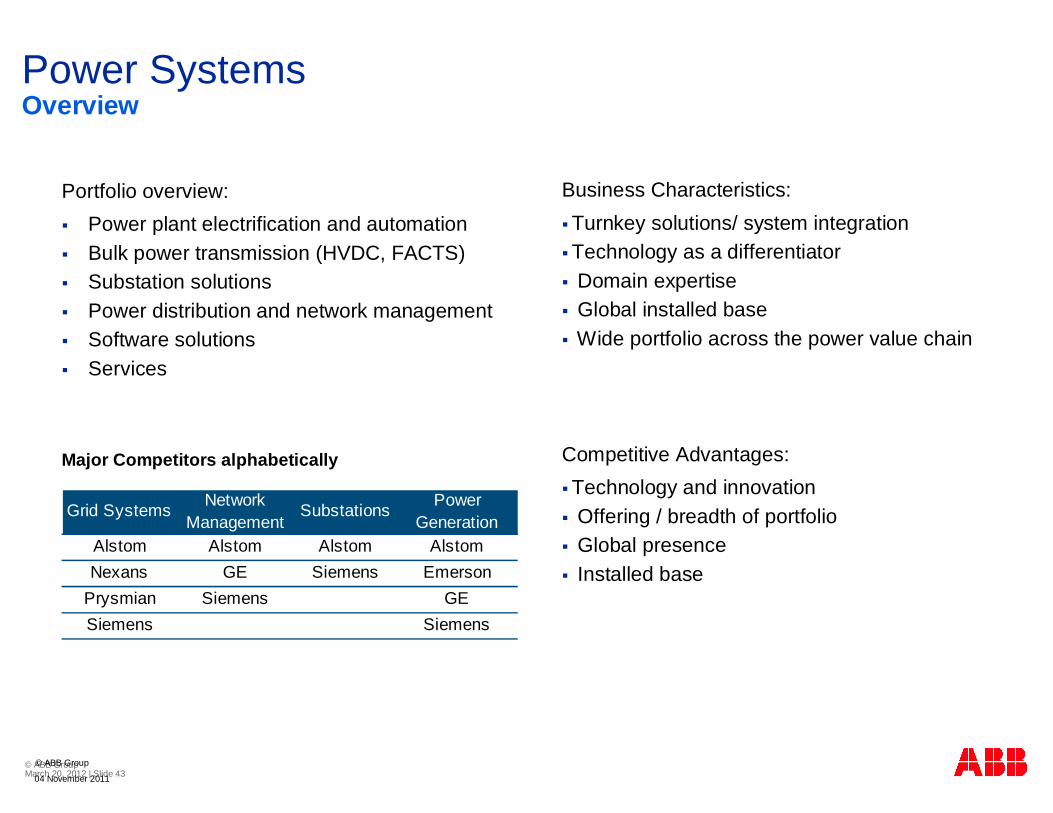
Power Systems
Portfolio overview:Power plant electrification and automationBulk power transmission (HVDC, FACTS)Substation solutionsPower distribution and network managementSoftware solutionsServices
Overview
Business Characteristics:Turnkey solutions/ system integrationTechnology as a differentiatorDomain expertiseGlobal installed baseWide portfolio across the power value chain
Competitive Advantages: Technology and innovationOffering / breadth of portfolioGlobal presenceInstalled base
Major Competitors alphabetically
Grid Systems Network Management
Substations Power Generation
Alstom Alstom Alstom AlstomNexans GE Siemens Emerson
Prysmian Siemens GESiemens Siemens
04 November 2011
© ABB Group

© ABB Group March 20, 2012 | Slide 44
Power SystemsHuge market opportunities, build on technology leadership
Execution plan for top-line growthTap opportunities in large-scale renewables: hydro, wind, solarBuild grid business around capacity, reinforcement and reliability Leverage business opportunities in automation, network controlExpand software solutions business (OT/IT convergence)Drive service and consulting growth above division average
Execution plan for profitabilityFurther strengthen contract and risk managementDrive operational excellenceSharper focus on supply management and footprint for cost
competitivenessDifferentiate on technology and innovation leadership
Target revenue growth vs market growth 2011-15Compound annual growth rate, base year 2010, % change in local currencies
Power Systems target revenues10 – 14%1
11%
7%
02468
10121416182022Power
Systems market 6%
11%
7%
Previous EBIT margin targets converted to operational EBITDA margins
Op. EBITDA margin target corridors 2007-15% revenues
1 Excl. Ventyx and Mincom, CAGR 9-13%
2007-2011
2007 2009 9m 112008 2010
2011-2015target
© ABB Group
04 November 2011

© ABB Group March 20, 2012 | Slide 45
85%
15%
50%
50%
Power SystemsFinancial Data
Service
Systems
2011 Orders by TypeApproximate
2011 Orders Geographic MixApproximate
2011 Revenues by businessApproximate
2011 Revenues by region
© ABB Group
EmergingMarkets
Mature Markets
Figures in BUSD2010
Full year2011
Full year
Orders Received 7.9 9.3
Revenues 6.8 8.1
Oper. EBITDA 0.3 0.7
Oper. EBITDA Margin 4.5% 9.1%
Employees ~ 17,300 ~ 19,400
7 March 2012
© ABB Group March 20, 2012 | Slide 46
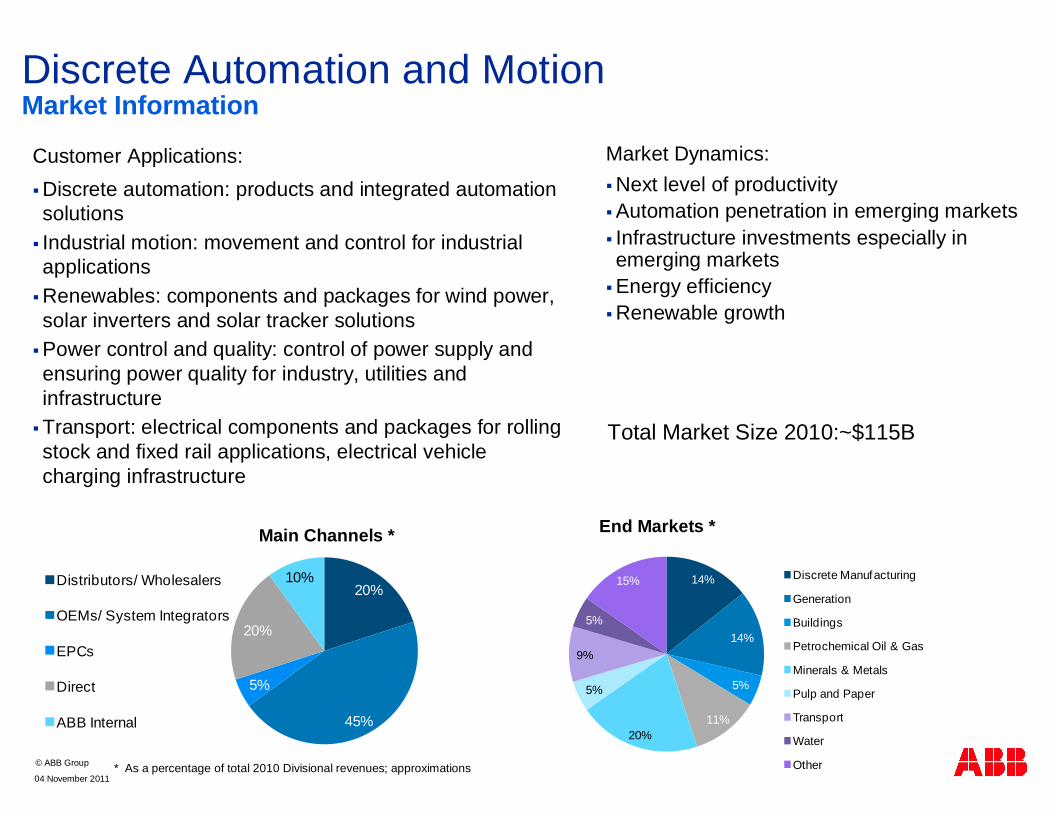
14%
14%
5%
11%20%
5%
9%
5%
15% Discrete Manufacturing
Generation
Buildings
Petrochemical Oil & Gas
Minerals & Metals
Pulp and Paper
Transport
Water
Other
Customer Applications:Discrete automation: products and integrated automation solutionsIndustrial motion: movement and control for industrial applicationsRenewables: components and packages for wind power, solar inverters and solar tracker solutionsPower control and quality: control of power supply and ensuring power quality for industry, utilities and infrastructureTransport: electrical components and packages for rolling stock and fixed rail applications, electrical vehicle charging infrastructure
20%
45%
5%
20%
10%Distributors/ Wholesalers
OEMs/ System Integrators
EPCs
Direct
ABB Internal
Discrete Automation and MotionMarket Information
Market Dynamics:Next level of productivity Automation penetration in emerging markets Infrastructure investments especially in emerging marketsEnergy efficiency Renewable growth
Total Market Size 2010:~$115B
04 November 2011
© ABB Group * As a percentage of total 2010 Divisional revenues; approximations
Main Channels * End Markets *
© ABB Group March 20, 2012 | Slide 47
© ABB Group
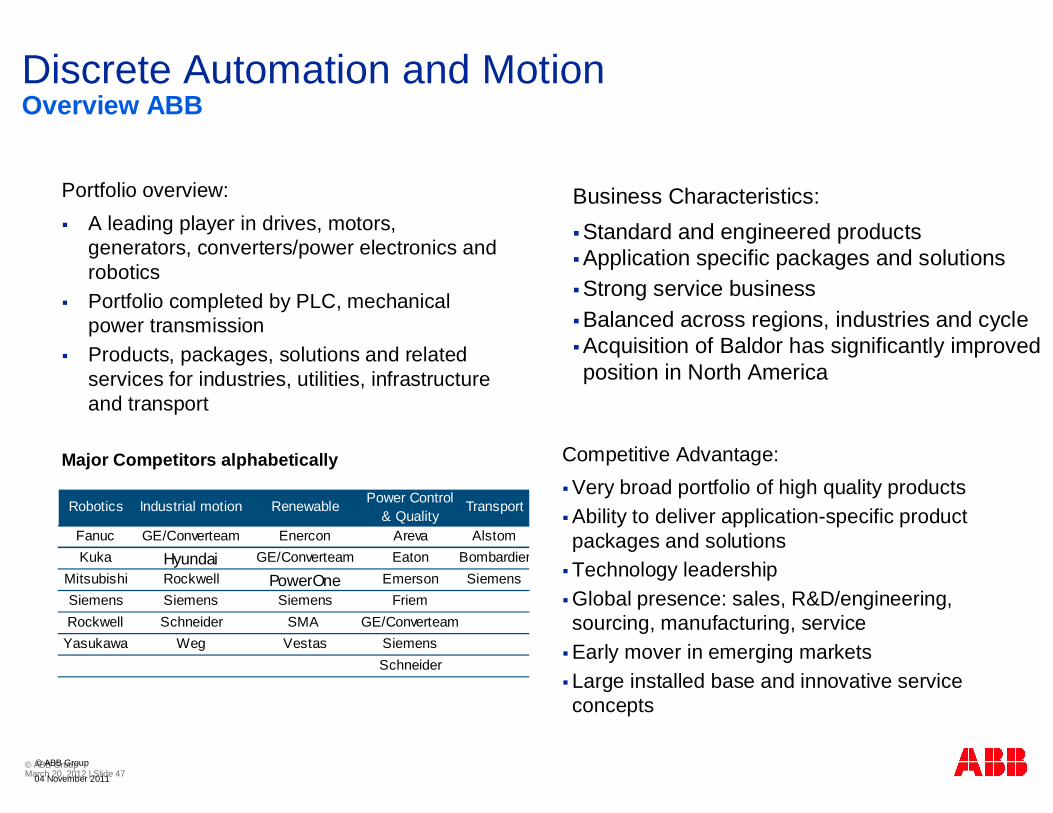
Discrete Automation and Motion
Portfolio overview:A leading player in drives, motors, generators, converters/power electronics and roboticsPortfolio completed by PLC, mechanical power transmissionProducts, packages, solutions and related services for industries, utilities, infrastructure and transport
Overview ABB
Business Characteristics:Standard and engineered productsApplication specific packages and solutions Strong service business Balanced across regions, industries and cycle Acquisition of Baldor has significantly improved position in North America
Competitive Advantage: Very broad portfolio of high quality products Ability to deliver application-specific product packages and solutionsTechnology leadershipGlobal presence: sales, R&D/engineering, sourcing, manufacturing, serviceEarly mover in emerging marketsLarge installed base and innovative service concepts
Robotics Industrial motion Renewable Power Control & Quality
Transport
Fanuc GE/Converteam Enercon Areva AlstomKuka Hyundai GE/Converteam Eaton Bombardier
Mitsubishi Rockwell PowerOne Emerson SiemensSiemens Siemens Siemens FriemRockwell Schneider SMA GE/Converteam
Yasukawa Weg Vestas SiemensSchneider
04 November 2011
Major Competitors alphabetically

© ABB Group March 20, 2012 | Slide 48 8
10121416182022
Discrete Automation and MotionExpand product and application offering
Execution plan for top-line growthExpand discrete automation offeringIndustrial motion: Further expand presence & portfolio Drive renewables component & package growthPower electronics strength for new applications Continue growth in traction, early-mover EV infrastructureFurther tap large installed base with advanced service conceptsGrow application business based on broad portfolio
Execution plan on op EBITDA marginDrive pricing excellenceAim for world-class operations supporting growth and profitabilityEnhance target costing/design-to-costContinue successful footprint and sourcing optimization
Target revenue growth vs market growth 2011-15Compound annual growth rate, base year 2010, % change in local currencies
Discrete Automation
market 7%
Discrete Automation target revenues
12 – 15%1
20%
15%
21%
16%
Op. EBITDA margin target corridors 2007-15% revenues
Previous EBIT margin targets converted to operational EBITDA margins
1 Excl. Baldor, CAGR 7-10%
2007-2011
2007 2009 9m 112008 2010
2011-2015target
04 November 2011
© ABB Group

© ABB Group March 20, 2012 | Slide 49
90%
10%
46%
54%
Discrete Automation and MotionFinancial Data
2011 Revenues by businessApproximate; Inner circle; Excluding . Baldor *
2011 Revenues by regionInner circle; Excluding . Baldor*
Service
Products
Exclud. Baldor Includ. Baldor
© ABB Group
2011 Orders by TypeApproximate
2011 Orders Geographic MixApproximate
EmergingMarkets
Mature Markets
Figures in BUSD2010
Full year2011
Full year
Orders Received 5.9 9.6
Revenues 5.6 8.8
Oper. EBITDA 1.0 1.7
Oper. EBITDA Margin 18.3% 18.9%
Employees ~ 18,300 ~ 27,600
* Estimated figures as if Baldor had not been acquired by ABB in 20117 March 2012
Exclud. Baldor Includ. Baldor
© ABB Group March 20, 2012 | Slide 50
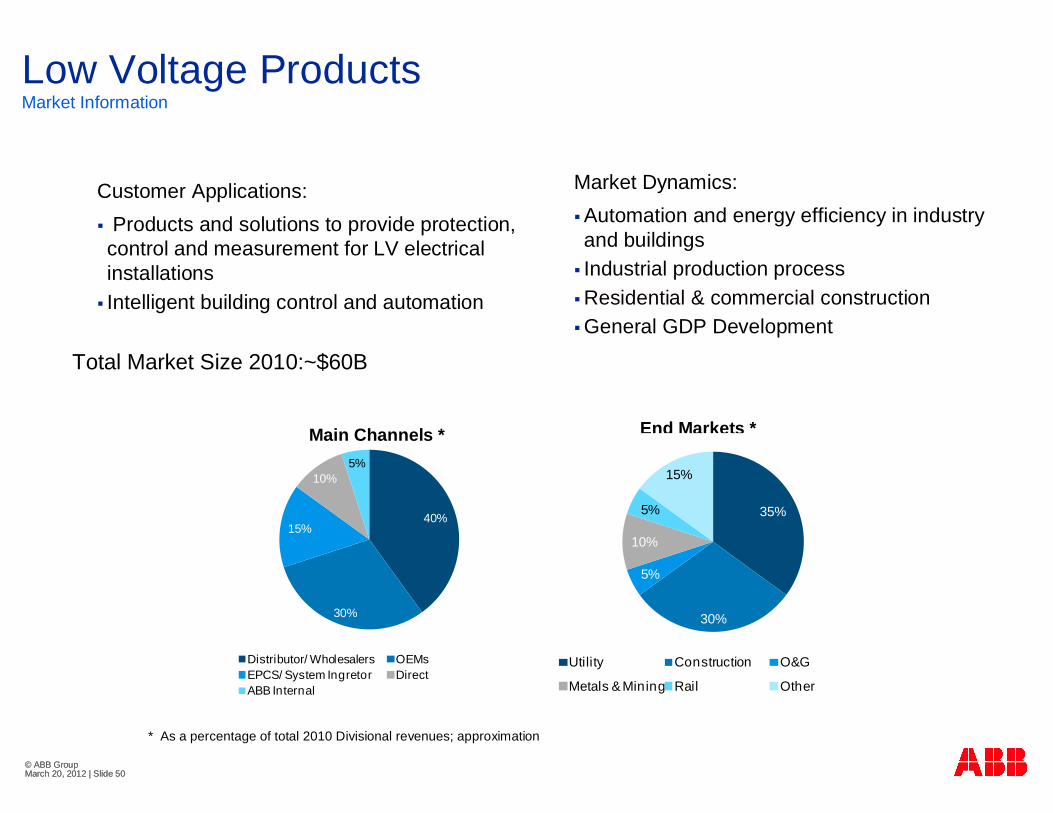
40%
30%
15%
10%5%
Distributor/ Wholesalers OEMsEPCS/ System Ingretor Direct ABB Internal
Low Voltage Products
Customer Applications:Products and solutions to provide protection,
control and measurement for LV electrical installationsIntelligent building control and automation
Market Information
End Markets *Main Channels *
Market Dynamics:Automation and energy efficiency in industry and buildingsIndustrial production processResidential & commercial constructionGeneral GDP Development
Total Market Size 2010:~$60B
* As a percentage of total 2010 Divisional revenues; approximation
35%
30%
5%
10%
5%
15%
Utility Construction O&G
Metals & Mining Rail Other
© ABB Group March 20, 2012 | Slide 50
© ABB Group March 20, 2012 | Slide 51
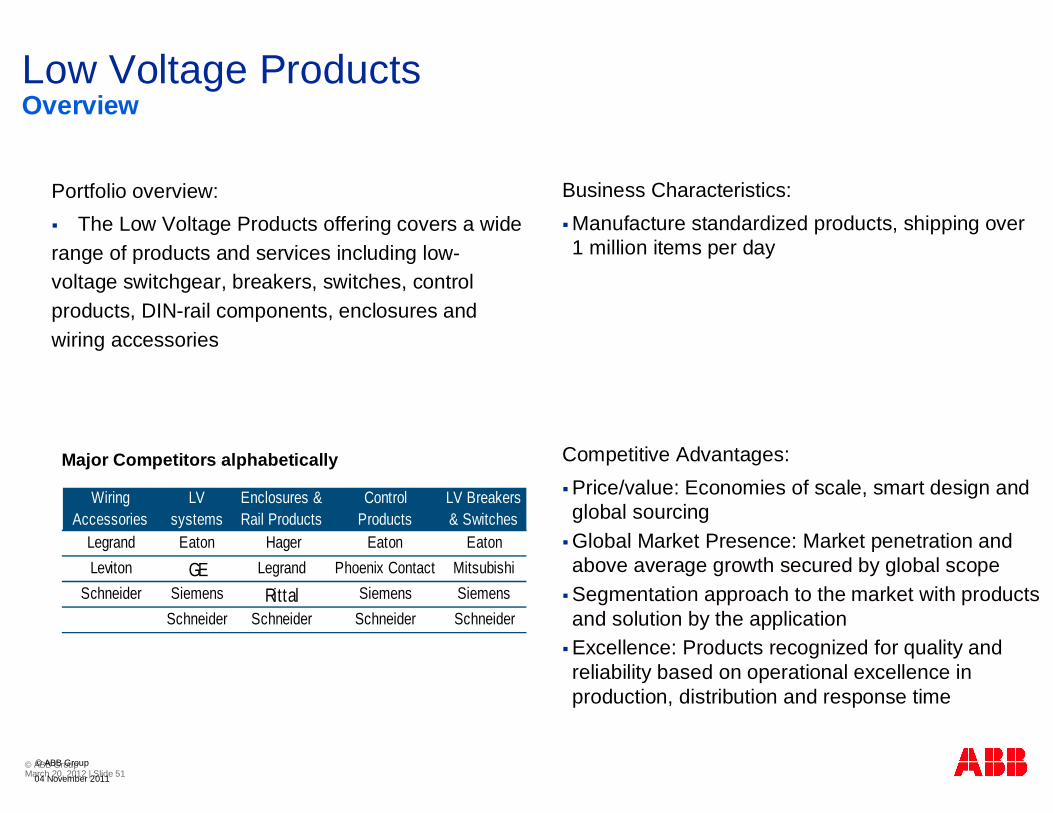
Low Voltage Products
Portfolio overview:The Low Voltage Products offering covers a wide
range of products and services including low-voltage switchgear, breakers, switches, controlproducts, DIN-rail components, enclosures and wiring accessories
Overview
Business Characteristics:Manufacture standardized products, shipping over 1 million items per day
Competitive Advantages: Price/value: Economies of scale, smart design and global sourcing Global Market Presence: Market penetration and above average growth secured by global scope Segmentation approach to the market with products and solution by the applicationExcellence: Products recognized for quality and reliability based on operational excellence in production, distribution and response time
Wiring Accessories
LV systems
Enclosures & Rail Products
Control Products
LV Breakers & Switches
Legrand Eaton Hager Eaton EatonLeviton GE Legrand Phoenix Contact Mitsubishi
Schneider Siemens Rittal Siemens SiemensSchneider Schneider Schneider Schneider
04 November 2011
© ABB Group
Major Competitors alphabetically
© ABB Group March 20, 2012 | Slide 5210
121416182022
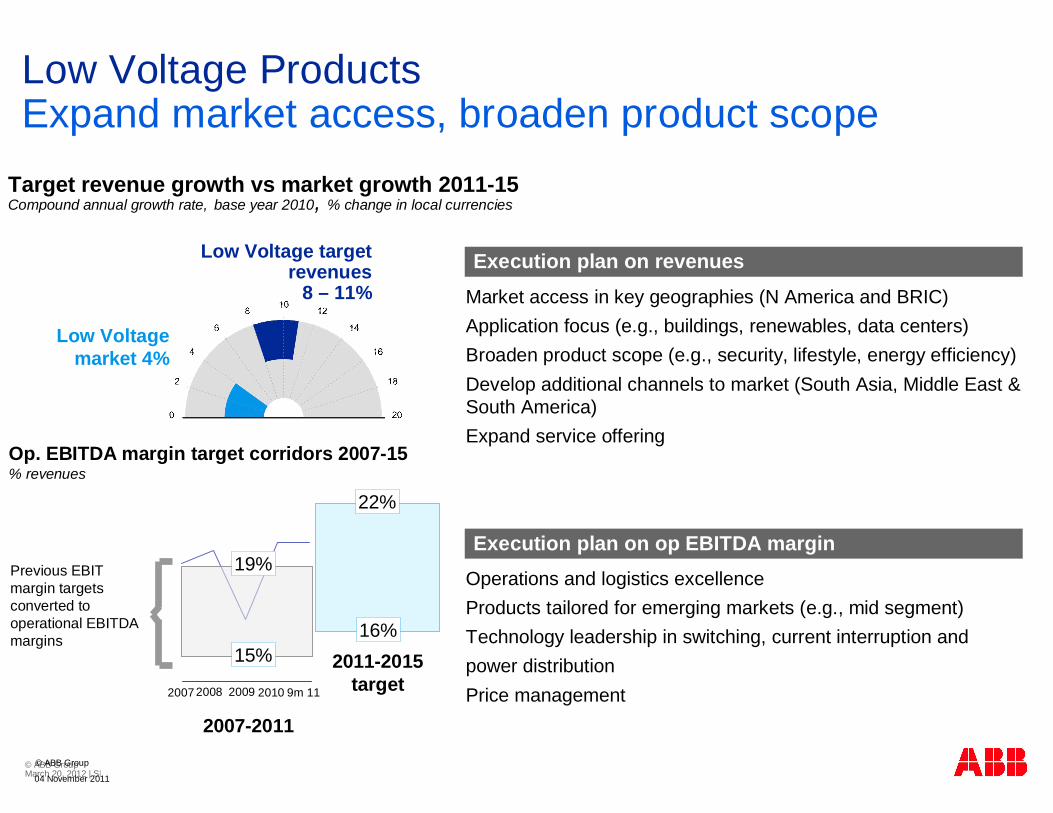
Low Voltage ProductsExpand market access, broaden product scope
Execution plan on revenuesMarket access in key geographies (N America and BRIC)Application focus (e.g., buildings, renewables, data centers)Broaden product scope (e.g., security, lifestyle, energy efficiency)Develop additional channels to market (South Asia, Middle East &South America)Expand service offering
Execution plan on op EBITDA marginOperations and logistics excellenceProducts tailored for emerging markets (e.g., mid segment)Technology leadership in switching, current interruption andpower distributionPrice management
Target revenue growth vs market growth 2011-15Compound annual growth rate, base year 2010, % change in local currencies
Low Voltage market 4%
Low Voltage target revenues
8 – 11%
19%
15%
22%
16%
Op. EBITDA margin target corridors 2007-15% revenues
Previous EBIT margin targets converted to operational EBITDA margins
2007-2011
2007 2009 9m 112008 2010
2011-2015target
© ABB Group
04 November 2011
© ABB Group March 20, 2012 | Slide 53
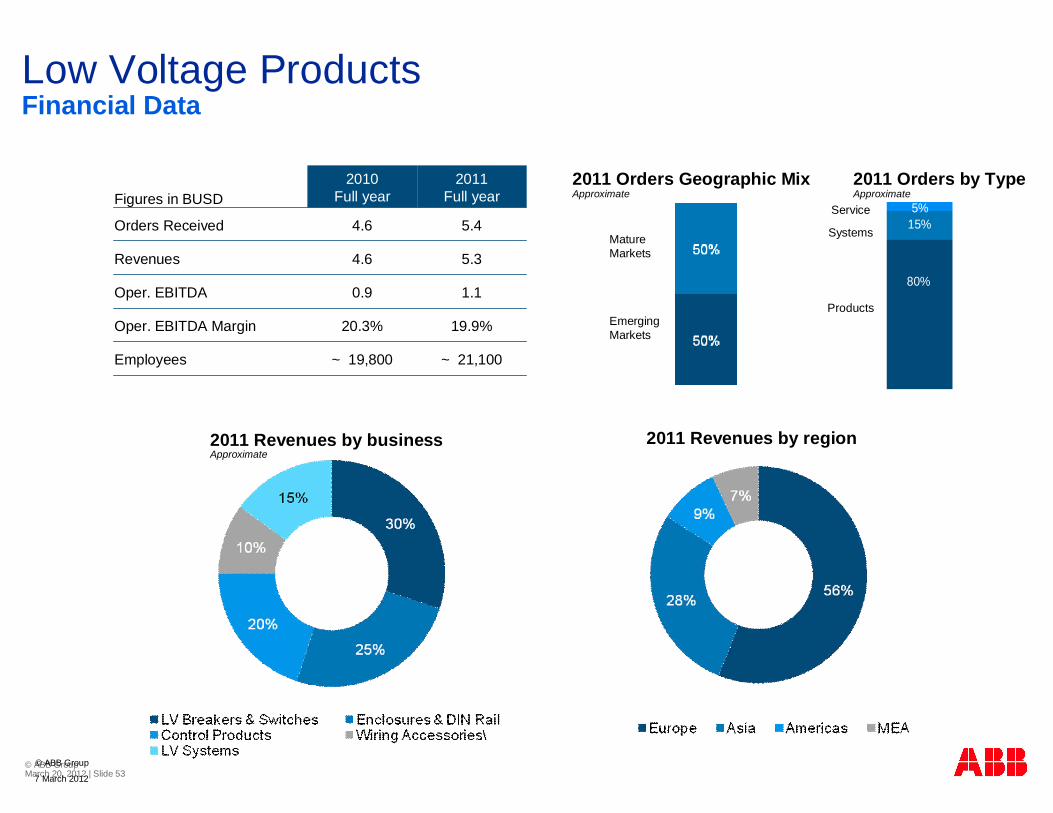
80%
15%5%
Low Voltage ProductsFinancial Data
Service
Products
MEA
Europe
Systems
© ABB Group
2011 Orders by TypeApproximate
2011 Orders Geographic MixApproximate
EmergingMarkets
Mature Markets
Figures in BUSD2010
Full year2011
Full year
Orders Received 4.6 5.4
Revenues 4.6 5.3
Oper. EBITDA 0.9 1.1
Oper. EBITDA Margin 20.3% 19.9%
Employees ~ 19,800 ~ 21,100
2011 Revenues by region2011 Revenues by businessApproximate
7 March 2012

© ABB Group March 20, 2012 | Slide 54
35%
25%
10%
20%
5%5%
Oil &Gas Minerals/ Metals Pulp & Paper
Marine Utility + Water Other
Process Automation
Customer Applications:Process control, safety, energy and information managementPlant maintenance and performance enhancement
Market Information
Market Dynamics:Commodity prices and process industry capexNeed for industrial efficiency and productivity improvements
Total Market Size 2010:~$110B
55%30%
15%
Direct OEM/ System Integrators EPCs
04 November 2011
© ABB Group
Main Channels * End Markets *
* As a percentage of total 2010 Divisional revenues; approximations
© ABB Group March 20, 2012 | Slide 55
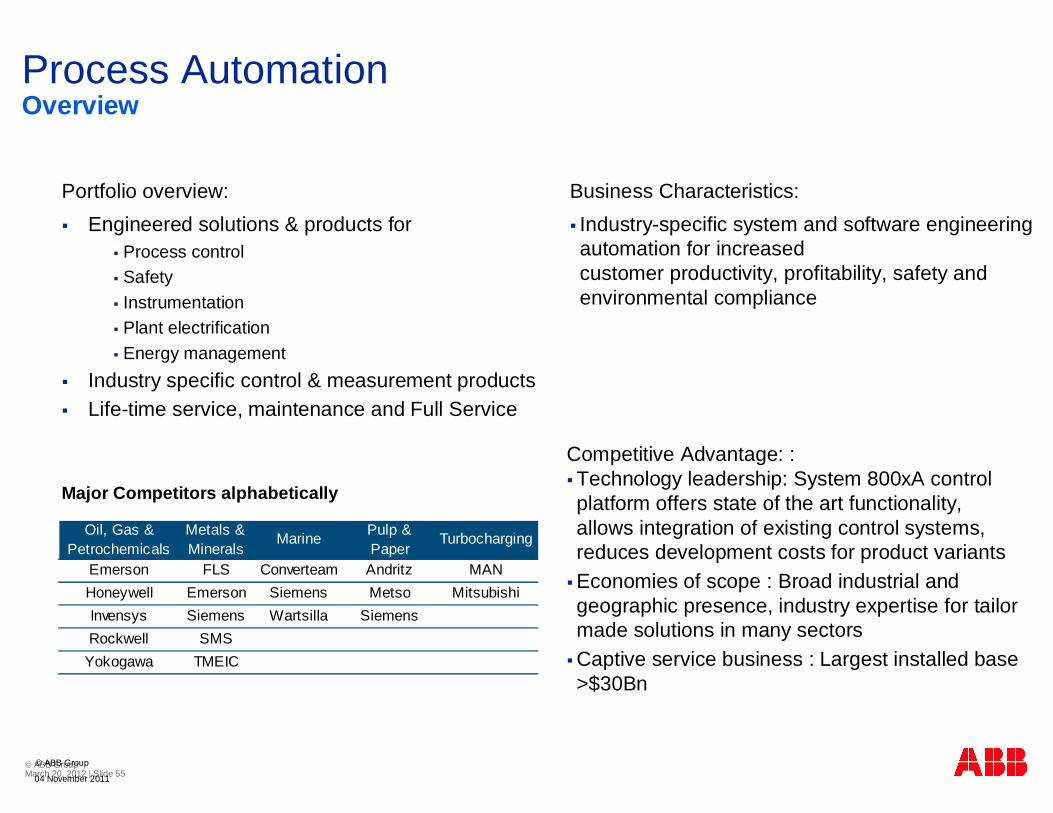
Process Automation
Portfolio overview:Engineered solutions & products for
Process controlSafety Instrumentation Plant electrification Energy management
Industry specific control & measurement productsLife-time service, maintenance and Full Service
Overview
Business Characteristics:Industry-specific system and software engineering automation for increased customer productivity, profitability, safety and environmental compliance
Competitive Advantage: : Technology leadership: System 800xA control platform offers state of the art functionality, allows integration of existing control systems, reduces development costs for product variants Economies of scope : Broad industrial and geographic presence, industry expertise for tailor made solutions in many sectorsCaptive service business : Largest installed base >$30Bn
Oil, Gas & Petrochemicals
Metals & Minerals
Marine Pulp & Paper
Turbocharging
Emerson FLS Converteam Andritz MANHoneywell Emerson Siemens Metso MitsubishiInvensys Siemens Wartsilla SiemensRockwell SMS
Yokogawa TMEIC
04 November 2011
© ABB Group
Major Competitors alphabetically
© ABB Group March 20, 2012 | Slide 56 2
468
10121416182022
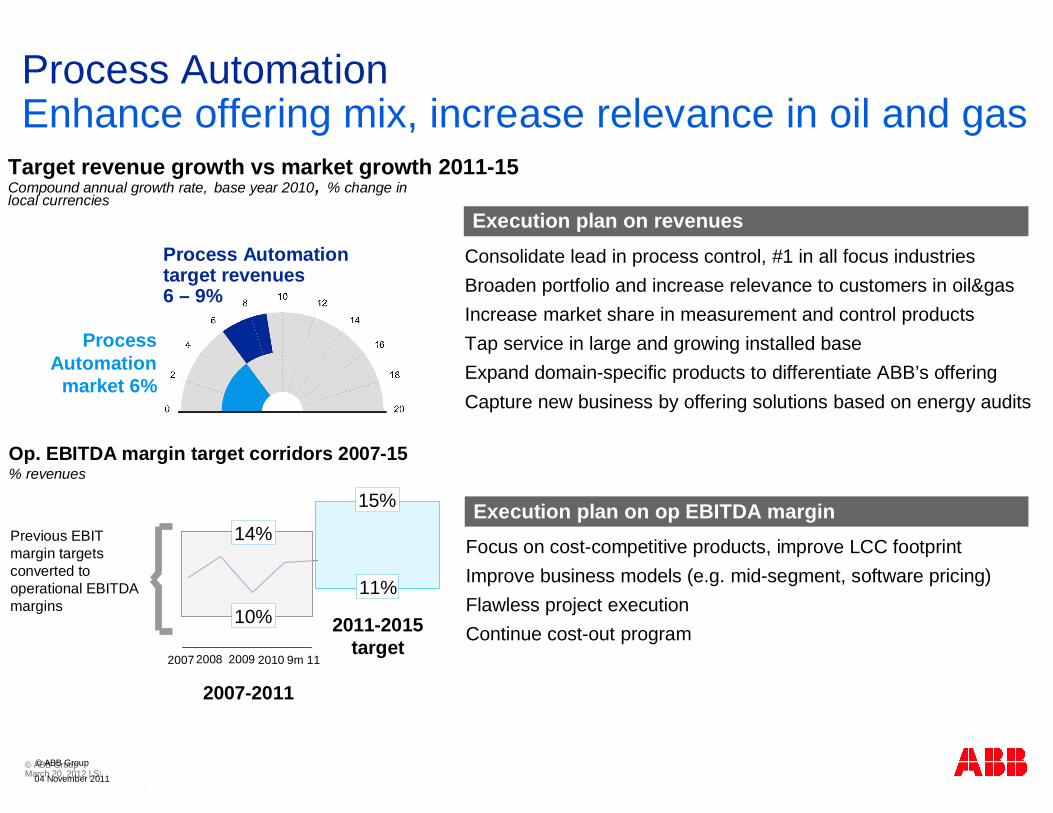
Process Automation Enhance offering mix, increase relevance in oil and gas
Execution plan on revenuesConsolidate lead in process control, #1 in all focus industries Broaden portfolio and increase relevance to customers in oil&gasIncrease market share in measurement and control productsTap service in large and growing installed baseExpand domain-specific products to differentiate ABB’s offeringCapture new business by offering solutions based on energy audits
Execution plan on op EBITDA marginFocus on cost-competitive products, improve LCC footprint Improve business models (e.g. mid-segment, software pricing)Flawless project executionContinue cost-out program
Target revenue growth vs market growth 2011-15Compound annual growth rate, base year 2010, % change in local currencies
Process Automation target revenues6 – 9%
2011-2015target
14%
10%
15%
11%
Previous EBIT margin targets converted to operational EBITDA margins
Op. EBITDA margin target corridors 2007-15% revenues
Process Automation
market 6%
2007-2011
2007 2009 9m 112008 2010
© ABB Group
04 November 2011
© ABB Group March 20, 2012 | Slide 57
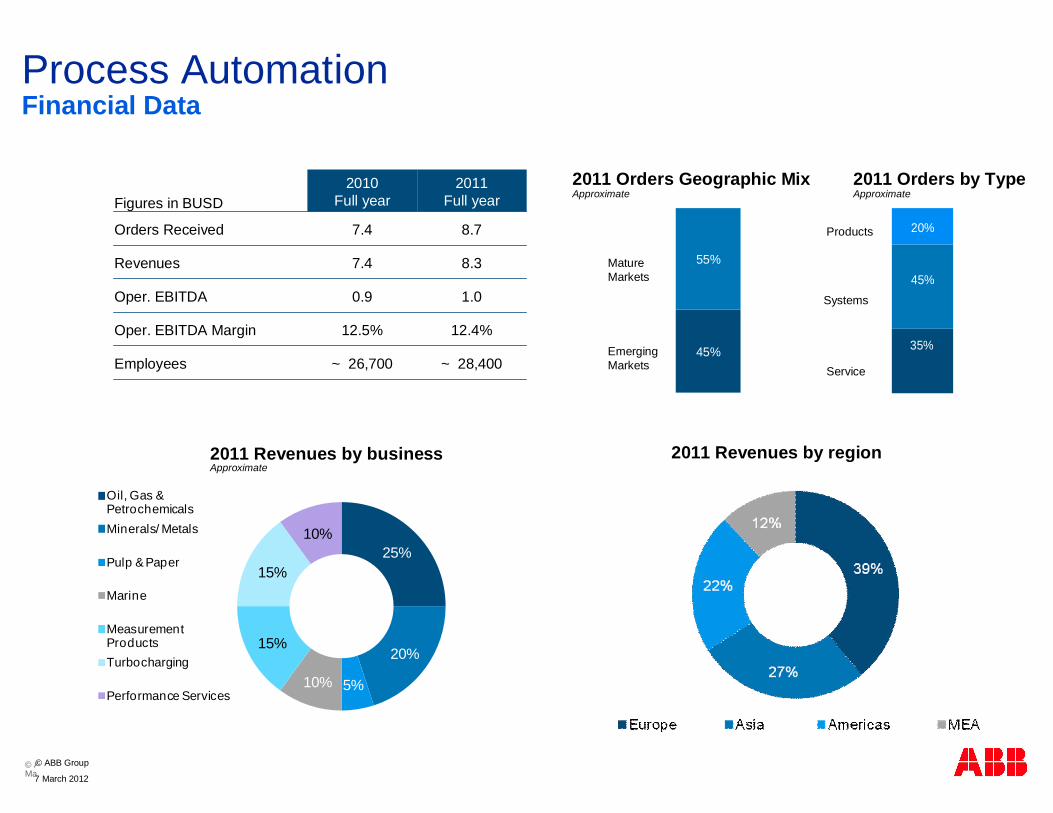
25%
20%
5%10%
15%
15%
10%
Oil, Gas & PetrochemicalsMinerals/ Metals
Pulp & Paper
Marine
Measurement ProductsTurbocharging
Performance Services
© ABB Group
45%
55%
Process AutomationFinancial Data
MEA
Europe
Asia
35%
45%
20%
Service
Products
Systems
2011 Orders by TypeApproximate
2011 Orders Geographic MixApproximate
EmergingMarkets
Mature Markets
Figures in BUSD2010
Full year2011
Full year
Orders Received 7.4 8.7
Revenues 7.4 8.3
Oper. EBITDA 0.9 1.0
Oper. EBITDA Margin 12.5% 12.4%
Employees ~ 26,700 ~ 28,400
2011 Revenues by businessApproximate
2011 Revenues by region
7 March 2012
© ABB Group March 20, 2012 | Slide 58
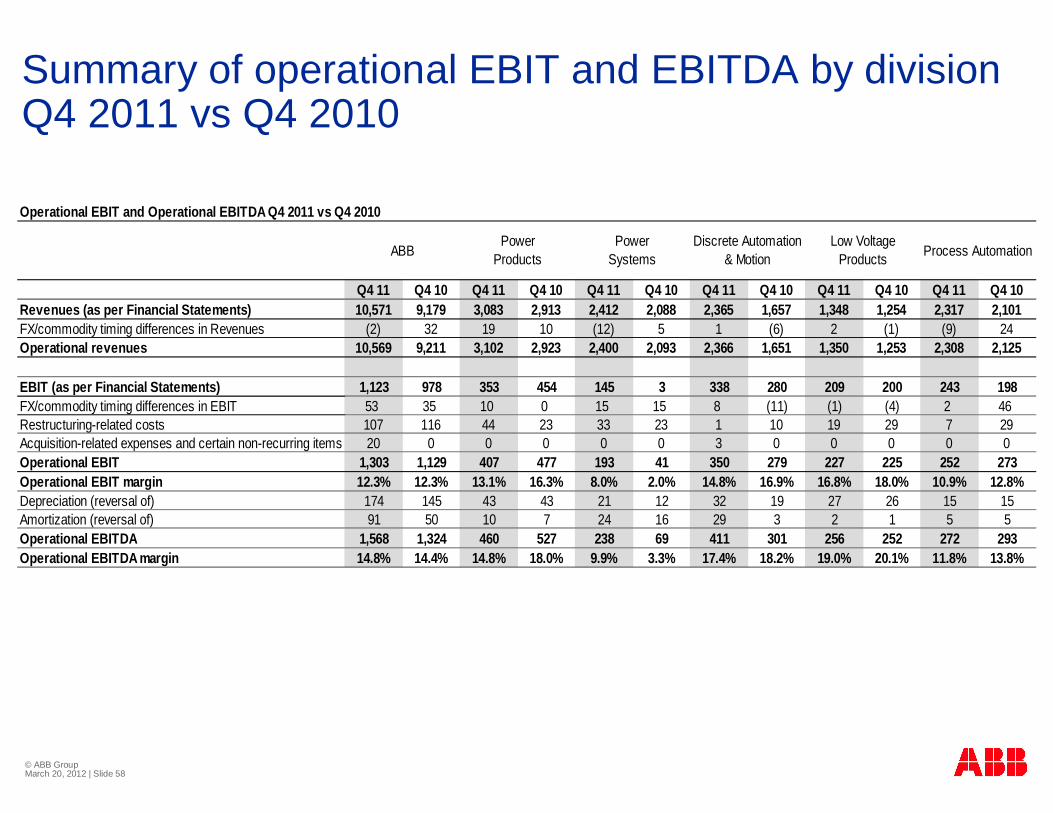
Summary of operational EBIT and EBITDA by divisionQ4 2011 vs Q4 2010
Operational EBIT and Operational EBITDA Q4 2011 vs Q4 2010
Q4 11 Q4 10 Q4 11 Q4 10 Q4 11 Q4 10 Q4 11 Q4 10 Q4 11 Q4 10 Q4 11 Q4 10Revenues (as per Financial Statements) 10,571 9,179 3,083 2,913 2,412 2,088 2,365 1,657 1,348 1,254 2,317 2,101 FX/commodity timing differences in Revenues (2) 32 19 10 (12) 5 1 (6) 2 (1) (9) 24 Operational revenues 10,569 9,211 3,102 2,923 2,400 2,093 2,366 1,651 1,350 1,253 2,308 2,125
EBIT (as per Financial Statements) 1,123 978 353 454 145 3 338 280 209 200 243 198FX/commodity timing differences in EBIT 53 35 10 0 15 15 8 (11) (1) (4) 2 46Restructuring-related costs 107 116 44 23 33 23 1 10 19 29 7 29 Acquisition-related expenses and certain non-recurring items 20 0 0 0 0 0 3 0 0 0 0 0 Operational EBIT 1,303 1,129 407 477 193 41 350 279 227 225 252 273Operational EBIT margin 12.3% 12.3% 13.1% 16.3% 8.0% 2.0% 14.8% 16.9% 16.8% 18.0% 10.9% 12.8%Depreciation (reversal of) 174 145 43 43 21 12 32 19 27 26 15 15Amortization (reversal of) 91 50 10 7 24 16 29 3 2 1 5 5Operational EBITDA 1,568 1,324 460 527 238 69 411 301 256 252 272 293Operational EBITDA margin 14.8% 14.4% 14.8% 18.0% 9.9% 3.3% 17.4% 18.2% 19.0% 20.1% 11.8% 13.8%
Process AutomationABBPower
ProductsPower
SystemsDiscrete Automation
& MotionLow Voltage
Products

© ABB Group March 20, 2012 | Slide 59
© ABB Group March 20, 2012 | Slide 59
Appendix: Definitions of non-GAAP measures 1
Organic: includes acquisitions closed by October 31, 2011
Operational EBIT: Earnings before interest and taxes (EBIT) adjusted for i) unrealized gains and losses on derivatives (FX, commodities, embedded derivatives), ii) realized gains and losses on derivatives where the underlying hedged transaction has not yet been realized, iii) unrealized foreign exchange movements on receivables/payables (and related assets/liabilities), iv) restructuring and restructuring-related expenses, and v) charges related to significant acquisitions.
Operational EBITDA: Operational EBIT adjusted for depreciation and amortization
Operational revenues: Revenues adjusted for i) unrealized gains and losses on derivatives, ii) realized gains and losses on derivatives where the underlying hedged transaction has not yet been realized, and iii) unrealized foreign exchange movements on receivables (and related assets).
Operational EBIT margin: Operational EBIT as a percentage of operational revenues
Operational EBITDA margin: Operational EBITDA as a percentage of operational revenues

© ABB Group March 20, 2012 | Slide 60
© ABB Group March 20, 2012 | Slide 60
Appendix: Definitions of non-GAAP measures 2
ROCE: Return on capital employed, calculated as 12 months EBIT x (1-tax rate) divided by capital employed
Capital employed: the sum of fixed assets and net working capital
Fixed assets: the sum of property, plant and equipment (net), goodwill, other intangible assets (net) and investments in equity method companies
Net working capital (NWC): the sum of i) receivables, net, ii) inventories, net, and iii) prepaid expenses; less iv) accounts payable, trade, v) billings in excess of sales, vi) employee and other payables, vii) advances from customers, and viii) accrued expenses
Normalized earnings per share: Reported basic earnings per share (undiluted) adjusted in the relevant periods for i) the gain on the sale of ABB Lummus Global, ii) the recognition of certain deferred tax assets (DTA), iii) the impact of compliance provisions, iv) costs associated with the cost take-out program and/or restructuring and restructuring-related costs, v) the mark-to-market treatment of hedging transactions and unrealized FX movements on receivables/payables, and vi) Baldor acquisition costs
© ABB Group March 20, 2012 | Slide 61
© ABB Group March 20, 2012 | Slide 61
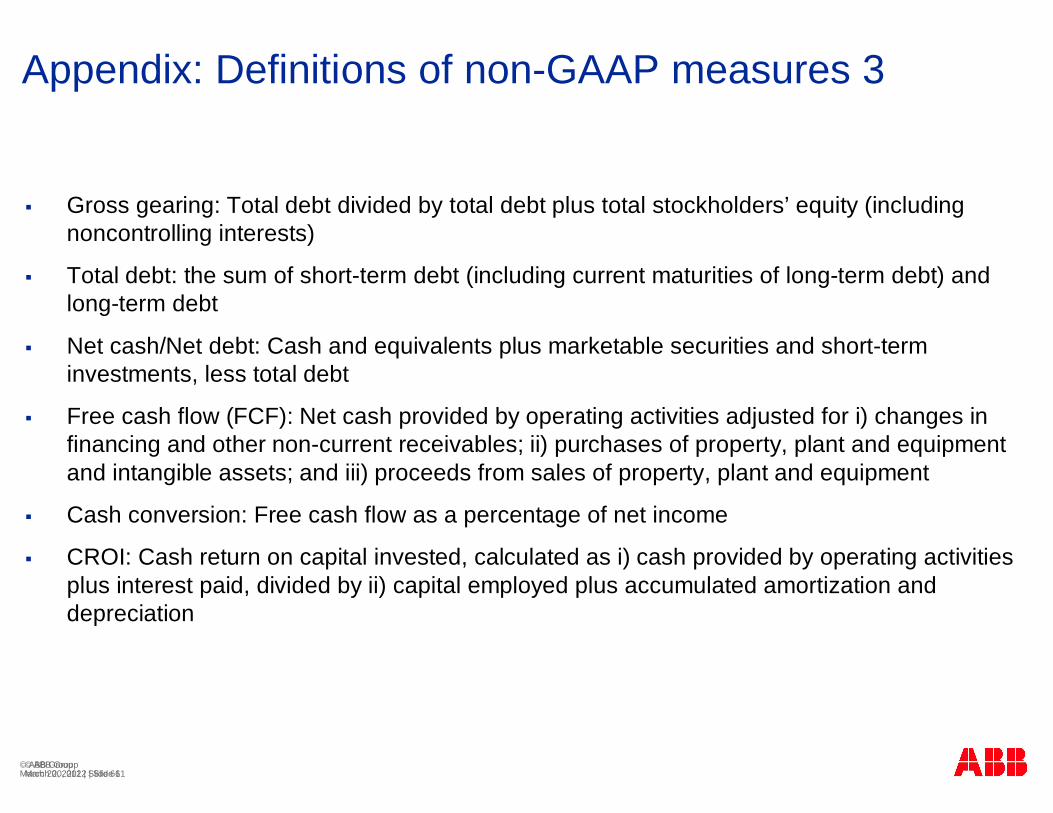
Appendix: Definitions of non-GAAP measures 3
Gross gearing: Total debt divided by total debt plus total stockholders’ equity (including noncontrolling interests)
Total debt: the sum of short-term debt (including current maturities of long-term debt) and long-term debt
Net cash/Net debt: Cash and equivalents plus marketable securities and short-term investments, less total debt
Free cash flow (FCF): Net cash provided by operating activities adjusted for i) changes in financing and other non-current receivables; ii) purchases of property, plant and equipment and intangible assets; and iii) proceeds from sales of property, plant and equipment
Cash conversion: Free cash flow as a percentage of net income
CROI: Cash return on capital invested, calculated as i) cash provided by operating activities plus interest paid, divided by ii) capital employed plus accumulated amortization and depreciation
© ABB Group March 20, 2012 | Slide 62
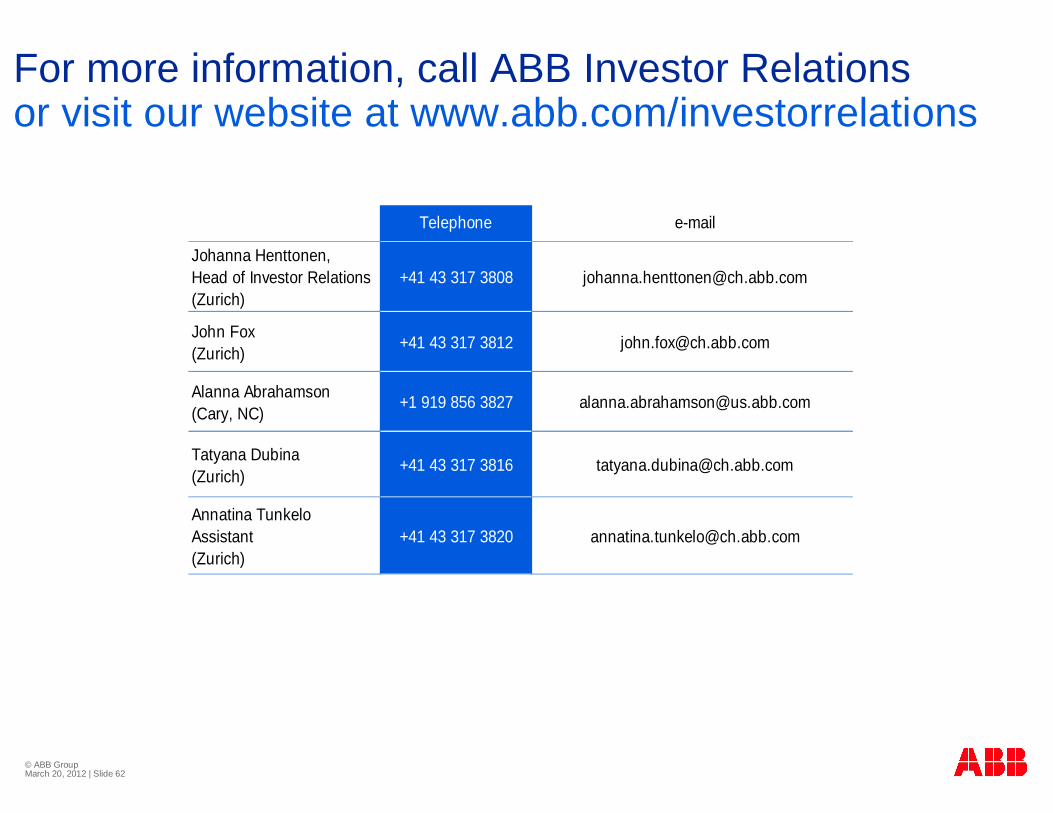
For more information, call ABB Investor Relationsor visit our website at www.abb.com/investorrelations
Telephone e-mail
Johanna Henttonen, Head of Investor Relations (Zurich)
+41 43 317 3808 [email protected]
John Fox(Zurich) +41 43 317 3812 [email protected]
Alanna Abrahamson (Cary, NC)
+1 919 856 3827 [email protected]
Tatyana Dubina (Zurich)
+41 43 317 3816 [email protected]
Annatina Tunkelo Assistant(Zurich)
+41 43 317 3820 [email protected]