abatement invest1gation for the … nswc tr 81-431.0 noise abatement investigation for the...
TRANSCRIPT

RD-Ai22 292 NOISE ABATEMENT INVEST1GATION FOR THE BLOODSWORTH --- 2ISLAND TARGET RANGE: DE..(U) NAVAL SURFACE WEAPONSCENTER SILVER SPRING MD R A LORENZ 02 NOV 81
UNCLASSIFIED NSWC/TR-Si-43i SBI-AD-F500 698 F/G 01/2, N

rr3- -i ,---.
L .I
. ._, , m , l
.1.
1111-5
MIRCPYRSLUNTS HR
NATIONAL BUREAU OF STANDARDS- I963-A
..... . i J m. _ ,... ,,, _. p :, .. ,. . .. ... .- .. . ....,., . _ . .. .- ...
Lt
7,I

NSWC TR 81-431.0
NOISE ABATEMENT INVESTIGATION FOR THEBLOODSWORTH ISLAND TARGET RANGE: 0
DESCRIPTION OF TEST PROGRAM AND NEW> LONG RANGE AIRBLAST OVERPRESSURE
-' .PREDICTION METHOD
BY RICHARD A. LORENZ
-RESEARCH AND TECHNOLOGY DEPARTMENT
. 'NOVEMBER 1981
Approved for public rehme, distibution unlimited. D T IC -
ELEC fDES 1 0 1982
A
NAVAL SURFACE WEAPONS CENTER "
Dahlgren, Virginia 22448 0 Silver Spring, Maryland 20910
82 12 07 004 "• .. . , - - m~mm mmmmm rl m
- ' '-mmmmm00 4lt~ m mm
JNCLASSIFIEDI
,ECU.
,IT Y Cl-ASSICICAION ',)F T-IS IMGE 'When Data Entered)
REPORT DOCUMENTATION PAGE READ INSTRUCTIONSBEFORE COMPLETING FORM
1. REPORT 4UMilER . GOVT AQC.SION NO. 3. RE i IoENT'S ATAL.OG NUMBER
NSWC TR 81-431 Aqtl _----_---
4. TITLE emd Subtitle) S. TYPE OF REPORT I PERIOD COVEREDNOISE ABATEMENT INVESTIGATION FOR THE BLOODS- FinalWORTH ISLAND TARGET RANGE: DESCRIPTION OFTEST PROGRAM AND NEW LONG RANGE AIRBLAST 6. PERFORMING ORG. RPORT NUMSE"OVERPRESSURE PREDICTION METHOD O R
7. AUTHOR( ) S. CONTRACT OR GRANT NUMIER(j
Richard A. Lorenz
9. MERFORMING ORGANIZATON NAME AND AODRESS 10 PqOGRAM ELEMENT. PROJECT, TASK% AREA & WORK€ UNIT NUMBERSNaval Surface Weapons Center (Code R15) AU
White Oak 0NN , 0, 0, CRI3GCSilver Spring, Maryland 2091011. CONTROLLING OFFICE NAME ANO ADDRESS I2. REPORT DATE
Commander-in-Chief, U.S. Atlantic Fleet 2 Nov 1981Code N322 [3. NUMSER OF PAGESNorfork, Virginia 23511 10314. MONITORING AGENCY NAME A AODRESS(If different from Controllilng Office) IS. SECURITY CLASS. (of thie teport)
UNCLASSIFIED
13a. OECLASSIFICATIONiOOWNGRAOINGSCMEDULE
IS. DISTRIBUTION STATEMENT (of this Report)
Approved for public release; distribution unlimited
17. DISTRISUTION STATEMENT (of the abetract entered In Block 20, If dlferent from Report)
14. SUPPLEMENTARY NOTES
19. KEY WORDS (Continue on revere, side If neceeema, and Identify by block number)
Explosions Airblast Propagation Overpressure MeasurementsTarget Range Sound Propagation Overpressure PredictionsCommunity Noise Sound Focusing Weather EffectsNoise Abatement
20. ABSTRACT (Continue on reverse side If necesery mid Identify by block number)
A new airblast magnitude prediction method has been developed in aneffort to reduce the impact of naval explosive exercises (both airdropsand naval gunfire) on the communities surrounding the Bloodsworth Islandcargec range in the Chesapeake 3ay. 7-his method Lses taiurad or"forecast upper air meteorological data to predict the airblast levels tobe expected in the neighboring communities from explosions of any size.The maximum, median, and ainimum expected airblast levels, as well as
IjDD 4=s3 1473 £DITION OF 1 -V SS jS OBSO-'. UNCLSSIFIED
39CJ-PITY ' ASSIFiAT1O% 01 -- IS 0409-r 'NWe,. Data Krler.L,

UNCLASSIFIEDSZCRITY CLASSIFICATION Of THIS PAGE ( ll Data Entered)
20. ABSTRACT (Cont.)
the statistical distribution,. can be determined. The method is applicable
to both positive and negative sound velocity gradients and should beadaptable to other explosive operations.
Typical range operations were monitored in the communities surrounding thetarget area and the airblast measurements were correlated with weatherdata taken during the exercises. This report describes the test programand the acquired data. Justification for the new airblast magnitude
prediction method is given. General directions for programming theprediction method on any computer are provided. A shoot/no shoot decision
procedure is proposed which should eliminate noise and damage complaints
from Navy exercises on Bloodsworth Island. Finally a new and simple
method to estimate the locations of caustics is described.
I
UNCLASS IFIED
SECURITY C'IASSIFICATION OF THIS PAGEI'W Isn Data Entered)

NSWC TR 81-431
FOREWORD
In response to community complaints and damage claims, an extensive inves-
tigation was conducted by the Naval Surface Weapons Center on the effects of
naval activities (bomb drops and gunnery exercises) at the Bloodsworth Island
target range on adjacent Eastern Shore populated areas. It is important to know
the physical airblast phenomena that cause these complaints and to develop oper-
ational techniques and procedures that will reduce and hopefully eliminate
future complaints. This effort stemmed from the Navy's commitment and concern
for the impact of its operations on the environment and for the maintenance of
good relations with its neighbors. Funding for this work was provided by
CINCLANTFLT through Work Request No. V0006078WR0313.
The author would like to acknowledge the efforts of Joseph E. Berry, who
planned, organized, and supervised the experimental test program, who supervised
the overpressure and ground motion data digitization, and who was at all times
responsible for the good health of the instrumentation. The author would also
like to thank Roy W. Huff, who performed the bulk of the very tedious data
reduction. The professional guidance and leadership of James F. Proctor are
also recognized and appreciated.
The mention of proprietary items or company names in this report is for
technical information purposes only. No endorsement or criticism is intended.
J. F. PROCTOR 1 "
By direction J 1ati~cato
~Dist.ribution/ -
AvailcbillitY ,+,
Avajl ild/or
.T T. + --. I.'. .T .p.. 2 ".C . ' - -
NSWC TR 81-431
CONTENTS
Chapter Page
INTRODUCTION ................................... I-
BACKGROUND ......................... I-
TASK 1. DATA BASE ..................................... I-
TASK 2. FOCUSING PREDICTION METHODS. .................. 1-2
TASK 3. DAMAGE AND NUISANCE CRITERIA................... 1-2
TASK 4. SHOOT/NO SHOOT PROCEDURE ...................... 1-2
SCOPE OF THE REPORT ................... .. ...... 1-3
DATA BASE REPORT ............. . ............... . ........ 1-32 TEST ROAM........................ 2-1
TYPES OF DT........................ 2-1
MONITORING STATION LOCATIONS............................. 2-1
WEATHER STATIONS......................................... 2-6
COORDINATION ................................... 2-9
INSTRUMENTATION .......... ,...................... 2-11
3 AIRBLAST OVERPRESSURE AND GROUND MOTION DATA .............. 3-1
AMOUNT OF DATA ............. ........................... 3-1DATA REDUCTION .......................... ..............~oo~ 3-I
MK 82 BOMB DATA.............................. ....... 3-25" GUNFIRE DATA.......................................... 3-6
COMPLAINTS DURING INVESTIGATION.......................... 3-6
4 WEATHER DATA............................................... 4-1
AMOUNT OF DATA. .......... .. ....... .... . *............ 4-1DATA REDUCTION .......... ..................... 4-1
COMPARISON OF WEATHER STATIONS ........................ 4-5
I ii
NSWC TR 81-431
CONTENTS (Cont.)
Chapter
5 AIRBLAST MAGNITUDE PREDICTION METHODS....................... 5-1
FWC METHOD .. EE....................................... 5-2
SIPS METHOD ............................... ....... 5-3
OTHER METHODS ......................... *.. ..... .. ........ 5-4
OVERPRESSURE AND WEATHER CORRELATIONS ...................... 5-5WEATHER PARAM2ETER.*o9o.s9 .. .o....o..o. 5-5
NAIRBLAST PARAMETER ...................... es ...... 5-8
CORRELATIONS ........................................... 5-8
SCALING CONSIDERATIONS .............. ............. . 5-18FOCAL POINT APPROXIMATION ... o....e...5-21
DISCUSSION ...................... 5-22
NSWC PREDICTION METHOD ................ .o.... . ........ ... 5-23
LOCAL NOISE REGULATIONS ............................ ......... 6-2STATE OF MARYLAND NOISE ACT .......... o. 6-1
IDPL SIV NOISE ........................................... 6-2MULTIPLE PULSES .................................. ....... 9. 6-4
DISCUSSION ................. o............................ 6-4
I RECOMMENDED SHOOT/NO SHOOT DECISION PROCEDURE ........... o.. 7-1
WEATHER SOUNDINGSX T M ..OD F ..... .....RMNIG.AUTI.R.ES..... 7-i
APPENDIX B--GENERAL INSTRUCTIONS FOR PROGRAMMING THE NSWC LONG RANGE
AIRELAST OVERPRESSUE PREDICTION METHOD. . . B-I
DAMAE CITERA*6ooooooeeoooo~o..,oooooeeoeeweoo,
iv
.U SC . . . . - , . . . . . . 7 .
_ ---a mmm -- = I R = A T OVERPRESSURE -P"REDICTION H . H . , . . ..... .. . ... -1 -
NSWC TR 81-431
ILLUSTRATIONS
Figure Page
2-1 MONITORING STATIONS ............................. 2-4
2-2 CHESAPEAKE BAY AREA ...................................... 2-8
2-3 BLOODSWORTH ISLAND NOISE INVESTIGATION FIELD ORGANIZATION.. 2-10
3-1 FREQUENCY-RESPONSE CHARACTERISTICS FOR 1933 SLM, WITH
AND WITHOUT STANDARD WEIGHTING NETWORKS.... .. o.......... 3-3
3-2 TYPICAL ANALOG RECORDS OF MK 82 BOMB EVENTS ................ 3-4
3-3 TYPICAL DIGITIZED RECORDS OF 11K 82 BOMB EVENTS ............. 3-5
3-4 TYPICAL ANALOG RECORDS OF 5"/54 NAVAL GUNFIRE ..... o......... 3-7
3-5 TYPICAL DIGITIZED RECORDS OF 5"/38 NAVAL GUNFIRE ........... 3-8
4-1 SAMPLE SOUND SPEED PROFILES............................... 4-4
4-2 COMPARISON OF PREDICTIONS BASED ON NATC AND WALLOPS
ISLAND WEATHER DATA.......... ............................ 4-6
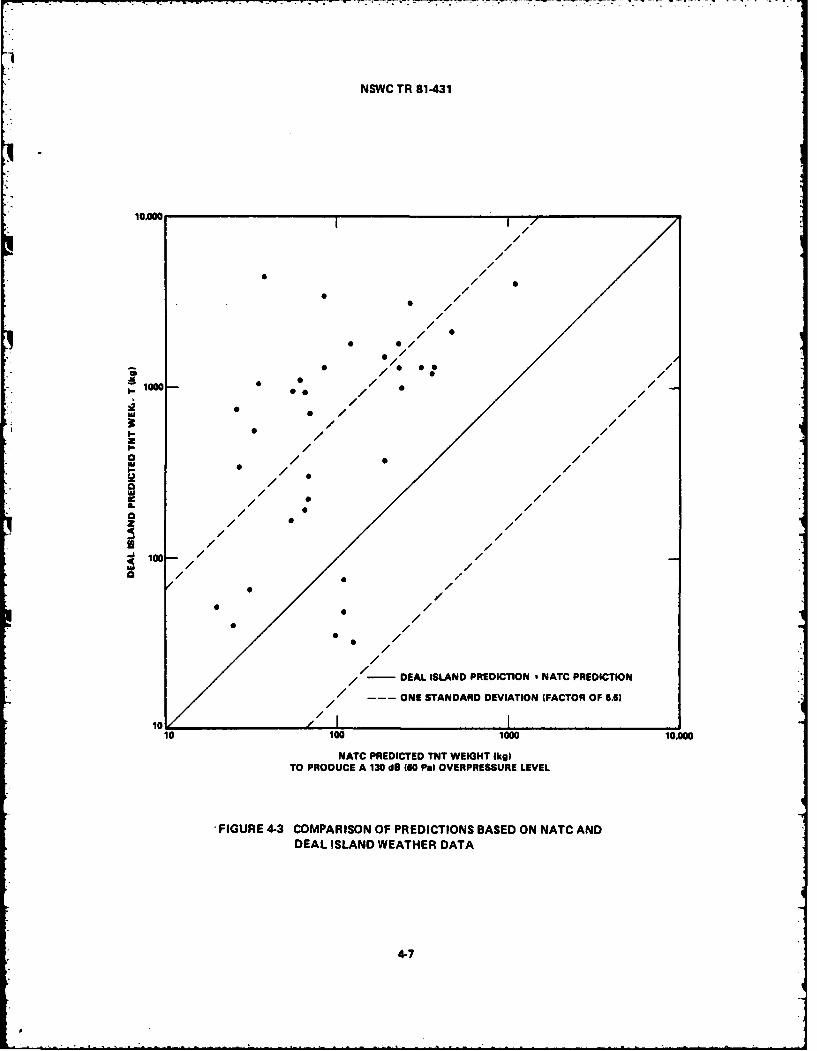
4-3 COMPARISON OF PREDICTIONS BASED ON NATC AND DEAL
ISLAND WEATHER DATA................. ..................... 4-7
4-4 COMPARISON OF PREDICTIONS BASED ON WALLOPS ISLAND AND
DEAL ISLAND WEATHER DATA................................. 4-8
5-1 SOUND SPEED PROFILE DEFINING TERMS IN EQUATION 5.2 FOR ... 5-7
5-2 MK 82 BOMB DATA FROM TOP POINT AND CRISFIELD............... 5-9
5-3 MK 82 BOMB AND MULTI-TON DATA .............. ................ 5-14
5-4 DISTRIBUTION OF MK 82 BOMB AND MULTI-TON DATA .............. 5-16
5-5 5" SHELL EXPLOSION DATA FROM DEAL ISLAND AND TOP POINT ..... 5-17
5-6 MUZZLE BLAST DATA FROM DEAL ISLAND AND TOP POINT........... 5-19
5-7 RECORDED PRESSURE AMPLITUDES VERSUS SOUND VELOCITY
DIFFERENCES IN THE BOUNDARY LAYER, AT YIELD-SCALED
DISTANCE OF 400 m FROM I kg TNT.......................... 5-20
V

-~~. ..-*-,- .. . . .t .
NSWC TR 81-431
ILLUSTRATIONS (Cont.)
Figure Page
A-I SOUND SPEED PROFILE INDEXING CONVENTION .................... A-2
A-2 COMPARISON OF CUBIC AND QUADRATIC FOCAL POINT PREDICTION
FORMULAS. ....... . ....... A-8
TABLES
Table Page
2-1 EVENT SCHEDULE ..................... .......... .. 2-2
2-2 TEST ACTIVITIES ................... 2-3
2-3 MONITORING STATION IDENTIFICATION ......................... 2-5
2-4 MONITORING STATION ORIENTATION ........................... 2-7
2-5 MEASUREMENTS... *. ..... o 2-14
3-1 INFORMAL COMPLAINTS DURING INVESTIGATION ................... 3-9
4-1 SAMPLE WEATHER DATA...................... 4-3
5-1 MULTI-TON SHOTS ..................... .............. ..... 5-11
5-2 MULTI-TON SHOT DATA .................... . .. .. ....... * .... 5-12
7-1 DAILY SOUND LEVELS DURING TESTS .............. oooe...* .... 7-7
vi
4/
* - - -- ~ - . . * . . - . .- . . ,
NSWC TR 81-431
CHAPTER I
INTRODUCTION
BACKGROUND
During the early and mid 70's, the Naval Surface Weapons Center (NSWC) was
requested on numerous occasions by the Navy Judge Advocate General's Office
(JAG) and Commander, Naval Surface Force, U.S. Atlantic Fleet (COMNAVSURFLANT)
to evaluate the validity of damage claims and nuisance complaints from airdrop
and gunnery exercises on Bloodsworth Island. On the surface it appeared that
the possibility and probability of naval exercises causing damage were remote,
but the number, frequency, and documentation of the complaints certainly added
credence to their validity. In September 1976 NSWC acknowledged this fact and
recommended to JAG that a technical investigation be made of the Bloodsworth
Island range operations that included measurements of sound pressure levels and
ground motion from typical airdrop and gunnery exercises with supporting upper
air meteorological measurements. The recommendation was accepted with
Commander-in-Chief, U.S. Atlantic Fleet (CINCLANTFLT) as the sponsoring and
directing organization.
OBJECTIVES
In an effort to reduce the impact of naval airdrop and gunnery exercises on
the neighboring communities, an extensive investigation was conducted in the
Bloodsworth Island area between mid-September and mid-October 1978. The objec-
tives of this investigation were as follows:
TASK 1. DATA BASE. Measure airblast levels and ground motion from naval
gunfire and aerial bombing under known meteorological conditions to form a data
base from which a shoot/no shoot decision procedure can be formulated.
1-1 -

NSWC TR 81-431
Characterize the records obtained in terms of parameters such as peak over-
pressure, peak velocity, impulse, energy, and frequency content in an effort to
determine which parameters are the main cause of damage and nuisance com-
plaints.
TASK 2. FOCUSING PREDICTION METHODS. Examine existing airblast foc sing
prediction methods to determine the optimum prediction technique in terms of
accuracy and ease of use.
Determine the best geographic locations from which to take meteorological
soundings that most accurately represent airblast focusing conditions in the
areas surrounding Bloodsworth Island.
TASK 3. DAMAGE AND NUISANCE CRITERIA. Identify the airblast and ground
motion parameters that cause damage and nuisance complaints. Define the thresh-
old values of these parameters.
Compare the data base to local, State, and Federal Environmental Protection
Agency (EPA) noise regulations and determine the status of Navy compliance for
the Bloodsworth Island operations.
TASK 4. SHOOT/NO SHOOT PROCEDURE. Formulate and recommend a shoot/no shoot
decision procedure for Navy explosion exercises on Bloodsworth Island that will
provide minimum noise levels to citizens living near the range. The procedure
should consider weather forecasts, focusing predictions, noise and damage crite-
ria, and specific Navy priorities and needs.
1-2
.............. **

NSWC TR 81-431
SCOPE OF THE REPORT
This report updates and completes the material presented in the interim
report.1'2 Chapter 2 summarizes the data acquisition test program. Chapter 3
describes the airblast and ground motion data obtained. Chapter 4 describes the
weather data that was taken. Chapter 5 discusses and compares several airblast
magnitude prediction methods, including the new NSWC method which was developed
as a result of this investigation. A simple approximation to estimate the loca-
tions of caustics is also mentioned. Chapter 6 investigates the Navy's com-
pliance with the local noise regulations. Chapter 7 outlines the shoot/no shoot
decision procedure recommended for Navy exercises on Bloodsworth Island.
DATA BASE REPORT
The data base acquired during the test program is being published as a
separate report.3 This data report primarily contains plots of the digitized
overpressure-time and ground velocity-time records and their corresponding
Fourier amplitude spectra. A number of plots show the effects of filtering
analog records through A-, B-, C-jeighted systems.
IBerry, J. E., Lorenz, R. A., and Proctor, J. F., "Bloodsworth Island
Investigation, Phase I - Interim Report," enclosure (1) of NAVSWC ltrR15:JFP:Jbb 3900 Ser 1747 to CINCLANTFLT of 8 May 1979.
2"Corrections to Bloodsworth Island Investigation Interim Report," enclosure(1) of NAVSWC ltr R15:JEB:Ibb 5800 Ser 3093 to CINCLANTFLT of 15 Aug 1979.
3Lorenz, Richard A., "Noise Abatement Investigation for the Bloodsworth IslandTarget Range: Data Report," NSWC TR 81-433 (to be published).
1-3/1-4
U
NSWC TR 81-431
CHAPTER 2
TEST PROGRAM
TYPES OF DATA
Time-resolved and peak sound pressure levels as well as ground motion
recordings were taken for typical target range exercises. Two types of ordnance
were used: air-delivered Mk 82 bombs (110 kg TNT equivalent) which are the
!largest single munition item used on Bloodsworth Island, and 5" naval projec-
tiles (4.1 kg TNT equivalent) which represent the most common type of gun fir-
ings from ships. The muzzle blast from 5" naval gunfire was found to be
equivalent to 30 kg TNT (see Chapter 5). Table 2-1 shows the types of exercises
covered in the test series. It was possible to monitor eight days of gunfire
and eight days of bomb tests. Table 2-2 lists actual test days, type
exercises, ordnance tests, and the Navy units providing support.
Upper air weather soundings were made during all the test exercises. A
wide variety of weather conditions were experienced during the 16 days of
tests.
MONITORING STATION LOCATIONS
Stations to monitor overpressure and ground motion levels were placed at
sites on or near locations of previous complaints and damage claims. Monitor-
ing points were representative of the larger population centers and those areas
most likely to be impacted by range operations. Five fixed stations were estab-
lished in or near the Eastern Shore communities (Figure 2-1). A mobile or rover
station was prepared to move to locations of predicted blast focusing. All
stations were manned by NSWC personnel. Table 2-3 gives the exact location of
the various stations. Leasing arrangements for the 'ise of private property were
made with the assistance of the Naval Facilities Engineering Command
(NAVFACENGCOM).
2-1

NSWC TR 81-431
TABLE 2-1 EVENT SCHEDULE
GUNFIRE TESTS
Gunfire of interest:
Single gun - illumination round - muzzle blast only
Single gun - standard round
Counter battery - single gun
Fire for effect - single gun
Fire for effect - multiple guns
2 series three times a day (0800-0900 and 1000-1100 EDT; 1300-1400
and 1500-1600 EDT; 1800-1900 and 2100-2200 EDT); 5 shots/series
Total in 8 days - 292 rounds
BOMB TESTS
5 series per day with 2 Mk 82 drops per series
Drops at 0800, 1000, 1300, 1500, 1700 EDT
Total in 8 days - 59 explosions
WEATHER DATA
Soundings at 0600, 1000, 1400, 1800, 2200 EDT at Deal Island and NATC,
Patuxent River. No 2200 EDT sounding on Bomb Tests.
Soundings at Wallops Island at 0700 and 1900 EDT
Total in 16 days - 153 soundings
2
."i 2-2

I-' --', .
NSWC TR 81-431
TABLE 2-2 TEST ACTIVITIES
DATE EXERCISE UNIT
9/13 Air Drops Mk 82 Bombs 4 each MATWING 1*
9/14 10 each
9/16 Naval Gunfire 5"/38 Shells 56 each USS HAWKINS9/17 32 each9/18 60 each
9/19 Air Drops Mk 82 Bombs 11 each MATNING 1
9/20 7 each9/21 8 each9/22 5 each
9/30 Naval Gunfire 5"/38 Shells 40 each USS ELLISON
10/1 38 each
10/2 Air Drops Mk 82 Bombs 8 each MATWING 1
10/3 6 each
10/4 Naval Gunfire 5"/54 Shells 6 each USS BEARY
10/5 33 each10/6 27 each
*Medium Attack Wing One
2-3
1 . . .
NSWC TR 81-431
a. 2
IL-2
55A. cc0. W 2
o w aI- a.0
V6F
0
N
ILi
a2-

NSWC TR 81-431
TABLE 2-3 MONITORING STATION IDENTIFICATION
Station RecordNo. Station Location Types
1 Bishops Head Crocheron Hunt Club peak pressureBishops Head
2 Deal Island Webster Rd. & Tangier Sound pressure historyDeal Island ground motion
3 Top Point Revels Neck Rd. pressure historyTop Point ground motion
4 Upper Hill Fairmont Rd. & Fishing Island peak pressureRd., Rt. 361Upper Hill
5 Rover (1) Rt. 314 & Revells Neck Rd. pressure history(Kingston) (2) Rumbley Point
(3) Kingston
6 Crisfield Somerset Ave. & Columbia Rd. pressure historyCrisfield ground motion
2-5
• ' I

NSWC TR 81-431
The intended impact area for the Mk 82 bombs was at the southern end of
Bloodsworth Island (Figure 2-1), while the target area for naval gunfire was
located on the western side of the island. The nominal ship firing position was
taken to be 9 km due west of the naval gunfire target area. Table 2-4 locates
each monitoring station relative to the above three explosion sources.
WEATHER STATIONS
Under certain conditions the atmosphere acts like a lens and refracts the
blast energy downward toward the ground, concentrating it in specific local
areas. This is known as sound focusing and can occur whenever the temperature
and wind velocity above the ground combine to produce a horizontal sound veloc-
ity component which is greater than that at ground level. The minimum weather
data necessary to determine focusing conditions are the temperature, wind speed,
and wind direction as functions of altitude.
Weather soundings were taken at three locations as shown in Figure 2-2. A
mobile weather team from Fleet Weather Center, Norfolk (FWC) was stationed
at the field headquarters and monitoring station on Deal Island, approximately
9 km ESE of Bloodsworth Island. Arrangements were made for soundings to be
taken at the Naval Air Test Center (NATC), Patuxent River, approximately 34 km
WNW of Bloodsworth Island. Regularly scheduled meteorological soundings were
available from Wallops Island, approximately 55 km ESE of Bloodsworth Island.
Each of the three weather stations acquired its temperature data via the
radiosonde technique; however, there were substantial differences in the wind
data acquisition methods. Both NATC and Wallops Island use a method
based on the LORAN-C navigational system and, therefore, these stations could be
relied on to give wind data in any kind of weather. Deal Island used the pibal
method of visually tracking a balloon to obtain wind data. As a result, when
there was a low cloud ceiling or on days of poor visibility (e.g., fog, rain,
balloon flying into sun), the Deal Island station could not provide wind data.
2-6

NSWC TR 81-431
TABLE 2-4 MONITORING STATION ORIENTATION
Nominal Ship
Station Mk 82 Bomb Target 5" Gunfire Target PositionNo. Station Distance*/Azimuth** Distance*/Azimuth** Distance*/Azimuth**
1 Bishops Head 9.1 km/100 6.1 km/400 14 km/700
2 Deal Island 9.0 km/80* 12 km/1000 21 km/95 °
3 Top Point 25 km/900 28 km/950 37 km/95 °
4 Upper Hill 23 km/1000 27 km/1050 36 km/1050
5 Kingston 29 km/105 ° 33 km/l 0° 42 km/105°
6 Crisfield 25 km/135* 30 km/1350 36 km/125-
*Distance from station to expected impact area or ship position.
**Azimuth angle toward station as seen from explosion source, clockwise from trueNorth.
2-7

0, NSWC TR 81-431
--- MAFILAND
0..
C4US cc
IDL
z x
II
2-8

NSWC TR 81-431
COORDINATION
Figure 2-3 shows the various units that made up the field test organiza-
tion and indicates the need that existed for close coordination between the
units. Synchronization of the exercises with the monitoring stations was accom-
plished with a station radio network and a spotter link. On airdrops a Tactical
Squadron (TACRON) ground/aircraft communications team at the Deal Island record-
ing station was notified by the bomber pilot of: (1) bomb run in progress-
coming in hot, (2) bomb release--off safe, and (3) bomb impact--bomb perform-
ance. Monitoring stations began recording at "off safe" to detect ground/water
transmitted shock.
On good visibility days the plumes from bombs and shells could be observed
from the Deal Island monitoring station. During naval gunfire, a Naval
Amphibious School, Norfolk (NAVPHIBSCOL) spotter on Adam Island, with the aid of
an NSWC communicator, broadcasted over the monitoring station radio network the
scheduled exercise and shell impact time.
As upper air sounding weather data became available, they were immediately
telephoned from NATC, Patuxent River, and Deal Island to NSWC for computer
processing with the SIPS (Sound Intensity Prediction System) computer pro-
gram.4 ,5,6 Any region of sound focusing indicated by SIPS was relayed to the
rover station, which could move near that region if it was accessible by road.
In practice, however, timely prediction of focusing regions was not possible
with the system described above. As a result, the rover station spent most of
its time at the Kingston location.
4Pollet, D. A., "Sound Intensity Prediction System for the Island of
Kahoolawe; Program Maintenance Manual," NSWC/DL TR 3786, Mar 1978.
5Gholson, N. H., "An Analysis of Sound Ray Focusing," NWL-TR-2834, Jan 1973.
6Gholson, N. H., "Evaluation and Utilization of the NWL Sound IntensityPrediction System," NWL-TN-T-4/74, Oct 1974.
2-9
!~

NSWC TR 81-431
I.-:
22
00
0
39 -A w 0
jA
'o2
al 0 I 0
SE ztoo 2
us 2
Li aA2 zt aO c-
40-5
0
mu
ICCZ,
ta~* ~ ~U.S.
NSWC TR 81-431
INSTRUMENTATION
The primary sensor placed at each of the six monitoring stations was a
pressure gage which had suitable characteristics to respond to sound pressure
levels generated by munitions exploded on Bloodsworth Island. Ground velocity
sensors were installed at three monitoring stations to sense any directly
transmitted ground motion and/or airblast induced peak particle velocity of the
soil.
Bruel and Kjaer (B & K) Type 4147 microphones were used with B & K model
2631 FM Carrier Systems at stations 2, 3, 5, and 6 of Table 2-3. The sound
pressure level recordings were made in compliance with ISO Draft Proposal
43/1N11 for sonic boom measurements. Blast signatures recorded in this manner,
when the angle of attack is uncertain, are representative of the incident blast
wave which will be acting on structures in the blast field. Redundant
measurements of overpressure levels (L)* were made at stations 2, 3, and 6 by
using two B & K systems to ensure against equipment malfunction and/or loss of
data. The pressure range covered by the B & K systems extended from 80 dB to
145 dB (0.20 Pa to 360 Pa). The system frequency response was essentially flat
from 1 Hz to 16 kHz (down 1 dB at the end points).
A single microphone-carrier system was used at Kingston (station 5) since
the Lockheed Store 4 tape recorder used with this system was limited to three
data channels.
A Sangamo Sabre II, a Honeywell Model 5600, and a Honeywell Model 101
fourteen channel magnetic tape recorder were used at Deal Island, Top Point, and
Crisfield (stations 2, 3, and 6) respectively for recording sensor signatures
*Instantaneous overpressure levels L in this report are expressed in units of
decibels (dB) defined by:
L (dB) - 20 loglo (p/po)
where p is the instantaneous overpressure and pon 20 micropascals.
2-11

NSWC TR 81-431
and calibrations. The recorders were operated at 30 ips in the IRIG Wideband I
mode for DC to 20 kHz frequency response. A variety of signal conditioners were
used as amplifiers to apply proper signal levels to the tape recorder channels.
Either IRIG "A" or "B" time code was recorded simultaneously on each tape
recorder.
Three-component ground motion gages (Vibra-Metrics Model M-320) were used
at Deal Island, Top Point, and Crisfield (stations 2, 3, and 6) to monitor the
transverse, radial, and vertical components of motion. Each axis was recorded
on two data channels with suitable signal conditioning to sense levels of motion
from 0.25 mm/sec to 25.4 mm/sec in the 4 Hz to 500 Hz transducer passband. For
these tests the radial axis was oriented toward the impact area.
On test days, a Dallas Instruments Inc. Model AR-2 Acoustic Monitor was
placed at the Upper Hill recording station (station 4). This instrument
recorded the peak flat sound pressure level on a strip chart recorder over the
90 dB to 130 dB (0.6 Pa to 60 Pa) range. This instrument is designed to meet
ANSI-1.4-1971 and IEC 123, 1961 specifications for monitoring impulse noise
levels.
Bishops Read was a manned station (station 1), where the operator monitored
three positive peak, "read and hold," General Radio Type 1556B Noise Impact
Analyzers that were used in conjunction with the General Radio Type 1551B Sound
Level Meters.
Daily calibrations of the microphone carrier systems were recorded as a
system test and for later data processing. Similarly, simulated laborntory
calibration levels of the ground motion transducers output were recorded. B & K
pistonphone calibrations of 124 dB (32 Pa) at 250 Hz and Hewlett Packard Type
15117A sound pressure levels of 124 dB (32 Pa), 114 dB (10 Pa), 104 dB (3.2 Pa),
and 94 dB (1.0 Pa) at 1 kHz were used. Other calibrators employed were B & K
type 4230 and General Radio Type 1562. The General Radio Type 1562 produced a
114 dB (10 Pa) calibration at five test frequencies and the B & K 4230 generated
94 dB (1.0 Pa) at I kHz. The Upper Hill and Bishops Head station sensors were
calibrated daily with one of the above type calibrators.
2-12
w!

NSWC TR 8-3
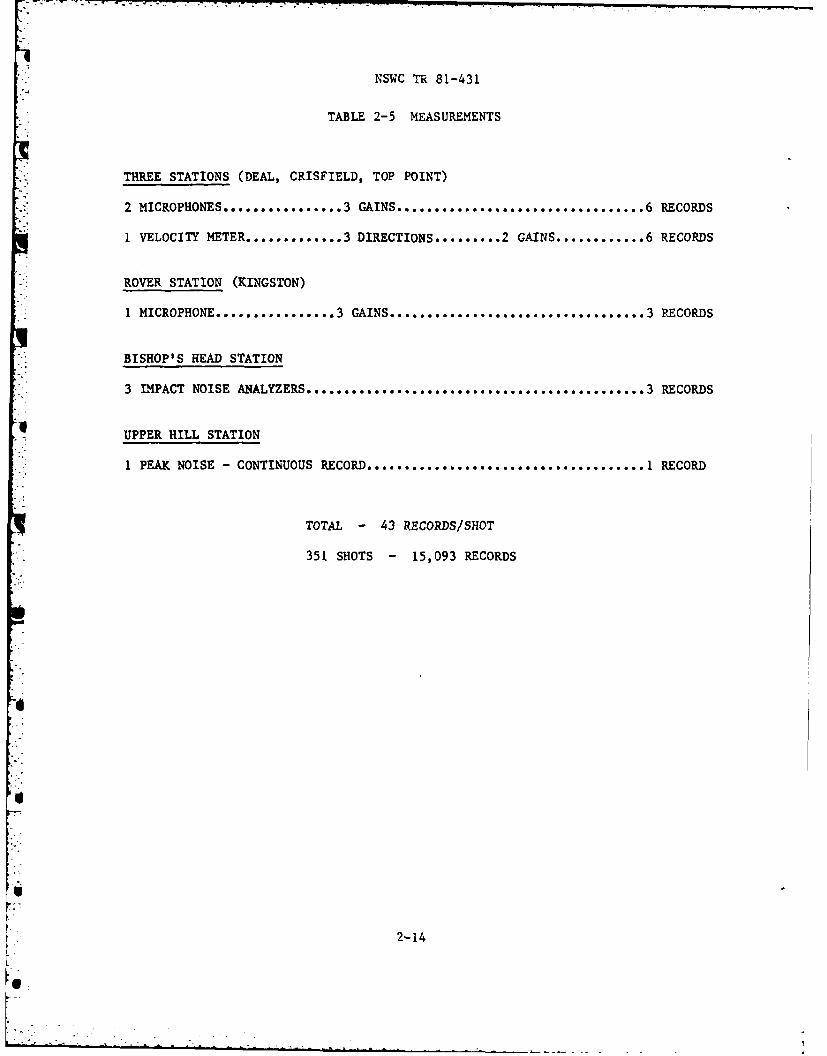
Table 2-5 summarizes the general types of intrumentation used at the
various stations and the typical number of records obtained for each shot.
2-13
NSWC TR 81-431
TABLE 2-5 MEASUREMENTS
THREE STATIONS (DEAL, CRISFIELD, TOP POINT)
2 MICROPHONES ................ 3 GAINS.* ... ........ ......... .......... 6 RECORDS
1 VELOCITY METER ............. 3 DIRECTIONS ......... 2 GAINS ............ 6 RECORDS
ROVER STATION (KINGSTON)
1 MICROPHONE .............. 3 GAINS .................................. 3 RECORDS
BISHOP'S HEAD STATION
3 IMPACT NOISE ANALYZERS ............ ........ ....... ...... .3 RECORDS
UPPER HILL STATION
1 PEAK NOISE - CONTINUOUS RECORD ................ ........... 1 RECORD
TOTAL - 43 RECORDS/SHOT
351 SHOTS - 15,093 RECORDS
2-14

NSWC TR 81-431
CHAPTER 3
AIRBLAST OVERPRESSURE AND GROUND MOTION DATA
i
AMOUNT OF DATA
During the 16 days of tests, recordings were taken on 59 Mk 82 bomb drops
and 292 rounds of 5" naval gunfire. On each event a total of 43 recordings
normally were taken by the six monitoring stations (see Table 2-5) which
resulted in a volume of data consisting of over 15,000 individual records. This
total is misleading on the low side because each of the some 12,000 gunfire
recordings have two or three pulses (bow wave, shell explosion, and muzzle
blast) that must be evaluated separately.
DATA REDUCTION
The first process in the data reduction task was a preliminary screening of
the records. The analog tapes were played back and recorded on an oscillograph.
These playouts were then evaluated to determine which records would require
detailed analysis. Consider, for example, the typical data from the Deal Island
station for a specific event. Here two pressure gages using three gains each
monitored the event and produced six records. Only one requires detailed
analysis, but it was necessary to play back and examine all six records in order
to select the best one to represent the pressure pulse that impacted the
station. The same process had to be applied to the ground motion records. The
second data reduction step was to digitize the selected record for subsequent
computer analysis.
As a result of the above exercise, approximately 880 pressure records and
150 velocity records were selected for digitization and detailed analysis. A
Nicolet Explorer III oscilloscope was used to digitize the analog recordings. The
resulting 1024- or 2048-point digital waveforms were then stored on a 9 track
3-1
L. -

. --. -, . m • .
NSWC TR 81-431
magnetic tape for subsequent processing. A number of the pressure records were
also processed through a General Radio Type 1933 Precision Sound Level Meter to
determine the effect of Flat, C-, B-, and A-weighting (Figure 3-1) on the pressuresignatures. Approximately 130 weighted pressure histories were digitized and
analyzed.
MK 82 BOMB DATA
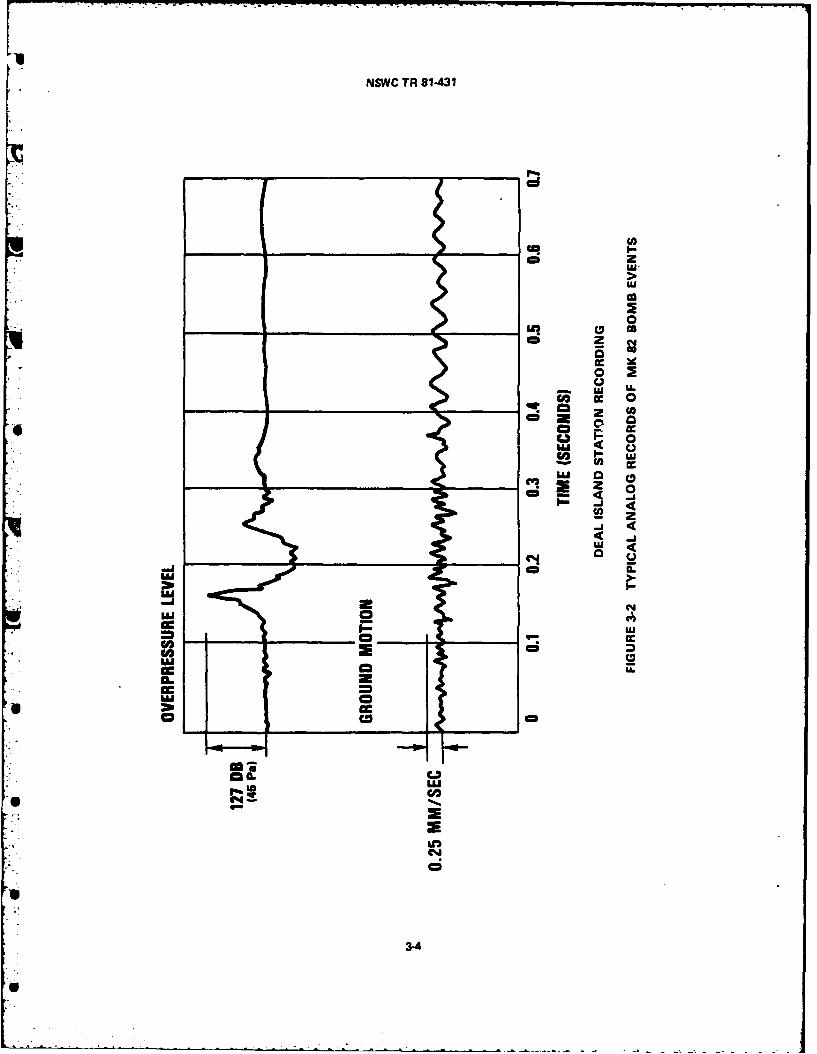
Figure 3-2 is characteristic of the MK 82 bomb overpressure and ground motion
records when strong focusing conditions exist. Rise times are relatively slow(tens of milliseconds). Multiple pulses are observed with the positive and
*I negative peak overpressures approximately equal in magnitude. The ground motion
sensor begins responding during airblast arrival, indicating that the ground motion
was airblast induced. No directly transmitted ground shock was ever positively
identified in the test series. Two strong frequencies can typically be seen inthe ground motion records, about 33 Hz and 10 Hz.
Sample digitized MK 82 records taken under weak to moderate focusing
conditions are shown in Figure 3-3. The pressure pulses become irregular an.
deviate from the classical shock wave form. The bulk of the airblast energy is
typically concentrated in frequencies below 12 Hz. The 33 o Crequeis..(rcomponentis seen to be dominant in the two related velocity records.
A detailed examination of ground motion dpta was not made because all
records indicate that the maximum velocities were two orders of magnitude below7,8,9the documented 25 mm/sec threshold for structural damage. It does not
appear that ground motion from MK 82 bombs contributes significantly to possible
damage in the communities near the Bloodsworth Island target range.
7Liu, T. K., Kinner, E. B., and Yegian, M. K., "Ground Vibrations," Sound andVibration, Oct 1974, pp. 26-32.
8i 8Nicholle, H. R., Johnson, C. F., and Duvall, W. I., "Blasting Vibrations and
Their Effects on Structures," Bureau of Mines Bulletin 656, 1971.
9 Von Gierke, H. E., Chairman, Working Group 69 on Evaluation of EnvironmentalImpact of Noise, "Guidelines for Preparing Environmental Impact Statements onNoise," Committee on Hearing, Bioacoustics, and Biomechanics (CHABA), Assemblyof Behavioral and Social Sciences, National Research Council, Jun 1977.
3-2
0

NSWC TR 81-431
HIIfil zo Io Io AW 1 ~ U
1111 z 001 1 1 1
I CUVE EXLD ThE POSIBL ACUTCLEFCSO ICOON -.
I AN AR EAE ON A I6pSUC IMEDNC
FIGUR I- IRQEC-RSOS CHRCEITC FO.93SL1WTAil D WtOU STNADWEGTNNTOK
fill A3-31
NSWC TR 81-431
(A
z
0_ _ _ C,
2
0c 0
C -%
ci0'UU
EME
= 4I- 94
___P____
EMCD
Ca.a
cc~
UL
ac

, r, _ _.7 - 7
NSWC TR 81-431
OVERPRESSURE RECORD FOURIER SPECTRUM
15 124
- .1 -0.- O
0 1 0 31.25 62.6
TIME (SEC) FREOUENCY (Hz)
TRANSVERSE GROUND MOTION RECORD FOURIER SPECTRUM
-0.3 A
A ~
0 1 2 0 31.25 62.5TIME (SEC) FREOUENCY (Hz)
RADIAL GROUND MOTION RECORD FOURIER SPECTRUM6.3 0.02 - - - --
IN -
MA W~ - - I
43 o -
0 1 2 0 31.25 62.5TIME (SEC) FREQUENCY (Hz)
TOP POINT STATION RECORDING
FIGURE 3-3 TYPICAL DIGITIZED RECORDS OF MK 82 BOMB EVENTS
3.5

NSWC TR 81-431
5" GUNFIRE DATA
Figure 3-4 shows the complex long range signatures generated by naval gun-
fire. The shell bow wave shown in Figure 3-4 is separated in time from the
shell detonation, but generally the bow wave arrives during the shell detonation
signal and is not directly separable. The amplitude of the muzzle blast and its
arrival time with respect to the shell detonation pulse varies with the position
of the ship, number of guns fired, type of fire (single or multi-gun salvo), and
the propellant charge. Generally the amplitude of the muzzle blast was greater
than that of the shell detonation, and its predominant oscillations were lower
in frequency.
Sample digitized gunfire records are shown in Figure 3-5. The energy of
the shell detonation was usually concentrated in frequencies below 100 Hz, while
the energy in the muzzle blast is generally found below 30 Hz.
The ground motion resulting from naval gunfire is less severe than that
from Mk 82 bombs. Therefore it does not appear that ground motion from naval
gunfire contributes significantly to possible damage in the cmmunities near the
Bloodsworth Island target range.
COMPLAINTS DURING INVESTIGATION
A subjective measure of the airblast overpressure levels is the number
and severity of complaints which occur during an exercise. Table 3-I lists
the informal complaints reported to the field measurements team during the
investigation. One can conclude from these observations that, during heavy
focusing, complaints and damage claims may be received for sound pressure levels
from Mk 82 bombs in the 125 dB to 135 dB (36 Pa to 110 Pa) range. Although the
reported damage was minor and limited in area, the measured sound pressure
3-6
I-

NSWC TR 81.431
UL
z
W4 c40
z 4
aj 0
z LU
4c
U0
a mu
WIM
3.7t

NSWC TR 81-431
UU
-I--a Lu "4 .
=C LJ P
= = = DI- - >
U ~. U -o
cc 0M
to w
c -a . 4A
to w
I t
(d) 3OnJJ3HdU3A- (d) 3unSIfldNV
3-8J

NSWC TR 81-431
TABLE 3-1 INFORMAL COMPLAINTS DURING INVESTIGATION
19 September 1978 MK 82 AIR DROPS - STRONG FOCUS PREDICTED
SOUND PRESSURE LEVEL
LOCATIONS NATURE Predicted* Measured
1. WENONA NOISE 135 dB (110 Pa) 133 dB (90 Pa)(Near Deal Island) DEAL ISLAND
2. CRISFIELD SHOOK WINDOWS 124 dB (32 Pa) 124 dB (32 Pa)CRISFIELD
3. FAIRMOUNT BROKE WINDOW 123 dB (28 Pa) 122 dB (25 Pa)(Near Kingston) KINGSTON
4. MARION STATION CRACKED PLASTER 123 dB (28 Pa) 122 dB (25 Pa)(Near Kingston) KINGSTON
22 September 1978 MK 82 AIR DROPS - STRONG FOCUS PREDICTED
SOUND PRESSURE LEVEL
LOCATIONS NATURE Predicted** Measured
-I1. CHANCE PICTURE OFF WALL 127 dB (45 Pa) 135 dB (110 Pa)
(Near Deal Island) DEAL ISLAND
2. CHANCE VASE OFF CUPBOARD 127 dB (45 Pa) 135 dB (110 Pa)(Near Deal Island) DEAL ISLAND
3. DEAL ISLAND CANNED GROCERIES 127 dB (45 Pa) 135 dB (110 Pa)OFF SHELF DEAL ISLAND
4. DEAL ISLAND BROKE WINDOW 127 dB (45 ?a) 135 dB (110 Pa)DEAL ISLAND
*NSWC Prediction Method (see Chapter 5). Weather conditions 4 hours earlierpredicted levels 1 or 2 dB higher.
II
**NSWC Prediction Method (see Chapter 5). Weather conditions 4 hours earlierpredicted a level of 138 dB (160 Pa). The 127 dB (45 Pa) level is based onweather data taken at the same time as the measurement, but 34 km away. Ifthe strongest wind had shifted and were blowing directly toward Deal Island,a level ol 133 dB (90 Pa) would have been predicted.
3-
3-9]

NSWC TR 81-431
levels were considerably below the 134 dB to 140 dB (100 Pa to 200 Pa) thresh-
old levels normally considered acceptable.10,11
No known formal damage claims or nuisance complaints were received during
"* the gunfire exercises. It is possible that nuisance complaints were not made
because the community residents were aware that these specific exercises were
designed to study worst case noise for their eventual benefit. Therefore unless
there was property damage, as occurred in the bombdrop exercises, the residents
may have decided not to voice any complaints.
Spectral analysis of the overpressure records shows that the blast energy
is characteristically concentrated in frequencies below 12 Hz for Mk 82 bombs
and below 25 to 50 Hz for 5" gunfire. Typical house structures can follow these
*, frequencies 1 2 and should therefore respond to the peak overpressure rather
than to the impulse of a blast wave. As a result of the informal complaints
received during the investigation, a 125 dB (36 Pa) sound pressure level is
recommended as a practical damage threshold level for the Bloodsworth Island
area.
10"Sonic Boom Experiments at Edwards Air Force Base," Interim Report,NSBEQ-1-67, AD 655310, 28 Jul 1967.
11Reed, J. W., "Guidelines for Environmental Impact Statements on Noise(Airblast)," Minutes of the Seventeenth Explosive Safety Seminar, 14-16Sep 1976.
12"The Effects of Sonic Boom and Similar Impulsive Noise on Structures,"NTID300.12, 31 Dec 1971.
3-10
p .
K
NSWC TR 81-431
CHAPTER 4
WEATHER DATA
AMOUNT OF DATA
Upper air weather soundings were scheduled for Deal Island and NATC,
Patuxent River at 0600, 1000, 1400, and 1800 EDT on test days, with an addi-
tional sounding at 2200 EDT during evening gunnery exercises. Wallops Island
had regularly scheduled soundings at 0700 and 1900 EDT daily.
A total of 153 weather soundings were taken during the 16 test days. Deal
Island took 57 soundings, of which only 35 had useable wind data. NATC took 67
soundings, and Wallops Island provided 29 soundings. Tabulated data for the 131
useable weather soundings can be found in the data report.3
A wide variety of weather conditions were observed during the test period.
There were days when heavy focusing occurred and days when quiescent conditions
prevailed. Most days had weather conditions varying between the two extremes.
These statements are based both on a review of the measured overpressure records
and on the comments of the field personnel.
DATA REDUCTION
Blast focusing occurs when the atmosphere acts like a lens to focus sound
rays toward some point (caustic) on the ground surface. This condition can
come about when the speed of sound at any altitude exceeds the speed of sound at
the ground surface. The weather data, therefore, are used to construct sound
speed versus altitude profiles to estimate the degree of blast focusing that can
occur.
3See footnote 3 on page 1-3.
4-1

NSWC TR 81-431
At each significant altitude, the total sound speed in any direction is
approximately equal to the temperature dependent sound speed plus the wimd
velocity component, and is given by the equation:
v(z,e) - 331 V'1 + T(z)/273 -WS(z) * cos (WD(z) - 6) (4.1)
where
v - Sound speed (m/sec)
z - Altitude (kin)
e - Azimuth angle (*) clockwise from true North as viewed from
the explosion source
T(z) = Temperature (* C), at altitude z
WS(z) -Wind speed (m/sec), at altitude z
WD(z) - Wind direction (°) from which wind is blowing, clockwise
from true North, at altitude z
The sound speed was calculated at each altitude level at which either a
temperature or a wind reading was taken. To eliminate an excessive number of
nonessential levels, temperature and wind altitudes were combined and con-
sidered equal when their difference was less than one-third the difference of
either temperature or wind levels. The temperature, wind speed, and wind
direction were assumed to vary linearly between measured levels. A sample set
of weather data and the result of combining the data are given in Table 4-1.
The wind speed and direction data represent 1-minute averages during the
rise of the weather balloon. This seems to be an appropriate averaging time to
detect the significant wind trends. Most NATC wind data were taken using 15
second averaging intervals. In many cases the measured local fluctuations were
large and obscured the major trends. When these data were reworked numerically
to give effective 1-minute averaging intervals, the desired trends were
obtained.
Sound speed versus altitude profiles were calculated and processed for all
azimuth angles of interest by the airblast focusing prediction methods discussed
in Chapter 5. Sample sound speed versus altitude profiles are shown in Figure
4-1.
4-2
V

NSWC TR 81-431
TABLE 4-1 SAMPLE WEATHER DATA
NATC STATION, 1000 ASCENT ON 19 SEP 1978
Input Data Combined DataWind Wind Wind Wind
Alt. Press. Temp. Dir. Speed Alt. Press. Temp. Dir. Speed(m) (mbars) (C C) (oAz) (knots) (m) (mbars) (0 C) (oAz) (knots)
0 1016 28.0 300.0 7.0 0 1016.0 28.0 300.0 7.0144 1000 27.0 144 1000.0 27.0 303.2 11.7351 977 26.5 351 977.0 26.5 304.9 18.6465 305.3 22.4 465 964.6 26.1 305.3 22.4664 943 25.5 664 943.0 25.5 312.9 25.3852 318.6 28.4 852 923.3 24.2 318.6 28.41045 903 22.9 1045 903.0 22.9 321.1 29.11244 323.7 29.9 1244 882.9 21.2 323.7 29.91570 850 18.5 1570 850.0 18.5 325.3 35.7
1648 325.3 35.71972 811 15.2 1972 811.0 15.2 334.2 36.02045 334.2 36.02390 772 13.6 2390 772.0 13.6 329.7 35.42425 329.7 35.42812 322.3 33.0 2812 734.0 11.6 322.3 33.02815 734 11.63208 312.5 29.2 3208 700.0 9.4 312.5 29.2
3211 700 9.43537 304.2 31.5 3537 670.0 6.7 304.2 31.53573 670 6.7
* 3926 297.3 29.1 3926 642.0 4.0 297.3 29.1
* 4127 626 2.4 4127 626.0 2.4 297.6 31.34373 298.0 34.0 4373 607.0 1.5 298.0 34.04376 607 1.54841 309.0 30.0 4841 566.0 -1.8 309.0 30.04937 566 -1.85248 325.0 27.0 5248 536.0 -4.3 325.0 27.0
5369 536 -4.35639 337.0 26.0 5639 518.2 -4.9 337.0 26.05916 500 -5.6 5916 500.0 -5.6 337.0 26.0
4-3

NSWC TR 81-431
NATC WEATHER STATION1000 ASCENT. 13 SEP 1973
(SEE TABLE 4.1)
4000-
2000 TOWARD BISHOPS HEAD110# AZIMUTH)
TOWARD DEAL ISLAND(W AZIMUTH)
100
325 330 335 340 345 350 356 360
SOUND SPEED lm/e!
FIGURE 4-1 SAMPLE SOUND SPEED PROFILES
4-4
NSWC TR 81-431
COMPARISON OF WEATHER STATIONS
It was necessary to determine which weather stations could be used to
adequately represent the atmospheric conditions in the Bloodsworth Island
area. To this end the data from the three weather stations described in Chapter
2 were compared with each other in a number of different ways. These included
visual comparisons of selected sound speed versus altitude profiles and the vis-
ual comparisons of the distributions of caustics calculated by the SIPS method
(see Chapter 5). The results of these comparisons agreed qualitatively with the
following procedure.
The most complete and least subjective comparisons of the weather stations
were made using the new NSWC method described in Chapter 5. The explosive
weight limits for pairs of stations are plotted against each other in Figures4-2 through 4-4 whenever simultaneous weather data were available. The explo-
sive weight limit is the amount of TNT required on Bloodsworth Island to produce
an upper bound sound pressure level at any of a number of specific locations on
the Eastern Shore under the given weather conditions. The upper bound sound
pressure level chosen for this exercise was 130 dB (63 Pa). If there were per-
fect correlation between any two weather stations, then all the explosive weight
limit points would lie on the central 45* slope line in Figures 4-2 through 4-4.
The high and low 450 slope lines represent the standard deviation of the points
from the central line.
In Figure 4-2 the points stay close to the central 45* slope line and tend
to scatter evenly about it. This suggests that the NATC and the Wallops Island
weather data may be expected to give comparable explosive weight limit results
within a factor of two* on the average. Note that these stations are approxi-
mately 90 km apart and that only early morning and early evening data sets are
being comparA.
I
|. *
A factor of 2 in the explosive weight (W) corresponds to a 2.7 dB change in the
overpressure level (L). This represents a factor of 1.36 in the overpressure
(p) itself. See equation 5.5 and the footnote on page 2-11.
4-5

L ...... ....NSWC TR 81-431
10.1m
Le 0/co/IL/0/j 100/j/
WALOSISAD RDITINNACPRDCTO
ON SANAD EVAIO IACO O 20
10 10 100 10NAT PRDICEDTNTWEIHT k/
TO~~~~~ PRDC A/3 I S a OEPESR EE
FIGUR 4-2 COPRIO OF PRDCIN/AE NN N
WALP ISLAN WETERDT
3 0 4-6
NSWC TR 81-431
10.00C
10, 1
100 100 1/
NATC 0 /RDCE N EGTIgTOPRDUEA 30d 10 a)OERRESRELEE
'FGUE43 OMARSN F REICIOSBAEDONNAC/NDEAL~~~ 0SADWAHRDT
4-7/

NSWC TR 81-431
p,++N
I.c
100--/
10/
/ / /
0 1 10
W L // /A DED TN WEIT kg)
TO POUEA0 /O(0P)OEPESR EE
FIGURE/ 4- COMPARISLANO PREDICTION AE NWLOSILN
//
a o / I0laO 1 / O0 Oo
AND DEAL ISLAND WEATHER DATA
- 4-8

NSWC TR 81-431
No such tendencies can be seen in Figures 4-3 and 4-4. This indicates that
the Deal Island weather data are significantly different from those of either
NATC or Wallops Island. As noted in Chapter 2, this is most likely the result
of Deal Island using the pibal method of visually tracking a balloon to obtain
the wind data, rather than using the LORAN-C navigational system as did the
other two stations. The Deal Island wind data appears to be excessively smooth
when compared to that of the other two stations. A final and decisive factor in
judging the Deal Island weather data is that the Deal Island weather data
correlated very poorly with the measured overpressure data.
The Deal Island weather data should have represented the atmospheric
conditions midway between NATC and Wallops Island, and were expected to best
represent the weather in the Bloodsworth Island area. However, as a result of
the above considerations the Deal Island weather data were judged to be
unreliable and were not considered further. The NATC data were chosen to
represent the weather in the Bloodsworth Island area for all subsequent analyses
because NATC was the closer of the two remaining stations and because it had the
most complete set of weather soundings made throughout the test days.
4 4
4-9/4-10

Lii
S
S
S
S

NSWC TR 81-431
CHAPTER 5
AIRBLAST MAGNITUDE PREDICTION METHODS
Two ingredients are necessary for airblast magnitude predictions. First,
one must obtain or predict the sound speed versus altitude profile which repre-
sents the atmospheric conditions for the area of interest at the time of the
explosion. This ingredient can be derived from local weather soundings taken
shortly before the test. Second, a prediction method must be employed to inter-
pret the sound speed versus altitude profile to determine the expected overpres-
sure levels. The prediction method should be, in order of importance, accurate,
fast, and easy to use.
As part of this investigation the Sound Intensity Prediction System
(SIPS)4 ,5,6 as well as the prediction method used by Fleet Weather Center (FWC),
Norfolk, were examined. In addition, information was obtained for prediction
methods used at Eglin AFB, 13 Sandia Lab, 14 Ballistics Research Lab (BRL),15
4See footnote number 4 on page 2-9.
5See footnote number 5 on page 2-9.
6See footnote number 6 on page 2-9.
13Rasmussen, R. A., CAPT, USAF, "A Prediction Method for Blast Focusing,"USAFETAC TN 71-8, Sep 1971.
14Thompson, R. J., "Computing Sound Ray Paths in the Presence of Wind,"
SC-RR-67-53, Feb 1967.
15 Perkins, B., Jr., Lorrain, P. H., and Townsend, W. H., "Forecasting theFocus of Air Blasts Due to Meteorologiral Conditions in the Lower Atmosphere,"BRL Report No. 1118, Oct 1960.
5-1

NSWC TR 81-431
Lawrence Livermore Lab (LLL),16 and Holloman AFB. 17 All of these methods are
based on the same principles of sound path refraction by the atmosphere, but
each implements these principles differently. Most importantly, the focusing
criteria and amplitude predictions vary significantly between the methods. The
SIPS and FWC methods have been reviewed in detail, while the others have only
been superficially examined.
FWC METHOD
In the FWC method, the latest available upper air weather data is obtained
from Wallops Island. This data is then smoothed to average out small measured
wind fluctuations which are not representative of the weather over the general
area. Next, the sound speed versus altitude profile is plotted in a single
direction (120* azimuth from true North) representing the direction from Bloods-
worth Island toward Wallops Island. Then some simple criteria are applied to
determine the degree of focusing to be expected. No estimate is made of the
sound pressure levels to be expected. To predict how focusing conditions will
change during the day, the weather forecaster at FWC uses his expertise to
predict how the sound speed versus altitude profile will change during the day
and then reapplies the simple focusing criteria.
FWC Strong Points: The weather forecaster uses his experience and exper-
tise to smooth the weather data and to predict changes expected in the sound
speed versus altitude profile throughout the day. The method is easy to use and
does not require a computer to perform the calculations. The method is insensi-
tive to the fine details of the sound speed versus altitude profile.
FWC Weak Points: Only one direction is considered; focusing conditions in
other directions may go undetected. The sound speed versus altitude profile is
16Pfeifer, H. E., Odell, B. N., and Arganbright, V. E., "Noise-AbatementMethod for Explosives Testing," American Industrial Hygiene Conference,CONF-790633-1, I Jun 1979.
1 7Kahler, J. P., "FOCUS - A Computerized Aid for Making Sound PropagationForecasts," Holloman AFB, ADTC-TR 79-8, Jan 1979.
V. 5-2

NSWC TR 81-431
constructed only up to about 1500 m, but it is probable that wind shears above
1500 m may cause significant focusing in the neighboring communities. The sound
pressure levels are not estimated. The focusing criteria used may be inade-
quate: these criteria are based on a weather survey reported in 1967. An exam-
ination indicated that, through a procedural error, FWC was constructing the
sound speed versus altitude profiles incorrectly during the survey. Telephone
conversations with FWC personnel substantiated that this procedural error had
been faithfully followed through 1978. FWC was notified of this error by tele-
phone as soon as it was discovered in September 1978. Subsequent conversations
with FWC personnel revealed that this error has been rectified in practice.
The above discussion describes the FWC method in use at the time of the
NSWC field tests in September-October 1978. Since May 1979 FWC has been using
a prediction method based on interim recommendations which were made.l, 2 The
form of the interim FWC method is similar to the procedure recommended in
Chapter 7 of this report.
SIPS METHOD
The SIPS method requires the latest available local upper air weather data.
Using a large computer, it calculates 80 or more ray paths in each of 20
directions of interest to find regions where focusing occurs. The location and
maximum expected overpressure levels for each caustic are printed out. The
overpressure levels are estimated simply by adding 15 dB (amplification factor
of 5.6) to the average expected overpressure from the explosion. Quiet direc-
tions in which all rays are refracted away from the ground are also detected and
printed out.
SIPS Strong Points: All important directions are considered. Caustics are
located so that it can be determined whether focusing occurs in populated or in
isolated areas. Sound pressure levels are estimated. The ray path calculations
'See footnote 1 on page 1-3.
2See footnote 2 on page 1-3.
5-3

NSWC TR 81-431
account for reflections from water surfaces and can account for interference
from hills and mountains. Quiet directions are detected.
SIPS Weak Points: Frequent weather soundings are required since the com-
puter program cannot predict changes in the sound speed versus altitude profile.
The computer is very sensitive to small measured fluctuations in the sound speed
profile; each data point will exert its full influence on each ray path being
calculated which may not be representative for the general area. These problems
can, of course, be overcome by having a weather forecaster smooth and predict
changes in the profile, but it may generally be difficult to do this in three-
dimensional space for a computer that will look at 20 different directions. A
fairly large computer is required for fast computing times; computing times are
excessive for minicomputers. The estimated sound pressure levels at the caus-
tics are worst-case values and tend to greatly overpredict the measured levels.
No sound pressure enhancement is calculated for any region which does not con-
tain a caustic. Single positive gradients in the sound speed versus altitude
profile near ground level, which could produce substantial sound concentrations,
are not recognized by SIPS because of its strict application of the ray tracing
equations. Thus, sound pressure enhancement produced by this single positive
gradient will go undetected.
OTHER METHODS
In an effort to find the "best" prediction model, cursory examinations were
made of the Elgin AFB,13 Sandia Lab, 14 and BRL15 airblast focusing prediction
methods. All of these methods lie midway between the simple but coarse FWC
method and the complex but overly sensitive SIPS method. For the present
application, the slight improvement in the results for these methods was judged
not worth the increase in complexity over the FWC method. In particular, over-
pressure levels were not predicted. Therefore, these three methods were not
considered further.
13See footnote 13 on page 5-1.
14See footnote 14 on page 5-1.
15See footnote 15 on page 5-1.
5-4

NSWC TR 81-431
The LLL method 1 6 came to the authors' attention after the new NSWC
method, discussed below, was formulated. Despite significant procedural differ-
ences, these two methods exhibit some common features: a simple evaluation of
the sound speed versus altitude profile is made, overpressure levels can be pre-
dicted, and an explosive weight limit can be determined. The two methods give
similar results for one of the two examples in reference 16, but disagree for
the second with LLL being less conservative. More study and comparisons would
be desirable but the LLL method will not be considered further in this report.
The Holloman AFB 17 method came to the authors' attention during the draft
stage of this report. The calculations are basically similar to those of the
SIPS method except for the following difference. SIPS predicts the overpressure
level at a focal point by adding a constant 15 dB (amplification factor of 5.6) to
the average expected overpressure level. Holloman AFB, however, calculates an
overpressure amplification factor which depends on the convergence of ray paths
at the focal point. These amplification factors normally vary between 2.2 (7
dB) and 8.3 (18 dB). This represents an improvement over the SIPS method.
However, the Holloman AFB method is also very sensitive to the details of the
sound speed versus altitude profile. Whether or not it detects single positive
gradients at the ground surface is not known at this time.
OVERPRESSURE AND WEATHER CORRELATIONS
WEATHER PARAMETER. Blast focusing occurs when the atmosphere acts like a
lens to focus sound rays toward some point (caustic) on the ground surface.
According to ray tracing theoryl5, 18 this condition can come about when the
speed of sound at any altitude exceeds the speed of sound at the ground surface.
The weather data are therefore used to construct sound speed versus altitude
profile to estimate the degree of blast focusing that can occur.
16See footnote 16 on page 5-2.
17See footnote 17 on page 5-2.
"5See footnote 15 on page 5-2.
18Cox, E. F., "Far Transmission of Air Blast Waves," Phys Fluids 1, 95-101,Mar-Apr 1958.
5-5

NSWC TR 81-431
At any altitude the total sound speed in any direction is approximately
equal to the temperature-dependent sound speed of the air plus the wind velocity
component and is given by the equation:
v - 331 /1 + T/273 - WS cos (WD -e) (5.1)
where
v - Total sound speed in the e direction (m/s)
e - Azimuth angle (*), clockwise from true North as viewed
from the explosion source
T - Temperature ( C)
WS - Wind speed (m/s)
WD - Wind direction from which wind is blowing (), clockwise
from true North
Direct application of ray tracing techniques were disappointing and Inade-
quate. Many attempts were made to discover a useful relationship between the
sound speed profiles and the measured overpressure levels. The correlations
tended to become worse as more details of the sound speed profile were included.
Finally, a promising correlation was noticed when only the maximum sound speed
difference and its altitude were combined. The parameter which eventually
evolved to represent the weather conditions is related to nmax=arctan (Av/Az)
in Figure 5-1 and is given by the equation:
8 - arctan 3 •-v . RI (5.2)
where
8 -Weather parameter (*) for a given azimuthal direction
R - Distance (km) to point of overpressure measurement
co -Sound speed (m/s) at ground level
5-6

NSWC TR 81-431
ALTITUDE z(6.)
1v
GROUND SURFACE __________________________________________
SOUND SPEED v lmis)
FIGURE 5-1 SOUND SPEED PROFILE DEFINING TERMS IN EQUATION 5.2 iv3
6-7
NSWC TR 81-431
Av - Sound speed difference (m/s) related to nmax in Figure 5-1
Az - Height (km) for Av above ground surface. If the ratio R/Az is
greater than 75, it is reset to equal 75 for this calculation.
Note that the weather parameter depends primarily on the single most
important feature in the sound speed profile: the velocity difference which
would have the maximum effect in standard ray tracing calculations. The usual
ray tracing calculations are unreliable because they are extremely sensitive to
the detailed shape of the sound speed profile. Normal wind fluctuations can
significantly alter the details of a sound speed profile within minutes after it
is measured. A strong wind blowing at some altitude, however, can be expected
to continue blowing for a considerable time and over a significant area. There-
fore, if a sound speed profile is expected to represent the weather conditions
over a large area for a period of time, only the major trends in the profile
should be relied on in the first place.
The "R" factor in Equation 5.2 effectively scales the sound speed profile
for the distance of interest. The "75" limit on the R/Az ratio was rather
arbitrarily imposed to prevent gentle breezes near the ground surface from trig-
gering erroneous severe focusing warnings.
AIRBLAST PARAMETER. The airblast parameter Lpk for an event is one-
half the peak-to-peak overpressure level difference for the measured flat
instantaneous overpressure versus time record. Half peak-to-peak is used
because the measurements are sufficiently far-field that the peak positive and
negative overpressures are approximately equal. In addition, baseline errors
are eliminated and the results are more reproducible.
CORRELATIONS. Figure 5-2 shows the surface-detonated Mk 82 bomb peak over-
pressure level data from Top Point and Crisfield plotted against the weather
parameter . These stations are 25 km from ground zero on two azimuthal direc-
tions 45* apart. This comprises the largest set of unscaled data in this testseries. A linear trend is noticeable despite the amount of scatter. The upper
line in Figure 5-2 was fit to the data as a practical upper bound. It
represents the maximum expected peak overpressure level for given weather
5-8

NSWC TR 81-431
0 0
I-2
00 S
4 0
44 4
ja a0 44 w4
U.
00 0 x
00 0
040
18P~d-0 1A1un sad3 Wd
ggS 0 I5 9
71NSWC TR 81-431
conditions. A practical minimum expected peak overpressure level line which
bounded the bulk of the data was chosen to be 18 dB below the maximum expected
line.
The available peak overpressure level data from the multi-ton shots 19 ,20 ,2 1
listed in Table 5-1 were scaled to Mk 82 bombs at 25 km at sea level (102 kPa).
The resulting values in Table 5-2 are plotted in Figure 5-3 along with the Mk 82
data from Figure 5-2 and the scaled Mk 82 data from Deal Island and Kingston.
The scaling laws relating a reference level (subscript o) and a level at
altitude (subscript z) are:
PA (PA 11/3
101Jp0 -= P TA and A0 A z (5.3)
I0
where p is the instantaneous overpressure, PA is the ambient pressure, X equals
R/WI/3, R is the distance from the explosion, and W is the TNT equivalent
weight of the explosive. Assuming a power decay law of the form p - const/x0 ,
the scaled overpressures become
A 3 Wzla/ x Z_ (5.4)PZ L2 ) tZ (
where a value of 4/3 was used for a. The fact that the scaled multi-ton data
for the most part falls within the scatter of the Mk 82 data increases the
confidence that a useful overpressure-weather correlation may have been found.
19Reed, J. W., "Project MIDDLE GUST Blast Predictions and MicrobarographMeasurements," in Proceedings of the MIXED COMPANY/MIDDLE GUST ResultsMeeting, 13-15 Mar 1973, Vol. 1, DNA 3151P1, 1 May 1973.
20 Reed, J. W., "DICE THROW Off-site Blast Predictions and Measurements," in
Proceedings of the DICE THROW Symposium, 21-23 Jun 1977, DNA 4377P-2, Jul1977.
2 1Reed, J. W., "Long Range Predictions and Measurements, MISERS BLUFF,Phase II," in Proceedings of the MISERS BLUFF Phase II Results Symposium,27-29 Mar 1979, Vol. 1, POR 7013-1, 26 Sep 1979.
5-10

NSWC TR 81-431
TABLE 5-1 MULTI-TON SHOTS
MIDDLE GUST B 100 Ton TNT
MIDDLE GUST C 100 Ton TNT
PRE-DICE THROW I 100 Ton TNT
PRE-DICE THROW II 120 Ton ANFO
DICE THROW 600 Ton ANFO
MISERS BLUFF I 120 Ton ANFO
MISERS BLUFF II 720 Ton ANFO
5-11

NSWC TR 81-431
a 10 00 J' V'% O C)0r 4 co -c u f 00 i e IT0 ~ -T C 1- L
00 V 00 O 40 0 fnID 00 as cc f0%0n0IT 'Jr JU~~~- -4 -- - - -
10010
0n en010 0 -040 c C y I n %O
000 Coc meo1 en4 enc 0 In In 4141soc1- U1'0 00C4L %Q %. %0 4-T It' %%10 'T C O N T
0~.. 4% Je -4 enc' 0D0e n 0-4 -4'4 00 0
1-4-4
C4 L u7li.' m0- -i 0O 4 0 a% o~~ 04 C o n0. 0 %. -000 Or. 00 00UI~~~
all 5 II -4 I II %Dc : o N 7 L-I C14 enU o ML r Vi. D0
P- I- liV V- 0
ra % 000 000 0 m0 a 40 0 0 0 0*o 0)cJ~~ 00.% ~ .4 0 N 60 N "I w N N0 .rto 0A
21: N- ow' cc 04~ V00-4w 00m~~0 - 0
u 0 ap.4 E-4 a 4
t4
e5 0
0 0
1-I C C;'-4k
I-5'12

NSWC TR 81-431
0l 1-3 -4~ -4 -4 -4 a * . *
1 v-i 00u 1- ; -4 CnC If N0%Ca
(n C1 e 0000 o0 F- 0
Cd Ca U' C1- 4 C4 .4
040
C4 - 4 V-1 0 1 .
Cn 0 0I.th
04 0
w~~~- -44n0 L 201 0n .%0. COt N L 0 Lna w C
42 v a b* n -T *0 ?- 0nwAd 0 w www w0
C4m% 2iM- .0 -
0 r
C: 9 I t 0C4.' v% -H ' 0 ".O~~- z .1 b *,. Vcco CL. To. VI .0wpr
M 04)
m- .5&C b
1- 44
0 0 '
0-40raw r* Od
0i -4 04 0-
5-13-
NSWC TR 81-431
34 4
++ *+
44 +
4. x I .4+
+4 + 33
0+ +2
0 o 0
0 o b
0 0
04 + U
4.p 4.i um amss m -Ai
W3 +1%.5414
NSWC TR 81-431
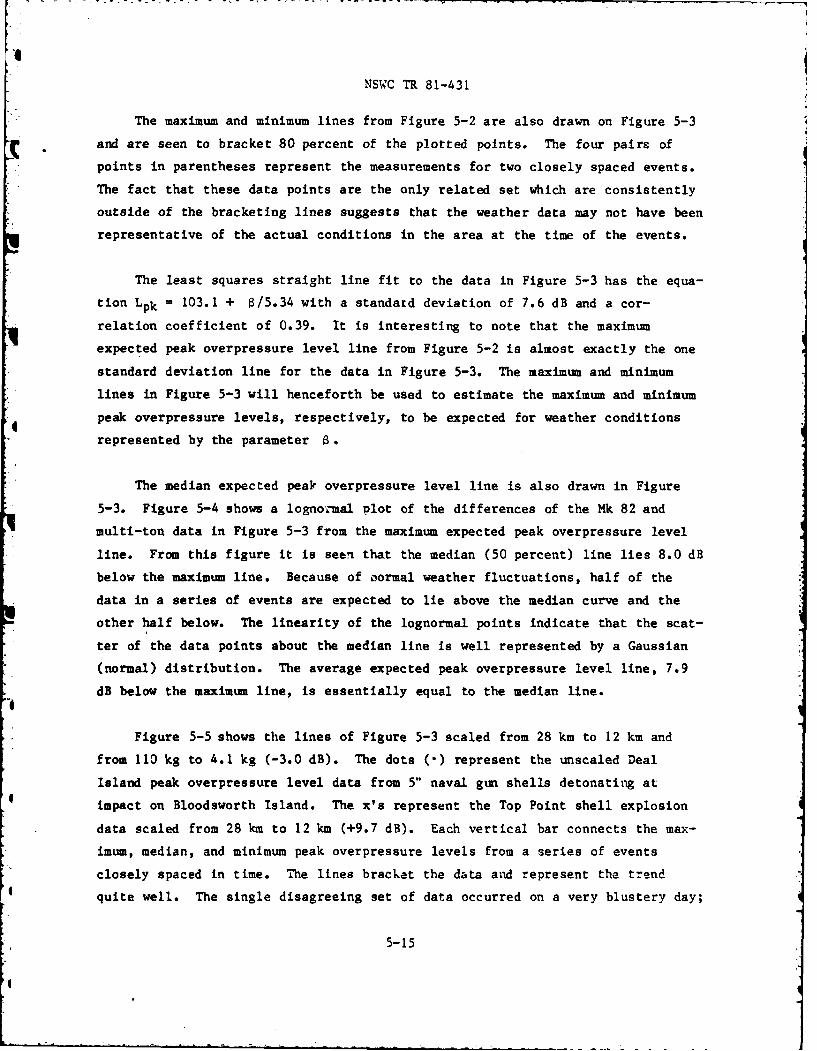
The maximum and minimum lines from Figure 5-2 are also drawn on Figure 5-3
and are seen to bracket 80 percent of the plotted points. The four pairs of
points in parentheses represent the measurements for two closely spaced events.
The fact that these data points are the only related set which are consistently
outside of the bracketing lines suggests that the weather data may not have been
representative of the actual conditions in the area at the time of the events.
The least squares straight line fit to the data in Figure 5-3 has the equa-
tion Lpk = 103.1 + a/5.34 with a standard deviation of 7.6 dB and a cor-
relation coefficient of 0.39. It is interesting to note that the maximum
expected peak overpressure level line from Figure 5-2 is almost exactly the one
standard deviation line for the data in Figure 5-3. The maximum and minimum
lines in Figure 5-3 will henceforth be used to estimate the maximum and minimum
peak overpressure levels, respectively, to be expected for weather conditions
represented by the parameter a.
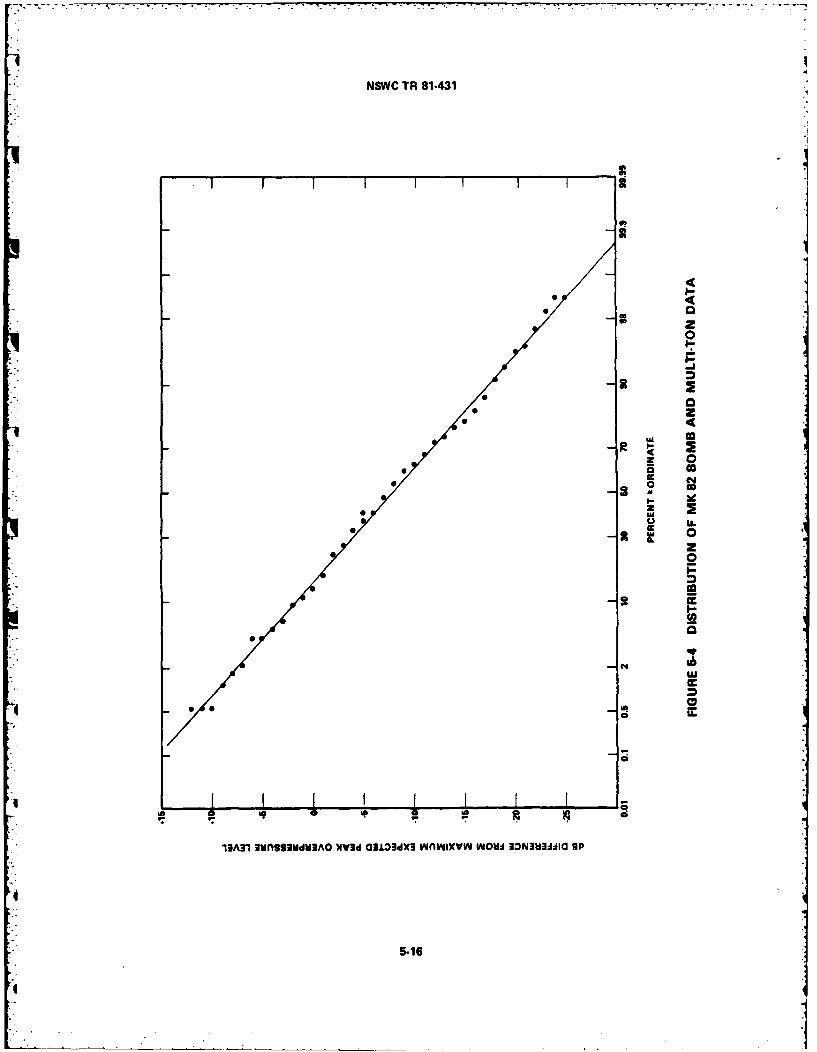
The median expected peak overpressure level line is also drawn in Figure
5-3. Figure 5-4 shows a lognormal plot of the differences of the Mk 82 and
multi-ton data in Figure 5-3 from the maximum expected peak overpressure level
line. From this figure it is seen that the median (50 percent) line lies 8.0 dB
below the maximum line. Because of normal weather fluctuations, half of the
data in a series of events are expected to lie above the median curve and the
other half below. The linearity of the lognormal points indicate that the scat-
ter of the data points about the median line is well represented by a Gaussian
(normal) distribution. The average expected peak overpressure level line, 7.9
dB below the maximum line, is essentially equal to the median line.
Figure 5-5 shows the lines of Figure 5-3 scaled from 28 km to 12 km and
from 110 kg to 4.1 kg (-3.0 dB). The dots (-) represent the unscaled Deal
Island peak overpressure level data from 5" naval gun shells detonating at
impact on Bloodsworth Island. The x's represent the Top Point shell explosion
data scaled from 28 km to 12 km (+9.7 dB). Each vertical bar connects the max-
imum, median, and minimum peak overpressure levels from a series of events
closely spaced in time. The lines bracket the data and represent the trendquite well. The single disagreeing set of data occurred on a very blustery day;
5-15
NSWC TR 81-431
S Ir
0 L0
mz0
ca
5-16

NSWC TR 81-431
0
0
HII-
* I'C
zo
00
A.j
Z I- LI c
00I-I
5-17

NSWC TR 81-431
the actual atmospheric conditions had probably changed drastically from the time
the sound speed profile had been measured.
Some difficulty was experienced in determining an acceptable equivalent
weight for the muzzle blast of 5"/38 caliber and 5"/54 caliber naval guns. A
value can be derived from the Deal Island and Top Point muzzle blast data
plotted on Figure 5-6. The dots (*) represent the unscaled Deal Island muzzle
blast data measured at a distance of 21 km from a typical ship position. The
x's represent the corresponding Top Point data scaled from 37 km to 21 km (+6.5
dB). Each vertical bar connects the maximum, median, and minimum peak
overpressure levels from a series of 5" gun firings closely spaced in time.
Then a set of lines of the "correct" slope were selected which resulted in a
practical upper bound for the muzzle blast data. Note how well they bracket the
data and represent the trend. By scaling these lines back to those in Figure
* 5-3, a value of 30 kg TNT was found to represent the muzzle blast assuming a
nominal ship standoff of 21 km from the Deal Island monitoring station. Both
Deal Island and Top Point are situated within 100 or 15* from most possible
direct lines of fire from the ships. It is known22 that muzzle blast is a
strongly directional phenomenon, but the value of 30 kg TNT can be used as a
practical upper bound for the muzzle blast from typical 5" naval gunfire on the
Bloodsworth Island range.
SCALING CONSIDERATIONS. Figures 5-3, 5-5, and 5-6 suggest that the over-
pressure and weather correlation is applicable over a wide range of explosive
weights (hundreds of tons TNT to 4.1 kg TNT). However, the distances involved
were greater than 9 km. In an effort to see how well the correlation applied
much closer to a charge, the following comparison was made.
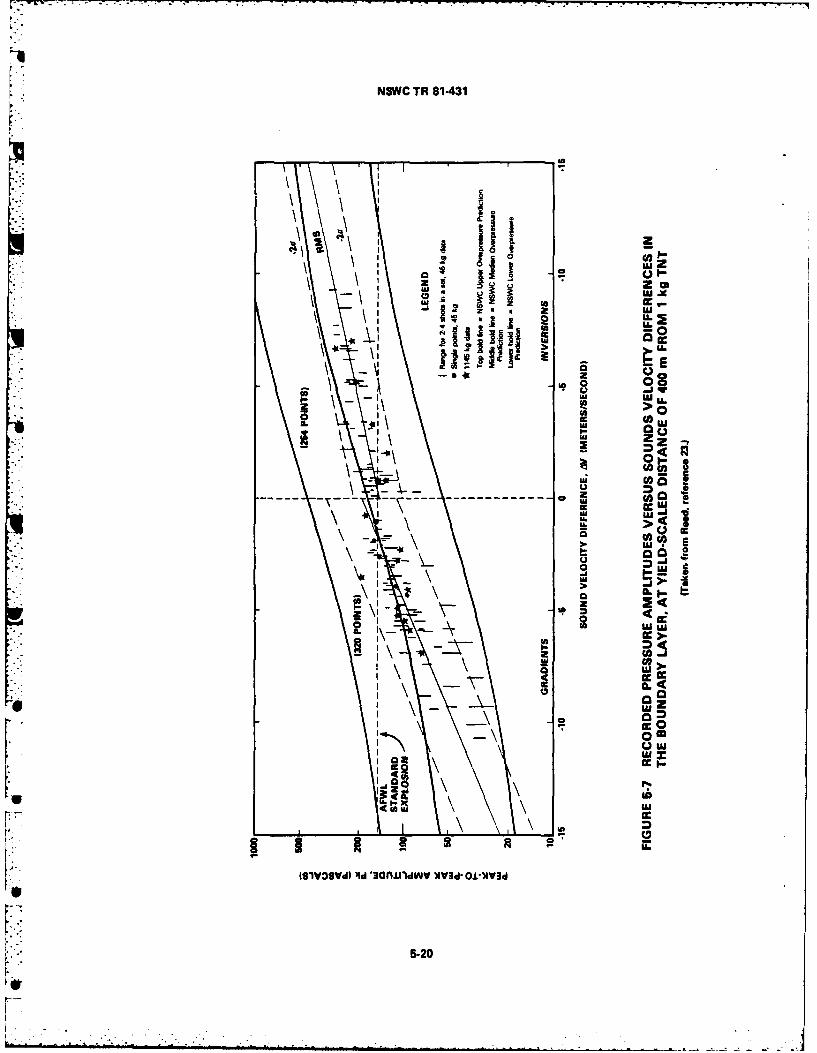
Figure 5-7 was taken from reference 23 and displays overpressure measure-
ments from 45 kg and 1145 kg charges scaled to 400 m from a 1 kg TNT charge.
22Pater, L. L., "Gun Blast Far Field Peak Overpressure Contours," NSWCTR 79-442, Mar 1981.
23Reed, J. W., "Project PROPA-GATOR--Intermediate Range Explosion AirblastPropagation Measurements," SAND 80-1880C, and in Minutes of the 19th DODExplosive Safety Seminar, 9-11 Sep 1980.
5-18
I /.

NSWC TR 81-431
me z
2 co
0 0
5-1-
NSWC TR 81-431
Z I.\A
> _.
2 (a
WCW
-U
IW U
I CIO
I0
I-,C
5F2
NSWC TR 81-431
The abscissa is the maximum measured sound velocity difference in the 152 m high
boundary layer at the ground surface. The NSWC weather correlation term is
range dependent. A range of 1423 m was used to generate the NSWC curves
(1423 m / (45 kg)l/3 - 400 m/kgl/ 3). Note that the NSWC average expected
overpressure curve reasonably represents the data. The maximum expected over-
pressure curve is overly pessimistic. The scatter in the expected overpressure
levels should decrease as the range decreases, but this dependence is not
accounted for in the NSWC model. For large negative sound velocity differences
the data and the NSWC curves seem to be diverging.
The NSWC correlation appears to contain the core of a fairly general pre-
diction method. But further study is needed to determine the applicability of
the NSWC correlation outside of the range of data from which it was derived.
FOCAL POINT APPROXIMATION. Many different approaches were tried in the
attempt to find a correlation between the weather data and the peak overpressure
level data. While working with the BRL ray tracing equations, 1 5 an approxima-
tion was found which greatly simplifies the determination of caustics, i.e.,
locations on the ground surface at which sound rays are concentrated by the lens
effect of the atmosphere. The standard ray tracing methods locate caustics
either by finding regions where an unusually large number of ray paths touch the
ground1 5,18 or by finding locations where the rays' touchdown points decrease
in distance from the source and then begin to increase as the rays' initial
angles of departure are gradually increased. 4 Both of these methods require
that a large number of ray paths be calculated in order to ensure that no
caustic is missed. With the new approximation, caustics are calculated in a
straightforward manner and only one ray path calculation is required for each
possible caustic. This results in a significant savings in computing time,
making caustic calculations practical for microcomputers. It is possible to
locate regions of reduced airblast propagation as well as regions of enhanced
15See footnote 15 on page 5-1.
18See footnote 18 on page 5-5.
4 See footnote 4 on page 2-9.
5-21

NSWC TR 81-431
propagation, whether or not a caustic exists. The effects of single positive
gradients at the ground surface can be included.
The approximation is derived and discussed in detail in Appendix A.
Equation A.5 is the essential approximation. This enables the caustics to be
calculated directly using the sound speed versus altitude profile. The calcu-
lated caustic ranges will be equal to or slightly less than the "exact" caustic
range. This is conservative. Another approximation, summarized in Equations
A.16 and A.17, removes the nonphysical mathematical solutions and certain arti-
ficial constraints so that the technique can be extended to all physically pos-
sible situations.
However, the approximations mentioned above did not lead to any method
which could be used to estimate the overpressure levels at the caustics.
Methods using the caustic approximation were pursued for a time but were aban-
doned when the new NSWC method was formulated. The caustic approximation l
included in this report because it is a product of the effort expended in this
project and because it might be helpful to others in developing or updating
their own methods.
DISCUSSION. Any attempt to correlate the peak overpressure level data with
the fine details of the sound speed profiles is destined to fail because of nor-
mal wind fluctuations. To make matters worse for this particular investigation,
the weather data was taken only once every 4 hours and 34 km away across the
Chesapeake Bay from ground zero. In addition the locations of the ships, shell
hits, and bomb hits are not precisely known. In spite of all the above, this
section demonstrates that a correlation apparently does exist between the peak
overpressure levels and the weather data for explosive charge weights ranging
from 4.1 kg to 4.5 x 10⁵ kg TNT. This correlation must be related to some
fundamental large-scale phenomenon which controls the long range airblast
propagation. Otherwise any trend would have been masked by all of the above
problems. The data scatter certainly prevented the derivation of too elaborate
a prediction method, but the one reported below is believed to be realistic and
should give useful results, especially for the Bloodsworth Island area.
5-22
NSWC TR 81-431
NSWC PREDICTION METHOD
The correlation discussed in the previous section quantitatively relates
the following four parameters: W, the surface-detonated TNT equivalent explo-
sive weight; R, the distance from the explosive to the point of interest;
Lpk, one-half the peak-to-peak overpressure level difference for the instan-
* taneous overpressure signature at the point of interest; and 6, the weather
parameter which represents airblast focusing conditions between the explosion
source and the point of interest. This means that if any three of these para-
meters are known, the fourth can be solved for. General instructions are given
in Appendix B for programming the NSWC method on any computer. In this section
a method will be given to determine Lpk when W, R, and B are known.
A To determine the weather parameter B. first generate the sound speed ver-
* sus altitude profile along the azimuth of interest using Equation 5.1. Then for
each altitude level, calculate tan n - Av/Az as indicated in Figure 5-1. For
altitudes below R/75, where R is the range of interest, calculate tan
-75Av/R. Finally calculate a using Equation 5.2 and the maximum value of
tan .
Figures 5-2 and 5-3 show that the maximum expected peak overpressure level
Lpk - 111.0 + $ /5.3 decibels for W -110 kg, R -25 kin, and ambient pressure
PAO = 102 kPa. Using Equation 5.4 with a - 4/3 to scale these conditions, the
* maximum expected pee~k overpressure level Lpk in decibels is given by
Lpk 111.0 + B/5.3
rPA .0.5 0.444 1.33]+ 20 log1 L 0 Wa0.5 kJ25 ]5.5a)100 25a km)
1
-107.8 + /5.3 + 20 log1 0 [PA 0.556 W 0.444 /R 1.333] (5.5b)
where Lpk - Maximum expected peak instantaneous overpressure level (dB)
- Weather parameter an
5-23

NSWC TR 81-431
PAO - Ambient pressure (kPa)
W - Explosive weight (kg), TNT equivalent surface detonation
R - Distance from explosion (km)
The median expected peak overpressure level is obtained by subtracting
8.0 dB from Equation 5.5. For the minimum expected peak overpressure level,
subtract 18 dB from Equation 5.5. For an airburst, subtract an additional
2.0 dB from Equation 5.5 (surface reflection factor of 1.7).
5-24
NSWC TR 81-431
CHAPTER 6
LOCAL NOISE REGULATIONS
STATE OF MARYLAND NOISE ACT
The local noise ordinances, where they exist, follow the state regulations.
The Environmental Noise Act of 1974 of the State of Maryland2 4 sets the maxi-
mum allowable discrete noise level for residential zoning districts at 60 dBA
during daytime hours (0700 - 2200), and at 50 dBA during nighttime hours (2200 -
0700), where A-weighting is understood (see Figure 3-1). In addition, a 55 dBA
limit is set for the 24 hour day-night average sound level (Ldn) where a 10
dBA penalty is applied to noise occurring during the nighttime hours (2200 -
0700). The definition of Ldn is:
L 10 log1 10 A dtdn 0 L 864000 0700
0700 [LA(t) + 101 /10 ](
1 0 d t(6.1)2200
where time t is in seconds, and LAMt is the instantaneous A-weighted over-
pressure level in decibels defined as
2 4Title 10 - Department of Health and Mental Hygiene, Maryland StateEnvironmental Health Administration. 10.03.45 Rules and Regulations Governingthe Control of Noise Pollution in Maryland, as amended 14 Sep 1977.
6-1
NSWC TR 81-431
L 10 log[10 P(t)/Po (6.2)
where PA(t)is the instantaneous A-weighted overpressure and po 20 micro-
pascals.
IMPULSIVE NOISE
The state regulations were derived from the consideration of continuous
noise sources. For impulsive noise sources such as blast waves from explosions,
where the energy is concentrated in the lower frequencies, the A-weighted con-
tribution to Ldn is negligible. The Committee on Hearing, Bioacoustics, and
Biomechanics (CHABA) of the National Research Council, however, recommends in
section VII of their report 9 that C-weighted sound exposure levels LCE with
a reference time interval of I sec be used for the impulsive noise contribution
to the day-night average sound level Ldn.
Equation 6.1 can be used to derive a formula which relates the C-weighted
day-night average sound level LCdn, the C-weighted sound exposure level LCE
for an impulsive event, and the number N of similar events:
L 10 log lo N - 10 d d
LC(t)/1oM 10 log10 10 dt + 10 log, N-10 og 86400
M CE 10log10 N -49.4 dB(63
where
9See footnote 9 on page 3-2.
6- 2

NSWC TR 81-431
N = Nd+ 10 Nd.,.n
Nd - Number of events during the day (0700 - 2200)
N = Number of events during the night (2200 - 0700)n
L - Instantaneous C-weighted overpressure level
Relationships were found3 for the Bloodsworth Island Mk 82 bomb records
relating the flat sound exposure level LE and the C-weighted sound exposure
level LCE to the peak flat overpressure level Lpk:
LE L pk 10 dB (6.4)
L CE L - 23 dB (6.5)
Equation 6.4 is similar to that found by Young25 for sonic booms having
N-waves of approximately 100 ms duration. Young reported a value of -11.5 dB
for the constant term. The NSWC data consists of multiple sinusoidal waves
typically of several hundred milliseconds duration (see Figures 3-2 through
3-5). Fifty-four records were analyzed where Lpk varied between 105 dB (3.6
Pa) and 132 dB (80 Pa). The NSWC data suggests that the constant, -10 dB, var-
ies slightly with the distance from the source.
Equation 6.5 was derived from 13 records where Lpk varied between 101
dB (2.2 Pa) and 132 dB (80 Pa). The constant was found to be -23.3 dB with a
standard deviation of 2.2 dB. This value is reasonable, since Young reports
that the A-weighted sound exposure level for sonic booms is 33-46 dB (45-200
times) lower than Lpk, depending on the value of Lpk. There was no indication
that the constant, -23 dB, varies as a function of the distance from the
source.
3See footnote 3 on page 1-3.
25 Young, R. W., "Average Sound Level Including Sonic Booms," in AcousticalSociety of America Meeting, 6 Nov 1975.
6-3
NSWC TR 81-431
MULTIPLE PULSES
The contribution of a number of similar impulsive events to the day-night
average sound level is determined by combining equations 6.3 and 6.5:
LCdn - Lpk + 10 log10 N - 72.4 dB (6.6)
The total day-night average sound level Ldn is found by combining the
A-weighted background noise level LAdn with the impulsive contribution LCdn
as follows:
Ldn - 10 log1 0 10L A dn / 10 + 10 L cdn / 10 (6.7)
Note that Ldn will equal 55 dB when both Ldn and Ledn equal 52 dB.
The above relationships imply that only one event (N-i) that produces an
Lpk - 127.4 dB (47 Pa) during the day will result in an Ldn - 55 dBA using
the CHABA recommendation. Any further activity would then exceed the intent of
the State of Maryland noise limitations. At night (2200 - 0700 hours) it would
take only one event with Lpk - 117.4 dB (15 Pa) to result in an Ldn - 55 dEA
using the CHABA recommendation and the 10 dBA nighttime penalty.
DISCUSSION
Strictly speaking, the typical Navy exercises described in Chapter 2 should
never violate the State of Maryland noise limitations. The energy of the blast
waves from typical Navy exercises is contained in the lower frequencies so that
the A-weighted contributions are negligible.
The CRABA recommendation is a reasonable criterion, but there is still much
controversy among the experts as to how impulsive signals should be processed
for Ldn calculations. Therefore it is recommended at this time that the dam-
age and nuisance criteria specified in Chapter 7 be adopted for the Bloodsworth
6-4

NSWC TR 81-431
Island area. These criteria are in line with the intent of the Maryland noise
regulations and will tend to keep Ldn below the 55 dB limit, even using the
CHABA recommendation.
6-5/6-6

NSWC TR 81-431
CHAPTER 7
RECOMMENDED SHOOT/NO SHOOT DECISION PROCEDURE
The main considerations regarding a shoot/no shoot decision procedure are
briefly reviewed below and are followed by a presentation of the recommended
decision procedure.
WEATHER SOUNDINGS
Figure 4-2 indicates that the early morning (0600 EST) and early evening
(1800 EST) upper air weather soundings from the NATC and Wallops Island stations
give comparable results. In Chapter 5 it was shown that the NATC soundings cor-
related well with the measured overpressure data. Therefore the 0600 and 1800
EST soundings from Wallops Island can be used to represent the early morning and
early evening weather conditions in the Bloodsworth Island area.
However, until it can be demonstrated and documented that the changing
weather conditions in the Bloodsworth Island area can be adequately predicted
throughout the day, it is recommended that additional weather soundings be taken
by NATC at least every 4 hours during explosive exercises. The first sounding
should be taken at such time that the airblast focusing conditions can be eval-
uated prior to commencement of the exercise. Wallops Island data will suffice
for the early morning and early evening soundings. No sounding should be
expected to accurately represent the weather conditions more than 1 or 2 hours
before or after the actual sounding. Therefore, on days when rapid changes in
weather conditions are expected, such as the passing of a front, weather sound-
ings should be taken at 1 or 2 hour intervals, as needed.
Sound speed versus altitude profiles should be constructed up to at least
3000 m (700 mbar, or 70 kPa) and analyzed for four different directions. Three
7-1

j
NSWC TR 81-431
of these directions are fixed: true North toward Bishops Head; 90* clockwise
from true North toward Deal Island; and 135 ° clockwise from true North toward
Crisfield. The fourth direction should be that he maximum wind velocity
blowing toward the Eastern Shore communities between true North and 135 ° clock-
wise from true North. This fourth direction need not be calculated if it lies
within 10 of any of the three fixed directions.
PREDICTION METHOD
The NSWC airblast magnitude prediction method described in Chapter 5 is
recommended for the evaluation of blast focusing conditions using the weather
data. The new prediction method is the major change to the interim shoot/no
shoot procedures. 1,2 The final shoot/no shoot procedure, using the more reli-
able NSWC prediction method, should keep the overpressure levels from typical
Navy exercises below the recommended damage and nuisance levels in the communi-
ties surrounding Bloodsworth Island.
The weather parameter (Equation 5.2) is depandent on the distance R of the
point of interest from the explosion. For the Bloodsworth Island target range
it is recommended that a value of R - 10 km be used between the azimuth angles
350* and 125* clockwise from true North, and that a value of R- 18 km be used
between 125' and 180 clockwise from true North.
DAMAGE CRITERIA
The measured ground motion was shown in Chapter 3 to be airblast induced
and to be negligible in magnitude. Only the airblast itself was seen to be
related to possible damage. Chapter 3 concludes that the peak overpressure
level Lpk is the principal parameter related to damage and should be held
below 125 dB (36 Pa) to eliminate damage claims. The analysis in Chapter 6
indicates that this is also the least restrictive limit which would comply with
ISee footnote 1 on page 1-3
2 See footnote 2 on page 1-3.
7-2

NSWC TR 81-431
24the intent of the State of Maryland noise regulations using the CHABA
recommendation 9 for handling impulsive noise events. Let it be restated here
that tl- CHABA recommendation is not required by law and is more restrictive
than the actual requirements.
NUISANCE CRITERIA
Whereas it is evident when damage occurs, nuisance or annoyance thresholds
are difficult to determine. The "startle" effect, repetition rate, and back-
ground noise level strongly influence the perception and tolerance of a signal
with a given overpressure level. No obvious nuisance thresholds could be deter-
mined from the data obtained in this test series.
The FWC prediction method discussed in Chapter 5 has been used for a
significant period of time with fairly good results for 5" naval gunfire. The
FWC method evaluates the sound speed profile and categorizes the sound focusing
conditions as either NIL, SLIGHT, MODERATE, or HEAVY. The FWC categories can be
related to the NSWC weather parameter B as follows:
Category 8 (0)
NIL < 0
SLIGHT 0 < 8 < 31 (tan 310 - 0.6)
MODERATE 31 < 8 < 50 (tan 500 - 1.2)
HEAVY 50 < 8
The categories as defined above are useful and sufficient to characterize the
weather conditions for the Bloodsworth Island target range. The recommended
courses of action to be taken for the different categories will be somewhat more
restrictive than those previously specified by the original FWC method.
2 4See footnote 24 on page 6-1.
9 See footnote 9 on page 3-2.
7-3

NSWC TR 81-431
RECOMMENDED DECISION PROCEDURE
The weather soundings and analyses should be performed as indicated in the
': previous sections.
Naval activities at Bloodsworth Island should be restricted to daytime
hours (0700 - 2200) as defined by the State of Maryland Noise Act. 24 The addi-
ional 10 dBA penalty required for noise occurring during nighttime hours is not
incorporated into the procedures recommended below. While gunnery exercises can
commence at 0700, the analysis of the 0700 Wallops Island sounding is usually
not complete until sometime after 0900. Therefore FWC must be prepared to
predict the sound focusing conditions for these early morning activities.
It is recommended that naval activities at Bloodsworth Island be regulated
by the following policy. Each activity will be assigned by NAVPHIBSCOL to one
of the below categories:
Category A: Ships assigned to qualify and scheduled to deploy within
90 days.
Category B: Ships assigned to qualify and scheduled to deploy within
180 days.
Category C: All other firing ships.
Category D: Bomb drops from aircraft.
The various courses of action available to NAVPHIBSCOL for control of the
naval activities are defined as follows:
1 - Continue firing.
24See footnote 24 on page 6-1.
7-4
I=.+ . .g

NSWC TR 81-431
2 - Check firing. Contact FWC to determine if weather will
improve. Commence firing after FWC has indicated an improve-
ment in focusing conditions and the course of action can be
changed to number 1 above.
3 - Do not open fire. Await FWC weather update.
Before any operation begins on Bloodsworth Island, the Navy activity must
contact NAVPHIBSCOL to obtain sound focus conditions and a course-of-action num-
ber. NAVPHIBSCOL will obtain the focusing conditions from FWC. The courses of
action to be taken BEFORE complaints are received from Eastern Shore residents
are as follows:
Sound Focus Condition: NIL SLIGHT MODERATE HEAVY
Category A: 1 1 2 3
Category B: 1 1 2 3
Category C: 1 2 3 3
Category D: 1 2 3 3
The courses of action to be taken AFTER complaints are received from
Eastern Shore residents are as follows:
Sound Focus Condition: NIL SLIGHT MODERATE HEAVY
Category A: 1 2 3 3
Category Bt 1 2 3 3
Category C: 2 2 3 3
Category D: 2 2 3 3
When airdrop or gunfire exercises are in progress on Bloodsworth Island,
NAVPHIBSCOL must inform the conducting Navy activity of any change in the
course-of-action numbe due either to worsening sound focusing conditions
provided by FWC or to the reception of complaints.
7-5
• . ..

NSWC TR 81-431
IMPACT OF RECOMMENDED PROCEDURE
This operations policy is very similar to the interim procedures1'2
currently in force and will require no additional effort on the part of FWC and
NAVPHIBSCOL for implementation. The major improvements involve the verification
of the nuisance and damage criteria, and the incorporation of the new NSWC
airblast magnitude prediction method. An important change, however, is the
recommendation that range activities cease at 2200 hours instead of the current
limit of 2300 hours.
The downtime for naval exercises on Bloodsworth Island can be estimated in
the following manner. Table 7-i gives a summary of the measured sound levels
for the 16 days of exercises which were monitored. It indicates the periods
during the exercises when the maximum sound levels at all monitoring stations
were below the indicated levels. If the 134-140 dB (100-200 Pa) range, which is
the documented threshold of window breakage,10.11 had been taken as the shoot/no
shoot criterion, then Table 7-1 indicates that exercises could be conducted at
any time irrespective of focusing conditions. However, minor damage and
nuisance complaints were received for sound levels as low as 124 dB (32 Pa)
during the test series. The objective of the recommended procedures is to
significantly reduce the number of complaints by holding the maximum expected
sound levels below the 125 dB (36 Pa) level. Based on the 16 days of exercises
monitored, Table 7-1 indicates that the downtime during a naval exercise might
be as high as 38 percent.
1]
'See footnote 1 on page 1-3.
2See footnote 2 on page 1-3.
10See footnote 10 on page 3-10.
"See footnote 11 on page 3-10.
7-6

NSWC TR 81-431
TABLE 7-1 DAILY SOUND LEVELS DURING TESTS
Sound Level Below115 dB 120 dB 125 dB 130 dB 135 dB 140 dB
Date Time Exercise (11 Pa) (20 Pa) (36 Pa) (63 Pa) (112 Pa) (200 Pa)
9/13 AM Bomb / / / / / /PM Bomb
9/14 AM Bomb / VI / / / /
PM Bomb / / / / V/ /
9/16 - NGF x x x / V/ /
9/17 - NGF x Y/ / / /
9/18 - NGF x x x x VI V/
9/19* AM Bomb x x x x V/ /PM Bomb x x x x V /
9/20 AM Bomb x / / / / V/PM Bomb x V/ / / /
9/21 AM Bomb x x / / / VPM Bomb x x x x / /
9/22* AM Bomb x x x x x /PM Bomb x / V/ / /
9/30 - NGF x / /
10/1 - NGF x / / / VI /
10/2 AM Bomb / / / / / /PM Bomb x x / / / V1
10/3 AM Bomb x x x / V/
PM Bomb / / V V 'I
10/4 - NGF x x x V' / /
10/5 - NGF x x x V
10/6 - NGF x x V/ / / V
Possible Downtime 75% 50% 38% 25% 4% 0%
*Complaints Received V' ..... levels were below stated valuex ..... levels were equal to or above
stated value
7-7/7-8

NSWC TR 81-431
BIBLIOGRAPHY
Berry, J. E., Lorenz, R. A., and Proctor, J. F., "Bloodsworth Island Investiga-
tion, Phase I - Interim Report," enclosure (1) of NAVSWC ltr R15:JFP:jbb 3900
Ser 1747 to CINCLANTFLT of 8 May 1979.
Beyer, W. H., Ed., CRC Handbook of Mathematical Sciences, 5th Edition, CRC
Press, Inc., 1978.
"Corrections to Bloodsworth Island Investigation Interim Report," enclosure (1)
of NAVSWC ltr R15:JEB:Jbb 5800 Ser 3093 to CINCLANTFLT of 15 Aug 1979.
Cox, E. F., "Far Transmission of Air Blast Waves," Phys. Fluids 1, 95-101, Mar-
Apr 1958.
Gholson, N. H., "An Analysis of Sound Ray Focusing," NWL-TR-2834, Jan 1973.
Gholson, N. H., "Evaluation and Utilization of the NWL Sound Intensity Predic-
tion System," NWL-TN-T-4/74, Oct 1974.
Kahler, J. P., "FOCUS - A Computerized Aid for Making Sound Propagation Fore-
casts," Holloman AFB, ADTC-TR 79-8, Jan 1979.
Liu, T. K., Kinner, E. B., and Yegian, M. K., "Ground Vibrations," Sound and
Vibration, Oct 1974.
Lorenz, R. A., "Noise Abatement Investigation for the Bloodsworth Island Target
Range: Data Report," NSWC TR 81-433 (to be published).
Nicholle, H. R., Johnson, C. F., and Duvall, W. E., "Blasting Vibrations and
Their Effects on Structures," Bureau of Mines Bulletin 656, 1971.
8-1

NSWC TR 81-431
Pater, L. L., "Gun Blast Far Field Peak Overpressure Contours," NSWC TR 79-442,
Mar 1981.
Perkins, B., Jr., Lorrain, P. H., and Townsend, W. H., "Forecasting the Focus of
Air Blasts Due to Meteorological Conditions in the Lower Atmosphere," BRL Report
No. 1118, Oct 1960.
Pfeifer, H. E., Odell, B. N., and Arganbright, V. E., "Noise-Abatement Method
for Explosives Testing," American Industrial Hygiene Conference, CONF-790633-1,
1 Jun 1979.
Pollet, D. A., "Sound Intensity Prediction System for the Island of Kahoolawe;
Program Maintenance Manual," NSWC/DL TR 3786, Mar 1978.
Rasmussen, R. A., CAPT, USAF, "A Prediction Method for Blast Focusing," USAFETAC
TN 71-8, Sep 1971.
Reed, J. W., "Project PROPA-GATOR - Intermediate Range Explosion Airblast Prop-
agation Measurements," SAND 80-1880C, Minutes of the 19th DOD Explosive Safety
Seminar, 9-11 Sep 1980.
Reed, J. W. "DICE THROW Off-site Blast Predictions and Measurements," in Pro-
ceedings of the DICE THROW Symposium, 21-23 June 1977, DNA 4377P-2, Jul 1977.
Reed, J. W., "Guidelines for Environmental Impact Statements on Noise (Air-
blast)," Minutes of the Seventeenth Explosives Safety Seminar, 14-16 Sep 1976.
Reed, J. W., "Long Range Predictions and Measurements, MISERS BLUFF, Phase II,"
in Proceedings of the MISER BLUFF Phase II Results Symposium, 27-29 Mar 1979,
Vol. I, POk 7013-1, 26 Sep 1979.
Reed, J. W., "Project MIDDLE GUST Blast Predictions and Microbarograph Measure-
ments," in Proceedings of the MIXED COMPANY/MIDDLE GUST Results Meeting, 13-15
March 1973, Vol. 1, DNA 3151P1, 1 May 1973.
8-2
NSWC TR 81-431
"Sonic Boom Experiments at Edwards Air Force Base," Interim Report, NSBEQ-1-67,
AD 655310, 28 Jul 1967.
"The Effects of Sonic Boom and Similar Impulsive Noise on Structures,"
NTID300.12, 31 Dec 1971.
Thompson, R. J., "Computing Sound Ray Paths in the Presence of Wind,"
SC-RR-67-53, Feb 1967.
Title 10 - Department of Health and Mental Hygiene, Maryland State Environmental
Health Administration, 10.03.45, Rules and Regulations Governing the Control of
Noise Pollution in Maryland, as amended 14 Sep 1977.
Von Gierke, H. E., Chairman, Working Group 69 on Evaluation of Environmental
Impact of Noise, "Guidelines for Preparing Environmental Impact Statements on
Noise," Committee on Hearing, Bioacoustics, and Biomechanics (CHABA), Assembly
of Behavioral and Social Sciences, National Research Council, Jun 1977.
Young, R. W., "Average Sound Level Including Sonic Booms," Acoustical Society of
* America Meeting, 6 Nov 1975.
8-3/8-4

NSWC TR 81-431
APPENDIX A
AN APPROXIMATE METHOD FOR DETERMINING CAUSTIC RANGES
This appendix describes an approximation which greatly simplifies the
determination of caustics (locations on the ground surface at which sound rays
are concentrated by the lens effect of the atmosphere). The standard ray
tracing methodsA,A 2 ,A 3 require that a large number of ray paths be cal-
culated in order to ensure that no caustic is missed. With the new approxima-
tion, caustics are calculated in a straightforward manner and only one ray path
calculation is required for each possible caustic.
The sound speed versus altitude profile must first be constructed using
Equation 5.1 of the text. Figure A-i shows the nomenclature convention used
in this appendix: altitude interval "i" extends from zi to zi+1, with inter-
val "I" beginning on the ground surface. The slope Ki is
v - viZi+l zi (A.1)
In ray tracing theory, a sound ray is considered to be travelling in a par-
*ticular direction as it leaves the source. Snell's law is assumed to hold over
the entire ray path:
A-lcox, E. F., "Far Transmission of Air Blast Waves," Phys. Fluids1, 95-101, Mar-Apr 1958
A-2Perkins, B., Jr., Lorrain, P. H., and Townsend, W. H., "Forecasting theFocus of Air Blasts due to Meteorological Conditions in the LowerAtmosphere," BRL RPport No. 1118, Oct 1960.
SA- 3pollet, D. A., "Sound Intensity Prediction System for the Island ofKahoolawe; Program Maintenance Manual," NSWC/DL TR-3786, Mar 1978.
A-1I

NSWC TR 81-431
1+
K Ki
'LI - I
K3
3
2K
42K1
GROUND SURFACE
SOUND SPEED (v)
FIGURE A-1 SOUND SPEED PROFILE INDEXING CONVENTION
A-2
NSWC TR 81-431
Cos 1Sconstant (A.2)
V vmax
where e is the angle between the ray path direction and the horizontal, v is the
sound speed at the current altitude of the sound ray, and Vmax is the sound
speed at the altitude where the ray turns over (cos 6 - 1) and is determined
by the initial angle and sound speed. Because of Equation A.2, the path of a
sound ray is uniquely specified by the sound speed profile once the initial
angle e is selected.
The range R of a ray path is the distance from the source to that point at
which the ray touches the ground. In this appendix the source and the touch-
down point are assumed to be at the same altitude. It can be shownA 2,A 3
that the range for a ray passing through N complete altitude intervals and
turning over in interval N + 1 (KN+1 > 0) is:
N 2 vi 2 vN+1RN+ i=i Tcos ,i (sin - sin 6 +) + tan 'N+1 (A.3)
Using Equation A.2 and noting that
n /1 2 / 2 2-"sin 6$ -l- cos - i-V / v
osi i max
Equation A.3 can be rewritten:
A-2See footnote A-2 on page A-1.
- A-3See footnote A-3 on page A-1.
A-3

NSWC TR 81-431
N 2 v__ _ _ / 2 2i 2 a 2v-/v /1 v V/V
+ 2 /2 2+ KN+ max N+l (A.4)
The simplifying approximation is made at this point. (In order to avoid
showing a large amount of algebra, only the directions for the operations to be
performed will be given.) Since vi is always less than Vmax in the first N
intervals, the two terms in the parentheses in Equation A.4 can be expanded in*: Taylor series. Collect terms according to descending powers of Vmax , A
factor of (v2 - v2 )/v2 can now be taken out of each term. The remainderi i+1 maxfor each term is a summation of the products of various powers of vi and vi+l.
Now make the approximation
vi vi+ 1 v (A.5)
where v is the average sound speed in the first N altitude intervals:
Nv 1 (zi+I - zi)(vi + vi+l)/ 2(zN+l - zl) (A.6)
When this approximation is made, the remainder terms are seen to be the
expansion of -1/2 / _ ;2/v 2 so that the parentheses term in Equation A.4 ismax2 2)1 2 -
simply (v1 - 2 V - vi+ vi, max max
Equation A.4 then becomes
A-4
Il

NSWC TR 81-431
2 2
N(v i+1 l I _+2 £2 2•~ N +.1 - I z~ T + - v +v (A. 7)
ilK/ 2 1KN-I- max N+Imax
Using Equations A.1 and A.6, Equation A.7 eventually becomes
2 (zN+1 -z I) v 2 /2 2
max VN+(
max
There can be situations where the range R first decreases and then
increases as the initial angle of departure e gradually increases. A caustic
exists where the range reverses direction, that is, at a value of R such
that
dR dR dR - (A.9)de d cos = d vmax
where use has been made of Equation A.2. When Equation A.9 is applied to
Equation A.8, the condition for a caustic becomes:
(ZN+l - Zl) 1_ _
0 (A. 10)0= 2 2 ;23/2 / 2 2
(V v) vN vN+ max N+l
where vmax is the unknown quantity to be solved for. The focal point is
determined when the vmax specified by Equation A.10 is substituted into Equation
A.8.
Equation A.10 can be transformed into a cubic equation for Vmax by squaring
the two terms on opposite sides of the equal sign. This means that only half of
the three cubic solutions will be physically meaningful. It can be shown that
if
A-5
NSWC TR 81-431
2 22 2(vmax 2 v'27 v I 1
x KN+I(ZN+ - Z) v and COS - 2 KN+l(zN+1 - Zl)V (A.1)
then the cubic equation is:
0 x-- cos (A.12)
This equation is in the desired form for standard cubic solution techniques.A -4
The physical solutions are:1 2 *- ~ !Cos + os 1
+_r3 cos C - COS2 j - for cos € >1 (A.13)
X -- cos (/3) for Icos I<I (A.14)
There is no real solution for cos 0 < -I. This is a nonphysical restriction
since caustics can exist for cos * < -1. This problem will be addressed again
below. When a cubic solution exists, the caustic range is given by:
R4 (ZN+l 1 ) ~ (A. 15)
Caustic -K4
This value for the caustic range was obtained with the assumption that there was
no upper bound on the altitude interval N + 1. Therefore, the existence of the
calculated caustic range must be checked by performing a standard ray path
A-4Beyer, W. H., Ed., CRC Handbook of Mathematical Sciences, 5th
Edition, CRC Press, Inc., 1978.
A-6
4I

NSWC TR 81-431
calculation using the initial angle of departure e specified by Vmax V
If the range for this ray is greater than or equal to the calculated caustic
range, then this focal point does physically exist; otherwise not. This check-
ing procedure implies that the caustic calculation need be made only for those
situations where vN+2 is greater than all sound speeds at lower altitudes.
This means that any sound speed profile needs to be evaluated only once from the
ground up, with the average velocity V being continuously updated and a caus-
tic range calculation made only when a new maximum velocity is found.
The caustic range given by Equation A. 15 is always less than or equal to
* the caustic range obtained by an exact ray path search. Comparisons for a
number of simple profiles showed that the approximate caustic ranges were
generally within a few percent of the "exact" caustic ranges. The relative
errors tended to be less for the shorter caustic ranges.
It was mentioned earlier that when cos * < -1 in Equation A.11, there wasno real cubic solution even when physical caustics did exist. To obtain
solutions in this region, use the following set of equations:
-2 2
- VN+l) 2
W- KN+ 1 (zN+ 1 - I -27 coo (A. 16)
/ (z~ + - z1) ; 1)/4
Rc4ti 4 v (1 + W) (A. 17)
This set is related to a derivation in which the average sound speed V was
originally defined slightly differently than in Equation A.6 so that the equa-
tion corresponding to Equation A. 12 was quadratic instead of cubic. The quad-
ratic formulation is somewhat less accurate than the cubic formulation, espe-
cially for large caustic ranges. Figure A-2 compares these two formulations.
It is recommended that the cubic calculation be used for cos $ > 0, and the
quadratic calculation for cos 0 < 0.
A-7
_______ *1ii!i ..

NSWC TR 81-431
CR 0
U
'3 0
w
U.
O -- O
U
0
p... Fq.. .
'3
0
0
Il
cc
A-8

NSWC TR 81-431
APPENDIX B
GENERAL INSTRUCTIONS FOR PROGRAMMINGTHE NSWC LONG RANGE AIRBLAST OVERPRESSURE
PREDICTION METHOD
The NSWC airblast magnitude prediction method was developed in an effort to
reduce the impact of naval explosive exercises (both airdrops and naval gunfire)
on the communities surrounding the Bloodsworth Island target range in the
Chesapeake Bay. This method uses measured or forecast upper air meteorological
data to predict the airblast levels to be expected in the neighboring communi-
ties from explosions of any size. The method is applicable to both positive and
negative sound velocity gradients and should be adaptable to other explosive
operations.
This appendix outlines the general procedures to be followed when program-
ming the NSWC method for any computer system. An adequate computer/calculator
should have at least 50 storage registers and sufficient program memory for the
required operations. The method is currently programmed for the TI-59 and the
HP-41C hand-held calculatcrs.
The programming notation used below is related to the BASIC programming
language and should be obvious to an experienced programmer. The recommended
program flow has the following order:
1. WEATHER DATA INPUT
The following upper air meteorological data is needed for each significant
altitude level or pressure level. This data should represent the typical
weather conditions over the entire area between the explosion source and the
locations for which the airblast overpressure predictions are to be made.
Unless significant weather changes occur, e.g., the morning temperature inversion
B-I

NSWC IR 81-431
disappears or a front moves through, the most recent upper air meteorolog-
ical data available from a nearby weather station may usually be sufficiently
accurate for this purpose. Use any convenient units for input.
N - total number of altitude or pressure levels, including the ground
surface level.
I - the index number for a given altitude or pressure level. I = I
represents the ground surface level.
FOR I - 1 to N (data input loop)
Z(I) - Altitude for level I, or
P(I) - Absolute pressure for level I.
Note: Either Z(I) or P(I) can be entered. Do not enter both.
Note: The highest level should be at a height above the surface
equaL to one tenth the greatest range of interest.
Note: If Z(I) values are entered, the ambient pressure at
the ground surface Po-->P(1) must be entered at some
point.
T() - Temperature at level T.
S(I) - Wind speed at level I.
D(I) - Wind direction at level I.
NEXT I (end of data input loop)
It would be a good idea for documentation purposes to print out the data
values that were read in.
B-2

F
NSWC TR 81-431
2. WEATHER DATA CONVERSION
The weather data must be converted, if necessary, to the units required for
the airblast overpressure prediction calculations.
FOR I - 1 to N (data conversion loop)
T(1)-->T() in units of degrees Celsius
S(I)-->S(I) in units of meters/second
D(I)-->D(I) in units of degrees azimuth clockwise from true North,
the direction from which the wind is blowing.
(if Z(I) was read in:)
Z(I)-->Z(I) in units of kilometers
CO TO end of loop (NEXT I)
(if P(I) was read in, use the following approximation derived from the
hydrostatic equation dP =- Pgdz)
IF I - 1, THEN 0-Z(I) and GO TO end of loop (NEXT I).
0.01464* [T(I) + T(I-1) + 546.3] * loge LP(I-1)
+ Z(I-1)->Z(I) The units are kilometers.
NEXT I (end of data conversion loop)
The short loop below resets the altitude values Z(I) relative to the
surface level. Reset the surface level last.
FOR I - 2 to N (Z loop)
Z(I) - Z(1)-)z(I)
NEXT I (end of Z loop)
O-Z ( 1)
Convert at least the ambient ground surface level pressure P(I) outside the
above loops. All pressure P(I) could be converted at the beginning of the data
conversion loop if desired, but only P(1) will be used below.
B-3

NSWC TR 81-431
P(1)-->P(1) in units of kilopascals.
Note: 1000 millibars - 100 kilopascals.
Now that the weather data has been read in and converted, the versatility
. of the NSWC method requires that a choice be made. Either (a) an explosive
weight can be specified and calculations made for the expected airblast over-
pressure at a particular location or at a number of locations; or (b) a maximum
airblast overpressure can be specified for a particular location and calcula-
tions made for the maximum allowable explosive weight which could be used at the
-target site under the given weather conditions. Other choices could also be
made as discussed in the NSWC PREDICTION METHOD section in Chapter 5. In the
development below, only choice (a) will be considered.
3. EXPLOSIVE WEIGHT INPUT
The maximum TNT blast equivalent weight W which will be detonated simulta-
* neously on the surface at the target site must now be entered.
input: W - explosive weight (any units)
convert: W->W in units of kilograms TNT
4. LOCATION INPUT
Now some more choices must be made. Either (a) a number of locations can
be actively entered each time the program is run; or (b) a number of important
" locations can be programmed into the code and automatically evaluated each time
the code is run; or (c) a combination of the above choices can be made. In the
programming below, only choice (a) will be considered.
input: R - Range or distance of desired location from explosion
source (any units)
A - Azimuth angle of location as viewed from the explosion
source
B
B -4
Ip

D-Ai22 292 NOISE ABATEMENT INVESTIGATION FOR THE BLOODSWdORTH 2/2ISLAND TARGET RANGE: DE..(U) NAVAL SURFACE WEAPONSCENTER SILVER SPRING MD R A LORENZ 82 NOV 81
UNCLASSIFIED NSWdC/TR-Si-43i 581-AD-F560 898 F/G 0/'2 NLm7Em-ND

i
"11
-,J,
1111121. 1 .4o 1.
MICROCOPY RESOLUTION TEST CHARTNATIONAL BUREAU OF STANDARDS- 1963-A
Sf

NSWC TR 81-431
convert: R--R in units of kilometers
A->A in units of degrees azimuth clockwise from true
North as viewed from the explosion source.
5. WEATHER PARAMETER
The parameter B which represents the airblast focusing power of the input
weather conditions is calculated as follows:
initialize: -1000-->B (Any large negative value will do as well.)
331 V1 + T (1)/273-C0
CO - S(M)*cos(D(1) - A)-VO
FOR 1 2 to N (weather parameter loop)
331 /1 + T(I)/273 - S(I)*cos (D(I) - A) - VO->V
(V is the combined sound speed and wind speed for level I less that
for ground level in the A direction from the explosion source.)
IF R/Z(I) < 75 THEN 3*R*V/[Z(I)*CO]-->B1
IF R/Z(I) > 75 THEN 225*V/CO-->B1
IF Bi > B, THEN B-->B
NEXT I (end of weather parameter loop)
convert: arctan (B)-->B in units of degrees
(The arctan function must give values between +90 degrees and -90
degrees.)
Now the maximum focusing power parameter B for the given weather conditions
at distance R in the direction A has been determined.
B-5
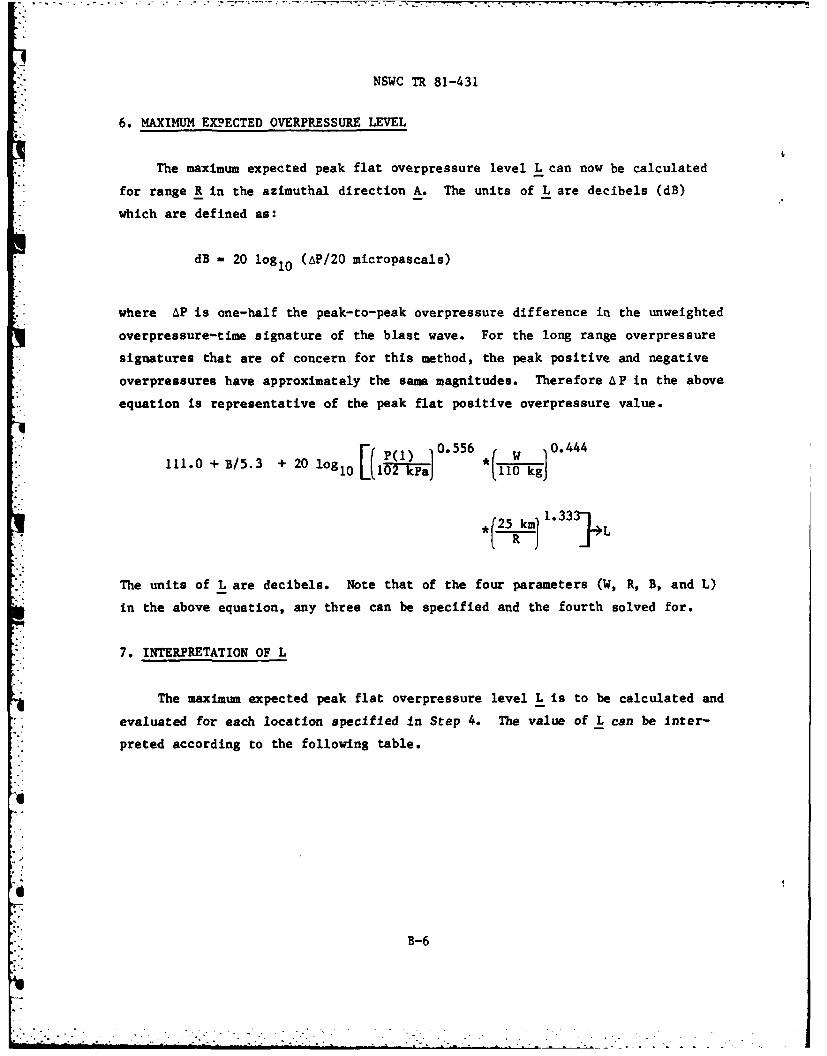
NSWC TR 81-431
6. MAXIMUM EXIECTED OVERPRESSURE LEVEL
The maximum expected peak flat overpressure level L can now be calculated
for range R in the azimuthal direction A. The units of L are decibels (dB)
which are defined as:
dB - 20 log 10 (AP/20 micropascals)
* where tiP is one-half the peak-to-peak overpressure difference in the unweighted
overpressure-time signature of the blast wave. For the long range overpressure
signatures that are of concern for this method, the peak positive and negative
overpressures have approximately the same magnitudes. Therefore A P in the above
equation is representative of the peak flat positive overpressure value.
' [(P(1) 0556 , 10 .44 4
111.0 + B/5.3 + 20 log10 10-k- .5 110 kg]
*(25 Rkmn 1*33 ]4L
The units of L are decibels. Note that of the four parameters (W, R, B, and L)
in the above equation, any three can be specified and the fourth solved for.
7. INTERPRETATION OF L
The maximum expected peak flat overpressure level L is to be calculated and
evaluated for each location specified in Step 4. The value of L can be inter-
preted according to the following table.
B-6

NSWC TR 81-431
L (d) Expected Conditions
> 125 Minor damage (e.g., broken windows, cracked plaster)
> 116 Complaints to be expected
> 112 Complaints are probable
> 108 Complaints once in a while (a 4 dB difference means
that the peak pressure of the larger shock is 1.6 times
greater than that of the smaller shock.)
< < 108 No complaints expected
The mean expected overpressure level is approximately 8.0 dB below L. The minimum
expected overpressure level is approximately 18.0 dB below L.
The 125 dB minor damage threshold was observed during the Mk 82 bomb (110
kg TNT) data acquisition program at Bloodsworth Island. The 116 dB and 112 dB
complaint thresholds are somewhat more speculative, but are related to long-
established 5" naval gunfire control procedures for the Bloodsworth Island tar-
get range. It is recommended that the complaint threshold values be refined for
a given target range by correlating the predicted L values with actual com-
plaints.
8. LOCATION LOOP
Repeat the above procedures, beginning at Step 4, for each location of
interest.
MISCELLANEOUS COMMENTS
TERRAIN EFFECTS. The NSWC airblast prediction method was developed using
*" measurements of surface bursts where the airblast propagated over several
*kilometers of water and then over flat land. The effect of natural barriers
such as mountains or forests is not known. If focusing is caused by high alti-
tude weather conditions, no screening should be expected. The effect of chan-
neling through mountains is also unknown.
It is believed that the NSWC prediction method gives a practical upper
bound estimate for the long range overpressure levels to be expected from a
B-7

NSWC TR 81-431
given surface explosion under the specified weather conditions, whether barriersare present or not.
MUZZLE BLAST. It was found in Chapter 5 that an equivalent weight of 30kg TNT at the ship position worked well to correlate the weather parameter Bwith the overpressure levels measured for the muzzle blast from 5" naval gun-fire, for both 5"/38 and 5"/54 caliber shells.
B-8
i..'2-'..2.'2. ". ... ..-. '.. '. • ". -: '.- . , -- .-- . -

NSWC TR 81-431
DISTRIBUTION
Copies Copies
Commander in Chief CommanderU.S. Atlantic Fleet Naval Weapons CenterAttn: Code N322 I Attn: Mr. Evert (Code 6234)Norfolk, VA 23511 China Lake, CA 93555
Commander Office of Naval ResearchNaval Amphibious School Attn: Mr. Cross (Code 465) 1Attn: Code 41 5 800 N. Quincy StreetLittle Creek, VA 23521 Arlington, VA 22217
Commander CommanderFleet Weather Central U.S. Naval StationAttn: D. Snyder 3 Attn: Mr. LinaburgMcAdie Building (U-117) AFTWF/OIC, NOCDNaval Air Station Box 3084Norfolk, VA 23511 FFO Miami, FL 34051
Commander CommanderAtlantic Division Fleet Numerical Oceanography
7 Naval Facilities Engineering CenterCommand Attn: LCDR R. Lanier (Code 32A) 3
Attn: C.-Magu re 1 Monterey, CA 93940J. Vardy 1
Norfolk, VA 23511 ChairmanDepartment of Defense
Commander Explosives Safety BoardNaval Postgraduate School Attn: T. ZakerAttn: LCDR D. E. Smith (Code 33) 1 Room 856-C Hoffman Bldg. 1Weapons Engineering 2461 Eisenhower AvenueMonterey, CA 93940 Alexandria, VA 22331
Commander 2WS/DRNaval Ocean Systems Center Attn: MAJ S. Strader 5Attn: R. Young (Code 51212) 1 Andrews AFB, DC 20334271 Catalina Blvd.San Diego, CA 92152 AFSC/WER
Attn: E. FisherOfficer in Charge Andrews AFB, DC 20334Naval Civil EngineeringLaboratory ESMC/WE
Attn: W. Keenan (Code L51) 1 Attn: LCOL J. Oliver INaval Construction Battalion 0. DanielCenter Patrick AFB, FL 32925
Port Hueneme, CA 93043
NSWC TR 81-431
DISTRIBUTION (Cont.)
Copies Copies
WSMC/WE NASA Marshall Space Flight CenterAttn: LCOL R. Anthony I Attn: 0. E. Smith (Code ES-81)
C. Boire 1 Huntsville, AL 35812Vandenberg AFB, CA 93437
Sandia Laboratories6585 Test Group/WE Attn: J. ReedAttn: MAJ P. Burnett 1 P.O. Box 5800
CAPT J. Kahler 1 Albuquerque, NM 87185
Holloman AFB, NM 88330Southwest Research Institute
AD/WE Attn: W. Baker
Attn: LCOL Johnson 1 8500 Culebra Road
E. Keppel I San Antonio, TX 78206Eglin AFB, FL 32542
New Mexico Institute of Mining
AFFTC/WE and Technology" Attn: LCOL W. Crandall 1 Attn: J. McLain
Edwards AFB, CA 93523 TERASocorro, NM 87801
SD/WE" Attn: LCOL F. Globokar 1 STEPD-MT-DA-M
Los Angeles AFS, CA 90045 Meteorology BranchAttn: Mr. Carlson
USAFETAC/DO Dugway Proving Ground
- Attn: MA Galusha 1 Dugway, UT 48022Scott APB, IL 62225
Tonapah Test RangePacific Missile Test Center Attn: J. Van MeterAttn: B. Hixon (Code 3252) 1 Division 1172Point Mugu, CA 93042 P.O. Box 871
Tonapah, NV 89049Defense Technical InformationCenter DELAS-AS-P
Cameron Station Attn: Mr. Kubinski I
Alexandria, VA 22314 12 Mr. Pries-White Sands Missile Range
STEYP-MDP-D NM 88002Attn: Mr. Carter 1Yuma Proving Ground RCC/MG Member (KMR)
Yuma, AZ 85364 Attn: J. Bobbie2003 Byrd Spring Road
* National Oceanic and Huntsville, AL 35802
Atmospheric AdministrationAttn: R. Titus I Director, AMRL/BBE
Weather Service Nuclear Attn: H. Von Gierke
Support Office Wright-Patterson AFB, OH 45433
P.O. Box 14985Las Vegas, NV 89114
2
.-

-: -
NSWC TR 81-431
DISTRIBUTION (Cont.)
£Copies Copies
Bolt, Beranek and Newman, Inc. Lawrence Livermore LaboratoryAttn: B. Calloway 1 Attn: H. Pfeifer 121120 Vanowen Street B. Odell 1P.O. Box 633 V. Arganbright 1Canoga Park, CA 91305 Livermore, CA 94550
Construction Engineering University of Dayton ResearchResearch Laboratory Institute
Attn: P. Schomer 1 Attn: J. FeltR. Goff 1 Dayton, OH 45469R. Raspet 1
P.O. Box 4005 Environmental Protection AgencyChampaign, IL 61820 Attn: J. Goldstein 1
Office of Noise Abatement andControl
Washington, DC 20460
3

I
I