abandoning sverdrup 0.010.11.010 50 40 30 70 60 50 40 30 70 60 50403070601008020 june chlorophyll...
TRANSCRIPT

Abandoning Sverdrup
0.01 0.1 1.0 10
50
40
30
70
60
50
40
30
70
60
50 40 3070 60 10 080 20
June Chlorophyll 1998 - 2006 (mg m-3)

1953Google citation count: 561
Net phytoplankton growth occurs when area acd > abdf

• Sverdrup’s 1953 paper was a formalization of the ‘critical depth’ concept originally proposed by Gran and Braarud in 1935*
• The critical depth hypothesis attempts to explain what initiates a vernal bloom, not what controls the magnitude of a bloom
• A bloom is an increase in biomass, not photosynthetic rate
• The hypothesis states that a bloom begins when the mixed layer shoals to a depth above the critical depth horizon where production (P) > respiration (R)
• R = grazing + sinking + phytoplankton respiration + all other losses
• R is assumed constant
• Inverse of Sverdrup: prior to crossing the critical depth criterion, net growth is negligible or negative
* Gran & Braarud. 1935. J. Biol. Board Can. 1 (5), 279-467

• Sverdrup: net growth can be independent of gross production under heavy grazing
• Sverdrup: the ‘bloom’ observed 2 days after “the depth of the mixed layer was for the first time smaller than the critical depth” likely reflected advection not rapid local growth
• Sverdrup: the first increase in biomass occurred before stratification
• Sverdrup: “It is therefore not advisable to place too great emphasis on the agreement between theory and [the Weather Ship ‘M’] observations”
(occurrence of blooms in the absence of stratification is not uncommon)
* e.g., Townsend et al. 1992. Nature 360, 59-62

50
40
30
70
60
50
40
30
70
60
50 40 3070 60 10 080 20
0.01 0.1 1.0 10Chlorophyll (mg m-3)
ANA-12
NA-7NA-8NA-9
NA-6 NA-5 NA-4
NA-3 NA-2 NA-1
NA-10NA-11
Abandoning Sverdrup
• SeaWiFS data 1998 – 2006• 8-day resolution• 12 central NA bins, minimize advect.• Chlsat = OC4-V4• Cphyto = GSM / Westberry et al 2008
= 1989 NABE
= 2008 NAB
= focus in later slides
1998 1999 2000 2001 2005 20062002 2003 2004
Cph
yto
(mg
C m
-3 )
0
20
40
60
80
Chlsat (m
g m-3 )0.0
0.2
0.4
0.6
0.8
1.0
1.2
1.4
1.6
Year
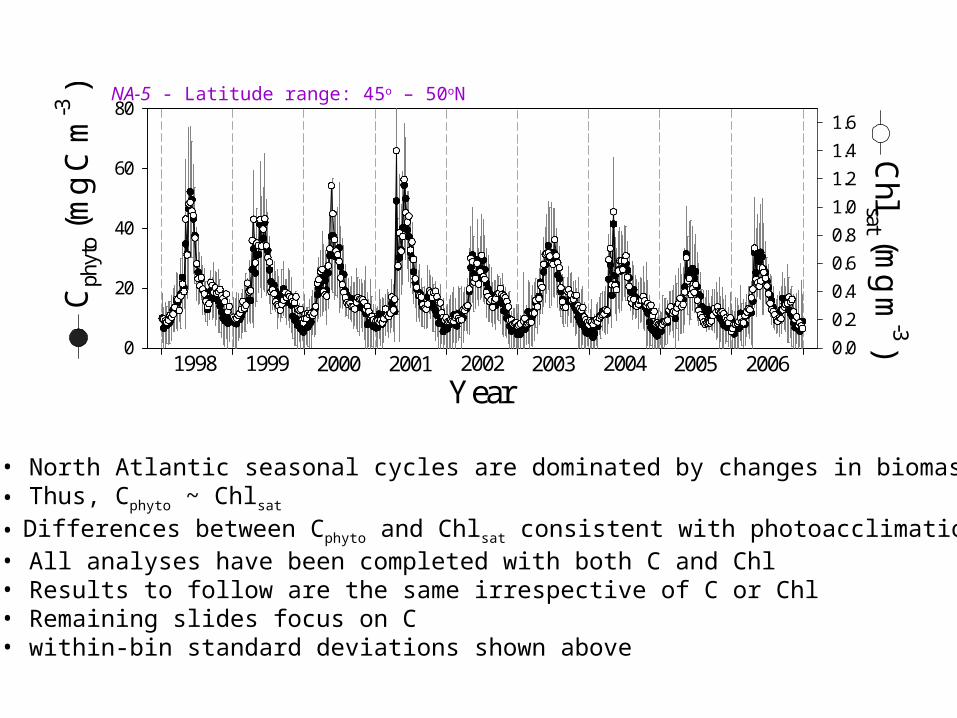
• North Atlantic seasonal cycles are dominated by changes in biomass• Thus, Cphyto ~ Chlsat
• Differences between Cphyto and Chlsat consistent with photoacclimation• All analyses have been completed with both C and Chl• Results to follow are the same irrespective of C or Chl• Remaining slides focus on C• within-bin standard deviations shown above
NA-5 - Latitude range: 45o – 50oN

1998 1999 2000 2001 2005 20062002 2003 2004
Cph
yto
(mg
C m
-3 )
0
20
40
60
80
YearPAR MLD
• peak biomass occurs in spring• coincident with rising PAR and shoaling MLD• also associated with rapid rise in primary production
Conclusion: phytoplankton in the North Atlantic exhibit a repeated vernal bloom caused by increased primary production and growth associated with rising light and shallowing mixed layers – aka, Sverdrup
… unfortunately, biomass can be a terribly misleading thing…. & correlation is not causation
NA-5 - Latitude range: 45o – 50oN

Bloom in a Bottle
• To understand what causes a bloom, it is necessary to first identify when a bloom started
• The start of a bloom can not be defined by biomass - e.g., when biomass X mg m-3 or Y% above annual median
• Using biomass can lead to the wrong start date and association of bloom initiation with the wrong environmental forcing
• Bloom initiation implies a change in the rate of growth – for Sverdrup it was the beginning of positive net growth
• An easy way to get a first-order sense of rate changes is to plot biomass on a logarithmic scale
0
2
4
6
8
10
12
Days0 2 4 6 8 10
Chl
orop
hyll
con
cent
rati
on (
mg
m-3
)
0.1
1
10
?
pert
urba
tion
Net growth rate = r = ln(C1/C0) = slope of log plot t1 – t0
0 2 4 6 8 10
0
2
4
6
8
10
12
Chl
orop
hyll
con
cent
rati
on (
mg
m-3
)
5% > mean
1998 1999 2000 2001 2005 20062002 2003 2004
2
468
20
406080
10
100
Year
-300
-250
-200
-150
-100
-50
0
789
20
30
10
-300
-250
-200
-150
-100
-50
0
6789
20
30
40
10
-300
-250
-200
-150
-100
-50
0
Cph
yto
(mg
C m
-3 )
456789
20
304050
10
-500
-400
-300
-200
-100
0
68
20
40
6080
10
J JMAJ A OM SF N D
Month
10
108
6
108
ML
D (m
)
NA-11
NA-8
NA-5
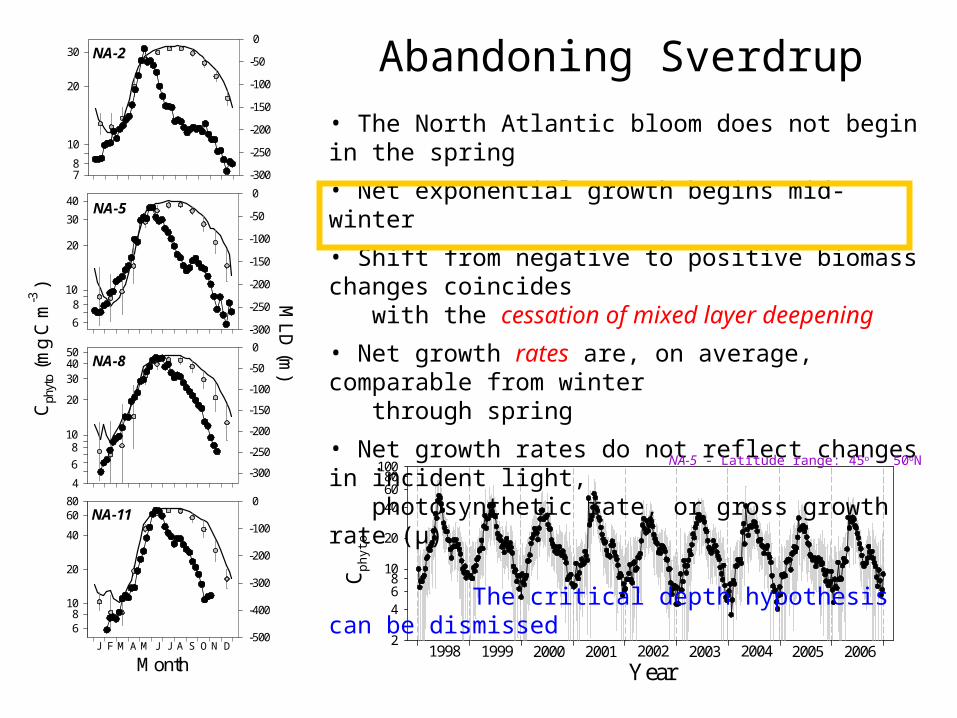
NA-2 Abandoning Sverdrup
• The North Atlantic bloom does not begin in the spring
• Net exponential growth begins mid-winter
• Shift from negative to positive biomass changes coincides with the cessation of mixed layer deepening
• Net growth rates are, on average, comparable from winter through spring
• Net growth rates do not reflect changes in incident light, photosynthetic rate, or gross growth rate (µ)
The critical depth hypothesis can be dismissed
Cph
yto
NA-5 - Latitude range: 45o – 50oN

Bloom in a Bottle
• Population specific net growth rates (r) can be calculated from changes in phytoplankton concentration (m-3) so long as the mixed layer is either shoaling or not deepening
• However, one must consider the influence of dilution when the mixed layer is deepening
• A dilution correction should be considered when assessing growth rates during mixed layer deepening
ML
D (m
)
-300
-250
-200
-150
-100
-50
0
Cph
yto
(mg
m-3
)
10
Chlsat (m
g m-3)
1.0
MJ F A M J J A S O N D
0.8
0.6
0.4
0.2
40
20
8
6
60
r = ln(C1/C0) t1 – t0
r = ln[(C1× MLD1) /[(C0×MLD0)] t1 – t0
NA-5 - Latitude range: 45o – 50oN
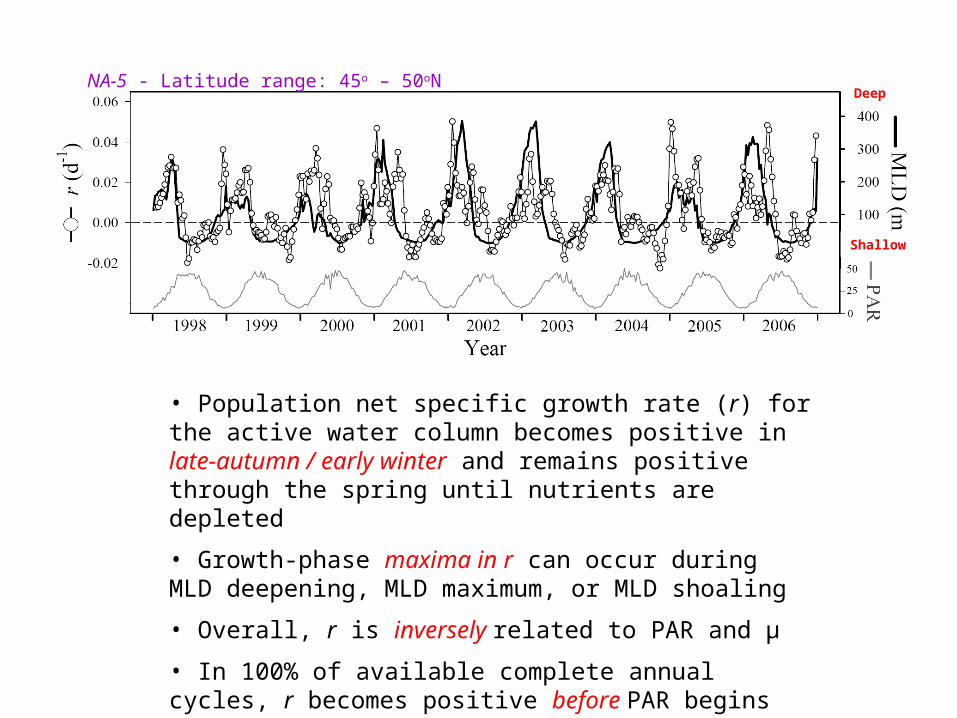
• Population net specific growth rate (r) for the active water column becomes positive in late-autumn / early winter and remains positive through the spring until nutrients are depleted
• Growth-phase maxima in r can occur during MLD deepening, MLD maximum, or MLD shoaling
• Overall, r is inversely related to PAR and µ
• In 100% of available complete annual cycles, r becomes positive before PAR begins to increase
Deep
Shallow

NA-5 - Latitude range: 45o – 50oN
Deep
Shallow
Starting now in July
• The ‘vernal’ bloom appears to be an event initiated in late fall• Triggering of the bloom appears to be associated with mixed layer deepening (not shoaling)
How is this possible? Why the mid-winter decrease in r?
Month
r (d
-1)
:
(d-1
)
0.0
0.2
0.4
0.6
0.8
1.0
J A S O N D J F M A M J J
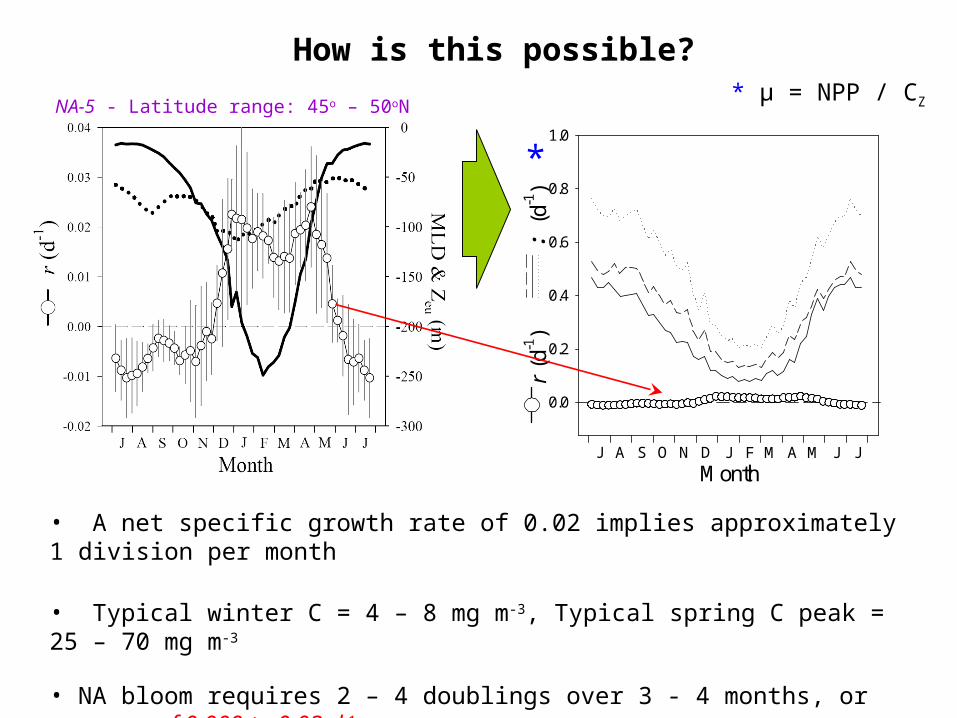
NA-5 - Latitude range: 45o – 50oN* µ = NPP / CZ
*
• A net specific growth rate of 0.02 implies approximately 1 division per month
• Typical winter C = 4 – 8 mg m-3, Typical spring C peak = 25 – 70 mg m-3
• NA bloom requires 2 – 4 doublings over 3 - 4 months, or average r of 0.009 to 0.03 d-1
How is this possible?

Month
r (d
-1)
:
(d-1
)
0.0
0.2
0.4
0.6
0.8
1.0
J A S O N D J F M A M J J
Production (mg C m-2 d-1)
10 100 1000 10000
"Res
pira
tion
" (m
g C
m-2
d-1
)
10
100
1000
10000
• Positive r through winter is allowed because losses co-vary with µ (Sverdrup assumed this ‘respiration’ to be a constant) – r µ 0 as PAR 0 at very high latitudes in mid-winter (no light) – a critical depth can never be reached
• The increase in r during winter implies that the fraction of µ that escapes predation and other losses (i.e., r:µ) must increase in the winter

The mid-winter decrease

*
Landry & Hassett 1982 Mar. Biol. 67, 283-288Landry et al. 1995 Mar. Ecol. Prog. Ser. 120, 53-63*
Diluted Digression

Month
ML
D &
Zeu (m
)-300
-250
-200
-150
-100
-50
0
r::
0.00
0.05
0.10
0.15
0.20
J A S O N D J F M A M J J
The ‘Grand Dilution Hypothesis’
Landry & Hassett 1982 Mar. Biol. 67, 283-288Landry et al. 1995 Mar. Ecol. Prog. Ser. 120, 53-63*
*• As a replacement for the Critical Depth Hypothesis, it is proposed that the north Atlantic bloom is a consequence of a massive scale ‘dilution experiment’
• Mixed layer deepening causes a slight decoupling between phytoplankton growth and losses (grazing, mostly)
• The ‘decoupling’ increases so long as the mixed layer continues to deepen
• Mixed layer shoaling drives a ‘re-coupling’ of phytoplankton growth and losses (grazing)
• Thus, while spring shoaling and increasing light favor enhanced photosynthesis and growth, they also favor heavier grazing losses
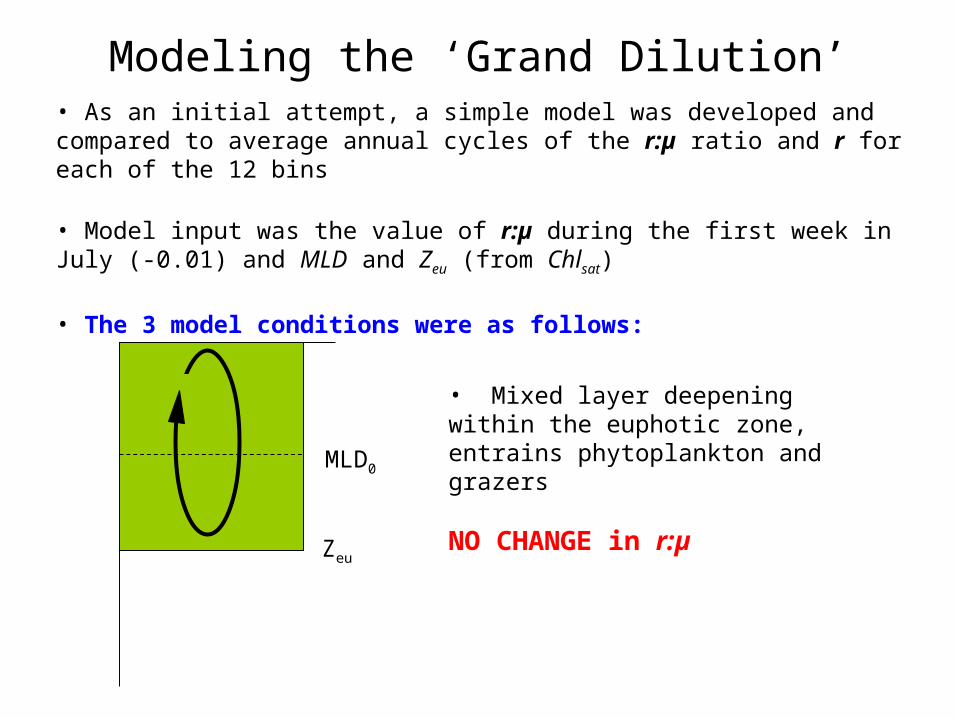
Modeling the ‘Grand Dilution’• As an initial attempt, a simple model was developed and compared to average annual cycles of the r:µ ratio and r for each of the 12 bins
• Model input was the value of r:µ during the first week in July (-0.01) and MLD and Zeu (from Chlsat)
• The 3 model conditions were as follows:
MLD0
Zeu
• Mixed layer deepening within the euphotic zone, entrains phytoplankton and grazers
NO CHANGE in r:µ
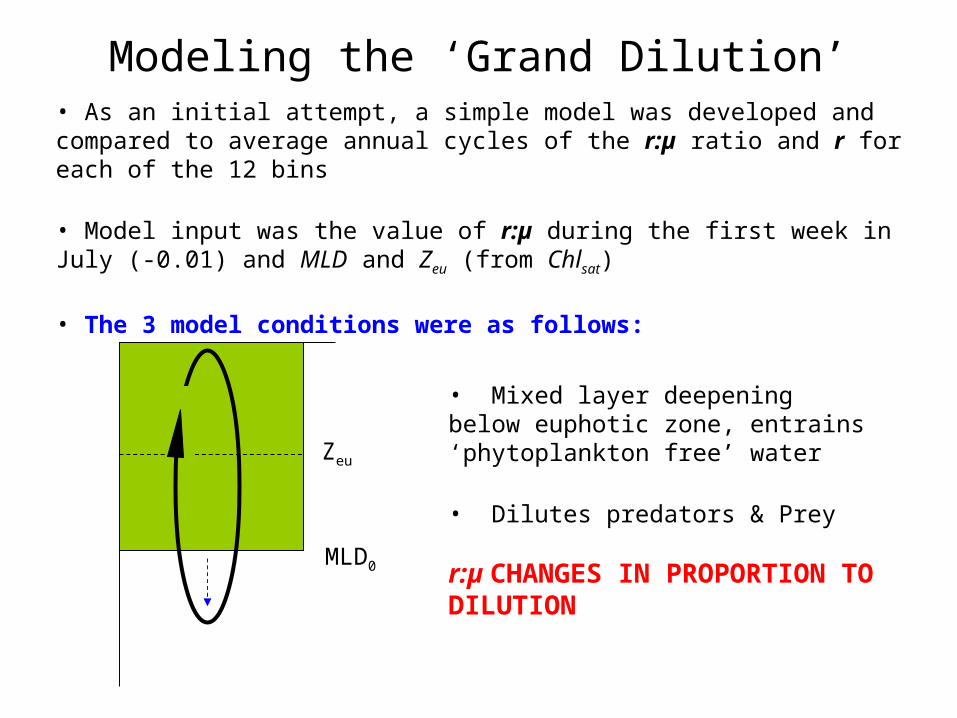
Modeling the ‘Grand Dilution’• As an initial attempt, a simple model was developed and compared to average annual cycles of the r:µ ratio and r for each of the 12 bins
• Model input was the value of r:µ during the first week in July (-0.01) and MLD and Zeu (from Chlsat)
• The 3 model conditions were as follows:
MLD0
Zeu
• Mixed layer deepening below euphotic zone, entrains ‘phytoplankton free’ water
• Dilutes predators & Prey
r:µ CHANGES IN PROPORTION TO DILUTION
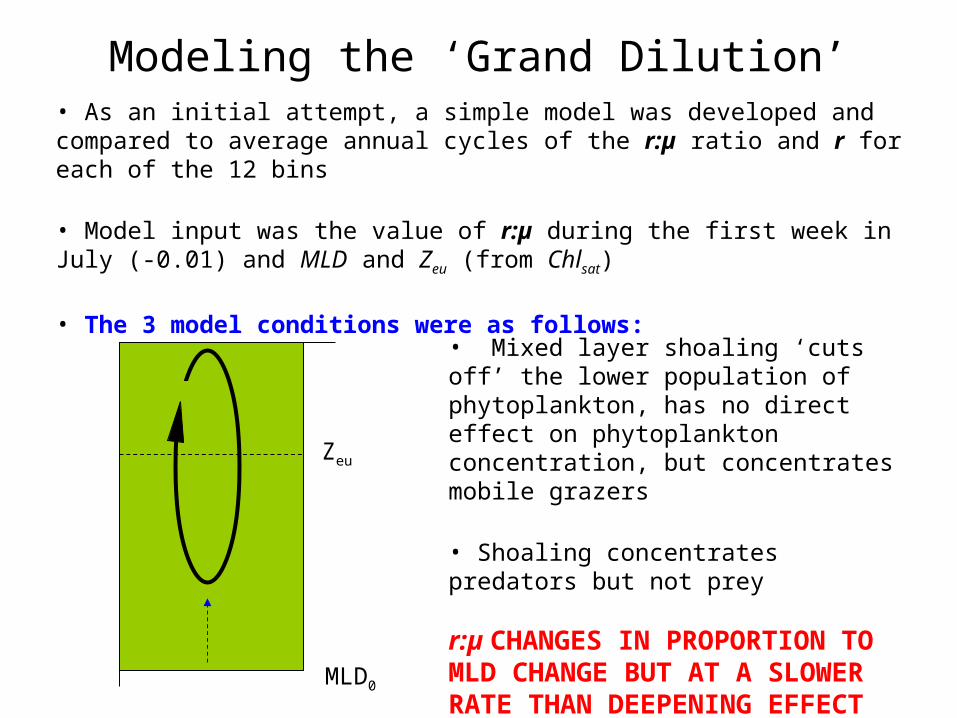
Modeling the ‘Grand Dilution’• As an initial attempt, a simple model was developed and compared to average annual cycles of the r:µ ratio and r for each of the 12 bins
• Model input was the value of r:µ during the first week in July (-0.01) and MLD and Zeu (from Chlsat)
• The 3 model conditions were as follows:
MLD0
Zeu
• Mixed layer shoaling ‘cuts off’ the lower population of phytoplankton, has no direct effect on phytoplankton concentration, but concentrates mobile grazers
• Shoaling concentrates predators but not prey
r:µ CHANGES IN PROPORTION TO MLD CHANGE BUT AT A SLOWER RATE THAN DEEPENING EFFECT

Modeling the ‘Grand Dilution’

Final Comments
• Temporal coverage of the satellite record provides a unique opportunity to re-evaluate bloom dynamics
• The critical depth hypothesis is found wanting (…actually, it fails miserably…)
• A Grand Dilution Hypothesis is suggested, but is not the only potential explanation (aggregation, temperature effects, sinking….?)
• Dilution Hypothesis accommodates blooms w/o stratification
• Climate change effects on North Atlantic (and other) blooms may be very much different for a ‘Critical Depth’ concept of blooms and a ‘Dilution’ concept of blooms
• Revisiting bloom experimentation in North Atlantic?

“
”*
*
Winter Chlz
Lat trends
Mixing velocity
Feb C max
Lat r µ
Cphyt vs Csat


