ab initio study of interaction of a model nitrile polymer ... archive/files/merge/vol-48... · ab...
TRANSCRIPT
Ab initio Study of Interaction of a Model Nitrile Polymer with Various Model Fuel Molecules
Dominic R. Alfonso and Anthony V. Cugini
National Energy Technology Laboratory, Pittsburgh, PA 15236,
USA Introduction
The extensive use of polymeric materials in various diverse industries has generated increased interest in the study of polymers particularly on how they will perform in a chemical environment. For example, many synthetic polymers are able to swell in suitable solvents, thus significantly altering their properties. This often is the first step in a degradation process that may ultimately lead to deterioration of the performance of the material in service, resulting in increased downtime for the system and costly maintenance procedures. However, there are polymer applications that rely on the polymers ability to be at least partially swollen and without swelling many technological applications of polymers would not be possible. In systems where flammable liquids are employed, the failure of O-rings (used in fuel line connections) to swell can cause tank seals to fail. It is therefore of practical interest to understand the mechanism of solvent-induced swelling.
The swelling behavior of polymers in a fluid can be examined experimentally in a variety of ways. 1-3 These include weight gain immersion time studies, modifications of hardness, volume and tensile strength, and dynamic mechanical thermal analysis (DMTA) to measure changes in the dynamic properties of the polymer as a function of temperature. Unfortunately, it is difficult to obtain direct mechanistic information about the swelling process on a molecular level using these approaches. It is well established that swelling of polymers involves mutual dissolution of two completely miscible substances accompanied by an increase in the dimension of the polymer. 4 The mechanism of swelling is therefore related to the competition of intermolecular and intramolecular bond in polymer on the one hand and in the polymer-solvent system on the other hand. Fundamental investigations into the interaction between the polymer and the fluid have important bearing in the understanding of the swelling process.
Quantum mechanical modeling has become a useful tool for obtaining a complete microscopic understanding of the polymer-fluid interactions under controlled conditions. A number of ab initio investigations using a small molecule analogue approach have been reported. 4,5 The validity of this approach was investigated for a model nitrile polymer (isobutyronitrile) interacting with a variety of model fuel molecules. The most common commercially available O-rings are based on nitrile polymers. Mixtures of nitrile polymers and numerous hydrocarbon based fuels (3-GP-11 naval distillate fuel and JP-5 aviation turbine fuel) have been studied experimentally. 3 Diffusion coefficients and weight gain were measured and correlated with the swelling behavior of nitrile polymers. Nevertheless, to date there is no clear understanding of the interaction of nitrile polymer with hydrocarbon based fluids from ab initio calculations. In this paper, we present the first results of molecular modeling for isobutyronitrile-fuel molecules systems at selected quantum mechanical levels of theory.
Computational Details
As can be seen, the method most widely used to model intermolecular interactions which takes into account the effect of electron correlation at relatively low computational cost is the second order Møller-Plesset (MP2) theory.6 Density Functional Theory (DFT) within the B3LYP approach 7 has been shown to yield reliable
predictions of the geometries and stabilization energies of some hydrogen bonded and ionic complexes. However, DFT poorly reproduces dispersion interactions and other weak forces. On the other hand, local correlation methods such as the local MP2 (LMP2) method 8 have recently emerged as alternatives for the study of intermolecular interactions. The LMP2 method is virtually free from basis set superposition error (BSSE). In addition, LMP2 offers significant computational savings over MP2. The method has been applied to study interactions between a variety of systems such as amino acid backbone and side chain analogues.
All MP2 calculations were performed using the program Gaussian 98. 9 LMP2 single point energy calculations were performed with the program Molpro. 10 Full geometry optimizations for various combinations of the model nitrile polymer and fuel molecules were carried out at the MP2 level of theory with the 6-31G* basis set. Single point energy evaluations for each combination of the model polymer and a fuel molecule at the LMP2/cc-pVDZ and LMP2/cc-pVTZ level of theory were carried out for geometries optimized at the MP2/6-31G* level. Calculations were carried out using isobutyronitrile ((CH3)2CHCN) as a model nitrile polymer. The number of atoms in the model polymer cluster was chosen to be as large as possible in order to adequately represent the extended bulk system while at the same time, remaining computationally tractable. We employed CH4, C2H2, C2H4, C2H6 and C6H6 as model fuel molecules
Results and Discussion
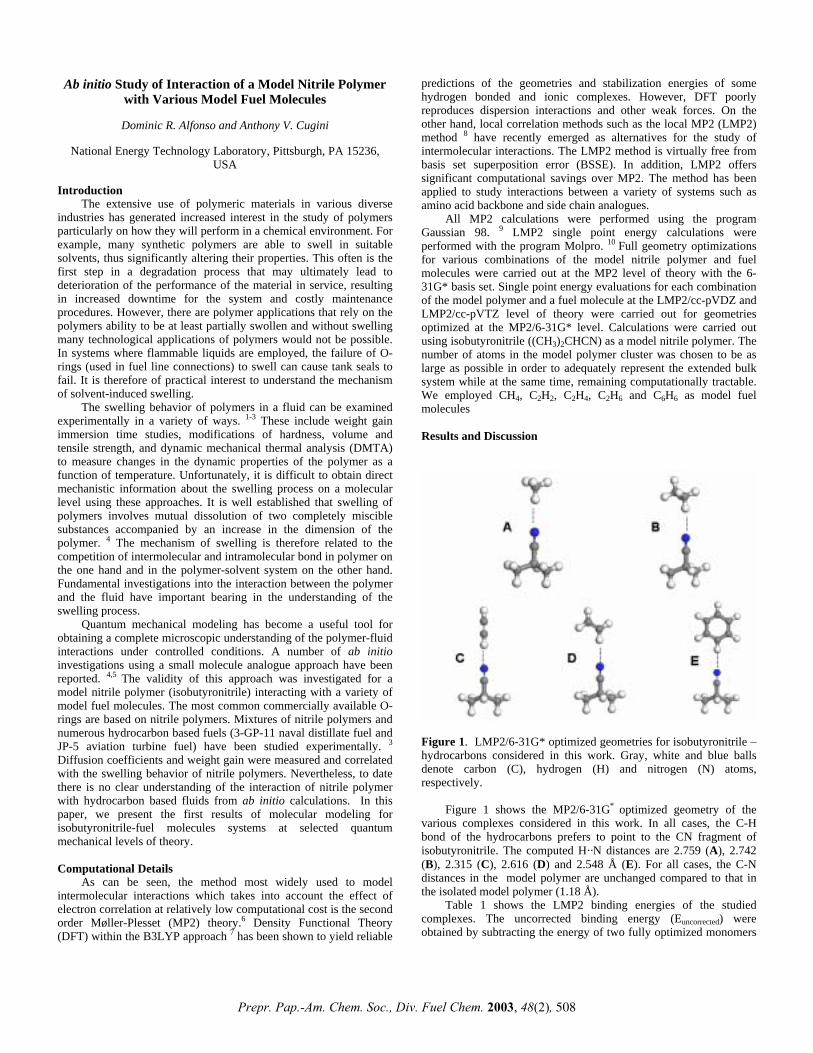
Figure 1. LMP2/6-31G* optimized geometries for isobutyronitrile – hydrocarbons considered in this work. Gray, white and blue balls denote carbon (C), hydrogen (H) and nitrogen (N) atoms, respectively.
Figure 1 shows the MP2/6-31G* optimized geometry of the various complexes considered in this work. In all cases, the C-H bond of the hydrocarbons prefers to point to the CN fragment of isobutyronitrile. The computed H··N distances are 2.759 (A), 2.742 (B), 2.315 (C), 2.616 (D) and 2.548 Å (E). For all cases, the C-N distances in the model polymer are unchanged compared to that in the isolated model polymer (1.18 Å).
Table 1 shows the LMP2 binding energies of the studied complexes. The uncorrected binding energy (Euncorrected) were obtained by subtracting the energy of two fully optimized monomers
Prepr. Pap.-Am. Chem. Soc., Div. Fuel Chem. 2003, 48(2), 508

from the energy of the dimer. The LMP2 interaction energies were corrected for BSSE at the Hartree-Fock (HF) level. The BSSE-corrected interaction energy (Ecorrected) is determined as follows: Ecorrected = (E[AB] – E[A]mon - E[B]mon) + EBSSE (1) EBSSE = (E[A]dim – E[A]dim
* + E[B]dim - E[B]dim*) (2)
where E[AB] is the energy of the dimer, Emon is the energy of the individually optimized monomer and EBSSE is the correction for the BSSE. Edim and Edim
* represent the energies of the monomers in their dimer optimized geometries for the basis set of the monomer and dimer, respectively.
Table 1. Interaction Energies (kcal/mol) at the LMP2 level of
theory
complex basis set Euncorrected EBSSE Ecorrected
A
cc-pvDZ cc-pvTZ
-1.086 -0.767
0.405 0.132
-0.681 -0.635
B cc-pvDZ cc-pvTZ
-1.083 -0.836
0.416 0.133
-0.667 -0.702
C
cc-pvDZ cc-pvTZ
-3.684 -3.254
0.612 0.209
-3.072 -3.045
D
cc-pvDZ cc-pvTZ
-1.558 -1.283
0.448 0.158
-1.111 -1.124
E
cc-pvDZ cc-pvTZ
-1.960 -0.997
0.485 0.182
-1.475 -0.816
For the complex of isobutyronitrile with aliphatic, ethylenic and acetylenic hydrocarbons, we find a slight change (ranging from 0.013 to 0.046 kcal/mol) in the binding energies when the the basis set size increased from from cc-pvDZ to cc-pvTZ at the LMP2 level. The only exception to this trend is the isobutyronitrile -benzene complex. As may be seen, significant differences in the interaction energies occur, indicating that this complex to be especially sensitive to the basis set protocol. One encouraging conclusion that can be made by analyzing Table 3 is that BSSE becomes small when cc-pvTZ basis set is used, thus making unnecessary BSSE correction in the case of LMP2/cc-pvTZ calculations. Our calculations have identified key differences between the interaction of saturated and unsaturated hydrocarbons with isobutyronitrile. The interaction of C2H4, C2H2 and C6H6 with isobutyronitrile is stronger compared to CH4 and C2H6. The larger attraction of aromatic, ethylenic and acetylenic C-H bonds with the CN moiety can be attributed to the substantial bond dipoles in these sp and sp2 C-H bonds. These bond dipoles have attractive dipole-dipole interactions with the CN fragment of the model polymer. The corresponding interaction between aliphatic C-H bond in CH4 and C2H6 is weaker. Hiltz et al. have carried out a DMTA study of swelling behavior of a variety of elastomers in naval distillate fuel (3-GP-11) and aviation turbine fuel (JP-5). 3 For nitrile elastomer, the rubber showed the biggest weight gain following exposure to JP-5 compared to 3-GP-11. They suggested that one of the factors that influence the uptake of hydrocarbons by the elastomer is the structure of the hydrocarbon. As JP-5 contains 25 % aromatic hydrocarbons, the higher solubility of the rubber in this fuel can be attributed to this factor. Our molecular modeling computations have brought to light differences in the interaction of saturated and unsaturated hydrocarbons considered in this work with isobutyronitrile. Based on the assumption that the swelling process is determined by solvent-
polymer interactions, our calculations show larger interaction energy for complexes composed of unsaturated hydrocarbons such as the aromatic compound benzene. Comparing all compounds investigated, one may further assume that the swelling property of nitrile rubber increases as the interaction energies increases. To obtain further insight into the swelling properties of the nitrile rubber, purely thermodynamical investigations obviously do not yield complete information. For this reason, additional investigations into the dynamic behavior with molecular dynamics simulations will lead to a better understanding of the different swelling behavior. Conclusions
Interactions of isobutyronitrile with CH4, C2H2, C2H4, C2H6 and C6H6 were examined using ab initio calculations at the LMP2 level of theory. In all cases, a C-H bond of the hydrocarbons prefer to point to the CN fragment of isobutyronitrile. Computations at the cc-pvDZ and cc-pvTZ level have identified key differences between the interaction of saturated and unsaturated hydrocarbons with isobutyronitrile. The attraction of aromatic, ethylenic and acetylenic C-H bonds with the CN moiety are larger and attributed to the substantial dipoles in these sp and sp2 C-H bonds. These molecular modeling computations have brought to light differences between the interaction of isobutyronitrile and saturated and unsaturated hydrocarbons which may help to explain why certain fuels swell nitrile elastomers and others do not. Acknowledgement. We thank Kurt Rothenberger, Kenneth Jordan, Richard Christie and Evgeny Mishakin for helpful comments. Computations were performed on a computer cluster at the National Energy Technology Laboratory. References (1) Harogoppad, S. B.; Aminabhavi, T. M. Polym. Commun. 1991,
32, 120. (2) Harogoppad, S. B.; Aminabhavi, T. M. Polymer, 1991, 32, 870. (3) Hiltz, J. A.; Morchat, R. M.; Keough, I. A. Thermochimica
Acta, 1993, 226, 143. (4) See for example, Kast, K. M.; Reiling, S.; Brickmann, J. Mol.
Struct. 1998, 453, 169. (5) Akbulut, M.; Ermler, W. C.; Kalyon, D. M. Comp. Theor. Poly.
Sci. 1997, 7, 75. (6) Moller, C.; Plesset, M. S. Phys. Rev. 1934, 46, 618. (7) Becke, A. D. J. Chem. Phys. 1993, 98, 1372. (8) Saebo, S.; Tong, W.; Pulay, P. J. Chem. Phys. 1993, 98, 2170. (9) Frisch, M. J. et al., Gaussian 98, revision A.9; Gaussian Inc.:
Pittsburgh, PA 1998. (10) Hetzer, G.; .Pulay, P.; Werner, H. -J. Chem. Phys. Lett. 1998,
290, 143.
Prepr. Pap.-Am. Chem. Soc., Div. Fuel Chem. 2003, 48(2), 509

EFFECT OF MONOMERIC SEQUENCE ON NANOPHASE-SEGREGATED STRUCTURE AND
WATER TRANSPORT IN NAFION 117
Seung Soon Jang, Valeria Molinero, Tahir Çağõn, and William A. Goddard III
Materials and Process Simulation Center MC 139-74,
California Institute of Technology, Pasadena, CA 91125 Introduction
Nafion is a polyelectrolyte consisting of nonpolar N=(CF2-CF2) and polar-ionizable P=(O-CF2-CF(CF3))2-CF2-CF2-SO3H) segment. Hydrated Nafion 117 with an average of 6.5 hydrophobic tetrafluoroethylene units per vinyl ether sulfonate unit is widely used for membranes in fuel cell operations due to its relatively high proton conductivity, mechanical and electrochemical stability. Although the ratio of hydrophobic to hydrophilic monomers is well known, the monomeric sequence in the Nafion polymer is not well characterized and its affect has not been included as a design variable to improve fuel cell performance. There is a general consensus supported by experiments1-7 and simulations8 that hydrated Nafion has a nanosegregated structure consisting of hydrophobic and hydrophilic domains. Notwithstanding, the details of the segregated morphology remain unclear and highly debated. In this work we explore in particular the effect of monomer sequence on the structure and transport in hydrated Nafion 117 by Molecular Dynamics (MD) simulations. Our goal is to elucidate the effect of the monomeric sequence of polar (P) and nonpolar (N) monomeric units in Nafion on the phase-segregated morphology and water/hydronium transport.
Simulation Methods
In order to assess the monomeric sequence effect on the properties of our interest, we prepared two model samples of Nafion 117 (equivalent weight 1150) chains. One has a (N7P)10 sequence in which the vinyl ether sulfonate unit comes every 7 tetrafluoroethylene units. This structure is characterized by a degree of randomness value (DR) of 1.1, and the ionizable monomeric unit is uniformly distributed along the chain. The Second polymer structure considered is a diblock copolymer with a N70P10 sequence in which the 10 vinyl ether sulfonate units gather at the end of a chain of 70 tetrafluoroethylene units. This latter structure has a DR=0.1. The distance between contiguous sulfonate groups in a fully extended chain is ~22 Å for DR=1.1 and ~6 Å for DR=0.1.
The simulation cells consist of four identical ionized Nafion chains of a given DR with 560 water molecules and 40 hydronium molecules, corresponding to 20 wt % water content.
MD simulations were performed at two temperatures, 300 and 353 K, relevant for fuel cell operation under isobaric-isothermal conditions using LAMMPS.9,10 The Dreiding force field was partially modified to handle perfluorocarbon compounds, water and hydronium.11 The equations of motion were integrated using the Verlet algorithm with a 1 fs time steps and the PPPM method12 was used to evaluate the electrostatic interactions. After an equilibration cycle, each system was simulated for additional 2 nanoseconds to obtain the equilibrium structural properties and to determine the water and hydronium diffusion.
Results and Discussion
I. Structure: Nanophase segregation. We observed water-polymer segregation for both temperatures and monomer sequences (Fig. 1). We found all sulfonate groups to be in the water nanophase, consistent with the experimental observation of complete dissociation for the sulfonic moiety in hydrated Nafion.13,14 The hydrophilic
domain forms a percolated nanophase and its shape is far from spherical which is in good agreement with Falk’s work.15
(a) DR=1.1 (b) DR=0.1 Figure 1. Nanostructure of hydrated Nafion. White domains are mainly occupied by Nafion backbone. Spheres represent the sulfur atoms. The surface formed by the dense dots is the Nafion/water interface in both figures.
Nanostructure of hydrated Nafion. White domains are mainly
occupied by Nafion backbone. Spheres represent the sulfur atoms. The surface formed by the dense dots is the Nafion/water interface in both figures.
We have computed the fraction of water molecules in the first solvation sphere of the hydronium and sulfonate ions. They constitute 49 and 43% of the total for the DR=1.1 and DR=0.1, respectively, at 353 K. These findings are consistent with the existence of bulk-like water in the IR spectrum of hydrated Nafion with this water content.14
qL/2π
0 1 2 3 4 5
S(q)
0
2
4
6
8
10
12
14
DR=1.1DR=0.1
Figure 2. Structure factor profile for hydrated Nafion with 20 wt % of water content. S(q) was computed following the method of Ref.16.
There are noticeable differences, nevertheless, in the spatial
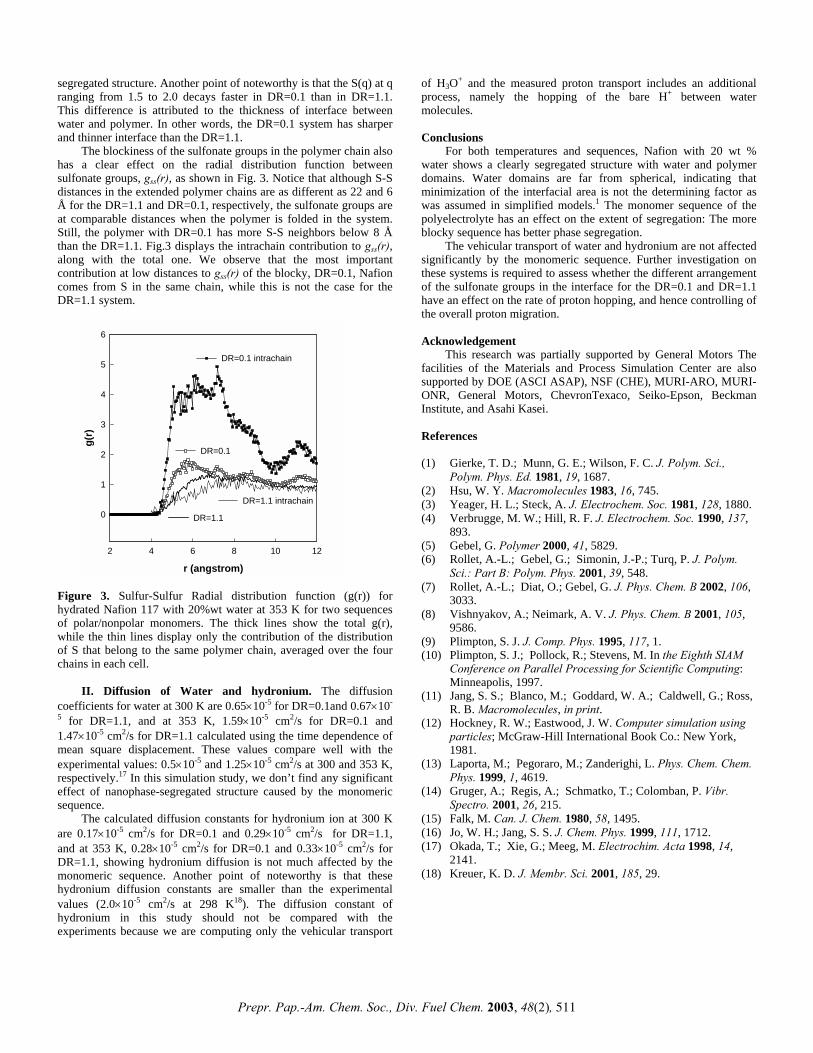
distribution of these “bulk” waters for the two monomer sequences: while for the DR=1.1, the “bulk” waters are dispersed all along the hydrophilic nanophase, they are lumped together in the structures for the blocky polymer of DR=0.1. The structure factor, S(q) at 353 K is shown in Fig. 2. We observe that at low q, the intensity of S(q) for the blocky Nafion of DR=0.1 is stronger than the DR=1.1, which means that the blocky Nafion of DR=0.1 has better developed phase-
Prepr. Pap.-Am. Chem. Soc., Div. Fuel Chem. 2003, 48(2), 510
segregated structure. Another point of noteworthy is that the S(q) at q ranging from 1.5 to 2.0 decays faster in DR=0.1 than in DR=1.1. This difference is attributed to the thickness of interface between water and polymer. In other words, the DR=0.1 system has sharper and thinner interface than the DR=1.1.
The blockiness of the sulfonate groups in the polymer chain also has a clear effect on the radial distribution function between sulfonate groups, gss(r), as shown in Fig. 3. Notice that although S-S distances in the extended polymer chains are as different as 22 and 6 Å for the DR=1.1 and DR=0.1, respectively, the sulfonate groups are at comparable distances when the polymer is folded in the system. Still, the polymer with DR=0.1 has more S-S neighbors below 8 Å than the DR=1.1. Fig.3 displays the intrachain contribution to gss(r), along with the total one. We observe that the most important contribution at low distances to gss(r) of the blocky, DR=0.1, Nafion comes from S in the same chain, while this is not the case for the DR=1.1 system.
r (angstrom)2 4 6 8 10 12
g(r)
0
1
2
3
4
5
6
DR=1.1
DR=0.1
DR=1.1 intrachain
DR=0.1 intrachain
Figure 3. Sulfur-Sulfur Radial distribution function (g(r)) for hydrated Nafion 117 with 20%wt water at 353 K for two sequences of polar/nonpolar monomers. The thick lines show the total g(r), while the thin lines display only the contribution of the distribution of S that belong to the same polymer chain, averaged over the four chains in each cell.
II. Diffusion of Water and hydronium. The diffusion
coefficients for water at 300 K are 0.65×10⁻⁵ for DR=0.1and 0.67×10-
5 for DR=1.1, and at 353 K, 1.59×10⁻⁵ cm2/s for DR=0.1 and 1.47×10⁻⁵ cm2/s for DR=1.1 calculated using the time dependence of mean square displacement. These values compare well with the experimental values: 0.5×10⁻⁵ and 1.25×10⁻⁵ cm2/s at 300 and 353 K, respectively.17 In this simulation study, we don’t find any significant effect of nanophase-segregated structure caused by the monomeric sequence.
The calculated diffusion constants for hydronium ion at 300 K are 0.17×10⁻⁵ cm2/s for DR=0.1 and 0.29×10⁻⁵ cm2/s for DR=1.1, and at 353 K, 0.28×10⁻⁵ cm2/s for DR=0.1 and 0.33×10⁻⁵ cm2/s for DR=1.1, showing hydronium diffusion is not much affected by the monomeric sequence. Another point of noteworthy is that these hydronium diffusion constants are smaller than the experimental values (2.0×10⁻⁵ cm2/s at 298 K18). The diffusion constant of hydronium in this study should not be compared with the experiments because we are computing only the vehicular transport
of H3O+ and the measured proton transport includes an additional process, namely the hopping of the bare H+ between water molecules.
Conclusions
For both temperatures and sequences, Nafion with 20 wt % water shows a clearly segregated structure with water and polymer domains. Water domains are far from spherical, indicating that minimization of the interfacial area is not the determining factor as was assumed in simplified models.1 The monomer sequence of the polyelectrolyte has an effect on the extent of segregation: The more blocky sequence has better phase segregation.
The vehicular transport of water and hydronium are not affected significantly by the monomeric sequence. Further investigation on these systems is required to assess whether the different arrangement of the sulfonate groups in the interface for the DR=0.1 and DR=1.1 have an effect on the rate of proton hopping, and hence controlling of the overall proton migration.
Acknowledgement
This research was partially supported by General Motors The facilities of the Materials and Process Simulation Center are also supported by DOE (ASCI ASAP), NSF (CHE), MURI-ARO, MURI-ONR, General Motors, ChevronTexaco, Seiko-Epson, Beckman Institute, and Asahi Kasei.
References (1) Gierke, T. D.; Munn, G. E.; Wilson, F. C. J. Polym. Sci.,
Polym. Phys. Ed. 1981, 19, 1687. (2) Hsu, W. Y. Macromolecules 1983, 16, 745. (3) Yeager, H. L.; Steck, A. J. Electrochem. Soc. 1981, 128, 1880. (4) Verbrugge, M. W.; Hill, R. F. J. Electrochem. Soc. 1990, 137,
893. (5) Gebel, G. Polymer 2000, 41, 5829. (6) Rollet, A.-L.; Gebel, G.; Simonin, J.-P.; Turq, P. J. Polym.
Sci.: Part B: Polym. Phys. 2001, 39, 548. (7) Rollet, A.-L.; Diat, O.; Gebel, G. J. Phys. Chem. B 2002, 106,
3033. (8) Vishnyakov, A.; Neimark, A. V. J. Phys. Chem. B 2001, 105,
9586. (9) Plimpton, S. J. J. Comp. Phys. 1995, 117, 1. (10) Plimpton, S. J.; Pollock, R.; Stevens, M. In the Eighth SIAM
Conference on Parallel Processing for Scientific Computing: Minneapolis, 1997.
(11) Jang, S. S.; Blanco, M.; Goddard, W. A.; Caldwell, G.; Ross, R. B. Macromolecules, in print.
(12) Hockney, R. W.; Eastwood, J. W. Computer simulation using particles; McGraw-Hill International Book Co.: New York, 1981.
(13) Laporta, M.; Pegoraro, M.; Zanderighi, L. Phys. Chem. Chem. Phys. 1999, 1, 4619.
(14) Gruger, A.; Regis, A.; Schmatko, T.; Colomban, P. Vibr. Spectro. 2001, 26, 215.
(15) Falk, M. Can. J. Chem. 1980, 58, 1495. (16) Jo, W. H.; Jang, S. S. J. Chem. Phys. 1999, 111, 1712. (17) Okada, T.; Xie, G.; Meeg, M. Electrochim. Acta 1998, 14,
2141. (18) Kreuer, K. D. J. Membr. Sci. 2001, 185, 29.
Prepr. Pap.-Am. Chem. Soc., Div. Fuel Chem. 2003, 48(2), 511

Density Functional Theory Study of Adsorption and Decomposition of H2S on Pd(111), Cu(111) and PdCu(110)
For all the surfaces investigated, we utilized a slab consisting of three layers. 4×4 surface cells were used for Pd(111) and Cu(111) (16 atoms/layer) whereas the surface cell for PdCu(110) is 4×5 (18 atoms/layer). Adsorbate was adsorbed on one side of the slabs and all the atoms except the bottom layer were allowed to relax. This corresponds to a coverage of roughly θ=0.06 ML for all the surfaces considered here. The geometrical optimizations were done using a dynamical-quenching like technique and the structural parameters were considered as converged when the atomic forces were less than 0.03 eV/Å. For the Brillouin zone integration, a 3 × 3 Monkhorst-Pack k-point grid 11 and cutoff of 234 eV was used for the plane wave basis set.
Dominic R. Alfonso, Anthony V. Cugini and Dan Sorescu
National Energy Technology Laboratory, Pittsburgh, PA 15236
Introduction
Inorganic nonporous membranes composed of Pd have been used for a number of hydrogenation and dehydrogenation applications.1 Because of their potential to cause equilibrium shift as well as the production of a pure hydrogen stream, they can be used in membrane reactors for facilitating equilibrium limited reactions such as hydrogen purification. Numerous potential processes for utilizing fossil fuel resources would involve separation of hydrogen from other gases in a reaction system. Unfortunately, sulfur impurities in a fossil fuel based feedstream has been found to have adverse effects on the performance of a Pd membrane.2 It has been reported that these materials poison very easily even at ppm-levels of H2S. 3
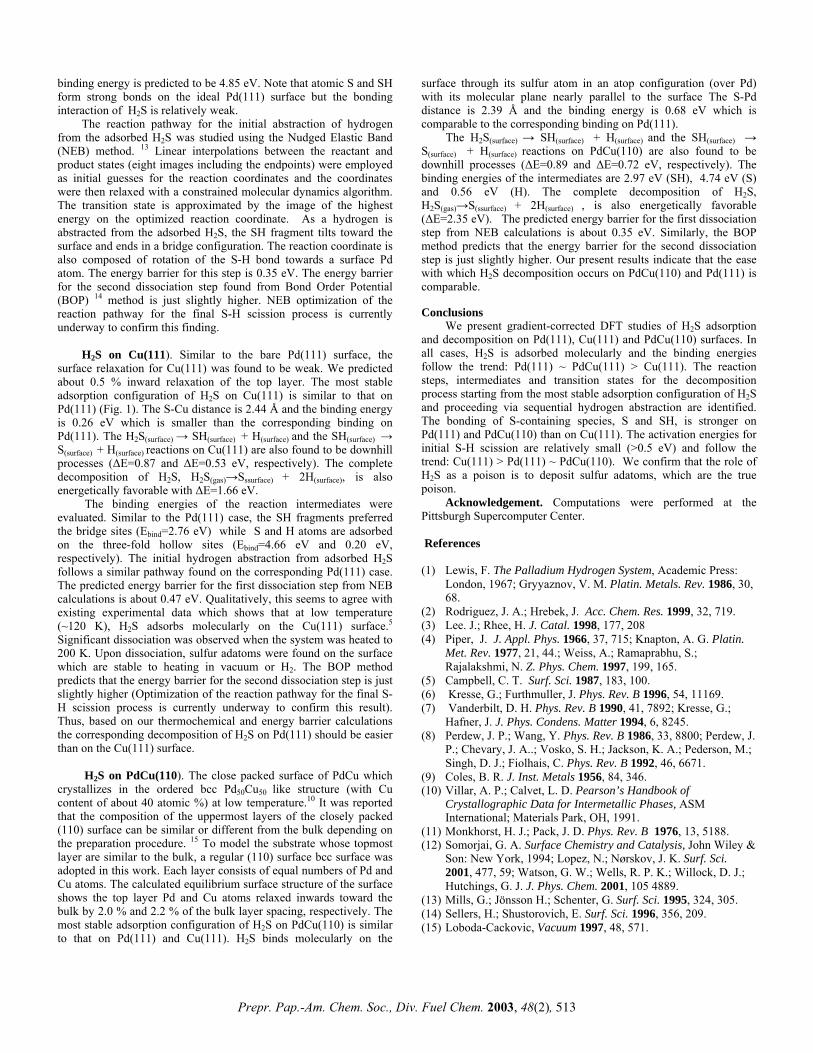
Results and Discussion H2S on Pd(111). Our calculations predict no reconstruction of the bare Pd(111) with respect to the (111) face of the bulk in agreement with experiments and several theoretical studies.12 H2S binds molecularly on the surface through its sulfur atom in an atop configuration with its molecular plane nearly parallel to the surface (Fig. 1). In this configuration, all the atoms of the adsorbate interact with the surface. The S-Pd distance is 2.37 Å and the binding energy is 0.71 eV.
There is surprisingly little fundamental information available on the mechanism by which sulfur compounds such as H2S poison the membrane. A major challenge in the area of membrane purification of hydrogen is the development of materials that either resist poisoning of sulfur compounds, or that adsorb a limited amount of sulfur compounds without drastically inhibiting their hydrogen permeability. Recently, Pd alloyed with a second metal, such as Cu, has appeared as a promising material for hydrogen separation.4 Some PdCu alloys are reported to exhibit enhanced resistance to H2S poisoning compared to the constituent metallic systems. But little is known about the effect of alloying Pd with Cu on the poisoning process. A fundamental knowledge of the interaction of H2S with the surfaces that constitute these membranes has an important bearing in the accomplishment of this goal.
In the present paper, we report results of a theoretical investigation of interaction of H2S with Pd(111) and Cu(111) surfaces from gradient-corrected plane wave Density Functional Theory (DFT) using a periodic supercell approach. We identify the most stable binding site, decomposition pathways and decomposition energy barriers. Previous experiments show that the role of H2S as a poison is to deposit sulfur adatoms, which are the true poison.5 The adsorption and decomposition of H2S on the corresponding PdCu(110) surface will also be investigated and the results compared to its pure metal counterparts. One particular aim is to analyze trends in adsorption energies and reaction barriers.
Figure 1. Schematic representation of H2S on Pd(111), Cu(111) and PdCu(110) surfaces. For the dissociative adsorption of H2S starting with S-H scission leading to adsorbed SH and and hydrogen, H2S(surface) → SH(surface) + H(surface) , the energy released is 0.88 eV. Thus this reaction is an energetically favorable process. SH binds through sulfur in a bridge (di-σ) configuration with the S-H axis nearly parallel to the surface while the abstracted hydrogen is adsorbed on a neighboring three-fold hollow site. The abstraction of hydrogen from adsorbed SH yielding an adsorbed atomic sulfur and hydrogen, SH(surface) → S(surface) + H(surface) , is also found to be energetically favorable. The energy released for this reaction is 0.72 eV. The generated S and H are both adsorbed on the three-fold hollow sites Thus from a thermochemical point of view, the complete H2S decomposition pathway on Pd(111), H2S(gas)→ S(surface) + 2H(surface),, starting from H2S adsorption and proceeding via sequential hydrogen abstraction is exothermic (∆E=2.31 eV).
Computational Details
The calculations were performed with the Vienna ab initio simulation package (VASP). 6 Ionic cores are described by ultra soft pseudopotential7 and the Kohn-Sham one-electron valence states are expanded in a basis of plane waves. The exchange correlation energy is described at the level of spin polarized generalized gradient approximations (GGA) in the implementation of Perdew et al. (PW91). 8
To model the Pd (111), Cu (111) and PdCu (110) surfaces, we used periodic supercells. First, the bulk Pd, Cu and PdCu were geometrically optimized in order to determine the lattice constants. Our calculated lattice constant for bulk fcc Pd, fcc Cu and bcc PdCu are 3.965, 3.641 and 3.031 Å, respectively, in excellent agreement with experiments (3.883, 9 3.606 10 and 2.960 Å, 10 respectively). After optimization of the bulk crystal, the (111) or (110) was exposed assuming a bulk terminated structures, followed by construction a three dimensional periodic supercell with a vacuum of 12 Å on the top of the free surface.
We calculate the binding energies of all reaction intermediates. The binding energy of SH is 3.02 eV and the S-Pd and H-Pd distances are 2.31 and 1.97 Å, respectively. H adsorbed preferentially on the three-fold hollow site on the surface and the binding energy is 0.50 eV with respect to gas phase H2. A diffusion barrier of H between the adjacent three-fold sites via the bridge site is about 0.16 eV which indicates that H is quite mobile on the surface. The S
Prepr. Pap.-Am. Chem. Soc., Div. Fuel Chem. 2003, 48(2), 512
binding energy is predicted to be 4.85 eV. Note that atomic S and SH form strong bonds on the ideal Pd(111) surface but the bonding interaction of H2S is relatively weak. The reaction pathway for the initial abstraction of hydrogen from the adsorbed H2S was studied using the Nudged Elastic Band (NEB) method. 13 Linear interpolations between the reactant and product states (eight images including the endpoints) were employed as initial guesses for the reaction coordinates and the coordinates were then relaxed with a constrained molecular dynamics algorithm. The transition state is approximated by the image of the highest energy on the optimized reaction coordinate. As a hydrogen is abstracted from the adsorbed H2S, the SH fragment tilts toward the surface and ends in a bridge configuration. The reaction coordinate is also composed of rotation of the S-H bond towards a surface Pd atom. The energy barrier for this step is 0.35 eV. The energy barrier for the second dissociation step found from Bond Order Potential (BOP) 14 method is just slightly higher. NEB optimization of the reaction pathway for the final S-H scission process is currently underway to confirm this finding. H2S on Cu(111). Similar to the bare Pd(111) surface, the surface relaxation for Cu(111) was found to be weak. We predicted about 0.5 % inward relaxation of the top layer. The most stable adsorption configuration of H2S on Cu(111) is similar to that on Pd(111) (Fig. 1). The S-Cu distance is 2.44 Å and the binding energy is 0.26 eV which is smaller than the corresponding binding on Pd(111). The H2S(surface) → SH(surface) + H(surface) and the SH(surface) → S(surface) + H(surface) reactions on Cu(111) are also found to be downhill processes (∆E=0.87 and ∆E=0.53 eV, respectively). The complete decomposition of H2S, H2S(gas)→Sssurface) + 2H(surface), is also energetically favorable with ∆E=1.66 eV. The binding energies of the reaction intermediates were evaluated. Similar to the Pd(111) case, the SH fragments preferred the bridge sites (Ebind=2.76 eV) while S and H atoms are adsorbed on the three-fold hollow sites (Ebind=4.66 eV and 0.20 eV, respectively). The initial hydrogen abstraction from adsorbed H2S follows a similar pathway found on the corresponding Pd(111) case. The predicted energy barrier for the first dissociation step from NEB calculations is about 0.47 eV. Qualitatively, this seems to agree with existing experimental data which shows that at low temperature (~120 K), H2S adsorbs molecularly on the Cu(111) surface.5 Significant dissociation was observed when the system was heated to 200 K. Upon dissociation, sulfur adatoms were found on the surface which are stable to heating in vacuum or H2. The BOP method predicts that the energy barrier for the second dissociation step is just slightly higher (Optimization of the reaction pathway for the final S-H scission process is currently underway to confirm this result). Thus, based on our thermochemical and energy barrier calculations the corresponding decomposition of H2S on Pd(111) should be easier than on the Cu(111) surface.
H2S on PdCu(110). The close packed surface of PdCu which
crystallizes in the ordered bcc Pd50Cu50 like structure (with Cu content of about 40 atomic %) at low temperature.10 It was reported that the composition of the uppermost layers of the closely packed (110) surface can be similar or different from the bulk depending on the preparation procedure. 15 To model the substrate whose topmost layer are similar to the bulk, a regular (110) surface bcc surface was adopted in this work. Each layer consists of equal numbers of Pd and Cu atoms. The calculated equilibrium surface structure of the surface shows the top layer Pd and Cu atoms relaxed inwards toward the bulk by 2.0 % and 2.2 % of the bulk layer spacing, respectively. The most stable adsorption configuration of H2S on PdCu(110) is similar to that on Pd(111) and Cu(111). H2S binds molecularly on the
surface through its sulfur atom in an atop configuration (over Pd) with its molecular plane nearly parallel to the surface The S-Pd distance is 2.39 Å and the binding energy is 0.68 eV which is comparable to the corresponding binding on Pd(111). The H2S(surface) → SH(surface) + H(surface) and the SH(surface) → S(surface) + H(surface) reactions on PdCu(110) are also found to be downhill processes (∆E=0.89 and ∆E=0.72 eV, respectively). The binding energies of the intermediates are 2.97 eV (SH), 4.74 eV (S) and 0.56 eV (H). The complete decomposition of H2S, H2S(gas)→S(ssurface) + 2H(surface) , is also energetically favorable (∆E=2.35 eV). The predicted energy barrier for the first dissociation step from NEB calculations is about 0.35 eV. Similarly, the BOP method predicts that the energy barrier for the second dissociation step is just slightly higher. Our present results indicate that the ease with which H2S decomposition occurs on PdCu(110) and Pd(111) is comparable. Conclusions
We present gradient-corrected DFT studies of H2S adsorption and decomposition on Pd(111), Cu(111) and PdCu(110) surfaces. In all cases, H2S is adsorbed molecularly and the binding energies follow the trend: Pd(111) ~ PdCu(111) > Cu(111). The reaction steps, intermediates and transition states for the decomposition process starting from the most stable adsorption configuration of H2S and proceeding via sequential hydrogen abstraction are identified. The bonding of S-containing species, S and SH, is stronger on Pd(111) and PdCu(110) than on Cu(111). The activation energies for initial S-H scission are relatively small (>0.5 eV) and follow the trend: Cu(111) > Pd(111) ~ PdCu(110). We confirm that the role of H2S as a poison is to deposit sulfur adatoms, which are the true poison.
Acknowledgement. Computations were performed at the Pittsburgh Supercomputer Center. References (1) Lewis, F. The Palladium Hydrogen System, Academic Press:
London, 1967; Gryyaznov, V. M. Platin. Metals. Rev. 1986, 30, 68.
(2) Rodriguez, J. A.; Hrebek, J. Acc. Chem. Res. 1999, 32, 719. (3) Lee. J.; Rhee, H. J. Catal. 1998, 177, 208 (4) Piper, J. J. Appl. Phys. 1966, 37, 715; Knapton, A. G. Platin.
Met. Rev. 1977, 21, 44.; Weiss, A.; Ramaprabhu, S.; Rajalakshmi, N. Z. Phys. Chem. 1997, 199, 165.
(5) Campbell, C. T. Surf. Sci. 1987, 183, 100. (6) Kresse, G.; Furthmuller, J. Phys. Rev. B 1996, 54, 11169. (7) Vanderbilt, D. H. Phys. Rev. B 1990, 41, 7892; Kresse, G.;
Hafner, J. J. Phys. Condens. Matter 1994, 6, 8245. (8) Perdew, J. P.; Wang, Y. Phys. Rev. B 1986, 33, 8800; Perdew, J.
P.; Chevary, J. A..; Vosko, S. H.; Jackson, K. A.; Pederson, M.; Singh, D. J.; Fiolhais, C. Phys. Rev. B 1992, 46, 6671.
(9) Coles, B. R. J. Inst. Metals 1956, 84, 346. (10) Villar, A. P.; Calvet, L. D. Pearson’s Handbook of
Crystallographic Data for Intermetallic Phases, ASM International; Materials Park, OH, 1991.
(11) Monkhorst, H. J.; Pack, J. D. Phys. Rev. B 1976, 13, 5188. (12) Somorjai, G. A. Surface Chemistry and Catalysis, John Wiley &
Son: New York, 1994; Lopez, N.; Nørskov, J. K. Surf. Sci. 2001, 477, 59; Watson, G. W.; Wells, R. P. K.; Willock, D. J.; Hutchings, G. J. J. Phys. Chem. 2001, 105 4889.
(13) Mills, G.; Jönsson H.; Schenter, G. Surf. Sci. 1995, 324, 305. (14) Sellers, H.; Shustorovich, E. Surf. Sci. 1996, 356, 209. (15) Loboda-Cackovic, Vacuum 1997, 48, 571.
Prepr. Pap.-Am. Chem. Soc., Div. Fuel Chem. 2003, 48(2), 513
THERMODYNAMIC CONSISTENCY IN MICROKINETIC DEVELOPMENT OF SURFACE
REACTION MECHANISMS
Ashish B. Mhadeshwara,c, Hai Wangb,c, and Dionisios G. Vlachosa,c
a Department of Chemical Engineering b Department of Mechanical Engineering
c Center for Catalytic Science and Technology University of Delaware
Newark, DE 19716 Introduction
Microkinetic analysis has evolved into a promising tool for modeling surface reactions since it has been well established by Dumesic and coworkers.1 A key advantage of the microkinetic analysis is that a mechanism developed at certain conditions is expected, in many cases, to capture system features under significantly different conditions. The rate parameters are typically obtained using input from surface science experiments or theoretical estimates using semi-empirical techniques and quantum mechanical density functional theory calculations, and sometimes using statistical mechanics through transition state theory. Due to the uncertainty resulting through the theoretical estimates of rate parameters, experimental measurements, and heterogeneity of real catalysts, some tuning/optimization of parameters is typically necessary for quantitative model predictions.
In mechanism development and rate parameter fitting or optimization, an issue often overlooked is thermodynamic consistency at both the enthalpic and entropic levels. This issue has been brought up in several instances,1-4 but there is no strategy available for testing and ensuring thermodynamic consistency of an arbitrary complex reaction network. As a result, while a few published mechanisms are thermodynamically consistent, most literature mechanisms are not. Enthalpic inconsistency gives incorrect solutions to the energy conservation equation, which translates to incorrect predictions of heat exchange and conversion/selectivity. Entropic inconsistency directly translates to fundamental inconsistency in the pre-exponential factors. Finally, entropic and enthalpic inconsistency distorts the underlying equilibrium constant, which affects the prediction of equilibrium states.
In this work, we review the criteria of thermodynamic consistency and demonstrate cases of thermodynamic inconsistency in previously published reaction mechanisms. We then present an optimization approach, coupled with statistical mechanics and semi-empirical techniques, which ensures thermodynamic consistency of the entire mechanism. We present a proof-of-concept analysis using the reaction model of H2 oxidation on Pt as an example. Similar examples of syngas production from methane and hydrogen production from ammonia will also be presented. Thermodynamic Constraints and Reaction Basis Set
In general, for any ith reaction in a mechanism, the following equations form the basis of the enthalpic and entropic constraints.
ibi
fi HEE ∆=− and , RSb
if
iieAA // ∆=
where f and b stand for the forward and backward steps, A is the pre-exponential factor, E is the activation energy, R is the universal gas constant and H∆ and are the enthalpy change and entropy change of the reaction, respectively. If we consider a set of linearly independent reactions of size L in a reaction mechanism consisting of I number of reactions (
S∆
IL ≤ ), it forms a basis in the reaction network. The basis set is usually not unique but its size L is unique.
The rest of the reactions are linear combinations of the basis set. They are termed linearly dependent reactions of the network and the constraints on them can be expressed as
( ) ILiEEcHcHEE bj
fj
L
jijj
L
jiji
bi
fi ,1,
11
+=−=∆=∆=− ∑∑==
( )
( ) LiAARS
cRSAA
L
j
cbj
fj
jL
jij
ibi
fi
ij 1,/ln/ln11
+==∆
=∆
= ∏∑==
I, ,
where cij are the coefficients of ith linearly decomposed reaction onto the reaction basis. Equations corresponding to the catalytic reaction mechanism analog are also derived and will be presented (not shown here). Examples of Thermodynamic Consistency
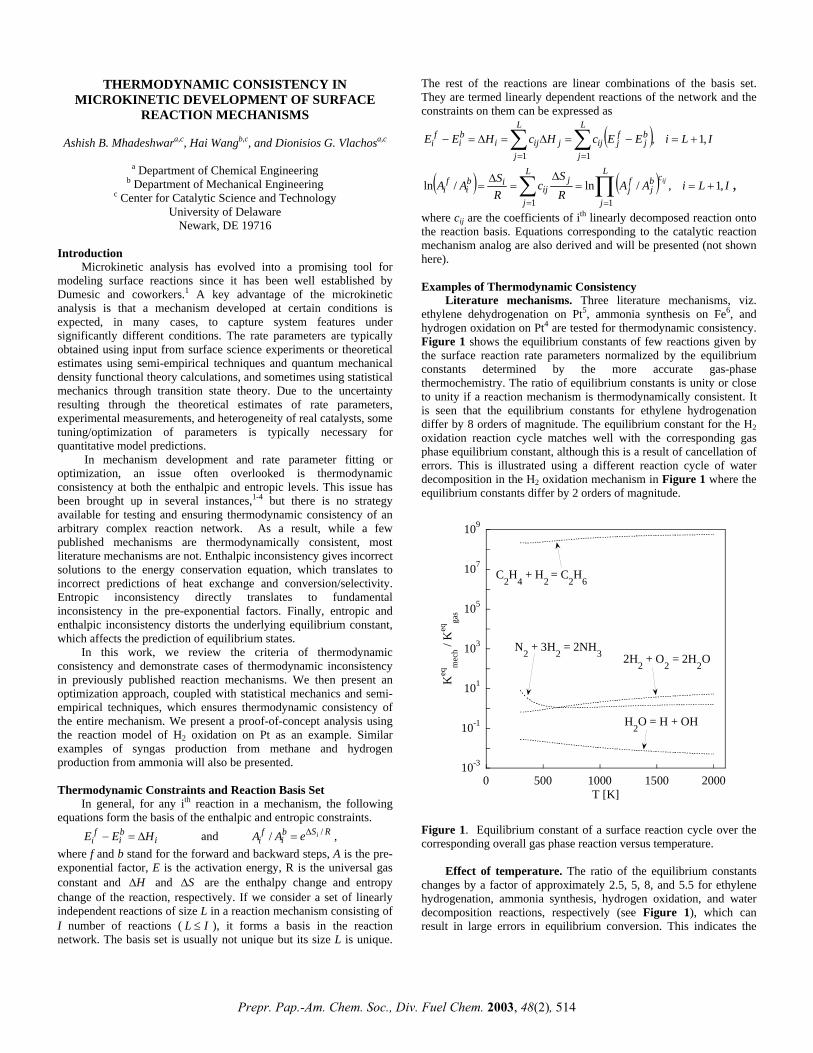
Literature mechanisms. Three literature mechanisms, viz. ethylene dehydrogenation on Pt5, ammonia synthesis on Fe6, and hydrogen oxidation on Pt4 are tested for thermodynamic consistency. Figure 1 shows the equilibrium constants of few reactions given by the surface reaction rate parameters normalized by the equilibrium constants determined by the more accurate gas-phase thermochemistry. The ratio of equilibrium constants is unity or close to unity if a reaction mechanism is thermodynamically consistent. It is seen that the equilibrium constants for ethylene hydrogenation differ by 8 orders of magnitude. The equilibrium constant for the H2 oxidation reaction cycle matches well with the corresponding gas phase equilibrium constant, although this is a result of cancellation of errors. This is illustrated using a different reaction cycle of water decomposition in the H2 oxidation mechanism in Figure 1 where the equilibrium constants differ by 2 orders of magnitude.
10-3
10-1
101
103
105
107
109
0 500 1000 1500 2000
Keq
mec
h / K
eqga
s
T [K]
C2H4 + H2 = C2H6
N2 + 3H2 = 2NH3 2H2 + O2 = 2H2O
H2O = H + OH
Figure 1. Equilibrium constant of a surface reaction cycle over the corresponding overall gas phase reaction versus temperature.
Effect of temperature. The ratio of the equilibrium constants changes by a factor of approximately 2.5, 5, 8, and 5.5 for ethylene hydrogenation, ammonia synthesis, hydrogen oxidation, and water decomposition reactions, respectively (see Figure 1), which can result in large errors in equilibrium conversion. This indicates the
Prepr. Pap.-Am. Chem. Soc., Div. Fuel Chem. 2003, 48(2), 514
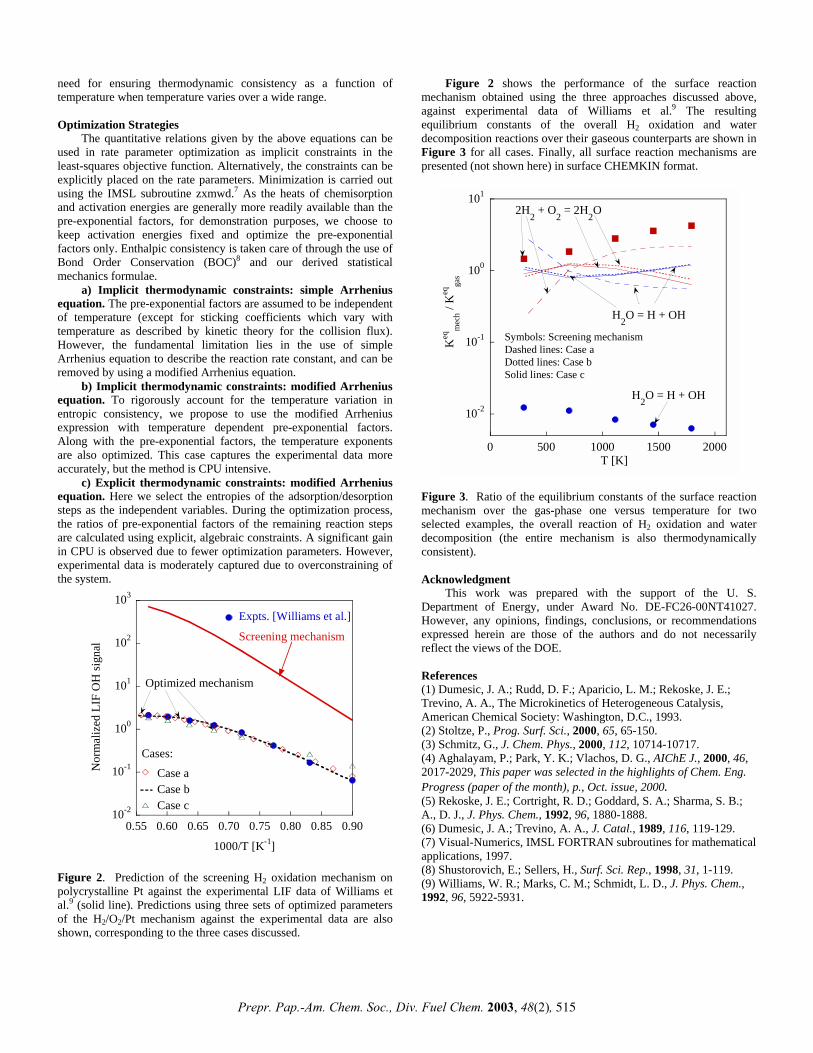
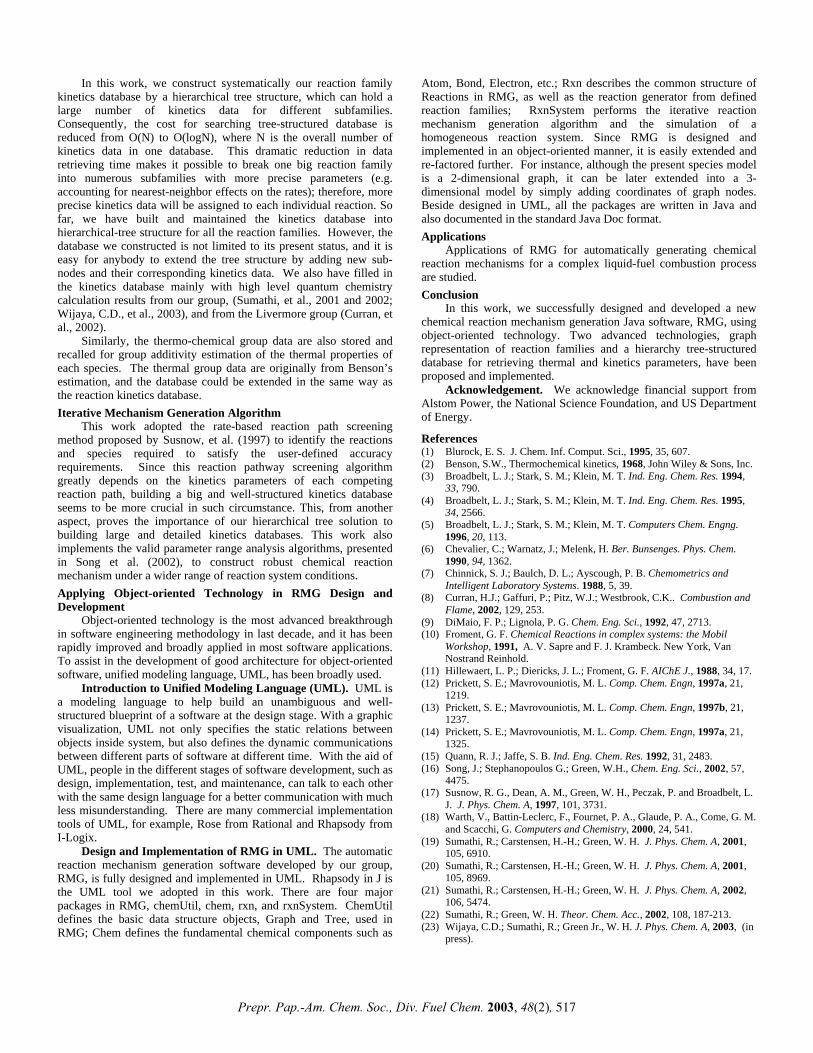
Figure 2 shows the performance of the surface reaction mechanism obtained using the three approaches discussed above, against experimental data of Williams et al.9 The resulting equilibrium constants of the overall H2 oxidation and water decomposition reactions over their gaseous counterparts are shown in Figure 3 for all cases. Finally, all surface reaction mechanisms are presented (not shown here) in surface CHEMKIN format.
need for ensuring thermodynamic consistency as a function of temperature when temperature varies over a wide range. Optimization Strategies
The quantitative relations given by the above equations can be used in rate parameter optimization as implicit constraints in the least-squares objective function. Alternatively, the constraints can be explicitly placed on the rate parameters. Minimization is carried out using the IMSL subroutine zxmwd.7 As the heats of chemisorption and activation energies are generally more readily available than the pre-exponential factors, for demonstration purposes, we choose to keep activation energies fixed and optimize the pre-exponential factors only. Enthalpic consistency is taken care of through the use of Bond Order Conservation (BOC)8 and our derived statistical mechanics formulae.
10-2
10-1
100
101
0 500 1000 1500 2000K
eqm
ech /
Keq
gas
2H2 + O2 = 2H2O
H2O = H + OH
Symbols: Screening mechanismDashed lines: Case aDotted lines: Case bSolid lines: Case c
T [K]
H2O = H + OH
a) Implicit thermodynamic constraints: simple Arrhenius equation. The pre-exponential factors are assumed to be independent of temperature (except for sticking coefficients which vary with temperature as described by kinetic theory for the collision flux). However, the fundamental limitation lies in the use of simple Arrhenius equation to describe the reaction rate constant, and can be removed by using a modified Arrhenius equation.
b) Implicit thermodynamic constraints: modified Arrhenius equation. To rigorously account for the temperature variation in entropic consistency, we propose to use the modified Arrhenius expression with temperature dependent pre-exponential factors. Along with the pre-exponential factors, the temperature exponents are also optimized. This case captures the experimental data more accurately, but the method is CPU intensive.
c) Explicit thermodynamic constraints: modified Arrhenius equation. Here we select the entropies of the adsorption/desorption steps as the independent variables. During the optimization process, the ratios of pre-exponential factors of the remaining reaction steps are calculated using explicit, algebraic constraints. A significant gain in CPU is observed due to fewer optimization parameters. However, experimental data is moderately captured due to overconstraining of the system.
Figure 3. Ratio of the equilibrium constants of the surface reaction mechanism over the gas-phase one versus temperature for two selected examples, the overall reaction of H2 oxidation and water decomposition (the entire mechanism is also thermodynamically consistent). Acknowledgment
This work was prepared with the support of the U. S. Department of Energy, under Award No. DE-FC26-00NT41027. However, any opinions, findings, conclusions, or recommendations expressed herein are those of the authors and do not necessarily reflect the views of the DOE.
10-2
10-1
100
101
102
103
0.55 0.60 0.65 0.70 0.75 0.80 0.85 0.90
Nor
mal
ized
LIF
OH
sign
al
1000/T [K-1]
Expts. [Williams et al.]
Screening mechanism
Case a
Case c
Optimized mechanism
Cases:
Case b
References (1) Dumesic, J. A.; Rudd, D. F.; Aparicio, L. M.; Rekoske, J. E.; Trevino, A. A., The Microkinetics of Heterogeneous Catalysis, American Chemical Society: Washington, D.C., 1993. (2) Stoltze, P., Prog. Surf. Sci., 2000, 65, 65-150. (3) Schmitz, G., J. Chem. Phys., 2000, 112, 10714-10717. (4) Aghalayam, P.; Park, Y. K.; Vlachos, D. G., AIChE J., 2000, 46, 2017-2029, This paper was selected in the highlights of Chem. Eng. Progress (paper of the month), p., Oct. issue, 2000. (5) Rekoske, J. E.; Cortright, R. D.; Goddard, S. A.; Sharma, S. B.; A., D. J., J. Phys. Chem., 1992, 96, 1880-1888. (6) Dumesic, J. A.; Trevino, A. A., J. Catal., 1989, 116, 119-129. (7) Visual-Numerics, IMSL FORTRAN subroutines for mathematical applications, 1997.
(8) Shustorovich, E.; Sellers, H., Surf. Sci. Rep., 1998, 31, 1-119. Figure 2. Prediction of the screening H2 oxidation mechanism on polycrystalline Pt against the experimental LIF data of Williams et al.9 (solid line). Predictions using three sets of optimized parameters of the H2/O2/Pt mechanism against the experimental data are also shown, corresponding to the three cases discussed.
(9) Williams, W. R.; Marks, C. M.; Schmidt, L. D., J. Phys. Chem., 1992, 96, 5922-5931.
Prepr. Pap.-Am. Chem. Soc., Div. Fuel Chem. 2003, 48(2), 515

Development of Automatic Chemical Reaction Mechanism Generation Software Using Object-Oriented Technology
Jing Song, Sumathy Raman, Joanna Yu, Catherina D Wijaya, George
Stephanopoulos, and William H. Green
Department of Chemical Engineering,
Massachusetts Institute of Technology,
77 Massachusetts Avenue, Cambridge, MA 02139, USA
Introduction Computer-aided reaction mechanism generation has been
employed by many groups to model multi-component reacting mixtures, in processes such as pyrolysis and fuel combustion (Chinnick, et al., 1988; Hillewaert, et al. 1988; Chevalier, et al. 1990; Froment, 1991; DiMaio and Lignola, 1992; Quann and Jaffe, 1992; Broadbelt, et al., 1994; Blurock, 1995; Broadbelt, et al., 1995; Ranzi, et al., 1995; Broadbelt, et al., 1996; Prickett and Mavrovouniotis 1997a, 1997b, 1997c; Susnow, et al., 1997; Warth, et al., 2000). Good model-generation software is desired to quickly build more detailed and reasonably-structured reaction mechanisms with better kinetics parameters. With the efforts from those groups, people have successfully represented the chemical structures and properties of reaction systems and generated large reaction mechanisms. However, some common shortcomings in the existing software prevent their wide usage in chemical reaction simulations. For example, many fewer reaction patterns are considered in such software than should be; furthermore, the thermal and kinetics parameters are not specific enough to account for different types of reaction pathways. How to extend the model generation software to accommodate more types of chemical reactions and/or allow users to create their own desired reaction types easily and how to systematically integrate the available thermal and kinetics data from different sources remained unsolved before this work.
Many previous chemical software applications were developed in procedural languages, like Fortran and C. Although those languages are good for calculation efficiency, they make it difficult to satisfy the important requirements of ease of maintenance, reusability and extendibility, when we design and develop software applications for large complex systems. In recent years, object-oriented technology has been rapidly developed to satisfy those basic requirements of good software. Corresponding modeling languages, such as unified modeling language (UML), and programming languages, such as C++, Java, and C#, have been widely used in developing better-structured software. In this work, we made use of those advanced research fruits to develop a well-structured, reusable and extendable automatic reaction mechanism generation software, RMG. Representing Chemical Structures by Graphs
Graphs, as fundamental data structures, and their associated algorithms have been widely used for uniquely representing chemical structures and estimating chemical properties in most chemical application software.
In RMG, we also used 2-dimensional graph data structures representing individual chemical species and chemical functional groups. The estimation of all the species features, such as symmetry number, resonance isomer structures, and cycle identification, etc. are implemented based on basic graph operations. The thermal properties are estimated by a group additivity method proposed by Benson (1968). Unlike chemical species with the unique graph representation, functional group describes a special group of chemical species with the same chemically functional centers.
Introducing functional group object into reaction generation software allows one to easily define the reaction pattern later. Moreover, we developed a key matching algorithm to quickly identify the sub-graph relationship between species and functional groups and between two functional groups, which speed recognition of all the chemical reaction patterns existing in any species. Defining Reaction Families
In most existing reaction model generation software, the reaction family definitions are hard-coded; this makes it very difficult for users to change the existing reaction families and to add any new ones. In RMG, we define the reactant families by drawing their functional groups and indicating the graph mutations happening to the reactants through the course of the reaction. Therefore, new reaction families can be easily input through a graphical interface, without the need for the user to modify the source code. This makes it much easier for normal users other than software developers to vary the present reaction family specification, to define new families of reactions, and to document the exact assumptions behind the models they construct. In this work, thirty-three primary reaction families, including eighteen forward families and fifteen reverse ones, are defined; this is the richest set of reaction families ever compiled. The summarization of all the reaction families is shown in table 1.
Table 1. Reaction Families Defined in RMG
Forward Reaction Family (Reverse Reaction Family) (1) Inter-molecular Hydrogen Abstraction (2) Radical Addition to Multiple Bond (Beta Scission) (3) Radical Addition to CO (CO Elimination from Carbonyl) (4) Radical Recombination (Bond Dissociation) (5) Bi-radical Recombination to Form Cyclic Structure (Ring open)(6) Disproportionation (Molecular Addition) (7) 1,2 Insertion (1,1 Elimination) (8) 1,3 Insertion (1,2 Elimination) (9) 1+2 Cyclo-addition (Three-Ring Cleavage) (10) 2+2 Cyclo-addition (Four-Ring Cleavage) (11) Diels-Alder Addition (Retro Diels-Alder Addition) (12) Keto-Enol Tautomerism (Enol-Keto Tautomerism) (13) Intra-molecular Hydrogen Migration (14) Intra-Molecular Addition across Multiple Bond to Form an
Exo-Cyclic Radical (Ring Open for Exo-Cyclic Radical) (15) Intra-Molecular Addition across Multiple Bond to Form an
Endo-Cyclic Radical (Ring Open for Endo-Cyclic Radical) (16) Cyclic Ether Formation from Alkyl-Hydroperoxy Radical (OH
Addition to Cyclic Ether) (17) Intra-Molecular Hydroxyl Migration (18) HO2 Elimination from Peroxy Radical
Constructing Thermal Groups and Reaction Kinetics database by Hierarchical Tree
With the technology described above, we are able to enumerate all the reactions occurring among any chemical species. However, a more important question still remains unanswered: how to get the best reaction kinetics parameter for a generated reaction?
Owing to the work of many experimental and computational chemical kinetics groups, now there are a large number of good-quality reaction kinetics data available. However, in much previous model generation software, only a small number of data are used to account for a huge group of reactions. Such approach is due in part to the high running time cost to construct and search through a huge kinetics database.
Prepr. Pap.-Am. Chem. Soc., Div. Fuel Chem. 2003, 48(2), 516
In this work, we construct systematically our reaction family kinetics database by a hierarchical tree structure, which can hold a large number of kinetics data for different subfamilies. Consequently, the cost for searching tree-structured database is reduced from O(N) to O(logN), where N is the overall number of kinetics data in one database. This dramatic reduction in data retrieving time makes it possible to break one big reaction family into numerous subfamilies with more precise parameters (e.g. accounting for nearest-neighbor effects on the rates); therefore, more precise kinetics data will be assigned to each individual reaction. So far, we have built and maintained the kinetics database into hierarchical-tree structure for all the reaction families. However, the database we constructed is not limited to its present status, and it is easy for anybody to extend the tree structure by adding new sub-nodes and their corresponding kinetics data. We also have filled in the kinetics database mainly with high level quantum chemistry calculation results from our group, (Sumathi, et al., 2001 and 2002; Wijaya, C.D., et al., 2003), and from the Livermore group (Curran, et al., 2002).
Similarly, the thermo-chemical group data are also stored and recalled for group additivity estimation of the thermal properties of each species. The thermal group data are originally from Benson’s estimation, and the database could be extended in the same way as the reaction kinetics database. Iterative Mechanism Generation Algorithm
This work adopted the rate-based reaction path screening method proposed by Susnow, et al. (1997) to identify the reactions and species required to satisfy the user-defined accuracy requirements. Since this reaction pathway screening algorithm greatly depends on the kinetics parameters of each competing reaction path, building a big and well-structured kinetics database seems to be more crucial in such circumstance. This, from another aspect, proves the importance of our hierarchical tree solution to building large and detailed kinetics databases. This work also implements the valid parameter range analysis algorithms, presented in Song et al. (2002), to construct robust chemical reaction mechanism under a wider range of reaction system conditions. Applying Object-oriented Technology in RMG Design and Development
Object-oriented technology is the most advanced breakthrough in software engineering methodology in last decade, and it has been rapidly improved and broadly applied in most software applications. To assist in the development of good architecture for object-oriented software, unified modeling language, UML, has been broadly used.
Introduction to Unified Modeling Language (UML). UML is a modeling language to help build an unambiguous and well-structured blueprint of a software at the design stage. With a graphic visualization, UML not only specifies the static relations between objects inside system, but also defines the dynamic communications between different parts of software at different time. With the aid of UML, people in the different stages of software development, such as design, implementation, test, and maintenance, can talk to each other with the same design language for a better communication with much less misunderstanding. There are many commercial implementation tools of UML, for example, Rose from Rational and Rhapsody from I-Logix.
Design and Implementation of RMG in UML. The automatic reaction mechanism generation software developed by our group, RMG, is fully designed and implemented in UML. Rhapsody in J is the UML tool we adopted in this work. There are four major packages in RMG, chemUtil, chem, rxn, and rxnSystem. ChemUtil defines the basic data structure objects, Graph and Tree, used in RMG; Chem defines the fundamental chemical components such as
Atom, Bond, Electron, etc.; Rxn describes the common structure of Reactions in RMG, as well as the reaction generator from defined reaction families; RxnSystem performs the iterative reaction mechanism generation algorithm and the simulation of a homogeneous reaction system. Since RMG is designed and implemented in an object-oriented manner, it is easily extended and re-factored further. For instance, although the present species model is a 2-dimensional graph, it can be later extended into a 3-dimensional model by simply adding coordinates of graph nodes. Beside designed in UML, all the packages are written in Java and also documented in the standard Java Doc format. Applications
Applications of RMG for automatically generating chemical reaction mechanisms for a complex liquid-fuel combustion process are studied. Conclusion
In this work, we successfully designed and developed a new chemical reaction mechanism generation Java software, RMG, using object-oriented technology. Two advanced technologies, graph representation of reaction families and a hierarchy tree-structured database for retrieving thermal and kinetics parameters, have been proposed and implemented.
Acknowledgement. We acknowledge financial support from Alstom Power, the National Science Foundation, and US Department of Energy.
References (1) Blurock, E. S. J. Chem. Inf. Comput. Sci., 1995, 35, 607. (2) Benson, S.W., Thermochemical kinetics, 1968, John Wiley & Sons, Inc. (3) Broadbelt, L. J.; Stark, S. M.; Klein, M. T. Ind. Eng. Chem. Res. 1994,
33, 790. (4) Broadbelt, L. J.; Stark, S. M.; Klein, M. T. Ind. Eng. Chem. Res. 1995,
34, 2566. (5) Broadbelt, L. J.; Stark, S. M.; Klein, M. T. Computers Chem. Engng.
1996, 20, 113. (6) Chevalier, C.; Warnatz, J.; Melenk, H. Ber. Bunsenges. Phys. Chem.
1990, 94, 1362. (7) Chinnick, S. J.; Baulch, D. L.; Ayscough, P. B. Chemometrics and
Intelligent Laboratory Systems. 1988, 5, 39. (8) Curran, H.J.; Gaffuri, P.; Pitz, W.J.; Westbrook, C.K.. Combustion and
Flame, 2002, 129, 253. (9) DiMaio, F. P.; Lignola, P. G. Chem. Eng. Sci., 1992, 47, 2713. (10) Froment, G. F. Chemical Reactions in complex systems: the Mobil
Workshop, 1991, A. V. Sapre and F. J. Krambeck. New York, Van Nostrand Reinhold.
(11) Hillewaert, L. P.; Diericks, J. L.; Froment, G. F. AIChE J., 1988, 34, 17. (12) Prickett, S. E.; Mavrovouniotis, M. L. Comp. Chem. Engn, 1997a, 21,
1219. (13) Prickett, S. E.; Mavrovouniotis, M. L. Comp. Chem. Engn, 1997b, 21,
1237. (14) Prickett, S. E.; Mavrovouniotis, M. L. Comp. Chem. Engn, 1997a, 21,
1325. (15) Quann, R. J.; Jaffe, S. B. Ind. Eng. Chem. Res. 1992, 31, 2483. (16) Song, J.; Stephanopoulos G.; Green, W.H., Chem. Eng. Sci., 2002, 57,
4475. (17) Susnow, R. G., Dean, A. M., Green, W. H., Peczak, P. and Broadbelt, L.
J. J. Phys. Chem. A, 1997, 101, 3731. (18) Warth, V., Battin-Leclerc, F., Fournet, P. A., Glaude, P. A., Come, G. M.
and Scacchi, G. Computers and Chemistry, 2000, 24, 541. (19) Sumathi, R.; Carstensen, H.-H.; Green, W. H. J. Phys. Chem. A, 2001,
105, 6910. (20) Sumathi, R.; Carstensen, H.-H.; Green, W. H. J. Phys. Chem. A, 2001,
105, 8969. (21) Sumathi, R.; Carstensen, H.-H.; Green, W. H. J. Phys. Chem. A, 2002,
106, 5474. (22) Sumathi, R.; Green, W. H. Theor. Chem. Acc., 2002, 108, 187-213. (23) Wijaya, C.D.; Sumathi, R.; Green Jr., W. H. J. Phys. Chem. A, 2003, (in
press).
Prepr. Pap.-Am. Chem. Soc., Div. Fuel Chem. 2003, 48(2), 517
Modeling the Negative Temperature Coefficient in the Low Temperature Oxidation of Light Alkanes
Timothy A. Barckholtz
Corporate Strategic Research
ExxonMobil Research and Engineering 1545 Route 22 East
Annandale, NJ 08801 [email protected]
Introduction
A distinguishing feature of the low temperature ignition of many molecules is a “negative temperature coefficient”, or NTC. At very low temperatures, as the temperature is raised, the ignition delay of a fuel is decreased. However, for many fuels, at a certain temperature the ignition delay reverses course and becomes longer as the temperature is raised. At some higher temperature, generally about 50 - 100 K higher than the onset of the NTC, the ignition delay begins to decrease again. Propane and butane each have a distinct and large NTC.
The aim of the work reported here was to model this ignition chemistry at the fundamental level, incorporating all necessary species and reactions. The resultant mechanism is fully pressure dependent and completely thermodynamically reversible. The mechanism reproduces with good accuracy the NTC in propane and butane. Reduced versions of the mechanism allowed for a detailed analysis of the cause of the NTC. Mechanism Details
The core of the mechanism is derived from the GRI mechanism1. While significant additions have been made to extend the mechanism to C4 fuels, we restrict ourselves here to discussion of the parts of the mechanism that are most relevant to the low temperature oxidation of propane and butane.
The key species for the modeling of the NTC are the propylperoxy radicals and their isomers. For these species, the thermodynamics were calculated using ab initio and density functional techniques as reported earlier for the ethyl systems2. The high pressure rate constants for the unimolecular reactions of the RO2• intermediates were also calculated using ab initio and DFT, similar to earlier work. Rates for the addition of a second O2 molecule to C•CCOOH, CC•COOH, and C2•COOH are comparable to those for the first O2. For the rate constant of the reaction between the alkyl radicals and O2 we use the rate given by Miller and Klippenstein for the ethyl radical3.
The pressure dependence of these reactions was modeled using modified strong collision theory, similar to previous work. For the ethylperoxy system, there were not significant differences between the rates calculated using modified strong collision theory and those calculated with the more sophisticated master equation4, and we prefer to continue to use the simpler and faster method. Many additional reactions of the species involved in the reactions were included in the mechanism. These reactions are too numerous to list here and did not play a significant role in the conclusions presented here. Results: Propane
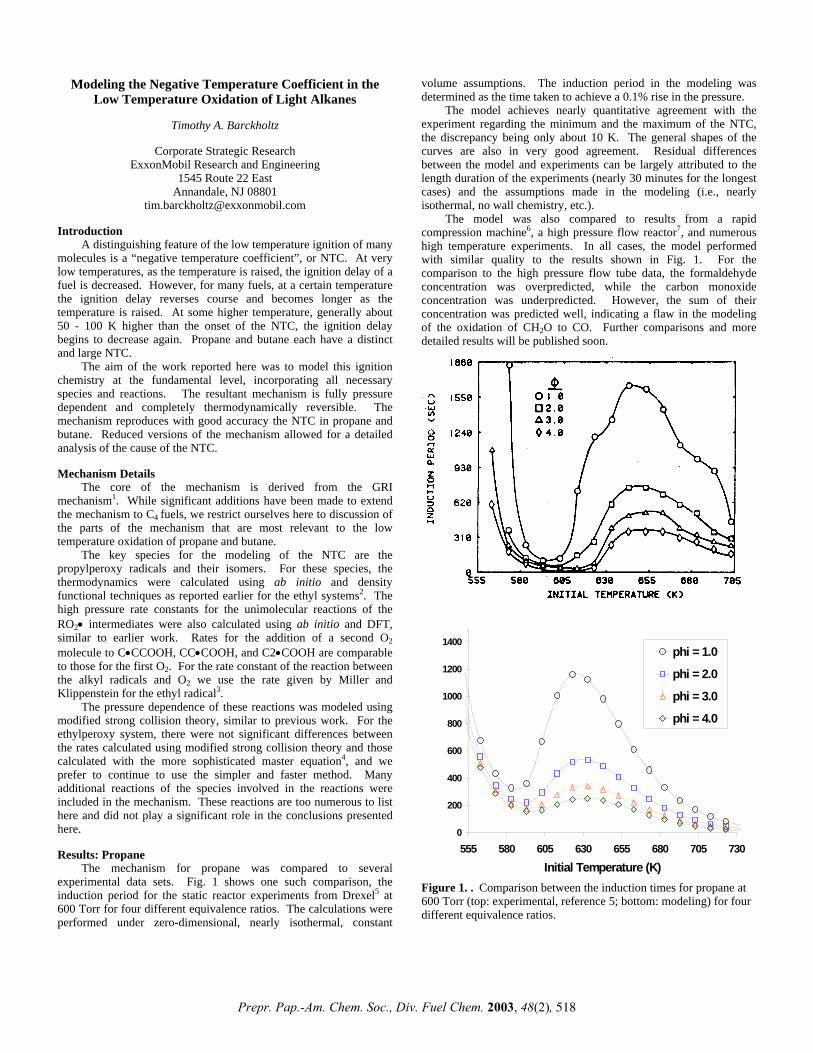
The mechanism for propane was compared to several experimental data sets. Fig. 1 shows one such comparison, the induction period for the static reactor experiments from Drexel5 at 600 Torr for four different equivalence ratios. The calculations were performed under zero-dimensional, nearly isothermal, constant
volume assumptions. The induction period in the modeling was determined as the time taken to achieve a 0.1% rise in the pressure.
The model achieves nearly quantitative agreement with the experiment regarding the minimum and the maximum of the NTC, the discrepancy being only about 10 K. The general shapes of the curves are also in very good agreement. Residual differences between the model and experiments can be largely attributed to the length duration of the experiments (nearly 30 minutes for the longest cases) and the assumptions made in the modeling (i.e., nearly isothermal, no wall chemistry, etc.).
The model was also compared to results from a rapid compression machine6, a high pressure flow reactor7, and numerous high temperature experiments. In all cases, the model performed with similar quality to the results shown in Fig. 1. For the comparison to the high pressure flow tube data, the formaldehyde concentration was overpredicted, while the carbon monoxide concentration was underpredicted. However, the sum of their concentration was predicted well, indicating a flaw in the modeling of the oxidation of CH2O to CO. Further comparisons and more detailed results will be published soon.
0
200
400
600
800
1000
1200
1400
555 580 605 630 655 680 705 730Initial Temperature (K)
phi = 1.0
phi = 2.0
phi = 3.0
phi = 4.0
Figure 1. . Comparison between the induction times for propane at 600 Torr (top: experimental, reference 5; bottom: modeling) for four different equivalence ratios.
Prepr. Pap.-Am. Chem. Soc., Div. Fuel Chem. 2003, 48(2), 518

Tmin < T < Tmax
0
10
20
30
40
50
60
70
80
675 725 775 825 875 925
Compressed Temperature (K)
Igni
tion
Del
ay (m
s)
50:50 N2/Ar
100% Ar
Model
In the region near the NTC itself, the reaction sequence listed above continues to operate, but an additional reaction begins to become fast,
CCCOO• = C3H6 + HO2 This reaction competes with the chain branching reaction. Due to the fast recombination of HO2radicals, yielding H2O2 and O2, the concerted elimination to olefin and HO2 is actually chain terminating. This leads to the longer ignition delays and a maximum in the ignition curve.
T > Tmax Finally, at temperatures greater than the maximum in the NTC,
the hydrogen peroxide formed via the recombination of HO2 radicals becomes unstable, leading to two OH radicals. Thus, the concerted elimination channel is no longer chain terminating, but chain propagating. This leads to a shorter ignition delay, and a downturn in the ignition curve.
All of these peroxy reactions are highly pressure dependent, due to their unimiolecular nature. The decomposition of H2O2 is also pressure dependent. Thus, the location of, and even existence of, the NTC in an alkane ignition is a complicated function of both temperature and pressure. We are continuing our research into this area with a focus on the pressure dependence of the rates, and the influence this dependence has on ignition timing in real-world systems, such as internal combustion engines.
Figure 2. . Comparison between the ignition times for butane in a rapid compression machine8. The experiments were performed for two different gas mixtures containing different concentrations of N2 and Ar, thus the two different data points and modeling lines. Results: Butane
The mechanism for butane was also compared to several experimental data sets, all with good success. Fig. 2 shows one of the comparisons, to the rapid compression machine data of Minetti et al.8. Three different equivalence ratios were examined, but only the stoichiometric data and model is shown in the figure. The comparisons and conclusions are nearly identical for the lean and rich mixtures.
Acknowledgement. We thank Joe Bozzelli for many helpful comments and for providing the initial calculations of the peroxy radical isomerization reactions. References (1) Bowman, C. T., Hanson, R. K., Davidson, D. F., Gardiner, Jr,
W. C., Lissianski, V., Smith, G. P., Golden, D. M., Frenklach, M., and Goldenberg, M, http://www.me.berkeley.edu/gri_mech As the figure shows, the model obtains reasonable agreement
with the overall ignition timing, but is too flat in the region near the NTC. This indicates that the chain branching in the model before the NTC is slightly too slow, and that the chain termination step that leads to the uptick in the NTC is also slightly too slow, or occurs at a lower temperature than in reality. Slight adjustments in the potential energy surface of the R + O2 system would probably alleviate many of the discrepancies between the model and the experimental data.
(2) Bozzelli, J. W. and Sheng, C., J. Phys. Chem. A, 2002, 106, 1113.
(3) Miller, J. A. and Klippenstein, S. J. Int. J. Chem. Kinet., 2001, 33, 654.
(4) Sheng, C. Y., Bozzelli, J. W., Dean, A. M., and Chang, A.Y, J. Phys. Chem. A, 2002, 106, 7276.
(5) Wilk, R. D., Cernansky, N. P., and Cohen, R. S., Combust. Sci. Tech., 1984, 49, 41.
Discussion: Origins of the NTC (6) Gallagher, S. M.; Curran, H. J.; Wurmel, J.; Simmie, J. M. Proc. 3rd Joint Meeting, US Sections of the Combustion Institute, Paper PM02.
A detailed analysis of the mechanism leads to the following conclusions regarding the orgin of the NTC in the ignition of light alkanes. (7) Koert, D. N., Miller, D. L., and Cernansky, N. P., Combust.
Flame, 1994, 96, 34. T < Tmin At colder conditions than the minimum in the ignition curve,
chain branching occurs via the reaction sequences similar to (8) Minetti, R.; Ribacour, M.; Carlier, M.; Fittschen, C.; Sochet, L.
R. Combust. Flame, 1994, 96, 201. CCC• + O2 = CCCOO• CCCOO• = C•CCOOH C•CCOOH + O2 = C(OO•)CCOOH C(OO•)CCOOH = C(OOH)CC•OOH C(OOH)CC•OOH = C(OOH)CCHO + OH• C(OOH)CCHO = C(O•)CCHO + OH• Net : CCC• + 2 O2 = C(O•)CCHO + 2 OH•
which is chain branching by producing 3 radicals from only 1. (Note that the first two reactions may proceed directly via a chemical activation mechanism; i.e., CCC• + O2 = C•CCOOH. Such reactions are explicitly included in the kinetic model via the modified strong collision calculations).
Prepr. Pap.-Am. Chem. Soc., Div. Fuel Chem. 2003, 48(2), 519
COULD SIMULATION BE VALUABLE CRITERIA FOR EVALUATION OF STERICAL COAL
STRUCTURE? Masakatsu Nomura1, Satoru Murata1, Tiaoling Dong1, Koh Kidena1,
Takenao Ohkawa2, and Hisanori Komoda2
1 Department of Applied Chemistry, Faculty of Engineering, Osaka University, 2-1 Yamada-oka, Suita Osaka 565-0871, Japan
2 Graduate School of Information Science and Technology, Osaka University, 2-1 Yamada-oka, Suita Osaka 565-0871, Japan
Introduction
Recently Mathews et al. proposed the model structures for Upper Freeport and Lewiston-Stockton coals (Argonne premium coal), where dimethylene bridge bonds prevail as bond connecting aromatic clusters [1]. This seems not to be true for the authors because ruthenium ion catalyzed oxidation (RICO) showed the distribution of bridge bonds clearly [2], however, their evaluation for this is not to reflect the results of RICO in a precise way. Evaluation of physical density of model structures using computer simulation is now considered a valuable means to justify the models. For example, the very sophisticated model of oil sand bitumen derived asphaltene proposed by Strausz et al. [3] should be fragmented into several parts based on evaluation of its density by simulation. Therefore, the calculation of density of models is a very facile method to justify the model. Carlson [4], Takanohashi [5], and the authors [6-9] have been involved in studying this objective. Another point as for coal chemical structures two phase model and uniphase model such as association structure are proposed by many researchers to fail in getting a conclusion. The authors would like to consider the possibility, in the present paper, concerning whether the simulation method could be the means to discriminate above two concepts for coal structures. Method
Evaluation of density of coal model. The calculation of physical density of the model molecules was conducted by using the computer-aided molecular design software, Cerius2 (Molecular Simulations, Inc.) on a Silicon Graphics workstation. The method for the calculation was also essentially the same with the published procedure [6-8]. The procedure is briefly described. At first, a model molecule is input and the calculation of molecular mechanics together with charge modification is carried out to optimize its potential energy until the root-mean-square (rms) gradient becomes less than 1.0. The model is then subjected to the combined calculations of molecular dynamics and mechanics. Among the conformers examined during the calculation, one with the lowest potential energy is extracted. Subsequent molecular mechanics treatment until the rms gradient becomes less than 1.0 gives the optimized single isolated model molecule. It is then enclosed in a cell and its molecular mechanics treatment is carried out under periodic boundary conditions until the rms gradient reaches less than 1.0. Under the conditions the model molecule is surrounded by the identical cells. The molecule can extend to other cells. If a segment of it exits from one surface of the cell, the same segment of another molecule enters from the opposite surface. Thus, in this approach intermolecular interactions and void volume can be taken into consideration. During the treatment, the size of the cell is gradually decreased. After that, the combined calculations of molecular dynamics and mechanics for 10 ps are performed to afford a temporally best conformer, which is again subjected to the molecular mechanics calculation as above. After several repetitions of these
calculations, the final best conformer is obtained together with the optimized density.
New method to construct structural model of coal (Density-
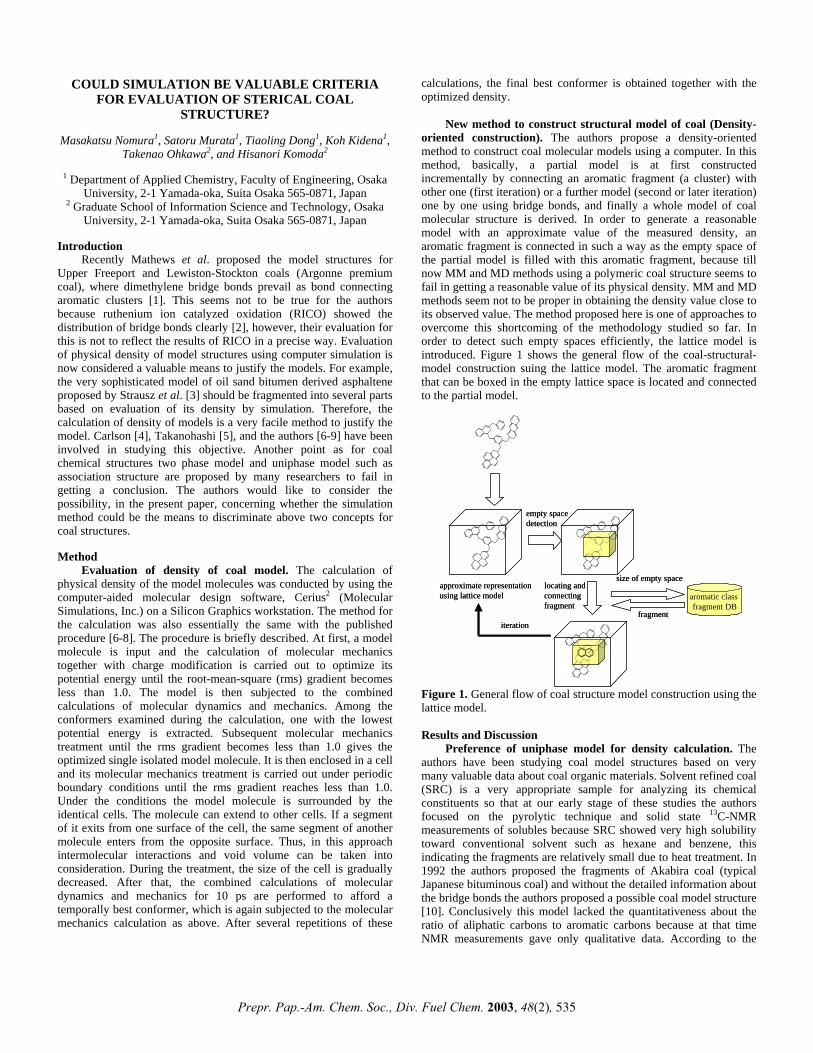
oriented construction). The authors propose a density-oriented method to construct coal molecular models using a computer. In this method, basically, a partial model is at first constructed incrementally by connecting an aromatic fragment (a cluster) with other one (first iteration) or a further model (second or later iteration) one by one using bridge bonds, and finally a whole model of coal molecular structure is derived. In order to generate a reasonable model with an approximate value of the measured density, an aromatic fragment is connected in such a way as the empty space of the partial model is filled with this aromatic fragment, because till now MM and MD methods using a polymeric coal structure seems to fail in getting a reasonable value of its physical density. MM and MD methods seem not to be proper in obtaining the density value close to its observed value. The method proposed here is one of approaches to overcome this shortcoming of the methodology studied so far. In order to detect such empty spaces efficiently, the lattice model is introduced. Figure 1 shows the general flow of the coal-structural-model construction suing the lattice model. The aromatic fragment that can be boxed in the empty lattice space is located and connected to the partial model.
aromatic class fragment DB
fragment
size of empty spacelocating andconnectingfragment
empty spacedetection
approximate representationusing lattice model
iteration
aromatic class fragment DB
fragment
size of empty spacelocating andconnectingfragment
empty spacedetection
approximate representationusing lattice model
iteration
Figure 1. General flow of coal structure model construction using the lattice model. Results and Discussion
Preference of uniphase model for density calculation. The authors have been studying coal model structures based on very many valuable data about coal organic materials. Solvent refined coal (SRC) is a very appropriate sample for analyzing its chemical constituents so that at our early stage of these studies the authors focused on the pyrolytic technique and solid state 13C-NMR measurements of solubles because SRC showed very high solubility toward conventional solvent such as hexane and benzene, this indicating the fragments are relatively small due to heat treatment. In 1992 the authors proposed the fragments of Akabira coal (typical Japanese bituminous coal) and without the detailed information about the bridge bonds the authors proposed a possible coal model structure [10]. Conclusively this model lacked the quantitativeness about the ratio of aliphatic carbons to aromatic carbons because at that time NMR measurements gave only qualitative data. According to the
Prepr. Pap.-Am. Chem. Soc., Div. Fuel Chem. 2003, 48(2), 535

recent quantitative data, researchers can propose very adequate data about the above ratio [11]. Following new method proposed here is going to handle these data for the evaluation of the density of the model structure later.
As for the calculation of the density, Takanohashi et al. succeeded in giving very proper value of density for Zao Zhuang coal [5], where the aromatic clusters stack each other so effectively. This can be done by considering relatively small fragments of coal. Their method is the same means the authors employed because the authors have been collaborated each other so far. The details are already described at Experimental section.
In this method the smaller the fractions become the closer the calculated density become to the observed value. In the course of studying the calculation of the density of models the authors found that fragments can be so closely arranged when they are smaller to results in higher density. Density obtained according to the calculation can not exceed the observed value.
Density-oriented construction of coal model. The method
described here was developed with the collaboration with Ohkawa and Komoda of Graduate School of Information Science and Technology of Osaka University. This method is very unique in attaining as higher density as possible. The fragments of coal should be at first determined so that the authors employed fragments proposed for Akabira coal [10], however, this fragments are not quantitative in terms of the ratio of aliphatic carbon and aromatic carbon. Less amounts of aliphatic carbons are recommended, however, the use of fragments in original paper seems not to be so serious because this method is based on the following concept: In order to attain the higher density, the fragments should be packed as closely as possible. The method is to put the fragment in a space of similar volume to that of fragment and this process is repeated to connect each fragment by adequate bridge bonding. The result was shown in Table 1. The authors finally reached the value of 1.27 g/cm3. This value is very similar to the observed value of original coal. In this case the fragments can be connected each other to form high molecular weight. This means that the present method can not discriminate the difference between the two phase model and uniphase model. Simulation model at first was expected to give a possible means to discriminate two structural models, however, it was found that new method the authors developed was found not to become the means to solve the issue concerning associative structure of coal or two phase model structure. Conclusion
Association structure of coal has been proposed by several researchers and a solvent system such as N-methyl-2-pyrrolidinone/carbon disulfide gave very high extraction yields for several coals. On the other hand, even this active binary solvent can give only very low values of extraction yield with other many coals. For these latter coals, the proposed density-oriented construction of coal model could be valuable to show reasonable density values. For a limited number of coals with high solvent extraction yield the concept of association structure of coal seems to be prevailing, however, even with these coals RICO reaction strongly indicated the presence of bridge bonds in a similar amount to other coals, where solvent extraction yields are very small. This tendency concerning bridge bonds between the former coals (high extraction yield) and the latter coals (low extraction yield) are considered to be a kind of contradiction, because bridge bonds are considered to be less with the former coals. From the combination viewpoints of density simulation of coal and the distribution of bridge bonds two phase structure concept still seems to be able to clarify the contradiction above
mentioned in a reasonable way. The former coal is the extreme case of this concept and the later coal is the other extreme case.
Table 1. Evaluation of method.
Method Density (g/cm3)
Calculation time (min)
Measured value 1.28 - Comics 0.97 180 Proposed method 1.27 7
References (1) Mathews, J. P.; Hatcher, P. G.; Scaroni, A. W. Energy Fuels
2001, 15, 863. (2) Nomura, M.; Kidena, K.; Matsumoto, K.; Murata, S.;
Proceedings of the 19th Annual Pittsburgh Coal Conference, Sep. 23-27, 2002, Pitsburgh, PA, USA.
(3) Mojelsky, T. W.; Ignasiak, T. M.; Frakman, Z.; McIntyre, D. D.; Lown, E. M.; Montgomery, D. S.; Strausz, O. P. Energy Fuels 1992, 6, 83.
(4) Carlson, G. A. Energy Fuels 1992, 6, 771. (5) Nakamura, K.; Takanohashi, T.; Iino, M.; Kumagai, H.; Sato,
M.; Yokoyama, S.; Sanada, Y. Energy Fuels 1995, 9, 1003. (6) Nakamura, K.; Murata, S.; Nomura, M. Energy Fuels 1993, 7,
347. (7) Murata, S.; Nomura, M.; Nakamura, K.; Kumagai, H.; Sanada,
Y. Energy Fuels 1993, 7, 472. (8) Dong, T.; Murata, S.; Miura, M.; Nomura, M.; Nakamura, K.
Energy Fuels 1993, 7, 1123. (9) Ohkawa, T.; Sasai, T.; Komoda, N.; Murata, S.; Nomura, M.
Energy Fuels 1997, 11, 937. (10) Nomura, M.; Matsubayashi, K.; Ida, T.; Murata, S. Fuel Process.
Technol. 1992, 31, 169. (11) Love, G. D.; Law, R. V.; Snape, C. E. Energy Fuels 1993, 7,
639.
Prepr. Pap.-Am. Chem. Soc., Div. Fuel Chem. 2003, 48(2), 536
INTEGRATED KINETIC MODELING C KMT AND ITS APPLICATIONS
M. T. Klein, and Wei Wei
Chemical & Biochemical Engineering Department,
Rutgers University 98 Brett road c252, Piscataway, NJ 08854 Fax: 732-445-5724, [email protected],
A chemical engineering approach for the rigorous
construction, solution and optimization of detailed kinetic models is described. This approach is based on the Kinetic Modeler's Toolbox (KMT) software package. Many important modeling functionalities and features are implemented in the KMT, including the Equation Building and Editing, Model Calibration, Target Estimation, Catalyst Deactivation, and Catalyst Activity Promotion.
The spreadsheet-based user interface provides a step-by-
step model building strategy under a rigorous engineering framework and can help the user develop full-featured kinetic models from only a set of reaction pathways. This tool thus allows scientists and engineers to focus on the fundamental chemistry and underlying kinetics while shifting the bookkeeping and coding burden to the software.
The KMT package has by now been used successfully to
develop many kinetic models, including examples in the broad categories of biological-environmental reactions, hydrocarbon reforming, dehydrogenation and oxidation processes, and thermal and catalytic cracking reaction systems. This work focuses on the kinetic modeling of Naphtha Reforming process using the KMT NetGen was used to automatically construct the reaction network for reforming reactions. CodeGen was used to generate the final mathematical equations for the model.
Important functionalities, including model calibration,
target evaluation, catalyst deactivation due to coking, were also automatically implemented into the model. The Linear Free Energy Relationship (LFER) concept was used to organize and evaluate the kinetic parameters. Other models for the selective oxidation of hydrocarbons, refinery unit process models and biology-based toxicology kinetic models were also developed using the KMT approach. The simulation results are shown to compare favorably with literature data.
Prepr. Pap.-Am. Chem. Soc., Div. Fuel Chem. 2003, 48(2), 537
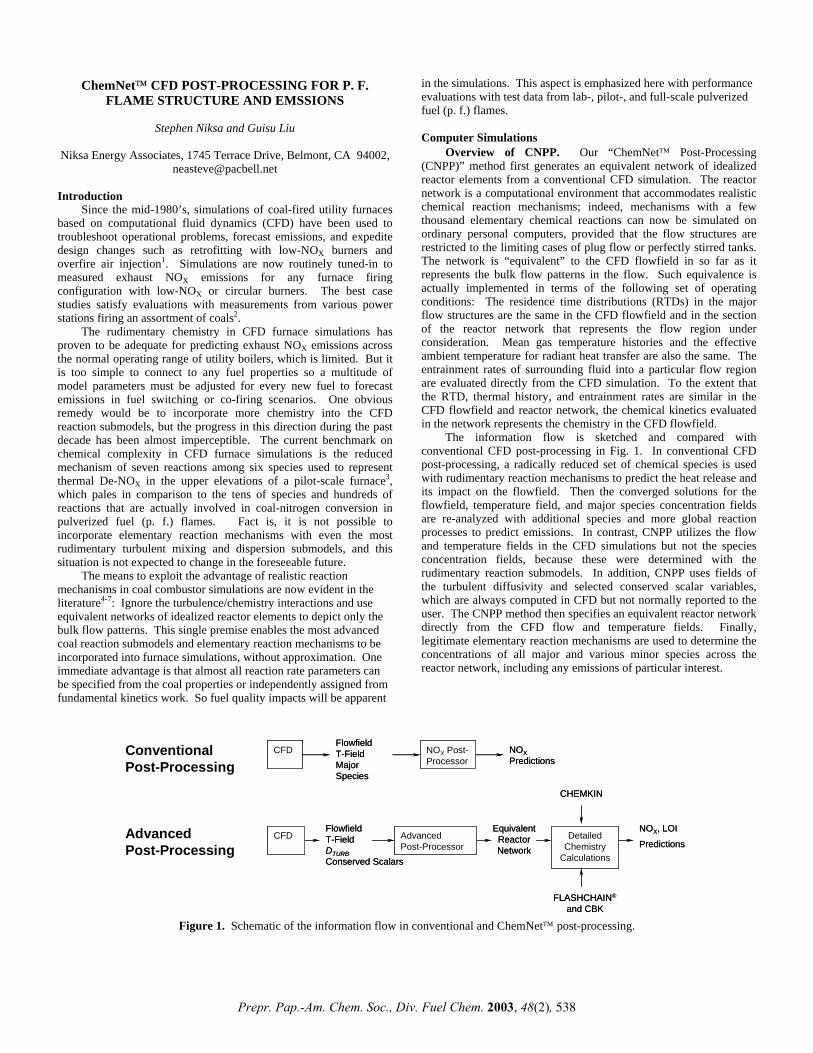
ChemNet CFD POST-PROCESSING FOR P. F. FLAME STRUCTURE AND EMSSIONS
Stephen Niksa and Guisu Liu
Niksa Energy Associates, 1745 Terrace Drive, Belmont, CA 94002,
[email protected] Introduction
Since the mid-1980’s, simulations of coal-fired utility furnaces based on computational fluid dynamics (CFD) have been used to troubleshoot operational problems, forecast emissions, and expedite design changes such as retrofitting with low-NOX burners and overfire air injection1. Simulations are now routinely tuned-in to measured exhaust NOX emissions for any furnace firing configuration with low-NOX or circular burners. The best case studies satisfy evaluations with measurements from various power stations firing an assortment of coals2.
The rudimentary chemistry in CFD furnace simulations has proven to be adequate for predicting exhaust NOX emissions across the normal operating range of utility boilers, which is limited. But it is too simple to connect to any fuel properties so a multitude of model parameters must be adjusted for every new fuel to forecast emissions in fuel switching or co-firing scenarios. One obvious remedy would be to incorporate more chemistry into the CFD reaction submodels, but the progress in this direction during the past decade has been almost imperceptible. The current benchmark on chemical complexity in CFD furnace simulations is the reduced mechanism of seven reactions among six species used to represent thermal De-NOX in the upper elevations of a pilot-scale furnace3, which pales in comparison to the tens of species and hundreds of reactions that are actually involved in coal-nitrogen conversion in pulverized fuel (p. f.) flames. Fact is, it is not possible to incorporate elementary reaction mechanisms with even the most rudimentary turbulent mixing and dispersion submodels, and this situation is not expected to change in the foreseeable future.
The means to exploit the advantage of realistic reaction mechanisms in coal combustor simulations are now evident in the literature4-7: Ignore the turbulence/chemistry interactions and use equivalent networks of idealized reactor elements to depict only the bulk flow patterns. This single premise enables the most advanced coal reaction submodels and elementary reaction mechanisms to be incorporated into furnace simulations, without approximation. One immediate advantage is that almost all reaction rate parameters can be specified from the coal properties or independently assigned from fundamental kinetics work. So fuel quality impacts will be apparent
in the simulations. This aspect is emphasized here with performance evaluations with test data from lab-, pilot-, and full-scale pulverized fuel (p. f.) flames.
Computer Simulations
Overview of CNPP. Our “ChemNet Post-Processing (CNPP)” method first generates an equivalent network of idealized reactor elements from a conventional CFD simulation. The reactor network is a computational environment that accommodates realistic chemical reaction mechanisms; indeed, mechanisms with a few thousand elementary chemical reactions can now be simulated on ordinary personal computers, provided that the flow structures are restricted to the limiting cases of plug flow or perfectly stirred tanks. The network is “equivalent” to the CFD flowfield in so far as it represents the bulk flow patterns in the flow. Such equivalence is actually implemented in terms of the following set of operating conditions: The residence time distributions (RTDs) in the major flow structures are the same in the CFD flowfield and in the section of the reactor network that represents the flow region under consideration. Mean gas temperature histories and the effective ambient temperature for radiant heat transfer are also the same. The entrainment rates of surrounding fluid into a particular flow region are evaluated directly from the CFD simulation. To the extent that the RTD, thermal history, and entrainment rates are similar in the CFD flowfield and reactor network, the chemical kinetics evaluated in the network represents the chemistry in the CFD flowfield.
The information flow is sketched and compared with conventional CFD post-processing in Fig. 1. In conventional CFD post-processing, a radically reduced set of chemical species is used with rudimentary reaction mechanisms to predict the heat release and its impact on the flowfield. Then the converged solutions for the flowfield, temperature field, and major species concentration fields are re-analyzed with additional species and more global reaction processes to predict emissions. In contrast, CNPP utilizes the flow and temperature fields in the CFD simulations but not the species concentration fields, because these were determined with the rudimentary reaction submodels. In addition, CNPP uses fields of the turbulent diffusivity and selected conserved scalar variables, which are always computed in CFD but not normally reported to the user. The CNPP method then specifies an equivalent reactor network directly from the CFD flow and temperature fields. Finally, legitimate elementary reaction mechanisms are used to determine the concentrations of all major and various minor species across the reactor network, including any emissions of particular interest.
CFDFlowfieldT-FieldMajor Species
NOX Post-Processor
NOX Predictions
CFDFlowfieldT-FieldMajor Species
NOX Post-Processor
NOX Predictions
NOX, LOIPredictions
CFDFlowfieldT-FieldDTURBConserved Scalars
Advanced Post-Processor
Equivalent Reactor Network
Detailed Chemistry
Calculations
CHEMKIN
FLASHCHAIN
and CBK
NOX, LOIPredictions
CFDFlowfieldT-FieldDTURBConserved Scalars
Advanced Post-Processor
Equivalent Reactor Network
Detailed Chemistry
Calculations
CHEMKIN
FLASHCHAIN
and CBK
ConventionalPost-Processing
AdvancedPost-Processing
Figure 1. Schematic of the information flow in conventional and ChemNet post-processing.
Prepr. Pap.-Am. Chem. Soc., Div. Fuel Chem. 2003, 48(2), 538
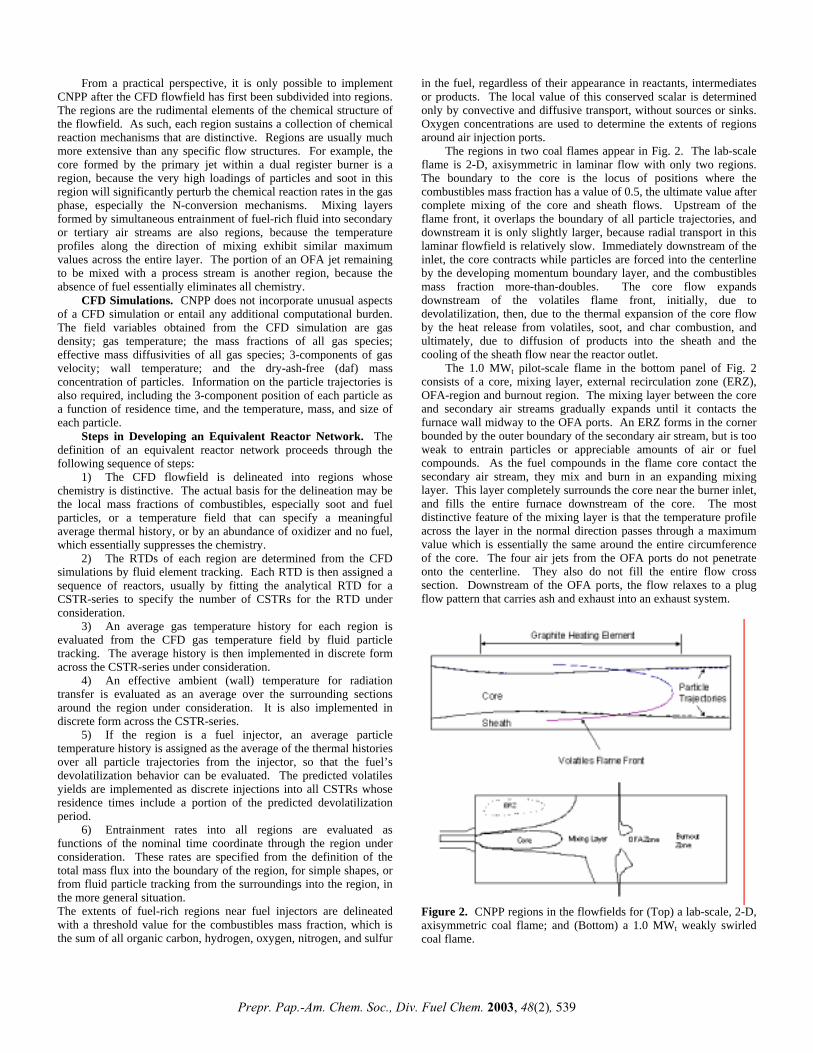
From a practical perspective, it is only possible to implement CNPP after the CFD flowfield has first been subdivided into regions. The regions are the rudimental elements of the chemical structure of the flowfield. As such, each region sustains a collection of chemical reaction mechanisms that are distinctive. Regions are usually much more extensive than any specific flow structures. For example, the core formed by the primary jet within a dual register burner is a region, because the very high loadings of particles and soot in this region will significantly perturb the chemical reaction rates in the gas phase, especially the N-conversion mechanisms. Mixing layers formed by simultaneous entrainment of fuel-rich fluid into secondary or tertiary air streams are also regions, because the temperature profiles along the direction of mixing exhibit similar maximum values across the entire layer. The portion of an OFA jet remaining to be mixed with a process stream is another region, because the absence of fuel essentially eliminates all chemistry.
CFD Simulations. CNPP does not incorporate unusual aspects of a CFD simulation or entail any additional computational burden. The field variables obtained from the CFD simulation are gas density; gas temperature; the mass fractions of all gas species; effective mass diffusivities of all gas species; 3-components of gas velocity; wall temperature; and the dry-ash-free (daf) mass concentration of particles. Information on the particle trajectories is also required, including the 3-component position of each particle as a function of residence time, and the temperature, mass, and size of each particle.
Steps in Developing an Equivalent Reactor Network. The definition of an equivalent reactor network proceeds through the following sequence of steps:
1) The CFD flowfield is delineated into regions whose chemistry is distinctive. The actual basis for the delineation may be the local mass fractions of combustibles, especially soot and fuel particles, or a temperature field that can specify a meaningful average thermal history, or by an abundance of oxidizer and no fuel, which essentially suppresses the chemistry.
2) The RTDs of each region are determined from the CFD simulations by fluid element tracking. Each RTD is then assigned a sequence of reactors, usually by fitting the analytical RTD for a CSTR-series to specify the number of CSTRs for the RTD under consideration.
3) An average gas temperature history for each region is evaluated from the CFD gas temperature field by fluid particle tracking. The average history is then implemented in discrete form across the CSTR-series under consideration.
4) An effective ambient (wall) temperature for radiation transfer is evaluated as an average over the surrounding sections around the region under consideration. It is also implemented in discrete form across the CSTR-series.
5) If the region is a fuel injector, an average particle temperature history is assigned as the average of the thermal histories over all particle trajectories from the injector, so that the fuel’s devolatilization behavior can be evaluated. The predicted volatiles yields are implemented as discrete injections into all CSTRs whose residence times include a portion of the predicted devolatilization period.
6) Entrainment rates into all regions are evaluated as functions of the nominal time coordinate through the region under consideration. These rates are specified from the definition of the total mass flux into the boundary of the region, for simple shapes, or from fluid particle tracking from the surroundings into the region, in the more general situation. The extents of fuel-rich regions near fuel injectors are delineated with a threshold value for the combustibles mass fraction, which is the sum of all organic carbon, hydrogen, oxygen, nitrogen, and sulfur
in the fuel, regardless of their appearance in reactants, intermediates or products. The local value of this conserved scalar is determined only by convective and diffusive transport, without sources or sinks. Oxygen concentrations are used to determine the extents of regions around air injection ports.
The regions in two coal flames appear in Fig. 2. The lab-scale flame is 2-D, axisymmetric in laminar flow with only two regions. The boundary to the core is the locus of positions where the combustibles mass fraction has a value of 0.5, the ultimate value after complete mixing of the core and sheath flows. Upstream of the flame front, it overlaps the boundary of all particle trajectories, and downstream it is only slightly larger, because radial transport in this laminar flowfield is relatively slow. Immediately downstream of the inlet, the core contracts while particles are forced into the centerline by the developing momentum boundary layer, and the combustibles mass fraction more-than-doubles. The core flow expands downstream of the volatiles flame front, initially, due to devolatilization, then, due to the thermal expansion of the core flow by the heat release from volatiles, soot, and char combustion, and ultimately, due to diffusion of products into the sheath and the cooling of the sheath flow near the reactor outlet.
The 1.0 MWt pilot-scale flame in the bottom panel of Fig. 2 consists of a core, mixing layer, external recirculation zone (ERZ), OFA-region and burnout region. The mixing layer between the core and secondary air streams gradually expands until it contacts the furnace wall midway to the OFA ports. An ERZ forms in the corner bounded by the outer boundary of the secondary air stream, but is too weak to entrain particles or appreciable amounts of air or fuel compounds. As the fuel compounds in the flame core contact the secondary air stream, they mix and burn in an expanding mixing layer. This layer completely surrounds the core near the burner inlet, and fills the entire furnace downstream of the core. The most distinctive feature of the mixing layer is that the temperature profile across the layer in the normal direction passes through a maximum value which is essentially the same around the entire circumference of the core. The four air jets from the OFA ports do not penetrate onto the centerline. They also do not fill the entire flow cross section. Downstream of the OFA ports, the flow relaxes to a plug flow pattern that carries ash and exhaust into an exhaust system.
Figure 2. CNPP regions in the flowfields for (Top) a lab-scale, 2-D, axisymmetric coal flame; and (Bottom) a 1.0 MWt weakly swirled coal flame.
Prepr. Pap.-Am. Chem. Soc., Div. Fuel Chem. 2003, 48(2), 539
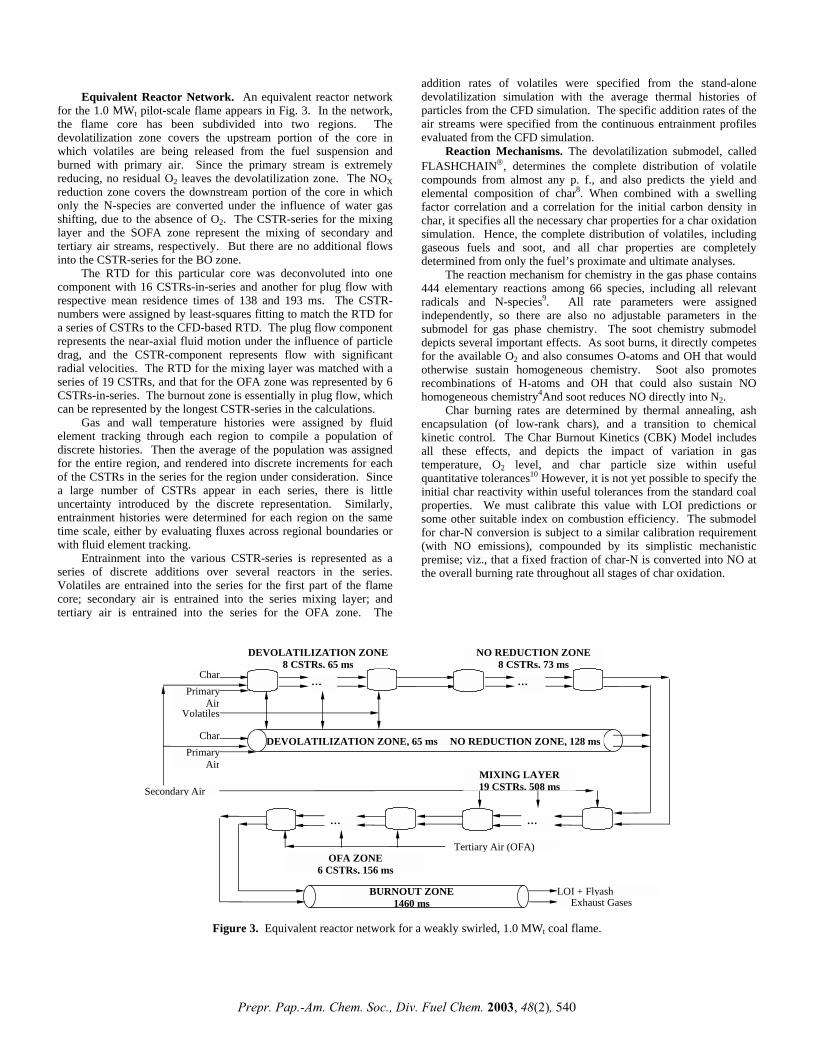
Equivalent Reactor Network. An equivalent reactor network
for the 1.0 MWt pilot-scale flame appears in Fig. 3. In the network, the flame core has been subdivided into two regions. The devolatilization zone covers the upstream portion of the core in which volatiles are being released from the fuel suspension and burned with primary air. Since the primary stream is extremely reducing, no residual O2 leaves the devolatilization zone. The NOX reduction zone covers the downstream portion of the core in which only the N-species are converted under the influence of water gas shifting, due to the absence of O2. The CSTR-series for the mixing layer and the SOFA zone represent the mixing of secondary and tertiary air streams, respectively. But there are no additional flows into the CSTR-series for the BO zone.
The RTD for this particular core was deconvoluted into one component with 16 CSTRs-in-series and another for plug flow with respective mean residence times of 138 and 193 ms. The CSTR-numbers were assigned by least-squares fitting to match the RTD for a series of CSTRs to the CFD-based RTD. The plug flow component represents the near-axial fluid motion under the influence of particle drag, and the CSTR-component represents flow with significant radial velocities. The RTD for the mixing layer was matched with a series of 19 CSTRs, and that for the OFA zone was represented by 6 CSTRs-in-series. The burnout zone is essentially in plug flow, which can be represented by the longest CSTR-series in the calculations.
Gas and wall temperature histories were assigned by fluid element tracking through each region to compile a population of discrete histories. Then the average of the population was assigned for the entire region, and rendered into discrete increments for each of the CSTRs in the series for the region under consideration. Since a large number of CSTRs appear in each series, there is little uncertainty introduced by the discrete representation. Similarly, entrainment histories were determined for each region on the same time scale, either by evaluating fluxes across regional boundaries or with fluid element tracking.
Entrainment into the various CSTR-series is represented as a series of discrete additions over several reactors in the series. Volatiles are entrained into the series for the first part of the flame core; secondary air is entrained into the series mixing layer; and tertiary air is entrained into the series for the OFA zone. The
addition rates of volatiles were specified from the stand-alone devolatilization simulation with the average thermal histories of particles from the CFD simulation. The specific addition rates of the air streams were specified from the continuous entrainment profiles evaluated from the CFD simulation.
Reaction Mechanisms. The devolatilization submodel, called FLASHCHAIN, determines the complete distribution of volatile compounds from almost any p. f., and also predicts the yield and elemental composition of char8. When combined with a swelling factor correlation and a correlation for the initial carbon density in char, it specifies all the necessary char properties for a char oxidation simulation. Hence, the complete distribution of volatiles, including gaseous fuels and soot, and all char properties are completely determined from only the fuel’s proximate and ultimate analyses.
The reaction mechanism for chemistry in the gas phase contains 444 elementary reactions among 66 species, including all relevant radicals and N-species9. All rate parameters were assigned independently, so there are also no adjustable parameters in the submodel for gas phase chemistry. The soot chemistry submodel depicts several important effects. As soot burns, it directly competes for the available O2 and also consumes O-atoms and OH that would otherwise sustain homogeneous chemistry. Soot also promotes recombinations of H-atoms and OH that could also sustain NO homogeneous chemistry4And soot reduces NO directly into N2.
Char burning rates are determined by thermal annealing, ash encapsulation (of low-rank chars), and a transition to chemical kinetic control. The Char Burnout Kinetics (CBK) Model includes all these effects, and depicts the impact of variation in gas temperature, O2 level, and char particle size within useful quantitative tolerances10 However, it is not yet possible to specify the initial char reactivity within useful tolerances from the standard coal properties. We must calibrate this value with LOI predictions or some other suitable index on combustion efficiency. The submodel for char-N conversion is subject to a similar calibration requirement (with NO emissions), compounded by its simplistic mechanistic premise; viz., that a fixed fraction of char-N is converted into NO at the overall burning rate throughout all stages of char oxidation.
…
Char Primary
Air
BURNOUT ZONE 1460 ms Exhaust Gases
LOI + Flyash
DEVOLATILIZATION ZONE, 65 ms
NO REDUCTION ZONE 8 CSTRs, 73 ms
… …
Volatiles
DEVOLATILIZATION ZONE8 CSTRs, 65 ms
Secondary Air
…
MIXING LAYER 19 CSTRs, 508 ms
OFA ZONE 6 CSTRs, 156 ms
Char Primary
Air
Tertiary Air (OFA)
NO REDUCTION ZONE, 128 ms
Figure 3. Equivalent reactor network for a weakly swirled, 1.0 MWt coal flame.
Prepr. Pap.-Am. Chem. Soc., Div. Fuel Chem. 2003, 48(2), 540
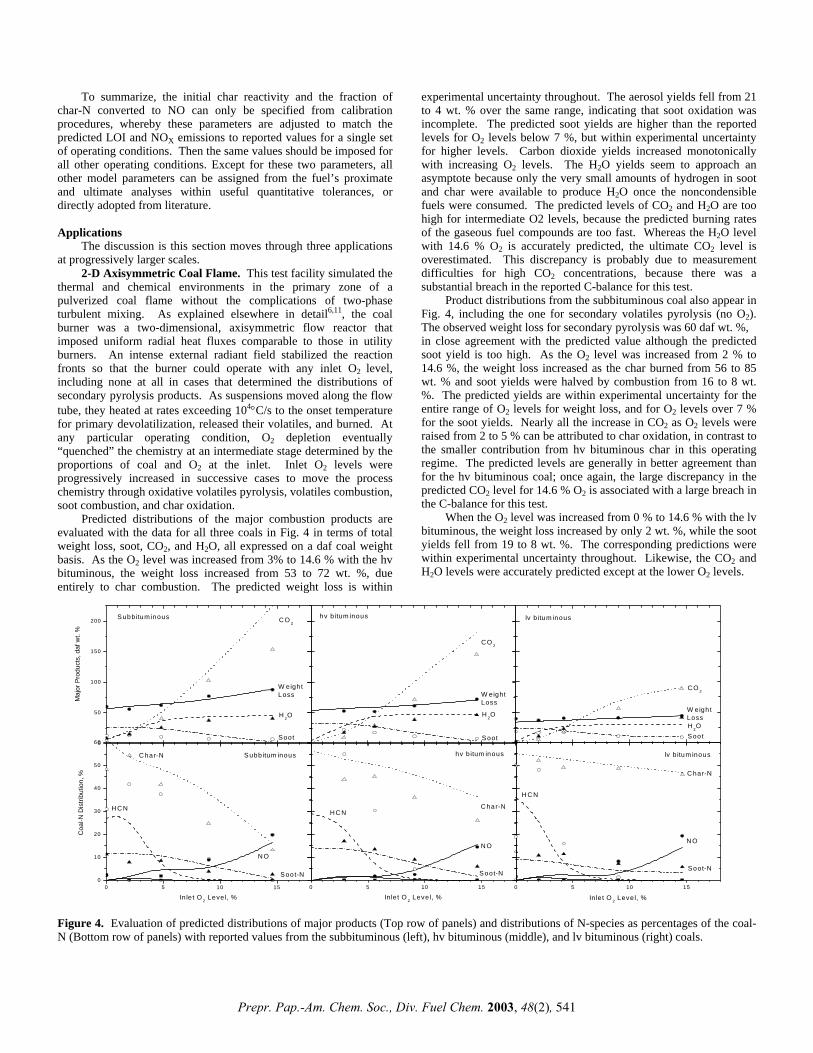
To summarize, the initial char reactivity and the fraction of
char-N converted to NO can only be specified from calibration procedures, whereby these parameters are adjusted to match the predicted LOI and NOX emissions to reported values for a single set of operating conditions. Then the same values should be imposed for all other operating conditions. Except for these two parameters, all other model parameters can be assigned from the fuel’s proximate and ultimate analyses within useful quantitative tolerances, or directly adopted from literature. Applications
The discussion is this section moves through three applications at progressively larger scales.
2-D Axisymmetric Coal Flame. This test facility simulated the thermal and chemical environments in the primary zone of a pulverized coal flame without the complications of two-phase turbulent mixing. As explained elsewhere in detail6,11, the coal burner was a two-dimensional, axisymmetric flow reactor that imposed uniform radial heat fluxes comparable to those in utility burners. An intense external radiant field stabilized the reaction fronts so that the burner could operate with any inlet O2 level, including none at all in cases that determined the distributions of secondary pyrolysis products. As suspensions moved along the flow tube, they heated at rates exceeding 104°C/s to the onset temperature for primary devolatilization, released their volatiles, and burned. At any particular operating condition, O2 depletion eventually “quenched” the chemistry at an intermediate stage determined by the proportions of coal and O2 at the inlet. Inlet O2 levels were progressively increased in successive cases to move the process chemistry through oxidative volatiles pyrolysis, volatiles combustion, soot combustion, and char oxidation.
Predicted distributions of the major combustion products are evaluated with the data for all three coals in Fig. 4 in terms of total weight loss, soot, CO2, and H2O, all expressed on a daf coal weight basis. As the O2 level was increased from 3% to 14.6 % with the hv bituminous, the weight loss increased from 53 to 72 wt. %, due entirely to char combustion. The predicted weight loss is within
experimental uncertainty throughout. The aerosol yields fell from 21 to 4 wt. % over the same range, indicating that soot oxidation was incomplete. The predicted soot yields are higher than the reported levels for O2 levels below 7 %, but within experimental uncertainty for higher levels. Carbon dioxide yields increased monotonically with increasing O2 levels. The H2O yields seem to approach an asymptote because only the very small amounts of hydrogen in soot and char were available to produce H2O once the noncondensible fuels were consumed. The predicted levels of CO2 and H2O are too high for intermediate O2 levels, because the predicted burning rates of the gaseous fuel compounds are too fast. Whereas the H2O level with 14.6 % O2 is accurately predicted, the ultimate CO2 level is overestimated. This discrepancy is probably due to measurement difficulties for high CO2 concentrations, because there was a substantial breach in the reported C-balance for this test.
Product distributions from the subbituminous coal also appear in Fig. 4, including the one for secondary volatiles pyrolysis (no O2). The observed weight loss for secondary pyrolysis was 60 daf wt. %, in close agreement with the predicted value although the predicted soot yield is too high. As the O2 level was increased from 2 % to 14.6 %, the weight loss increased as the char burned from 56 to 85 wt. % and soot yields were halved by combustion from 16 to 8 wt. %. The predicted yields are within experimental uncertainty for the entire range of O2 levels for weight loss, and for O2 levels over 7 % for the soot yields. Nearly all the increase in CO2 as O2 levels were raised from 2 to 5 % can be attributed to char oxidation, in contrast to the smaller contribution from hv bituminous char in this operating regime. The predicted levels are generally in better agreement than for the hv bituminous coal; once again, the large discrepancy in the predicted CO2 level for 14.6 % O2 is associated with a large breach in the C-balance for this test.
When the O2 level was increased from 0 % to 14.6 % with the lv bituminous, the weight loss increased by only 2 wt. %, while the soot yields fell from 19 to 8 wt. %. The corresponding predictions were within experimental uncertainty throughout. Likewise, the CO2 and H2O levels were accurately predicted except at the lower O2 levels.
0
50
100
150
200
Soot
H 2O
W eightLoss
C O 2Subbitum inous
Maj
or P
rodu
cts,
daf
wt.
%
0 5 10 150
10
20
30
40
50
60
Subb itum inous
H C N
C har-N
N O
Soot-N
Coa
l-N D
istri
butio
n, %
In le t O 2 Leve l, %
hv b itum inous
Soot
H 2O
W eightLoss
CO 2
0 5 10 15
N O
hv b itum inous
HC N
Soot-N
C har-N
In let O 2 Level, %
lv b itum inous
SootH 2O
W eigh tLoss
C O 2
0 5 10 15
lv b itum inous
H C N
C har-N
N O
Soot-N
In let O 2 Level, %
Figure 4. Evaluation of predicted distributions of major products (Top row of panels) and distributions of N-species as percentages of the coal-N (Bottom row of panels) with reported values from the subbituminous (left), hv bituminous (middle), and lv bituminous (right) coals.
Prepr. Pap.-Am. Chem. Soc., Div. Fuel Chem. 2003, 48(2), 541

The N-species distributions in Fig. 4 are resolved into char-N, soot-N, HCN, NH3, and NO, all expressed as percentages of the coal-N. For all three coals, the predicted N-species distributions depict the observed shift in the fixed-N species from HCN with minor amounts of NH3 but no NO for the lower two O2 levels, through an abrupt transition to only NO (and N2) at the highest O2 level. The levels of char- and soot-N fall continuously for progressively higher O2 levels, while these carbonaceous fuels burn away. For the hv bituminous coal, the predicted levels of soot-N, NH3, and NO are within experimental uncertainty across the entire range of O2 level. Char-N levels are slightly overpredicted, but HCN levels are too low by a factor of two or more. However, there is a breach of more than 15 % in the reported N-balance for the case with 2 % O2, so it is difficult to pinpoint the source of these discrepancies.
With the other coals, the predicted N-species distributions are generally more accurate although, here again, HCN levels are underestimated for low O2 levels and char-N levels are over predicted at intermediate O2 levels. It is interesting that the reaction mechanism predicts almost 5 % N2O and 3 % HNCO when the lv bituminous is burned in 4.2 % O2, although these species were not monitored in the tests.
1.0 MWt Pilot-Scale Flame. A database on emissions from biomass cofired flames was compiled in Southern Research Institute’s (SoRI) Combustion Research Facility (CRF)12,13. The CRF consists of fuel handling and feeding systems, a vertical refractory lined furnace with a single up-fired burner, a horizontal convective pass, heat exchangers and conventional exhaust cleaning devices. Emissions from this system have been qualified against those from full-scale, tangential-fired furnaces for the operating conditions imposed in this work14. The 8.5 m by 1.07 m (i.d.) cylindrical furnace handles gas velocities from 3 to 6 m/s, and residence times from 1.3 to 2.5 s. The nominal firing rate is 1.0 MWt, which was fixed for all cases in this work. A single burner generates a core of pulverized fuel and primary air surrounded by weakly swirled secondary air. For all cases in this paper, the biomass was co-milled with the coal and the mixture was directly fed into the burner. Overfire air (OFA) was injected through 4 off-radius ports located 4.6 m down the furnace. All datasets include cases with 0 (unstaged) and 15 % OFA. In the unstaged series, the OFA was combined with secondary air. Air feedrates were varied to produce exhaust (wet) O2 levels between 2.5 and 5 %. Fuel quality was varied by firing four coals representing ranks from subbituminous through low volatile bituminous with sawdust and switchgrass at loadings of 10 and 25 % by weight.
The parity plot in Fig. 5 evaluates the predicted NOX emissions for all the tested fuel combinations at standardized operating conditions of 3.5 % exhaust O2 with 15 % OFA. The measured NOX emissions increase from 140 ppm through 450 ppm while the coals were switched from the subbituminous, through two high volatile bituminous samples, through the low volatile bituminous. Each of these coals was cofired at two or three levels of sawdust and switchgrass, which generally reduced NOX by up to 30 %. The dataset in Fig. 5 contains four baseline, coal-only cases which were used to assign various parameters in the CNPP simulations. The other twenty-one cases were predicted with no parameter adjustments whatsoever. The fuels’ proximate and ultimate analyses were used to predict the compositions of all volatile and residual fuel compounds, which were then processed through full chemical reaction mechanisms in the gas phase and on soot to describe the conversion of fuel-N. Across the complete range of fuel quality, the predicted NOX emissions are within experimental uncertainty of the measured values, except for the overprediction by 75 ppm for the measured value of 360 ppm.
The detailed flame structures from the CNPP analyses showed that two factors are primarily responsible for the significant NOX reduction observed for CRF flames with biomass cofiring. First, there is more volatile matter from biomass and it contains a much smaller contribution from soot. Consequently, the near-burner S. R. values for the gas phase are significantly richer than in coal-only flames. Under richer conditions, near-burner NO will be reduced away and a greater proportion of the fixed-N species will be converted into N2. CRF flames provide sufficient residence times in the flame cores for NO reduction and fixed-N conversion to N2. Second, a significantly lower percentage of the total fuel-N will remain in the char beyond the near-burner zone, where its partial conversion to NO is inevitable. If the biomass contains nitrogen, it releases all of it in the near-burner zone. If the biomass contains no nitrogen, then the inventory of char-N beyond the flame core is reduced in proportion to the biomass loading. In either case, there is less char-N beyond the point where NO can be reduced by chemistry in the gas phase.
Figure 5. Evaluation of predicted NOX emissions from 1.0 MWt flames of 2 forms of biomass co-milled with 4 diverse coals.
Full-Scale T-fired Furnace. CNPP was successfully applied to a full-scale, tangential-fired utility furnace fired with subbituminous coal. The coal was injected into the lower furnace through tens of independent fuel injectors that were arranged with multiple close-coupled OFA ports as well as two layers of OFA at the furnace midsection. Whereas the exhaust NOX emissions could be closely matched to reported values, this application is particularly interesting for its resolution of the total NOX emissions into contributions from each fuel injector. The key to this capability is a deconvolution of the extremely complex RTDs for the flow from each fuel injector.
Each fuel jet generates a flow of gases that moves along the walls. This stream is regarded as a mixing layer that constitutes a separate region in the flowfield, because it contains a very high level of gaseous fuel compounds and soot. Each ribbon is surrounded above and below by air jets which, in turn, are surrounded above and below by two auxiliary air streams. These various air streams gradually mix with the ribbon flow, burning out the volatile fuels, and also with each other. Fluid tracking showed that the ribbon from each primary jet moves in a helix from the core of its parent fuel jet to the top of the fuel injection zone. The air flows between the ribbons from different fuel jets tend to isolate each ribbon, and little interaction was seen among the ribbons from primary jets at different
Prepr. Pap.-Am. Chem. Soc., Div. Fuel Chem. 2003, 48(2), 542

corners and elevations, although some ribbons were bisected by the ribbons from neighboring jets. The various collisions and deflections among these flows are responsible for the complex RTD in Fig. 6. Almost all the ribbon RTDs were too complicated to represent with a single CSTR-series. Most of the RTDs were bimodal and some were trimodal. Nevertheless, the RTDs could still be deconvoluted into multiple CSTR-series, as seen in Fig. 6. These two component RTDs are essentially independent, and their mean residence times differ by more than a factor of four, suggesting that part of the flow actually short-circuited the primary flow path. For this particular ribbon, two CSTRs represented the first component, and 20 represented the second, which approaches the limiting behavior of a single CSTR in parallel with a plug flow reactor. There are other cases like this, but most of the multimode RTDs had components in plug flow.
Due to the disparate residence times in the component RTDs for each fuel jet, the compositions of the flows into the upper furnace were significantly affected by the complexity in the RTDs. RTD-components with the shortest residence times tended to have much higher concentrations of HCN and NH3 as they moved into the upper furnace. When these variations in composition were ultimately processed through the reaction mechanism that partitions the intermediate species into NO or N2, they were responsible for very large differences in the NOX levels contributed by individual fuel injectors. Indeed, the extreme values differed by a factor of ten, so that substantial portions of the exhaust NOX could be associated with a handful of fuel injectors.
Figure 6. CFD-based RTDs (histograms) and their analytical fits (curves) for the flow from an individual fuel injector in a T-fired utility furnace.
Discussion The CNPP method provides an alternative to conventional CFD
post-processing whereby rudimentary N- conversion schemes are applied to the primary CFD temperature and concentration fields to estimate exhaust NOX emissions. One key difference is that in CNPP, CFD simulations only specify temperature histories and mixing rates, not the species concentration fields that directly reflect the rudimentary reaction schemes. Another key difference is that the furnace is subdivided into regions that delineate the structure of p. f. flames, as in gaseous flames. The combustibles mass fraction used to delineate the regions near fuel injectors explicitly accounts for the impact of aerosol and particulate combustibles on the burning rates of gaseous fuel compounds and, especially, on the NO production rates. This aspect is responsible for the accurate predictions of NOX
emissions from the biomass cofired flames, in which volatiles chemistry determined how much of the near-burner NO was expelled into the downstream flame zones and, ultimately, into the exhaust. It also enabled the exhaust emissions from the full-scale utility furnace to be resolved into contributions from individual fuel injectors, which were surprisingly variable.
Simulations based on detailed reaction mechanisms require far fewer parameter adjustments than conventional CFD simulations whenever different fuels are considered. To depict the reported distributions in Fig. 4 of the major fuel intermediates and combustion products, but not the N-species, with CFD simulations6, the following reactivity parameters were adjusted: 2 parameters for the devolatilization rate plus the ultimate volatiles yield; 3 parameters in the combustion rate for gaseous fuels; 3 parameters in a global rate for soot oxidation; and 4 parameters in the intrinsic char oxidation rate. In principle, there are 13 adjustable parameters in the CFD chemistry submodels. In practice, the compositions of soot and char hardly change for different coal types, so there are actually 11 effective adjustable parameters. To reproduce the product distributions in Fig. 2, all these parameters were adjusted for different coals, except for the activation energies for soot and gas combustion and the reaction order for char oxidation. Hence, 8 parameters were adjusted 3 times for a total of 24 parameter adjustments to represent the datasets on these 3 coals.
In contrast, in the detailed chemistry simulations, the rate constant for soot oxidation was adjusted to match one case with the lv bituminous coal, and the rate constant for NO reduction on soot was adjusted to match one case with the hv bituminous coal. In addition to these 2 adjustments, we generally expect to adjust the initial reactivity in CBK and the fraction of char-N converted to NO for each coal type (although the same char-N fraction was specified for all 3 coal samples in this study). Hence, 8 parameters could have been adjusted for these 3 coals, which is many fewer than 24, even without an allowance for the omission of nitrogen chemistry in the CFD simulations. This is the main practical benefit of the mechanistic complexity in the detailed chemistry simulations.
Whereas all the applications in this paper featured NOX emissions from flames, the method is generally applicable to any set of species of particular interest. It has already been used to interpret test data on NOX reduction with direct radical injection from dielectric barrier discharges and mercury transformations in utility exhaust systems. The method will be especially suitable for gasification systems where the chemical kinetics control the overall conversion rates, and the mixing limited analyses in conventional CFD furnace simulations no longer apply.
References (1) Niksa, S. Coal Combustor Modeling, 1996, No. 31 IEA
Perspectives Series, IEA Coal Research, London. (2) Visona, S. P.; and Stanmore, B. R. Chem. Engr. Sci., 1998,
53(11), 2013-2027. (3) Brower, J.; Heap, M. P.; Pershing, D. W.; and Smith, P. J., Proc.
Comb. Inst., 1996, 26, 2117-2124. (4) Pedersen, L. S.; Glarborg, P.; et al. Combust. Sci. Technol.,
1998, 132, 251-314. (5) Benedetto, D.; Pasini, S.; Falcitelli, M.; La Marca, C.; and
Tognotti, L. Combust. Sci. and Technol., 2000, 153, 279-294. (6) Niksa, S.; and Liu G.-S., Fuel, 2002, 81(18), 2371-85. (7) Falcitelli, M.; Tognotti, L.; and Pasini, S. Combust. Sci.
Technol., 2002, 174(11-12), 27. (8) Niksa, S. Combust. Flame, 1995, 100, 384-394. (9) Glarborg, P.; Alzueta, M. U.; Dam-Johansen, K.; and Miller, J.
A. Combust. Flame, 1998, 115, 1-27.
Prepr. Pap.-Am. Chem. Soc., Div. Fuel Chem. 2003, 48(2), 543

(10) Hurt, R. H.; Sun J.-K.; and Lunden, M. Combust. Flame, 1997, 113(1/2), 181.
(11) Niksa, S.; and Liu, G.-S. Proc. Comb. Inst., 2002, 29, to appear. (12) Niksa, S.; Liu, G.-S.; Felix, L. G.; and Bush, P. V. Paper No.
IJPGC2002-26136, Int. Joint Power Gen. Conf., ASME, Phoenix, AZ, June 25, 2002.
(13) Niksa, S.; Liu, G.-S.; Felix, L. G.; Bush, P. V.; and Boylan, D. M. “Predicting NOX Emissions from Biomass Cofiring,” 28th Int. Technical Conf. on Coal Utilization and Fuel Systems, 2003, Coal Technology Assoc., Clearwater, Fl, March.
(14) Monroe, L. S. et al., 1995, EPRI/EPA 1995 Joint Symp. On Stationary Combustion NOX Control, Book 3, EPRI, Palo Alto, CA.
Prepr. Pap.-Am. Chem. Soc., Div. Fuel Chem. 2003, 48(2), 544
A TIME-SCALE PROBLEM FOR THE FORMATION OF SOOT PRECURSORS IN PREMIXED FLAMES
Angela Violi1, Gregory A. Voth2, Adel F. Sarofim1
1 Department of Chemical and Fuels Engineering 2 Henry Eyring Center for Theoretical Chemistry,
Department of Chemistry
University of Utah Salt Lake City, UT 84112
Introduction
This paper applies a previously developed tool to study the molecular transformations that occur in combustion conditions during the transition from gas phase precursors to soot particles.1-2 To help resolve issues such as identification of pathways leading to soot formation, it is important to characterize the soot precursors, in terms of chemical structure/components. Questions like structure-pathways and structure-property relationships may lead to a deeper understanding of soot growth mechanisms. We want to address these questions theoretically by studying the growth of molecules in combustion environments, using Kinetic Monte Carlo (KMC) and Molecular Dynamics (MD) methodologies.
The processes involved in soot precursor formation exhibit a wide range of time scales, spanning pico- or nanoseconds for intramolecular processes that can occur on a particle surface to milliseconds for the formation of the first soot precursors. In order to accurately describe the soot formation process, we need to model the reactions happening at different time scales. The coupling of KMC and MD methodologies allows us to do so. The code, named KMC/MD, combines the strengths of KMC for long-time sampling, and MD for relaxation processes is based on that developed at LLNL.2. The time-duration between Monte Carlo events can be arbitrarily long (depending on the kinetics, model. etc), while in Molecular Dynamics, we require time steps which are a small fraction of a vibrational period. So the combination of the two techniques spans two time- and equilibrium scales. The reaction rates among the compounds present in the system are calculated using electronic configuration methods, and they are specified as probabilities. This approach is designed to preserve atomistic scale structure: a single particle evolves in time with real three-dimensional structure (bonds, bond-angles, dihedral angles). Some preliminary results have been reported in an earlier publication for the simulation of the evolution of soot precursors in an ethylene premixed laminar flame.1,3 In this paper the KMC/MD code is used to study the growth of aromatic structures to a nano-size range in the soot inception zone of aromatic and aliphatic laminar flames. The aromatic growth process strongly depends on the specific local regime, which is characterized by several experimental factors such as temperature, concentration of hydrogen, PAH, etc., and it is interesting to understand the influence of different environments on structural properties of the compounds formed. The use of this approach enables the investigation on the physical as well as chemical properties of the carbonaceous nanoparticles formed, such as H/C ratio, and particle morphology. After summarizing in the following section the methodological details of the computations performed, the results of hydrocarbon compounds growth are discussed in two different environments represented by low pressure aromatic and aliphatic flames.
Methodology Molecular Dynamics, in which one chooses an appropriate
interatomic potential to describe the forces between atoms and then integrates the classical equation of motion, is the most direct approach among atomistic simulations. However, the limitation in the accessible simulation time represents a substantial obstacle in making useful predictions with MD. Resolving individual atomic vibrations requires a time step of approximately femtoseconds in the integration of the equations of motion, so that reaching times of even microseconds is very difficult. In order to solve this time scale problem, MD methodology has been coupled to KMC to allow the extension of the accessible time scale by orders of magnitude relative to direct MD, while retaining full atomistic detail. During the KMC module4-6 one escape path is chosen randomly from a list of possible transition events, weighted by the rate constant, and the system is advanced to that new state. The clock is then incremented in a way that is consistent with the average time for escape from that state, which can be determined easily from the rate constants for the possible escape paths in the list. The two methods differ in their ability to explore phase space. The ability of the KMC method to make non-physical moves can significantly enhance its capacity to explore phase space in appropriate cases. Its capability to generate states directly has many advantages, including bypassing configurations which may be difficult to escape dynamically. And so the method can be used to study the configurations of systems which may be expensive or impossible to access via MD.
Molecular Dynamics may not be able to cross the barriers between the conformations sufficiently often to ensure that each conformation is sampled according to the correct statistical weight. MD can be very useful for exploration of the local phase space whereas the KMC method may be more effective for conformational changes which jump to a completely different area of phase space.
The time-step for a single KMC iteration is a "real time," determined by the kinetics system. The reaction rates among the compounds present in the system are specified as probabilities and the surface configuration over time is then given by a master equation, describing the time evolution of the probability distribution of system configurations.
A more detailed description of the methodology is reported elsewhere.1-3
Conditions analyzed
Below we report the computational results obtained for the growth of aromatics in two premixed laminar flames of aliphatic and aromatic fuels in order to determine the influence of different environments, and hence reaction pathways, on the structures of particles. A low-pressure benzene-oxygen flame C/O=0.8 with an unburned velocity of 42 cm s-1, p= 2.66 kPa,7 and an acetylene/oxygen flame at a pressure of 2.67 kPa8 have been experimentally studied by Homann and co-workers, who measured PAH and PAH radicals for these flames by mean of resonant (REMPI) and nonresonant multiphoton ionization with a frequency-doubled, pulsed dye laser and separation with a time-of-flight mass spectrometer, equipped with an ion reflector. These experimental data are used to validate the code in terms of structure properties, such as H/C ratio.
The two major inputs to the KMC/MD code are represented by the number and concentration profiles of the species that characterize the gas phase and that can contribute to the growth process and by the reaction rates that describe the velocity with which the gas-phase species are added to the growing seed. Acetylene, H, naphthalene, and acenapthylene species are considered in this work as key contributors to the PAH growth process and used as input to the
Prepr. Pap.-Am. Chem. Soc., Div. Fuel Chem. 2003, 48(2), 545
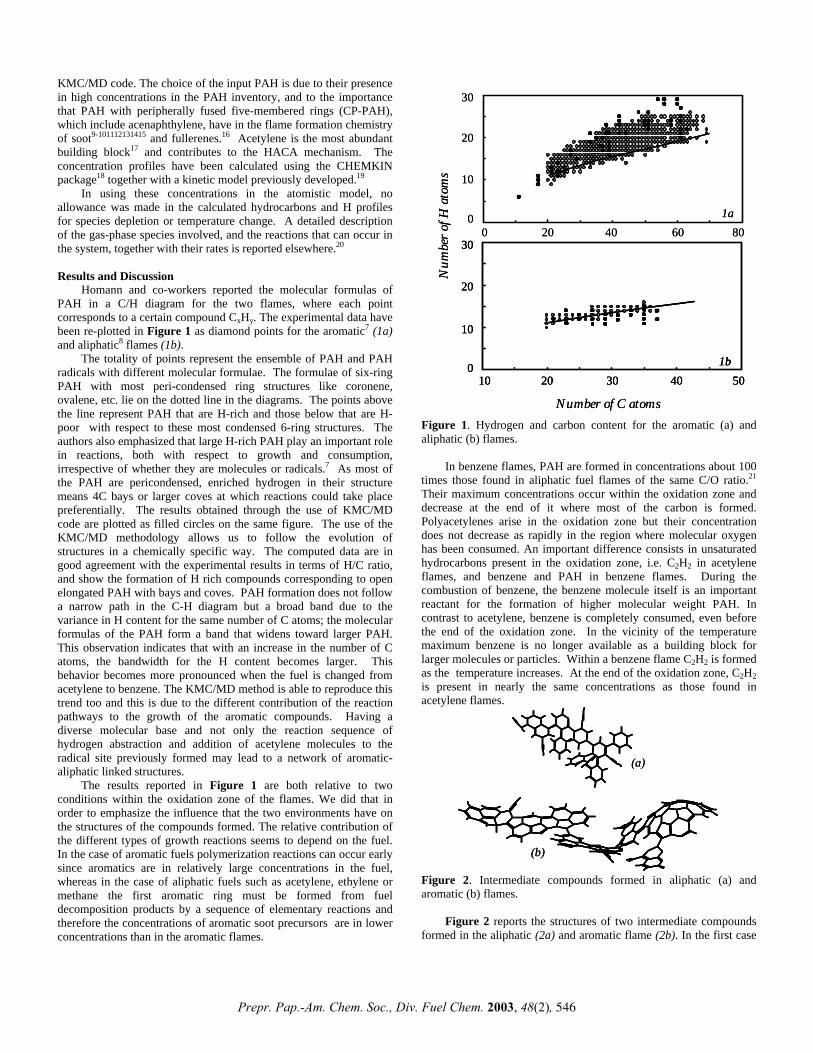
KMC/MD code. The choice of the input PAH is due to their presence in high concentrations in the PAH inventory, and to the importance that PAH with peripherally fused five-membered rings (CP-PAH), which include acenaphthylene, have in the flame formation chemistry of soot9-101112131415 and fullerenes.16 Acetylene is the most abundant building block17 and contributes to the HACA mechanism. The concentration profiles have been calculated using the CHEMKIN package18 together with a kinetic model previously developed.19
0
10
20
30
0 20 40 60 801a
0
10
20
30
10 20 30 40 501b
Number of C atoms
Num
ber o
f H a
tom
s
0
10
20
30
0 20 40 60 801a
0
10
20
30
10 20 30 40 501b0
10
20
30
10 20 30 40 501b
Number of C atoms
Num
ber o
f H a
tom
s
In using these concentrations in the atomistic model, no allowance was made in the calculated hydrocarbons and H profiles for species depletion or temperature change. A detailed description of the gas-phase species involved, and the reactions that can occur in the system, together with their rates is reported elsewhere.20
Results and Discussion
Homann and co-workers reported the molecular formulas of PAH in a C/H diagram for the two flames, where each point corresponds to a certain compound CxHy. The experimental data have been re-plotted in Figure 1 as diamond points for the aromatic7 (1a) and aliphatic8 flames (1b).
The totality of points represent the ensemble of PAH and PAH radicals with different molecular formulae. The formulae of six-ring PAH with most peri-condensed ring structures like coronene, ovalene, etc. lie on the dotted line in the diagrams. The points above the line represent PAH that are H-rich and those below that are H-poor with respect to these most condensed 6-ring structures. The authors also emphasized that large H-rich PAH play an important role in reactions, both with respect to growth and consumption, irrespective of whether they are molecules or radicals.7 As most of the PAH are pericondensed, enriched hydrogen in their structure means 4C bays or larger coves at which reactions could take place preferentially. The results obtained through the use of KMC/MD code are plotted as filled circles on the same figure. The use of the KMC/MD methodology allows us to follow the evolution of structures in a chemically specific way. The computed data are in good agreement with the experimental results in terms of H/C ratio, and show the formation of H rich compounds corresponding to open elongated PAH with bays and coves. PAH formation does not follow a narrow path in the C-H diagram but a broad band due to the variance in H content for the same number of C atoms; the molecular formulas of the PAH form a band that widens toward larger PAH. This observation indicates that with an increase in the number of C atoms, the bandwidth for the H content becomes larger. This behavior becomes more pronounced when the fuel is changed from acetylene to benzene. The KMC/MD method is able to reproduce this trend too and this is due to the different contribution of the reaction pathways to the growth of the aromatic compounds. Having a diverse molecular base and not only the reaction sequence of hydrogen abstraction and addition of acetylene molecules to the radical site previously formed may lead to a network of aromatic-aliphatic linked structures.
Figure 1. Hydrogen and carbon content for the aromatic (a) and aliphatic (b) flames.
In benzene flames, PAH are formed in concentrations about 100
times those found in aliphatic fuel flames of the same C/O ratio.21 Their maximum concentrations occur within the oxidation zone and decrease at the end of it where most of the carbon is formed. Polyacetylenes arise in the oxidation zone but their concentration does not decrease as rapidly in the region where molecular oxygen has been consumed. An important difference consists in unsaturated hydrocarbons present in the oxidation zone, i.e. C2H2 in acetylene flames, and benzene and PAH in benzene flames. During the combustion of benzene, the benzene molecule itself is an important reactant for the formation of higher molecular weight PAH. In contrast to acetylene, benzene is completely consumed, even before the end of the oxidation zone. In the vicinity of the temperature maximum benzene is no longer available as a building block for larger molecules or particles. Within a benzene flame C2H2 is formed as the temperature increases. At the end of the oxidation zone, C2H2 is present in nearly the same concentrations as those found in acetylene flames.
(a)
(b)
(a)
(b)
The results reported in Figure 1 are both relative to two conditions within the oxidation zone of the flames. We did that in order to emphasize the influence that the two environments have on the structures of the compounds formed. The relative contribution of the different types of growth reactions seems to depend on the fuel. In the case of aromatic fuels polymerization reactions can occur early since aromatics are in relatively large concentrations in the fuel, whereas in the case of aliphatic fuels such as acetylene, ethylene or methane the first aromatic ring must be formed from fuel decomposition products by a sequence of elementary reactions and therefore the concentrations of aromatic soot precursors are in lower concentrations than in the aromatic flames.
Figure 2. Intermediate compounds formed in aliphatic (a) and aromatic (b) flames.
Figure 2 reports the structures of two intermediate compounds formed in the aliphatic (2a) and aromatic flame (2b). In the first case
Prepr. Pap.-Am. Chem. Soc., Div. Fuel Chem. 2003, 48(2), 546
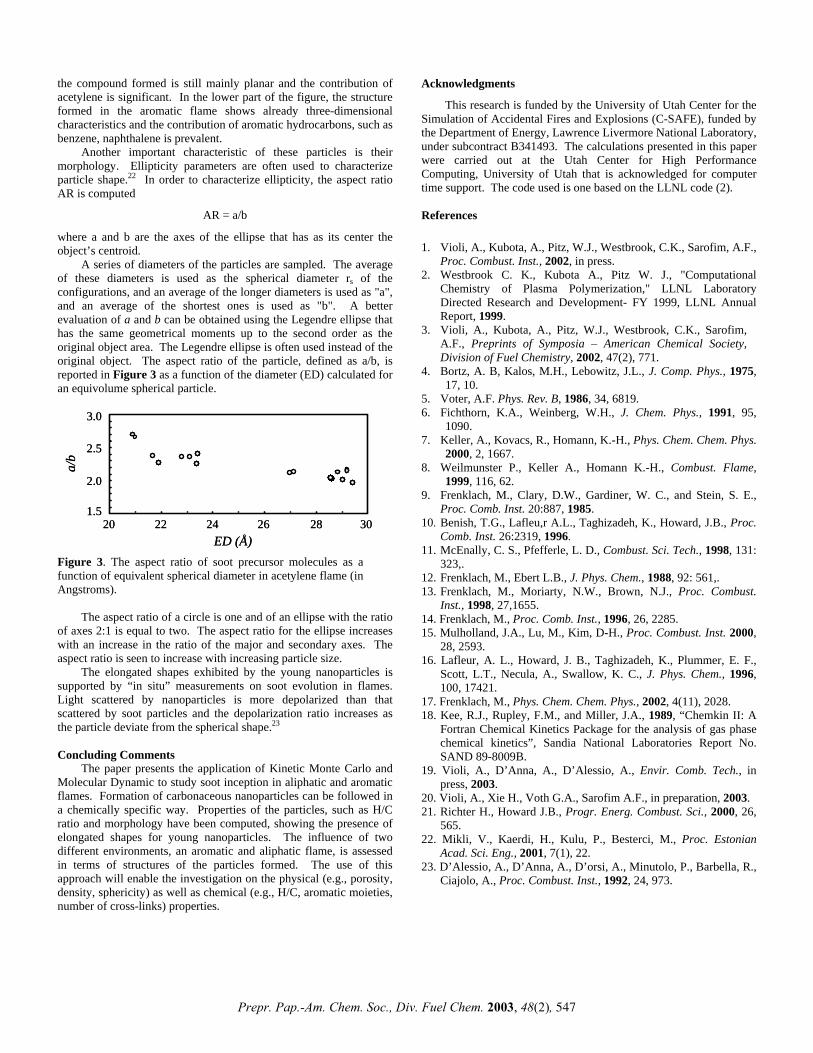
the compound formed is still mainly planar and the contribution of acetylene is significant. In the lower part of the figure, the structure formed in the aromatic flame shows already three-dimensional characteristics and the contribution of aromatic hydrocarbons, such as benzene, naphthalene is prevalent.
Acknowledgments
This research is funded by the University of Utah Center for the Simulation of Accidental Fires and Explosions (C-SAFE), funded by the Department of Energy, Lawrence Livermore National Laboratory, under subcontract B341493. The calculations presented in this paper were carried out at the Utah Center for High Performance Computing, University of Utah that is acknowledged for computer time support. The code used is one based on the LLNL code (2).
Another important characteristic of these particles is their morphology. Ellipticity parameters are often used to characterize particle shape.22 In order to characterize ellipticity, the aspect ratio AR is computed
AR = a/b References
where a and b are the axes of the ellipse that has as its center the object’s centroid. 1. Violi, A., Kubota, A., Pitz, W.J., Westbrook, C.K., Sarofim, A.F.,
Proc. Combust. Inst., 2002, in press. A series of diameters of the particles are sampled. The average of these diameters is used as the spherical diameter rs of the configurations, and an average of the longer diameters is used as "a", and an average of the shortest ones is used as "b". A better evaluation of a and b can be obtained using the Legendre ellipse that has the same geometrical moments up to the second order as the original object area. The Legendre ellipse is often used instead of the original object. The aspect ratio of the particle, defined as a/b, is reported in Figure 3 as a function of the diameter (ED) calculated for an equivolume spherical particle.
2. Westbrook C. K., Kubota A., Pitz W. J., "Computational Chemistry of Plasma Polymerization," LLNL Laboratory Directed Research and Development- FY 1999, LLNL Annual Report, 1999.
3. Violi, A., Kubota, A., Pitz, W.J., Westbrook, C.K., Sarofim, A.F., Preprints of Symposia – American Chemical Society, Division of Fuel Chemistry, 2002, 47(2), 771.
4. Bortz, A. B, Kalos, M.H., Lebowitz, J.L., J. Comp. Phys., 1975, 17, 10.
5. Voter, A.F. Phys. Rev. B, 1986, 34, 6819. 6. Fichthorn, K.A., Weinberg, W.H., J. Chem. Phys., 1991, 95,
1090.
1.5
2.0
2.5
3.0
20 22 24 26 28 30
a/b
ED (Å)
1.5
2.0
2.5
3.0
20 22 24 26 28 30
a/b
ED (Å)
7. Keller, A., Kovacs, R., Homann, K.-H., Phys. Chem. Chem. Phys. 2000, 2, 1667.
8. Weilmunster P., Keller A., Homann K.-H., Combust. Flame, 1999, 116, 62.
9. Frenklach, M., Clary, D.W., Gardiner, W. C., and Stein, S. E., Proc. Comb. Inst. 20:887, 1985.
10. Benish, T.G., Lafleu,r A.L., Taghizadeh, K., Howard, J.B., Proc. Comb. Inst. 26:2319, 1996.
11. McEnally, C. S., Pfefferle, L. D., Combust. Sci. Tech., 1998, 131: 323,. Figure 3. The aspect ratio of soot precursor molecules as a
function of equivalent spherical diameter in acetylene flame (in Angstroms).
12. Frenklach, M., Ebert L.B., J. Phys. Chem., 1988, 92: 561,. 13. Frenklach, M., Moriarty, N.W., Brown, N.J., Proc. Combust.
Inst., 1998, 27,1655. The aspect ratio of a circle is one and of an ellipse with the ratio
of axes 2:1 is equal to two. The aspect ratio for the ellipse increases with an increase in the ratio of the major and secondary axes. The aspect ratio is seen to increase with increasing particle size.
14. Frenklach, M., Proc. Comb. Inst., 1996, 26, 2285. 15. Mulholland, J.A., Lu, M., Kim, D-H., Proc. Combust. Inst. 2000,
28, 2593. 16. Lafleur, A. L., Howard, J. B., Taghizadeh, K., Plummer, E. F.,
Scott, L.T., Necula, A., Swallow, K. C., J. Phys. Chem., 1996, 100, 17421.
The elongated shapes exhibited by the young nanoparticles is supported by “in situ” measurements on soot evolution in flames. Light scattered by nanoparticles is more depolarized than that scattered by soot particles and the depolarization ratio increases as the particle deviate from the spherical shape.23
17. Frenklach, M., Phys. Chem. Chem. Phys., 2002, 4(11), 2028. 18. Kee, R.J., Rupley, F.M., and Miller, J.A., 1989, “Chemkin II: A
Fortran Chemical Kinetics Package for the analysis of gas phase chemical kinetics”, Sandia National Laboratories Report No. SAND 89-8009B.
Concluding Comments
The paper presents the application of Kinetic Monte Carlo and Molecular Dynamic to study soot inception in aliphatic and aromatic flames. Formation of carbonaceous nanoparticles can be followed in a chemically specific way. Properties of the particles, such as H/C ratio and morphology have been computed, showing the presence of elongated shapes for young nanoparticles. The influence of two different environments, an aromatic and aliphatic flame, is assessed in terms of structures of the particles formed. The use of this approach will enable the investigation on the physical (e.g., porosity, density, sphericity) as well as chemical (e.g., H/C, aromatic moieties, number of cross-links) properties.
19. Violi, A., D’Anna, A., D’Alessio, A., Envir. Comb. Tech., in press, 2003.
20. Violi, A., Xie H., Voth G.A., Sarofim A.F., in preparation, 2003. 21. Richter H., Howard J.B., Progr. Energ. Combust. Sci., 2000, 26,
565. 22. Mikli, V., Kaerdi, H., Kulu, P., Besterci, M., Proc. Estonian
Acad. Sci. Eng., 2001, 7(1), 22. 23. D’Alessio, A., D’Anna, A., D’orsi, A., Minutolo, P., Barbella, R.,
Ciajolo, A., Proc. Combust. Inst., 1992, 24, 973.
Prepr. Pap.-Am. Chem. Soc., Div. Fuel Chem. 2003, 48(2), 547