aasbo march bi-monthly membership meeting dr. chuck essigs
TRANSCRIPT
AASBO March Bi-Monthly Membership Meeting
Dr. Chuck Essigs

The difficult times will stay for a number of years.
Could it get more difficult? – It could.
When will it improve?
Think long term.
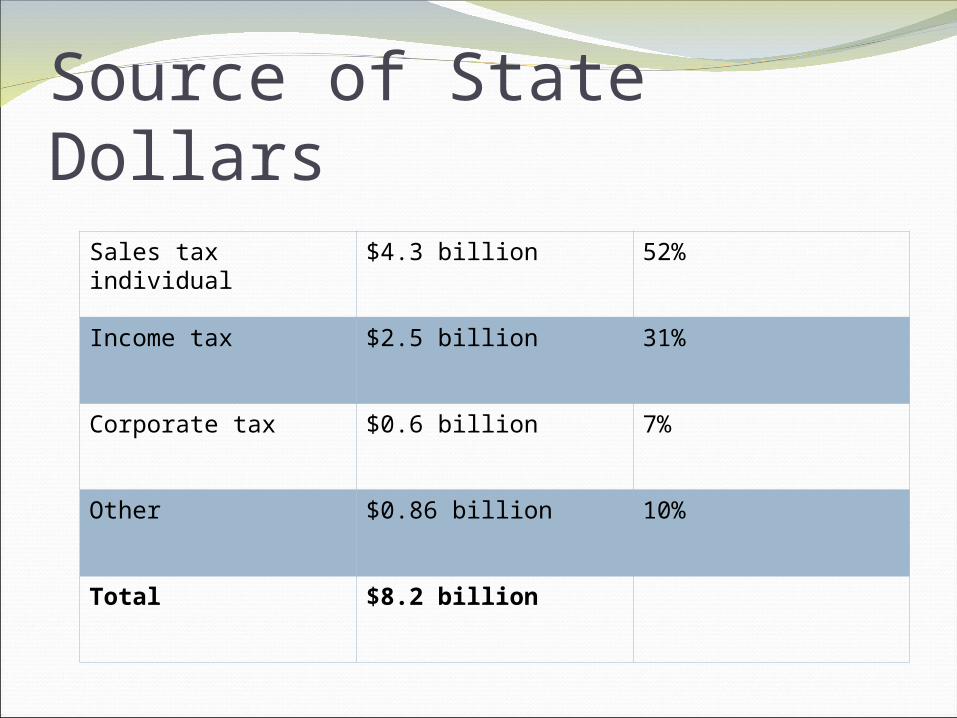
Source of State DollarsSales tax individual $4.3 billion 52%
Income tax $2.5 billion 31%
Corporate tax $0.6 billion 7%
Other $0.86 billion 10%
Total $8.2 billion
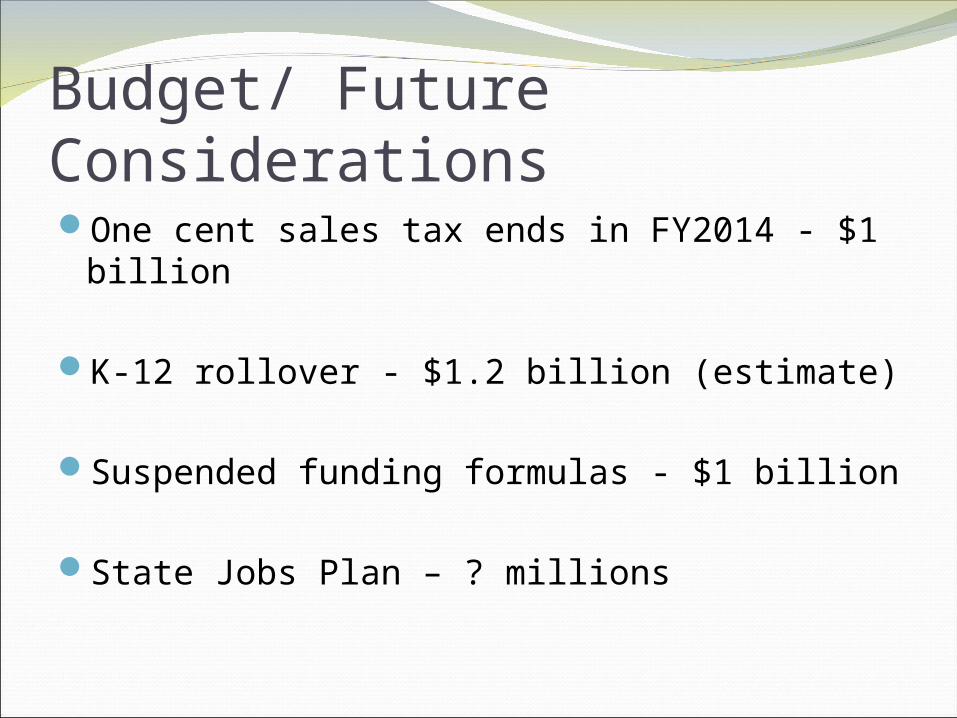
Budget/ Future ConsiderationsOne cent sales tax ends in FY2014 - $1 billion
K-12 rollover - $1.2 billion (estimate)
Suspended funding formulas - $1 billion
State Jobs Plan – ? millions
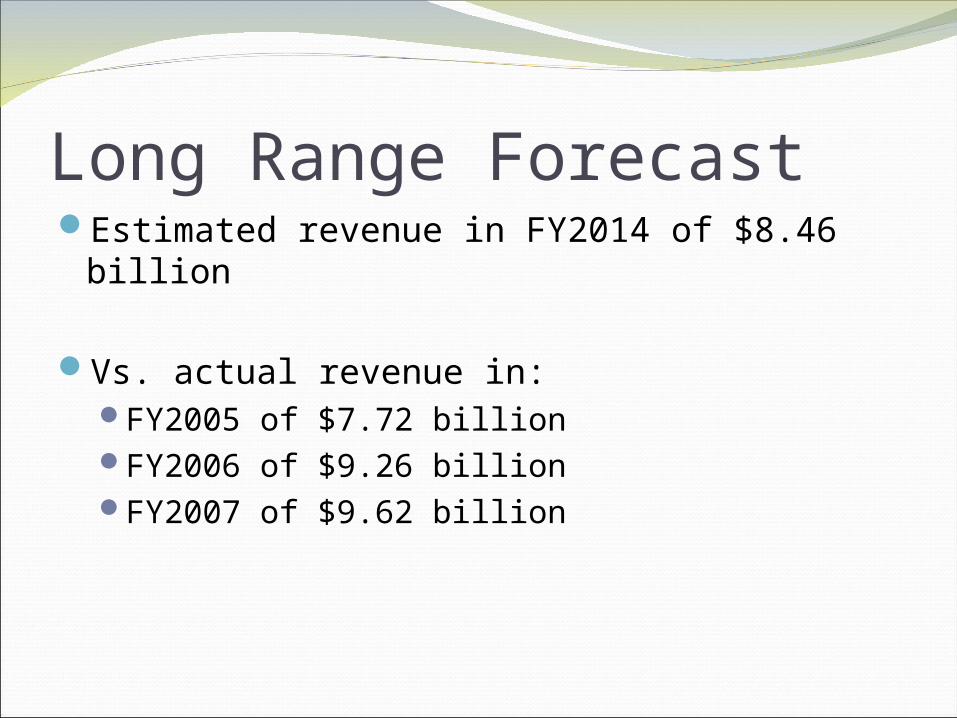
Long Range ForecastEstimated revenue in FY2014 of $8.46 billion
Vs. actual revenue in:FY2005 of $7.72 billionFY2006 of $9.26 billionFY2007 of $9.62 billion
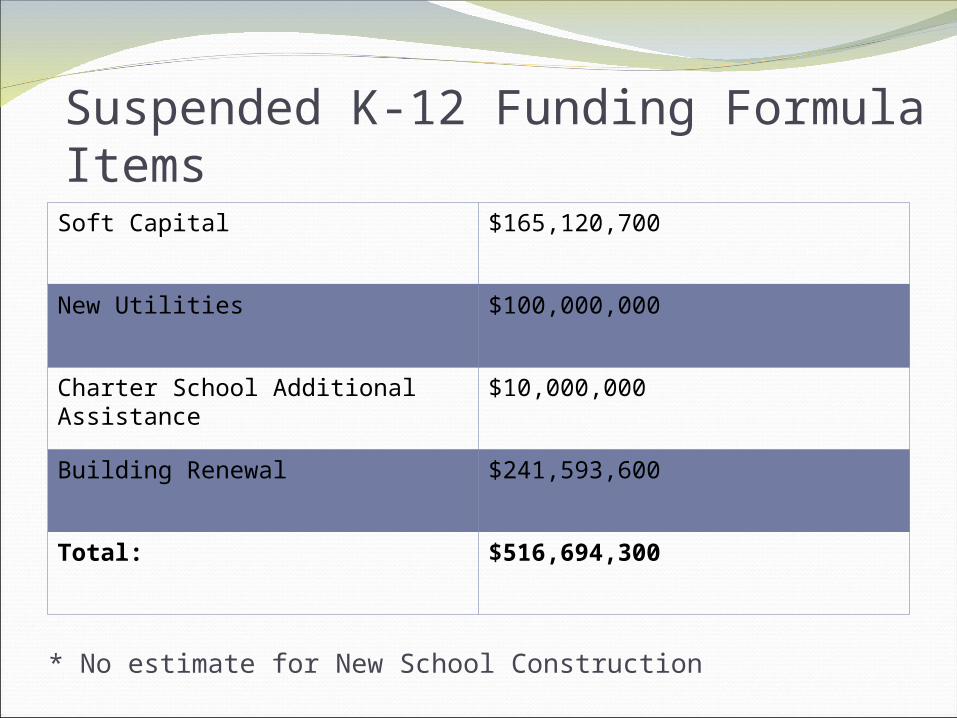
Soft Capital $165,120,700
New Utilities $100,000,000
Charter School Additional Assistance
$10,000,000
Building Renewal $241,593,600
Total: $516,694,300
* No estimate for New School Construction
Suspended K-12 Funding Formula Items
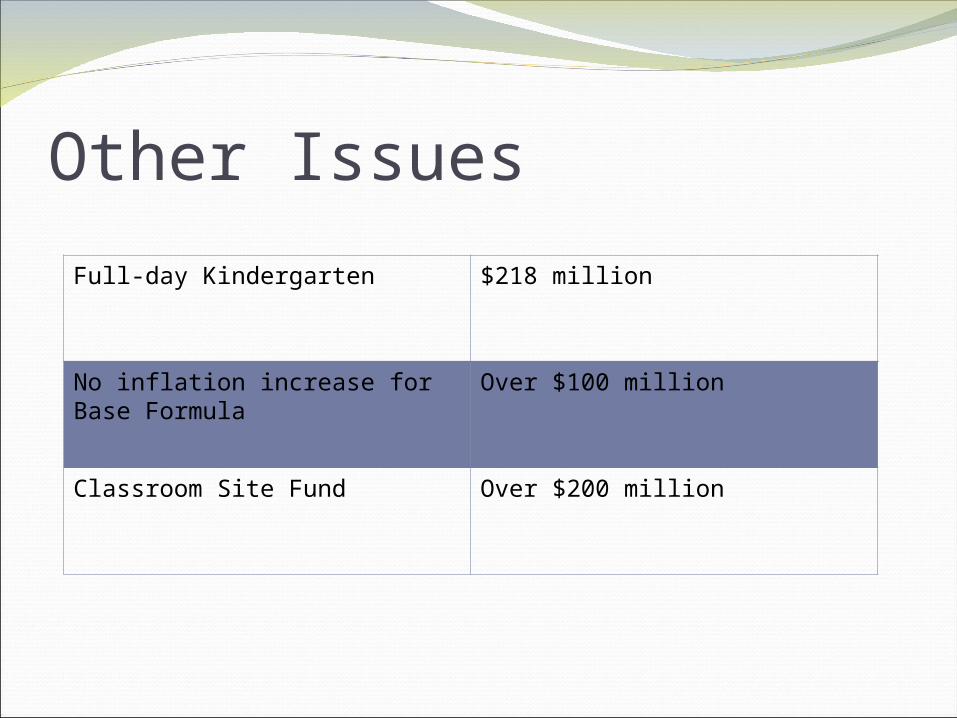
Other Issues
Full-day Kindergarten $218 million
No inflation increase for Base Formula
Over $100 million
Classroom Site Fund Over $200 million

School Budget
Parents, Community, Students and Employees
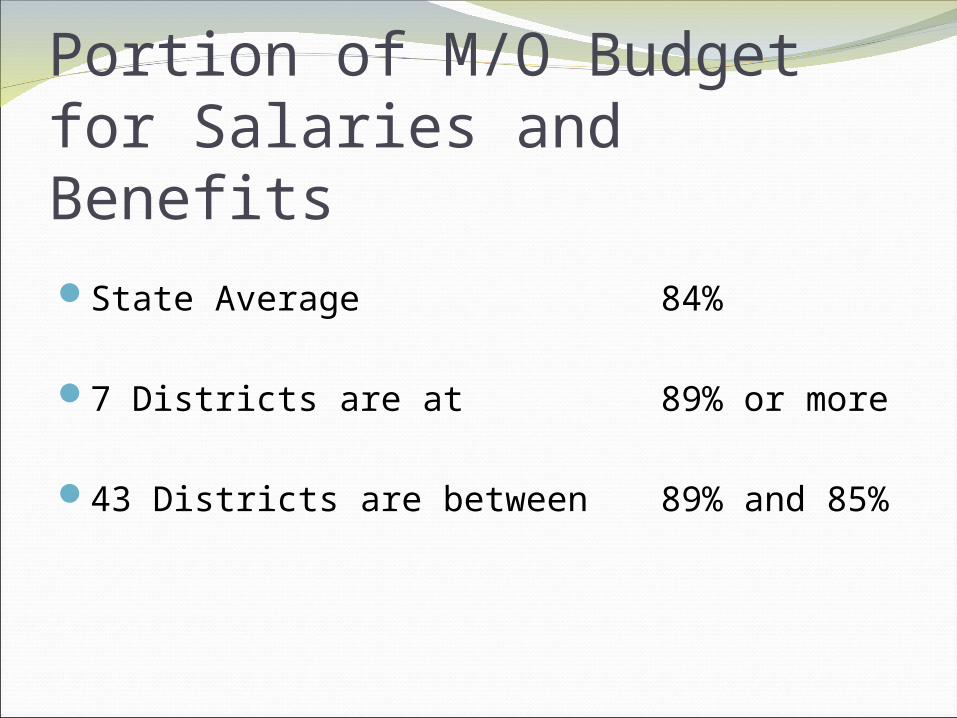
Portion of M/O Budget for Salaries and BenefitsState Average 84%
7 Districts are at 89% or more
43 Districts are between 89% and 85%
Times Have Changed
Past – Pay your people more or pay more people
Present – Pay your people less or pay less people
OptionsEliminate services
Contract services
Cooperative programs
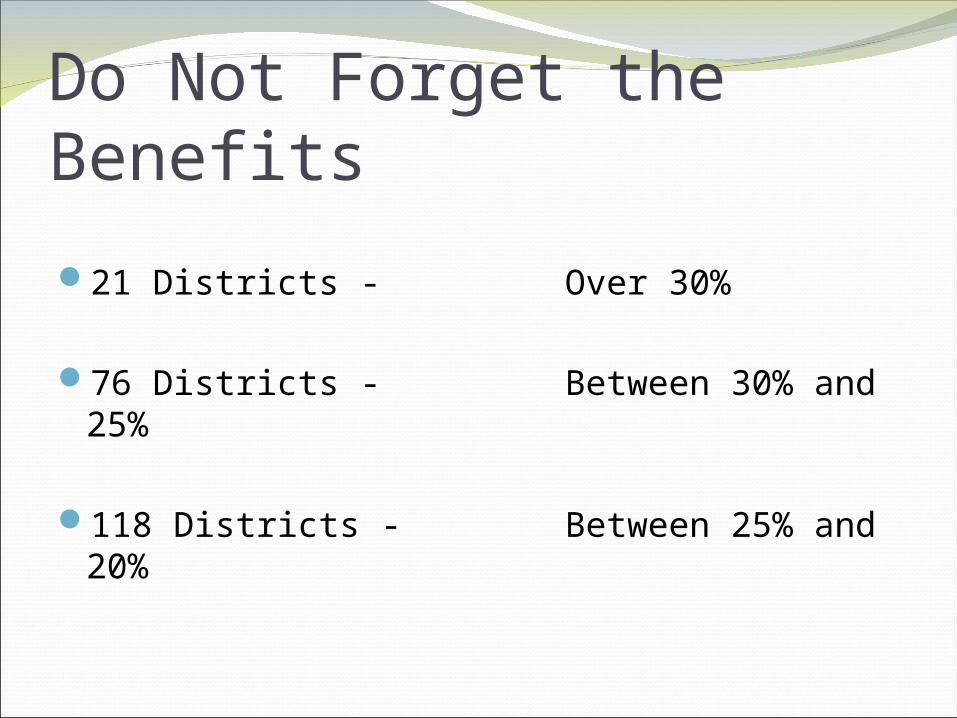
Do Not Forget the Benefits
21 Districts - Over 30%
76 Districts - Between 30% and 25%
118 Districts - Between 25% and 20%
Special Education
Should not be overlooked
You need to look at comparisons
Special EducationKnow your spending and know why
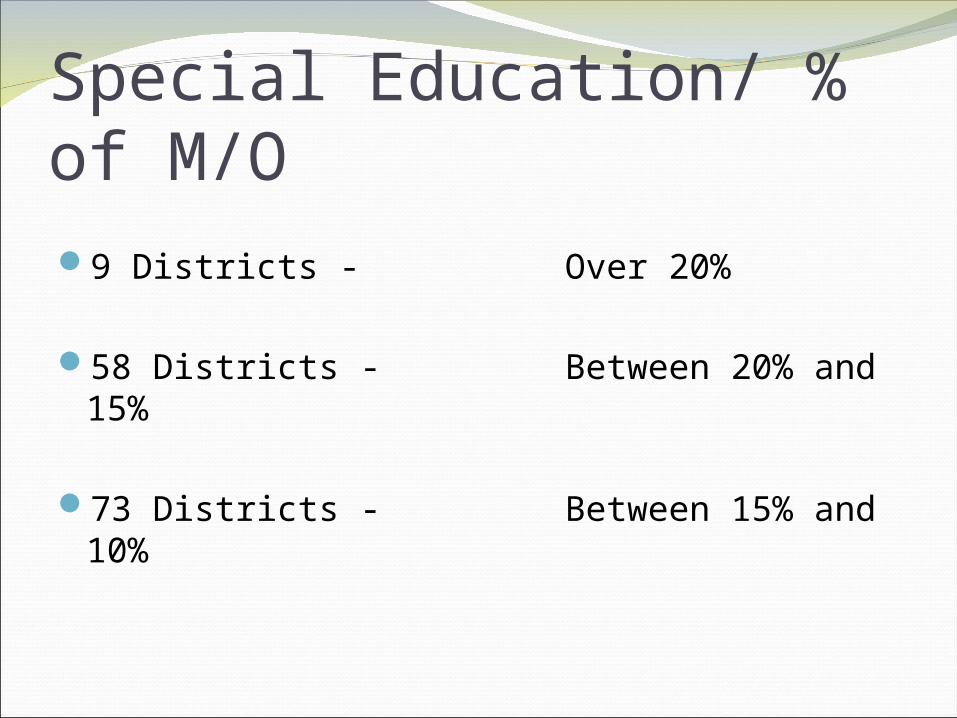
Special Education/ % of M/O9 Districts - Over 20%
58 Districts - Between 20% and 15%
73 Districts - Between 15% and 10%
Special EducationSpend more or less than other districts
More or less students that need special services
More or less expensive services
Closing Schools
Why
When
Win
CLOSEDCLOSED