aalborg universitet static capacity of laterally pre ... · to 65.000 load cycles on a monopile...
TRANSCRIPT

Aalborg Universitet
Static capacity of laterally pre-cycled monopiles in dense sand
Nicolai, Giulio; Ibsen, Lars Bo
Publication date:2016
Document VersionPublisher's PDF, also known as Version of record
Link to publication from Aalborg University
Citation for published version (APA):Nicolai, G., & Ibsen, L. B. (2016). Static capacity of laterally pre-cycled monopiles in dense sand. Aalborg:Department of Civil Engineering, Aalborg University. (DCE Technical Reports; No. 202).
General rightsCopyright and moral rights for the publications made accessible in the public portal are retained by the authors and/or other copyright ownersand it is a condition of accessing publications that users recognise and abide by the legal requirements associated with these rights.
? Users may download and print one copy of any publication from the public portal for the purpose of private study or research. ? You may not further distribute the material or use it for any profit-making activity or commercial gain ? You may freely distribute the URL identifying the publication in the public portal ?
Take down policyIf you believe that this document breaches copyright please contact us at [email protected] providing details, and we will remove access tothe work immediately and investigate your claim.
Downloaded from vbn.aau.dk on: April 30, 2017

ISSN 1901-726X DCE Technical Report No. 202
Static capacity of laterally pre-cycled monopiles in dense sand
Giulio Nicolai Lars Bo Ibsen


DCE Technical Report No. 202
Static capacity of laterally pre-cycled monopiles in dense sand
by
Giulio Nicolai Lars Bo Ibsen
March 2016
© Aalborg University
Aalborg University Department of Civil Engineering Geotechnical Engineering Group

Scientific Publications at the Department of Civil Engineering Technical Reports are published for timely dissemination of research results and scientific work carried out at the Department of Civil Engineering (DCE) at Aalborg University. This medium allows publication of more detailed explanations and results than typically allowed in scientific journals. Technical Memoranda are produced to enable the preliminary dissemination of scientific work by the personnel of the DCE where such release is deemed to be appropriate. Documents of this kind may be incomplete or temporary versions of papers—or part of continuing work. This should be kept in mind when references are given to publications of this kind. Contract Reports are produced to report scientific work carried out under contract. Publications of this kind contain confidential matter and are reserved for the sponsors and the DCE. Therefore, Contract Reports are generally not available for public circulation. Lecture Notes contain material produced by the lecturers at the DCE for educational purposes. This may be scientific notes, lecture books, example problems or manuals for laboratory work, or computer programs developed at the DCE. Theses are monograms or collections of papers published to report the scientific work carried out at the DCE to obtain a degree as either PhD or Doctor of Technology. The thesis is publicly available after the defence of the degree. Latest News is published to enable rapid communication of information about scientific work carried out at the DCE. This includes the status of research projects, developments in the laboratories, information about collaborative work and recent research results.
Published 2016 by Aalborg University Department of Civil Engineering Sofiendalsvej 9-11 DK-9200 Aalborg SV, Denmark Printed in Aalborg at Aalborg University ISSN 1901-726X DCE Technical Report No. 202

Static capacity of laterally pre-cycled monopiles in dense sand
Giulio Nicolai and Lars Bo Ibsen Department of Civil Engineering, Aalborg University
Sofiendalsvej 9, 9200 Aalborg, Denmark
Email: [email protected]
ABSTRACT
This work aims to investigate the change in static capacity of monopiles due to cyclic lateral
loading. Results from small-scale tests on a monopile model in dense saturated sand are presented.
Three series of tests were carried out to study the response of the monopile to different cyclic lateral
loading conditions. A formulation to predict the change in static capacity is proposed and applied to
confirm the tests results.
INTRODUCTION
Offshore wind power is becoming a competitive renewable energy technology, although it currently
represents a small percentage of the total wind energy capacity. There are several foundation types
for offshore wind turbines and the most common is the monopile foundation. The monopile is a
steel pile often with a diameter of 4 m to 6 m. Nowadays, the design of monopiles relies on
guidelines that are used for offshore piles supporting oil and gas facilities. Such foundations are
slender piles with a diameter of 0.5 m to 2 m. Slender piles have a flexible behavior under
horizontal loads, which is different from the stiff behavior of monopiles. Therefore, current design
methods may not capture the real response of monopiles, which is not well interpreted. Further,
offshore wind turbines are exposed to different loads than oil and gas installations. Waves and wind
induce millions of cyclic lateral loads on a monopile during its lifetime. The design approach
proposed in API (2010) and DNV (2014) involves cyclic lateral loading by reducing the ultimate
resistance of the soil-pile system with a constant factor. This reducing factor does not account for
the amplitude and direction of the cyclic loading or the number of cycles, which might differ by less
than few hundreds of cycles in the short-term to millions in the long-term. Millions of cyclic loads
induce monopiles to accumulate a rotation that might damage the turbine. Thus, further
investigations are necessary to fully understand the behavior of monopiles under cyclic lateral
loading in order to improve design guidelines.
LITERATURE REVIEW
The p-y curve method is the most common approach for predicting lateral displacements of offshore
piles subjected to lateral loads. The p-y curves represent the relationship between the soil resistance
p and the lateral displacement of the pile y, taking into account cyclic loads through a reducing
factor of p. This approach arises from studies promoted by the oil and gas industry and was
proposed by Reese et al. (1974) and O´Neill and Murchison (1983), who reported results of full-
scale tests on slender piles with no more than 100 load cycles. A review of previous works on
offshore piles was described in Long and Vanneste (1994). This work presented results of 34 field
tests with 5 to 500 load cycles, proposing to reduce the soil resistance with a power law as a
function of the number of cycles. Lin and Liao (1999) tested flexible piles with up to 100 cycles.
The work was concluded suggesting a relationship in which the lateral displacement of the pile
increases with the number of cycles through a logarithmic evolution. Peng et al. (2006), Peralta and
Achmus (2010) and LeBlanc et al. (2010) performed small-scale tests on monopiles under cyclic

lateral loading at 1g. Peng et al. (2006) showed that the lateral displacement of a monopile increases
with the frequency and the amplitude of the cyclic load. Further, the results showed that the
monopile accumulated a larger deflection when the load was between one-way and two-way
loading than two-way loading. The study presented by Peralta and Achmus (2010) showed that the
lateral displacement of piles increases with the number of cycles through a power law in rigid piles
and a logarithmic law in flexible piles. LeBlanc et al. (2010) performed a series of tests with 8.000
to 65.000 load cycles on a monopile model with a diameter of 80 mm and a penetration length of
360 mm in dry loose sand. The study was concluded proposing a method that allows to predict the
accumulated rotation of monopiles due to long-term cyclic lateral loading. The proposed
formulation relates the accumulated rotation of the monopile to the number of cycles with a power
law. This formulation also included functions that depend on the amplitude and symmetry of the
cyclic load. Further, the test results revealed that during the tests the pile stiffness was increasing
with the number of cycles. This is in contrast with the p-y method, in which a reduction of the
lateral capacity of the pile is suggested for accounting cyclic loading. Moreover, Klinkvort et al.
(2010) conducted a centrifuge study in dense sand, proving that the stiffness and static capacity of
the pile increased after applying cyclic lateral loading. Similar results were presented in other
works, with centrifuge tests in medium dense sand in Haigh (2014), and with 1g modelling in dense
sand in Nicolai and Ibsen (2014). Therefore, changes of the foundation stiffness and bearing
capacity are not properly understood and further research is necessary.
EXPERIMENTAL SETUP
The tests of the present investigation were conducted in the laboratory of geotechnical engineering
at the Aalborg University. The setup used for the tests is a 1g testing rig capable of performing
cyclic and static tests, as depicted in Figures 1 and 2. The rig consists of a steel sandbox S, a loading
frame F, a loading lever L, three weight hangers supporting three masses m1, m2 and m3, three
displacement transducers D1, D2 and D3, two load cells F1 and F2, two steel wires W1 and W2, and a
steel bar B. The sandbox is a cylindrical caisson with a height of 1.20 m and a diameter of 2.00 m,
filled with gravel for 0.30 m at the bottom and with sand for 0.90 m at the top, separated by means
of a geotextile membrane. The soil was saturated with water poured through a system of perforated
pipes placed in the gravel, which is used as a drainage material. The pipes are equally distributed in
the gravel layer in order to guarantee a uniform distribution of water in the soil. The soil sample
was saturated with a water level of 20 to 40 mm above the sand surface. The tests were conducted
with the Aalborg University Sand No. 1 (Baskarp Sand No. 15) and its properties are presented in
Table 1.
Figure 1. Sketch of the testing rig, where S, F, L and B are the sandbox, loading frame, loading
lever and steel bar, respectively. W1 and W2 are the steel wires, D1, D2, and D3 are the horizontal

displacement transducers, F1 and F2 are the load cells, m1 and m2 are the masses used to perform the
cyclic loading, and m3 is the mass to counterbalance the left side of the rig. Dimensions are in m.
Figure 2. Photograph of the experimental setup.
Table 1. Characteristics of Aalborg University Sand No. 1
Property Valu
e
Unit
%d 5050 - quantile 0.14
[mm]
1060 d/dCU 1.78 [-]
Specific grain density ds 2.64 [-]
Maximum dry unit weight,
γmax
17.0
3
[kN/m3]
Minimum dry unit weight,
γmin
14.1
9
[kN/m3]
The soil was the same among the tests and was prepared dense with a relative density of 80% to
90% by means of a standard procedure to ensure conditions of repeatability. Such procedure is
widely described in Sørensen and Ibsen (2011), Roesen et al. (2012) and Sørensen et al. (2015), and
it consists of different steps that were repeated before each test. The sand was loosened increasing
the water level by 100 mm above the soil surface with an upward hydraulic gradient of 0.9. The soil
was then compacted by introducing a vibrator rod in the sand through a wooden plate with equally
distributed holes, placed on the top of the sandbox. The soil was vibrated in established holes with a
specific order to achieve a uniform compaction of the sand. The water level was above the sand
surface to let air outside the sand during the vibration. The density of the sand was controlled by
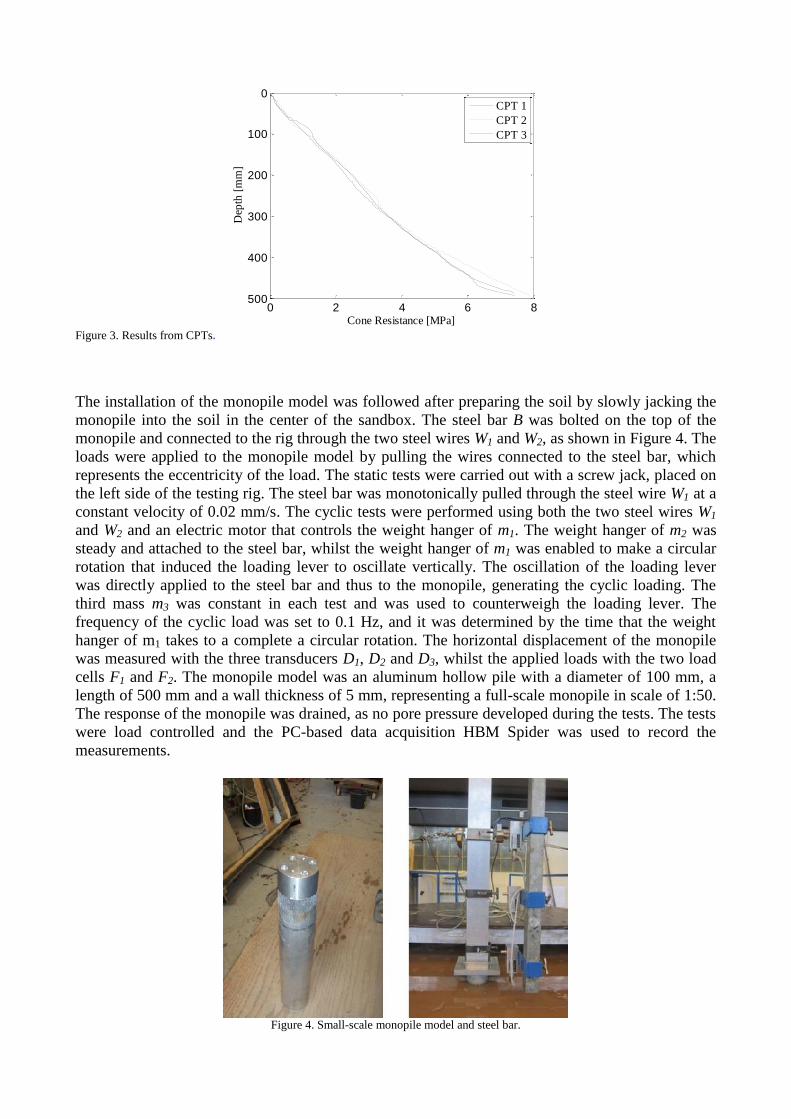
adjusting the amount of vibration. Finally, Cone Penetration Tests (CPTs) were performed along the
centerline of the sandbox to check whether the sand was consistently dense among the tests. The
relative density of the sand was calculated through the CPTs results, following the procedure
described in Ibsen et al. (2009). A plot of the CPT results is depicted in Figure 3, where the cone
resistance is shown against the penetration depth.
0 2 4 6 8
0
100
200
300
400
500
Cone Resistance [MPa]
Dep
th [
mm
]
CPT 1
CPT 2
CPT 3
Figure 3. Results from CPTs.
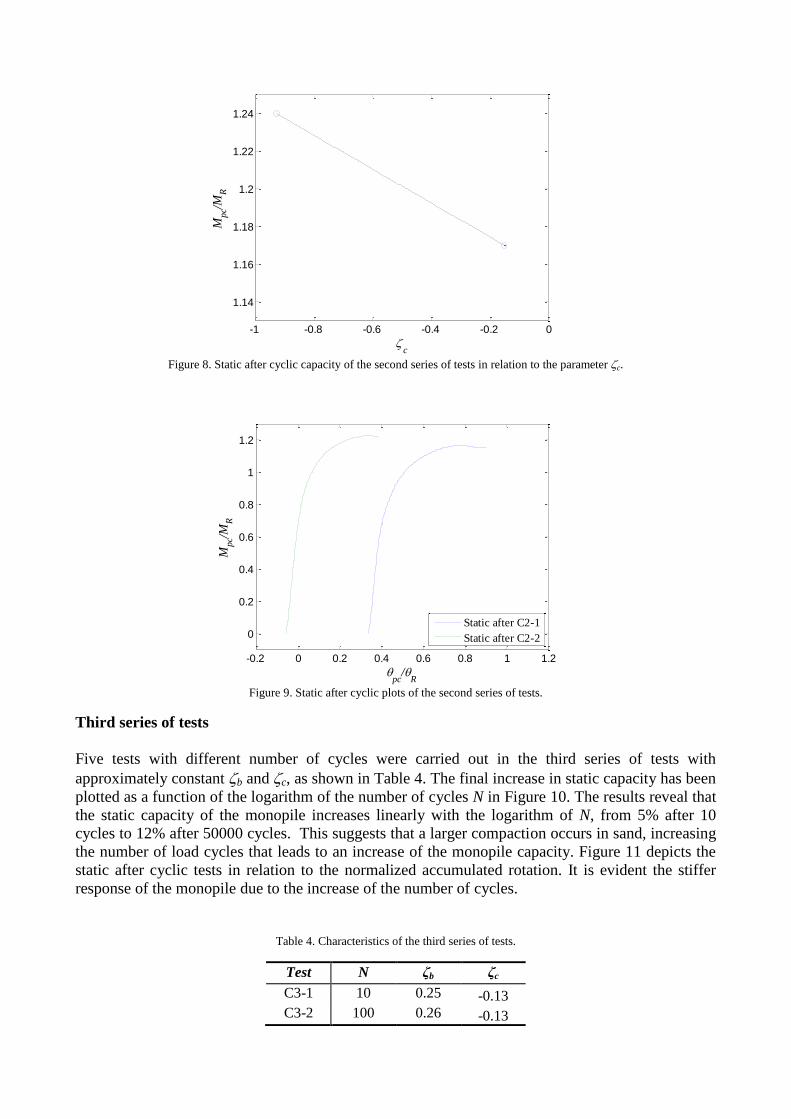
The installation of the monopile model was followed after preparing the soil by slowly jacking the
monopile into the soil in the center of the sandbox. The steel bar B was bolted on the top of the
monopile and connected to the rig through the two steel wires W1 and W2, as shown in Figure 4. The
loads were applied to the monopile model by pulling the wires connected to the steel bar, which
represents the eccentricity of the load. The static tests were carried out with a screw jack, placed on
the left side of the testing rig. The steel bar was monotonically pulled through the steel wire W1 at a
constant velocity of 0.02 mm/s. The cyclic tests were performed using both the two steel wires W1
and W2 and an electric motor that controls the weight hanger of m1. The weight hanger of m2 was
steady and attached to the steel bar, whilst the weight hanger of m1 was enabled to make a circular
rotation that induced the loading lever to oscillate vertically. The oscillation of the loading lever
was directly applied to the steel bar and thus to the monopile, generating the cyclic loading. The
third mass m3 was constant in each test and was used to counterweigh the loading lever. The
frequency of the cyclic load was set to 0.1 Hz, and it was determined by the time that the weight
hanger of m1 takes to a complete a circular rotation. The horizontal displacement of the monopile
was measured with the three transducers D1, D2 and D3, whilst the applied loads with the two load
cells F1 and F2. The monopile model was an aluminum hollow pile with a diameter of 100 mm, a
length of 500 mm and a wall thickness of 5 mm, representing a full-scale monopile in scale of 1:50.
The response of the monopile was drained, as no pore pressure developed during the tests. The tests
were load controlled and the PC-based data acquisition HBM Spider was used to record the
measurements.
Figure 4. Small-scale monopile model and steel bar.

Methodology
Two non-dimensional parameters are used to describe the characteristics of the cyclic loads, which
were originally introduced in LeBlanc et al. (2010),
R
maxb
M
M (1)
max
minc
M
M (2)
where Mmin and Mmax are the minimum and maximum moments in a cyclic test and MR is the static
capacity of the pile. The parameter b represents the amplitude of the load, whilst c is related to the
symmetry of the cyclic loading. The parameter c is defined such that is equal to 0 for one-way
loading and to -1 for two-way loading, as depicted in Figure 5.
Figure 5. Cyclic loading configurations (from LeBlanc et al. 2010).
TEST RESULTS
Testing program
Three series of tests were carried out in the present work, investigating the influence that the non-
dimensional parameters b, c and the number of cycles N have on the monopile static capacity.
Every series was performed keeping constant each parameter within the tests, except the parameter
that was investigated. The tests were carried out mainly with several thousands of cycles in order to
represent the long-term response, but also the behavior of the monopile at short-term was studied by
analyzing tests of 10 to 100 cycles. The effects of the cyclic loads on the monopile behavior were
evaluated by determining the static capacity at the end of each cyclic test. The static after cyclic
capacity Mpc and the corresponding rotation θpc were then analyzed in relation to the static capacity
without pre-cycling the monopile MR and the corresponding rotation θR.
First series of tests
The first series of tests was performed to evaluate the influence of b on the static capacity of the
monopile.
Three tests with 10000 load cycles were carried with c approximately constant and b varying, as
shown in Table 2. The final results of the tests have been plotted in Figure 6, where it is shown that
M
M R
0
c =0.0
0.25
b =
0.5
0.75
1.0
b =0.5
0.5
0.0
c = - 0.5
- 1.0

the capacity of the monopile is increased by 10% to 20% after the cyclic tests in relation to b. The
plot shows that the test results can be fitted with a straight line that increases proportionally to b.
This means that the amplitude of the cyclic loading clearly affects the static after cyclic capacity of
the monopile. The increase of capacity is due to a compaction of the sand, which is induced by the
cyclic lateral loading. The observed results of Figure 6 indicate that a higher intensity of the cyclic
load cause a larger compaction of the sand around the monopile that enhances the resistance of the
soil. Note that the straight line in Figure 6 has been evaluated to achieve Mpc / MR =1 for b = 0, as
no cyclic load would be applied in this case.
The results of the tests in relation to the normalized rotation have been plotted in Figure 7. Note that
the different accumulated rotation, due to the cyclic tests, makes the static after cyclic curves have
different initial positions. It is evident that the slope of the curves is larger from the test C1-1 to C1-
3, indicating that there is an increase of rotational stiffness of the soil for increasing b.
Table 2. Characteristics of the first series of tests.
Test N ζb ζc
C1-1 10055 0.25 -0.14
C1-2 10012 0.31 -0.13
C1-3 10029 0.37 -0.12
0 0.05 0.1 0.15 0.2 0.25 0.3 0.35 0.40.95
1
1.05
1.1
1.15
b
Mp
c/MR
Figure 6. Static after cyclic capacity of the first series of tests in relation to the parameter b.

0.2 0.4 0.6 0.8 1 1.2
0
0.2
0.4
0.6
0.8
1
Mp
c/MR
pc
/R
Static after C1-1
Static after C1-2
Static after C1-3
Figure 7. Static after cyclic plots of the first series of tests.
Second series of tests
The purpose of second series of tests was to investigate the variation of the monopile static after
cyclic capacity as a function of the symmetry of the cyclic load, i.e. c. Two tests with
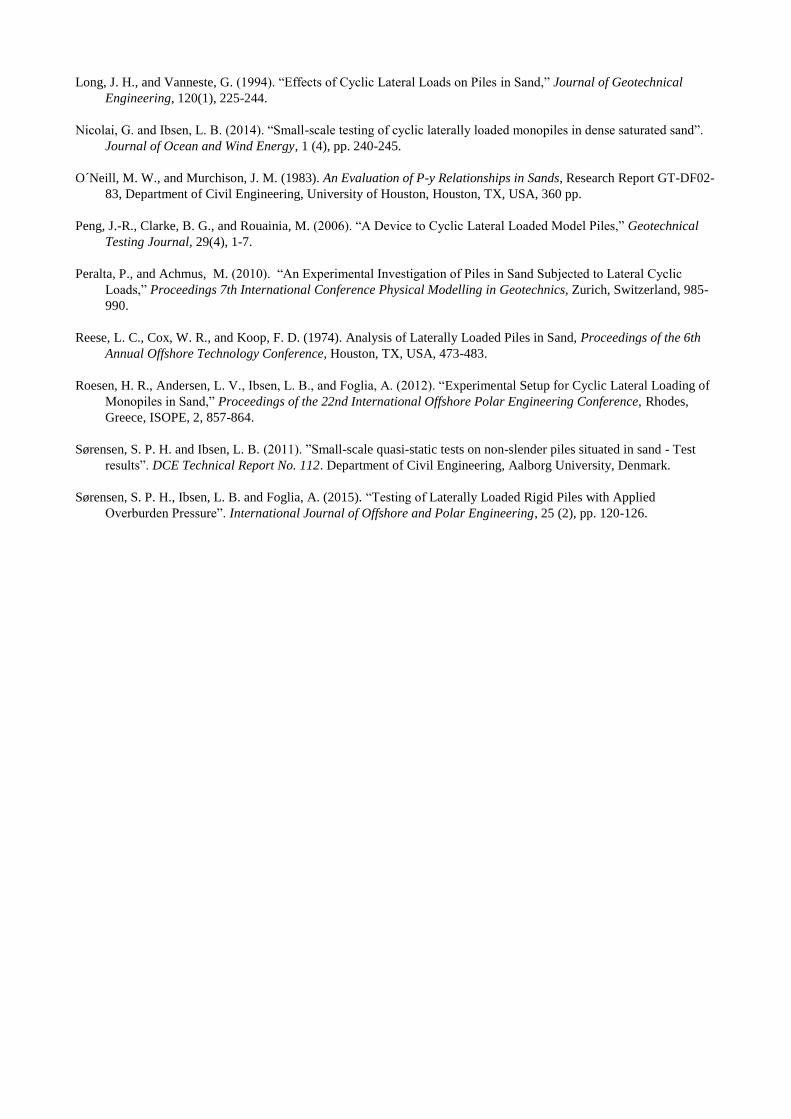
approximately constant b and different c were performed, as summarized in Table 3. Figures 8
and 9 depict the static after cyclic capacity as a function of c and in relation to the normalized
accumulated rotation. The plots show that a larger increase in capacity occurs after two-way loading
than one-way loading. This means that a larger movement of the soil, due to the reverse loading,
induces to increase the sand compaction and consequently the monopile capacity. Note that a
negative accumulated rotation of the monopile is reached at the end of the test C2-3. A similar
result was reported by Klinkvort and Hededal (2013), which conducted a centrifuge study on a
monopile under cyclic lateral loading in dense sand, showing that the monopile accumulated a
negative deflection under two-way loading. The conclusion of the work was that the reversing
displacement of the monopile was due to the high density of the sand. Further, Figures 7 shows that
the increase in static capacity due to cyclic loading is proportional to the rotation accumulated at the
end of the cyclic tests. This might suggest that the increase in static capacity is due to the
accumulated rotation reached after cyclic loading. In contrast, Figure 9 shows that the increase of
capacity is larger after the test C2-2 although the accumulated rotation after the cyclic test was less
than in the test C2-1. This proves that the increase of the monopile capacity is mostly affected by
the reverse loading during a two-way cyclic test than the accumulated rotation.
Table 3. Characteristics of the second series of tests.
Test N ζb ζc
C2-1 50810 0.32 -0.15
C2-2 50466 0.33 -0.95
-1 -0.8 -0.6 -0.4 -0.2 0
1.14
1.16
1.18
1.2
1.22
1.24
Mp
c/MR
c
Figure 8. Static after cyclic capacity of the second series of tests in relation to the parameter c.
-0.2 0 0.2 0.4 0.6 0.8 1 1.2
0
0.2
0.4
0.6
0.8
1
1.2
Mp
c/MR
pc
/R
Static after C2-1
Static after C2-2
Figure 9. Static after cyclic plots of the second series of tests.
Third series of tests
Five tests with different number of cycles were carried out in the third series of tests with
approximately constant b and c, as shown in Table 4. The final increase in static capacity has been
plotted as a function of the logarithm of the number of cycles N in Figure 10. The results reveal that
the static capacity of the monopile increases linearly with the logarithm of N, from 5% after 10
cycles to 12% after 50000 cycles. This suggests that a larger compaction occurs in sand, increasing
the number of load cycles that leads to an increase of the monopile capacity. Figure 11 depicts the
static after cyclic tests in relation to the normalized accumulated rotation. It is evident the stiffer
response of the monopile due to the increase of the number of cycles.
Table 4. Characteristics of the third series of tests.
Test N ζb ζc
C3-1 10 0.25 -0.13
C3-2 100 0.26 -0.13

C3-3 917 0.27 -0.05
C3-4 10055 0.25 -0.14
C3-5 50069 0.26 -0.10
100
101
102
103
104
105
1.02
1.04
1.06
1.08
1.1
1.12
1.14
1.16
Mp
c/MR
N Figure 10. Static after cyclic capacity of the third series of tests in relation to the number of cycles N.
0 0.5 1 1.5
0
0.2
0.4
0.6
0.8
1
Mp
c/MR
pc
/R
Static after C3-1
Static after C3-2
Static after C3-3
Static after C3-4
Static after C3-5
Figure 11. Static after cyclic plots of the third series of tests.
ANALYSIS
The observed results of this work suggest that the three parameters b, c and the number of cycles
N have a clear influence on the variation in static capacity of the monopile. It is shown that the
static capacity increases with the number of cycles, with the amplitude of the cyclic loading and
from one-way to two-way loading. Based on the results shown in the present investigation, the
increase in static capacity of the monopile due to cyclic lateral loading may be evaluated as
ccbbN
R
pcMMNM
M
MM̂ 1 (3)

where MN(N), Mb(b) and Mc(c) are non-dimensional functions that depend respectively on N, b
and c. The functions Mb and Mc represent the effects of the amplitude and symmetry of the cyclic
loading on the monopile capacity and can be determined as
bbbb mM (4)
cc
ccc
mM 1 (5)
where mb and mc represent the slope of the curves that fit the data shown respectively in Figures 6
and 8, and c is a calibration factor. The parameter c is necessary to achieve results independent of
the parameters b that were used in the tests for determining mc, and can be evaluated as
221 nMmc N,bb (6)
in which b,2 is the average of the parameters b that were used to perform the second series of tests
and n2 is the average of the number of cycles of the second series of tests. MN is the function that
relates the variation in static capacity with the number of cycles of the cyclic test and is determined
as
1nln
NlnNM N (7)
where n1 is the average of the number of cycles of the first series of tests. Note that the formulation
proposed in Equation (4) is valid for a value of b > 0 such that the monopile is moving under cyclic
lateral loading. The effect of the cyclic loading symmetry is considered as a contribute that is zero
for one-way loading and is positive for c < 0, which is added to the increase in static capacity due
to b. Further, it should be noted that no tests with less than ten cycles were performed and therefore
Equation (4) is valid for N 10. Indeed, the first cyclic loads have a larger influence on the soil
particles, and thus a non-linear increase in static capacity may be expected.
Discussion
The presented method allows to predict the variation of the monopile static capacity due to cyclic
lateral loading, having in input b, c and N. Table 5 reports a comparison between the results from
the present investigation and the predicted values with Equation (4), in which the variation M̂
represents the variation between the real increase in static capacity achieved in the presented tests
realM̂ and the value predicted with Equation (4) predictedM̂ , as shown in Equation (8). Note that the
predicted results in Table 5 are determined with mb = 0.4 and mc = 0.07, which arise from the results
of the present investigation. The observed results of Table 5 show that the difference between real
and predicted results is zero in most of the tests, with a largest discrepancy of 1.7% to 1.9% in the
tests C1-3 and C3-1, respectively.
Table 5. Comparison between the real and predicted variation is static capacity of the monopile due to cyclic lateral loading.
Test C1-1 C1-2 C1-3 C2-1 C2-2 C3-1 C3-2 C3-3 C3-4 C3-5
realM̂ 1.11 1.12 1.18 1.16 1.23 1.05 1.06 1.07 1.11 1.12
predictedM̂ 1.11 1.13 1.16 1.16 1.23 1.03 1.06 1.08 1.11 1.13
M̂ 0 -0.9% 1.7% 0 0 1.9% 0 0.9% 0 -0.9%

real
predictedreal
M̂
M̂M̂M̂
(8)
CONCLUSIONS
The present work presents results from three series of laboratory tests on a monopile model to
evaluate the influence of cyclic lateral loading on the monopile behavior. Static tests were carried
out after applying cyclic loads with different loading conditions. The observed results showed a
clear relationship between the amplitude, symmetry and number of cycles of the cyclic load with
the variation in static capacity. The static capacity of the pile increased with the amplitude of the
cyclic load and with the logarithm of the number of cycles. Further, it was shown that such an
increase was larger after a cyclic test with two-way than one-way loading. The work was concluded
proposing a method to evaluate the variation in static capacity of the monopile due to cyclic lateral
loading. Moreover, this method was applied to the results of the present investigation, showing a
reliable prediction.
ACKNOWLEDGMENTS
This research is associated with the EUDP program “Monopile cost reduction and demonstration by
joint applied research” funded by the Danish Energy Agency. The financial support is sincerely
acknowledged.
REFERENCES
API (2010). Recommended Practice for Planning, Designing and Constructing Fixed Offshore Platforms-Working
Stress Design, RP 2A-WSD, 21st edition, American Petroleum Institute.
DNV (2014). “Offshore standard DNV-OS-J101: Design of offshore wind turbine structures”. Technical report DNV-
OS-J101”, Det Norske Veritas.
Haigh, S. K. (2014).“Foundations for offshore wind turbines”. Proceedings of the 8th international conference Physical
Modelling in Geotechnics. Perth, Australia.
Ibsen, L. B., Hanson, M. Hjort, T. and Taarup, M. (2009).
“MC-parameter Calibration of Baskarp Sand No. 15”. DCE Technical Report No. 62. Department of Civil
Engineering, Aalborg University, Denmark.
Klinkvort, R. T., Leth., C. T., Hededal, O. (2010). Centrifuge modelling of a laterally cyclic loaded pile. Proceedings of
the 7th International Conference on Physical Modelling in Geotechnics, Zurich, Switzerland, pp. 959-964.
Klinkvort, R. T. and Hededal, O. (2013). Lateral response of monopile supporting an offshore wind turbine .
Proceedings of the Institution of Civil Engineers, Geotechnical Engineering, Vol. 166, No. GE2, pp. 147-158.
LeBlanc, C., Houlsby, G., and Byrne, B. (2010). “Response of Stiff Piles in Sand to Long-term Cyclic Lateral
Loading,” Géotechnique, 60(2), 79-90.
Lin, S-S, and Liao, J. C. (1999). “Permanent Strains of Piles in Sand due to Cyclic Lateral Loads,” Journal of
Geotechnical and Geoenvironmental Engineering, 125(9), 789-802.
Long, J. H., and Vanneste, G. (1994). “Effects of Cyclic Lateral Loads on Piles in Sand,” Journal of Geotechnical
Engineering, 120(1), 225-244.
Nicolai, G. and Ibsen, L. B. (2014). “Small-scale testing of cyclic laterally loaded monopiles in dense saturated sand”.
Journal of Ocean and Wind Energy, 1 (4), pp. 240-245.
O´Neill, M. W., and Murchison, J. M. (1983). An Evaluation of P-y Relationships in Sands, Research Report GT-DF02-
83, Department of Civil Engineering, University of Houston, Houston, TX, USA, 360 pp.
Peng, J.-R., Clarke, B. G., and Rouainia, M. (2006). “A Device to Cyclic Lateral Loaded Model Piles,” Geotechnical
Testing Journal, 29(4), 1-7.
Peralta, P., and Achmus, M. (2010). “An Experimental Investigation of Piles in Sand Subjected to Lateral Cyclic
Loads,” Proceedings 7th International Conference Physical Modelling in Geotechnics, Zurich, Switzerland, 985-
990.
Reese, L. C., Cox, W. R., and Koop, F. D. (1974). Analysis of Laterally Loaded Piles in Sand, Proceedings of the 6th
Annual Offshore Technology Conference, Houston, TX, USA, 473-483.
Roesen, H. R., Andersen, L. V., Ibsen, L. B., and Foglia, A. (2012). “Experimental Setup for Cyclic Lateral Loading of
Monopiles in Sand,” Proceedings of the 22nd International Offshore Polar Engineering Conference, Rhodes,
Greece, ISOPE, 2, 857-864.
Sørensen, S. P. H. and Ibsen, L. B. (2011). ”Small-scale quasi-static tests on non-slender piles situated in sand - Test
results”. DCE Technical Report No. 112. Department of Civil Engineering, Aalborg University, Denmark.
Sørensen, S. P. H., Ibsen, L. B. and Foglia, A. (2015). “Testing of Laterally Loaded Rigid Piles with Applied
Overburden Pressure”. International Journal of Offshore and Polar Engineering, 25 (2), pp. 120-126.

ISSN 1901-726X DCE Technical Report No. 202