aalborg trafikdage 24.08 · aalborg trafikdage 24.08.2010 longitudinal analysis of young danes...
TRANSCRIPT
Aalborg trafikdage 24.08.2010
Longitudinal analysis of young Danes travel pattern.
Sigrun Birna Sigurdardottir PhD student, DTU Transport.

2 DTU Transport, Technical University of Denmark
Background
•Limited literature regarding models or factors influencing the transport behaviour of young adults in their transitional stage to adulthood
•Statistically young adults as an age group usually range to the age of 24 and are then considered adults
•Lack of scrutinizing differences in young adults transport mode choice and explaining the difference
•Lack of employing national travel surveys for these purposes

3 DTU Transport, Technical University of Denmark
Aim
•To scrutinize change over time regarding mode choice for each gender aging 16-34 years old and furthermore to examine the demographical factors influencing these individuals choice
•To analyse the interaction between age, gender and year in relation to length travelled, time travelled and number of trips taken
4 DTU Transport, Technical University of Denmark
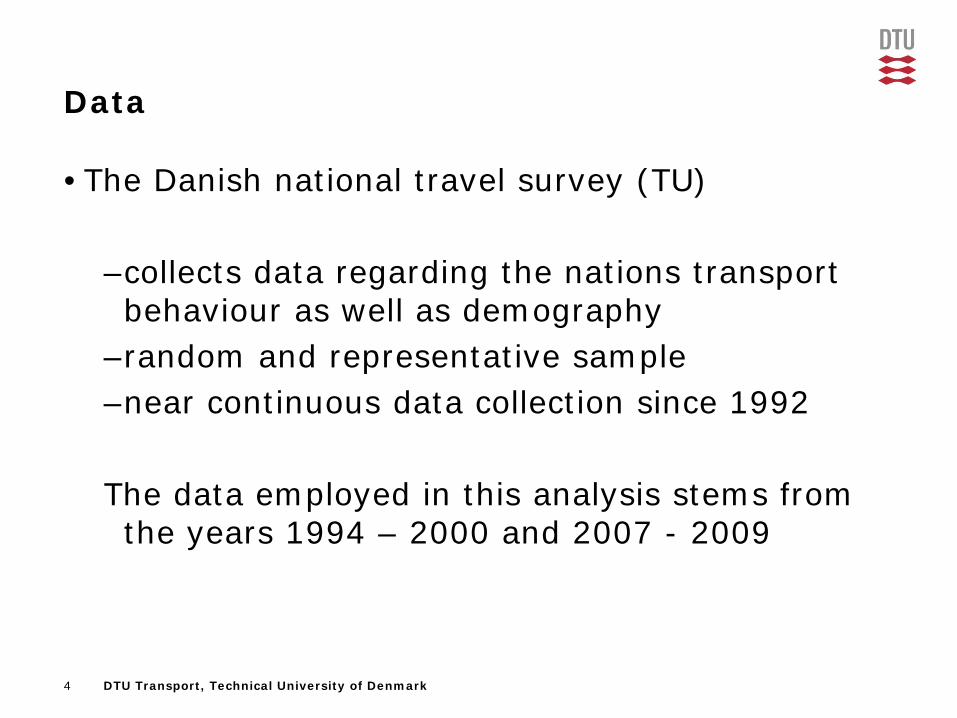
Data
•The Danish national travel survey (TU)
–collects data regarding the nations transport behaviour as well as demography
–random and representative sample –near continuous data collection since 1992
The data employed in this analysis stems from the years 1994 – 2000 and 2007 - 2009

5 DTU Transport, Technical University of Denmark
Sample
•Age and gender
–individuals aging between 16 to 34 years old of both genders. Participants were divided into four groups after age; 16-19, 20-24, 25-29 and 30-34 years old

6 DTU Transport, Technical University of Denmark
16-19 year old

7 DTU Transport, Technical University of Denmark
20-24 year old

8 DTU Transport, Technical University of Denmark
25-29 years old

9 DTU Transport, Technical University of Denmark
30-34 years old

10 DTU Transport, Technical University of Denmark
Time trends: Mode
Table 1. Spearman’s correlation coefficient for mode choice after years for each age and gender.
Car Walk Biking MC PT16-19 males .035* .083** -.075** -.020 -.00716-19 females .074** .057** -.033* .010 -.068**
20-24 males -.031* .079** -.007 .004 -.01720-24 females -.014 .043** .006 -.005 -.00825-29 males -.070** .074** .035* .017 -.01425-29 females -.026 .051** .033* .016 -.02330-34 males -.023 .044** .012 -.003 -.02030-34 females .018 .048** -.013 -.049** -.040**
Partial correlation -.009 .049** -.011* -.003 -.024**

11 DTU Transport, Technical University of Denmark
Multinomial logistic regression
•Multinomial logit regression (MLR) analysis was employed to reveal the relationship behind mode choice and various demographical variables
•Dependent variable: mode choice (walk, bike, PT, MC, car)
•Reference for each mode was all other modes combined

12 DTU Transport, Technical University of Denmark
Indipendent variables – demography
–Age and gender–Occupation–Education–Address density–Personal income–Position in family–Nucl. family type–Number of persons in household
–Public transport season card
–Bike ownership–Driving licence –Number of driving licence in houshold
–Number of cars in houshold
–House, own-rent or partownership (andelsbolig)

13 DTU Transport, Technical University of Denmark
The car user•Higher income•Driving licence•Position in family: Couples or singles, seldom child•Not likely to possess a public transport season ticket•More likely to be employed instead of student or unemployed
•Mainly comes from low density areas, the denser the living area the less likely on is to drive
•Less likely to own a bike•Homeowner instead of cooperative apartment owner (andels bolig) and least likely to rent
•Children in families, both couples and single parent homes
•Positively related to higher number of cars in household
14 DTU Transport, Technical University of Denmark
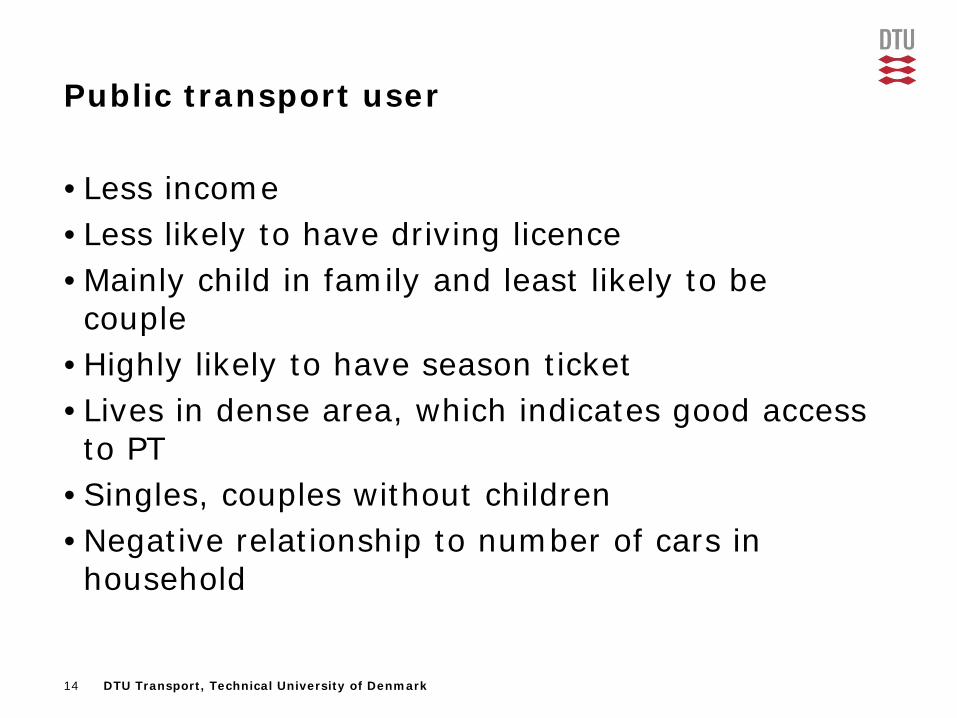
Public transport user
•Less income•Less likely to have driving licence•Mainly child in family and least likely to be couple
•Highly likely to have season ticket•Lives in dense area, which indicates good access to PT
•Singles, couples without children•Negative relationship to number of cars in household

15 DTU Transport, Technical University of Denmark
Bicycle user• Lower income • Less likely to have driving licence• No season ticket • Mainly students but also positively correlated to working • Young individuals are the primary users• Primarily individuals from cities and dense areas• Educational background is likely to be from elementary
school, gymnasium students, and longer university education, least likely to be vocational education
• Owns a bike• Family type is highly likely to be singles, then couples
and singles with children • Fewer cars in households• Positively correlated to households where more
individuals have driving licence
16 DTU Transport, Technical University of Denmark
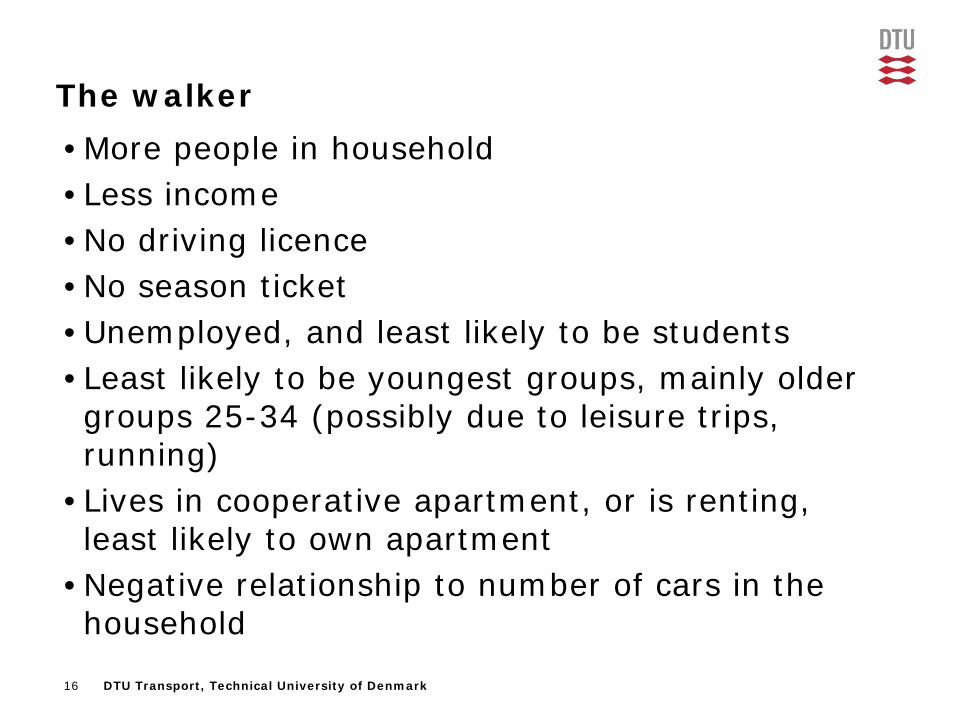
•More people in household•Less income•No driving licence •No season ticket•Unemployed, and least likely to be students•Least likely to be youngest groups, mainly older groups 25-34 (possibly due to leisure trips, running)
•Lives in cooperative apartment, or is renting, least likely to own apartment
•Negative relationship to number of cars in the household
The walker

17 DTU Transport, Technical University of Denmark
The motorcyclist and moped user
•Not likely to have driving licence•No season ticket•Primarily males•Education background; primarily from elementary
school and vocational education, less likely as the education level rises
•Less likely to own a bicycle •Positively related to increasing number of driving
licence in the family

18 DTU Transport, Technical University of Denmark
Conclusion - mode analysis•There are evidence indicating that mode choice has changed over time for the presented sample –Car use is increasing for the youngest group but decreasing for others, however the oldest females show a slow upward trend (but not significant) to car use
–Walking is increasing, however the reason for this phenomenon could be traced to better data collection over time
–Biking is decreasing for the youngest group, but increasing for both genders aging 25-29
–MC and mopeds are a difficult group to generalize about, however this transport mode is still most used by the youngest males
–PT use is declining for all ages, however less dramatically for males than females

19 DTU Transport, Technical University of Denmark
MANOVA
•Performed to find significant differnance over time on the variables: length of travel, time travelled and number of trips
•There was a significant multivariate effect in relation to year, age, gender and the interaction of age and gender on all multivariate tests except for year regarding length of travel.

20 DTU Transport, Technical University of Denmark
Length of travel

21 DTU Transport, Technical University of Denmark
Time travelled

22 DTU Transport, Technical University of Denmark
Number of trips
23 DTU Transport, Technical University of Denmark
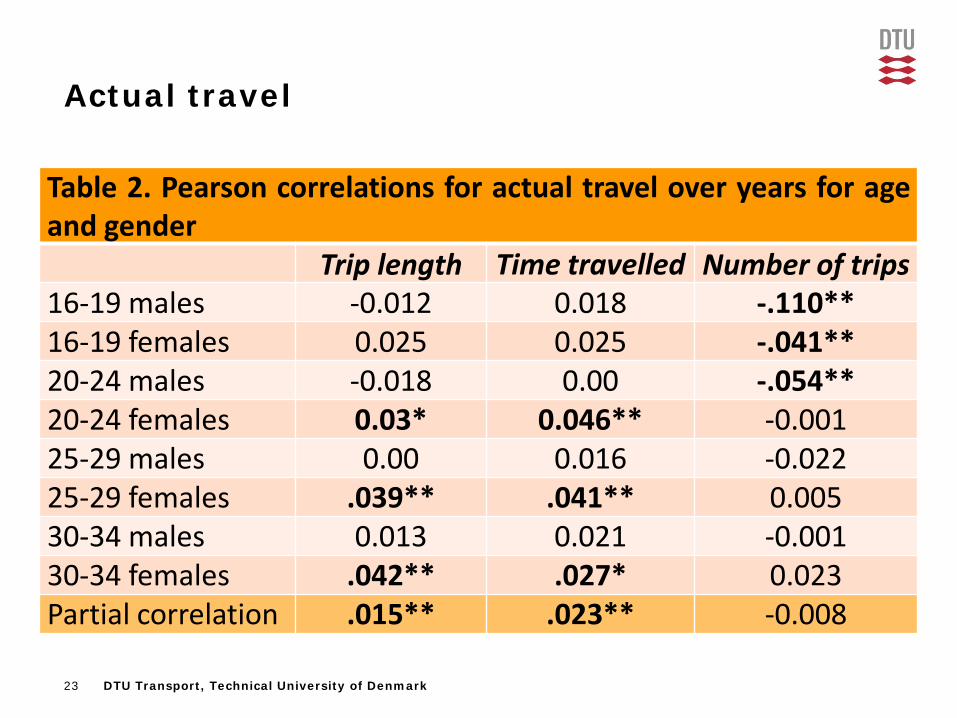
Actual travel
Table 2. Pearson correlations for actual travel over years for ageand gender
Trip length Time travelled Number of trips16-19 males -0.012 0.018 -.110**16-19 females 0.025 0.025 -.041**20-24 males -0.018 0.00 -.054**20-24 females 0.03* 0.046** -0.00125-29 males 0.00 0.016 -0.02225-29 females .039** .041** 0.00530-34 males 0.013 0.021 -0.00130-34 females .042** .027* 0.023Partial correlation .015** .023** -0.008

24 DTU Transport, Technical University of Denmark
Conclusion•Manova establishes significant difference between the groups and within the groups
•Time (independently) was only significant for time travelled and number of trips taken
•Profiling the age and gender of the “high mobile” individual and “low mobile” individual possible
•Correlation indicates that females of all ages are increasing the length of travel over time for and the youngest females are as well increasing number of trips
•Females are “catching up”•Partial correlation shows positive increase over time regarding trip length
25 DTU Transport, Technical University of Denmark
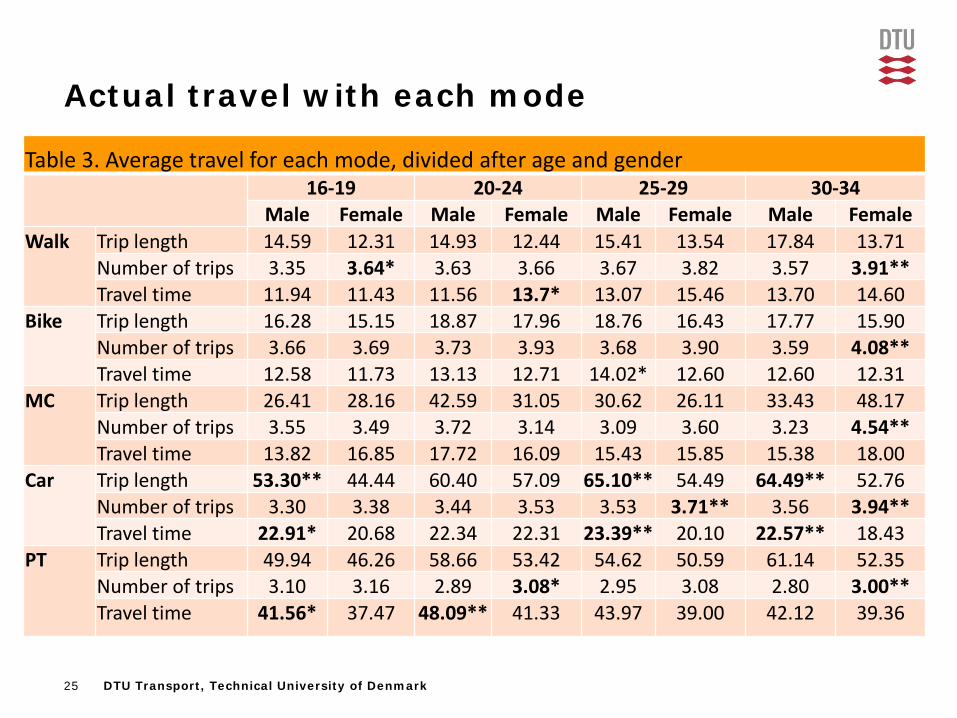
Actual travel with each mode
Table 3. Average travel for each mode, divided after age and gender16-19 20-24 25-29 30-34
Male Female Male Female Male Female Male FemaleWalk Trip length 14.59 12.31 14.93 12.44 15.41 13.54 17.84 13.71
Number of trips 3.35 3.64* 3.63 3.66 3.67 3.82 3.57 3.91**Travel time 11.94 11.43 11.56 13.7* 13.07 15.46 13.70 14.60
Bike Trip length 16.28 15.15 18.87 17.96 18.76 16.43 17.77 15.90Number of trips 3.66 3.69 3.73 3.93 3.68 3.90 3.59 4.08**Travel time 12.58 11.73 13.13 12.71 14.02* 12.60 12.60 12.31
MC Trip length 26.41 28.16 42.59 31.05 30.62 26.11 33.43 48.17Number of trips 3.55 3.49 3.72 3.14 3.09 3.60 3.23 4.54**Travel time 13.82 16.85 17.72 16.09 15.43 15.85 15.38 18.00
Car Trip length 53.30** 44.44 60.40 57.09 65.10** 54.49 64.49** 52.76Number of trips 3.30 3.38 3.44 3.53 3.53 3.71** 3.56 3.94**Travel time 22.91* 20.68 22.34 22.31 23.39** 20.10 22.57** 18.43
PT Trip length 49.94 46.26 58.66 53.42 54.62 50.59 61.14 52.35Number of trips 3.10 3.16 2.89 3.08* 2.95 3.08 2.80 3.00**Travel time 41.56* 37.47 48.09** 41.33 43.97 39.00 42.12 39.36
26 DTU Transport, Technical University of Denmark
Conclusion •Confirming
– Group difference excists across age and gender but also within over time
– Profiles of the main mode user (demography)– Profiles of the high and low mobile individual– Gender differences regarding actual travel
•MLR results useful in order to predict for mode choice in changing demographical setting
•Indicating the need for scrutinizing the factors influencing the change in travel pattern for the ages and genders
•Foundation for cohort analysis