aaaannual infocomm and transport statistical bulletin
TRANSCRIPT

Annual Info-Comm and Transport Statistical Bulletin
(2nd
Edition-March, 2011)
Ministry of Information and Communications
Royal Government of Bhutan

1
Foreword
The Ministry of Information and Communications (MoIC) is happy to share the second edition
of the Annual InfoComm and Transport Statistical Bulletin 2011.
This Bulletin is designed to provide statistical information and related data on ICT, Media,
Surface Transport and Civil Aviation sectors in the country. The information has been compiled
from various sources and MoIC wishes to thank all the agencies for their cooperation. It has been
formatted for easy reference and understanding and the information may be used freely. We will
make every effort to ensure consistency of the figures with the Statistical Yearbook of Bhutan.
MoIC will post this information online, without a printed edition and we welcome feedback and
suggestions on the content or design of this bulletin from our partner agencies and users.
TASHI DELEK.
Kinley Dorji
Secretary,
Ministry of Information and Communications

2
Table of Contents
1. Introduction 3
2. Mandate of MoIC 3
3. About the Annual InfoComm and Transport Statistical Bulletin 4
4. Summary of MoIC Indicators 5-6
Chapter 1- Information Society
1.1. ICT and Telecommunication Development 7
1.2. ICT uptake in Bhutan 8-9
1.3. Fixed Line Telephony 10-12
1.4. Mobile Cellular Telephony 12-15
1.5. Internet Services 16-18
1.6. Cost of accessing Fixed Broadband, 3G,EDGE, GPRS, Dial up,
and Mobile cellular services 19-20
1.7. Media Profile 21
Chapter 2: Aviation and Surface Transport Services
1. Aviation Sector 22-24
2. Surface Transport 25
2.1. Trend in vehicle growth 25-26
2.2. Ownership Pattern 26-28
2.3. Vehicle by Type and Ownership 28-31
2.4. Motor vehicle crash data 32
2.5. Causes of Motor vehicle crashes 33
2.6. Other important data 34
2.7. Vehicle imported as of June, 2010 34-37

3
1. Introduction
The Ministry of Communications was bifurcated in July 2003 into two Ministries - the
Ministry of Information and Communications (MoIC) and the Ministry of Works and
Human Settlements. The creation of the Ministry of Information and Communications was
aimed at focusing on the development of the Information and Communication Technology
(ICT), Information & Media, Surface Transport and Civil Aviation sectors.
MoIC will continue its efforts to collect and disseminate reliable and up-to date data through
the publication of Statistical Bulletin on an annual basis for all users to access the latest
information.
2. Mandate of MoIC
MoIC is mandated with the following responsibilities:
Development of an efficient and reliable information and communication system to
transform Bhutan to an information society
Promotion of ICT in the country as an enabler of national development
Development of safe and progressive national surface transport system
Development of a safe and sustainable civil aviation sector of international standards that
meets the national needs
In discharging the above mandates, MoIC is designated as the lead Government agency in
Bhutan for formulation and implementation of policies, drafting of legislation, assist and
facilitate in executing the development programs, and acting on behalf of the Royal
Government, on matters related to ICT, Media, Surface Transport and Civil Aviation.

4
3. About the Annual Info-Comm. and Transport Statistical Bulletin
The Annual Info-Comm. and Transport Statistical Bulletin, the 2nd
report after the
establishment of the Ministry of Information & Communications in 2003, is aimed at
disseminating reliable information covering ICT, Media, Surface Transport and Civil
Aviation sectors. We hope that the information provided in this publication will prove
useful for use by Government agencies, general public, development partners, training
institutions and schools.
The data in this report was collected and compiled by the Policy and Planning Division of
MoIC with support from the Departments/Corporations/Private Sector agencies such as
the Department of Information Technology & Telecom (DITT), Department of
Information & Media (DoIM), Department of Civil Aviation (DCA), Road Safety and
Transport Authority (RSTA), Bhutan Telecom Limited (BTL), Tashi Info-Comm. Limited
(TICL), etc as the direct source of these information concerning their respective areas.
The information bulletin has been prepared based on 2010 data collected until December
2010, and therefore, valid as of that year. Although an attempt has also been made to
provide detailed statistical information keeping most parameters into account, MoIC will
continue its endeavor to improve and include missing or inadequate information in
subsequent publications.
This bulletin is divided into two chapters. Chapter one provides information on
information society which broadly encompasses ICT, information and media sectors.
Chapter two deals with transportation, focusing on civil aviation and surface transport
activities.

5
Summary of MoIC Indicators:
Sector Data (as of December 2010)
ICT:
Internet Subscribers
Fixed line telephone subscribers
No. of Dzongkhag HQ’s with fixed line
connections
No. of Geog HQ’s with access to Fixed
line
Mobile cellular subscribers
No. of Dzongkhag HQ’s with Mobile
network
No. of Geog HQ’s with access to
Mobile network
% of Population covered by Mobile
network
94,285 ( 18542 in 2009)-> 408% increase
26,292 (26,348 in 2009)- decreased by 2%
All 20 Dzongkhags
197 out of 205
394,316 (327,052 in 2009)- 20.6% increase
All 20
200 Geogs out of 205
56.7% of the total population,2010
Media:
Television Stations
Radio Stations
No. of newspapers
1
6
7 ( 2 daily, 5 weekly)- 1 more exclusive

6
Note: For passenger movement and revenue, the data collected are on financial basis i.e. July-
June period.
Dzongkha newspaper started publication from
19th
February 2011.
Aviaton:
Domestic Airports
International Airports
No. of Airlines operating
Air services
3 under construction
1
2
8 routes in 4 countries + Myanmar
Surface Transport:
Vehicle Number as of December 2010
Passenger Movement through public
buses (excluding city buses)
No. of Passenger Transport buses in use
Revenue collected
53,382
921,628 (587,354 in 2009)- 57% increase
185 (160 in 2008-09)-15% incease
Nu.173.180 m (2009-10)-16% increase from
2008-2009 Financial year.

7
Chapter 1 – Information Society
This chapter deals with basic information relating to information and communication
technology such as telecommunication services, Internet, Mobile services and Media.
1.1. ICT and Telecommunication Development
In the last decade, Asia and Pacific region as a whole has experienced continuous ICT
infrastructure development and service uptake, making it a world leader in ICT. This
regional development had a positive and immediate impact on Bhutan. By December
2010, there were 26,292 fixed line telephone subscribers and 394,316 mobile users
although 14,217 are in passive. B-Mobile, a subsidiary of BTL and Tashi-Cell, a
subsidiary of TICL, are currently the two service providers offering mobile services in
the country.
Internet services are provided by Druk-net (under BTL), Samden Tech, Drukcom and
TICL.BTL is the sole provider of fixed line telecommunication in the country. Despite
appreciable growth, ICT penetration rate remains low compared to other developing
countries. Disparity between urban and rural areas is also clearly visible.
Table 1.1: Key ICT indicators – as of December 2010
Indicators Number
1. Fixed line telephone subscribers 26,292
2. Cellular mobile subscribers 394,316
3. Internet subscribers :
i) Lease line
ii) Dial-up
iii) Fixed Broadband Subscribers
iv) Mobile Broadband Subscribers
94,285
199
953
8,675
84,458
4. No. of geog with fixed-line telephone access 197 out of 205
5. No. of Geogs with access to mobile services 200 out of 205 Geogs
6. No. of Dzongkhag head-offices with fixed line
and mobile services
All 20
7. Number of Community Centers 44

8
1.2. ICT uptake in Bhutan
Bhutan has made a modest progress in ICT uptake since its introduction in 1999. Fixed
line penetration rate is currently 3.78 per 100 inhabitants, down from 5.9 in 2004. On the
other hand, mobile penetration rate is 56.7 per 100 inhabitants from 5.96 in 2005 as
shown below:
Chart 1.1: Penetration level of fixed line and mobile services, 2004-2010
Source: Bhutan Telecom Limited and Tashi-Cell, December,2010
Growth in certain segment of ICT has been comparable with other developing countries
while it is not as much in certain other aspects. For example, against 37 mobile
subscribers per every 100 inhabitants in the Asia Pacific region in 2008, Bhutan had a
comparable figure of 34.3 per 100 inhabitants. This figure for Bhutan increased to 56.7 in
2010 as much as it would have been in other countries in the Asia-Pacific Region.
On the other hand, the fixed line subscribers is at around 3.78 telephone lines per 100
inhabitants against 3.8 in the same time last year, a slight decrease of 0.02.
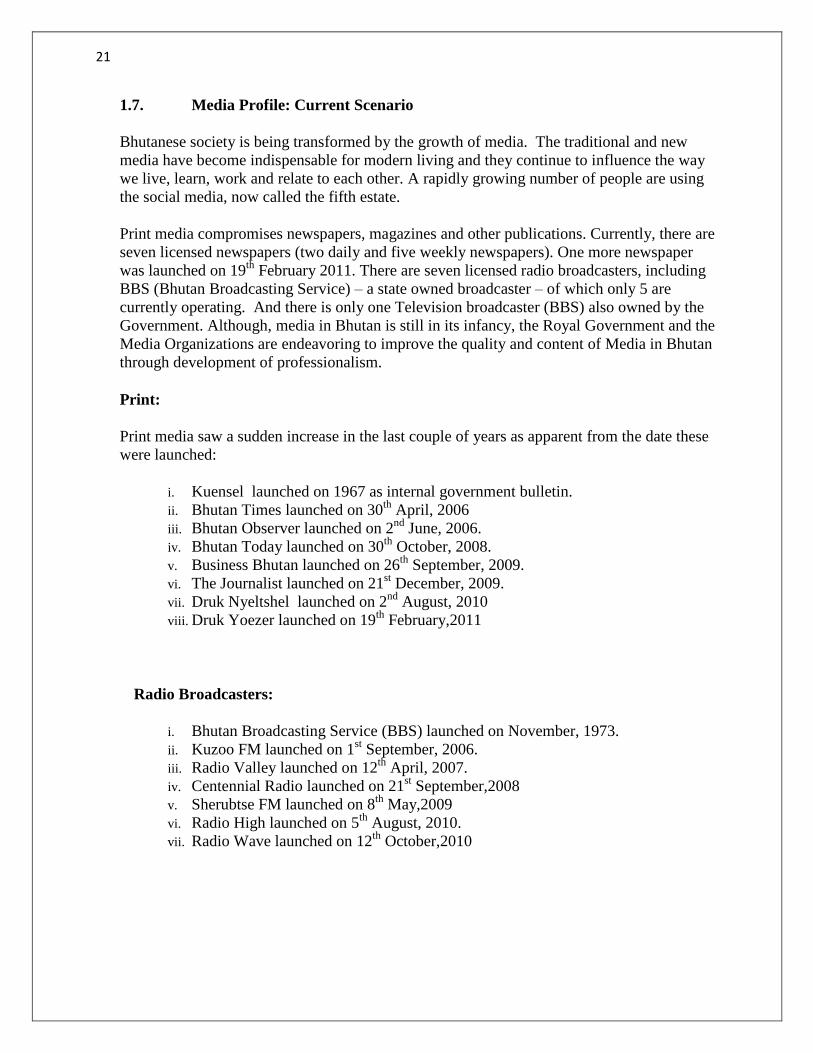
Internet usage in Bhutan has increased significantly with about 13.6 per every 100
inhabitants now having Internet access. Mobile broadband service is gaining increasing
popularity with number of subscribers rising from 11,886 in 2009 to around 84,458 by
December 2010 i.e. an increase of 611%. The actual number of users would be much
higher if all users connected through lease-line and Wi-Fi connections are taken into
account.
ICT penetration rate generally has remained low if we keep out mobile penetration as
confirmed by the figures in chart 1.2.

9
Chart 1.2: ICT development in Bhutan (subscribers per 100 inhabitants): 2004-20101
Table 1.2: Total No. of subscribers by type
Year Fixed line subscribers Mobile cellular
subscribers
Internet subscribers
Total
subscribers
Subscribers
per 100
inhabitants
Total
subscribers
Subscribers
per 100
inhabitants
Total
subscribers
Subscribers
per 100
inhabitants
2004 30,285 5.90 18,995 3.70 35 0.006
2005 32,709 5.10 37,842 5.96 48 0.008
2006 31,526 4.90 82,078 12.70 61 0.010
2007 30,279 4.60 148,179 22.50 4,040 0.600
2008 27,937 4.20 228,347 34.30 5,548 0.830
2009 26,348 3.80 327,052 47.80 18,542 2.700
2010 26,292 3.78 394,316 56.40 94,285 13.600
Source (chart1.2 and Table 1.2): Bhutan Telecom Limited and Tashi-Cell, December,2010
1 Source: BTL, TashiCell, Samden Tech, Drukcom. Internet subscribers refer to the number of households, corporate houses and government offices connected with Internet, and not the actual number of users.

10
1.3. Fixed-line telephony
The first telephone network in Bhutan was established in 1963. It was only in 1998 that a
fully digital national telecommunication network interconnecting all the twenty
Dzongkhags head offices and major towns were established.
BTL is the only operator that provides fixed line telecommunication services in the
country. Fixed line was one of the main mediums of voice communication prior to the
introduction of mobile cellular service in November 2003 by which time there were
around 23,657 subscribers nationwide.
Fixed line connections peaked in 2005 with 32,709 subscribers with an annual growth
rate of 8 percent. Since then the number started declining to 31,536 in 2006, to 26,348 in
2009 and 26,292 by 2010. This is obviously attributed to the growing popularity of
mobile services among urban and rural population. Decrease in subscriber number by
almost 1,000 subscribers (except for 2010, where the number of connections remained
stagnant) each year is considered significant, but this trend is not unique to Bhutan and
experienced by many countries world over.
Chart 1.3: Trend in fixed line subscribers over the years (2004-2010)
Source: Bhutan Telecom Limited,December,2010

11
Table 1.3: Showing total number of fixed line subscribers and fixed line subscribers
per 100 inhabitants for Bhutan Telecom
Chart 1.4: Showing fixed telephone line trend, 2004-2013.
From the chart 1.4, fixed telephone line penetration in the country will remain somewhat
stagnated or show a sign of decrease in the foreseeable future. Fixed telephone line
subscribers are expected to decrease from 26,292 in 2010 to around 26,000 subscribers by
2013.
Year No. of subscribers Fixed line Per 100
Inhabitants
2004 30,285 5.90
2005 32,709 5.10
2006 31,526 4.90
2007 30,279 4.60
2008 27,937 4.20
2009 26,348 3.80
2010 26,292 3.78
12
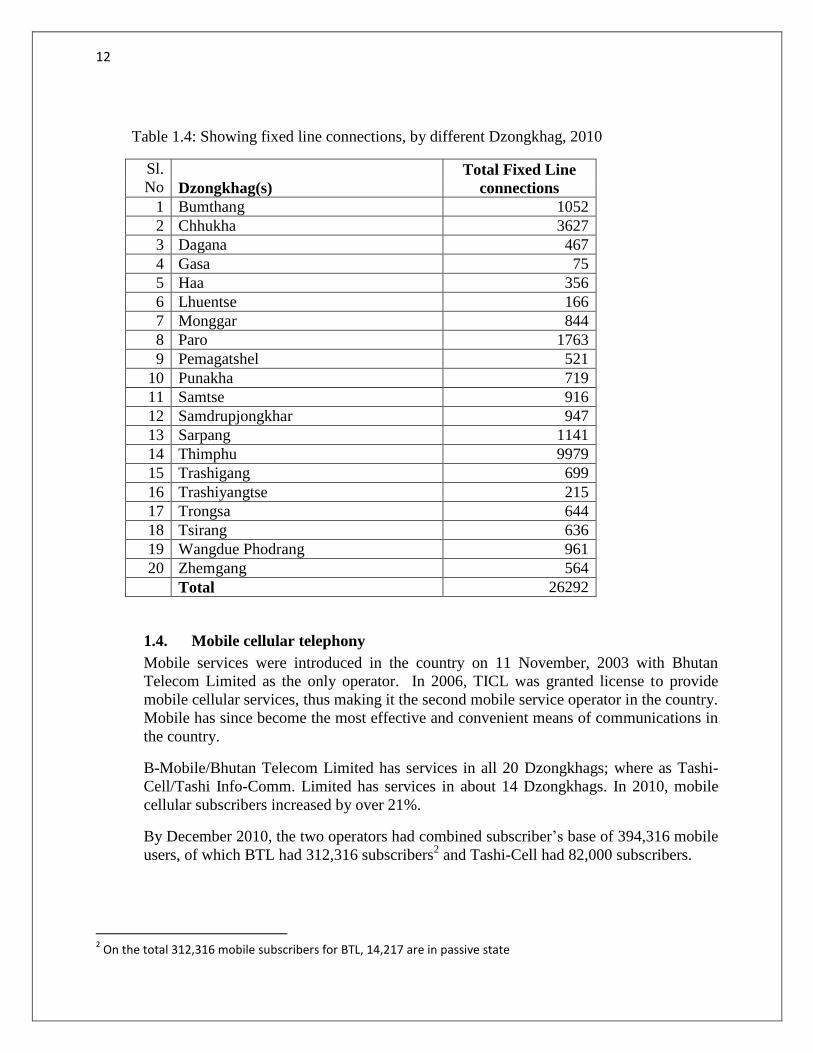
Table 1.4: Showing fixed line connections, by different Dzongkhag, 2010
Sl.
No Dzongkhag(s)
Total Fixed Line
connections
1 Bumthang 1052
2 Chhukha 3627
3 Dagana 467
4 Gasa 75
5 Haa 356
6 Lhuentse 166
7 Monggar 844
8 Paro 1763
9 Pemagatshel 521
10 Punakha 719
11 Samtse 916
12 Samdrupjongkhar 947
13 Sarpang 1141
14 Thimphu 9979
15 Trashigang 699
16 Trashiyangtse 215
17 Trongsa 644
18 Tsirang 636
19 Wangdue Phodrang 961
20 Zhemgang 564
Total 26292
1.4. Mobile cellular telephony
Mobile services were introduced in the country on 11 November, 2003 with Bhutan
Telecom Limited as the only operator. In 2006, TICL was granted license to provide
mobile cellular services, thus making it the second mobile service operator in the country.
Mobile has since become the most effective and convenient means of communications in
the country.
B-Mobile/Bhutan Telecom Limited has services in all 20 Dzongkhags; where as Tashi-
Cell/Tashi Info-Comm. Limited has services in about 14 Dzongkhags. In 2010, mobile
cellular subscribers increased by over 21%.
By December 2010, the two operators had combined subscriber’s base of 394,316 mobile
users, of which BTL had 312,316 subscribers2 and Tashi-Cell had 82,000 subscribers.
2 On the total 312,316 mobile subscribers for BTL, 14,217 are in passive state

13
Chart 1.5: Mobile Cellular Subscribers, Bhutan,2004-2010
Source: Bhutan Telecom Limited and Tashi-Cell, December, 2010
Chart1.6: Percentage increase in actual number of subscribers, Bhutan, 2004-2010
Source: Bhutan Telecom Limited and Tashi-Cell, December,2010
As shown in Chart 1.5 & 1.6, for the past 4 years, Bhutan though experienced an increase
in actual number of mobile cellular subscribers, it has also experienced a decline in the
rate at which the subscribers are added when compared to previous years i.e. on or before
2006. In future, it is expected that the percentage increase in the actual number of new
subscribers added to the network will be lesser than 20% of its previous year’s
subscriber’s base.
14
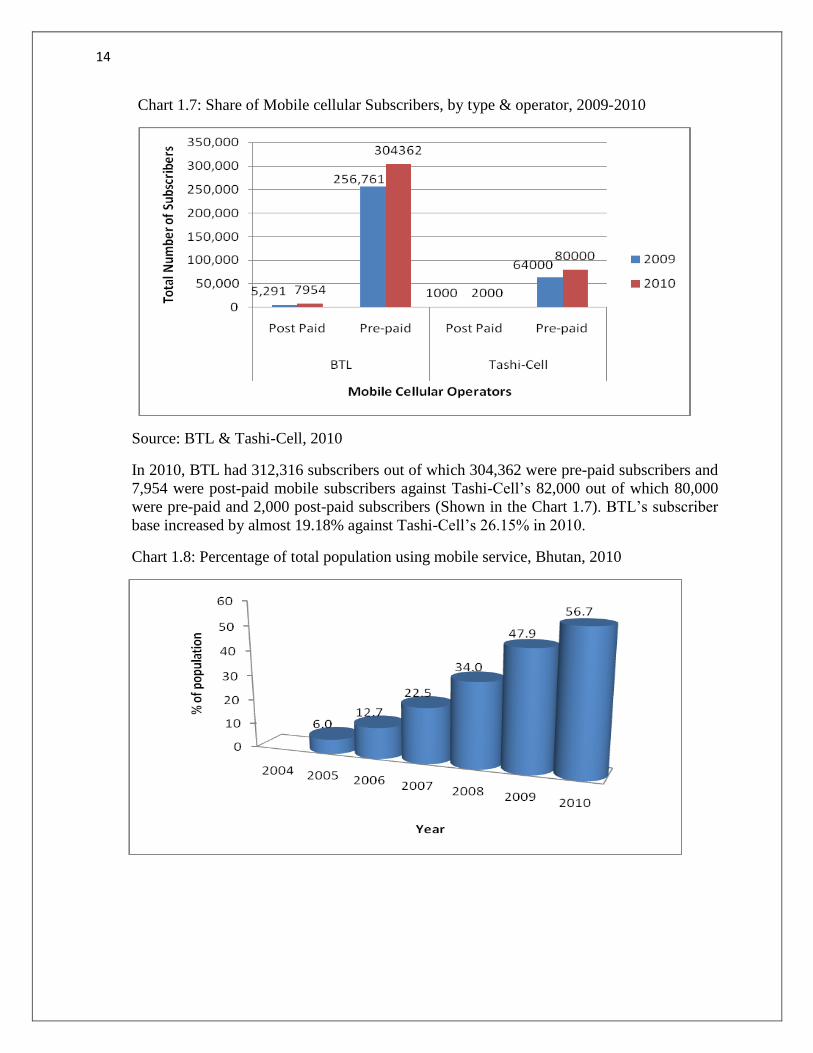
Chart 1.7: Share of Mobile cellular Subscribers, by type & operator, 2009-2010
Source: BTL & Tashi-Cell, 2010
In 2010, BTL had 312,316 subscribers out of which 304,362 were pre-paid subscribers and
7,954 were post-paid mobile subscribers against Tashi-Cell’s 82,000 out of which 80,000
were pre-paid and 2,000 post-paid subscribers (Shown in the Chart 1.7). BTL’s subscriber
base increased by almost 19.18% against Tashi-Cell’s 26.15% in 2010.
Chart 1.8: Percentage of total population using mobile service, Bhutan, 2010
15
Short Messaging Services (SMS)
Short Messaging Services (SMS) is now becoming more powerful than ever before in the
country. In 2010, Mobile cellular subscribers in the country had sent as many as 69,981,396
SMSes of which 62,809,449 were sent by BTL subscribers and 7,171,947 were sent by
Tashi-cell subscribers.
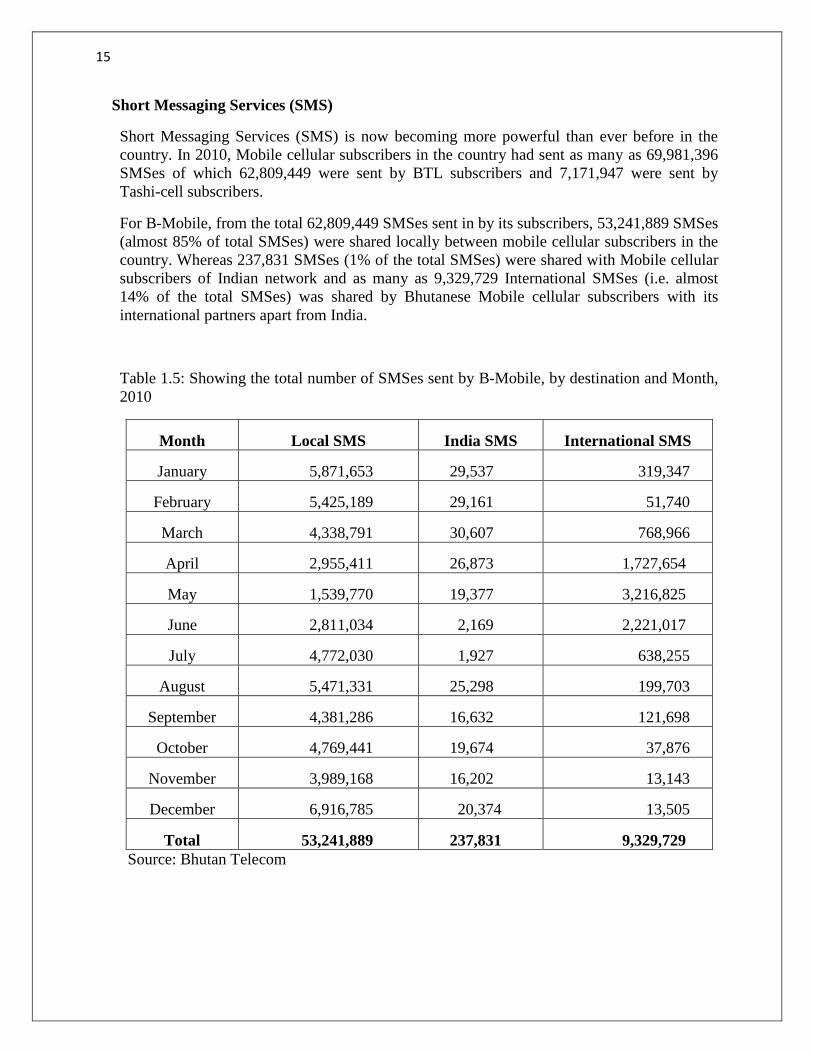
For B-Mobile, from the total 62,809,449 SMSes sent in by its subscribers, 53,241,889 SMSes
(almost 85% of total SMSes) were shared locally between mobile cellular subscribers in the
country. Whereas 237,831 SMSes (1% of the total SMSes) were shared with Mobile cellular
subscribers of Indian network and as many as 9,329,729 International SMSes (i.e. almost
14% of the total SMSes) was shared by Bhutanese Mobile cellular subscribers with its
international partners apart from India.
Table 1.5: Showing the total number of SMSes sent by B-Mobile, by destination and Month,
2010
Month Local SMS India SMS International SMS
January 5,871,653 29,537 319,347
February 5,425,189 29,161 51,740
March 4,338,791 30,607 768,966
April 2,955,411 26,873 1,727,654
May 1,539,770 19,377 3,216,825
June 2,811,034 2,169 2,221,017
July 4,772,030 1,927 638,255
August 5,471,331 25,298 199,703
September 4,381,286 16,632 121,698
October 4,769,441 19,674 37,876
November 3,989,168 16,202 13,143
December 6,916,785 20,374 13,505
Total 53,241,889 237,831 9,329,729
Source: Bhutan Telecom

16
1.5. Internet services
Druknet,TICL, Samden Tech and Drukcom are the Internet Service Providers (ISPs) in
the country providing range of Interent services as indicated below.
Operators Type of services provided Coverage
1. Druknet, BTL Lease line
Dial-up
Broadband (fixed)
3G/EDGE/GPRS (Mobile
broadband)
Country-wide
Country-wide where fixed line
telephone services are
available
18 Dzongkhag head-offices
and where B-mobile signals
are available
20 Dzongkhags ( 3G available
only in Thimphu)
2. TashiCell,
TICL
EDGE/GPRS,lease line
connection
14 Dzongkhag head offices
3. Samden Lease line connection Thimphu
4. Drukcom Lease line connection Thimphu
The type of Internet3 services provided by the ISPs are:
a. Lease line connection: Lease line connection is the oldest form of internet connection in
the country and is currently provided by Druknet, Tashi cell, Samden and Drukcom. By
the end of 2010, there were around 199 lease line connections throughout the country, up
from 35 in 2004, 48 in 2005, 61 in 2006, 80 in 2007,109 in 2008 and 145 in 2009. Lease
line connections have grown steadily over the years but these are mostly limited to
government agencies and corporate houses.
b. Dial up connection : Prior to the introduction of broadband services in 2008, dial-up
connection was quite common among individuals and houshold users to access Internet.
The highest number of dial-up users recorded was 4,014 in 2008 from where it started
declinig rapidly with better access to broadband services.By 2010 , there were only 953
dial up internet subscribers in the country, a decrease of 2180 users when compared to
2009.
c. Broadband Internet
Fixed broadband Internet services along with Mobile broadband was introduced for the
first time in 2008. In 2010, total number of fixed broadband internet users reached 8,675,
an increase of 57% i.e.5,297 compared to 3,378 users in 2009.Though there was an
3 Total number of household connected by lease line, dial up and fixed broadband and number of mobile
broadband subscribers are taken as “Total Internet subscribers”, as it is very difficult to calculate the actual number of Internet users via Internet Café, at Home, offices, etc
17
increase in the number of subscribers, broadband patronage has been rather slow, perhaps
due to high tariff,especially for individual household users.
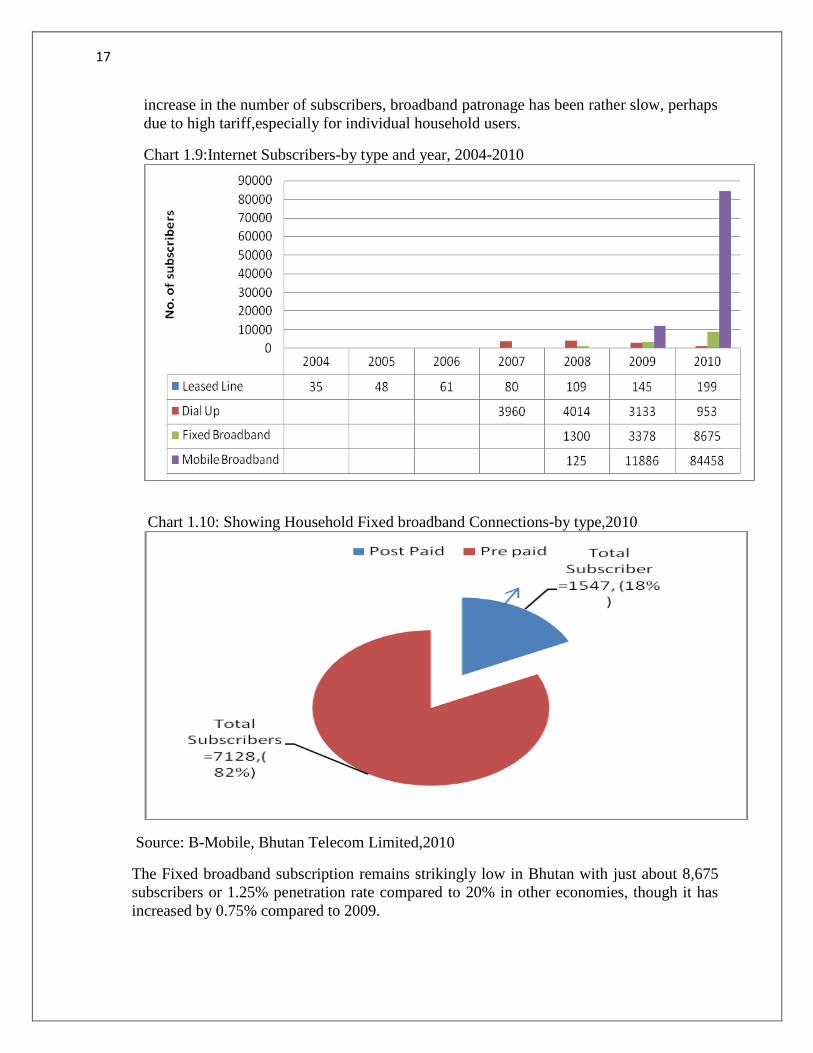
Chart 1.9:Internet Subscribers-by type and year, 2004-2010
Chart 1.10: Showing Household Fixed broadband Connections-by type,2010
Source: B-Mobile, Bhutan Telecom Limited,2010
The Fixed broadband subscription remains strikingly low in Bhutan with just about 8,675
subscribers or 1.25% penetration rate compared to 20% in other economies, though it has
increased by 0.75% compared to 2009.
18
Due to lack of infratructure, fixed-line broadband service is available only in some urban
locations such as Gedu, Punakha, Trashigang, Pemagatshel, Simtokha, Pasakha, Samdrup
Jongkhar, Bumthang, Tshimasham, Paro, Gelephu,Wangdue Phodrang,Mongar,Deothang,
Haa, Samtse, Trongsa, TrashiYangtse, Sarpang, Rurichhu, Gomtu, Lobesa, Zhemgang,
Khaling,Nganglam,Dagana,Royal Thimphu College, Rangung, Chumey, Lhuntse,
Gelposhing, Womrong, Thimphu, Phuentsholing, Dechencholing, Damphu, Satsam chorten
(Paro) and Dagapala.
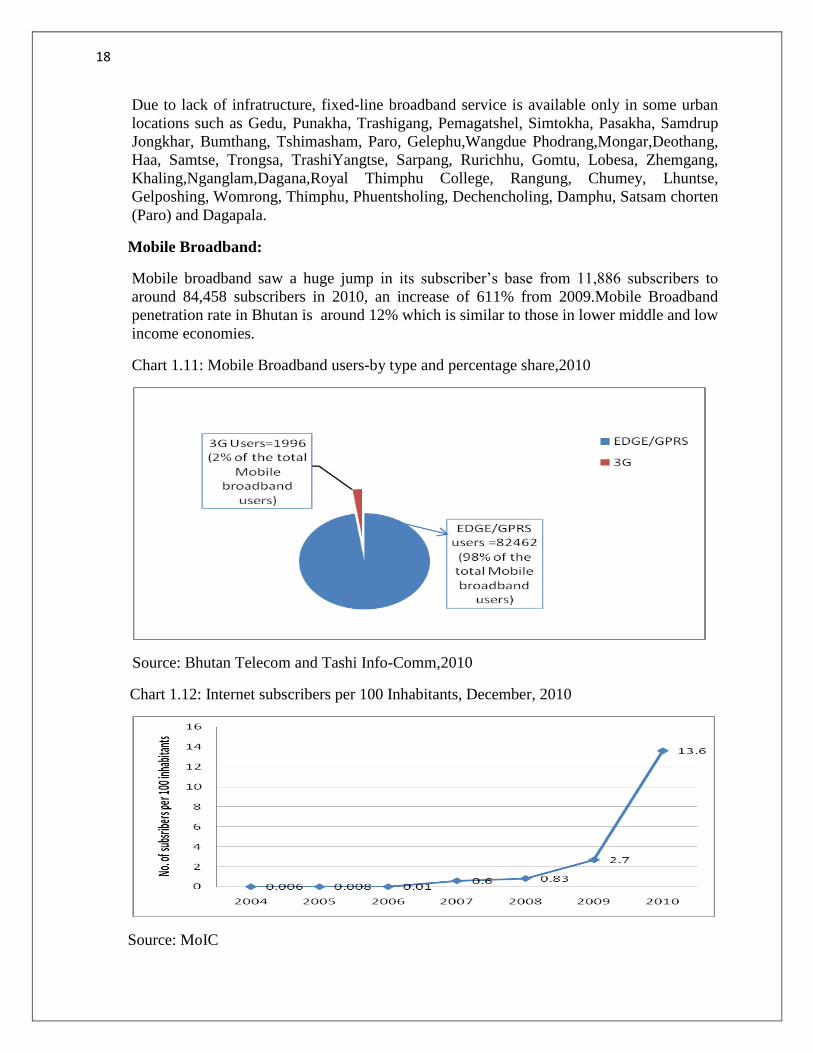
Mobile Broadband:
Mobile broadband saw a huge jump in its subscriber’s base from 11,886 subscribers to
around 84,458 subscribers in 2010, an increase of 611% from 2009.Mobile Broadband
penetration rate in Bhutan is around 12% which is similar to those in lower middle and low
income economies.
Chart 1.11: Mobile Broadband users-by type and percentage share,2010
Source: Bhutan Telecom and Tashi Info-Comm,2010
Chart 1.12: Internet subscribers per 100 Inhabitants, December, 2010
Source: MoIC

19
1.6. Cost of accessing Fixed Broadband, 3G, EDGE,GPRS,Dial up and Mobile
phone
The fixed line broadband price differences in the region are also striking. The top
economies in terms of fixed line broadband penetration have monthly subscription fees
that correspond to about 1 percent of the monthly income. On the other hand, in some
economies of the region, the cost of broadband subscription may represent more than 100
percent of the monthly income. In Bhutan, the average cost of accessing broadband (post-
paid and pre-paid) ranges from 7 to 14 percent of monthly income for home and personal
usage of broadband services.
1. Fixed Broadband Tariff:4 Monthly Post paid Rates:
4 Source: BTL, other ISPs do not provide Fixed broadband services as of now.
Package Name
Circuit
Bandwidth
Monthly
Tariff(NU)
Data
upload/Download
Limit
Additional
UsageCharge
per MB (NU)
Personal
Upto 256
Kbps 479 2.5 GB 0.19
Home
Upto 256
Kbps 959 5 GB 0.19
Office
Upto 512
Kbps 1439 7 GB 0.19
Business Upto 1 Mbps 2159 10 GB 0.19
Enterprise Upto 2Mbps 2999 15 GB 0.19
2.Monthly Prepaid Rates:
Package Name
Circuit
Bandwidth
Monthly
Tariff(NU)
Data
Upload/Download
Limit validity
Personal
Upto 256
Kbps 399 2.5 GB 30 days
Home
Upto 256
Kbps 799 5 GB 30 days
Office
Upto 512
Kbps 1199 7 GB 30 days
Business Upto 1 Mbps 1799 10 GB 30 days
Enterprise
Upto 2
Mbps 2499 15 GB 30 days

20
2. Tariff for 3G,EDGE & GPRS
a. Bhutan Telecom Limited (B-Mobile):
Package Lite Easy Supreme Unlimited
Rate NU 149 NU 399 NU 799 NU 999
Data Limit 300 MB 1.2 GB 2.5 GB Unlimited
1. Pay-Per-Use: NU 0.003/KB (the pay-as-you-use can be subscribed by both postpaid
and prepaid customers).
2. MMS (person to person): maximum size of MMS – 100 KB.
3. Video call: NU 1.75/unit (one unit is 20 seconds. The rates for video calls is only for
on-net
b. Tashi Info-Comm Private Limited:
1. Pay per use - It is available for both prepaid as well as post paid subscribers. For every
kilobyte (KB) of data browsed, subscribers will be charged Nu. 0.01 only.
2. Unlimited usage - It is available only for postpaid subscribers. Subscribers pay a fixed
amount of Nu. 777 for the whole month.
3. Tariff for Dial up internet connections:
- Minutes per Unit for NU 1.50
-
21
1.7. Media Profile: Current Scenario
Bhutanese society is being transformed by the growth of media. The traditional and new
media have become indispensable for modern living and they continue to influence the way
we live, learn, work and relate to each other. A rapidly growing number of people are using
the social media, now called the fifth estate.
Print media compromises newspapers, magazines and other publications. Currently, there are
seven licensed newspapers (two daily and five weekly newspapers). One more newspaper
was launched on 19th
February 2011. There are seven licensed radio broadcasters, including
BBS (Bhutan Broadcasting Service) – a state owned broadcaster – of which only 5 are
currently operating. And there is only one Television broadcaster (BBS) also owned by the
Government. Although, media in Bhutan is still in its infancy, the Royal Government and the
Media Organizations are endeavoring to improve the quality and content of Media in Bhutan
through development of professionalism.
Print:
Print media saw a sudden increase in the last couple of years as apparent from the date these
were launched:
i. Kuensel launched on 1967 as internal government bulletin.
ii. Bhutan Times launched on 30th
April, 2006
iii. Bhutan Observer launched on 2nd
June, 2006.
iv. Bhutan Today launched on 30th
October, 2008.
v. Business Bhutan launched on 26th
September, 2009.
vi. The Journalist launched on 21st December, 2009.
vii. Druk Nyeltshel launched on 2nd
August, 2010
viii. Druk Yoezer launched on 19th
February,2011
Radio Broadcasters:
i. Bhutan Broadcasting Service (BBS) launched on November, 1973.
ii. Kuzoo FM launched on 1st September, 2006.
iii. Radio Valley launched on 12th
April, 2007.
iv. Centennial Radio launched on 21st September,2008
v. Sherubtse FM launched on 8th
May,2009
vi. Radio High launched on 5th
August, 2010.
vii. Radio Wave launched on 12th
October,2010
22
Chapter Two – Aviation and Surface Transport
1. Aviation sector:
(i) Airports
Type of
airport(s)
Place Altitude
above sea
level
Runway
length
Runway
width
Aerodrome
Reference
classification
International Paro 7,300 feet
(2,225 m)
2,255 m 30 m 4C
Domestic5 Yonphula 8,400 feet
(2,560m)
1,300 m 30m 2B
Domestic Bumthang 8,465 feet
(2,580 m)
1,200 m 30m 2B
Domestic Gelephu 726 feet
(221 m)
1,200m 30m 2B
(ii) Number of helipads: 40
Drukair, the national flagcarrier of Bhutan, started air services in February 11, 1983. Since
then, it has been the only airline in the country until August 23,2010 providing scheduled
international air services and currently operating to the following routes:
i) India : Delhi, Kolkata, Gaya, Bagdogra, Guwahati
ii) Nepal : Kathmandu
iii) Thailand : Bangkok
iv) Bangladesh : Dhaka
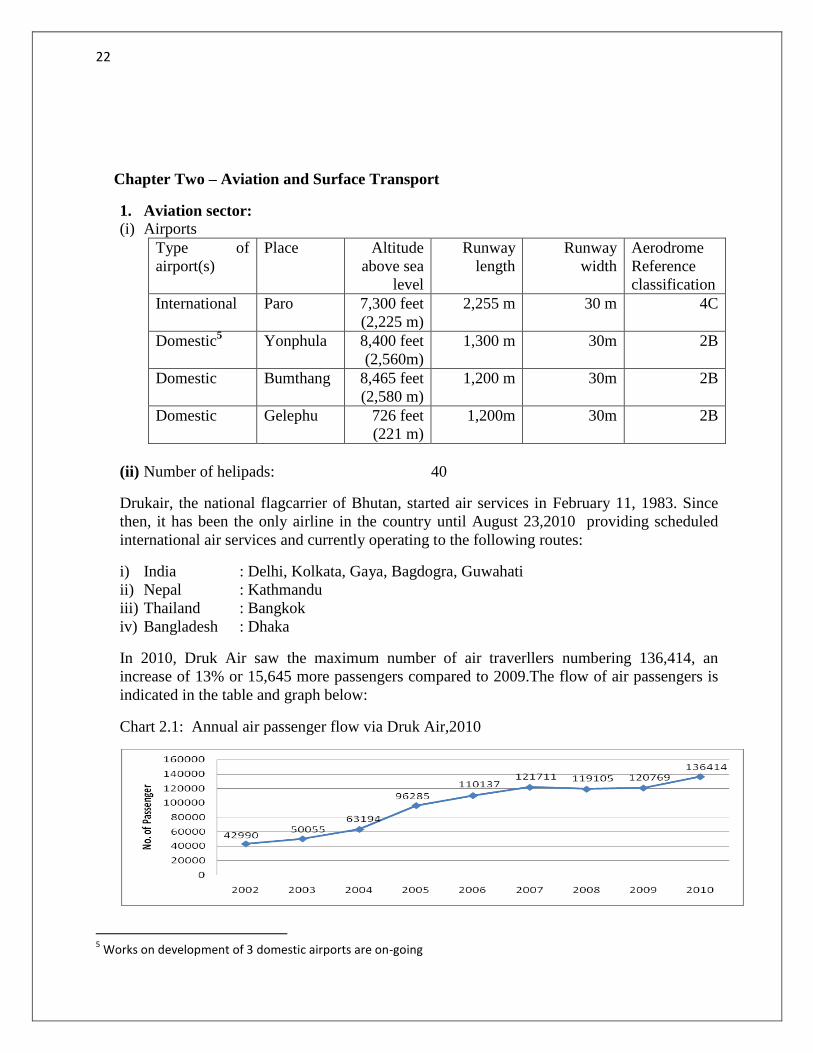
In 2010, Druk Air saw the maximum number of air traverllers numbering 136,414, an
increase of 13% or 15,645 more passengers compared to 2009.The flow of air passengers is
indicated in the table and graph below:
Chart 2.1: Annual air passenger flow via Druk Air,2010
5 Works on development of 3 domestic airports are on-going

23
Table2.1: Drukair Passenger Flow – 2010 and 2009, segregated by sectors
Sector JANUARY-DECEMBER
Year 2010 Year 2009
Paro to
Delhi 11479 10139
Bangkok 24361 22159
Kathmandu 10509 8597
Kolkata 11450 8070
Gay 751 1026
Dhaka 2952 1530
Bagdogra 2033 1302
Guwahati 118
Sub-total 63653 52823
to Paro
Delhi 12032 10037
Bangkok 24560 22410
Kathmandu 10675 8825
Kolkata 10374 7614
Gaya 850 897
Dhaka 2964 1407
Bagdogra 1965 1289
Guwahati 108
Sub-total 63528 52479
Kathmandu/Delhi 0 2037
Delhi/Kathmandu 0 1102
Kolkata/Bangkok 0 1664
Bangkok/Kolkata 11 1586
Gaya/Bangkok 707 1447
Bangkok/Gaya 625 1415
Dhaka/Bangkok 2254 2720
Bangkok/Dhaka 1835 2377
Bagdogra/Bangkok 1819 649
Bangkok/Bagdogra 1716 470
Guwahati/Bangkok 180
Bangkok/Guwahati 86
Sub-total 9233 15467
Grand Total 136414 120769

24
From Table 2.1, Bangkok is the most frequently travelled sector compared to all the other
secctors from Bhutan. In 2010, total number of 24,361 passengers travelled to Bangkok, an
increase of 2202 travellers from 2009.Delhi, was the 2nd
most travelled sector, followed by
Kolkata and Kathmandu respectively.Guwahati is the least travelled sector from Bhutan. At
the same time, Bangkok sector also remains the most frequently used sector to travel to
Bhutan, followed by Delhi, Kathmandu and Kolkata.
Chart 2.2: No. of passengers travelling to and from Paro via Druk Air- by sector, 2010
Chart 2.3: Departure and Arrival of Passengers at PBH, 2009-2010
In recent years,number of people travelling outside Bhutan has been slightly more than the
number of peole arriving in the country.In 2010, 63,653 passengers departed from Paro
International Airport compared to 63,528 passengers arriving at the Airport. Nevertheless, last
year Paro International Airport saw an increase in number of passenger using the airport
compared to 2009 by 15,645 passengers i.e. more than13 %.

25
2. Surface Transport:
2.1. Surface transport is primarily segregated into two major elements based on functional and
institutional arrangement:
a) Road infrastructure, broadly comprising the development of road network, bridge
construction and their maintenance, is the mandate of the Department of Roads under the
Ministry of Works and Human Settlement.
b) Transport management aspects including the issuance of licenses for public transport
services, administration and enforcement of motor vehicle related activities, are carried out by
the Road Safety Transport Authority under MoIC. Information in this bulletin is therefore,
limited to this aspect only.
2.2. Trend in vehicle growth
Chart 2.4: Trend in vehicle growth, 2001-2010, Bhutan.
Source: RSTA
Chart 2.5: Annual Growth Rate and projected growth rate, 2001-2012

26
As of December 2010, there were 53,382 vehicles registered with RSTA i.e. an increase of
16.5 % compared to 45,819 vehicles in 2009. In the past decade, the country saw an increase
of 30,855 vehicles over a period of 10 years.
At the current scenario, vehicle number in Bhutan is estimated to grow at an annual growth
rate of 13-14% annually over the next two years (see above chart 2.5)
Table 2.2: Number of vehicles by type, 2001-201067
Year Heavy Medium Light Two-wheeler Taxi PT TR Earth-movers Others Total Vehicle
2001 2863 697 9915 8165 201 n.a. n.a. 408 278 22,527
2002 2747 770 10199 8371 1423 n.a. n.a. 464 456 24,430
2003 4841 308 11575 7507 1560 n.a. n.a. 321 384 26496
2004 4345 n.a. 12425 7707 1682 n.a. n.a. 1682 388 28,229
2005 4352 n.a. 14365 6703 2050 n.a. n.a 511 491 28,472
2006 4176 343 17355 7903 2038 79 109 555 23 35704
2007 4547 467 19798 7458 2218 109 474 633 n.a 35,704
2008 4624 659 24244 7734 2511 151 611 744 n.a 41,278
2009 5198 786 27145 8027 2859 692 183 929 n.a 45,819
2010 6568 1007 31162 8820 3599 756 210 1260 n.a. 53,382
Source: RSTA/MoIC
2.3. Ownership pattern
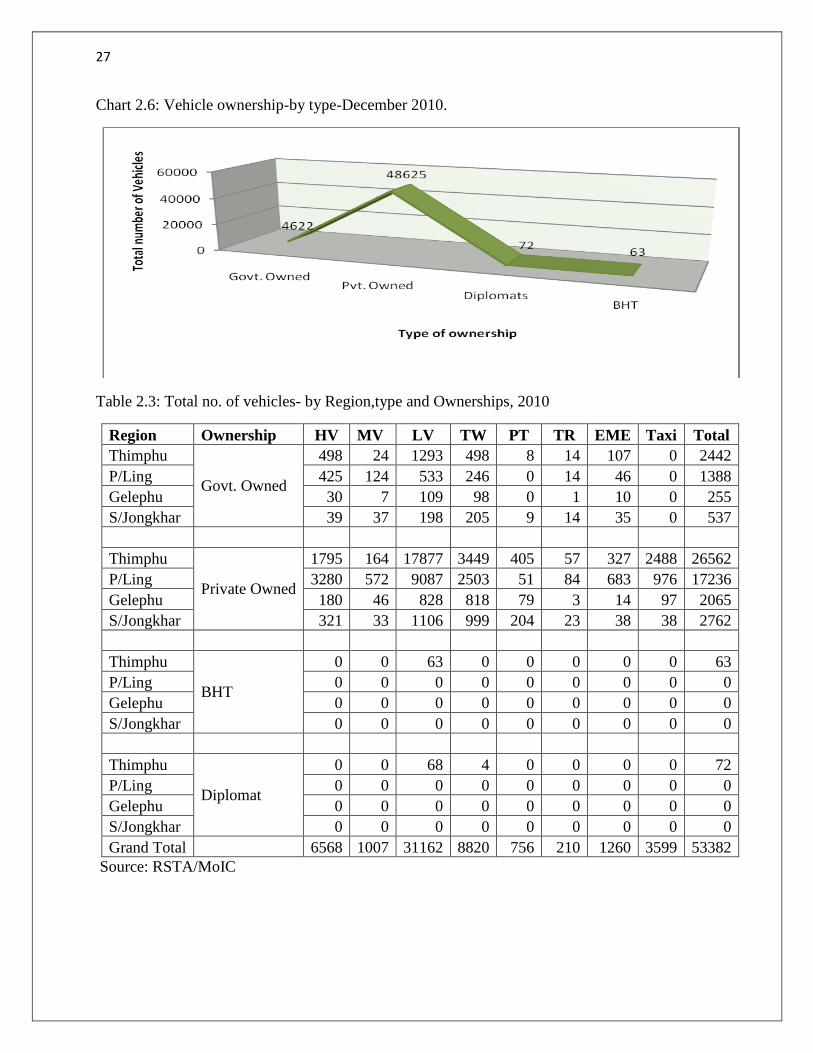
Of the total 53,382 vehicles in the country, approximately 8.7% or 4,622 vehicles are
registered in the name of Government agencies, 91% or 48,625 registered in the name of
private sector entities and individuals, with the remaining registered in the name of
Diplomatic missions( see below chart 2.6) and rest as BHT. Vehicles registered in the
name of Royal Body Guard, Royal Bhutan Army and Royal Bhutan Police are not
included in the total number shown in the table above.
Of the total of 4,622 registered in the name of government agencies including state
owned corporations, 46% are light vehicles, 22.7% two wheelers, 21.5% Heavy Vehicles
and 4.3% Earth Moving Equipments. The remaining 5.5 % comprises of medium
vehicles, power tillers and tractors.
6 Source: RSTA/MoIC
7 From 2007, vehicles which earlier was classified as “others” was clubbed into different category of vehicles
27
Chart 2.6: Vehicle ownership-by type-December 2010.
Table 2.3: Total no. of vehicles- by Region,type and Ownerships, 2010
Region Ownership HV MV LV TW PT TR EME Taxi Total
Thimphu
Govt. Owned
498 24 1293 498 8 14 107 0 2442
P/Ling 425 124 533 246 0 14 46 0 1388
Gelephu 30 7 109 98 0 1 10 0 255
S/Jongkhar 39 37 198 205 9 14 35 0 537
Thimphu
Private Owned
1795 164 17877 3449 405 57 327 2488 26562
P/Ling 3280 572 9087 2503 51 84 683 976 17236
Gelephu 180 46 828 818 79 3 14 97 2065
S/Jongkhar 321 33 1106 999 204 23 38 38 2762
Thimphu
BHT
0 0 63 0 0 0 0 0 63
P/Ling 0 0 0 0 0 0 0 0 0
Gelephu 0 0 0 0 0 0 0 0 0
S/Jongkhar 0 0 0 0 0 0 0 0 0
Thimphu
Diplomat
0 0 68 4 0 0 0 0 72
P/Ling 0 0 0 0 0 0 0 0 0
Gelephu 0 0 0 0 0 0 0 0 0
S/Jongkhar 0 0 0 0 0 0 0 0 0
Grand Total 6568 1007 31162 8820 756 210 1260 3599 53382
Source: RSTA/MoIC

28
Chart 2.7: % share of total number of vehicles- by region, 2010
Table 2.4: Total number of vehicles by region,2010
Region Total Vehicle no. % share of vehicles
Thimphu 29,139 54.6
Gelephu 2,320 4.3
Samdrupjonkhar 3,299 6.2
Phuentsholing 18,624 34.9
Total 53,382 100
2.4. Vehicle by Type and Ownership:
Heavy, Medium and Light vehicles
Heavy vehicle is defined as motor vehicle exceeding 10 tons gross vehicle weight or a bus
seating more than 25 adults (including the driver). As of December 2010, there were around
6,568 heavy vehicles in the country i.e. an increase of 1370 (26.4%) heavy vehicles from
2009.
Chart 2.8: % share of Heavy vehicles- by Ownerships, 2010
Source: RSTA/MoIC
Meduim vehicles means a motor vehicle exceeding 3 tons but not exceeding 10 tones gross
vehicle weight or a bus seating between 13 and 24 passengers. Number of medium vehicles

29
has increased in recent years from 697 in 2001 to around 1,007 by 2010. Number of
medium vehicles had comparatively increased by 28% from 2009.
Chart 2.9: % share of Medium vehicles-by ownership, 2010
Source: RSTA/MoIC
Light Vehicle means a motor vehicle (which is not a two-wheeler) seating not more than 12
adults (including the driver) and not exceeding 3 tones gross vehicle weight. At the
beginning of the decade there were around 8,777 vehicles, by 2004 there were around 12638
light vehicles in the country.By 2010 end, there were 31,162 light vehicles, an increase of
4,017( or 14.8% ) numbers from 2009.
Chart 2.10: % share of Light vehicles-by ownership, 2010
Source: RSTA/MoIC
30
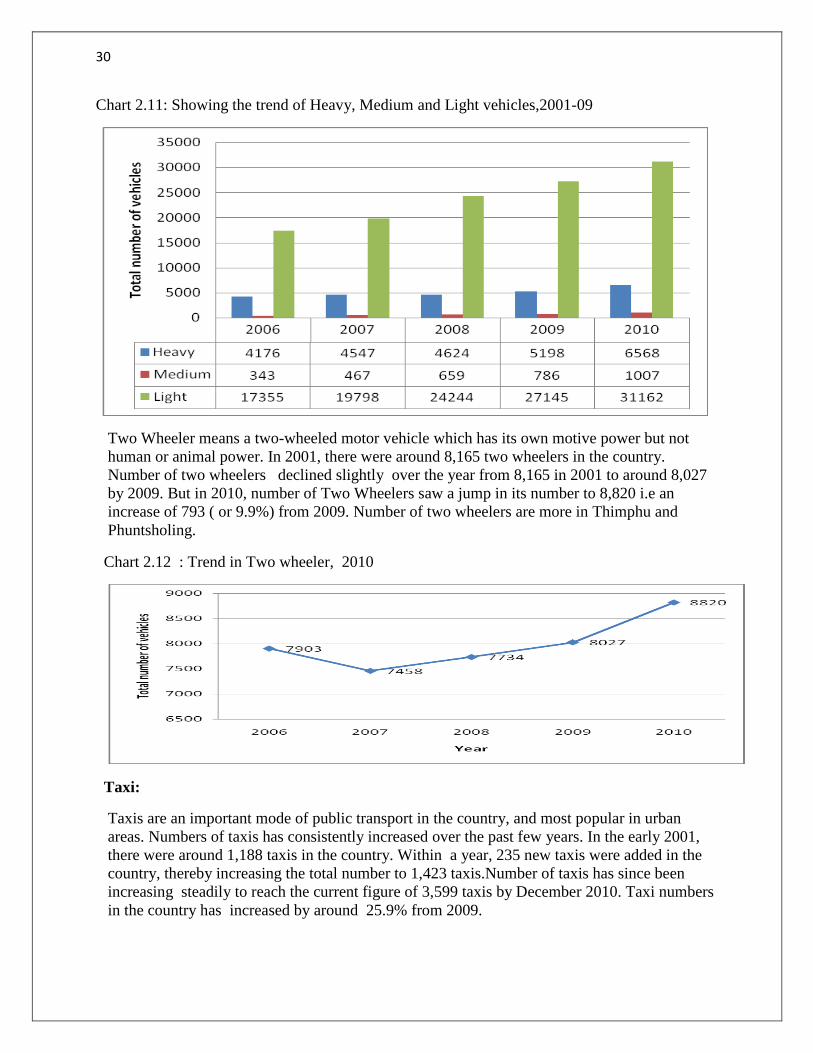
Chart 2.11: Showing the trend of Heavy, Medium and Light vehicles,2001-09
Two Wheeler means a two-wheeled motor vehicle which has its own motive power but not
human or animal power. In 2001, there were around 8,165 two wheelers in the country.
Number of two wheelers declined slightly over the year from 8,165 in 2001 to around 8,027
by 2009. But in 2010, number of Two Wheelers saw a jump in its number to 8,820 i.e an
increase of 793 ( or 9.9%) from 2009. Number of two wheelers are more in Thimphu and
Phuntsholing.
Chart 2.12 : Trend in Two wheeler, 2010
Taxi:
Taxis are an important mode of public transport in the country, and most popular in urban
areas. Numbers of taxis has consistently increased over the past few years. In the early 2001,
there were around 1,188 taxis in the country. Within a year, 235 new taxis were added in the
country, thereby increasing the total number to 1,423 taxis.Number of taxis has since been
increasing steadily to reach the current figure of 3,599 taxis by December 2010. Taxi numbers
in the country has increased by around 25.9% from 2009.
31
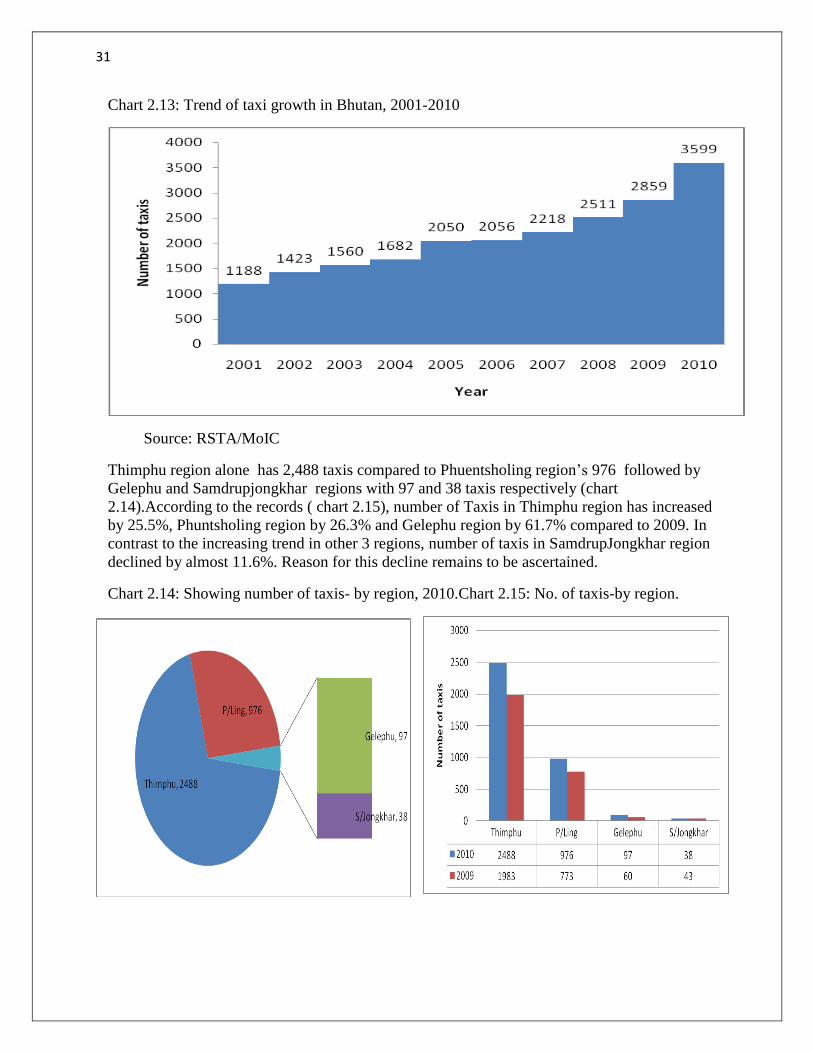
Chart 2.13: Trend of taxi growth in Bhutan, 2001-2010
Source: RSTA/MoIC
Thimphu region alone has 2,488 taxis compared to Phuentsholing region’s 976 followed by
Gelephu and Samdrupjongkhar regions with 97 and 38 taxis respectively (chart
2.14).According to the records ( chart 2.15), number of Taxis in Thimphu region has increased
by 25.5%, Phuntsholing region by 26.3% and Gelephu region by 61.7% compared to 2009. In
contrast to the increasing trend in other 3 regions, number of taxis in SamdrupJongkhar region
declined by almost 11.6%. Reason for this decline remains to be ascertained.
Chart 2.14: Showing number of taxis- by region, 2010.Chart 2.15: No. of taxis-by region.

32
2.5. Motor vehicle crash data – 2010
Table 2.5: Motor vehicle crashes,2005-2010
Year No. of motor vehicle
crashes Death Injured
2005 696 39 247
2006 940 71 389
2007 523 40 335
2008 995 92 488
2009 1436 77 579
2010 1260 79 611
Chart 2.16: Number of motor vehicle crashes and casualties
The year 2010 saw a decline in number of motor vehicle accidents from 1,436 in 2009 to
1,260. Despite decrease in number of accidents in 2010,number of deaths increased by 2 and
inured by 32 against 2009 figures.
33
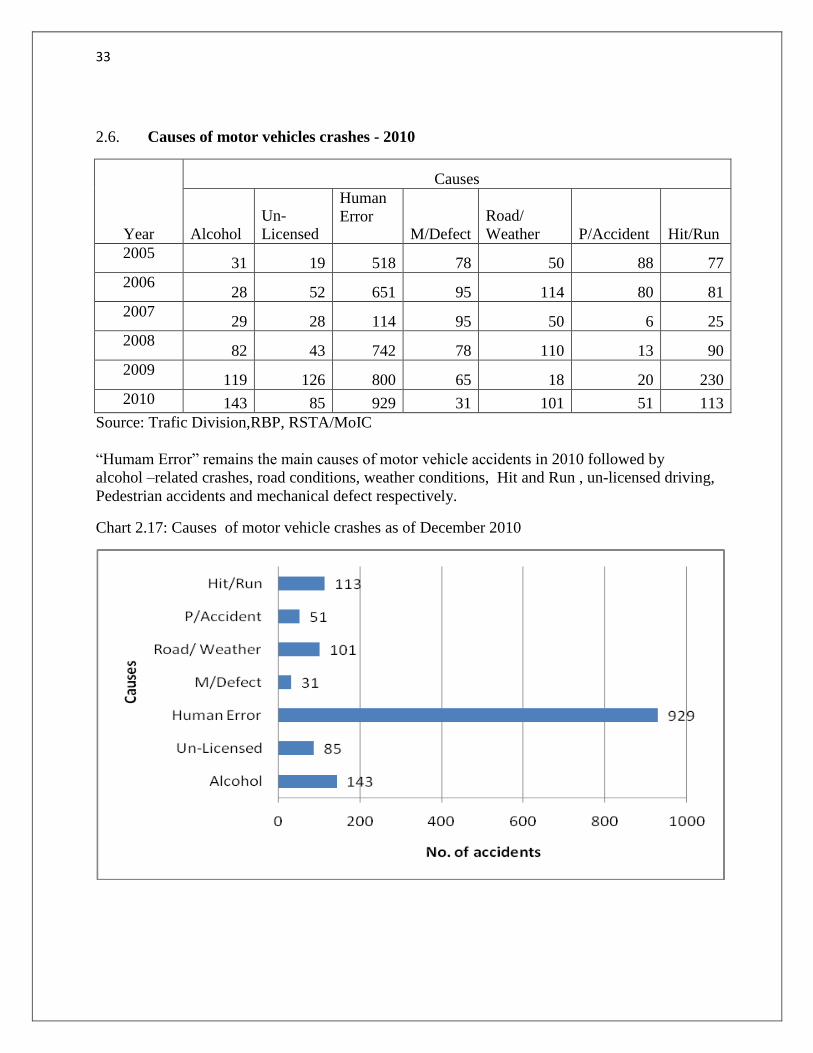
2.6. Causes of motor vehicles crashes - 2010
Year
Causes
Alcohol
Un-
Licensed
Human
Error M/Defect
Road/
Weather P/Accident Hit/Run
2005 31 19 518 78 50 88 77
2006 28 52 651 95 114 80 81
2007 29 28 114 95 50 6 25
2008 82 43 742 78 110 13 90
2009 119 126 800 65 18 20 230
2010 143 85 929 31 101 51 113
Source: Trafic Division,RBP, RSTA/MoIC
“Humam Error” remains the main causes of motor vehicle accidents in 2010 followed by
alcohol –related crashes, road conditions, weather conditions, Hit and Run , un-licensed driving,
Pedestrian accidents and mechanical defect respectively.
Chart 2.17: Causes of motor vehicle crashes as of December 2010
34
2.7. Other important data
Table 2.6: Driving Licenses Issued as of December,2010(cumulative figure)
Sl.No Region Total
1 Thimphu 35,385
2 Phuentsholing 7,353
3 Gelephu 6,821
4 Samdrupjonkhar 5,820
5 All 4 Regional Office(commercial driving
licenses)
7,557
Total 62,936
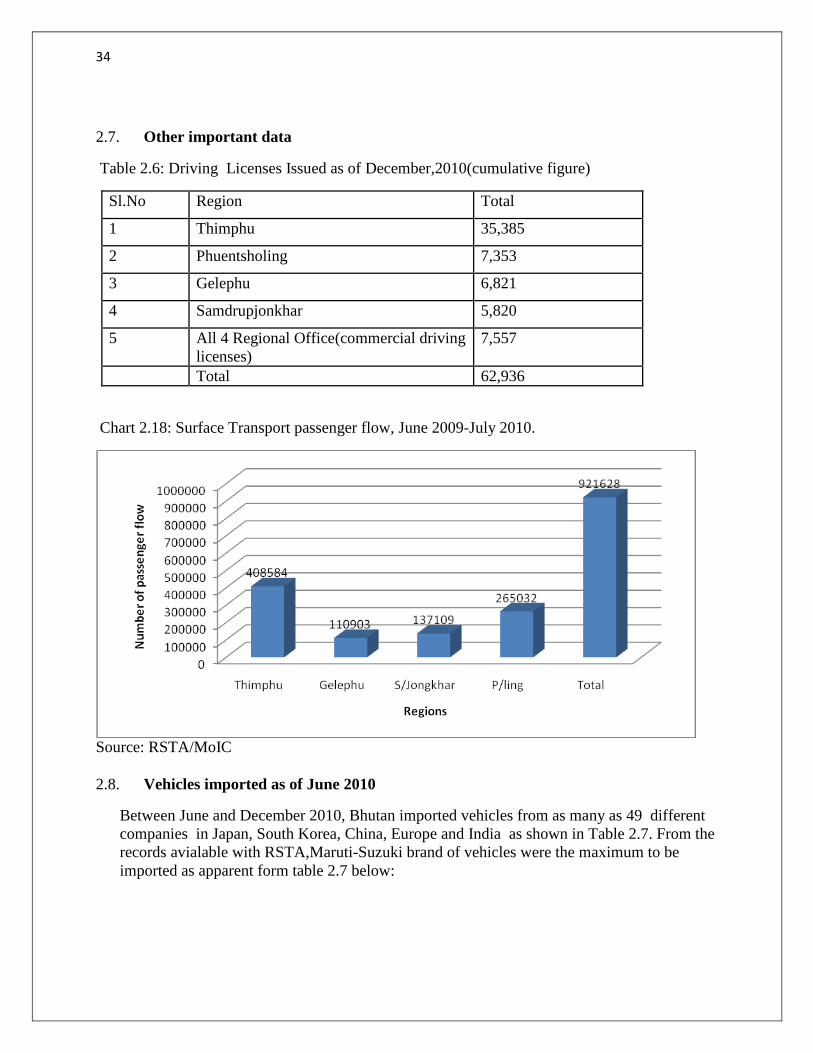
Chart 2.18: Surface Transport passenger flow, June 2009-July 2010.
Source: RSTA/MoIC
2.8. Vehicles imported as of June 2010
Between June and December 2010, Bhutan imported vehicles from as many as 49 different
companies in Japan, South Korea, China, Europe and India as shown in Table 2.7. From the
records avialable with RSTA,Maruti-Suzuki brand of vehicles were the maximum to be
imported as apparent form table 2.7 below:

35
Chart 2.19: Top 14 Vehicle Models purchased by Bhutanese as of June,2010
Table 2.7: Detail data of vehicles imported as of June 2010- By Company, Model and
Numbers
Company Vehicle Type Numbers Principle Country
of imported
vehicle
AMW Tipper/Truck 33 India
Ashok Leyland Tipper/Truck 40 India
Ashok Leyland Bus 1 India
Bajaj Bike 155 India
Bajaj Scooter 1 India
BMW Light vehicle 1 Germany
Bongua Power Tiller 33 -
Britannia Road Roller 1 India
Caterpillar Bull Dozer D7G3 1 U.S.A
Caterpillar Excavator 18 U.S.A
Caterpillar Loader 2 U.S.A
Chevrolet Light vehicle 38 U.S.A
Cifa Truck loader 1 U.S.A
Doosan Excavator 2 South Korea
Dronphen Power Tiller 4 -
Eicher Truck 155 India
Eicher Bus 5 India
Escort Tractor 21 India
Escort Crane 4 India

36
Ford Figo Light vehicle 124 U.S.A
Ford Ford Tractor 9 U.S.A
Great Wall Light vehicle 5 China
Hero Honda Bike 40 India
Hero Honda Honda Scooter 1 India
Honda Bike 1 Japan
Honda Light vehicle 29 Japan
Hummer Light vehicle 1 U.S.A
Hyundai Light vehicle 596 South Korea
Hyundai Excavator 2 South Korea
JCB Excavator 41 India
Jining Rising
Business
Machine Co.
LTD
Truck Crane 1 China
Kamatsu Excavator 56 Japan
Kia Light vehicle 16 South Korea
Kobelco Excavator 26 U.S.A
Kuboto Tractor 1 Japan
Kuboto Power Tiller 9 Japan
L&T Compactor 1 India
Land Rover Light vehicle 3 United Kingdom
Luoyang
Lutong
Trading Co.
Road Roller 2 China
Mahindra &
Mahindra
Light vehicle 246 India
Maruti Light vehicle 970 India
Mercedes
Benz
Light vehicle 4 Germany
Mitsubishi Light vehicle 5 Japan
Mitsubishi Power Tiller 52 Japan
Normet OY Dozer 1 Finland
Puzzoolana Pay loader 1 India
Reva Electric car 5 India
Royal Enfield Bike 2 United Kingdom
Sakai Road roller 1 Japan
Same Range
Tractor
Tractor 9 Italy
Shandong Forklift truck 2 China

37
Guangming
Machinery
Company
Shiv Shakti
Road
Equipments
Pvt. Ltd
Road Roller 1 India
Speed Craft Road roller 7
Ssangyong
Motors
Light vehicle 6 China
Suzuki Light vehicle 3 Japan
Tata Mini Truck 168 India
Tata Ambulance 2 India
Tata Light vehicle 40 India
Tata Bus 13 India
Tata Truck 400 India
Toyota Coaster Bus 19 Japan
Toyota Light vehicle 125 Japan
Volkswangen
co.
Light vehicle 1 United Kingdom
Voltas Truck 1
Volvo Excavator 28 USA/India
Wuhan
Chancay
Road Roller 1 China
Yamaha Bike 23 Japan
Grand Total 3616

38
Technical Notes
1. Fixed Telephone Lines per 100 Inhabitants
Fixed Telephone lines refer to telephone lines connecitng a customer’s equipment i.e. telephone
set to Public Switched Telephone Network and which have a dedicated port on public
payphones. Fixed telephone line per 100 inhabitants is calculated by dividing the number of
fixed lines by the population and multiplying by 100.
2. Mobile cellular per 100 inhabitants.
Mobile cellular per 100 inhabitants is obtained by dividing the number of mobile cellular
subscriptions by number of mobile cellular subscriptions by the populaiton and multiplying by
100.
3. Internet users per 100 inhabitants
Internet users in the bulletin refers only to those who are connected with either lease line,dial up
connections, fixed broadband and mobile broadband. Internet users per 100 inhabitants is
calculated number of users with internet connections by total population multiplyed by 100.
4. Fixed Broadband Internet subscribers
Fixed broadband Internet subscribers refers to subscribers who pay for high speed access to the
pUblic Internet at sppeds equals to, or greater than, 256 kbps. Fixed broadband internet
subscribers per 100 inhabitants is calculated by dividing the population of the country and by
multiplying by 100.
5. Mobile Broadband Subscriber per 100 inhabitants
Mobile broadband internet subscribers per 100 inhabitants is calculated by dividing the
population of the country and by multiplying by 100.