a.4 pathogen emissions report
TRANSCRIPT

A.4 Pathogen Emissions Report
page Evaluation of Agriclean Technology at the BR Harris Farm for Pathogens Project OPEN Science Team for Pathogens 1 Evaluation of Sustainable NC Technology at the Stokes Farm for Pathogens Project OPEN Science Team for Pathogens 10 Antimicrobial Resistance of Bacteria Collected from Surrogate Farms and Farms with Alternative Waste Management Systems 20
1

Evaluation of Agriclean Technology at the BR Harris Farm for Pathogens Project OPEN Science Team for Pathogens
Alternative Technology: anaerobic digester followed by solids separation Location: Bobby Ray Harris Farm, Pitt County, northwest of Greenville, NC Period of Operation: The evaluation dates are:
1st field experiment: 01/17/2005 (liquid/solid waste stream only) 2nd field experiment: 01/24/2005 (air only) 3rd field experiment: 01/31/2005 (air only)
Technology Supplier: Phil Lusk, David Palmer, Scott Pogue (Agriclean, LLC, 605-224-4334, 615-238-4477) NCSU Representative PI: Leonard Bull (919-515-6838); Lynn Worley-Davis (919-515-6852) Statement of Task:
- Measurement of microbial indicator and pathogen concentrations at key points throughout the waste treatment stream of the technology
- Measurement of airborne microbial indicator and pathogen concentrations at selected sites on the farm in close proximity to the treatment system and at the upper and lower property boundaries
- Measurement of microbial indicator and pathogen concentrations within soils from sites where treated waste water is applied, as well as background soil where spray irrigation does not occur (did not spray irrigate during sample periods)
- Microbial measurements were made during one session corresponding to a cold season. - Microbial parameters measured for the waste stream: fecal indicators (fecal coliforms, E.
coli, enterococci, spores of Clostridium perfringens, and total coliphages) and the bacterial pathogen Salmonella
- Microbial parameters measured in the air samples: total bacteria, total fungi, bacterial endotoxins, fecal indicators (fecal coliforms, E. coli, spores of Clostridium perfringens, and total coliphages) and the bacterial pathogen Salmonella
- Environmental conditions measured at sample points as air samples were collected: temperature, wind direction and speed, relative humidity, solar irradiance
Measurement of Pathogens: Treatment Technology The Bobby Ray Harris farm on which the Agriclean alternative technology is built is a finishing farm with twelve swine houses. The source of microbial contaminants on the farm is the fecal matter from the barns. At capacity, there are 960 animals per barn for a total of 11,520 animals on the farm site, with an average weight of 50 to 250 pounds (pigs are scheduled within one week of each other, all in-all out). Each of the houses utilizes tunnel ventilation and a pit-recharge system for removing the fecal matter from the barns. The pit recharge system utilizes 40,000 gallons of water per house with each house being flushed twice per week (5 houses are flushed each day (AgriJet technology)). For part of this project, there was an alternative AgriJet flush system that was to be retrofit into a portion of the houses; however, installation in all 12 houses had not been completed at the time of the evaluation. Due to time constraints, there was only a single cool season evaluation performed for this technology. For the waste treatment stream, the barns are flushed into an underground equalization tank from which the wastewater is moved into a mesophilic anaerobic digester. A portion of the mesophilic digester effluent is re-circulated through a heat exchanger to help heat in the influent from the houses. Under proper operating conditions, the 250,000 gallon digester will operate at 95oF. Methane can be harvested from the digester and used as a heat source for the incoming waste stream from the houses. From the
1

digester, the treated waste moves to an equalization tank designed to buffer system flows and then into a solids fan separator unit. At the time of this evaluation, there were no resulting solids separated from the treatment system. The treated liquid from the solids separator is then returned to a storage lagoon where it is used to flush the houses. Microbiological Samples Single grab samples were collected from points within the waste treatment streams to assess the microbial concentrations associated with the technology. Microbial concentrations were quantitatively determined in the waste stream for fecal indicators (fecal coliforms, E. coli, enterococci, spores of Clostridium perfringens, and total coliphages) and the bacterial pathogen, Salmonella. Microbiological assays were performed according to protocols outlined in the Quality Assurance Project Plan (QAPP) prepared by the Pathogens group of the OPEN team. Briefly, fecal coliform, E. coli, and enterococci bacteria were assayed using commercial, quantitative, biochemically-based (defined substrate) microbial culture assay systems and other microbial indicators were assayed using standard quantitative microbial assay methods. Salmonella was assayed using an accepted most-probable number culture assay method based on published literature. Air samples for microbial analysis were collected at sites throughout the farm. Airborne microbial concentrations were measured for total bacteria, total fungi, spores of C. perfringens, fecal coliforms, E. coli, and Salmonella. Microbiological air sampling was performed using AGI-30 all-glass impingers with sampling at 12.5 LPM for 30 minutes per sample. Each microorganism was analyzed by culture methods described in the QAPP document from the OPEN team. In addition to culturable airborne microorganisms, airborne endotoxins were collected using personal SKC air samplers at approximately 4 LPM for 4 hours. Samples were analyzed by the Limulus amebocyte lysate (LAL) test. Environmental conditions, including temperature, relative humidity (RH), wind velocity, and solar irradiation, were measured and recorded at specific locations and times when microbial air samples were collected. These microbial measurements took place according to the following schedule: Table 21.1. Pathogen Measurement Schedule and Sample Locations at BR Harris Farm Date Samples
Collected Air Samples Analyzed Waste Stream Samples Analyzed Environmental Samples Analyzed
1/17/2004 -- FF, BF, ABF, ID, ES, L --
8/2/2004 UB, LB, B, L, T -- --
8/9/2004 UB, LB, B, L, T -- --
UB=upper boundary; LB=lower boundary; B=barn; L=lagoon; T=technology; FF=fresh feces; BF=barn flush; ABF=Agriclean Barn Flush; ID= influent to digester; ES= effluent from digester; L= lagoon
2

Figure 21.1. Microbial Waste Stream Measurements Taken at BR Harris Farm
Solids
Digester
EQ Tank Solid Sep (fan)
Heat exchanger / Recirculation
Sep liquid back to lagoon
Methane storage tank
Flare
EQ tank from Houses
Lagoon
Pits in the houses are recharged with liquid from lagoon.
House 12
House1
Housing flush systems: AgriJet system is currently installed in Houses 4,5,10,11,12 which flows into the EQ tank and is then pumped to the Digester. All other houses are pit recharge (existing system) and are still being flushed weekly into the lagoon.
FF=fresh feces BF=barn flush ABF= Agriclean barn flushID=influent to digester ES=effluent from digester L=lagoon
3

Results: Waste Stream Samples Concentrations of microbial indicators and Salmonella were measured in the waste stream of two surrogate farms and of the BR Harris farm with the Agriclean technology. At each farm, the microbial “source strength” was measured directly in fresh fecal samples taken from the barns where the animals are housed (Table 21.2). Microbial concentrations in fresh feces at the surrogate farms showed some variations at different sampling times. Concentrations were higher and less variable for fecal coliforms, E. coli and enterococci than they were for C. perfringens, coliphages and Salmonella. Microbial concentrations were statistically lower in the fresh feces at the BR Harris farm than at the surrogate farms (Mann-Whitney U-test; p=0.0311). Salmonella concentrations in fresh feces were generally low for all three of the farms tested. Table 21.2. Pathogen “Source Strength" in Fresh Swine Feces for the Surrogate Farms and the
BR Harris Farm with the Agriclean Technology
Site Date Fecal
Coliform (cfu/g)
E. coli (cfu/g)
Enterococci (cfu/g)
Cl. perfringens
(cfu/g)
Coliphage (pfu/g)
Salmonella (cfu/g)
9/10/2002 1.4E+07 1.0E+07 3.6E+05 7.9E+04 2.5E+07 4.6E+01 Surrogate 1 1/7/2003 8.1E+05 1.7E+05 1.6E+05 4.5E+01 < 4.5E+04 < 3.0E+01 10/1/2002 2.9E+05 1.2E+05 5.5E+05 2.3E+02 1.8E+03 < 3.0E-01 1/28/2003 1.5E+06 2.4E+05 3.0E+05 5.4E+05 3.7E+05 2.1E-01 5/13/2003 2.4E+06 3.8E+05 5.3E+05 4.5E+03 1.8E+04 3.6E-01
Surrogate 2
7/28/2003 3.9E+06 2.9E+06 2.9E+05 3.5E+06 1.8E+06 1.1E+02 Agriclean 1/17/2005 5.2E+04 3.0E+04 1.0E+03 3.3E+02 1.8E+02 3.0E-01
In order to determine treatment efficacy of the surrogate sites and of the BR Harris farm with the Agriclean technology, log10 microbial reductions were computed for each of the treatment systems (Table 21.3). Reductions for the liquid waste streams were computed using the barn flush for each farm as the influent to the treatment systems and using the lagoon liquid microbial concentrations for the surrogate farms and the treated liquid from the digester at the BR Harris farm with the Agriclean technology. Microbial concentrations in the barn flush were used because these give a more representative estimate of the microbial concentrations of the influent to the treatment system than the microbial concentrations in fresh fecal matter. The barn flush represents a greater portion of the animals in the house and provides a more homogenous and time-integrated mixture of microbes. Additionally, these concentrations account for changes in microbial quality caused by any microbial degradation that may occur within the houses before the swine wastes enter the treatment system. Due to time constraints, the BR Harris farm was evaluated only once during the cold season. This treatment system gave somewhat lower log10 reductions for all of the microbial indicators, as well as for Salmonella, during this evaluation period compared to the reductions achieved on the surrogate farms. There are only small differences between the influent and effluent microbial concentrations and this is reflected in the low, and sometimes even negative, values for calculated log10 microbial reductions at the surrogate farm and BR Harris farm sites. There were no statistically significant differences in the log10 reductions for the alternative technology as compared to the surrogate farms (Mann-Whitney U-test, p=0.8715).
4

Table 21.3. Log10 Microbial Reductions in the Waste Streams at the Surrogate Farms and at the BR Harris Farm with the Agriclean Technology
Site Date Fecal Coliforms E. coli Enterococci Cl. perfringens Coliphage Salmonella
9/10/2002 2.0 2.1 2.0 1.3 2.0 1.4 Surrogate 1 1/7/2003 1.5 1.5 1.1 0.4 1.1 2.4
10/1/2002 1.5 1.6 0.9 1.3 0.7 > 0.2 1/28/2003 0.7 0.7 0.3 -0.3 0.7 -0.8 5/13/2003 1.6 1.2 0.9 1.4 1.0 0.3
Surrogate 2
7/28/2003 2.0 2.1 2.0 1.3 2.0 1.4 Agriclean 1/17/2005 1.5 1.5 1.5 0.1 1.1 1.7
* Negative Log10 Reduction values correspond to increases in microbial concentrations within the treatment systems
In order to better understand the overall microbial reduction for this waste management system, it is important to know the microbial concentrations in the final effluent, or treated wastewater from the system. These microbial concentrations are shown in Table 21.4. The microbial concentrations in the final treated liquids were statistically similar to those in the treated wastewaters at the surrogate farm sites (Mann-Whitney U-test, p=0.7328). There were no solids from the separation system available during the evaluation period. Table 21.4. Microbial Concentrations in Final Treated Liquids at the Surrogate Farms and at the
BR Harris Farm with the Agriclean Technology
Site Date Fecal
Coliforms (cfu/100mL)
E. coli (cfu/100
mL)
Enterococci(cfu/100mL)
Cl. perfringens (cfu/100mL)
Coliphage(pfu/100
mL)
Salmonella(cfu/100mL)
9/10/2002 2.2E+05 1.1E+05 2.0E+04 1.3E+05 4.5E+04 4.6E+02 Surrogate 1 1/7/2003 2.6E+05 1.6E+05 4.1E+05 4.9E+04 3.1E+05 4.3E+02
10/1/2002 1.3E+05 9.7E+04 2.7E+04 7.0E+04 4.6E+04 4.6E+02 1/28/2003 1.6E+05 1.1E+05 4.4E+05 9.2E+05 3.6E+05 4.6E+02 5/13/2003 2.0E+04 1.0E+04 2.8E+04 2.4E+05 3.2E+04 1.5E+01
Surrogate 2
7/28/2003 4.9E+04 1.9E+04 1.1E+04 2.3E+06 2.0E+04 3.6E+00 Agriclean 1/17/2005 2.0E+05 1.2E+05 7.4E+05 4.9E+04 3.3E+04 9.2E+00
Environmental Samples No environmental groundwater samples, soil or vegetation samples from land application sites of waste treatment solid or liquid residuals (byproducts), or vectors (flies) associated with this site were collected during the course of this evaluation (cold season evaluation only). It is hoped that the opportunity to evaluate the full technology and its possible environmental microbial (pathogen) impacts would come at some future time. On-farm Air Samples Bacteria and Fungi in Air. Concentrations of total bacteria and total fungi were measured in air on the surrogate farms and on the BR Harris farm with the Agriclean technology (Figures 21.2A and 21.2B). The results for total bacteria concentrations at the BR Harris farm were statistically lower than the concentrations on the surrogate farms (Mann-Whitney U-test; p=0.0005) (Figure 12.2A). The concentrations of total bacteria were generally in the range of 2 to 4 log10 per cubic meter at all three of these test sites. Bacterial concentrations at the surrogate sites were lowest at the upper (upwind) boundary, higher at the lower (downwind) boundary and highest near exhaust fans and barns. For the BR Harris farm, the highest levels of total bacteria in air were at the barns and the lowest concentrations were observed at the lagoon. Overall, these results indicate
5

increases in airborne bacteria on the farms compared to upwind boundary levels. Microbial increases at lower boundaries were higher on conventional farms than on the alternative technology (BR Harris) farm. Figure 21.2. Concentrations (CFU/M3) of airborne bacteria and fungi at the surrogate farms and
the BR Harris Farm with the Agriclean technology (UB: upper boundary; LB: lower boundary; B: exhaust fan or near barn; L: lagoon; T: technology)
23
45
6
UB LB B L UB LB B L UB LB B L T
surrogate1 surrogate2 Agriclean
log1
0 (T
otal
Bac
teria
)
Graphs by Farm
a. Total Bacteria
As shown in Figure 12.2(B), the levels of fungi in air tended to be similar on the surrogate farms and statistically lower at the BR Harris farm (Mann-Whitney U-test; p=0.0006). The highest airborne fungi concentrations were at certain sites on the conventional farms, such as near barns (Surrogate 1) and at the lower boundary (Surrogate 2). Concentrations were generally in the range of 2 to 4 log10 per cubic meter for the surrogate farms and in the range of 0 to 2 log10 per cubic meter for the BR Harris farm. Airborne fungi concentrations were very low at the lower boundary and at the lagoon for the BR Harris farm and were highest at the barns.
01
23
45
UB LB B L UB LB B L UB LB B L T
surrogate1 surrogate2 Agriclean
log1
0 (T
otal
Fun
gi)
Graphs by Farm
b. Total Fungi
6

Fecal Indicator Bacteria in Air. Air samples were analyzed for fecal indicator organisms and for the pathogen, Salmonella. Because many of the results for these samples were below the lower level of detection for the assays, the percentage of positive samples based on the total number of samples collected was computed and these percentages are summarized in Tables 21.5 to 21.7. There were no air samples positive for Salmonella at any of these farms sites. Both of the surrogate farms had positive air samples at the upper boundary, suggesting that there may be airborne fecal impacts from other adjacent sources. The frequencies of samples positive for fecal indicator microbes in air were generally lowest for upper boundaries and highest for sample sites near waste sources, such as exhaust fans or near barns, lagoons, or the technology. The frequencies at which air samples were positive for fecal indicator microbes were slightly higher on the surrogate farms (38 of 416 samples or 9%) as compared to the BR Harris farm (3 of 100 samples or 3%). However, these frequencies of positive samples were not significantly different (Fisher’s Exact Test; p = 0.2277) and microbial concentrations in positive microbial air samples were similar for the BR Harris farm with the Agriclean technology when compared to the surrogate farms (median concentrations of 210 and 69 CFU/M3, respectively, Mann-Whitney U-test, p = 0.6523). These results indicate that there are environmental impacts associated with the BR Harris farm and each of the surrogate farms. Table 21.5. The percentage of positive samples of Clostridium perfringens spores measured at
different sampling sites on the Surrogate Farm1, Surrogate Farm 2, and BR Harris Farm Site Surrogate Farm 1 Surrogate Farm 2 BR Harris Farm
Upper boundary 0 0 0 Lower boundary 0 29% 0 Exhaust fans or
near barn 50% 56% 0
Lagoon 13% 13% 0 Technology n/a n/a 0
1 not applicable
Table 21.6. The percentage of positive samples of total coliphage measured at different sampling sites on the Surrogate Farm1, Surrogate Farm 2, and BR Harris Farm Site Surrogate Farm 1 Surrogate Farm 2 BR Harris Farm
Upper boundary 0 13% 0 Lower boundary 0 21% 25% Exhaust fans or
near barn 13% 33% 50%
Lagoon 0 13% 0 Technology n/a n/a 0
1 not applicable Table 21.7. The percentage of positive samples of fecal coliform bacteria (E. coli) measured at
different sampling sites on the Surrogate Farm1, Surrogate Farm 2, and BR Harris Farm Site Surrogate Farm 1 Surrogate Farm 2 BR Harris Farm
Upper boundary 6% (0) 0 0 Lower boundary 0 0 0 Exhaust fans or
near barn 13% (0) 0 0
Lagoon 13% (0) 0 0 Technology n/a n/a 0
1 not applicable The levels of endotoxins measured at the two surrogate farms and the BR Harris farm with the Agriclean technology are summarized in Table 21.8. The concentrations of endotoxins varied a great deal on a daily basis at the farm sites. High levels of endotoxins (mean 985 EU/m3) were detected at the barn sample for the BR Harris farm and were similar to those at the surrogate
7

farm 2 (BR Harris and surrogate 2 each use tunnel ventilation). In some cases, the concentrations of endotoxins at the lower boundary were higher than (surrogate 2) or similar to (surrogate 1 farm and BR Harris farm with the Agriclean technology) those at the upper boundary, which suggests that endotoxins released from the swine barns were reaching the lower boundary of at least some farms (surrogate 2 and BR Harris).. Table 21.8. The levels of endotoxin from airborne dust at sampling sites
Summary Day 1 Day 2 Day 3 Day 4 Day 5 Day 6 Day 7 Mean SD Location Sites
Concentration (EU/m3) Upper Boundary 20 5 107 49 n/d1 n/d n/d 45 45
Upper Wind 9 8 47 217 n/d n/d n/d 70 100 Near Barn 1 70 62 358 481 n/d n/d n/d 243 210 Near Barn 2 217 48 510 510 n/d n/d n/d 321 229
Lagoon 160 14 108 23 n/d n/d n/d 76 70
Surrogate 1
Lower Boundary 5 6 121 47 n/d n/d n/d 45 54 Upper Boundary 1 1 15 31 6 21 2 11 12
Exhaust fan 1 28 312 2940 290 1861 288 55 825 1126Exhaust fan 2 225 n/d 2869 84 n/d n/d n/d 1059 1569
Lagoon 3 2 68 26 13 10 21 20 23 Surrogate 2
Lower Boundary 3 3 97 26 23 30 4 26 33 Upper Boundary 4 6 n/d n/d n/d n/d n/d 5 1
Barn 1922 48 n/d n/d n/d n/d n/d 985 1325Lagoon 26 3 n/d n/d n/d n/d n/d 15 17
Technology 22 3 n/d n/d n/d n/d n/d 12 14 BR Harris Farm
Lower Boundary 14 10 n/d n/d n/d n/d n/d 12 3 1 not done; 2 below limit of detection Environmental conditions were recorded simultaneously at the points on the farms where air samples were collected, with these values summarized in Table 21.9. Temperatures were somewhat variable for the different sample days for each of the surrogate farms, as would be expected due to the varied seasons of sample collection. Temperatures were lower for the BR Harris farm due to the single season (cold season) evaluation. Mean relative humidity, mean wind velocity, and mean solar irradiation were similar for each of the farms. Table 21.9. Summary of environmental conditions during microbial air sampling at the Surrogate
Farm1, Surrogate Farm 2, and BR Harris Farm (a) Temperature (°C)
Farm Day 1 Day 2 Day 3 Day 4 Day 5 Day 6 Day 7 Mean ± SD
Surrogate 1 27±1°C 23±5 °C 1±1 °C -2 ±1°C n/a1 n/a n/a 13±14°C
Surrogate 2 31±3°C 30±2°C 8±3°C 19±3°C 25±1°C 32±2°C 33±3°C 25±9°C
BR Harris Farm 4±4°C 6±2°C n/a n/a n/a n/a n/a 5±3°C
8

(b) Relative Humidity (%)
Farm Day 1 Day 2 Day 3 Day 4 Day 5 Day 6 Day 7 Mean ± SD
Surrogate 1 82±3% 52±17% 28±3% 33±7% n/a n/a n/a 49±23%
Surrogate 2 46±8% 61±6% 22±5% 80±12% 28±2% 63±5% 58±5% 51±20%
BR Harris Farm 28±13% 53±8% n/a n/a n/a n/a n/a 41±17%
(c) Average wind velocity (m/sec)
Farm Day 1 Day 2 Day 3 Day 4 Day 5 Day 6 Day 7 Mean ± SD
Surrogate 1 2.2±0.6 1.0±0.8 3.0±1.4 1.2±0.4 n/a n/a n/a 1.9±1.2
Surrogate 2 0.6±0.3 1.2±0.3 2.2±0.8 3.7±2.6 2.1±0.8 1.5±0.7 1.7±1.1 1.9±1.0
BR Harris Farm 1.0±0.5 4.1±1.4 n/a n/a n/a n/a n/a 2.6±1.9
(d) Solar irradiation (mW/cm2)
1 not applicable
Farm Day 1 Day 2 Day 3 Day 4 Day 5 Day 6 Day 7 Mean ± SD
Surrogate 1 2.4±1.4 7.1±1.3 3.8±0.8 4.3±0.7 n/a n/a n/a 4.4±2.0
Surrogate 2 5.0±1.8 5.4±2.3 5.0±0.5 3.4±2.6 10.3±1.3 6.7±3.7 11.5±0.8 6.8±3.0
BR Harris Farm 5.2±0.4 5.6±0.5 n/a n/a n/a n/a n/a 5.4±0.5
Summary Analysis: Based on the current information from a single cold season evaluation, the Agriclean system at the BR Harris farm cannot be judged environmentally superior to the current technology because there were statistically similar log10 reductions and there were high concentrations of microbial indicators and pathogens remaining in the resulting waste stream final residuals. Levels of airborne bacteria and fungi were lower at the BR Harris farm when compared to the surrogate farms; however, frequencies, levels and concentrations of some airborne fecal indicator organisms also were statistically similar for the surrogate farms and the BR Harris farm with the Agriclean technology.
9

Evaluation of Sustainable NC Technology at the Stokes Farm for Pathogens Project OPEN Science Team for Pathogens
Alternative Technology: Closed-loop liquid treatment and solids composting Location: Redhill Farm, Greene County, near Ayden, NC Period of Operation: The evaluation dates are:
1st field experiment: 03/21/2005 (air only) 2nd field experiment: 03/28/2005 (liquid/solid waste stream only)
3rd field experiment: 07/18/2005 (air and liquid/solid waste stream) 4th field experiment: 07/25/2005 (air only) 5th field experiment: 08/01/2005 (composter liquid/solid waste stream and air)
Project Investigators: Don Lloyd (Environmental Technologies, LLC; 919-922-5399) NCSU Representative PI: Kurt Creamer (919-515-4092) Statement of Task:
- Measurement of microbial indicator and pathogen concentrations at key points throughout the waste treatment stream of the technology
- Measurement of airborne microbial indicator and pathogen concentrations at selected sites on the farm in close proximity to the treatment system and at the upper and lower property boundaries
- Measurement of microbial indicator and pathogen concentrations within soils from sites where treated waste water is applied, as well as background soil where spray irrigation does not occur (did not spray irrigate during sample periods)
- Microbial measurements were made during two sessions corresponding to a warm and cold season.
- Microbial parameters measured for the waste stream: fecal indicators (fecal coliforms, E. coli, enterococci, spores of Clostridium perfringens, and total coliphages) and the bacterial pathogen Salmonella
- Microbial parameters measured in the air samples: total bacteria, total fungi, fecal indicators (fecal coliforms, E. coli, spores of Clostridium perfringens, and total coliphages) and the bacterial pathogen Salmonella
- Environmental conditions measured at sample points as air samples were collected: temperature, wind direction and speed, relative humidity, solar irradiance
Measurement of Pathogens: Treatment Technology The Sustainable NC alternative technology is located on the Redhill farm. The Redhill site is a finishing facility that consists of 3 animal barns capable of housing 1224 animals per house for a total capacity of 3672 animals on the farm. The source of microbial contamination on the farm is the animals in the houses. The fecal wastes from the barns are removed using a flush system consisting of two flush tanks per house with a capacity of 450 gallons each. The houses are flushed 4 to 5 times daily for a total volume of wastewater of 4500 to 5400 gallons per house per day. The average weight of the pigs at the facility is 150 pounds and the barns are naturally ventilated. The alternative waste management system utilizes an equalization tank to stabilize flows from the houses, after which a solids separator removes the solids from the wastes. The solids are removed using a trailer to convey them to the composter constructed at a separate site in close proximity to the Redhill farm. A sanitizer (TCM – trichlormelamine) and polymer are injected into the liquid portion of the waste stream, flocculated using a static mixer, and solids are further removed through two settling tanks in series. The settled solids and polymer is removed to the composter for further treatment. A portion of the liquid waste stream is returned to the flush
10

tanks for use in removing the wastes from the barns and the other portion is further treated through a Norweco aeration and filtration system to produce drinking water for the pigs. The Norweco treated water is mixed with well water to dilute the dissolved salts to achieve potable drinking water for the pigs. One-ppm chlorine is maintained in the water for the pigs through the use of an automatic residual chlorine monitor. Microbiological Samples Single grab samples were collected from points within the waste treatment streams to assess the microbial concentrations associated with the technology. Microbial concentrations were quantitatively determined in the waste stream for fecal indicators (fecal coliforms, E. coli, enterococci, spores of Clostridium perfringens, and total coliphages) and the bacterial pathogen, Salmonella. Microbiological assays were performed according to protocols outlined in the Quality Assurance Project Plan (QAPP) prepared by the Pathogens group of the OPEN team. Briefly, fecal coliform, E. coli, and enterococci bacteria were assayed using commercial, quantitative, biochemically-based (defined substrate) microbial culture assay systems and other microbial indicators were assayed using standard quantitative microbial assay methods. Salmonella was assayed using an accepted most-probable number culture assay method based on published literature. Air samples for microbial analysis were collected at sites throughout the farm. Airborne microbial concentrations were measured for total bacteria, total fungi, spores of C. perfringens, fecal coliforms, E. coli, and Salmonella. Microbiological air sampling was performed using AGI-30 all-glass impingers with sampling at 12.5 LPM for 30 minutes per sample. Each microorganism was analyzed by culture methods described in the QAPP document from the OPEN team. Environmental conditions, including temperature, relative humidity (RH), wind velocity, and solar irradiation, were measured and recorded at specific locations and times when microbial air samples were collected. These microbial measurements took place according to the following schedule: Table 22.1. Pathogen Measurement Schedule and Sample Locations at Stokes Farm Date Samples
Collected Air Samples Analyzed Waste Stream Samples Analyzed Environmental Samples Analyzed
3/21/2005 UB, LB, L, B, T -- --
3/28/2005 -- FF, SS, SP, BF, LS, ST, NS, DW, L --
7/18/2005 UB, LB, L, B, T FF, SS, SP, BF, LS, ST, NS, DW, L --
7/25/2005 UB, LB, L, B, T -- --
8/1/2005 (composter) UB, LB, T IN, AM, EF, CT --
UB=upper boundary; LB=lower boundary; L=lagoon B=barn; T=technology; FF=fresh feces; SS=solids from separator; SP=settled polymer; BF=barn flush; LS=liquids from separator; ST=liquids from settling tank; NS=liquid from Norweco system; DW=drinking water to houses; L=lagoon; IN=influent to composter; AM= compost amendment (cotton offal); EF=effluent from composter; CT=tea from composter
11

Figure 22.1. Microbial Waste Stream Measurements Taken at the Stokes Farm with the SNC waste treatment system
TMC Polymer
Static mixers
NORWECO system
Settling tanks Fresh H2O Tank for houses - % goes to NORWECO system (aeration/ filtration) for potable H2O for pigs This is enclosed in a building.
EQ tank for barn flush Solid separator to trailer (which under a shed)
Waste stream flow: House – EQ tank – Solid Separator (Solids are to be land applied or composted) – Liquid injected w/ TMC – mixer – Polymer injection – mixer – settling tanks – H2O tank – to barns for flush & % goes thru the NORWECO system ( aeration/ filtration) – potable H2O for pigs
Existing lagoon
Cows Cows Currently none on this pasture
Lower Field Road
N
L=lagoon SS=separated solids LS=liquid from separator NS=water from Norweco sDW=drin
ystemking water to pigs
ST=liquid from settling tank
SP=settled polymer
BF=barn flush FF=fresh feces
Results: Waste Stream Samples Concentrations of microbial indicators and Salmonella were measured in the waste stream of two surrogate farms and of the Redhill farm with the Sustainable NC (SNC) technology. At each farm, the microbial “source strength” was measured directly in fresh fecal samples taken from the barns where the animals are housed (Table 22.2). Microbial concentrations in fresh feces at the surrogate farms showed some variations at different sampling times. Concentrations were higher and less variable for fecal coliforms and E. coli than they were for enterococci, C. perfringens, coliphages and Salmonella. Microbial concentrations were statistically similar in the fresh feces at the Redhill farm on 3/28/05 and 7/18/05 and at the surrogate farms (Mann-Whitney U-test; p=0.8583). Microbial concentrations were statistically lower in the fecal matter at the Redhill farm that was subjected to composting on 8/1/05 as compared to the microbial concentrations in the fresh feces at the surrogate farms (Mann-Whitney U-test; p=0.0195). When all of the data for the Redhill farm is combined, there are no statistically significant differences between the fecal matter at this farm compared to the surrogate farm sites (Mann-Whitney U-test; p=0.1805). Salmonella concentrations in fresh feces were generally low for all three of the farms tested.
12

Table 22.2. Pathogen “Source Strength" in Fresh Swine Feces for the Surrogate Farms and the Stokes Farm with the Sustainable NC Technology
Site Date Fecal
Coliform (cfu/g)
E. coli (cfu/g)
Enterococci (cfu/g)
Cl. perfringens
(cfu/g)
Coliphage (pfu/g)
Salmonella (cfu/g)
9/10/2002 1.4E+07 1.0E+07 3.6E+05 7.9E+04 2.5E+07 4.6E+01 Surrogate 1 1/7/2003 8.1E+05 1.7E+05 1.6E+05 4.5E+01 < 4.5E+04 < 3.0E+01 10/1/2002 2.9E+05 1.2E+05 5.5E+05 2.3E+02 1.8E+03 < 3.0E-01 1/28/2003 1.5E+06 2.4E+05 3.0E+05 5.4E+05 3.7E+05 2.1E-01 5/13/2003 2.4E+06 3.8E+05 5.3E+05 4.5E+03 1.8E+04 3.6E-01
Surrogate 2
7/28/2003 3.9E+06 2.9E+06 2.9E+05 3.5E+06 1.8E+06 1.1E+02 3/28/2005 2.6E+06 1.8E+06 2.0E+05 2.3E+05 3.0E+06 7.4E-01 SNC 7/18/2005 2.0E+06 7.5E+05 4.8E+03 4.9E+01 3.3E+04 3.0E-01
SNC composter 8/1/2005 2.0E+02 2.0E+02 3.1E+03 4.6E+03 6.0E+02 3.0E-01
In order to determine treatment efficacy of the surrogate sites and of the Redhill farm with the SNC technology, log10 microbial reductions were computed for each of the treatment systems (Table 22.3). Reductions for the liquid waste streams were computed using the barn flush for each farm as the influent to the treatment systems and using as final residuals the lagoon liquid microbial concentrations for the surrogate farms and the combined treated liquid and solid residuals at the Redhill farm with the SNC technology. Microbial concentrations in the barn flush were used because these give a more representative estimate of the microbial concentrations of the influent to the treatment system than the microbial concentrations in fresh fecal matter. The barn flush represents a greater portion of the animals in the house and provides a more homogenous and time-integrated mixture of microbes. Additionally, these concentrations account for changes in microbial quality caused by any microbial degradation that may occur within the houses before the swine wastes enter the treatment system. During the first two evaluation periods, the composter system was not operational and microbial reductions were computed based on no further treatment of the separated waste solids from the system. The technology provider and NCSU representative provided flow estimates that allowed us to make computations for the microbial reductions achieved by the system. These microbial reductions are based on 16% of the overall flow through the system removed as solids by the solids separator, 17% of the flow removed as solids by the flocculation and settling, 56% of the flow returned as liquid to the flush tanks of the barns, and 11% of the flow treated through the Norweco system for producing potable drinking water for the pigs. This treatment system gave relatively low log10 reductions for all of the microbial indicators, as well as for Salmonella, during these two evaluation periods compared to the reductions achieved on the surrogate farms. The comparatively low microbial reductions in the alternative technology were because of the higher microbial concentrations in the solids from the separator and from the settling tanks. There are only small differences between the influent and effluent microbial concentrations and this is reflected in the low, and sometimes even negative, values for calculated log10 microbial reductions at the surrogate farm sites and at the BR Harris farm with the SNC technology. The alternative SNC technology actually performed worse than the surrogate farms as evidenced by statistically lower log10 reductions in the waste stream (Mann-Whitney U-test, p=0.0033). The composter was operational and was evaluated on 8/1/2005. Microbial log10 reductions were computed using the separated solids from the SNC technology as the influent material and the composter effluent liquids and solids. There were statistically higher log10 reductions achieved by the composter alone as compared to the reductions at the surrogate farm sites (Mann-Whitney U-test; p=0.0051).
13

Table 22.3. Log10 Microbial Reductions in the Waste Streams at the Surrogate Farms and at the Stokes Farm with the Sustainable NC Technology
Site Date Fecal Coliforms E. coli Enterococci Cl. perfringens Coliphage Salmonella
9/10/2002 2.0 2.1 2.0 1.3 2.0 1.4 Surrogate 1
1/7/2003 1.5 1.5 1.1 0.4 1.1 2.4 10/1/2002 1.5 1.6 0.9 1.3 0.7 > 0.2 1/28/2003 0.7 0.7 0.3 -0.3* 0.7 -0.8 5/13/2003 1.6 1.2 0.9 1.4 1.0 0.3
Surrogate 2
7/28/2003 2.0 2.1 2.0 1.3 2.0 1.4 3/28/2005 0.3 0.7 1.0 0.5 0.4 > 0.1 SNC 7/18/2005 0.3 > 0.4 -0.2 > 0.1 > 1.6 > 0.0
SNC composter 8/1/2005 2.1 2.3 2.6 3.0 2.9 0.8
* Negative Log10 Reduction values correspond to increases in microbial concentrations within the treatment systems
Table 22.3 demonstrates the microbial reductions achieved by the SNC technology without and with the subsequent composter for treatment of the separated solids. In order to understand the overall efficacy of the SNC system, it is important to compute the combined reductions that would be expected by the SNC technology for treatment of waste liquids and the composter for treatment of the separated waste solids. The microbial reductions are summarized in Table 22.4. As expected, greater overall microbial reductions are achieved by the complete system for solids and liquid treatment. These microbial reductions for the overall system are statistically similar to the reductions achieved by the conventional systems on the surrogate farm sites (Mann-Whitney U-test; p=0.7750). Table 22.4. Log10 Microbial Reductions in the Waste Streams at the Surrogate Farms and at the
Stokes Farm with the Combined Sustainable NC Technology and Composter
Site Date Fecal Coliforms E. coli Enterococci Cl. perfringens Coliphage Salmonella
9/10/2002 2.0 2.1 2.0 1.3 2.0 1.4 Surrogate 1
1/7/2003 1.5 1.5 1.1 0.4 1.1 2.4 10/1/2002 1.5 1.6 0.9 1.3 0.7 > 0.2 1/28/2003 0.7 0.7 0.3 -0.3* 0.7 -0.8 5/13/2003 1.6 1.2 0.9 1.4 1.0 0.3
Surrogate 2
7/28/2003 2.0 2.1 2.0 1.3 2.0 1.4 -- 1.2 1.3 1.8 1.4 1.3 > 0.3 SNC liquid +
composter -- 1.1 > 1.2 0.9 > 1.1 > 2.1 > 0.3 * Negative Log10 Reduction values correspond to increases in microbial concentrations within the treatment
systems These values for microbial reductions are somewhat misleading because the calculations take into account the portion of the waste from the settling tanks (56% of the total flow) that is re-circulated to flush the barns and that never leave the system. In order to better understand the efficacy of this combined treatment system, it is important to consider the microbial concentrations in the final treated waste residuals resulting from treatment (Table 22.5). The residuals from the system are the resulting liquid from the Norweco system (Table 22.5 – liquid) that is diluted as potable drinking water for the pigs (Table 22.5 – drinking water) and the resulting liquid and solids from the compost unit. During the first evaluation, the microbial concentrations were still quite high in the treated Norweco liquids (1.7E+03 to 4.6E+05 cfu of pfu/100 mL; except
14

Salmonella which was below detection limits). For the second evaluation, these microbial concentrations were considerably lower (below detection limits to 1.3E+02 cfu/100 mL). The microbial concentrations in the treated liquids from the Norweco system are statistically lower than the microbial concentrations in the liquids at the surrogate farms with conventional treatment (Mann-Whitney U-test; p=0.0008). The drinking water reflects these microbial concentrations, with detectable levels of indicators in drinking water during the initial evaluation period and generally below detection limits during the second evaluation period. Of particular note and concern are the viral indicators (coliphage) during the initial period with 680 pfu/100 mL that was going to the pigs for potable drinking water. There are two waste residuals from the compost unit: a solid residual and a compost “tea” material. The technology providers noted during the evaluations that the liquid “tea” material had been previously used from other similar systems as a nutrient source for plants. This may not be an acceptable practice for raw food plants (e.g., produce) without further treatment of this material. This is because of the high microbial concentrations that we measured during this evaluation, including measurable concentrations of the frank pathogen, Salmonella (1.5E+01 to 3.6E+05 cfu or pfu/100mL). However, these microbial concentrations are statistically lower than the residual materials from the surrogate farms with conventional treatment and those liquids are land applied at agronomic rates (Mann-Whitney U-test; p=0.0423). For the solid residual from the compost unit, the microbial concentrations are reported in Table 22.5 as concentrations per 100 grams wet weight. These microbial concentrations in the composted solid materials are statistically lower compared with the microbial concentrations in the treated residuals from the surrogate farms (Mann-Whitney U-test; p=0.0269). It should also be noted that this material meets Class A biosolids standards for fecal coliform bacteria (<1000 fecal coliform bacteria per gram) and for Salmonella (<3 Salmonella per 4 grams). However, further studies would be needed to demonstrate whether the material meets the total culturable virus (<1 total per 4 grams) and viable helminth ova standards (<1 viable helminth (Ascaris) ova per 4 grams). Overall microbial concentrations from this combined system (treated liquid from the SNC technology and treated liquid and solids from the compost unit) were statistically lower that those microbial concentrations in treated residual materials from the surrogate farm site (Mann-Whitney U-test; p<0.0001). Table 22.5. Microbial Concentrations in Final Treated Residuals at the Surrogate Farms and at
the Stokes Farm with the Sustainable NC Technology
Site Date Material Fecal Coliforms(cfu/100mL)
E. coli (cfu/100 mL)
Enterococci(cfu/100mL)
Cl. perfringens (cfu/100mL)
Coliphage (pfu/100 mL)
Salmonella (cfu/100mL)
9/10/02 liquid 2.2E+05 1.1E+05 2.0E+04 1.3E+05 4.5E+04 4.6E+02 Surrogate 1 1/7/03 liquid 2.6E+05 1.6E+05 4.1E+05 4.9E+04 3.1E+05 4.3E+02
10/1/02 liquid 1.3E+05 9.7E+04 2.7E+04 7.0E+04 4.6E+04 4.6E+02 1/28/03 liquid 1.6E+05 1.1E+05 4.4E+05 9.2E+05 3.6E+05 4.6E+02 5/13/03 liquid 2.0E+04 1.0E+04 2.8E+04 2.4E+05 3.2E+04 1.5E+01
Surrogate 2
7/28/03 liquid 4.9E+04 1.9E+04 1.1E+04 2.3E+06 2.0E+04 3.6E+00 liquid 1.4E+04 1.2E+04 3.7E+03 1.7E+03 4.6E+05 <3.0E+01
3/28/05 drinking water 5.6E+01 3.7E+01 5.1E+00 2.0E+01 6.8E+02 <3.0E+01
liquid 1.3E+02 <1.0E+01 2.0E+01 <1.8E+01 <4.5E+01 <3.0E+01 SNC
7/18/05 drinking water 1.9E+01 <1.0E+01 1.5E+01 <1.8E+01 <4.5E+01 <3.0E+01
liquid 1.5E+04 3.5E+03 3.6E+05 4.5E+01 5.0E+01 1.5E+01 SNC composter 8/1/05
solids 6.8E+04 6.1E+03 1.7E+04 2.3E+03 5.0E+03 2.0E+01
15

Environmental Samples No environmental groundwater samples, soil or vegetation samples from land application sites of waste treatment solid or liquid residuals (byproducts), or vectors (flies) associated with this site were collected during the course of this evaluation. We attempted to collect vectors (flies) at this technology site on both 3/28/2005 and 7/18/2005, but none were caught. This presumably was due to low numbers of flies at this site during those evaluation periods. We were not able to collect houseflies at the SNC compost site on 8/1/05; however, we did note houseflies around the compost unit. We suggested to the technology providers that the piled composted material should be covered to avoid any potential contamination issues as a result of houseflies at the site. It is hoped that the opportunity to evaluate the full technology and its possible environmental microbial (pathogen) impacts would come at some future time. On-farm Air Samples Bacteria and Fungi in Air. Concentrations of total bacteria and total fungi were measured in air on the surrogate farms and on the Redhill farm with the SNC Technology (Figures 22.2A and 22.2B). Total bacteria concentrations at the Redhill farm were statistically lower than the concentrations at the surrogate farms (Figure 12.2A)(Mann-Whitney U-test, p<0.0001). The concentrations of total bacteria were generally in the range of 2 to 6 log10 per cubic meter at all three of these test sites. Bacterial concentrations at the surrogate sites were lowest at the upper (upwind) boundary, higher at the lower (downwind) boundary and highest near exhaust fans and barns. For the Redhill farm, the highest levels of total bacteria in air were at barns followed closely by the technology samples. Overall, these results indicate increases in airborne bacteria on the farms compared to upwind boundary levels. Microbial increases at lower boundaries were higher on conventional farms than on the alternative technology (Redhill) farm on the basis of log10 concentrations at upper boundaries, especially when the composter was operational at the alternative technology site. Figure 22.2. Concentrations (CFU/M3) of airborne bacteria and fungi at the surrogate farms and
the Redhill farm with the Sustainable NC technology (UB: upper boundary; LB: lower boundary; B: exhaust fan or near barn; L: lagoon; T: technology)
23
45
6
UB LB B L UB LB B L UB LB B L T UB LB T
surrogate1 surrogate2 SNC SNCcomposter
log1
0 (T
otal
Bac
teria
)
Graphs by Farm
a. Total Bacteria
As shown in Figure 12.2(b), the levels of fungi in air were statistically higher on the surrogate farms as compared to the Redhill farm with the SNC technology. The highest airborne fungi concentrations were at certain sites on the conventional farms, such as near barns (Surrogate 1) and at the lower boundary (Surrogate 2). The highest fungi concentrations associated with the
16

SNC technology were at the compost unit. Concentrations were generally in the range of 2 to 4 log10 per cubic meter. In general, airborne fungi concentrations were lower at the upper (upwind) boundary of surrogate farms, higher at the lower (downwind) boundary and highest near exhaust fans and barns. Overall, airborne fungi concentrations were somewhat lower on the alternative technology (Redhill) farm as compared to the surrogate farms.
01
23
45
UB LB B L UB LB B L UB LB B L T UB LB T
surrogate1 surrogate2 SNC SNCcomposter
log1
0 (T
otal
Fun
gi)
Graphs by Farm
b. Total Fungi
Fecal Indicator Bacteria in Air. Air samples were analyzed for fecal indicator organisms and for the pathogen, Salmonella. Because many of the results for these samples were below the lower level of detection for the assays, the percentage of positive samples based on the total number of samples collected was computed and these percentages are summarized in Tables 22.6 to 22.8. There were no positive air samples at any of the sites for the frank pathogen, Salmonella. Both of the surrogate farms had positive air samples at the upper boundary, suggesting that there may be airborne fecal impacts from other adjacent sources. The frequencies of samples positive for fecal indicator microbes in air were generally lowest for upper boundaries and highest for sample sites near waste sources, such as exhaust fans or near barns, lagoons, or the technology. The frequencies at which air samples were positive for fecal indicator microbes were higher on the surrogate farms (38 of 416 samples or 9%) as compared to the Redhill farm (0 of 120 samples or 0%). These frequencies of positive samples were significantly lower (Fischer’s Exact Test; p<0.0001) for the Redhill farm as compared to the frequencies of positives at the surrogate farm sites. These results indicate that there are fewer environmental impacts from airborne fecal microbes associated with the Redhill farm than at the surrogate farms. Table 22.6. The percentage of positive samples of Clostridium perfringens spores measured at
different sampling sites on the Surrogate Farm1, Surrogate Farm 2, and Redhill farm with the SNC Technology Site Surrogate Farm 1 Surrogate Farm 2 SNC
Upper boundary 0 0 0 Lower boundary 0 29% 0 Exhaust fans or
near barn 50% 56% 0
Lagoon 13% 13% 0 Technology n/a n/a 0
Technology 2 (compost) n/a n/a 0
1 not applicable
17

Table 22.7. The percentage of positive samples of total coliphage measured at different sampling
sites on the Surrogate Farm1, Surrogate Farm 2, and Redhill farm with the SNC Technology Site Surrogate Farm 1 Surrogate Farm 2 SNC
Upper boundary 0 13% 0 Lower boundary 0 21% 0 Exhaust fans or
near barn 13% 33% 0
Lagoon 0 13% 0 Technology n/a n/a 0
Technology 2 (compost) n/a n/a 0
1 not applicable Table 22.8. The percentage of positive samples of fecal coliform bacteria (E. coli) measured at
different sampling sites on the Surrogate Farm1, Surrogate Farm 2, and Redhill farm with the SNC Technology Site Surrogate Farm 1 Surrogate Farm 2 SNC
Upper boundary 6% (0) 0 0 Lower boundary 0 0 0 Exhaust fans or
near barn 13% (0) 0 0
Lagoon 13% (0) 0 0 Technology n/a n/a 0
Technology 2 (compost) n/a n/a 0
1 not applicable Environmental conditions were recorded simultaneously at the points on the farms where air samples were collected, with these values summarized in Table 22.9. Temperatures were somewhat variable for the different sample days for each of the farm sites, as would be expected due to the varied seasons of sample collection. Mean relative humidity, mean wind velocity, and mean solar irradiation were similar for each of the farms tested. Table 22.9. Summary of environmental conditions during microbial air sampling at the Surrogate
Farm1, Surrogate Farm 2, and Stokes Farm with the SNC Technology (a) Temperature (°C)
Farm Day 1 Day 2 Day 3 Day 4 Day 5 Day 6 Day 7 Mean ± SD
Surrogate 1 27±1°C 23±5 °C 1±1 °C -2 ±1°C n/a1 n/a n/a 13±14°C
Surrogate 2 31±3°C 30±2°C 8±3°C 19±3°C 25±1°C 32±2°C 33±3°C 25±9°C
SNC 18±2 35±3 °C 33±3 °C 26±1 °C n/a n/a n/a 28±7°C
(b) Relative Humidity (%)
Farm Day 1 Day 2 Day 3 Day 4 Day 5 Day 6 Day 7 Mean ± SD
Surrogate 1 82±3% 52±17% 28±3% 33±7% n/a n/a n/a 49±23%
Surrogate 2 46±8% 61±6% 22±5% 80±12% 28±2% 63±5% 58±5% 51±20%
SNC 31±5% 60±7% 60±8% 81±3% n/a n/a n/a 55±18%
18

(c) Average wind velocity (m/sec)
Farm Day 1 Day 2 Day 3 Day 4 Day 5 Day 6 Day 7 Mean ± SD
Surrogate 1 2.2±0.6 1.0±0.8 3.0±1.4 1.2±0.4 n/a n/a n/a 1.9±1.2
Surrogate 2 0.6±0.3 1.2±0.3 2.2±0.8 3.7±2.6 2.1±0.8 1.5±0.7 1.7±1.1 1.9±1.0
SNC 0.8±0.5 1.6±1.0 2.0±1.1 1.5±0.7 n/a n/a n/a 1.5±1.0
(d) Solar irradiation (mW/cm2)
1 not applicable
Farm Day 1 Day 2 Day 3 Day 4 Day 5 Day 6 Day 7 Mean ± SD
Surrogate 1 2.4±1.4 7.1±1.3 3.8±0.8 4.3±0.7 n/a n/a n/a 4.4±2.0
Surrogate 2 5.0±1.8 5.4±2.3 5.0±0.5 3.4±2.6 10.3±1.3 6.7±3.7 11.5±
0.8 6.8±3.0
SNC 8.1±1.7 9.8±3.0 9.7±1.2 3.3±0.8 n/a n/a n/a 8.2±3.0
Summary Analysis: Overall, the SNC technology built at the Redhill farm site can potentially be viewed as an environmentally superior technology even though it does not show extensive microbial log10 reductions in the waste stream. This is because a significant portion of the flow (56%) is contained within the system. The resulting microbial concentrations in the final treated residual material (drinking water to pigs and composted solids and liquids) are statistically lower than the residual materials from the surrogate farm sites with the conventional treatment technologies. These treated materials include the water that is treated through the Norweco system for potable use by the pigs on the farm, and the liquid and solid material from the compost unit. Although the microbial concentrations in the compost liquid “tea” are somewhat high, they are statistically lower than the treated residual liquids from the surrogate farms with conventional treatment that are generally land applied in much greater volumes for agronomic purposes to crops at farm sites. Additionally, the residual solid material from the compost unit had microbial concentrations that are statistically lower that the residuals from the conventional technology sites (Mann-Whitney U-test; p=0.0052), and further go on to meet Class A biosolids standards for fecal coliform bacteria and Salmonella (analyses were not performed to determine if they meet Class A biosolids standards for total culturable viruses and helminth ova). It should further be noted that the volumes of residual materials from the compost unit are less than the volumes of treated liquids on farm sites utilizing conventional technology. Therefore, not only are the microbial concentrations lower at the SNC technology site, but the microbial loads (concentration X volume) to the environmental will be lower than at farm sites with the conventional technologies. Furthermore, there were statistically lower airborne microbial indicator (total bacteria and fungi) concentrations at the Redhill farm with the SNC technology as compared to concentrations in air at the surrogate farm sites with conventional technologies. There were no airborne fecal indicators (fecal coliform bacteria, E. coli, spores of Cl. perfringens, and coliphage) or Salmonella detected in any of the samples collected to the Redhill farm site, as compared to 9% frequency at the surrogate farm sites. Finally, there were no houseflies collected at the Redhill site during each of the sampling periods; this presumably was because there were low concentrations of houseflies associated with the technology at this site.
19

Antimicrobial Resistance of Bacteria collected from Surrogate Farms and Farms with Alternative Waste Management Systems
(Note: This report is a revision of information presented in the 2005 Phase 2 Report for Technology Determinations, Appendix A8, Pathogen Emissions Report)
This section of the report summarizes the essential study findings on the performance of the alternative swine waste technologies for presence and reductions of antimicrobial resistance for E. coli and Salmonella relative to the antimicrobial resistance for bacteria isolated from the surrogate farms and relative to each other. Antimicrobial resistance analyses were done on bacteria isolates from eighteen swine farms: two surrogate farms and sixteen farms or sites with alternative technologies. The alternative technology farms include:
- Goshen Ridge farm with the Super Soils technology for treatment of liquid wastes, - Hickory Grove site with the Super Soils composting technology for the waste solids from
the Goshen Ridge farm, - Grinnells laboratory on the NCSU campus with the ReCycle belt system, - Lake Wheeler Research farm with the ReCycle gasifier, - Harrells farm with the ISSUES technology, - Carrolls farm with the ISSUES technology, - Vestal farm with the ISSUES technology, - Agriclean farm, - Corbett farm #1 (BEST) technology, - Corbett farms #3/4 technology, - Murphy-Brown farm # 93 (Ekokan) technology, - ORBIT/HSAD (High Solids Anaerobic Digester) technology, - Corbett Farm #2 (ReCip) Technology, - Sequencing Batch Reactor (SBR) Technology, - Howard Farm (Constructed Wetlands) technology, and - Barham farm with a covered ambient temperature digester, biological nitrification of
digester liquid effluent and recycle of the nitrified effluent for fertilization of greenhouse tomatoes.
Both E. coli and Salmonella were chosen for antibiotic testing because they are common in the intestinal tracts of swine and it is possible for each of them to cause disease outbreaks in animals and humans. Salmonella is clearly a frank pathogen. Multiple antibiotic resistance is also important for E. coli, although it is not always a frank pathogen. However, some strains of E. coli are human pathogens and antibiotic resistance can be associated with genetic material on plasmids that can be transferred from one bacterium to another. Strains of E. coli harbored by animals that are human pathogens include E. coli O157:H7 harboring Shiga-like toxin genes and various enterotoxigenic strains harboring genes for heat stable and/or heat labile toxins. It is possible that the widespread antibiotic resistance seen in the E. coli isolates, including the non-pathogenic strains, can be transferred to other frank pathogens, such as pathogenic strains of E. coli, Salmonella and Campylobacter. An important consideration in judging if alternative technologies were superior to conventional technologies on the basis of reducing antimicrobially resistant bacteria was to determine whether or not alternative treatments resulted in greater extents of reduction of these bacteria in treated waste residuals based on lower occurrence of antimicrobial resistance traits in E. coli and Salmonella bacteria isolates after treatment than before treatment as compared to the conventional technology. For antimicrobial resistance testing, a micro-dilution method was used as described in detail in the QAPP document for this project. Bacterial isolates were tested for their resistance to nine different antibiotics: streptomycin (STR), chlortetracycline (CTET), tetracycline (TET), trimethoprim (TMP), sulfamethoxazole (SMX), chloramphenicol (CHL), ciprofloxacin (CIP), gentamicin (GEN), and ampicillin (AMP). Briefly, bacteria were isolated from waste stream, air,
20

and environmental samples from the farms. Such isolation was a subsequent step following enumeration of the bacteria for evaluation of remaining microbial concentrations in treatment residuals and environmental media potentially impacted the systems and determination of microbial reductions by treatment processes. The bacterial isolates were purified by three successive pure colony isolation steps and resulting isolates were subjected to biochemical confirmation of their identity (i.e. E. coli or Salmonella). Provided the isolates confirmed as the bacteria of interest, they were then diluted to a proper concentration for testing by analysis on antimicrobial micro-titer plates. The micro-titer plates have varying concentrations of the antibiotics of interest pre-distributed to wells on the plates and equal amounts of bacteria are inoculated to each of the wells. Following a 24-hour incubation, wells are scored as positive (antimicrobially resistant) or negative (antimicrobially sensitive) for bacterial growth. From this information, a minimum inhibitory concentration (MIC) for each antibiotic can be calculated. This MIC corresponds to the least amount of each antibiotic that is required to inhibit growth of the bacterial isolate. Depending on the MIC, the E. coli and Salmonella isolates were classified into susceptible or resistant categories based on the breakpoints for humans set by the National Committee for Clinical Laboratory Standards (NCCLS). This classification was used instead of any corresponding MICs for animals because of the interest in human public health impacts associated with antimicrobial resistant bacteria from these farms. An additional use for antimicrobial resistance patterning is for microbial source tracking, where it is possible compare the numbers and types of antimicrobials detected in the waste stream samples on the farms to those from environmental samples (i.e. air, ground and surface waters, and soils and vegetation from land application sites on the farms of treated residual material). Unfortunately, we were unable to isolate a sufficient number of E. coli and Salmonella from environmental samples to effectively make these comparisons for microbial source tracking analysis. Where environmental isolates were collected, they are noted in the report. Sources of Bacterial Isolates on Farms Bacterial isolates used for determining antimicrobial resistance were collected from throughout the waste streams on each of the test farms. These locations are summarized in Tables 18.1 to 18.18. For each of the farm sites, an attempt was made to collect equivalent numbers of isolates from each of the sample locations on the farms. This was possible for E. coli due to the sizeable number of isolated colonies. However, it was not always possible for Salmonella because few if any of these bacteria were isolated from some sites and samples. Surrogate farm 1 was a commercial swine farm that used a conventional waste treatment system consisting of an anaerobic lagoon and sprayfield. This system flushed wastes from the barns into a conventional anaerobic lagoon system. Nineteen E. coli and twenty Salmonella isolates were tested from Farm 1 and their sources are summarized in Table 18.1.
Table 18.1 Sources of E. coli and Salmonella isolates from Surrogate Farm 1
Source # of E. coli
isolates (n=19)
# of Salmonella isolates (n=19)
Fresh Feces 6 3 Influent to Lagoon 6 8 Lagoon 7 8
Surrogate farm 2 was a commercial swine farm that used a conventional waste treatment system consisting of an anaerobic lagoon and sprayfield in which the waste from the barn was flushed into an anaerobic lagoon. Thirty-one E. coli isolates and 33 Salmonella isolates were collected and analyzed. Isolates were also collected and analyzed from environmental samples of soils and vegetation to which lagoon liquid had been land applied in accordance with the waste
21
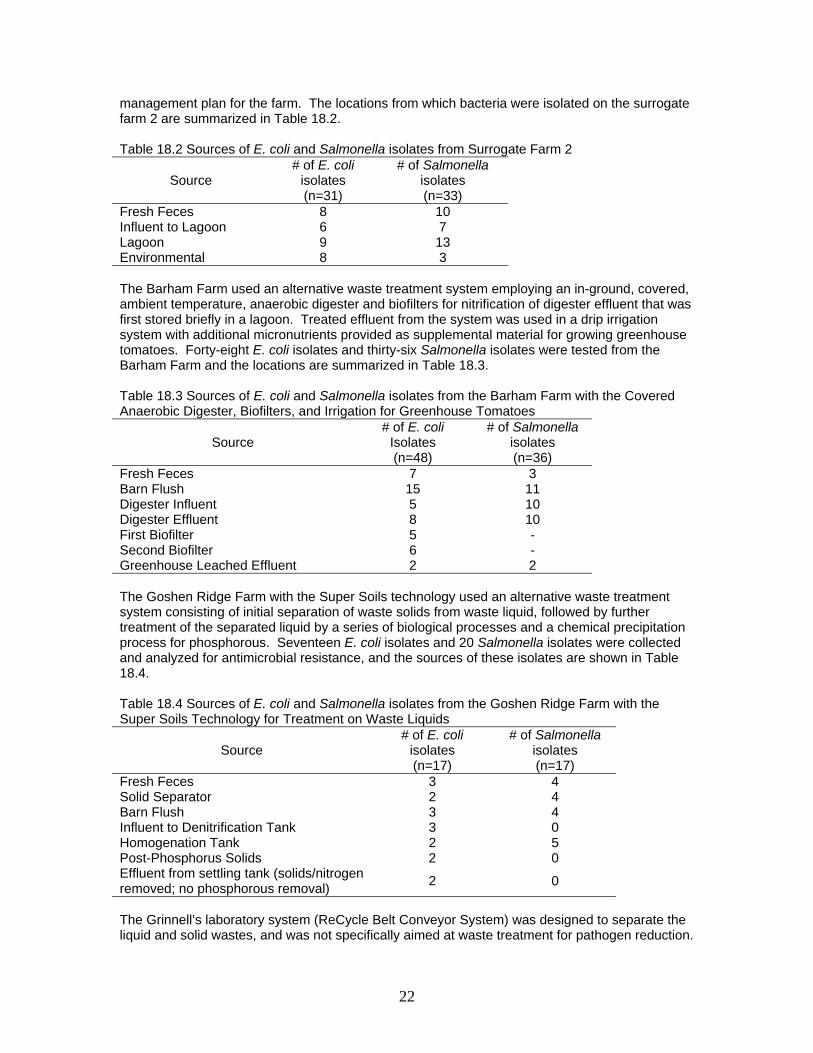
management plan for the farm. The locations from which bacteria were isolated on the surrogate farm 2 are summarized in Table 18.2. Table 18.2 Sources of E. coli and Salmonella isolates from Surrogate Farm 2
Source # of E. coli
isolates (n=31)
# of Salmonella isolates (n=33)
Fresh Feces 8 10 Influent to Lagoon 6 7 Lagoon 9 13 Environmental 8 3 The Barham Farm used an alternative waste treatment system employing an in-ground, covered, ambient temperature, anaerobic digester and biofilters for nitrification of digester effluent that was first stored briefly in a lagoon. Treated effluent from the system was used in a drip irrigation system with additional micronutrients provided as supplemental material for growing greenhouse tomatoes. Forty-eight E. coli isolates and thirty-six Salmonella isolates were tested from the Barham Farm and the locations are summarized in Table 18.3. Table 18.3 Sources of E. coli and Salmonella isolates from the Barham Farm with the Covered Anaerobic Digester, Biofilters, and Irrigation for Greenhouse Tomatoes
Source # of E. coli
Isolates (n=48)
# of Salmonella isolates (n=36)
Fresh Feces 7 3 Barn Flush 15 11 Digester Influent 5 10 Digester Effluent 8 10 First Biofilter 5 - Second Biofilter 6 - Greenhouse Leached Effluent 2 2 The Goshen Ridge Farm with the Super Soils technology used an alternative waste treatment system consisting of initial separation of waste solids from waste liquid, followed by further treatment of the separated liquid by a series of biological processes and a chemical precipitation process for phosphorous. Seventeen E. coli isolates and 20 Salmonella isolates were collected and analyzed for antimicrobial resistance, and the sources of these isolates are shown in Table 18.4. Table 18.4 Sources of E. coli and Salmonella isolates from the Goshen Ridge Farm with the Super Soils Technology for Treatment on Waste Liquids
Source # of E. coli
isolates (n=17)
# of Salmonella isolates (n=17)
Fresh Feces 3 4 Solid Separator 2 4 Barn Flush 3 4 Influent to Denitrification Tank 3 0 Homogenation Tank 2 5 Post-Phosphorus Solids 2 0 Effluent from settling tank (solids/nitrogen removed; no phosphorous removal) 2 0
The Grinnell’s laboratory system (ReCycle Belt Conveyor System) was designed to separate the liquid and solid wastes, and was not specifically aimed at waste treatment for pathogen reduction.
22

This technology was linked with the ReCycle gasifier system at the Lake Wheeler Research farm. This was a pilot-scale facility and the final fate of the separated liquid (urine) from the system was not specified. Six E. coli isolates were collected and analyzed for antimicrobial resistance, and the sources of these isolates are shown in Table 18.5. Table 18.5 Sources of E. coli isolates from the ReCycle Belt System at the Grinnells Laboratory
Source # of E. coli
isolates (n=6)
Feces from belt 5 Urine 1 The ReCycle gasifier technology was the gasification system utilized for treatment of separated solids and was linked with the ReCycle belt system (Grinnells laboratory) for removal and separation of the liquids and solids from the barns. Five E. coli isolates were collected and analyzed for antimicrobial resistance, and the source of these isolates is shown in Table 18.6. Table 18.6 Sources of E. coli isolates from the ReCycle Gasifier at the Lake Wheeler Research Farm
Source # of E. coli
isolates (n=5)
Influent Solids 5 The Carrolls farm used a combined in-ground anaerobic digester with an aerobic blanket, combined with a BioKinetic aeration process for nitrification-denitrification of the swine wastes from the barns. Twenty E. coli and sixteen Salmonella isolates were collected and analyzed for antimicrobial resistance, and the sources of theses isolates are shown in Table 18.7. Table 18.7 Sources of E. coli and Salmonella isolates from the Carrolls Farm
Source # of E. coli
isolates (n=20)
# of Salmonella isolates (n=16)
Fresh Feces 3 5 Flies 2 2 Barn Flush 3 2 Lagoon 1 3 3 Aeration basin 3 1 Spray irrigated soil/vegetation 2 1 Aerated Spray/abs effluent 4 2 The Harrells farm used an in-ground digester with a permeable cover and aerobic blanket combined with a BioKinetic aeration process for nitrification-denitrification of the swine wastes from the barns. Thirty-seven E. coli and nine Salmonella isolates were collected and analyzed for antimicrobial resistance, and the sources of theses isolates are shown in Table 18.8.
23

Table 18.8 Sources of E. coli and Salmonella isolates from the Harrells Farm
Source # of E. coli
isolates (n=37)
# of Salmonella isolates (n=9)
Fresh Feces 5 1 Influent to digester 5 1 Barn Flush 5 1 Influent to polishing reservoir 5 1 Polishing reservoir 6 2 Clarifier Solids 4 3 Spray irrigated soil/vegetation 3 - Background Soil 4 The Vestal farm used a mesophilic anaerobic digester with methane recovery and power generation, followed by an aerobic digester and water reuse system. Nineteen E. coli and seventeen Salmonella isolates were collected and analyzed for antimicrobial resistance, and the sources of theses isolates are shown in Table 18.9. Table 18.9. Sources of E. coli and Salmonella isolates from the Vestal Farm
Source # of E. coli
isolates (n=19)
# of Salmonella isolates (n=17)
Fresh Feces 1 - Barn Flush 3 3 Clarifier Solids 1 1 Influent to water reuse 1 2 Clarifier Liquids 2 3 Effluent from water reuse 2 2 Effluent from mesophilic digester 3 2 Digested solids 2 - Settling basin 4 4 The Super Soils composting technology was a centralized waste solids composting and processing facility linked to the Super Soils system at the Goshen Ridge farm site. Waste solids were processed for value-added products that were to be for use and sale off site. Seventeen E. coli and ten Salmonella isolates were collected and analyzed for antimicrobial resistance, and the sources of these isolates are shown in Table 18.10. Table 18.10 Sources of E. coli and Salmonella isolates from the SS Composting Farm
Source # of E. coli
isolates (n=17)
# of Salmonella isolates (n=10)
Wood shavings 2 1 Flies 4 3 Semi composted (15 days) 2 2 Effluent solids 5 4 Influent solids 4 - The Agriclean system utilizes an anaerobic digester followed by solids separation using a fan separator unit. The treated liquid from the solids separator is then returned to a storage lagoon where it is used to flush the houses. Eight E. coli and seventeen Salmonella isolates were collected and analyzed for antimicrobial resistance, and the sources of these isolates are shown in Table 18.11.
24

Table 18.11 Sources of E. coli and Salmonella isolates from Agriclean Farm
Source # of E. coli
isolates (n=8)
# of Salmonella isolates (n=4)
Fresh Feces 2 - Barn Flush 1 1 Effluent from storage tank 2 2 Lagoon 1 1 Influent to Digester 2 - The Corbett Farm #1 with the BEST technology is primarily for solids separation and utilizes a fan separator. This technology is not intended to treat swine waste, but instead to separate the solid and liquid components. The separated solids are to be further treated and processed through a centralized biomass energy recovery system, consisting of a gasification and combustion unit, which was not evaluated by the OPEN team. This solids separation technology does not treat the liquid portion of the waste. The technology providers have suggested this solids separation technology can be combined with some other technology that can further treat the liquid wastes. Twenty E. coli and eleven Salmonella isolates were collected and analyzed for antimicrobial resistance, and the sources of these isolates are shown in Table 18.12. Table 18.12 Sources of E. coli and Salmonella isolates from Corbett Farm # 1 (BEST) Farm
Source # of E. coli
isolates (n=20)
# of Salmonella isolates (n=11)
Fresh Feces 4 1 Barn Flush 4 - Effluent from storage tank 4 6 Pond 4 1 Solids from Separator 4 3 The Corbett Farms #3/4 with the BEST technology focuses primarily on solids separation utilizing a screen and screw press system. This technology does not include processes for treating swine waste. It consists only of processes for separating the waste components so that the separated solids can be subjected to processing through a centralized biomass energy recovery system, consisting of a gasification and combustion unit. This technology does not treat the liquid portion of the waste and the technology providers have suggested this technology be combined with some technology that can further treat the liquid wastes. Seventeen E. coli and nine Salmonella isolates were collected and analyzed for antimicrobial resistance, and the sources of these isolates are shown in Table 18.13. Table 18.13 Sources of E. coli and Salmonella isolates from Best 3/4 Farm
Source # of E. coli
isolates (n=17)
# of Salmonella isolates (n=9)
Fresh Feces 1 - Barn Flush 3 2 Effluent from storage tank 2 2 Pond 4 1 Solids from Separator 3 2 Influent to pond 2 2 Spray irrigated soil/vegetation 2 - The Ekokan technology utilizes solids separation followed by an up-flow biofilter technology to treat the liquid portion of waste. This system is designed to treat only the liquid portion of the waste from the farm and the separated solids are held in a conventional anaerobic lagoon on the
25

farm site. Nineteen E. coli and twenty Salmonella isolates were collected and analyzed for antimicrobial resistance, and the sources of these isolates are shown in Table 18.14. Table 18.14 Sources of E. coli and Salmonella isolates from Ekokan Farm
Source # of E. coli
isolates (n=19)
# of Salmonella isolates (n=20)
Fresh Feces 1 - Barn Flush 2 1 Effluent 1 3 Polishing reservoir 3 2 Solids from Separator 2 2 Equalization tank 1 2 Backwash 2 4 Biosolids Reservoir 3 2 Liquid from separator 2 1 Lagoon 2 3 The ORBIT/HSAD (High Solids Anaerobic Digester) technology is designed as a central processing facility for anaerobic digestion of swine waste solids from several farms in one geographical area. Ten E. coli and nine Salmonella isolates were collected and analyzed for antimicrobial resistance, and the sources of these isolates are shown in Table 18.15. Table 18.15 Sources of E. coli and Salmonella isolates from Orbit Farm
Source # of E. coli
isolates (n=10)
# of Salmonella isolates (n=9)
Influent to digester 5 9 Flies 5 0 The RECIP (Solids separation/reciprocating water technology system) system is designed only to treat the liquid portion of the waste stream separated by an initial solids separation process. Separated solids are transferred to an existing lagoon system on the farm. Thirty-one E. coli and eighteen Salmonella isolates were collected and analyzed for antimicrobial resistance, and the sources of these isolates are shown in Table 18.16. Table 18.16 Sources of E. coli and Salmonella isolates from ReCip Farm
Source # of E. coli
isolates (n=31)
# of Salmonella isolates (n=18)
Fresh Feces 1 - Barn Flush 2 - Lagoon for separated solids 4 3 Storage pond 2 5 Sludge from Separator 3 4 Spray irrigated soil/vegetation 7 - Dosing Tank 2 2 Day Holding Tank 4 4 House flies 6 - The Sequencing Batch Reactor (SBR) technology is a batch reactor that utilizes aerobic processes to treated the combined fecal wastes from the barns (liquids and solids). Sixteen E. coli and seven Salmonella isolates were collected and analyzed for antimicrobial resistance, and the sources of these isolates are shown in Table 18.17.
26

Table 18.17 Sources of E. coli and Salmonella isolates from SBR Farm
Source # of E. coli
isolates (n=16)
# of Salmonella isolates (n=7)
Fresh Feces 2 - Barn Flush 3 2 Equalization tank effluent 4 1 SBR effluent 2 1 SBR bacteria/activated sludge 3 2 Lagoon 1 1 1 Lagoon 2 1 - The Constructed Wetlands technology at the Howard farm utilizes a solids separator to remove the solid portion of the waste after which, the liquids are treated through two parallel wetlands cells. As operated, the solids are land applied without further treatment. Forty-two E. coli and thirty-eight Salmonella isolates were collected and analyzed for antimicrobial resistance, and the sources of these isolates are shown in Table 18.18. Table 18.18 Sources of E. coli and Salmonella isolates from Constructed Wetland Farm
Source # of E. coli
isolates (n=42)
# of Salmonella isolates (n=38)
Fresh Feces 3 - Barn Flush 3 8 Storage pond 1 3 Soil applied with solids 1 2 Soil and vegetation 4 5 Barn exhaust fan 10 - Inner wetland influent 4 5 Outer wetland effluent 5 4 Outer wetland influent 4 3 Solids Separator 4 8 Inner wetland effluent 3 -
27

Antimicrobial Resistance of E. coli Isolates from the Farms E. coli bacteria were isolated from eighteen test farms and subjected to antimicrobial resistance testing. Results from these analyses are summarized in Table 18.19. Table 18.19 Antibiotic Resistance (%) for E. coli Isolates from Eighteen Test Farms
% Antibiotic Resistance to: Farm No. of
Isolates STR CTET TET TMP SMX CHL CIP GEN AMP
Surrogate 1 19 21 100 100 0 32 21 0 0 32 Surrogate 2 31 19 100 100 0 29 29 0 0 16 Barham Farm 48 40 94 96 8 29 4 0 0 12 Goshen Ridge 17 29 100 100 0 12 24 0 0 18 Grinells 6 0 17 17 17 0 17 0 0 17 Gasifier 5 0 60 80 0 40 0 0 0 0 Carrolls 20 20 100 100 0 70 15 0 0 35 Harrells 37 16 86 89 11 30 16 0 0 32 Vestal 19 16 100 100 26 84 37 0 0 5 SS Composting 17 12 100 100 35 59 18 0 0 6 Agriclean 8 37 100 100 0 50 0 0 0 25 BEST #1 20 20 100 100 0 55 5 0 0 30 BEST #3/4 17 6 88 88 0 41 6 0 0 35 Ekokan 19 0 100 100 5 53 5 0 0 74 ORBIT 10 0 50 60 0 20 0 0 0 10 ReCip 31 3 90 90 3 71 42 0 0 45 SBR-Hunt 16 6 94 94 0 6 6 0 0 1 Wetlands 42 7 90 93 2 17 0 0 0 10
* Streptomycin (STR), Chlortetracycline (CTET), Tetracycline (TET), Trimethoprim (TMP), Sulfamethoxazole (SMX), Chloramphenicol (CHL), Ciprofloxacin (CIP), Gentamicin (GEN), Ampicillin (AMP) E. coli isolates from all eighteen farms studied (surrogate farm 1, surrogate farm 2, Barham farm, Goshen Ridge Super Soils, Grinnells Laboratory, Carrolls farm, Harrells farm, Vestal farm, Hickory Grove site with the Super Soils Composting, Agriclean farm, Best #1 farm, Best #3/4 farm, Ekokan farm, Orbit farm, ReCip farm, SBR – Hunt farm, Howard farm with constructed wetland technology, and the Lake Wheeler Research farm gasifier) showed resistance to chlortetracycline and tetracycline. Isolates from fourteen farms showed resistance to streptomycin (all except Grinnells Laboratory, Lake Wheeler Research farm gasifier, Ekokan farm and Orbit farm) (Table 18.19). E. coli isolates from eight farms (Barham, Grinnells, Harrells, Vestal, Ekokan, ReCip, Wetlands, and Super Soils composting) showed resistance to trimethoprim. E. coli isolates from all farms except the Grinnells laboratory showed resistance to sulfamethoxazole. Resistance to chloramphenicol was found in all E. coli isolates from fourteen farms (except for isolates from the Lake Wheeler Research farm gasifier, Agriclean farm, Orbit farm and constructed wetlands). Similarly E. coli isolates from eighteen farms tested were resistant to ampicillin (all except Lake Wheeler Research farm gasifier). E. coli isolates from all eighteen farms showed no resistance to ciprofloxacin or gentamicin (Table 18.19). It is noteworthy that streptomycin, chlortetracycline, tetracycline, sulfamethoxazole, and ampicillin are approved for swine use, but chloramphenicol is prohibited in the feed of the animals. E. coli resistance levels on surrogate farm 1 varied from 21% for chloramphenicol up to 100% for chlortetracycline and tetracycline. Resistance levels on surrogate farm 2 ranged from 16% for ampicillin to 100% for chlortetracycline and tetracycline (Table 18.19). Resistance levels on the Barham farm ranged from 4% for chloramphenicol to 96% for chlortetracycline. Resistance levels on the Goshen Ridge farm with the Super Soils technology ranged from 12% for sulfamethoxazole to 100% for both chlortetracycline and tetracycline. Resistance levels on the Grinnell farm were 17% for ampicillin, chloramphenicol, trimethoprim, chlortetracycline and tetracycline. Resistance levels on Carrolls farm ranged from 15% for chloramphenicol to 100%
28

for chlortetracycline and tetracycline. Resistance levels on the Harrells farm ranged from 11% for trimethoprim to 89% for tetracycline. Resistance levels on the Vestal farm ranged from 5% for ampicillin to 100% for both chlortetracycline and tetracycline. Resistance levels on the Super Soils composting farm ranged from 6% for the ampicillin to 100% for both chlortetracycline and tetracycline. Resistance levels on Agriclean farm ranged from 25% for ampicillin to 100% for both chlortetracycline and tetracycline. Resistance level on Corbett farm # 1 (BEST) ranged from 5% for chloramphenicol to 100% for both chlortetracycline and tetracycline. Resistance levels on Corbett farm #3/4 (BEST) ranged from 6% for streptomycin and chloramphenicol to 88% for both chlortetracycline and tetracycline. Resistance levels on Ekokan farm ranged from 5% for trimethoprim and chloramphenicol to 100% for both chlortetracycline and tetracycline. Resistance level on Orbit farm ranged from 10% for ampicillin to 60% for tetracycline. Resistance level on ReCip farm ranged from 3% for streptomycin and trimethoprim to 90% for both chlortetracycline and tetracycline. Resistance levels on SBR-Hunt farm ranged from 1% for ampicillin to 94% for both chlortetracycline and tetracycline. Resistance levels on constructed wetland farm ranged from 2% for trimethoprim to 93% for tetracycline. Finally, resistance levels for the Lake Wheeler Research farm gasifier ranged from 40% for sulfamethoxazole to 80% for tetracycline (Table 18.19). The presence of E. coli resistant to five different antimicrobials at the Goshen Ridge site is an interesting finding because antibiotics are not routinely used in the animal feed for growth promotion and for disease prevention. Antimicrobial Resistance of Salmonella Isolates from the Farms Salmonella bacteria were isolated from sixteen test farms and subjected to antimicrobial resistance testing. Results from these analyses are summarized in Table 18.20. Table 18.20 Antibiotic Resistance (%) for Salmonella Isolates from sixteen Test Farms
% Antibiotic Resistance to: Farm No. of
Isolates STR CTET TET TMP SMX CHL CIP GEN AMP
Surrogate 1 20 45 90 85 0 35 30 0 0 25 Surrogate 2 33 55 94 94 3 88 18 0 0 21 Barham Farm 36 8 64 64 19 42 3 0 0 8 Goshen Ridge 20 50 100 100 0 45 25 0 0 30 Carrolls 18 6 12 12 6 19 12 0 0 19 Harrells 9 44 89 89 11 89 67 0 0 67 Vestal 17 12 88 88 0 47 24 0 0 71 SS Composting 10 60 80 80 10 70 10 0 20 30 Agriclean 4 25 100 100 0 75 75 0 0 50 BEST #1 11 73 100 100 0 45 9 0 0 0 BEST #3/4 9 33 89 89 0 67 33 0 0 22 Ekokan 20 100 100 100 0 55 5 0 0 5 ORBIT 9 56 89 89 0 78 0 0 0 0 ReCip 18 44 78 78 11 78 61 0 0 61 SBR-Hunt 7 14 100 86 0 29 0 0 0 0 Wetlands 38 29 95 97 39 53 50 0 0 55
* Streptomycin (STR), Chlortetracycline (CTET), Tetracycline (TET), Trimethoprim (TMP), Sulfamethoxazole (SMX), Chloramphenicol (CHL), Ciprofloxacin (CIP), Gentamicin (GEN), Ampicillin (AMP) Salmonella isolates from all sixteen farms studied (surrogate farm 1, surrogate farm 2, Barham farm, Goshen Ridge Super Soils, Carrolls farm, Harrells farm, Vestal farm, Hickory Grove site with the Super Soils Composting, Agriclean farm, BEST #1 farm, BEST #3/4 farm, Ekokan farm, ORBIT farm, ReCip farm, SBR – Hunt farm, and Howard farm with constructed wetland technology) showed resistance to streptomycin, chlortetracycline, tetracycline, and sulfamethoxazole (Table 18.20). Salmonella isolates from seven farms (surrogate 2, Barham, Carrolls, Harrells, super soils composting, ReCip and Wetlands) also showed resistance to trimethoprim. Salmonella isolates from all sixteen farms showed no resistance to ciprofloxacin or
29

gentamicin with the exception of 20% isolates from Super Soils composting farm, which were resistant to gentamicin (Table 18.20). Salmonella resistance levels on surrogate farm 1 varied from 25% for ampicillin up to 90% for chlortetracycline. Resistance levels on surrogate farm 2 ranged from 3% for trimethoprim to 94% for chlortetracycline and tetracycline (Table 18.20). Resistance levels on the Barham farm ranged from 3% for chloramphenicol to 64% for chlortetracycline and tetracycline. Resistance levels on the Goshen Ridge farm with the Super Soils technology ranged from 25% for chloramphenicol to 100% for chlortetracycline and tetracycline. Resistance levels on the Carrolls farm ranged from 6% for the streptomycin and trimethoprim to 19% for sulfamethoxazole and ampicillin. Resistance level on the Harrells farm ranged from 11% for trimethoprim to 89% for sulfamethoxazole, chlortetracycline and tetracycline. Resistance levels on the Vestal farm ranged from 12% for streptomycin to 88% for chlortetracycline and tetracycline. Resistance level on Agriclean farm ranged from 25% for streptomycin to 100% for chlortetracycline and tetracycline. Resistance level on Corbett Farm #1 (BEST) ranged from 9% for chloramphenicol to 100% for both chlortetracycline and tetracycline. Resistance level on Corbett farm #3/4 (BEST) ranged from 22% for ampicillin to 89% for both chlortetracycline and tetracycline. Resistance level on Ekokan farm ranged from 5% for ampicillin and chloramphenicol to 100% for streptomycin, chlortetracycline and tetracycline. Resistance level on Orbit farm ranged from 56% for streptomycin to 89% for chlortetracycline and tetracycline. Resistance level on ReCip farm ranged from 11% for trimethoprim to 78% for chlortetracycline and tetracycline. Resistance level on SBR-Hunt farm ranged from 14% for streptomycin to 100% for chlortetracycline. Resistance level on constructed wetlands ranged from 29% for streptomycin to 97% for tetracycline. Finally, resistance levels at the Hickory Grove site with the Super Soils composting technology ranged from 10% for trimethoprim and chloramphenicol to 80% for chlortetracycline and tetracycline (Table 18.20). Multiple Antibiotic Resistance in E. coli Isolates from Test Farms Resistance of bacteria to a single antibiotic is a concern to public health, but this is only a small part of the potential impact or risk. Multiple antibiotic resistance of bacteria is a growing concern for environmental impacts from confined animal feeding operations. Resistance to multiple antibiotics can result in the inability to successfully treat an infection or illness because there may be no antibiotics to which an infecting microbe is susceptible. To address this issue, we identified the number of E. coli isolates that were resistant to multiple antibiotics and the number of antibiotics to which each of the isolates were resistant. The results for multiple antibiotic resistance of E. coli isolates from these farms are summarized in Table 18.21.
30

Table 18.21 Multiple Antibiotic Resistance (%) of E. coli Isolates from the eighteen Test Farms % of antibiotic each isolate is resistant to Farms 0 1 2 3 4 5 6 7
Surrogate 1 (n=19) - 5 26 37 32 - - - Surrogate 2 (n=31) - - 55 19 23 3 - - Barham Farm (n=48) 2 4 31 42 15 4 2 - Goshen Ridge (n=17) - - 71 - 29 - - - Grinnells Laboratory (n=6) 67 - 17 17 - - - - Gasifier (n=5) 40 - 20 40 - - - - Carrolls farm (n=20) - - 20 30 40 10 - - Harrells farm (n=37) 11 3 30 27 16 8 5 - Vestal farm (n=19) - - 5 42 26 26 - - SS Composting (n=17) - - 35 29 12 29 - - Agriclean (n=8) - - 37 25 25 12 - - BEST #1 (n=20) - - 45 10 30 - 15 BEST #3/4 (n=17) 6 6 41 24 12 12 - - Ekokan (n=19) - - 5 58 32 5 - - ORBIT (n=10) 40 - 50 - 10 - - - ReCip (n=31) 10 - 13 19 29 29 - - SBR-Hunt (n=16) 6 - 87 - - 6 - - Wetlands (n=42) 7 2 62 21 7 - - - As shown in Table 18.21, E. coli isolates from all eighteen farms were resistant to some of the test antibiotics. All farms had E. coli isolates that were multiply resistant (resistant to 2 or more antibiotics). On nine of the eighteen farms there were no E. coli isolates lacking resistance to one or more antibiotics; all isolates were resistant to one or more antibiotics. Of the other nine farms, absence of antibiotic resistance was found in 2, 6, 6, 7, 10, 11, 40, 40 and 67% of isolates. E. coli isolate resistance to only 1 antibiotic occurred in only 2, 3, 4, 5, and 6% isolates from wetlands, Harrells farm, Barham farm, surrogate farm 1, and BEST #3/4 farm, respectively. Eleven farms, including Surrogate farm 2 and ten alternative technology farms, had isolates that were resistant to as many as 5 different antibiotics; Barham farm, Harrell’s farm and BEST #1 farm had isolates that were resistant to as many as 6 different antibiotics (Table 18.21). This demonstrates that multiple antibiotic resistance was widely present in E. coli from all of these farms and that the alternative waste management systems appeared to have similar occurrence rates for multiple antibiotic resistance as did the surrogate farms. Multiple Antibiotic Resistance in Salmonella Isolates from Test Farms Of greater potential for public health risk to humans may be multiple antibiotic resistance in individual Salmonella isolates. This is because Salmonella bacteria are frank pathogens, capable of causing illness and disease outbreaks in both animals and humans. Multiple antibiotic resistance would make it more difficult to use antibiotic therapy treat patients with Salmonella infections. Salmonella isolates were found to be not only frequently antimicrobially resistant, but many were also resistant to multiple antibiotics. The numbers of antibiotics to which Salmonella isolates from these farms were resistant are summarized in Table 18.22.
31

Table 18.22. Multiple Antibiotic Resistance (%) of Salmonella Isolates from the sixteen Test Farms
% of antibiotics each isolate is resistant to Farms 0 1 2 3 4 5 6 7
Surrogate 1 (n=20) 15 - 40 5 15 5 20 - Surrogate 2 (n=33) - - 18 24 43 6 9 - Barham Farm (n=36) 22 8 25 22 19 - 3 3 Goshen Ridge (n=20) - - 45 5 25 5 20 - Carrolls farm (n=18) 78 - 6 - 6 - 11 - Harrells farm (n=9) 11 - - - 22 44 22 - Vestal farm (n=17) 18 - - 47 12 18 6 - SS Composting (n=10) 20 - 10 10 30 20 - 10 Agriclean (4) - - 25 - 25 25 25 - Best 1 (11) - - - 73 27 - - - Best ¾ (9) - 11 11 33 22 22 - - Ekokan (20) - - - 45 50 - 5 - Orbit (9) - 11 22 11 56 - - - ReCip (18) 22 - - - 17 22 39 - SBR-Hunt (7) - 14 57 14 14 - - - Wetlands (38) 3 - 39 5 - 11 24 18 All farms had Salmonella that were resistant to multiple antibiotics, and the majority of Salmonella isolates from all sixteen farms had resistance to 2 or more of the 9 antibiotics for which resistance was tested. On eight farms all Salmonella isolates were antibiotic resistant, and on other eight farms the majority of Salmonella were antibiotic resistant. The exception was for only one farm, Carrols, where the majority of Salmonella (78%) were not resistant to antibiotics. Four farms, (Barham farm, BEST #3/4, ORBIT, and SBR-Hunt) had an isolate resistant to a single antibiotic. The remaining Barham Farm isolates and all other isolates that were antibiotic resistant had multiple resistance traits. Eleven farms had isolates resistant to six different antibiotics and three farms had isolates resistant to 7 different antibiotics. Overall, these results indicate high prevalence of multiply resistant Salmonella in fecal waste samples from both surrogate and alternative technology swine farms. Statistical Comparisons of Antimicrobial Resistance Levels of E. coli and Salmonella in Raw and Treated Wastes of Surrogate and Alternative Technology Farms Further analyses were conducted to determine if alternative technologies were environmentally superior to the surrogate technology on the basis of reducing the levels of antimicrobial resistance (AR) of E. coli and Salmonella isolates in treated swine waste residuals. The key criterion for comparisons of AR was the number of antimicrobially resistant traits harbored by bacterial isolates from raw and treated wastes of surrogate and alternative technology farms and the extent to which conventional or alternative treatment reduced the number of AR traits relative to the initial number such AR traits in the bacteria of the raw waste. Comparisons of numbers of AR traits in E. coli and Salmonella isolates from untreated swine wastes and treated residuals (solids or liquids) were made statistically using an unpaired, nonparametric t-test, the Mann-Whitney U-statistic. The results of these comparisons are summarized in Table 18.23
32

Table 18.23. Statistical Comparisons of Antimicrobial Resistance Levels of E. coli and Salmonella in Raw and Treated Wastes of Surrogate and Alternative Technology Farms
Bacteria (number
of isolates)
Technology Type
Swine Waste Type
Mean No. (SD) AR
Traits/Isolate Comparison
P-value (Signifi- cance)
E. coli (102) Untreated 2.78 (1.4) E. coli (93) Alternative Treated 2.67 (1.4)
AR traits in Raw vs. Treated Waste Isolates
0.41 (NS)*
E. coli (14) Untreated 2.6 (0.74) E. coli (14) Surrogate Treated 3.0 (1.0)
AR traits in Raw vs. Treated Waste Isolates
0.43 (NS)
Salmonella (46) Untreated 2.56 (1.96) Salmonella (68) Alternative Treated 3.61 (1.96)
AR traits in Raw vs. Treated Waste Isolates
0.0074 (VS)
Salmonella (13) Untreated 3.5 (1.1) Salmonella (26) Surrogate Treated 3.5 (1.9)
AR traits in Raw vs. Treated Waste Isolates
0.90 (NS)
* NS = not significant; VS = Very significant; 5% level of significance or P < 0.05 As shown in Table 18.23, the levels of antibiotic resistance traits of E. coli isolates in untreated and treated wastes were not significantly different for either the alternative technologies or the surrogate technology. The numbers of antibiotic resistance traits in E. coli remained essentially unchanged after treatment from their numbers in the untreated waste. These results suggest that neither alternative nor conventional treatments reduced the carriage of antibiotic resistance traits by E. coli in swine wastes. The results in Table 18.23 for Salmonella also indicate that the levels of antibiotic resistance traits of isolates in untreated and treated wastes were not significantly reduced by the alternative technologies or the surrogate technology. The numbers of antibiotic resistance traits in Salmonella after treatment by alternative technologies were actually significantly greater than their numbers in the raw waste. For the surrogate (conventional) technology farms, the numbers of antibiotic resistance traits in Salmonella isolates in treated waste residuals remained essentially unchanged from their numbers in the untreated waste. These results suggest that neither alternative nor conventional treatments reduced the carriage of antibiotic resistance traits by Salmonella in swine wastes. Overall, the results of these analyses indicate that neither alternative nor conventional treatment systems significantly changed the levels of carriage of antibiotic resistance by E. coli and Salmonella in swine wastes. The majority of these bacteria continued to harbor multiple resistance to antibiotics. However, it is important to recall that the actual concentrations and total loads of these bacteria were appreciably reduced by swine waste treatment. Therefore, while the extent of carriage of antimicrobial resistance by E. coli and Salmonella was not reduced, the numbers of such bacteria were reduced to varying extents, depending upon the type of treatment and waste management system. Nevertheless, some E. coli and Salmonella harboring multiple antibiotic resistance remained in the treated waste residuals of the treatment technologies. Therefore, such waste residuals need to be properly managed to reduce human and animal exposure to such bacteria, some of which are known pathogens (all Salmonella and some strains of E. coli). Antimicrobial resistance of E. coli and Salmonella from Environmental Samples of Soil, Vegetation and Flies Further evidence for the environmental persistence and presence of multiple antimicrobial resistant E. coli and Salmonella was provided by the antibiotic resistance characteristics of the environmental isolates from soil, vegetation and flies. As shown by the results summarized in Table 18.24, multiply antimicrobial resistant E. coli and Salmonella were found in environmental isolates of these bacteria in samples from both alternative and surrogate (conventional) technology farms.
33

Table 18.24. Antimicrobial Resistance Properties of E. coli and Salmonella Isolates from Environmental Samples of Tested Swine Farms
Isolates Farm Medium No. of
resistance trails
Antibiotic
E. coli S2F1 Flies 4 STR,CTET,TET,SMX S2F2 Flies 4 CTET,TET,SMX, AMP S2F3 Flies 3 CTET,TET, AMP S2F4 Flies 2 CTET,TET S2F5 Flies 5 STR,CTET,TET,SMX,CHL S2S2 Soil 2 CTET,TET S2S3 Soil 2 CTET,TET S2S5
Surrogate 2
Soil 2 CTET,TET CF1 Flies 4 STR,CTET,TET,AMP CF2 Flies 4 STR,CTET,TET,SMX SV1 Soil/Vegetation 4 CTET,TET,SMX, AMP SV2
Carroll - ISSUES
Soil/Vegetation 2 CTET,TET SCF1 Flies 5 STR,CTET,TET,TMP,SMX SCF2 Flies 5 STR,CTET,TET,TMP,SMX SCF4 Flies 3 CTET,TET,SMX SCF6
Super Soils Composting
Flies 2 CTET,TET Salmonella S2S1 Soil 2 SMX, AMP S2S2 Soil 2 SMX, AMP S2S3
Surrogate 2 Soil 5 STR,CTET,TET,SMX,AMP
CF3 Flies 0 CF4 Flies 0 CSV2
Carroll - ISSUES Soil/Vegetation 0
SCF4 Flies 0 SCF5 Flies 3 CTET,TET,SMX SCF6
Super Soils Composting Flies 0
* Streptomycin (STR), Chlortetracycline (CTET), Tetracycline (TET), Trimethoprim (TMP), Sulfamethoxazole (SMX), Chloramphenicol (CHL), Ciprofloxacin (CIP), Gentamicin (GEN), Ampicillin (AMP) . All E. coli isolates from flies or soil and vegetation of both alternative technology and surrogate farms were multiply antibiotic resistant, with some isolates harboring up to 5 resistance traits. Fewer Salmonella isolates than E. coli isolates were obtained from environmental samples. Of these, some but not all Salmonella isolates from soil or flies on surrogate or alternative technology farms harbored multiple antibiotic resistance. As for E coli, resistance to as many as 5 antibiotics was detected in some Salmonella isolates. Overall Summary for Antimicrobial Resistance on Study Farms Antibiotic resistance and multiple antibiotic resistance has been associated with bacteria from confined animal feeding operations due to the common practice of using these pharmaceuticals in the feed for therapeutic disease prevention, as well as sub-therapeutically for growth promotion of the animals. These antimicrobial resistance properties of bacteria present on the farm can have subsequent adverse public health impacts if people on farms are exposed to them or if
34

these bacteria are carried off the farms and people and other animals become exposed to them. These potential human and animal health impacts are a concern because some of the antibiotics used on the farms are also used to combat human infections. This widespread use of antibiotics, and the corresponding increases in antibiotic resistant bacteria, impact the medical and veterinary communities, making it difficult for physicians and veterinarians to treat human and animal bacterial disease cases and outbreaks with first-line antibiotics. Because of the lack of epidemiological data, it is still difficult to fully quantify health risks or the extent to which antibiotic use and resulting antibiotic resistant bacteria results in exposures that impact the health of human and animal populations. Both E. coli and Salmonella isolates from the waste management systems on these farms and the environmental samples from surrogate farm 2 and some alternative technology farms tested were widely resistant to antibiotics. The two most common antibiotics for which the bacteria were resistant were chlortetracycline and tetracycline. There were two bacteria isolates resistant to gentamicin and only one isolate was resistant to ciprofloxacin. This resistance to ciprofloxacin is of particular concern because this antibiotic has been banned for use in animal feeds. There were also few bacteria isolates resistant to trimethoprim. Multiple antibiotic resistance of bacteria isolated from these farms was widespread. For E. coli, all of the isolates were resistant to antibiotics, with all eighteen tested farms having isolates resistant to two or more antibiotics. Potentially of greater public health concern is the multiple antibiotic resistance in Salmonella. On all but one of the farms the majority of Salmonella isolates had multiple antibiotic resistance, and four farms had isolates resistant to 7 different antibiotics. The reasons for the persistence of these multiple antibiotic resistance traits in both E. coli and Salmonella is uncertain at this time. It could be due to the continued presence of the antibiotic in the waste material and the environmental samples or to the ability of the bacteria to maintain the antibiotic resistance gene and its expression in the environment, even if the antibiotic and its selective pressure were no longer present. When comparing these test farms for the extent of antimicrobial resistance among E. coli and Salmonella, there appear to be no differences between the extent of the resistance on the surrogate farms with conventional waste management technology and on the farms with alternative waste management technologies A large proportion of the bacteria isolated from each of the farms were resistant to multiple antibiotics. Furthermore, the levels of multiple antibiotic resistance in E. coli and Salmonella were not reduced by the alternative or surrogate (conventional) swine waste treatment processes and management systems. Levels of multiple antibiotic resistance in E. coli and Salmonella isolates from treated wastes or from environmental media (flies, soil and vegetation), remained unchanged from the resistance levels found in isolates of these bacteria from untreated wastes. Based on these results, none of the alternative waste management systems can be judged environmentally superior to the conventional technology at the surrogate farms based on reduction of the levels of antimicrobial resistance in bacteria in treated swine waste residuals or environmental media. However, the concentrations of these bacteria and the total loads of these bacteria were often significantly reduced by alternative treatment processes and systems. On the basis of remaining concentrations or total numbers (loads) of antimicrobially resistant bacteria, many of these alternative technologies were superior to the surrogate (conventional) technology.
35