a young eu member’s ageing: budgetary and macroeconomic consequences of slovenia’s demographic...
TRANSCRIPT

ORI GIN AL PA PER
A young EU member’s ageing: budgetaryand macroeconomic consequences of Slovenia’sdemographic prospects
Klaus Weyerstrass • Reinhard Neck
Published online: 8 May 2013
� Springer Science+Business Media New York 2013
Abstract In this paper, we simulate a macroeconometric model of Slovenia over
the period 2012–2060, using the projected demographic development as input, and
determine time paths for budgetary and macroeconomic variables under alternative
assumptions about Slovenian policy instruments so as to limit budgetary pressures
stemming from population ageing. The main macroeconomic indicators (growth,
employment, price stability, sustainable public finances) are shown to depend on the
assumed long-run policy options followed. It is demonstrated that the ageing of the
Slovenian population projected in the demographic forecast leads to severe bud-
getary problems unless increases of the retirement age, rising social security con-
tributions or reductions of state financed pensions are implemented. A reduction of
the pension replacement rate turns out to be the most effective measure to cope with
the budgetary implications of population ageing. However, none of the analysed
policy measures is sufficient to stabilise the debt ratio.
Keywords Macroeconomics � Fiscal policy � Ageing � Slovenia � Pension
economics � Public debt
JEL Classification E17 � E37 � H63
1 Introduction
Recently, concerns have been raised about the consequences of demographic
developments for the fiscal stance and the economic outlook for many industrialised
K. Weyerstrass
Institute for Advanced Studies, Vienna, Austria
R. Neck (&)
Alpen-Adria-Universitat Klagenfurt, Klagenfurt, Austria
e-mail: [email protected]
123
Empirica (2013) 40:427–456
DOI 10.1007/s10663-013-9217-z

countries, especially in Europe (see, among others, Auerbach and Lee 2001; Kasek
et al. 2008; Banca d’Italia 2009). The financial and economic crisis of 2007–2009,
the ‘‘Great Recession’’, which resulted in negative growth and increasing
unemployment in nearly all industrial countries irrespective of their initial situation,
aggravated the budgetary problems in addition to already high and rising
government debt before the crisis (e.g., Balassone et al. 2011). Some countries
were hit particularly hard, which was partly due to government failures, i.e. to
special reactions of their economic policy makers. This is also true for Slovenia,
whose economic situation deteriorated very strongly during the last few years.
Slovenia was the only country of former Yugoslavia to enter the European Union
(EU) together with most former socialist countries from Central and Eastern Europe
in 2004, and it managed to introduce the euro as legal tender already in 2007. The
economic development of Slovenia was successful in terms of the main
macroeconomic indicators before the ‘‘Great Recession’’. Between 2005 and
2008, real GDP grew by 5 % per year on average, the registered unemployment rate
declined from 11 to 7 %, and the debt-to-GDP ratio decreased from 26.7 to 22 %.
However, the impact of the recession was especially deep in Slovenia, with a
decline in GDP of almost 8 % in one single year (2009) and an increase in
unemployment to the level of the year before Slovenia joined the Euro Area (2006).
Also in 2010 and 2011 the Slovenian economy did not recover well (real GDP grew
by just 1.2 % in 2010 and by 0.6 % in 2011), in contrast to most EU member states,
and at present the macroeconomic prospects for the following years are not very
favourable according to most national and international forecasts. For 2012, in their
Autumn outlooks, the European Commission, the International Monetary Fund
(IMF) and the OECD estimate a decline of real GDP by 2.2–2.4 % (European
Commission 2012b; IMF 2012; OECD 2012). For 2013 a further decrease in the
quite wide range of 0.4–2.1 % is forecasted, followed by a growth of about 1 % in
2014.
Part of the problem results from the enormous fiscal deficits and the resulting
increase of public debt during the last few years. As Figs. 1 and 2 show, after 2007
public finances in Slovenia deteriorated sharply. After having achieved a balanced
budget in 2007, in 2008 a deficit of about 2 % in relation to GDP occurred. In the
following years, this deficit widened considerably, reaching about 6 % in relation to
GDP in the period 2009–2011.
As a consequence of this budgetary development, the debt-to-GDP ratio
increased to 47 % in 2011, more than twice the figure of 2008. Part of this debt
increase was caused by financial assistance the government had to give to the
banking system as some banks faced severe capital losses due to the bursting of a
housing bubble which had contributed to the high economic growth prior to 2009.
According to the 2012 update of the Slovenian Stability Programme, the deficit-to-
GDP ratio shall be gradually reduced below 3 % in 2013 and to close to balance by
2015, i.e. the end of the current Stability Programme period. According to this
projection, the debt ratio should peak at 53 % in 2013. By 2015 it should have
declined slightly to 51 %. However, in light of the adverse economic development
in 2012, the European Commission expects a budget deficit of around 4 % in
428 Empirica (2013) 40:427–456
123

relation to GDP also in 2013 and 2014, and a further increase of the debt ratio to
62 % in 2014. The OECD is only slightly more optimistic.
The amount of government debt piled up points toward long-run problems as
causes in addition to the short-run effects of the ‘‘Great Recession’’. One of these
problems, which was at the centre of recent political debates in Slovenia and
contributed markedly to the demise of the last government, was the pension
problem, which is prominent on the agenda of the new administration but far from
being close to a solution. In this paper we analyse potential effects of the
demographic development projected for Slovenia on this country’s government
budget and on the labour market, with special emphasis on the pension problem. A
long-run projection of the age composition of the Slovenian population is used as
the basis of several scenarios simulated with the macroeconometric model
SLOPOL.
The structure of the paper is as follows. In the next section, demographic
projections and some features of the current Slovenian pension system are
presented. The SLOPOL model used for the simulations is sketched in Sect. 3. In
Fig. 1 Budget balance in relation to GDP. Source Eurostat; from 2012 onwards Slovenian Ministry ofFinance, Stability Programme, 2012 update; authors’ illustration
Fig. 2 Public debt in relation to GDP. Source Eurostat; from 2012 onwards Slovenian Ministry ofFinance, Stability Programme, 2012 update; authors’ illustration
Empirica (2013) 40:427–456 429
123

Sect. 4, the design of the simulation experiments is outlined. The results of the
simulations are presented in Sect. 5. Section 6 concludes with a summary of the
results.
2 Demographic projections and some features of the Slovenian pension system
In the coming decades, the demographic development will put considerable pressure
on public finances in Slovenia, as in most European countries. For this paper, the
population projection EUROPOP2010 by Eurostat has been used.1 The EURO-
POP2010 population projections are based on assumptions of fertility, mortality and
migration. The population projections assume convergence, meaning that socio-
economic and cultural differences between the EU countries will decrease over
time. Therefore, the realisations of the demographic components on which the
projections are based will be the same in all countries in the convergence year
(2150). This implies that in the year 2150 no net migration will take place in the
countries considered and that the fertility rate as well as life expectancy at birth will
be equalised by that year. The population of Slovenia will continue to grow quite
quickly until about 2025 (to approximately 2,155,000). Afterwards total population
is projected to decline slowly. As can be clearly seen from Fig. 3, the projected
demographic development in Slovenia will lead to a marked increase in the share of
people aged 65 and more. This will bring about a sharp rise of the dependency ratio,
i.e. the relation between people in the working age and those in retirement. The
share of people aged 65 years and more is projected to almost double from 16.5 %
in 2011 to 31.5 % in 2060. Due to a low fertility rate (which is assumed to rise
marginally from 1.55 in 2011 to 1.65 in 2060), the increase in the ratio between
people in the retirement age (65 and older) and those in working age (15 to
Fig. 3 Demographic projections for Slovenia. Source Eurostat (EUROPOP2010); authors’ illustration
1 Details on the EUROPOP2010 projections in general can be found on the EU website:
http://epp.eurostat.ec.europa.eu/statistics_explained/index.php/Population_projections. Details for
Slovenia are available from the website of the Slovenian Statistical office:
http://www.stat.si/eng/novica_prikazi.aspx?id=3989.
430 Empirica (2013) 40:427–456
123

64 years) is even more dramatic. This ratio is projected to rise from slightly below
24 % in 2011 to almost 58 % in 2060.
For the 2012 update of the Slovenian Stability Programme, the consequences of
the projected demographic development for public finances have been assessed in
Slovenian Ministry of Finance (2012). The most important results are summarised
in Table 1. As can be seen, age related public expenditures are projected to increase
by more than 9 % points from about one quarter to more than one-third of GDP.
This is mainly caused by the increase in pensions. As a consequence of this
projected development of expenditures, the budget balance will deteriorate
dramatically. The high budget deficit will push up public debt. As a result, interest
payments will rise sharply, contributing to a further increase in the budget deficit.
According to these projections by the Slovenian government, in 2060 the primary
budget deficit will amount to 13.4 % in relation to nominal GDP. Due to the high
public debt, which is projected to reach nearly 550 % in relation to GDP, interest
expenditures will account for almost one quarter of GDP. Hence, by 2060 the
overall budget deficit-to-GDP ratio would reach as much as 36.5 %.
The sharp deterioration of public finances is brought about by two factors. First,
the rising number of the elderly increases pension payments. At the same time, the
size of the working-age population decreases, hence funds flowing into the pension
system which are financed by employees’ and employers’ contributions and hence
linked to the number of employed people decline unless contribution rates are
raised. Higher contributions, on the other hand, reduce the purchasing power of
employees and raise production costs for companies. At the same time, the
production potential is limited by a declining labour force. This can be compensated
only to a limited extent by raising capital intensity and technical progress.
The projections shown in Table 1 demonstrate clearly that Slovenian public
finances are far from being sustainable in the long run if no corrective measures are
implemented. Hence adaptations of the pension system to the ageing of the
population are of utmost importance. At present, the statutory retirement age is
63 years for men and 61 for women. The minimum insurance period required for
Table 1 Projections of public finance related to population ageing
Percent of GDP 2010 2030 2060
Age related expenditures 24.6 27.7 35.1
Pensions 11.2 13.3 18.3
Health care 6.1 6.8 7.2
Long-term care 1.4 1.9 3.0
Education 4.7 4.8 5.2
Others 1.2 0.9 1.4
Interest expenditures 1.4 5.2 23.0
Primary budget balance -3.9 -4.9 -13.4
Overall budget balance -5.2 -10.1 -36.5
Government debt 37.1 125.6 548.6
Source Slovenian Ministry of Finance, Stability Programme, 2012 update
Empirica (2013) 40:427–456 431
123

retirement at these ages is 20 years. Early retirement is possible at the age of 58 with
40 years of insurance for men and 38 years of insurance for women. In the past,
annual pension increases were related to the rise in nominal wages. Since the latest
pension reform introduced in 1999, in February of each year pensions are increased
by the growth rate of nominal wages in the previous year minus 0.6 % points.
Currently, negative accrual rates for early retirement are rather small and do not
exceed 3.6 % per year. Similarly, additional accrual rates for postponing retirement
are also rather low. They are digressive and do not exceed 3.6 % per year
(Stanovnik et al. 2012). The 1999 pension reform has resulted in a stabilisation of
the effective retirement age as well as pension expenditures in relation to GDP. In
2010, the effective retirement age was 61 years and 10 months for men and
58 years and 5 months for women. The average old-age pension amounted to about
65 % of the average net wage, and pension expenditures made up 11 % of GDP.
As the projections in Table 1 above show clearly, although the 1999 pension
reform has temporarily stabilised the budgetary pressures from pension liabilities,
further reforms are necessary. According to the 2012 Ageing Report of the
European Union (European Commission 2012a), until 2060 among the 27 EU
member states only in Luxembourg age-related expenditures will increase more
than in Slovenia.
After a reform proposal had been rejected in a referendum by a vast majority of
72 %, the previous Slovenian government failed. The new government slightly
modified the pension reform which passed the Slovenian parliament in December
2012. As the Constitutional Court had decided that the new pension reform would
not be subject to a referendum, it could come into effect on 1 January 2013. The
amended legislation stipulates stricter retirement conditions. Via transitional
periods, the reform raises the retirement age to 65 years for both genders. Early
retirement will be possible at 60 years of age on the basis of 40 years of service.
Furthermore, the period for calculating the pension basis is increased from the
current 18–24 years. In addition, a more stimulating policy of bonuses for later
retirement and a more restrictive policy of reductions (maluses) for early retirement
are established.2 This reform will help to mitigate some of the adverse age-related
impacts on public finances as pointed out, e.g. in the EU Ageing Report. However,
the pronounced increase in life-expectancy is likely to put additional pressure on
public finances in Slovenia also in the future, as in most European countries. As
long as the increase in the retirement age is not indexed to the increase in life
expectancy, the pension system is inherently lagging behind the demographic
development. Furthermore, the declining labour force puts a drag on the long-term
growth potential if labour market participation of the elderly is not raised
substantially. Lower long-run growth aggravates the budgetary pressures due to
negative impacts on the tax base, in particular regarding corporate and personal
income taxes.
2 Slovenian Ministry of Labour, Family and Social Affairs, Press Releases, 4. 12. 2012, Slovenia passes
pension reform.
432 Empirica (2013) 40:427–456
123

3 The SLOPOL model
The simulations for the present paper have been conducted with the macroecono-
metric model SLOPOL (SLOvenian POLicy model, version 9). In its current
version, SLOPOL has 72 equations of which 27 are behavioural. The econometric
estimations are based on quarterly data for the period 1995 q1 to 2011 q4. The
equations and variable definitions are provided in the appendix. A more detailed
description of an earlier version can be found in Weyerstrass et al. (2011). SLOPOL
contains behavioural equations for the labour, goods, financial, and labour markets.
The demand side of the economy is modelled in more detail and affects the
development of the macroeconomic variables more strongly than the supply side. In
particular, real GDP and its expenditure components (exports, imports, private and
public consumption, gross fixed capital formation), prices, wages, interest rates,
employment, and labour supply are determined endogenously. In addition, the
public sector and the population structure are modelled in detail. As unit root tests
identify almost all variables as integrated of order one, with only a few exceptions
the equations are specified as error correction models with the growth rate of the
respective variable over the same quarter of the previous year as the endogenous
variable.
Private consumption depends on real disposable income and on the real long-
term interest rate. This specification combines the traditional Keynesian view with
more modern consumption theories such as the permanent income hypothesis. It is
safe to assume that most households try to smooth consumption over time; hence
their consumption expenditures depend on wealth rather than on current disposable
income. These wealth effects are captured by the real interest rate. Disposable
income includes both wage income and yields from financial wealth. Income from
wealth is determined by multiplying the stock of financial wealth by the average
interest rate. Financial wealth is extrapolated with the growth rate of the nominal
capital stock. A certain share of households is credit constrained, and for them
current income is relevant. Gross fixed capital formation is influenced by final
demand (the accelerator hypothesis), by the user cost of capital, and by capacity
utilisation. The user cost of capital is approximated by the real interest rate and the
depreciation rate on the capital stock. Including the ratio between actual and
potential GDP (i.e. the macroeconomic capacity utilisation rate) is based on the idea
that higher net investment becomes necessary when the utilisation of the existing
capital stock increases. Real exports depend on world trade and on the international
price competitiveness of Slovenian goods and services on the world market.
Competitiveness is approximated by the real effective exchange rate vis-a-vis
Slovenia’s 41 most important trading partners. The real exchange rate takes the
nominal exchange rates and the ratio of consumer prices into account. Real imports
are influenced by domestic demand in Slovenia and also by the real effective
exchange rate. Employment depends on real GDP and on the real gross wage. In
order to prevent employment to exceed the working age population in long-term
forecasts, the employment function explains the employment rate, i.e. the number of
employees in relation to the total working age population, rather than the
employment level. Labour supply by private households is determined by
Empirica (2013) 40:427–456 433
123

multiplying the labour force participation rate by the working age population. In a
behavioural equation, the participation rate is positively related to the real net wage.
The positive coefficient implies that the positive substitution effect of an increasing
net wage dominates the negative income effect.
Wages are determined in an extended Phillips curve equation. Hence, gross
wages depend on consumer prices, labour productivity and the labour market
situation. The labour market tightness is captured via the difference between the
actual and the structural unemployment rate. The consumer price index (CPI) is
determined by exogenous and endogenous factors. For a small open economy like
Slovenia, international raw material prices are important determinants for the
domestic price development. This is taken into account by including the import
deflator in the consumer price equation, together with the wage rate as the dominant
internal price determinant. The deflators for private and for public consumption are
related to the CPI. Taking the high import content of exports into account, the
export deflator is explained by the import deflator in addition to unit labour costs as
the most important domestic cost factor. The import deflator is influenced by the oil
price in euro, where the oil price approximates international raw material prices in
general.
The equation for the short-term interest rate takes into account that Slovenia was
outside the Euro Area during the first years of the period for which data for the
estimation of the equations have been used, while the country joined the Euro Area
in 2007. Hence, the short-term interest rate in Slovenia might deviate slightly from
the Euro Area average, but it converges towards the Euro Area interest rate over
time. The long-term interest rate in Slovenia is determined by the short-term interest
rate in Slovenia and by the Euro Area average long-term interest rate. The latter
again accounts for convergence between Slovenia and the Euro Area average over
time. As the financial crisis has clearly shown, the long-term interest rate also
contains a risk premium which is positively related to the public debt level. As
financial market participants doubt the long-term sustainability of public finances,
they demand a higher risk premium. This is captured by including the debt-to-GDP
ratio in the equation for the long-term interest rate. The implicit interest rate on
public debt is explained by the long-term market interest rate. The real effective
exchange rate vis-a-vis Slovenia’s 41 most important trading partners is explained
by the nominal exchange rate between the euro and the US dollar (taking Slovenia’s
Euro Area membership since 2007 into account), the exchange rate between the
Slovenian tolar and the euro (accounting for Slovenia’s own currency before joining
the Euro Area), and CPI inflation in Slovenia. While the nominal exchange rates vis-
a-vis the other Euro Area member states do not exist, deviating price developments
are relevant and important also within the monetary union.
On the supply side, potential GDP is determined via a Cobb-Douglas production
function with labour, capital and autonomous technical progress as input factors.
Since potential GDP is a long-term concept, it is not the actual but the trend
realisations of the production factors that are used for its estimation. For the factor
labour, this implies the estimation of the structural, i.e. the non-accelerating
inflation rate of unemployment (NAIRU). The latter is estimated by applying the
434 Empirica (2013) 40:427–456
123

Hodrick-Prescott filter to the actual unemployment rate. The NAIRU is then
endogenised via a moving average equation.
The model comprises a number of potential fiscal policy instruments, namely
transfers paid to households, public consumption, public investment, as well as tax
rates. Regarding transfers, in the context of the present investigation transfers other
than pensions are considered separately. Pensions are calculated as the average
pension replacement rate multiplied by the average gross wage rate. In the
simulations, the pension replacement rate is considered as a policy instrument. A
further instrument is the average social security contribution rate as percentage of
the average gross wage. With regard to fiscal implications of the demographic
development, the retirement age is the third important policy instrument considered
in the SLOPOL model. As Slovenia is a member of the Euro Area, its monetary
policy is conducted by the Eurosystem and the European Central Bank (ECB) in
particular.
4 Simulation design
The SLOPOL model gives forecasts of the most important macroeconomic
variables for Slovenia under alternative settings of the policy instruments. For the
present paper, those instruments relevant in the context of the pension system are
varied in the different scenarios. These policy instruments are (a) the average
pension replacement rate, i.e. the average pension as a percentage of the average
gross wage; (b) the social security contribution rate, also specified relative to the
average gross wage; (c) the average (i.e. not the statutory) pension age. The time
paths of the remaining policy instruments (public consumption and investment, tax
rates, transfers other than pensions, monetary policy) are identical across the
scenarios. The following simulations are run:
i. Baseline: First, a baseline run with the assumption of no policy change is run
over the time horizon 2012 to 2060. In this baseline, the policy instruments are
projected from their actual 2011 values, as are all other exogenous variables.
ii. Pension age: In this scenario, the average pension age is raised from the actual
level of about 60 years in 2011 to 63 years from 2015 and to 65 years from
2018 onwards. The scenario is further divided into two sub-scenarios: in
scenario (ii. a), it is assumed that 75 % of all people that were retired in the
baseline scenario and are now not eligible to retire are employed. In contrast,
for scenario (ii. b) it is assumed that the Slovenian labour market is able to
absorb only 25 % of the additional labour force. Hence, the majority of the
older people that have to remain in the labour force for another three to five
years are now assumed to be unemployed. Although in Slovenia older
employees are protected from being dismissed by law, it is reasonable to
assume that not all older people are able to find an adequate job. Even though
the demographic development in Slovenia will probably cause skills shortages
in certain sectors, as in most European countries, it is reasonable to assume that
Empirica (2013) 40:427–456 435
123

there remains a skill mismatch between labour demand and supply, in particular
with regard to older people.
iii. Reduced gross pension replacement rate: Here the average pension replace-
ment rate, i.e. the average pension in percent of the gross wage, is reduced by 5
% points from 2012 onwards. In 2011, the average pension replacement rate
amounted to about 45 %.
iv. Increased social security contribution rate: In this scenario, from 2012
onwards the average social security contribution rate (including both
employers’ and employees’ contributions) is increased by 1 % point to about
22 % of the average gross wage.
5 Simulation results
The results of the simulations are visualised in Figs. 4, 5, 6, 7, 8, 9, 10. Each figure
depicts the respective variable in the baseline scenario (denoted by Baseline) and in
the reform scenarios: the increase in the retirement age with 75 % of the additional
labour force being employed (age_1), the increase in the retirement age with 25 %
of the additional labour force being employed (age_2), the scenario with a reduced
pension replacement rate (rep_rate), and the scenario with a higher social security
contribution rate (contr_rate).
Fig. 4 Budget balance in relation to GDP. Source Authors’ illustration
436 Empirica (2013) 40:427–456
123

Fig. 5 Public debt in relation to GDP. Source Authors’ illustration
Fig. 6 Pensions in relation to GDP. Source Authors’ illustration
Empirica (2013) 40:427–456 437
123

Fig. 7 Real GDP growth rate. Source Authors’ illustration
Fig. 8 Employment (persons). Source: Authors’ illustration
438 Empirica (2013) 40:427–456
123

Fig. 9 Unemployment (persons). Source Authors’ illustration
Fig. 10 Unemployment rate. Source Authors’ illustration
Empirica (2013) 40:427–456 439
123

Tables 2, 3, 4, 5, 6 summarise the main results for the last year of the previous
and the following decades until 2060.
In terms of the macroeconomic performance, the baseline projection shows a
relatively favourable development. After the recession years 2011 and 2012, real
Table 2 Main results—baseline scenario
2010 2020 2030 2040 2050 2060
Percent of GDP
Pensions 11.2 14.8 16.5 17.9 18.3 17.9
Interest payments 1.4 3.5 6.5 10.6 15.3 20.4
Primary budget balance -4.0 -3.3 -5.4 -6.0 -5.1 -2.3
Overall budget balance -5.3 -6.8 -11.9 -16.5 -20.4 -22.7
Government debt 38.6 71.2 131.0 210.3 302.2 399.5
Absolute values
GDP per capita (euro) 17,395 23,809 35,554 53,610 80,216 117,430
Unemployment rate (%) 11.9 10.8 9.2 7.5 5.9 5.2
Table 3 Main results—higher pension age, 75 % find employment
2010 2020 2030 2040 2050 2060
Percent of GDP
Pensions 11.2 13.4 15.2 16.4 17.0 16.8
Interest payments 1.4 3.1 5.1 8.0 11.5 15.0
Primary budget balance -4.0 -1.7 -3.7 -4.2 -3.5 -1.1
Overall budget balance -5.3 -4.8 -8.9 -12.2 -15.0 -16.1
Government debt 38.6 62.7 102.7 160.0 226.3 293.8
Absolute values
GDP per capita (euro) 17,395 23,564 35,302 53,139 79,571 116,682
Unemployment rate (%) 11.9 12.9 11.3 10.1 8.4 7.3
Table 4 Main results—higher pension age, 25 % find employment
2010 2020 2030 2040 2050 2060
Percent of GDP
Pensions 11.2 13.1 14.8 16.0 16.6 16.5
Interest payments 1.4 3.6 6.4 10.3 14.8 19.6
Primary budget balance -4.0 -3.3 -5.1 -5.7 -4.8 -2.1
Overall budget balance -5.3 -6.9 -11.5 -16.0 -19.6 -21.7
Government debt 38.6 72.9 129.1 205.2 292.5 383.3
Absolute values
GDP per capita (euro) 17,395 23,156 34,825 52,329 78,456 115,397
Unemployment rate (%) 11.9 17.5 16.0 15.4 13.3 11.4
440 Empirica (2013) 40:427–456
123
GDP growth gradually recovers and peaks at 2.7 % around the year 2020.
Afterwards, the demographic development leads to a gradual decline of the growth
rate, reaching 2 % at the end of the projection period in 2060. In line with the
projected path of total demand, inflation peaks around the year 2020 and then more
or less stabilises at 1.6 %. Due to the decrease in the working-age population, both
employment and unemployment decline markedly over time.
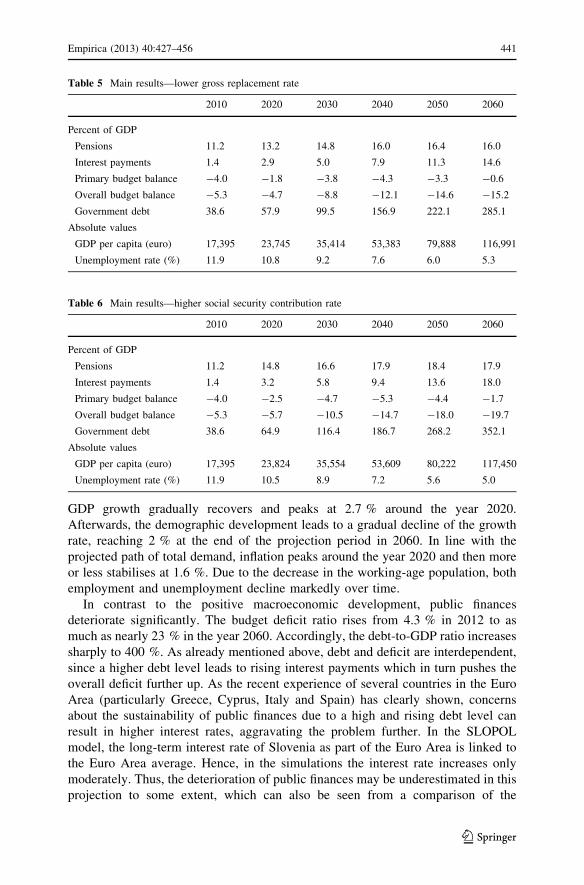
In contrast to the positive macroeconomic development, public finances
deteriorate significantly. The budget deficit ratio rises from 4.3 % in 2012 to as
much as nearly 23 % in the year 2060. Accordingly, the debt-to-GDP ratio increases
sharply to 400 %. As already mentioned above, debt and deficit are interdependent,
since a higher debt level leads to rising interest payments which in turn pushes the
overall deficit further up. As the recent experience of several countries in the Euro
Area (particularly Greece, Cyprus, Italy and Spain) has clearly shown, concerns
about the sustainability of public finances due to a high and rising debt level can
result in higher interest rates, aggravating the problem further. In the SLOPOL
model, the long-term interest rate of Slovenia as part of the Euro Area is linked to
the Euro Area average. Hence, in the simulations the interest rate increases only
moderately. Thus, the deterioration of public finances may be underestimated in this
projection to some extent, which can also be seen from a comparison of the
Table 5 Main results—lower gross replacement rate
2010 2020 2030 2040 2050 2060
Percent of GDP
Pensions 11.2 13.2 14.8 16.0 16.4 16.0
Interest payments 1.4 2.9 5.0 7.9 11.3 14.6
Primary budget balance -4.0 -1.8 -3.8 -4.3 -3.3 -0.6
Overall budget balance -5.3 -4.7 -8.8 -12.1 -14.6 -15.2
Government debt 38.6 57.9 99.5 156.9 222.1 285.1
Absolute values
GDP per capita (euro) 17,395 23,745 35,414 53,383 79,888 116,991
Unemployment rate (%) 11.9 10.8 9.2 7.6 6.0 5.3
Table 6 Main results—higher social security contribution rate
2010 2020 2030 2040 2050 2060
Percent of GDP
Pensions 11.2 14.8 16.6 17.9 18.4 17.9
Interest payments 1.4 3.2 5.8 9.4 13.6 18.0
Primary budget balance -4.0 -2.5 -4.7 -5.3 -4.4 -1.7
Overall budget balance -5.3 -5.7 -10.5 -14.7 -18.0 -19.7
Government debt 38.6 64.9 116.4 186.7 268.2 352.1
Absolute values
GDP per capita (euro) 17,395 23,824 35,554 53,609 80,222 117,450
Unemployment rate (%) 11.9 10.5 8.9 7.2 5.6 5.0
Empirica (2013) 40:427–456 441
123

projected debt ratio of 550 % in the Slovenian Stability Programme (cf. Table 1)
and our projection of 400 % in 2060.
Among the pension reform options considered in the simulations, the reduced
pension replacement rate and the increase in the average retirement age are the most
effective measures to combat the deterioration of public finances, provided (in the
latter case) that most additional older people in the labour force find employment. In
the former scenario (rep_rate), the budget deficit rises to 15 % of GDP in 2060, in
the latter one (age_1), to 16 % in 2060. As a result, the debt ratio ‘‘only’’ increases
to 285 and 294 %, respectively, which means a reduction of more than one quarter
as compared to the baseline scenario.
On the other hand, if the retirement rate is increased but most of the additional
persons in the labour force become unemployed (age_2), the development of public
finances is less favourable. On average, the deficit ratio is then about 3 % points higher
as compared to scenario age_1. In the final year of the simulation period it amounts to
22 %. This is only less than 1 % point lower than in the baseline. The debt ratio
increases to 383 %, which is also closer to the baseline than to scenario age_1.
Regarding the labour market, both scenarios deviate markedly from the baseline
and from each other. In scenario age_1, over the period 2015 (the first year with a
higher retirement age in the simulations) to 2060, employment is on average about
35,000 persons higher than in the baseline. In scenario age_2, employment on average
deviates by 16,000 persons. In terms of unemployment, the differences are even more
pronounced. By 2060, the number of unemployed persons declines from 110,000 in
the year 2011 to less than 40,000 both in the baseline scenario and in the scenario with
the reduced replacement rate. In scenarios age_1 and age_2, due to the assumption that
not all people staying in the labour force find a job, unemployment decreases to 55,000
and 80,000, respectively. Hence, over the entire period of the implementation of the
higher retirement age (i.e. from 2015 onwards), unemployment is higher in both
reform scenarios age_1 and age_2. The budgetary improvement in these scenarios is
caused by the fact that the average unemployment benefit is significantly lower than
the average pension. In this respect, the reduction of the pension replacement rate is
more favourable, increasing unemployment only marginally over the values of the
baseline scenario.
With regard to other macroeconomic indicators such as real GDP growth and
inflation, the differences between the baseline and the scenarios with a higher
pension age are small. The oscillations of GDP growth and inflation are slightly
higher, but over time the reform scenarios converge to the baseline. This applies
also to the other reform scenarios considered here, i.e. a higher social security
contribution rate (contr_rate) and a reduced pension replacement rate (rep_rate). In
these cases, real GDP growth is close to its baseline values. The small effects on
output even in case of additional employment are due to a decrease in labour
productivity associated with the increase in the labour force.
With respect to the fiscal indicators, the reduction of the pension replacement rate
(rep_rate) gives a more favourable development than the increase in the social
security contribution rate (contr_rate). Altogether, the reduction of the pension
replacement rate appears as the most favourable scenario for reducing the burden of
ageing in Slovenia, although it nevertheless leads to an unsustainable fiscal
442 Empirica (2013) 40:427–456
123

development. Therefore alternative policy options will have to be considered, such
as encouraging immigration of younger qualified workers, measures aiming at
increasing labour force participation, and creating incentives for the development of
innovative and productive industries.
6 Summary and conclusions
Slovenia was hit hard by the ‘‘Great Recession’’ of 2008 and 2009, followed by a
muted economic recovery and weak economic prospects for the years to come. The
working of the automatic stabilisers and discretionary fiscal policy measures led to a
drastic deterioration of public finances. In the coming decades, the projected
demographic development will put considerable additional pressure on the fiscal
position. According to recent projections by the Slovenian government, age related
public expenditures will soar from about 25 % of GDP in 2010 to 35 % in 2060.
This will push up public debt. At the same time, potential and actual economic
growth is limited by a shrinking working-age population.
In this paper, we used the macroeconometric model SLOPOL to simulate
macroeconomic and fiscal effects of different pension reform options. According to
the simulation results, lowering the pension replacement rate is most effective in
limiting the increase in the budget deficit and hence public debt without strong
negative effects on the labour market. Raising the average retirement rate can have
similar effects on the fiscal position of the country, but only if most of the additional
older workers find employment. When most of the additional persons in the labour
force are unemployed, public debt rises nearly as much as in the baseline, i.e. without
any policy measures. An increase in the social security contribution rate is less
effective in coping with the fiscal consequences of population ageing than a lower
pension replacement rate. In any case, none of the analysed measures is sufficient to
stabilise the debt ratio at values close to the reference level of 60 % set in the
Maastricht treaty. Hence, even more drastic reforms than the relatively moderate
options considered in this paper will be required to fully offset the pressure from
population ageing on public finances. Also with respect to the macroeconomic
performance, the scenario with a lower pension replacement rate gave the best
results. A next step of research will have to augment the SLOPOL model by a more
detailed model bloc of the supply side as well as a more elaborate financial markets
bloc and to check for the sensitivity of our results with respect to these additions.
Appendix: the SLOPOL model
Model equations
Behavioural equations
In the following, the equations of the SLOPOL model are presented together with
some statistics. R2 is the adjusted coefficient of determination, p(LM) is the
probability level of false rejection of the null hypothesis of no serial correlation up
Empirica (2013) 40:427–456 443
123

to lag 4; t-statistics are given in parentheses below coefficients. All equations have
been estimated with ordinary least squares (OLS). Variable definitions are provided
in ‘‘List of variables’’.
Private consumption
log CRt=CRt�4ð Þ ¼ 0:0601:973ð Þ
þ 0:4534:164ð Þ
�log CRt�1=CRt�5ð Þ
� 0:040�1:443ð Þ
� log CRt�4ð Þ � 0:506� 0:933 � log INCOMERt�4ð Þ½ �
� 0:004�2:195ð Þ
�GOV10R
�0:050�2:730ð Þ
�UM00 � SEAS 2ð Þ þ 0:0452:461ð Þ
�DUM07 � SEAS 3ð Þ
R2 ¼ 0:451 p LMð Þ ¼ 0:4434
Gross fixed capital formation
log PRINVRt=PRINVRt�4ð Þ ¼ 0:4804:542ð Þ
�log PRINVRt=PRINVRt�4ð Þ
þ 0:9022:718ð Þ
�log GDPRt=GDPRt�4ð Þ
� 0:004�0:841ð Þ
� UCCt�1 � UCCt�5ð Þ
� 0:200�2:127ð Þ
� log PRINVRt�4ð Þ þ 3:587½
�1:233 � log GDPRt�4ð Þ�þ 0:549
1:228ð Þ�log UTILt=UTILt�4ð Þ
þ 0:1452:282ð Þ
�DUM00 � SEAS 3ð Þ
� 0:1512:293ð Þ
�DUM00 � SEAS 3ð Þ
R2 ¼ 0:763 p LMð Þ ¼ 0:7665
Exports of goods and services
log EXRt=EXRt�4ð Þ ¼ 0:3486:068ð Þ
�log EXRt�1=EXRt�5ð Þ
þ 0:72510:416ð Þ
�log WTRADEt=WTRADEt�4ð Þ
� 0:223�2:435ð Þ
�log REERt�4=REERt�8ð Þ
� 0:083�3:259ð Þ
�DUM09 � SEAS 1ð Þ
� 0:236�2:865ð Þ
� log EXRt�4ð Þ � 0:381½
�1:089 � log WTRADEt�4ð Þ�
R2 ¼ 0:919 p LMð Þ ¼ 0:1731
444 Empirica (2013) 40:427–456
123

Imports of goods and services
log IMPRt=IMPRt�4ð Þ ¼ � 0:011�1:726ð Þ
þ 0:1942:451ð Þ
�log IMPRt�1=IMPRt�5ð Þ
þ 1:7038:934ð Þ
�log GDPRt=GDPRt�4ð Þ
þ 0:1381:015ð Þ
�log REERt�1=REERt�5ð Þ
� 0:592�5:377ð Þ
� log IMPRt�4ð Þ þ 7:594½
�1:802 � log GDPRt�4ð Þ�
R2 ¼ 0:818 p LMð Þ ¼ 0:1075
Employment
log EMPt=POP1564tð Þ ¼ 0:2114:249ð Þ
�log GDPRtð Þ � 0:251�3:958ð Þ
�log AGWRtð Þ
� 0:102�5:280ð Þ
�log EMPt�4=AGWRt�4ð Þ
R2 ¼ 0:702 p LMð Þ ¼ 0:0000
Labour supply
PARTRATEt � PARTRATEt�4ð Þ ¼ �0:0006�1:059ð Þ
þ 0:7859:230ð Þ
� PARTRATEt�1 � PARTRATEt�5ð Þ
þ 0:0332:639ð Þ
�log NETWAGERt�4=NETWAGERt�8ð Þ
R2 ¼ 0:608 p LMð Þ ¼ 0:8018
Wages
log AGWNt=AGWNt�4ð Þ ¼ 0:0082:408ð Þ
þ 0:6046:228ð Þ
�log AGWNt�1=AGWNt�5ð Þ
þ 0:3533:233ð Þ
�log CPIt�1=CPIt�5ð Þ
þ 0:0200:413ð Þ
�log PRODt=PRODt�4ð Þ
� 0:0023�1:461ð Þ
� URt � NAIRUtð Þ
� 0:074�7:520ð Þ
�DUM08 � SEAS 4ð Þ
þ 0:0373:232ð Þ
�DUM09 � SEAS 1ð Þ
R2 ¼ 0:910 p LMð Þ ¼ 0:1982
Empirica (2013) 40:427–456 445
123

Consumer price index HICP
log CPIt=CPIt�4ð Þ ¼ �0:125�1:566ð Þ
þ 0:5547:623ð Þ
�log CPIt�1=CPIt�5ð Þ
þ 0:0993:412ð Þ
�log IMPDEFt=IMPDEFt�4ð Þ
þ 0:2804:332ð Þ
�log AGWNt=AGWNt�4ð Þ
� 0:122�2:424ð Þ
�log CPIt�4ð Þ þ 0:0511:449ð Þ
�log AGWNt�4ð Þ
þ 0:0591:446ð Þ
�log IMPDEFt�4ð Þ
R2 ¼ 0:940 p LMð Þ ¼ 0:2742
GDP deflator
log GDPDEFt=GDPDEFt�4ð Þ ¼ 0:5116:987ð Þ
þ 0:6426:468ð Þ
�log CPIt=CPIt�4ð Þ
� 0:904�6:233ð Þ
�log GDPDEFt�4ð Þ
þ 0:7965:887ð Þ
�log CPIt�4ð Þ
� 0:016�3:748ð Þ
�SEAS 1ð Þ
R2 ¼ 0:836 p LMð Þ ¼ 0:0001
Private consumption deflator
log CDEFt=CDEFt�4ð Þ ¼ 0:1542:821ð Þ
þ 0:2612:814ð Þ
�log CDEFt=CDEFt�4ð Þ
þ 0:6896:747ð Þ
�log CPIt=CPIt�4ð Þ
� 0:343�3:345ð Þ
�log CDEFt�1ð Þ
þ 0:3103:286ð Þ
�log CPIt�4ð Þ
� 0:0064�2:263ð Þ
�SEAS 1ð Þ
R2 ¼ 0:917 p LMð Þ ¼ 0:1063
Public consumption deflator
log GDEFt=GDEFt�4ð Þ ¼ �0:153�2:638ð Þ
þ 0:6129:057ð Þ
�log GDEFt�1=GDEFt�5ð Þ
þ 0:5305:269ð Þ
�log CPIt=CPIt�4ð Þ � 0:254�3:837ð Þ
�log GDEFt�4ð Þ
þ 0:2853:942ð Þ
�log CPIt�4ð Þ
� 0:030�2:881ð Þ
�DUM07 � SEAS 4ð Þ
R2 ¼ 0:902 p LMð Þ ¼ 0:1543
446 Empirica (2013) 40:427–456
123

Export deflator
log EXPDEFt=EXPDEFt�4ð Þ ¼ 0:1143:032ð Þ
þ 0:3565:569ð Þ
�log EXPDEFt�1=EXPDEFt�5ð Þ
þ 0:0671:822ð Þ
�log ULCt=ULCt�4ð Þ
þ 0:44710:119ð Þ
�log IMPDEFt=IMPDEFt�4ð Þ
� 0:241�3:065ð Þ
�log EXPDEFt�4ð Þ
þ 0:2162:825ð Þ
�log IMPDEFt�4ð Þ
� 0:033�3:487ð Þ
�DUM97 � SEAS 1ð Þ
R2 ¼ 0:930 p LMð Þ ¼ 0:6973
Import deflator
log IMPDEFt=IMPDEFt�4ð Þ ¼ 0:4522:685ð Þ
þ 0:5457:473ð Þ
�log IMPDEFt�1=IMPDEFt�5ð Þ
þ 0:0676:940ð Þ
�log OILEURt=OILEURt�4ð Þ
� 0:122�2:509ð Þ
�log IMPDEFt�4ð Þ
þ 0:0311:945ð Þ
�log OILEURt�4ð Þ
R2 ¼ 0:829 p LMð Þ ¼ 0:5254
Short-term interest rate
SLOR3Mt � SLO3Mt�4ð Þ ¼ 0:9379:785ð Þ
� EUR3Mt � EUR3Mt�4ð Þ
� 0:691�6:003ð Þ
� SLO3Mt�4 � EUR3Mt�4ð Þ
R2 ¼ 0:631 p LMð Þ ¼ 0:0000
Long-term interest rate
GOV10Yt ¼ �4:455�5:467ð Þ
þ 0:56812:313ð Þ
GOV10Yt�4 þ 0:1382:330ð Þ
SLO3Mt
þ 1:4676:171ð Þ
EUR10Yt�4
þ 2:0041:498ð Þ
�d log DEBTGDPtð Þ½ �
R2 ¼ 0:925 p LMð Þ ¼ 0:0013
Implicit interest rate on public debt
IGOVDEBTt ¼ 0:4863:338ð Þ
þ 0:0392:642ð Þ
�GOV10Yt þ 1:4248:961ð Þ
�SEAS 1ð Þ þ 1:0726:888ð Þ
SEAS 2ð Þ
R2 ¼ 0:606 p LMð Þ ¼ 0:0999
Empirica (2013) 40:427–456 447
123

Real effective exchange rate
log REERt=REERt�4ð Þ ¼ � 0:021�4:271ð Þ
þ 0:5448:587ð Þ
�log REERt�1=REERt�5ð Þ
þ 0:3192:159ð Þ
�log SITEURt=SITEURt�4ð Þ
þ 0:0984:830ð Þ
�log EURUSDt=EURUSDt�4ð Þ
þ 0:5593:904ð Þ
�log CPIt=CPIt�4ð Þ þ 0:0405:102ð Þ
�DUM09
þ 0:0584:256ð Þ
�DUM09 � SEAS 4ð Þ � 0:039�3:012ð Þ
�DUM10 � SEAS 1ð Þ
R2 ¼ 0:837 p LMð Þ ¼ 0:0157
Social security contributions by companies
log SOCCOMPt=SOCCOMPt�4ð Þ ¼ �0:387�15:790ð Þ
þ 0:98732:953ð Þ
�log SOCEMPt=SOCEMPt�4ð Þ
� 0:605�46:386ð Þ
�log SOCCOMPt�4ð Þ
þ 0:63752:059ð Þ
�log SOCEMPt�4ð Þ � 0:048�11:094ð Þ
�DUM97
� 0:034�3:983ð Þ
�DUM00 � SEAS 4ð Þ
þ 0:0212:754ð Þ
�DUM03 � SEAS 2ð Þ
R2 ¼ 0:987 p LMð Þ ¼ 0:0000
Corporate income tax payments
INCTAXCORPt � INCTAXCORPt�4ð Þ ¼ �18:274�4:368ð Þ
þ 0:1153:633ð Þ
�log INCTAXCORPt�1=INCTAXCORPt�5ð Þ
þ 0:0648:007ð Þ
� GDPNt � GDPNt�4ð Þ
þ 224:48914:698ð Þ
�DUM06 � SEAS 2ð Þ
� 66:773�4:280ð Þ
�DUM07 � SEAS 2ð Þ
� 321:155�18:494ð Þ
�DUM09 � SEAS 2ð Þ
� 113:465�7:363ð Þ
�DUM10 � SEAS 2ð Þ
þ 238:40815:459ð Þ
�DUM11 � SEAS 2ð Þ
R2 ¼ 0:956 p LMð Þ ¼ 0:3119
448 Empirica (2013) 40:427–456
123

Value added tax (VAT) revenues
log VATt=VATt�4ð Þ ¼ �1:550�3:169ð Þ
þ 1:3424:823ð Þ
�log VATAXRATEt�1 � CNt�1ð Þ= VATAXRATEt�5 � CNt�5ð Þð Þ
� 0:606�8:142ð Þ
�log VATt�4ð Þ þ 0:4817:166ð Þ
�log VATAXRATEt�4 � CNt�4ð Þ
� 0:557�5:107ð Þ
�DUM01 � SEAS 1ð Þ � 0:676�5:772ð Þ
�DUM01 � SEAS 1ð Þ
R2 ¼ 0:648 p LMð Þ ¼ 0:0524
Remaining, un-specified government revenues
log REVRESTt=REVRESTt�1ð Þ ¼ 0:0231:021ð Þ
þ 1:2044:422ð Þ
�log GDPNt=GDPNt�1ð Þ
� 0:246�5:685ð Þ
�SEAS 1ð Þ þ 0:1976:380ð Þ
�SEAS 4ð Þ
� 0:435�4:434ð Þ
�DUM02 � SEAS 1ð Þ
R2 ¼ 0:838 p LMð Þ ¼ 0:0129
Public consumption according to fiscal statistics
log GNFINt=GNFINt�4ð Þ ¼ �0:043�3:346ð Þ
þ 0:3033:492ð Þ
�log GNFINt�1=GNFINt�5ð Þ
þ 0:9728:174ð Þ
�log GNt=GNt�4ð Þ
� 0:109�2:159ð Þ
�log GNFINt�4=GNt�4ð Þ
� 0:142�4:485ð Þ
�DUM04 � SEAS 4ð Þ
R2 ¼ 0:778 p LMð Þ ¼ 0:4029
Remaining, un-specified government expenditures
EXPRESTt=EXPRESTt�1ð Þ ¼ �04:043�1:178ð Þ
þ 0:2628:612ð Þ
� REVRESTt � REVRESTt�1ð Þ
� 0:194�3:379ð Þ
�log EXPRESTt�4=REVRESTt�4ð Þ
� 0:447�4:697ð Þ
�DUM00 � SEAS 1ð Þ þ 0:2064:018ð Þ
�DUM04
R2 ¼ 0:505 pðLMÞ ¼ 0:4876
Empirica (2013) 40:427–456 449
123

Trend total factor productivity
log TRENDTFPt=TRENDTFPt�4ð Þ ¼ 0:0000041:500ð Þ
þ 3:87266:026ð Þ
�log TRENDTFPt�1=TRENDTFPt�4ð Þ
� 5:680�32:759ð Þ
�log TRENDTFPt�2=TRENDTFPt�6ð Þ
þ 3:73921:537ð Þ
�log TRENDTFPt�3=TRENDTFPt�7ð Þ
� 0:932�15:821ð Þ
�log TRENDTFP�4=TRENDTFPt�8ð Þ
� 0:000038�3:224ð Þ
�DUM09 � SEAS 3ð Þ
� 0:000042�3:627ð Þ
�DUM09 � SEAS 3ð Þ
R2 ¼ 0:9999 p LMð Þ ¼ 0:0078
Financial wealth
log FINWEALTHt=FINWEALTHt�4ð Þ ¼ 0:0302:665ð Þ
þ 0:1307:874ð Þ
�DUM07� 0:032�1:877ð Þ
�DUM09
þ 0:3873:848ð Þ
�log CAPRt � GDPDEFt=100ð Þ=½
CAPR�4 � GDPDEF�4=100ð Þ�
R2 ¼ 0:573 p LMð Þ ¼ 0:0000
Non-accelerating rate of unemployment (NAIRU)
Eight quarter moving average (UR)
Change in inventories (INVENTR)
Eight quarter moving average INVENTRð Þ þ 0:07 � INVENTRt�4
Identities
log YPOTð Þ ¼ 0:65 � log TRENDEMPð Þ þ 1� 0:65ð Þ � log CAPRð Þþ log TRENDTFPð Þ
OILEUR ¼ OIL=EURUSD
GR ¼ GN=GDEF � 100
AGWR ¼ AGWN=CPI � 100
CAN ¼ EXR � EXPDEF=100� IMPR � IMPDEF=100
CAGDP ¼ CAN=GDPN � 100
GRGDPR ¼ GDPR=GDPRt�4 � 100� 100
GRYPOT ¼ ðYPOT=YPOTt�4 � 1Þ � 100
PROD ¼ GDPR=EMP � 100
ULC ¼ AGWN=PROD
DEMAND ¼ INVR þ CRþ GRþ EXR
450 Empirica (2013) 40:427–456
123

INCOME ¼ NETWAGEN � EMP=1000000þ RESTTRANSFERS þ PENSIONS
þ UNBENEFIT � INCTAXCORPþ FINWEALTH � EUR10Y=400
INCOMER ¼ INCOME=CPI � 100
INFL ¼ ðCPI=CPIt�4 � 1Þ � 100
GOV10YR ¼ GOV10Y � INFL
UCC ¼ GOV10YRþ DEPR
INCTAXPERS ¼ INCTAXRATE � AGWN � EMP=1000ð Þ=100
SOCEMP ¼ SOCEMPRATE � AGWN � EMP=1000ð Þ=100
WEDGE ¼ AGWN � INCTAXRATE=100þ SOCEMPRATE=100ð ÞNETWAGEN ¼ AGWN �WEDGE
NETWAGER ¼ NETWAGEN=CPI � 100
SOCTOTAL ¼ SOCCOMPþ SOCEMP
INCTAX ¼ INCTAXPERS þ INCTAXCORP
CAPR ¼ 1� DEPR=100ð Þ � CAPRt�1 þ INVR
GDPR ¼ CRþ GRþ INVRþ INVENTRþ EXR� IMPR
GDPN ¼ GDPR � GDPDEF=100
CN ¼ CR � CDEF=100
TRENDEMP ¼ LFORCE � 1� NAIRU=100ð ÞUTIL ¼ GDPR=YPOT � 100
INTEREST ¼ IGOVDEBT � DEBTt�1=100
BALANCEN ¼ VAT þ SOCTOTALþ INCTAX þ REVREST � GNFIN
� GINVN � PENSIONS
� UNBENEFIT � RESTTRANSFERS � INTEREST � EXPREST
BALANCEGDP ¼ BALANCEN=GDPN � 100
DEBT ¼ DEBT�1 � BALANCEN þ DEBTADJ
DEBTGDP ¼ DEBT=ðGDPN þ GDPNt�1 þ GDPNt�2 þ GDPNt�3Þ � 100
GINVR ¼ GINVN=GDPDEF � 100
INVR ¼ PRINVRþ GINVR
Empirica (2013) 40:427–456 451
123

PENSIONERS ¼ PENSIONERS1549þ PENSIONERS50
þ PENSIONERS51þ PENSIONERS52
þ PENSIONERS53þ PENSIONERS54
þ PENSIONERS55þ PENSIONERS56
þ PENSIONERS57þ PENSIONERS58
þ PENSIONERS59þ PENSIONERS60
þ PENSIONERS61þ PENSIONERS62
þ PENSIONERS63þ PENSIONERS64
þ PENSIONERS65þ PENSIONERS66
þ PENSIONERS67þ PENSIONERS68
þ PENSIONERS69þ PENSIONERS70PLUS
POP1564 ¼ POP1549þ POP50þ POP51þ POP52þ POP53
þ POP54þ POP55þ POP56þ POP57þ POP58
þ POP59þ POP60þ POP61þ POP62þ POP63þ POP64
AVPENSION ¼ REPRATE � AGWN
PENSIONS ¼ AVPENSION � PENSIONERS=1000000
AVUNBENEFIT ¼ UNBENEFITRATE � AGWN
UNBENEFIT ¼ AVUNBENEFIT � UN=1000000
LFORCE ¼ PARTRATE � POP1564
UN ¼ LFORCE � EMP
UR ¼ UN=LFORCE � 100
List of variables
Endogenous variables
AGWN Average gross wage per employee
AGWR Average real gross wage
AVPENSION Average pension
AVUNBENEFIT Average unemployment benefit
BALANCEN Budget balance
BALANCEGDP Budget balance in relation to GDP
CAN Current account balance
CAGDP Current account balance in percent of GDP
CAPR Capital stock, real
CDEF Private consumption deflator
CN Private consumption, nominal
CPI HICP for Slovenia
452 Empirica (2013) 40:427–456
123

CR Private consumption, real
DEBT Public debt
DEBTGDP Debt level in relation to GDP
DEMAND Final demand, real
EMP Employed persons
EXPDEF Export deflator
EXPREST Remaining, unspecified government expenditures
EXR Exports, real
FINWEALTH Financial wealth
GDEF Public consumption deflator
GDPDEF GDP deflator
GDPN GDP, nominal, Mio. euro
GDPR GDP, real, Mio euro, chained volumes
GINVR Real government investment
GNFIN Government consumption, financial statistics
GOV10Y Yield of 10 year government bonds
GOV10YR Real government bond yield
GR Government consumption, real
GRGDPR Real GDP growth rate
GRYPOT Growth rate of potential GDP
IGOVDEBT Implicit interest rate on government debt (quarterly rate)
IMPDEF Import deflator
IMPR Imports, real
INCOME Disposable income of private households, nominal
INCOMER Disposable income of private households, real
INCTAX Total income tax revenues
INCTAXCORP Corporate taxes on income and profit
INCTAXPERS Individual taxes on income and profit
INFL Inflation rate
INTEREST Interest payments on outstanding public debt
INVENTR Change in inventories (? statistical discrepancy), real
INVR Gross fixed capital formation, real
LFORCE Labour force
NAIRU Non-accelerating inflation rate of unemployment
NETWAGEN Gross wage minus average income taxes and soc. secur.
contributions
NETWAGER Net wage, real
OILEUR Oil price in euro
PARTRATE Labour force participation rate
PENSIONERS Number of pensioners
PENSIONS Pensions paid by Pension Fund
POP1564 Population aged 15 to 64
PRINVR Real private investment
PROD Labour productivity
REER41 Real effective exchange rate, 41 partners, CPI based (Eurostat)
Empirica (2013) 40:427–456 453
123

REVREST Remaining government revenues
SLO3 M 3 months interest rate in Slovenia. Source: OECD, MEI
SOCCOMP Social security contributions by companies
SOCEMP Employees’ social security contributions
SOCTOTAL Social security contributions by employers and employees
TRENDEMP Trend of employment
TRENDTFP Trend of total factor productivity
UCC User cost of capital
ULC Unit labour cost
UN Unemployed persons
UR Unemployment rate
UNBENEFIT Total unemployment benefits
UTIL Capacity utilisation rate
VAT VAT and sales tax revenues
WEDGE Tax wedge on gross wages
YPOT Potential output
Exogenous variables
DEBTADJ Difference between change in public debt level and budget
balance
DEPR Capital stock depreciation rate
DUM97 Dummy variable, 1 in 1997, 0 otherwise
DUM98 Dummy variable, 1 in 1998, 0 otherwise
DUM99 Dummy variable, 1 in 1999 0 otherwise
DUM00 Dummy variable, 1 in 2000, 0 otherwise
DUM01 Dummy variable, 1 in 2001, 0 otherwise
DUM02 Dummy variable, 1 in 2002, 0 otherwise
DUM03 Dummy variable, 1 in 2003, 0 otherwise
DUM05 Dummy variable, 1 in 2005, 0 otherwise
DUM06 Dummy variable, 1 in 2006, 0 otherwise
DUM07 Dummy variable, 1 in 2007, 0 otherwise
DUM08 Dummy variable, 1 in 2008, 0 otherwise
DUM09 Dummy variable, 1 in 2009, 0 otherwise
DUM10 Dummy variable, 1 in 2010, 0 otherwise
DUM11 Dummy variable, 1 in 2011, 0 otherwise
SEAS(i) Seasonal Dummy: 1 in quarter i, 0 otherwise
EUR10Y 10 year government bond yield, Euro Area average
EUR3 M 3 months EURIBOR
EURUSD Exchange rate USD per EUR
GINVN Public investment, nominal
GN Government consumption, nominal
NCTAXRATE Average personal income tax rate
OIL Oil price, USD per barrel Brent
454 Empirica (2013) 40:427–456
123
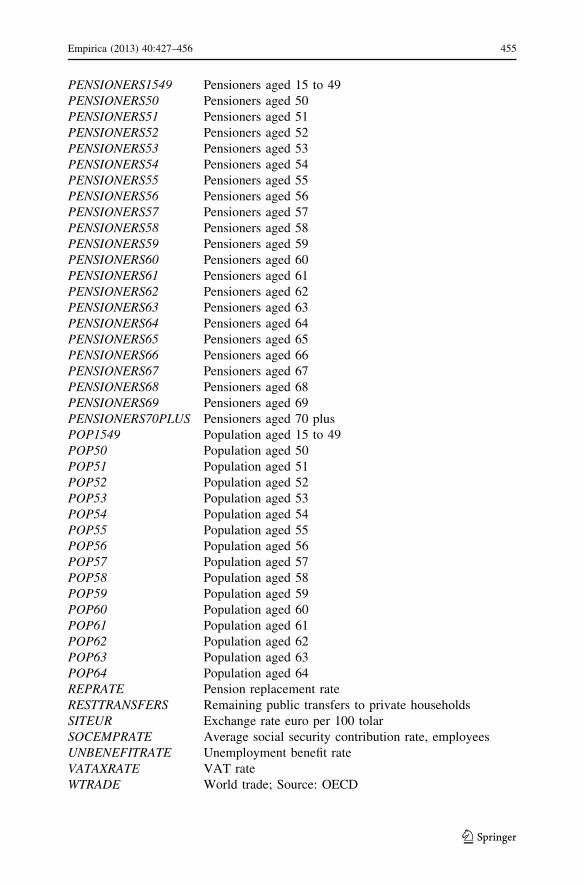
PENSIONERS1549 Pensioners aged 15 to 49
PENSIONERS50 Pensioners aged 50
PENSIONERS51 Pensioners aged 51
PENSIONERS52 Pensioners aged 52
PENSIONERS53 Pensioners aged 53
PENSIONERS54 Pensioners aged 54
PENSIONERS55 Pensioners aged 55
PENSIONERS56 Pensioners aged 56
PENSIONERS57 Pensioners aged 57
PENSIONERS58 Pensioners aged 58
PENSIONERS59 Pensioners aged 59
PENSIONERS60 Pensioners aged 60
PENSIONERS61 Pensioners aged 61
PENSIONERS62 Pensioners aged 62
PENSIONERS63 Pensioners aged 63
PENSIONERS64 Pensioners aged 64
PENSIONERS65 Pensioners aged 65
PENSIONERS66 Pensioners aged 66
PENSIONERS67 Pensioners aged 67
PENSIONERS68 Pensioners aged 68
PENSIONERS69 Pensioners aged 69
PENSIONERS70PLUS Pensioners aged 70 plus
POP1549 Population aged 15 to 49
POP50 Population aged 50
POP51 Population aged 51
POP52 Population aged 52
POP53 Population aged 53
POP54 Population aged 54
POP55 Population aged 55
POP56 Population aged 56
POP57 Population aged 57
POP58 Population aged 58
POP59 Population aged 59
POP60 Population aged 60
POP61 Population aged 61
POP62 Population aged 62
POP63 Population aged 63
POP64 Population aged 64
REPRATE Pension replacement rate
RESTTRANSFERS Remaining public transfers to private households
SITEUR Exchange rate euro per 100 tolar
SOCEMPRATE Average social security contribution rate, employees
UNBENEFITRATE Unemployment benefit rate
VATAXRATE VAT rate
WTRADE World trade; Source: OECD
Empirica (2013) 40:427–456 455
123

References
Auerbach AJ, Lee RD (eds) (2001) Demographic change and fiscal policy. Cambridge University Press,
Cambridge, UK
Balassone F, Cunha J, Langenus G, Manzke B, Pavot J, Prammer D, Tommasino P (2011) Fiscal
sustainability and policy implications: a post-crisis analysis for the euro area. Int J Sustain Econ
3:210–234
Banca d’Italia (ed) (2009) Pension reform. Fiscal policy and economic performance. Banca d’Italia,
Rome
European Commission (2012a) The 2012 ageing report economic and budgetary projections for the 27
EU Member States (2010–2060). European Economy 2/2012, Brussels
European Commission (2012b), European Economic Forecast. Autumn 2012 European Economy 7/2012,
Brussels
IMF (2012) World economic outlook. October 2012. Coping with High Debt and Sluggish Growth.
Washington
Kasek L, Laursen L, Skrok E (2008) Sustainability of pension systems in the New EU Member States and
Croatia. World Bank Working paper no. 129. World Bank, Washington
OECD (2012), OECD Economic outlook No. 92. November 212, Paris
Slovenian Ministry of Finance (2012), Stability programme, Republic of Slovenia, 2012 update. Mimeo,
Ljubljana
Stanovnik T, Turk E, Rupel VP (2012) Annual National Report 2012. Pensions, Health Care and Long-
term Care. Slovenia. March 2012. Report on behalf of the European Commission, DG Employment,
Social Affairs and Inclusion
Weyerstrass K, Neck R, Blueschke D (2011) Optimal macroeconomic policies in a financial and
economic crisis: a case study for Slovenia. Empirica 38:435–459
456 Empirica (2013) 40:427–456
123