a world bank january 2016 commodity markets...
TRANSCRIPT

Analysis
EMBARGOED: NOT FOR NEWSWIRE TRANSMISSION, POSTING ON WEBSITES, OR ANY OTHER MEDIA USE UNTIL JANUARY 26, 2016, 10:00AM EST (1500 GMT) EMBARGOED: NOT FOR NEWSWIRE TRANSMISSION, POSTING ON WEBSITES,
Weak Growth in Emerging Economies and Commodity Markets
Commodity Markets Outlook
A World Bank Quarterly Report
EMBARGOED: NOT FOR NEWSWIRE TRANSMISSION, POSTING ON WEBSITES, OR ANY OTHER MEDIA USE UNTIL JANUARY 26, 2016, 10:00AM EST (1500 GMT) EMBARGOED: NOT FOR NEWSWIRE TRANSMISSION, POSTING ON WEBSITES,
Q4Q3Q2Q1
JANUARY 2016
http://www.worldbank.org/commodities


A World Bank Quarterly Report
JANUARY 2016
CommodityMarketsOutlook

© 2016 International Bank for Reconstruction and Development / The World Bank
1818 H Street NW, Washington, DC 20433
Telephone: 202-473-1000; Internet: www.worldbank.org
Some rights reserved
This work is a product of the staff of The World Bank with external contributions. The findings, interpretations, and conclusions expressed in this work do not necessarily reflect the views of The World Bank, its Board of Executive Directors, or the governments they represent. The maps were produced by the Map Design Unit of The World Bank. The World Bank does not guarantee the accuracy of the data included in this work. The boundaries, colors, denominations, and other information shown on these maps do not imply, on the part of The World Bank Group, any judgment on the legal status of any territory, or any endorsement or acceptance of such boundaries.
Nothing herein shall constitute or be considered to be a limitation upon or waiver of the privileges and immunities of The World Bank, all of which are specifically reserved.
Rights and Permissions
Attribution—Please cite the work as follows: World Bank Group. 2016. Commodity Markets Outlook, January. World Bank, Washington, DC. License: Creative Commons Attribution CC BY 3.0 IGO
Translations—If you create a translation of this work, please add the following disclaimer along with the attribution: This translation was not created by The World Bank and should not be considered an official World Bank translation. The World Bank shall not be liable for any content or error in this translation.
Adaptations—If you create an adaptation of this work, please add the following disclaimer along with the attribution: This is an adaptation of an original work by The World Bank. Views and opinions expressed in the adaptation are the sole responsibility of the author or authors of the adaptation and are not endorsed by The World Bank.
Third-party content—The World Bank does not necessarily own each component of the content contained within the work. The World Bank therefore does not warrant that the use of any third-party-owned individual component or part contained in the work will not infringe on the rights of those third parties. The risk of claims resulting from such infringement rests solely with you. If you wish to re-use a component of the work, it is your responsibility to determine whether permission is needed for that re-use and to obtain permission from the copyright owner. Examples of components can include, but are not limited to, tables, figures, or images.
All queries on rights and licenses should be addressed to the Publishing and Knowledge Division, The World Bank, 1818 H Street NW, Washington, DC 20433, USA; fax: 202-522-2625; e-mail: [email protected].
The cutoff date for the data used in this report was January 22, 2016.

ContentsCoMMoDItY MARKets oUtLooK 3
ContentsAcknowledgments . . . . . . . . . . . . . . . . . . . . . . . . . . . . . . . . . . . . . . . . . . . . . . . . . . . . . . . . . . . . . . . . . . . . . .5
Executive Summary . . . . . . . . . . . . . . . . . . . . . . . . . . . . . . . . . . . . . . . . . . . . . . . . . . . . . . . . . . . . . . . . . . . . .7
Special Focus: Weak growth in emerging market economies: What does it imply for commodity markets? . . . . . . . .9
Commodity Market Developments and Outlook
Energy . . . . . . . . . . . . . . . . . . . . . . . . . . . . . . . . . . . . . . . . . . . . . . . . . . . . . . . . . . . . . . . . . . . .19
Agriculture . . . . . . . . . . . . . . . . . . . . . . . . . . . . . . . . . . . . . . . . . . . . . . . . . . . . . . . . . . . . . . . . .23
Fertilizers . . . . . . . . . . . . . . . . . . . . . . . . . . . . . . . . . . . . . . . . . . . . . . . . . . . . . . . . . . . . . . . . . .27
Metals . . . . . . . . . . . . . . . . . . . . . . . . . . . . . . . . . . . . . . . . . . . . . . . . . . . . . . . . . . . . . . . . . . . .28
Precious metals . . . . . . . . . . . . . . . . . . . . . . . . . . . . . . . . . . . . . . . . . . . . . . . . . . . . . . . . . . . . . .30
Appendix A: Historical commodity prices and price forecasts . . . . . . . . . . . . . . . . . . . . . . . . . . . . . . . . . . . . .31
Appendix B: Commodity balances . . . . . . . . . . . . . . . . . . . . . . . . . . . . . . . . . . . . . . . . . . . . . . . . . . . . . . . . .39
Appendix C: Description of price series and technical notes . . . . . . . . . . . . . . . . . . . . . . . . . . . . . . . . . . . . . .65
Figures
1 Commodity price indices, monthly . . . . . . . . . . . . . . . . . . . . . . . . . . . . . . . . . . . . . . . . . . . . . . . . . .7
2 Oil prices during collapse and recovery episodes, monthly . . . . . . . . . . . . . . . . . . . . . . . . . . . . . . . .7
F1 Contributions of supply and demand shocks to the oil price decline . . . . . . . . . . . . . . . . . . . . . . . .11
F2 GDP growth of emerging and developing economies . . . . . . . . . . . . . . . . . . . . . . . . . . . . . . . . . . .12
F3 Change in 2020 growth forecasts from 2010 to 2015 . . . . . . . . . . . . . . . . . . . . . . . . . . . . . . . . . . .12
F4 Consumption shares of key commodity groups . . . . . . . . . . . . . . . . . . . . . . . . . . . . . . . . . . . . . . . .13
F5 Production shares of key commodity groups . . . . . . . . . . . . . . . . . . . . . . . . . . . . . . . . . . . . . . . . . .13
F6 Metal consumption of China, India and rest of the world . . . . . . . . . . . . . . . . . . . . . . . . . . . . . . . .13
F7 Coal consumption of China, India and rest of the world . . . . . . . . . . . . . . . . . . . . . . . . . . . . . . . . .13
F8 China’s consumption of key commodities . . . . . . . . . . . . . . . . . . . . . . . . . . . . . . . . . . . . . . . . . . . .14
F9 China’s consumption growth of industrial commodities . . . . . . . . . . . . . . . . . . . . . . . . . . . . . . . . .14
F10 Impact of China’s growth slowdown on commodity prices . . . . . . . . . . . . . . . . . . . . . . . . . . . . . . .15
F11 Impact of China’s growth slowdown on commodity exporting and importing countries . . . . . . . . .15
3 Crude oil prices, daily . . . . . . . . . . . . . . . . . . . . . . . . . . . . . . . . . . . . . . . . . . . . . . . . . . . . . . . . . . .19
4 World oil demand growth . . . . . . . . . . . . . . . . . . . . . . . . . . . . . . . . . . . . . . . . . . . . . . . . . . . . . . . .19
5 U.S. crude oil production . . . . . . . . . . . . . . . . . . . . . . . . . . . . . . . . . . . . . . . . . . . . . . . . . . . . . . . .20
6 U.S. oil rig count and oil prices, weekly . . . . . . . . . . . . . . . . . . . . . . . . . . . . . . . . . . . . . . . . . . . . .20
7 OECD crude oil stocks . . . . . . . . . . . . . . . . . . . . . . . . . . . . . . . . . . . . . . . . . . . . . . . . . . . . . . . . . .21
8 Oil prices during collapse and recovery episodes, monthly . . . . . . . . . . . . . . . . . . . . . . . . . . . . . . .21

Contents CoMMoDItY MARKets oUtLooK4
9 Coal consumption of key countries and regions . . . . . . . . . . . . . . . . . . . . . . . . . . . . . . . . . . . . . . .22
10 Coal and natural gas prices, monthly. . . . . . . . . . . . . . . . . . . . . . . . . . . . . . . . . . . . . . . . . . . . . . . .22
11 Agriculture price indices, monthly . . . . . . . . . . . . . . . . . . . . . . . . . . . . . . . . . . . . . . . . . . . . . . . . .23
12 Stock-to-use ratios of maize, wheat, and rice . . . . . . . . . . . . . . . . . . . . . . . . . . . . . . . . . . . . . . . . . .23
13 Global grain production and consumption . . . . . . . . . . . . . . . . . . . . . . . . . . . . . . . . . . . . . . . . . . .24
14 Global production of key edible oils . . . . . . . . . . . . . . . . . . . . . . . . . . . . . . . . . . . . . . . . . . . . . . . .24
15 Price changes of commodities affected by El Niño . . . . . . . . . . . . . . . . . . . . . . . . . . . . . . . . . . . . . .25
16 Global biofuel production . . . . . . . . . . . . . . . . . . . . . . . . . . . . . . . . . . . . . . . . . . . . . . . . . . . . . . . .25
17 Arabica and robusta coffee prices, daily . . . . . . . . . . . . . . . . . . . . . . . . . . . . . . . . . . . . . . . . . . . . . .26
18 Natural rubber production . . . . . . . . . . . . . . . . . . . . . . . . . . . . . . . . . . . . . . . . . . . . . . . . . . . . . . .26
19 Fertilizer prices . . . . . . . . . . . . . . . . . . . . . . . . . . . . . . . . . . . . . . . . . . . . . . . . . . . . . . . . . . . . . . . .27
20 Global nutrient consumption . . . . . . . . . . . . . . . . . . . . . . . . . . . . . . . . . . . . . . . . . . . . . . . . . . . . .27
21 Metal prices, monthly . . . . . . . . . . . . . . . . . . . . . . . . . . . . . . . . . . . . . . . . . . . . . . . . . . . . . . . . . . .28
22 Refined metal consumption of key regions and countries . . . . . . . . . . . . . . . . . . . . . . . . . . . . . . . .28
23 World metal consumption growth . . . . . . . . . . . . . . . . . . . . . . . . . . . . . . . . . . . . . . . . . . . . . . . . . .29
24 Zinc price and LME stocks, daily . . . . . . . . . . . . . . . . . . . . . . . . . . . . . . . . . . . . . . . . . . . . . . . . . .29
25 Precious metal prices, monthly . . . . . . . . . . . . . . . . . . . . . . . . . . . . . . . . . . . . . . . . . . . . . . . . . . . .30
26 Global silver production . . . . . . . . . . . . . . . . . . . . . . . . . . . . . . . . . . . . . . . . . . . . . . . . . . . . . . . . .30
Tables
1 Nominal price indices (actual and forecasts) and forecast revisions. . . . . . . . . . . . . . . . . . . . . . . . . . . .8
F1 Real GDP growth forecast . . . . . . . . . . . . . . . . . . . . . . . . . . . . . . . . . . . . . . . . . . . . . . . . . . . . . . . . . . 11

ACKNOWLEDGMENTSCOMMODITY MARKETS OUTLOOK | JANUARY 2016 5
AcknowledgmentsThis World Bank Group Report is a product of the Prospects Group in the Development Economics Vice Presidency. The report was managed by John Baffes under the general guidance of Ayhan Kose and Franziska Ohnsorge.
The World Bank’s Commodity Markets Outlook is published quarterly, in January, April, July, and October. The report provides detailed market analysis for major commodity groups, including energy, metals, agriculture, precious metals, and fertilizers. A Special Focus section examines current topics and issues in commodity markets. Price forecasts to 2025 for 46 commodities are presented, together with historical price data. The report also contains production, consumption, and trade balances for major commodities. Commodity price data updates are published separately at the beginning of each month.The report and data can be accessed at: www.worldbank.org/commoditiesFor inquiries and correspondence, email at: [email protected]
Many people contributed to the report. John Baffes authored the section on agriculture. Shane Streifel authored the sections on energy, fertilizers, metals, and precious metals. John Baffes, Raju Huidrom, Franziska Ohnsorge, Marc Stocker, and Shane Streifel contributed to the Special Focus section on implications of the emerging market growth prospects for commodity markets. Xinghao Gong managed the price database and assisted with the Annex tables. The design and production of the report was managed by Maria Hazel Macadangdang and Adriana Maximiliano. Carlos Arteta, Betty Dow, Christian Eigen-Zucchi, Graeme Littler, and Dana Vorisek provided extensive editorial comments. David Rosenblatt reviewed the report. Mark Felsenthal, Phillip Jeremy Hay, and Mikael Reventar managed the media relations and dissemination. The accompanying website was produced by Graeme Littler.


eXeCUtIVe sUMMARYCoMMoDItY MARKets oUtLooK | JAnUARY 2016 7
Trends. Energy prices dropped more than 13 percent in the fourth quarter of 2015 (Figure 1). Oil prices, which registered the largest decline, continued to slide in 2016 to below $30/bbl in mid-January—some-what below levels that would appear to be warranted by fundamentals—on prospects for continued abun-dant supplies and concerns about weak demand. In addition to high stocks, OPEC reaffi rmed its market share strategy at its December 2015 meeting, and ex-ports from the Islamic Republic of Iran are expected to rise sharply as sanctions that had hampered oil sec-tor investment and exports have been lifted. U.S. crude oil production continued to fall from its peak in April 2015, but the decline has been slower than ex-pected owing to effi ciency gains and cost reductions. On the demand side, the oil price drop of 2015 en-couraged consumption growth, but this was tempered in the fourth quarter by mild temperatures in the northern hemisphere reducing heating oil demand. Natural gas and coal prices fell 9 and 15 percent in the quarter on ample supplies, high stocks, falling im-
Executive Summary
FIGURE 1 Commodity price indices, monthly
Source: World Bank.Note: Defi nitions and compositions of price indices can be found in Appendix A and C. Last observation is December 2015.
Source: World Bank.Note: Lines indicate oil prices for 12 months before and after the trough, indexed to 100 at the trough. Dashed line indicates forecast. Shaded area denotes range of forecasts by 6 major investment banks, released during January 15-22, 2016.
ports to China and India, and policies to reduce coal consumption in power generation.Non-energy commodity prices fell 4 percent in the fourth quarter of 2015, to a level almost 40 percent below their early 2011 highs, on continued large in-ventories and ample supplies. Agriculture prices fell 2.3 percent, marking the seventh consecutive quar-terly decline. El Niño-related concerns in some re-gions did little to support prices on global commodity markets. Metal prices fell 8 percent on softening growth prospects in China and continued increases in supply due to earlier investments. Cost reductions, notably for energy, and exchange rate depreciation in many producing countries have delayed closure of higher-cost mines. Fertilizer prices fell on surplus pro-duction capacity and slower seasonal demand. Pre-cious metal prices fell marginally on weaker invest-ment demand.Outlook and risks. All main commodity price indi-ces are projected to decline in 2016 relative to last year due to persistently elevated supplies and, in the case of
Commodity prices continued to fall in the fourth quarter of 2015, reflecting abundant supplies, weaker growth pros-pects in emerging economies, and a strong U.S. dollar. One of the largest declines was in crude oil, which fell from $51 per barrel (bbl) in early October to less than $30/bbl in mid-January. In addition to concerns about slowing growth in emerging economies, the plunge in oil prices reflected mild winter weather in the northern hemisphere, elevated stocks, resilient U.S. oil production, earlier-than-expected Iranian exports, and unchanged OPEC policy prioritizing market share. For 2015 as a whole, energy prices plunged by 45 percent from the previous year, while non-energy commodity prices declined by 15 percent. Relative to their peaks in 2011, the main industrial commodity price indices in Decem-ber were sharply down—two-thirds for energy and more than one-half for metals. Agricultural prices also declined—down one-third from their 2011 peaks—reflecting higher stocks (due to good crops in the past two seasons) and produc-tion increases for some commodities, despite an intensification of the El Niño weather phenomenon. Most price forecasts have been revised downward for 2016 (37 of the 46 commodity prices monitored in this report). Aside from rebound in oil prices, only a modest recovery is expected in 2017. This issue examines the implications of emerging-market growth on commodity prices, and highlights that weaker growth prospects could have a sizeable adverse effect on prices.
40
60
80
100
120
140
160
Jan-11 Jan-12 Jan-13 Jan-14 Jan-15
US$ nominal, 2010=100
Metals
Agriculture
Energy
FIGURE 2 Oil prices during collapse and recovery episodes, monthly
50
100
150
200
250
300
350
-12 -10 -8 -6 -4 -2 0 2 4 6 8 10 12
Forecast rangeJul 1985-Jul 1987Dec 1997-Dec 1999Dec 2007-Dec 2009Jan 2015-Jan 2017
Nominal index 100=trough

COMMODITY MARKETS OUTLOOK | JANUARY 2016 8 SPECIAL FOCUS
industrial commodities, weak growth prospects in emerging market economies (Table 1). Energy prices are expected to fall 25 percent from 2015, with oil prices projected to average $37/bbl in 2016 (a down-ward revision from $51/bbl forecast in the October 2015 Commodity Markets Outlook). From their cur-rent lows, however, a gradual recovery in oil prices is expected over the course of the year for several rea-sons. First, the sharp oil price drop in early 2016 does not appear fully warranted by fundamental drivers of oil demand and supply, and there may be some re-bound in prices. Second, higher-cost oil producers are suffering losses, which could bring production cuts that offset additional capacity coming to the market. Third, demand is expected to strengthen somewhat with a modest pickup in global growth (Figure 2). Significant downside risks to the energy price forecast include higher-than-expected output from OPEC producers that prolongs the surplus in the global oil market, particularly if accompanied by weaker de-mand from emerging market economies. On the other hand, higher prices could result from supply disruptions among key OPEC producers mostly be-cause of conflict. Non-energy prices are expected to fall 3.7 percent in 2016. Metals prices are projected to decline 10 per-cent, following last year’s 21 percent drop, due to weaker demand prospects in emerging market econo-mies and new capacity. The largest decline is expected for iron ore (-25 percent). Downside price risks in-clude a further growth slowdown in China and larger-than-expected production associated with cost reduc-tions and exchange rate depreciation in producing countries.
Agricultural prices are projected to decline 1.4 percent in 2016, compared with the October 2015 forecast of a 1.3 percent increase, with prices falling in almost all main commodity groups. This agricultural price out-look reflects adequate production (despite intensifica-tion of El Niño), comfortable levels of stocks for most commodities, lower energy costs, and plateauing de-mand for biofuel use. The largest price drop is for grains (-3.4 percent), followed by oils and meals (-2.2 percent); beverage and agricultural raw material prices are forecast to fall marginally. Fertilizer prices could retreat 4 percent, reflecting weakening growth pros-pects in emerging market economies and capacity ex-pansion. Risks to the agricultural price forecasts in-clude a prolonged (or intensified) El Niño that could reduce production in some commodities.Special Focus on the implications of weak growth prospects of emerging market economies for com-modity markets. Amid amply supplied markets, weak growth prospects for these economies are weighing on commodity prices. Growth projections for emerging and developing countries have been revised down-wards by 0.6 percentage point to 4.0 percent in 2016 and 4.7 percent in 2017-18. The forecast is subject to considerable downside risks, especially if a sharper-than-anticipated slowdown in major commodity-im-porting emerging markets spills over to weaken growth prospects in other emerging market and devel-oping countries. The Special Focus argues that a faster-than-expected slowdown in major emerging markets economies—especially if combined with fi-nancial stress—could further reduce commodity prices considerably, setting back growth in commod-ity exporters and the global economy.
TABLE 1 Nominal price indices (actual and forecasts) and forecast revisions
Source: World Bank.Notes: (1) “F” denotes forecasts. (2) “Revision” denotes change to the forecast from the October 2015 report (expressed in percentage points for the price indices, $/bbl for crude oil, and $/toz for gold). (3) The non-energy price index excludes precious metals. See Appendix C for definitions of price and indices.
Price Indices (2010=100) Change (%) Revision2
2012 2013 2014 2015 2016F1 2017F1 2015-16 2016-17 2016F 2017FEnergy 128 127 118 65 49 62 -24.7 25.8 -17.0 -8.3
Non-Energy3 110 102 97 82 79 81 -3.7 2.2 -4.6 -4.3
Metals 96 91 85 67 60 63 -10.2 4.2 -9.2 -8.5
Agriculture 114 106 103 89 88 89 -1.4 1.6 -2.5 -2.3
Food 124 116 107 91 89 91 -1.7 1.9 -3.1 -2.8
Grains 141 128 104 89 86 88 -3.4 2.6 -5.0 -4.5
Oils and meals 126 116 109 85 83 86 -2.2 2.9 -4.2 -3.8
Other food 107 104 108 100 100 101 0.1 0.3 -0.1 0.0
Beverages 93 83 102 94 93 92 -0.9 -0.9 0.6 0.5
Raw Materials 101 95 92 83 83 85 -0.7 2.2 -2.6 -2.5
Fertilizers 138 114 100 95 92 92 -3.9 0.3 -3.3 -2.5
Precious Metals3 138 115 101 91 83 83 -8.0 -0.3 -7.5 -6.7
Memorandum items
Crude oil ($/bbl) 105 104 96 51 37 48 -27.1 29.7 -14.4 -6.6
Gold ($/toz) 1,670 1,411 1,265 1,160 1,075 1,066 -7.3 -0.8 -81.2 -71.3

SPECIAL FOCUS:
Weak growth in emerging market economies: What does it imply for commodity markets?
S
Weak growth in emerging market economies: Weak growth in emerging market economies: Weak growth in emerging market economies: Weak growth in emerging market economies: Weak growth in emerging market economies: What does it imply for commodity markets?
Weak growth in emerging market economies: Weak growth in emerging market economies: Weak growth in emerging market economies: Weak growth in emerging market economies: Weak growth in emerging market economies: What does it imply for commodity markets?What does it imply for commodity markets?What does it imply for commodity markets?What does it imply for commodity markets?What does it imply for commodity markets?What does it imply for commodity markets?What does it imply for commodity markets?
Weak growth in emerging market economies: Weak growth in emerging market economies: What does it imply for commodity markets?
Weak growth in emerging market economies: Weak growth in emerging market economies: Weak growth in emerging market economies: What does it imply for commodity markets?What does it imply for commodity markets?What does it imply for commodity markets?What does it imply for commodity markets?What does it imply for commodity markets?What does it imply for commodity markets?What does it imply for commodity markets?What does it imply for commodity markets?What does it imply for commodity markets?What does it imply for commodity markets?What does it imply for commodity markets?
Weak growth in emerging market economies: Weak growth in emerging market economies: What does it imply for commodity markets?
Weak growth in emerging market economies: What does it imply for commodity markets?
Weak growth in emerging market economies: What does it imply for commodity markets?
Weak growth in emerging market economies: Weak growth in emerging market economies: Weak growth in emerging market economies: Weak growth in emerging market economies: Weak growth in emerging market economies: What does it imply for commodity markets?What does it imply for commodity markets?What does it imply for commodity markets?What does it imply for commodity markets?What does it imply for commodity markets?
Weak growth in emerging market economies: What does it imply for commodity markets?
Weak growth in emerging market economies: Weak growth in emerging market economies: What does it imply for commodity markets?
Weak growth in emerging market economies: What does it imply for commodity markets?What does it imply for commodity markets?What does it imply for commodity markets?What does it imply for commodity markets?What does it imply for commodity markets?What does it imply for commodity markets?What does it imply for commodity markets?What does it imply for commodity markets?What does it imply for commodity markets?What does it imply for commodity markets?What does it imply for commodity markets?
Weak growth in emerging market economies: What does it imply for commodity markets?
Weak growth in emerging market economies: Weak growth in emerging market economies: What does it imply for commodity markets?What does it imply for commodity markets?
Weak growth in emerging market economies: Weak growth in emerging market economies: Weak growth in emerging market economies: What does it imply for commodity markets?What does it imply for commodity markets?
Weak growth in emerging market economies: What does it imply for commodity markets?What does it imply for commodity markets?
Weak growth in emerging market economies: What does it imply for commodity markets?
Weak growth in emerging market economies: Weak growth in emerging market economies: What does it imply for commodity markets?What does it imply for commodity markets?
Weak growth in emerging market economies: Weak growth in emerging market economies: Weak growth in emerging market economies: What does it imply for commodity markets?
Weak growth in emerging market economies: Weak growth in emerging market economies: What does it imply for commodity markets?What does it imply for commodity markets?
Weak growth in emerging market economies: Weak growth in emerging market economies: What does it imply for commodity markets?
Weak growth in emerging market economies: Weak growth in emerging market economies: Weak growth in emerging market economies: Weak growth in emerging market economies: What does it imply for commodity markets?What does it imply for commodity markets?
Weak growth in emerging market economies: What does it imply for commodity markets?What does it imply for commodity markets?
Weak growth in emerging market economies: Weak growth in emerging market economies: What does it imply for commodity markets?What does it imply for commodity markets?
Weak growth in emerging market economies: Weak growth in emerging market economies: What does it imply for commodity markets?What does it imply for commodity markets?What does it imply for commodity markets?What does it imply for commodity markets?
Weak growth in emerging market economies: Weak growth in emerging market economies: What does it imply for commodity markets?What does it imply for commodity markets?What does it imply for commodity markets?
Weak growth in emerging market economies: What does it imply for commodity markets?
Weak growth in emerging market economies: Weak growth in emerging market economies: Weak growth in emerging market economies: Weak growth in emerging market economies: What does it imply for commodity markets?
Weak growth in emerging market economies: What does it imply for commodity markets?
Weak growth in emerging market economies: Weak growth in emerging market economies: Weak growth in emerging market economies: What does it imply for commodity markets?
Weak growth in emerging market economies: Weak growth in emerging market economies:
S
What does it imply for commodity markets?What does it imply for commodity markets?Weak growth in emerging market economies: What does it imply for commodity markets?
Weak growth in emerging market economies: Weak growth in emerging market economies: Weak growth in emerging market economies:
SS
Weak growth in emerging market economies: What does it imply for commodity markets?
Weak growth in emerging market economies: What does it imply for commodity markets?
Weak growth in emerging market economies: What does it imply for commodity markets?What does it imply for commodity markets?What does it imply for commodity markets?What does it imply for commodity markets?What does it imply for commodity markets?What does it imply for commodity markets?What does it imply for commodity markets?What does it imply for commodity markets?What does it imply for commodity markets?What does it imply for commodity markets?What does it imply for commodity markets?
Weak growth in emerging market economies: What does it imply for commodity markets?
Weak growth in emerging market economies: What does it imply for commodity markets?What does it imply for commodity markets?What does it imply for commodity markets?What does it imply for commodity markets?
Weak growth in emerging market economies: What does it imply for commodity markets?
Weak growth in emerging market economies: What does it imply for commodity markets?
Weak growth in emerging market economies: Weak growth in emerging market economies: What does it imply for commodity markets?
Weak growth in emerging market economies: What does it imply for commodity markets?What does it imply for commodity markets?
Weak growth in emerging market economies: What does it imply for commodity markets?What does it imply for commodity markets?What does it imply for commodity markets?What does it imply for commodity markets?
Weak growth in emerging market economies: What does it imply for commodity markets?What does it imply for commodity markets?What does it imply for commodity markets?What does it imply for commodity markets?What does it imply for commodity markets?What does it imply for commodity markets?What does it imply for commodity markets?What does it imply for commodity markets?What does it imply for commodity markets?What does it imply for commodity markets?What does it imply for commodity markets?
Weak growth in emerging market economies: What does it imply for commodity markets?
Weak growth in emerging market economies: Weak growth in emerging market economies: Weak growth in emerging market economies: Weak growth in emerging market economies: Weak growth in emerging market economies: Weak growth in emerging market economies: What does it imply for commodity markets?
S
Weak growth in emerging market economies: Weak growth in emerging market economies: Weak growth in emerging market economies: What does it imply for commodity markets?
Weak growth in emerging market economies: What does it imply for commodity markets?What does it imply for commodity markets?What does it imply for commodity markets?
Weak growth in emerging market economies: Weak growth in emerging market economies: What does it imply for commodity markets?What does it imply for commodity markets?What does it imply for commodity markets?
SS
Weak growth in emerging market economies: Weak growth in emerging market economies: What does it imply for commodity markets?
Weak growth in emerging market economies: What does it imply for commodity markets?What does it imply for commodity markets?What does it imply for commodity markets?What does it imply for commodity markets?What does it imply for commodity markets?What does it imply for commodity markets?What does it imply for commodity markets?
Weak growth in emerging market economies: What does it imply for commodity markets?
Weak growth in emerging market economies: What does it imply for commodity markets?What does it imply for commodity markets?What does it imply for commodity markets?What does it imply for commodity markets?
Weak growth in emerging market economies: What does it imply for commodity markets?What does it imply for commodity markets?What does it imply for commodity markets?
Weak growth in emerging market economies: What does it imply for commodity markets?
Weak growth in emerging market economies: What does it imply for commodity markets?What does it imply for commodity markets?
Weak growth in emerging market economies: Weak growth in emerging market economies: Weak growth in emerging market economies: What does it imply for commodity markets?What does it imply for commodity markets?
Weak growth in emerging market economies: What does it imply for commodity markets?What does it imply for commodity markets?
Weak growth in emerging market economies: Weak growth in emerging market economies: What does it imply for commodity markets?
Weak growth in emerging market economies: What does it imply for commodity markets?What does it imply for commodity markets?What does it imply for commodity markets?
Weak growth in emerging market economies:
S
Weak growth in emerging market economies:


COMMODITY MARKETS OUTLOOK | JANUARY 2016 11SPECIAL FOCUS
Weak growth in emerging market economies: What does it imply for commodity markets?
Introduction
The sharp decline in commodity prices over the past five years has coincided with slowing growth in emerg-ing and developing economies (EMDEs). Commod-ity prices slid by 40 percent since 2010 while growth in EMDEs slowed from 7.1 percent in 2010 to 3.3 percent in 2015. Although the decline in commodity prices has been mostly due to excess supply, weaken-ing demand from commodity-importing EMDEs has also played a role. For example, recent developments in oil markets have been driven by both supply and demand factors. A decomposition of oil price move-ments into demand and supply factors (Baffes et al. 2015) suggests that the decline in oil prices since mid- 2014 has been predominantly (about 65 percent) driven by supply factors (Figure F1). However, pres-sures from softening demand have steadily increased as EMDE growth slowed, compounded in the last quarter of 2015 by mild winter temperatures in the northern hemisphere. The weakness in oil prices has mirrored that in other commodity prices, especially
those of other industrial commodities. Following a decade of large investments encouraged by high prices, capacity in most industrial commodities is now ample, while slowing growth in EMDEs has weighed on demand.
How are emerging and developing economies performing?1
The global economy remained in a fragile state in 2015, as further deceleration in activity across major EMDEs more than offset a modest recovery in ad-vanced economies. As a result, global growth slowed to an estimated 2.4 percent in 2015 from 2.6 percent in 2014 (Table F1). EMDEs grew by 3.3 percent in 2015, the weakest showing since 2010. In about half of EMDEs, growth in 2015 fell short of expectations, with the largest disappointments among energy ex-porters (Angola, Colombia, Ecuador, Kazakhstan, Ni-geria, Russian Federation, República Bolivariana de Venezuela) and countries experiencing conflicts (Ukraine) or heightened policy uncertainty (Brazil).
TABLE F1 Real GDP growth forecast1
The World Bank has recently revised downwards its growth forecasts for emerging and developing economies to 4.0 percent in 2016. Amid amply-supplied markets, weak growth prospects for these economies are weighing on commodity prices. This Special Focus addresses the following questions: (i) How are emerging and developing economies perform-ing? (ii) How important are these economies for commodity markets? (iii) What are the implications of the slowdown in major emerging market economies for commodity markets? The results indicate that major emerging markets—par-ticularly China—have been among the largest sources of additional commodity demand during the 2000s. A faster-than-expected slowdown in major emerging economies—especially if combined with financial stress—could reduce commodity prices considerably and set back growth in commodity exporters.
Source: World Bank.Notes: (1) Aggregate growth rates calculated using 2010 U.S. dollars GDP weights. (2) “e” denotes estimate. (3) Percentage point difference from June 2015 projection. (4) EMDE refers to emerging and developing economies that are not identified as advanced markets in Arteta et al. (2015).
Forecast Revision3
2015e2 2016F 2017F 2015e 2016F 2017FWorld 2.4 2.9 3.1 -0.4 -0.4 -0.1 High-income 1.6 2.1 2.1 -0.3 -0.2 -0.1 Euro Area 1.5 1.7 1.7 0.0 -0.1 0.1 Japan 0.8 1.3 0.9 -0.3 -0.4 -0.3 United States 2.5 2.7 2.4 -0.2 -0.1 0.0 EMDE4 3.3 4.0 4.7 -0.4 -0.6 -0.2 Brazil -3.7 -2.5 1.4 -2.4 -3.6 -0.6 China 6.9 6.7 6.5 0.2 -0.3 -0.4 India 7.3 7.8 7.9 -0.2 -0.1 -0.1 Indonesia 4.7 5.3 5.5 0.0 -0.2 0.0 Mexico 2.5 2.8 3.0 -0.1 -0.4 -0.5 Russia -3.8 -0.7 1.3 -1.1 -1.4 -1.2
Turkey 4.2 3.5 3.5 1.2 -0.4 -0.2
FIGURE F1 Contributions of supply and demand shocks to the oil price decline
Source: Baffes et al (2015).Note: The results are based on a structural vector autoregression model with sign restrictions to identify demand and supply shocks that drive oil prices.
-70
-50
-30
-10
10
-80
-60
-40
-20
0
Jul 1
4
Sep
14
Nov 1
4
Jan
15
Mar
15
May
15
Jul 1
5
Sep
15
Nov 1
5
8 Ja
n 16
Supply (RHS)Demand (RHS)Actual (LHS)

COMMODITY MARKETS OUTLOOK | JANUARY 2016 12 SPECIAL FOCUS
The recent slowdown in EMDE growth partly reflects an unwinding of cyclically strong, policy-supported, post-crisis growth, especially in East Asia and Pacific and in Latin America and the Caribbean. However, it also has a considerable structural component. On av-erage, among the 24 largest emerging market econo-mies, about one-third of the slowdown between 2010 and 2014 was structural in nature (Didier et al. 2015). The working-age share of the population has peaked in most regions other than Sub-Saharan Africa, while slowing productivity growth, continued policy uncer-tainty, rising debt and eroding policy buffers capped growth and reduced confidence.
For EMDE growth, 2015 is expected to be a low point. Growth is projected to pick up somewhat in 2016, to 4.0 percent; however, this rate would be 0.6 percentage point lower than previously expected and would be significantly below historical averages (Fig-ure F2).
Downside risks still dominate in this fragile global en-vironment. Many of the factors underpinning the slowdown in recent years—including low commodity prices, weak global trade, and slow productivity growth—are expected to persist. This has already led to a re-evaluation of medium-term growth prospects for the largest emerging market economies (Figure F3). Deteriorating growth prospects are eroding fiscal and monetary policy buffers and leaving many coun-tries more susceptible to external shocks.
How important are emerging econo-mies for commodity markets?2
Despite the growth slowdown since 2010, emerging economies play a significant role in shaping commod-ity markets, both for production and consumption.
Of the five BRICS economies (Brazil, China, India, Russian Federation, and South Africa), four slowed or even contracted in 2015. China’s economy continued to slow, and its rebalancing away from commodity-intensive activities toward services has weighed on global trade and commodity prices. Brazil and Russia, two large commodity exporters, are in deep contrac-tions accompanied by currency depreciation, above-target inflation and deteriorating public finances. In South Africa, chronic power supply bottlenecks are a major factor behind weak growth. In contrast to the other four BRICS, growth in India remained robust, buoyed by strong investor sentiment and the positive effect on real incomes of falling oil prices. (India is the world’s fourth largest crude oil consumer after the United States, China, and Japan, and imports most of the oil it consumes).
Both external factors—including weak global trade, financial market volatility, and persistently low com-modity prices—and domestic factors have contrib-uted to the slowdown. Adverse external developments have hit commodity-exporting developing economies particularly hard. Growth in several of the largest countries (Brazil, Colombia, Nigeria, Peru, South Af-rica) weakened considerably in 2015, as the impact of deteriorating terms of trade on exports was com-pounded by tightening macroeconomic policy and softening investor confidence. Governments re-sponded to falling fiscal revenues from the resource-intensive sectors with spending cuts. Central banks raised interest rates to help moderate pressures on ex-change or inflation rates. Investor confidence weak-ened on deteriorating growth prospects and credit rat-ings, resulting in declining capital inflows and currency depreciations.
Source: World Bank.Note: The developing country aggregate includes recently graduated high-income countries (Argentina, Chile, Hungary, República Bolivariana de Venezuela, and the Russian Federation).
FIGURE F2 GDP growth of emerging and developing economies
FIGURE F3 Change in 2020 growth forecasts from 2010 to 2015
Source: World Bank.Note: Percentage point revision between October 2010 and October 2015.
0
2
4
6
8
10
2009
2011
2013
2015
2009
2011
2013
2015
2009
2011
2013
2015
EMDEs BRICS Developingcommodityexporters
1990-2008 average2003-08 average
Percent change from previous year
-2.5
-2.0
-1.5
-1.0
-0.5
0.0
Unite
d Stat
esEu
ro A
rea
Japa
n
Russ
ian F
ed.
Braz
ilCh
ina Peru
Polan
dInd
ones
iaHu
ngar
yTh
ailan
dTu
rkey
India
Colom
biaMa
laysia
Mexic
o
Advancedeconomies
EMDEs
Percentage points

COMMODITY MARKETS OUTLOOK | JANUARY 2016 13SPECIAL FOCUS
During 2010-14, the four largest emerging markets (Brazil, Russia, India, and China) accounted for 20 percent or more of global gas and oil production and 40 percent or more of global coal and grain produc-tion (Figure F4). At the same time, their commodity consumption has grown rapidly, to about 40 percent of global primary energy and food commodity con-sumption and more than 50 percent of global metal consumption (Figure F5).
That said, there has been considerable heterogeneity among these countries, including between China and India, which together currently account for almost 40 percent of the global population. China has been world’s largest consumer of a number of industrial commodities during the past decade and a half, and accounted for much of the growth of global commod-ity consumption—virtually all of the increase in met-
als and more than half of the increase in primary en-ergy between 2000 and 2014 (Figures F6 and F7). China also accounts for more than half of global coal consumption, most of it domestically produced.
India’s industrial commodity consumption has also increased, but to a lesser extent than China’s, partly as a result of its economic growth being more services-based than China’s. Although primary energy con-sumption in India doubled during the past two de-cades, the country still accounts for only 4.5 percent of global energy consumption. India’s metal con-sumption almost doubled over the period, but from a very small base (from a share of 1.9 percent to 3.4 percent).
In contrast to industrial commodities, China’s con-sumption of agricultural commodities—especially for grain such as maize, rice, and wheat—grew broadly in
Sources: BP Statistical Review, U.S. Department of Agriculture, World Bureau of Metal Statistics.
Sources: BP Statistical Review, U.S. Department of Agriculture.
FIGURE F4 Consumption shares of key commodity groups
FIGURE F5 Production shares of key commodity groups
Source: BP Statistical Review.Note: Last observation is 2014.
FIGURE F7 Coal consumption of China, India, and rest of the world
Source: World Bureau of Metal Statistics.Note: Last observation is 2014. The six metals are included: aluminum, copper, lead, nickel, tin and zinc.
FIGURE F6 Metal consumption of China, India, and rest of the world
0
500
1,000
1,500
2,000
1975 1980 1985 1990 1995 2000 2005 2010 2015
Million tons of oil equivalent
China
India
Rest of world
0
10
20
30
40
50
60
1975 1980 1985 1990 1995 2000 2005 2010 2015
Million metric tons
China
India
Rest of world
0
20
40
60
1990
-94
2010
-14
1990
-94
2010
-14
1990
-94
2010
-14
1990
-94
2010
-14
1990
-94
2010
-14
Edibleoils
Grains Crudeoil
Primaryenergy
Metals
Brazil ChinaIndia Russia
Percent of global consumption
0
20
40
6019
90-9
4
2010
-14
1990
-94
2010
-14
1990
-94
2010
-14
1990
-94
2010
-14
1990
-94
2010
-14
Edibleoils
Grains Coal Naturalgas
Crudeoil
Brazil China
India Russia
Percent of global production

COMMODITY MARKETS OUTLOOK | JANUARY 2016 14 SPECIAL FOCUS
line with global consumption over the past two de-cades, leaving their share of world consumption virtu-ally unchanged at about 23 percent and 10 percent, respectively (Figures F8). This partly reflects a greater sensitivity of agricultural commodity demand to pop-ulation growth compared to industrial commodity demand which is more sensitive to income growth (World Bank 2015a). One exception among agricul-tural commodities is China’s share of global edible oils consumption, which rose almost one-and-a-half fold, to one-fifth of the world total in 2014.
Since 2010, growth in metals and primary energy de-mand from China has slowed steadily. The slowdown was more pronounced in metals whose annual con-sumption growth declined from 10.3 percent during 1995-2008 to 3.2 percent during 2010-14 (Figure F9). This has partly reflected a gradual economic re-balancing in China, away from commodity-intensive investment and industry towards consumption and services.
What are the implications of the slowdown in major emerging market economies for commodity markets?3
Given their significant demand for commodities, a weakening in growth prospects for commodity im-porting emerging market economies could have sig-nificant repercussions for commodity markets. Al-though it is still a low-probability scenario, a faster-than-expected slowdown in China combined with a more protracted deceleration in other major emerging markets could materially weaken growth prospects across EMDEs and derail a still-fragile global recovery. Such a scenario would be accompa-nied by significantly lower global demand for key in-dustrial commodities.
More specifically, a 1 percentage point growth slow-down in the BRICS could result in a 0.8 percentage point decline in growth in other emerging market countries over a span of two years and slow global growth by 0.4 percentage point. Such adverse spill-overs would transmit through a two main channels: trade and commodity markets.
China is deeply integrated into supply chains in East Asia and the Pacific, and constitutes a large export market for commodity-exporting countries in Sub- Saharan Africa and Latin America. Commodity-ex-porting countries, in turn, are important export mar-kets and sources of finance for commodity-importing countries in their respective regions. In particular, Brazil trades significantly with neighboring Latin American countries and Russia generates large remit-tance flows and export revenues for countries in the Caucasus and Central Asia.
Given its direct impact on the demand for commodi-ties and indirect impact through trading partner growth, a sharper-than-expected slowdown in China could have additional repercussions for commodity markets and, hence, commodity exporters. A 1 per-centage point drop in China’s growth could result in a decline in average commodity prices of about 6 per-centage points after two years (Figure 10).4 Although point estimates vary widely across methodologies, the effect would likely be more pronounced for industrial metals prices than for oil prices. For example, while a 1 percentage point decline in China’s growth has been estimated to reduce oil prices by 1.1-1.9 percent, it has been estimated to reduce metals prices by 1.3-5.5 percent (Inoue, Kaya and Ohshige 2015; Ahuja and Nabar 2012).
Focusing on the part of the Chinese economy that is among the most intensive in commodity imports, a 1
FIGURE F8 China’s consumption of key commodities
Sources: BP Statistical Review, World Bank.Note: Primary energy includes coal and oil. Grains consist of maize, wheat, and rice.
20.0
22.5
43.9
11.3
22.0
12.6
22.8
6.4
26.2
4.1
9.2
0 15 30 45
Edible oils
Grains
Metals
Coal
Oil
Primary energy 1990-942010-14
Percent of world total
50.1
FIGURE F9 China’s consumption growth of industrial commodities
Sources: BP Statistical Review and World Bureau of Metal Statistics.Notes: The declines in the growth rate of oil and primary energy are nearly identi-cal because declines in the growth rate of coal have been compensated by cor-responding increases in natural gas.
0
3
6
9
12
Metals Oil Primary energy
1995-20072011-2014
Percent, period average growth rate
50.1

COMMODITY MARKETS OUTLOOK | JANUARY 2016 15SPECIAL FOCUS
Source: World Bank.Note: Solid bars denote the median and the error bars denote the 16-84 percent confidence bands
FIGURE F10 Impact of China’s growth slowdown on commodity prices
Source: World Bank.Note: Solid bars denote the median and the error bars denote the 16-84 percent confidence bands.
percentage point decline in Chinese industrial pro-duction has been associated with a decline of 1.9 per-cent in oil prices and 2.3 percent in copper prices (Roache 2012). As a result of global commodity price impacts, a slowdown in major emerging market com-modity importers would likely set back growth more in commodity-exporting countries than commodity-importing countries (Figure 11).5 Regions with large resource wealth, such as Latin America and Sub-Saha-ran Africa, may be particularly affected by a slowdown in China (Gauvin and Rebillard 2013, World Bank 2015b and 2015c).
Finally, a synchronous slowdown of BRICS would have more pronounced spillover effects if combined with financial stress. In a scenario where BRICS growth continues to be downgraded (as in recent years) and emerging market bond spreads widen by 100 basis points, growth in other emerging markets could be curtailed by 1.3-1.5 percentage points in 2016. This would further set back global growth and be associated with continued downward pressure on commodity prices.
Endnotes
1. This section is based on the January 2016 edition of Global Economic Prospects (World Bank 2016).
2. See World Bank (2015a) for a comprehensive discus-sion of China’s and India’s role in global commodity markets.
3. The model is based on a vector autoregression (VAR) framework, with a recursive identification scheme, is estimated for the period 1998Q1-2015Q2. Key vari-ables included in the model are growth in China (spill-over source), trade-weighted commodity prices, and growth in the spillover destination country. The model
also includes additional variables that serve as controls for global activity and financial conditions. The VAR model is estimated for each spillover destination coun-try one at a time. Technical details of the model and the list of spillover destination countries are provided in Annex 3.2 of World Bank (2016).
4. Cumulated impulse responses of trade-weighted com-modity prices of commodity exporters, for different horizons, due to a 1 percentage point decline in China growth. The average quarterly growth rate of commod-ity prices is about 0.9 percent in the sample. Com-modity exporters include Chile, Malaysia, Paraguay, and Peru.
5. Cumulated impulse responses of GDP growth, at the two year horizon, due to a 1 percentage point decline in China’s growth. For each group, the figures refer to the cross-sectional average response across all the countries in that group. Commodity exporters include Chile, Malaysia, Paraguay, and Peru. Commodity im-porters include Bulgaria, Croatia, Hong Kong SAR, China, Hungary, Jordan, Mexico, Poland, Republic of Korea, Romania, Singapore, Thailand, and Turkey.
References Ahuja, A., and M. Nabar. 2012. “Investment-Led
Growth in China: Global Spillovers.” Working Pa-per 12/267, International Monetary Fund, Wash-ington, DC.
Arteta, C., M. A. Kose, F. Ohnsorge, M. Stocker. 2015. “The Coming U.S. Interest Rate Tightening Cycle: Smooth Sailing or Stormy Waters?” World Bank Policy Research Note No. 2. World Bank, Washington, D.C.
Baffes, J., M. A. Kose, F. Ohnsorge, and M. Stocker. 2015. “The Great Plunge in Oil Prices: Causes,
-2.0
-1.6
-1.2
-0.8
-0.4
0.0
Commodity exporter Commodity importer
Percentage points
FIGURE F11 Impact of China’s growth slowdown on commodity exporting and importing countries
-12
-10
-8
-6
-4
-2
0
On impact 1 year 2 years
Percentage points

CoMMoDItY MARKets oUtLooK | JAnUARY 2016 16 sPeCIAL FoCUs
Consequences, and Policy Responses.” Policy Re-search Note 1, World Bank, Washington DC.
Didier, T., A. Kose, F. Ohnsorge, and L. Ye. 2015. “Slowdown in Emerging Markets: Rough Patch or Prolonged Weakness?” Policy Research Note 4, World Bank, Washington DC.
Gauvin, L. & Rebillard, C. 2013. “Towards Recou-pling? Assessing the Impact of a Chinese Hard Landing on Commodity Exporters: Results from Conditional Forecast in a GVAR Model.” MPRA Paper 65457, University Library of Munich, Munich.
Inoue, T., D. Kaya, and H. Ohshige. 2015. “Th e Im-pact of China’s Slowdown on the Asia Pacifi c Re-gion: An Application of the GVAR Model.” Policy Research Working Paper 7442, World Bank, Wash-ington, DC.
International Monetary Fund. 2014a. World Economic Outlook: Recovery Strengthens, Remains Uneven. In-ternational Monetary Fund, Washington, DC.
__________. 2014b. “IMF Multilateral Policy Issues Report: 2014 Spillover Report.” IMF Policy Paper, International Monetary Fund, Washington, DC.
Roache, S. 2011. “China’s Impact on World Com-modity Markets.” Working Paper 12/115, Interna-tional Monetary Fund, Washington, DC.
World Bank. 2015a. Commodity Markets Outlook,July. World Bank, Washington, DC.
__________. 2015b. Global Economic Prospects: Hav-ing Fiscal Space and Using It, January. World Bank, Washington, DC.
__________. 2015c. Global Economic Prospects: Global Economy in Transition, June. World Bank, Washington, DC.
__________. 2016. Global Economic Prospects: Spill-overs Amid Weak Growth, January. World Bank, Washington, DC.
Author Data Methodology Results
Ahuja and Nabar (2012)
G20, monthly, 2000-11
Factor Augmented Vector autoregres-sion (FAVAR)
A slowdown in Chinese investment would result in a fall in commodity prices, especially metal prices. A 3.5 percentage point decline in China’s investment growth (quarter-on-quar-ter, seasonally adjusted) is associated with a 2-5 ½ percent decline in aluminum, copper, lead, nickel, and zinc prices af-ter one year but an insignifi cant impact on oil prices.
IMF (2014) Advanced and emerging market aggregates, quarterly
VAR with Cho-leskyidentifi cation
Growth declines in emerging markets can adversely affect commodity prices. A 1 percentage point decline in emerging market growth is associated with a more than 6 percent de-cline in average commodity prices after one year, while a 1 percentage point decline in advanced market growth is asso-ciated with an almost 4 percent decline in average commodity prices after one year.
Inoue, Kaya, and Ohshige (2015)
26 advanced andemerging mar-kets, quarterly, 1979-2013
Global VAR (GVAR) with time-varying trade weights
A decline in China’s real GDP has a signifi cant impact on neighboring economies, especially on commodity export-ers (e.g. Indonesia). A 1 percentage point decline in China’s growth would reduce the oil price somewhat less than metal prices (by just over 1 percent after one year).
Gauvin and Rebillard (2015)
36 countries, quarterly, 1995-2014
GVAR A hard landing in China would signifi cantly affect commodity-exporting regions such as Latin America.
Roache (2012) Global aggre-gate, monthly, 2000-2011
VAR with Cho-lesky identifi cation
Shocks to aggregate activity in China have a signifi cant and persistent short-run impact on the price of oil and some base metals. A 1 percentage point increase in China’s industrial production is followed by a 1.9 percent increase in oil prices, 0.4-0.9 percent increase in zinc and aluminum prices, 1-1.7 percent increase in lead, nickel, and tin prices, and 2.3 per-cent increase in copper prices after one year.
World Bank (2015a)
LAC region, quarterly, 1992-2014
VAR with Cho-lesky identifi cation
China’s growth effects on metal prices are an important chan-nel for the transmission of a slowdown in China to commodity exporters in Latin America.
ANNEX Impact of EMDE slowdown on commodity prices: Review of the literature

COMMODITY MARKETDEVELOPMENTS
AND OUTLOOK
EnergyAgriculture
FertilizersMetals
Precious metals


JANUARY 2016COMMODITY MARKETS OUTLOOK 19
Energy
The World Bank Energy Index fell 13 percent in the fourth quarter from the previous period. Oil led the decline, dropping 13 percent on continued ample supply, expectation of an early increase in production in the Islamic Republic of Iran, deteriorating growth prospects in major energy- importing countries, high stocks and continued OPEC policy to defend market share. Natural gas and coal prices fell 15 and 9 per-cent, respectively, owing to similarly weak demand and abundant supply.
Crude oilCrude oil prices averaged $42.2/bbl in the fourth quarter, down 13 percent from the third quarter (see Appendix B, Crude Oil). For the year, crude oil prices averaged $50.8/bbl, down 47 percent from 2014 and the lowest annual level since 2004. From November 2015, oil prices declined steadily, slipping below $30/bbl in mid-January in a slide that appears somewhat stronger than warranted by fundamentals. Weak oil prices reflected continued ample supply from non-OPEC producers, expectations of an imminent ex-pansion of Iranian exports as sanctions were lifted somewhat earlier than expected, high stocks, weaken-ing growth prospects in major oil-importing econo-mies, and OPEC’s continued resolve to defend mar-ket share (Figure 3).
Despite tepid global industrial activity weighing on gasoil (diesel) demand, overall oil demand (especially for gasoline) was robust in 2015 but slowed in the fourth quarter as mild temperatures in the northern hemisphere reduced heating oil demand. U.S. crude oil production continued to fall from its peak in April, but less than expected—despite a plunge in invest-ment and drilling—owing to efficiency gains and cost reductions. As many non-OPEC producers sustain
losses at oil prices below $40/bbl, such production cuts are expected to accelerate in 2016 whereas OPEC production is expected to rise.
By December, a sharp decline in Brent spot prices had virtually eliminated the differential with the West Texas Intermediate (WTI) price, from a high of $8 per barrel in March 2015. Meanwhile, the WTI was supported by declining light oil production from shale and expanding pipeline and rail infrastructure in the United States and the repeal of the 1975 ban on U.S. crude oil exports in late December. The immedi-ate impact of lifting the ban on U.S. crude exports will be muted, as export infrastructure is limited and the United States still imported in excess of 7 mb/d of crude in 2015. U.S. light crude imports are expected to rise further as output from West Africa, for exam-ple, becomes more competitively priced. Neverthe-less, removal of the export ban gives producers more options, such as selling to refiners in Central and South America. However, several uncertainties remain concerning the availability of crude for export and the demand for light crude by U.S. Gulf coast refiners. In the medium term, the WTI-Brent differential is ex-pected to remain narrowly near export transport costs to less than $3/bbl.
Global oil consumption has faced two offsetting pres-sures: weakening real income growth and sharply lower prices. While weakening growth, especially in emerging market and developing countries, has weighed on consumption, the sheer magnitude of the oil price decline—two-thirds of which due to a supply shock—has encouraged consumption. On balance, consumption growth reached a five-year high at 1.8 percent in 2015, despite some weakening in the fourth quarter to 1.1 percent as a result of lower heat-ing oil consumption in OECD countries amidst mild winter weather in the northern hemisphere (Figure 4). While gasoline demand remained robust, weak diesel
FIGURE 3 Crude oil prices, daily
Source: Bloomberg.Note: Last observation is January 22, 2016.
FIGURE 4 World oil demand growth
Source: International Energy Agency.Note: The last observation, 2016Q1, is an estimate.
-4
-2
0
2
4
2007Q1 2009Q1 2011Q1 2013Q1 2015Q1
OECDChinaOther Non-OECD
mb/d, growth year over year
20
30
40
50
60
70
Jan-15 Apr-15 Jul-15 Oct-15 Jan-16
US$/bbl
Brent
WTI

commodity markets outlook JaNuary 2016 20
demand reflected slowing economic activity in China and tepid global industrial activity.
For 2016, world oil consumption growth is expected to slow to 1.3 percent (1.2 mb/d) to an average global consumption of 95.7 mb/d. The slowdown in growth partly reflects the waning boost to demand from lower oil prices. OECD oil consumption is expected to be flat with a modest gain in North America nearly off-setting declines elsewhere. Non-OECD oil consump-tion is projected to rise by 1.2 mb/d (2.4 percent). Consumption growth is expected to be considerably slower in Asia, which still accounts for the bulk of non-OECD growth.
Global oil production growth slowed sharply to 1.5 mb/d in the fourth quarter of 2015, from an average of nearly 3 mb/d during the first three quarters. Most of the gains in the fourth quarter were from OPEC countries, while non-OPEC production was up only marginally (with gains exceeding 0.1 mb/d only in the United States and Russia) despite cost reductions and efficiency gains. This reverses a trend over the previous 10 consecutive quarters where non-OPEC produc-tion recorded gains averaging nearly 2 mb/d, more than two-thirds of this in the United States.
Despite sharp cuts in investment, U.S. production has remained more resilient than projected. U.S. up-stream investment is estimated to have fallen by about one-third last year, and rigs drilling for oil fell by two-thirds from a high in October 2014 (Figure 6). Pro-ducers have responded with productivity increases and cost cuts by utilizing their most efficient rigs on the most productive tracts; reducing drilling time and re-fracking wells; better planning and innovation; greater proppant use; longer laterals and tighter well spacing. In the Eagle Ford (Texas) and Bakken (North Dakota) regions, new well productivity has more than
doubled from less than 300 barrels per well in early 2012, to 785 and 712 barrels per well, respectively. As a result, U.S. crude oil production declined only moderately, from a peak in April at 9.7 mb/d to 9.2 mb/d in December, and mostly in the on-land lower-48 states, especially in shale-producing basins in Texas and, to a smaller extent, in North Dakota (Figure 5).
Looking ahead, U.S. shale oil production could drop off sharply. Output from shale oil wells declines rap-idly, falling by some 70 percent or more in the first year and more than 80 percent in the first two years. This requires substantial drilling to offset the shale’s rapid declines. While efficiency gains and technical innovation are expected to continue, future improve-ments may be more difficult.
For 2016, overall non-OPEC production is expected to decline by 0.6 mb/d. The U.S. Energy Information Administration projects that U.S. crude oil produc-tion declines from 9.3 mb/d in the fourth quarter of 2015 to 8.5 mb/d in the fourth quarter of 2016. For 2016 as a whole, total U.S. production is projected to decline by 0.7 mb/d, with output in the lower-48 states falling 0.8 mb/d, partly offset by an increase of 0.1 mb/d in the Gulf of Mexico. Non-OPEC produc-tion outside the U.S. is expected to fall by 0.1 mb/d, with small declines in most regions only partially off-set by increases in Canada and Brazil of more than 0.1 mb/d each.
OPEC (excluding new member Indonesia) crude oil production averaged 31.7 mb/d during the second half of the year, ending the year at 31.6 mb/d—up from 30.5 mb/d a year earlier. Most of the gains came from Iraq and Saudi Arabia. Iraq’s output reached a record 4.3 mb/d in September, but the country is not expected to exceed this level in 2016 under the strain
FIGURE 5 U.S. crude oil production
Source: U.S. Energy Information Administration.Note: Last observation is October 2015.
Sources: Baker Hughes, Bloomberg.Note: Last observation is January 22, 2016.
FIGURE 6 U.S. oil rig count and oil prices, weekly
0
1
2
3
4
5
Jan-09 Jan-11 Jan-13 Jan-15
OtherTexasNorth Dakota
mb/d
0
300
600
900
1,200
1,500
1,800
25
50
75
100
125
150
Jan-07 Jan-09 Jan-11 Jan-13 Jan-15
US$/bbl Rig count
US oil rig count (RHS)
Oil price, WTI (LHS)

JANUARY 2016COMMODITY MARKETS OUTLOOK 21
of low oil prices and a costly conflict against the so-called Islamic State. While Libya’s output has held near 0.4 mb/d, it is uncertain when production might rise following a UN brokered agreement forming a national unity government. At the OPEC meeting on December 4, the Organization decided to keep pro-ducing at current levels, with key exporter, Saudi Ara-bia, intent on maintaining market share. The group abandoned its 30 mb/d production target, which had been in place since the beginning of 2012. Adding to the uncertainty were expectations that the Islamic Republic of Iran would increase exports earlier-than-expected.
Ample supplies continue to result in higher OECD crude oil inventories (Figure 7). Much of the increase in stocks has been in North America, but they are el-evated in Europe and the Pacific regions as well. In the fourth quarter—a period when stocks typically fall—global inventories soared by an implied 1.8 mb/d, a record for the quarter, on warm winter weather in the northern hemisphere.
For 2016, crude oil prices are projected to average $37/bbl, a decline of 27 percent from last year. From their current lows, a gradual recovery in oil prices is expected over the course of the year, resulting from a number of factors. First, part of the sharp oil price drop in early 2016, which does not appear fully war-ranted by fundamental drivers of oil demand and sup-ply, is likely to reverse. Second, high-cost oil produc-ers are expected to sustain persistent losses and increasingly implement production cuts that are likely to exceed any additional capacity coming to the mar-ket. Third, demand is expected to strengthen some-what, along with a modest pickup in global growth.
The anticipated oil price recovery is forecast to be smaller than the rebounds that followed sharp drops
in 2008, 1998, and 1986. In these declines, prices re-bounded from their troughs by around 50 percent within about five months, and approximately doubled after 12 months (Figure 8). In 1998 and 2008, signifi-cant OPEC production cuts contributed to the price recovery, while in 1986 OPEC sought to regain its market share— somewhat similar to its current intent on defending its share. The currently expected price recovery over the course of 2016 is less than that in the previous episodes owing to large stocks and pros-pects for continued ample supplies (including from OPEC) and anemic demand.
On balance, the price outlook remains subject to con-siderable downside risks. These include a larger-than-expected increase in Iran’s exports and a possible re-covery of exports from Libya. Short-cycle U.S. shale production may again turn out to be more resilient than currently anticipated if companies achieve fur-ther productivity gains. Ample supply would particu-larly weigh on prices if global demand were to also weaken more than expected. Prices may thus have to fall further to reduce production and investment, es-pecially for short-cycle U.S. shale production.
Upside risks include sharper-than-anticipated non-OPEC supply declines and slow expansion of exports from Iran. In addition, there are risks of disruptions among key OPEC producers mostly because of inter-nal conflict. Higher-than-forecast global demand would also help reduce the stock overhang.
FIGURE 7 OECD crude oil stocks
Source: International Energy Agency.Note: Last observation is November 2015.
FIGURE 8 Oil prices during collapse and recovery episodes, monthly
Source: World Bank.Note: Lines indicate oil prices for 12 months before and after the trough, indexed to 100 at the trough. Dashed line indicates forecast. Shaded area denotes range of forecasts by 6 major investment banks, released during January 15-22, 2016.
900
1,000
1,100
1,200
Jan-07 Jan-09 Jan-11 Jan-13 Jan-15
Million barrels
5-year average
Crude oil stocks
50
100
150
200
250
300
350
-12 -10 -8 -6 -4 -2 0 2 4 6 8 10 12
Forecast rangeJul 1985-Jul 1987Dec 1997-Dec 1999Dec 2007-Dec 2009Jan 2015-Jan 2017
Nominal index 100=trough

COMMODITY MARKETS OUTLOOK JANUARY 2016 22
Source: BP Statistical Review of World Energy.Note: Last observation is 2014. FSU is Former Soviet Union.
Source: World Bank. Note: Last observation is December 2015.
Coal
Thermal coal prices fell 9 percent in the fourth quarter on continued weak demand, high stocks, and surplus production. Prices have fallen by more than 60 percent since the beginning of 2011 because of chronic over-supply and falling imports into China—the world’s largest consumer of coal—and India (Figure 9). Europe and United States continue to shun coal amidst a global drive towards cleaner energy, collapsing gas prices, and increasing power efficiency. Global coal supplies continue to increase aided by falling costs and depreciating producer currencies.
China’s coal imports fell by one-third in 2015 due to slowing industrial activity, growing contributions from other sources to generate power, and government poli-cies to limit coal use. China is suspending the approval of new mines for the next three years, and in an effort to reduce pollution coal’s share of energy consumption is to be reduced to 62.6 percent this year from 64.4 percent in 2015. In addition, rising capacity of China’s high-voltage long-distance power transmission net-work could suppress coastal import demand.
Coal prices are expected to decline 13 percent in 2016 to $50/ton, on continued weak demand and oversup-ply. The coal industry faces difficult market conditions, as cheap natural gas and policies that favor clean energy challenge coal’s position in the power sector. Import demand in China is expected to continue falling, and will only partly be offset by rising demand in India and other emerging markets. Coal also faces declining con-sumption in the OECD, particularly in the U.S. and Europe. Ample coal supplies are likely, in part because of the ramp-up in new capacity from earlier invest-ment. There is also significant spare capacity in coun-tries such as Indonesia and Australia that could be brought on-line.
Natural gas
Natural gas prices fell 15 percent in the fourth quar-ter, as all three main markets remain in surplus amid weak demand, large stocks and ample supply (Figure 10). U.S. gas prices plunged 23 percent to $2.1/ mmbtu as stocks touched record highs, and con-sumption weakened because of mild weather. Demand has been robust for power generation, and continues to substitute for coal. While natural gas production continued to grow, shale gas output has declined, including in the northeast Marcellus basin, which lacks pipeline capacity out of the region.
European gas prices fell 9 percent to $6.3/mmbtu, also on weak seasonal demand from mild tempera-tures. Eu-rope remains well supplied, despite the Netherlands setting a 27 billion cubic meter (bcm) cap for Groningen field production. The cap was imposed because of damage from earthquake tremors linked to gas extraction. The field produced 54 bcm in 2013. The price of gas delivered to Japan fell 2 percent to $9.4/mmbtu, as im-ported gas largely remains indexed to oil prices (with a lag). Still, spot cargoes of liquefied natural gas (LNG) are flowing into Asia at $7/mmbtu (and to Europe at under $6) because of excess seaborne supply.
Natural gas prices are projected to fall in 2016, led by large declines in Japan (-19 percent to $8.5/mmbtu) and Europe (-17 percent to $6.0/mmbtu), on contin-ued surplus supply and further competitive pressures on oil-linked import contracts. Gas prices in the U.S. are expected fall by 4 percent to an average of $2.5/ mmbtu, but are up from recent lows due to contin-ued strong growth in demand, rising pipeline and LNG exports, and slowing production growth. Risks are mainly to the downside, however, given a global supply surplus and the resilience of production in the United States.
0
500
1,000
1,500
2,000
1970 1980 1990 2000 2010
Million tons of oil equivalent
China
OECD
Other
FSU
0
5
10
15
20
Jan-00 Jan-02 Jan-04 Jan-06 Jan-08 Jan-10 Jan-12 Jan-14
US$/mmbtu
Coal (Australia)
Natural Gas(Japan)
Natural Gas (U.S.)
Natural Gas(Europe)
FIGURE 10 Coal and natural gas prices, monthly
FIGURE 9 Coal consumption of key countries and regions

JANUARY 2016COMMODITY MARKETS OUTLOOK 23
Agriculture
Agricultural prices continued their broad-based de-clines, with the overall index down 2.3 percent for the fourth quarter of 2015 and 12 percent lower than a year ago (Figure 11). The two key sub-indices both declined: grains fell 2.5 percent, and oils and meals 4.1 percent. Agricultural raw materials prices declined as well (more than 2 percent), while beverage prices were broadly unchanged. The price declines were driven by favorable supply conditions (despite a strong El Niño episode currently under way), with a number of food commodities (such as wheat) and ed-ible oils expected to reach record production levels. Other factors, including a strong U.S. dollar, low en-ergy prices, high stock levels (in turn a reflection of good crop yields during the past two seasons), and weak growth of biofuel production have also contrib-uted to the softness of prices. Most agricultural com-modity prices are expected to fall in 2016. Specifically, grains are expected to decline 3.4 percent, and oils and meals 2.2 percent, while raw material and bever-age prices will decline by 1 percent. Prices are expected to recover marginally in 2017, but even that mild re-covery is subject to numerous downside risks.
Food
Grain prices declined 2.5 percent in the fourth quar-ter; they are 14 percent lower than a year ago and al-most 40 percent below their early 2011 peaks. Wheat prices declined almost 5 percent in the quarter, fol-lowed by rice and maize, which were down about 1.3 percent each.
Global production of wheat is expected to reach a new record in the 2015-16 season (1.5 percent higher than last season), with output increases in Australia, China, and Ukraine that more than offset declines in Argen-tina and Canada. As a result, the stocks-to-use ratio (a
FIGURE 11 Agriculture price indices, monthly
Source: World Bank.Note: Last observation is December 2015.
Source: U.S. Department of Agriculture.Note: Numbers are based on USDA's January 2016 update.
measure of the abundance of supplies relative to de-mand) is anticipated reach a 14-year high in 2015-16 (Figure 12), despite higher global wheat consump-tion. Trade volume, however, is expected to decline as several major wheat importers have good production prospects of their own.
The market for maize is expected to tighten, with global production projected to reach 968 million tons this season—marginally lower than assessments pre-pared in May 2015 and 4.3 percent lower than 2014-15. Mostly due to weather, production is expected to fall in most producing countries and regions, includ-ing Argentina (-3.4 percent), Brazil (-4.1 percent), European Union (-23.8 percent), and the United States (-4 percent). Despite tighter maize supplies, the stocks-to-use ratio will remain largely unchanged due to low consumption and higher stock carry-over.
Global rice production is also expected to decline marginally (from 478 to 470 million tons) on weak-ening output prospects in Asia, particularly in India, the Philippines, and Thailand, the world’s top rice ex-porter. The stocks-to-use ratio for rice is expected to drop to 18.6 percent, down from last season’s 21.7 percent. The ongoing tightness in the rice market has been linked to El Niño.
Global supplies (beginning stocks plus production) for all three grains will reach 2.70 billion tons in 2015-16, slightly up from last season’s record of 2.69 billion tons, according to the United States Depart-ment of Agriculture’s January 2016 assessment (Fig-ure 13). Thus, the lower stocks-to-use ratio of rice will be offset by a higher maize ratio.
The World Bank’s Edible Oils and Meals Price Index declined 4.1 percent in the quarter due to declines in three of its key components: soybean meal (-10.2 per-cent), soybeans (-2.7 percent), and palm oil (-0.9 per-cent). The overall index is down almost 20 percent
60
80
100
120
140
Jan-07 Jan-09 Jan-11 Jan-13 Jan-15
US$ indices, 2010=100
Food
Beverages
Raw materials
FIGURE 12 Stock-to-use ratios of maize, wheat, and rice
0
5
10
15
20
25
30
35
Maize Wheat Rice
2006-0710-yr average2015-16
Percent

commodity markets outlook JaNuary 2016 24
from a year ago, and close to 40 percent lower than its early 2011 peak.
The oilseed supply outlook is healthy with current season global supplies of the 10 major oilseeds ex-pected to reach 619 million tons, 11 million tons higher than last season. Most of the increase in cur-rent supplies comes from elevated stock carry-over, which will reach 99.1 million tons, up from last sea-son’s 79.4 million tons. The increase in stocks reflects last year’s record soybean harvest.
The outlook is positive for the 17 most consumed ed-ible oils as well: global production in 2015-16 will reach 207 million tons, up from last season’s 204 mil-lion tons, with most of the increase coming from soy-bean oil (Figure 14). The consumption of edible oils is typically more strongly correlated with income than consumption of other agricultural commodities since growing incomes are associated with increased food consumption in restaurants and in processed form—both with higher edible oil content compared to home-cooked meals.
In view of the adequate-supplied food commodity markets, along with lower energy prices and the mac-roeconomic headwinds discussed in the Special Focus section, the World Bank’s Food Commodity Price In-dex is expected to decline 1.7 percent in 2016 before rebounding 2 percent the year after. This assessment is subject to a number of short- and long-term risks. The most important center on the evolution of energy prices (especially the likelihood of remaining low for an extended period of time); weather patterns (given the ongoing El Niño and, possibly La Niña episodes); trade policies (especially the reversal from export re-strictions to domestic support); and biofuel consump-tion (in view of lower energy prices).
Energy prices
Agriculture is very energy-intensive—it is four to five times more energy intensive than manufacturing in terms of energy used for a given value of output. Hence, food commodity prices are greatly affected by energy prices through numerous channels. The long-term transmission elasticity from energy to food com-modity prices is estimated at between 0.15 and 0.20, suggesting that a halving of energy prices may precipi-tate a 10 percent decline in food prices (assuming ev-erything else remains the same).
Oil prices are expected to average $37 in 2016 (almost two-thirds lower than their 2011-14 levels), while fer-tilizer prices are projected to fall 4 percent in 2016, on top of last year’s 5 percent decline. (Fertilizer prices are linked to natural gas prices because gas is a key input to fertilizer production.) Thus, a prolonged pe-riod of low energy prices will ease the input cost pres-sures that affected most agricultural commodities dur-ing the post-2005 price boom, keeping commodity prices depressed.
Weather
The key weather-related risk is El Niño, which will reach its peak during the first quarter of 2016. El Niño typically affects agricultural production in the Southern Hemisphere, especially in Australia and countries in East Asia and South America (see the Spe-cial Focus of the October 2015 edition of the Com-modities Market Outlook for an extensive discussion on El Niño). Its impact in the northern hemisphere is modest.
Despite being one of the strongest on record, the im-pact of El Niño on commodity prices is likely to be predominantly local rather than global, especially
Source: U.S. Department of Agriculture.Note: Grains include maize, wheat, and rice.
FIGURE 14 Global production of key edible oils
Source: U.S. Department of Agriculture.Note: Numbers are based on USDA's January 2016 update.
1.2
1.4
1.6
1.8
2.0
2.2
2.4
1990 1993 1996 1999 2002 2005 2008 2011 2014
ProductionConsumption
Billion metric tons
FIGURE 13 Global grain production and consumption
0
40
80
120
160
200
1990 1993 1996 1999 2002 2005 2008 2011 2014
Palm oilSoybean oilRapeseed oilOthers
Million metric tons

JANUARY 2016COMMODITY MARKETS OUTLOOK 25
Source: World Bank.Note: Price changes are based on quarterly averages.
given the elevated supplies of most agricultural com-modities. Indeed, the prices of commodities most vul-nerable to El Niño saw year-on-year declines of be-tween 2 percent (rice) and 33 percent (wheat) in the second quarter of 2015, when El Niño discussions intensified (Figure 15). The price drops were even more pronounced in the fourth quarter of 2015, when El Niño was peaking.
Trade policies
In the years following the food price spikes of 2007-08 and 2010-11, numerous countries imposed export restrictions in order to insulate their domestic com-modity markets from increases in world prices. Prom-inent among those were export taxes and outright ex-port bans imposed by various East Asian rice producing nations in the aftermath of the 2008 price spike, and by some Central Asian wheat producers during the 2010 price spike. Similar trade restrictions are unlikely to be repeated in view of the lower price environment.
In today’s weak commodity price enviroment, govern-ments are increasingly shifting from trade policies aimed to reduce consumer prices, to domestic support programs designed to raise farmgate prices. For ex-ample, an income transfer mechanism for wheat is expected to be implemented by Egypt in early 2016, supporting wheat farmers to the tune of $400 per hectare. Likewise, the Indian government has in-creased the minimum support prices of wheat by more than 5 percent. Indonesia is considering a 10 percent import tariff on soybeans, in addition to a 10 percent increase in the floor price. Numerous other countries are considering support to farmers as well, especially those affected by drought conditions associ-ated with El Niño (e.g., India and South Africa). Al-
though these policies are unlikely to affect global food markets in a major way, if they are implemented at a large scale and frequency (or adopted by countries with large shares in world trade), they could lead to even lower agricultural commodity prices.
Biofuels
Finally, the outlook for food commodity prices also assumes that biofuels will continue to play a key role in agricultural commodity markets. However, this role is likely to be less prominent than in the past. Currently, biofuels account for 3-4 percent of global arable land and 1.5 mb/d in crude oil equivalent terms (Figure 16). The world’s top three biofuel producers are the United States (accounting for 42 percent of global biofuel production, mostly from maize-based ethanol), Brazil (with a 24 percent share, mostly from sugarcane-based ethanol), and the European Union (with a 14 percent share, mostly from rapeseed-based biodiesel). Although biofuel production is expected to increase, growth will be much slower than previously anticipated. Indeed, production of biodiesel—which accounts for 20 percent of global biofuel production versus 80 percent for ethanol—declined almost 2 per-cent in 2015, the first decline since 2000. Biodiesel is projected to return to 2014 levels in 2016.
Low oil prices may increase biofuel demand given that they lead to higher oil consumption, which under mandated blending, implies more use of biofuels. However, several countries are reconsidering biofuel policies (and targets), as policy makers increasingly realize that the environmental and energy indepen-dence benefits of biofuels are not as large as initially thought, and that targets are harder to achieve than expected.
FIGURE 16 Global biofuel productionFIGURE 15 Price changes of commodities affected by El Niño
Sources: BP Statistical Review and World Bank.Note: The 2016 valve is a forecast.
0.0
0.4
0.8
1.2
1.6
1990 1993 1996 1999 2002 2005 2008 2011 2014
Million barrels per day of oil equivalent
-50 -40 -30 -20 -10 0
WheatNatural RubberPalm oilCoffee (arabica)CopperSoybeansCottonMaizeSugarRice
2014Q2-2015Q22014Q2-2015Q4
Percent change

commodity markets outlook JaNuary 2016 26
Beverages
The World Bank’s Beverage Price Index declined mar-ginally in the fourth quarter of 2015, led by declines in the prices of robusta coffee and tea, down 4.2 and 3.1 percent, respectively, for the quarter. Arabica cof-fee prices dipped slightly (-1.7 percent), while cocoa prices increased by a similar amount.
Although arabica coffee prices were broadly un-changed in the quarter, they are almost 30 percent lower than a year earlier (Figure 17). The price decline reflects Brazil’s strong recovery from last year’s drought, which had raised arabica coffee prices to al-most $5/kg. Other arabica producers, including Co-lombia and some countries in Central America, will also experience output increases. Despite concerns about Indonesia’s robusta coffee production due to the El Niño-related drought, prices remain weak, down 4.2 in the fourth quarter of 2015 and 20 per-cent lower than a year ago. In view of the adequately supplied coffee market, both arabica and robusta prices are expected to decline in 2016 (-3.6 and -7.3 percent, respectively).
Cocoa prices gained 1.5 percent in the quarter, and stand almost 11 percent higher than a year earlier. The strength of cocoa prices reflects concerns that the global market will swing into deficit next year, due to downward forecast revisions in Indonesia’s output (linked to El Niño), as well as an expected fall in Côte d’Ivoire’s output. Cocoa prices are projected to in-crease marginally in 2016 (+2.1 percent), but then soften in 2017 as market supplies return to surplus. Finally, tea prices, which declined 3.1 percent in the fourth quarter due to ample supplies form several Af-rican producers, are expected to remain relatively sta-ble in the medium term at about $2.80/kg.
Agricultural raw materials
The World Bank’s Raw Material Price Index declined a further 2.3 percent in the fourth quarter, and was 5 percent lower than a year earlier and almost 40 per-cent below its 2011 peak. This pattern largely mirrors the path of the other two industrial commodity price indices—energy and metals. The across-the-board weakness of industrial commodity prices reflects, for the most part, a slowing global economy (especially of emerging market economies, which account for most commodity consumption growth), and the scaled-up production capacity as a result of the high post-2005 prices.
Cotton prices changed little in the last quarter of 2015, as the market is gradually returning to deficit following six consecutive years of surpluses. These sur-pluses went mostly to China’s stock-building, which currently accounts for almost 60 percent of world’s stocks. Global cotton stocks currently represent one year of consumption, a highly atypical situation. In view of this season’s deficit, cotton prices are expected to increase 2.7 percent in 2016 and 3.6 percent in 2017, assuming that there is no sharp draw-down in China’s stocks.
Natural rubber prices continued their downward path, falling 14 percent in the fourth quarter com-pared with a year earlier and almost 80 percent lower than in 2011. The downward spiral of rubber prices reflects weak growth of tire sales, especially in China; two-thirds of natural rubber goes to tire manufactur-ing. Supplies of natural rubber have remain strong, especially by key East Asian producers, including In-donesia and Thailand (Figure 18). The weakness in rubber prices is expected to persist throughout 2016 (dropping by a further 10 percent from 2015), before a mild recovery materializes in 2017 (increasing by 6 percent).
FIGURE 17 Arabica and robusta coffee prices, daily
FIGURE 18 Natural rubber production
Source: Rubber Statistical Bulletin, International Rubber Study Group.Note: Numbers are based on the January 2016 update.
Source: Bloomberg. Note: Last observation is January 22, 2016.
0
1
2
3
4
2007Q1 2009Q1 2011Q1 2013Q1 2015Q1
Thou
sand
s IndonesiaThailandRest of World
Million metric tons
2.5
3.0
3.5
4.0
4.5
5.0
1.3
1.5
1.7
1.9
2.1
Jan-15 Mar-15 May-15 Jul-15 Sep-15 Nov-15 Jan-16
US$/kg
Arabica (RHS)
Robusta (LHS)
US$/kg

JANUARY 2016COMMODITY MARKETS OUTLOOK 27
Fertilizers
Fertilizer prices fell 2 percent in the fourth quarter of 2015, the fourth consecutive quarterly decline, due to weak import demand, high stocks, and growing sup-ply capacity (Figure 19). Phosphate prices led the de-cline by dropping 10 percent. Urea prices fell 7 per-cent, down for a fifth straight quarter, while potash prices declined 2 percent. Phosphate rock prices con-tinued to climb, rising by 5 percent. Demand weak-ness stems from declining farmer profitability, lower crop prices, and depreciating currencies of key im-porting countries. Supply surpluses are being exacer-bated by falling costs and cheaper feedstock prices (e.g., natural gas). Phosphate prices for DAP fell 10 percent (TSP prices were flat) due to weak seasonal demand and contin-ued contraction in Brazil’s fertilizer consumption. Production capacity continued expanding globally, although some producers sought to curtail output in the fourth quarter. Demand is expected to grow mod-erately in 2016, initially from Australia and Brazil, and then in other major importing countries in the spring. Capacity expansions are expected in Morocco and Saudi Arabia, which along with elevated stocks, are expected to weigh on prices. The decline in urea prices was mainly due to oversup-ply amid weak seasonal demand. Global import de-mand was weaker in 2015, led by reductions in urea purchases in Brazil, despite increases in imports in a few countries such as India and the United States. There were also natural gas supply constraints in a number of countries (Arab Republic of Egypt, Ukraine) and regions (e.g., South Asia), while new gas capacity came online in Asia and Africa. Higher-cost urea producers benefited from lower energy prices: Chinese firms benefited from lower coal prices while European firms benefited from cheaper natural gas
prices. While new export capacity is expected this year in a number of regions (especially Africa), U.S. im-ports may fall as substantial new domestic production comes on stream (on top of the gains in 2014), and could significantly impact global trade flows. Potash (potassium chloride) prices fell 2 percent in the quarter owing to weak demand, particularly in Brazil, and elevated stocks. Global potash capacity declined in the United States, Lao People’s Democratic Repub-lic, and the Russian Federation (the latter as a result of a mine flood). These were partly offset by capacity in-creases in Canada, which will add to production vol-umes in 2016. Upcoming annual contract negotia-tions with Chinese and Indian buyers are likely to result in significant reductions from the current con-tract price of $315/tons. Weak demand, surplus global capacity, and currency devaluations will also factor into negotiations. Fertilizer prices are projected to decline by 4 percent in 2016 due to weak demand, rising supply capacity, and destocking. Nutrient application, which has been on a rising trend faces headwinds as farmers are likely to economize more on fertilizer use in order to reduce costs and offset the effects of lower crop prices and currency depreciations (Figure 20). Prices are gener-ally expected to increase moderately over the medium term due to growth in demand, higher energy costs, and to support investment for required new capacity of primary and processed supply. Forecast risks are skewed to the downside, owing to the poor economic positions of farmers, and expected increases in new production capacity. Subsidy reform in large consuming countries could curtail demand and precipitate adjustments in fertilizer use, notably in India which favors urea application over phosphate and potash. On the upside, higher agriculture prices and currency appreciation could boost fertilizer de-mand and prices.
FIGURE 19 Fertilizer prices
Source: World Bank.Note: Last observation is December 2015.
FIGURE 20 Global nutrient consumption
Source: Agrium Fact Book, International Fertilizer Association..Note: Consumption does not include industrial use.
0
200
400
600
800
1000
1200
Jan-07 Jan-09 Jan-11 Jan-13 Jan-15
US$/mtDAP
Urea
Potassium chloride
0
40
80
120
160
200
2004-05 2006-07 2008-09 2010-11 2012-13 2014-15
Nitrogen Phosphorus Potassium
Million metric tons
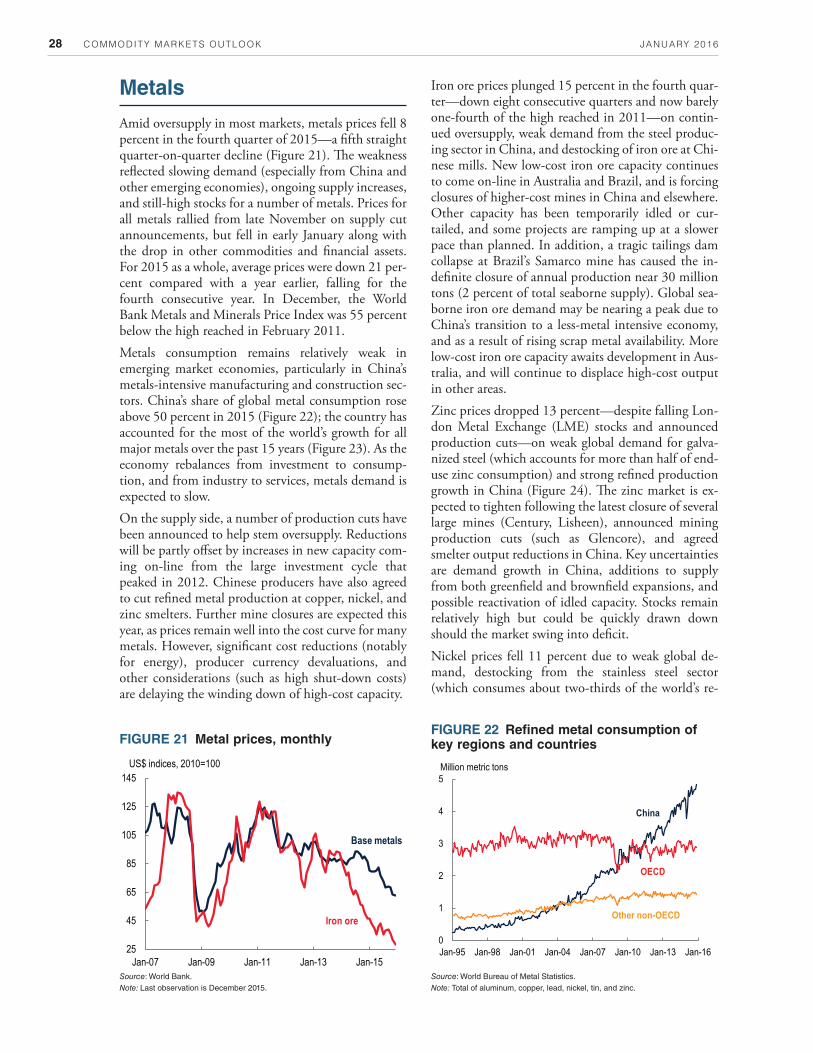
commodity markets outlook JaNuary 2016 28
Metals
Amid oversupply in most markets, metals prices fell 8 percent in the fourth quarter of 2015—a fifth straight quarter-on-quarter decline (Figure 21). The weakness reflected slowing demand (especially from China and other emerging economies), ongoing supply increases, and still-high stocks for a number of metals. Prices for all metals rallied from late November on supply cut announcements, but fell in early January along with the drop in other commodities and financial assets. For 2015 as a whole, average prices were down 21 per-cent compared with a year earlier, falling for the fourth consecutive year. In December, the World Bank Metals and Minerals Price Index was 55 percent below the high reached in February 2011.Metals consumption remains relatively weak in emerging market economies, particularly in China’s metals-intensive manufacturing and construction sec-tors. China’s share of global metal consumption rose above 50 percent in 2015 (Figure 22); the country has accounted for the most of the world’s growth for all major metals over the past 15 years (Figure 23). As the economy rebalances from investment to consump-tion, and from industry to services, metals demand is expected to slow. On the supply side, a number of production cuts have been announced to help stem oversupply. Reductions will be partly offset by increases in new capacity com-ing on-line from the large investment cycle that peaked in 2012. Chinese producers have also agreed to cut refined metal production at copper, nickel, and zinc smelters. Further mine closures are expected this year, as prices remain well into the cost curve for many metals. However, significant cost reductions (notably for energy), producer currency devaluations, and other considerations (such as high shut-down costs) are delaying the winding down of high-cost capacity.
FIGURE 21 Metal prices, monthly
Source: World Bank.Note: Last observation is December 2015.
FIGURE 22 Refined metal consumption of key regions and countries
Source: World Bureau of Metal Statistics.Note: Total of aluminum, copper, lead, nickel, tin, and zinc.
Iron ore prices plunged 15 percent in the fourth quar-ter—down eight consecutive quarters and now barely one-fourth of the high reached in 2011—on contin-ued oversupply, weak demand from the steel produc-ing sector in China, and destocking of iron ore at Chi-nese mills. New low-cost iron ore capacity continues to come on-line in Australia and Brazil, and is forcing closures of higher-cost mines in China and elsewhere. Other capacity has been temporarily idled or cur-tailed, and some projects are ramping up at a slower pace than planned. In addition, a tragic tailings dam collapse at Brazil’s Samarco mine has caused the in-definite closure of annual production near 30 million tons (2 percent of total seaborne supply). Global sea-borne iron ore demand may be nearing a peak due to China’s transition to a less-metal intensive economy, and as a result of rising scrap metal availability. More low-cost iron ore capacity awaits development in Aus-tralia, and will continue to displace high-cost output in other areas. Zinc prices dropped 13 percent—despite falling Lon-don Metal Exchange (LME) stocks and announced production cuts—on weak global demand for galva-nized steel (which accounts for more than half of end-use zinc consumption) and strong refined production growth in China (Figure 24). The zinc market is ex-pected to tighten following the latest closure of several large mines (Century, Lisheen), announced mining production cuts (such as Glencore), and agreed smelter output reductions in China. Key uncertainties are demand growth in China, additions to supply from both greenfield and brownfield expansions, and possible reactivation of idled capacity. Stocks remain relatively high but could be quickly drawn down should the market swing into deficit.Nickel prices fell 11 percent due to weak global de-mand, destocking from the stainless steel sector (which consumes about two-thirds of the world’s re-
25
45
65
85
105
125
145
Jan-07 Jan-09 Jan-11 Jan-13 Jan-15
US$ indices, 2010=100
Base metals
Iron ore
0
1
2
3
4
5
Jan-95 Jan-98 Jan-01 Jan-04 Jan-07 Jan-10 Jan-13 Jan-16
Million metric tons
China
OECD
Other non-OECD

JANUARY 2016COMMODITY MARKETS OUTLOOK 29
fined nickel), and rising LME inventories. Despite some announced production cuts and the fact that prices are deep into the global cost curve, supply out-side China has proved resilient, mainly on the belief that prices will rebound from low levels and further cost reductions can be achieved. China’s nickel pig iron (NPI) production continues to contract, follow-ing Indonesia’s 2014 ore export ban, which was en-acted in order to encourage more domestic process-ing. Ore imports from Indonesia have been partly replaced by shipments from the Philippines. The nickel market is expected to move into a small deficit in 2016. The magnitude hinges on the trajectory of demand growth, China’s capital NPI output, and the pace of inventory withdrawal. Copper prices fell 7 percent amid weak demand in China, elevated stocks, and steady increases in new mine capacity. China’s copper demand growth has been slower in most key sectors, particularly construc-tion, and weak growth is expected in 2016. There have been a number of production curtailments over the past year due to both technical issues and market-related pressures, such as the closure of Glencore’s Af-rican mines for 18 months (restarts are expected in 2017). Further new mine supply is likely to come on-line in the near term. In an environment of weak de-mand, more significant closures may well be necessary to limit emerging market surpluses. Aluminum prices fell 6 percent, despite declining LME inventories, on slowing demand and continued strong growth in smelting capacity in China. Demand remains relatively robust compared with other metals, due to aluminum’s diversified uses in multiple sectors and the ongoing substitution away from other metals (such as copper, zinc, and steel). However, it is not immune from the general decline in global metals consumption. While some higher-cost capacity has been closed, and Alcoa announced that it would shut 0.5 million tons of capacity (less than 1 percent of
global demand) by the end of the first quarter of 2016, new low-cost capacity continues to ramp-up in China and is boosting excess supplies. With domestic demand weakening, Chinese exports of semi-manu-factured aluminum products are increasing, broadly offsetting cuts in aluminum production in the rest of the world. Despite prospects for relatively strong de-mand growth, more closures of high-cost production is required to bring the market into balance. Lead prices fell 2 percent due to weak seasonal de-mand, with mild temperatures denting the demand for replacement batteries. Tin prices slipped 1 per-cent, despite rising inventories and weak demand in China (particularly for use in solder alloys). Tin sup-plies continue to contract.Metals prices are projected to decline by 10 percent in 2016 due to slowing demand in emerging market economies (especially China), and increases in new production capacity. Iron ore prices are projected to decline most (down 25 percent), due to reduced im-ports from China’s steel producers and new capacity in Australia and Brazil, followed by nickel (down 16 percent) and copper (down 9 percent). Most other prices are also expected to fall, as markets remain well supplied with elevated stocks. Markets are expected to tighten in the medium term due to reduced invest-ment in production capacity, stronger global demand, and some specific factors, including the continued impact of Indonesia’s ore export ban and closure of large zinc mines due to exhaustion.
Downside risks to the forecast include slower demand in China and higher-than-expected production in-duced by cost reductions and currency depreciations in producer countries. Upside risks are centered on stronger global demand growth and supply shortfalls from project delays and disruptions, falling ore grades, environmental constraints, higher costs (such as for energy), and accelerated closure of high-cost capacity.
FIGURE 23 World metal consumption growth
Source: World Bureau of Metal Statistics.Note: Last observation is 2015.
FIGURE 24 Zinc price and LME stocks, daily
Source: Bloomberg. Note: Last observation is January 22, 2016.
-8
-4
0
4
8
12
1996 1998 2000 2002 2004 2006 2008 2010 2012 2014
OECDOther non-OECDChina
Million metric tons
0
200
400
600
800
1,000
1,200
1,400
0
1,000
2,000
3,000
4,000
5,000
Jan-07 Jan-09 Jan-11 Jan-13 Jan-15
US$/ton Thousand metric tons
Zinc price (LHS)
LME stocks (RHS)

commodity markets outlook JaNuary 2016 30
Precious metals
Precious metals prices fell 2 percent in the fourth quarter of 2015 on weakening investment demand (Figure 25). Platinum prices fell 8 percent, mainly on oversupply driven by rising production in South Af-rica. Gold and silver prices fell 2 and 1 percent, re-spectively, as U.S. dollar appreciation and the start of the U.S. Federal Reserve’s tightening cycle dampened investor sentiment. Gold prices have declined during 10 of the past 12 quarters, reaching $1,105/toz in the fourth quarter of 2015—a drop of one-third since its quarterly peak of $1,718/toz in the fourth quarter of 2012. Weak inves-tor demand and a strong dollar helped push prices lower. Anticipation of a U.S. interest rate increase (0.25 percent on December 16, and the first rise in nearly ten years) was a key factor exerting downward pressure on gold prices. Rising interest rates typically have negative implications for gold prices, as investors find yield-bearing assets more attractive. Despite vari-ous geopolitical and financial jitters, gold did not at-tract much in the way of safe-haven buying until the stock market sell-off in January this year.After a weak first half, physical demand for gold was up 8 percent in the third quarter of 2015, with the bulk of the increase accounted for by jewelry in China and India. Bar and coin demand was strong in China, Europe, and North America. Indian gold demand was relatively subdued in the fourth quarter due to a poor monsoon season and its effects on agriculture income, and high inventories. Central banks continue to be net buyers of gold, with the majority of purchases coming from China and Russia. Gold mine supply is trending lower as investment falls. Companies con-tinue to focus on aggressive cost reduction, helped by lower energy prices, improved efficiency, and depreci-ating producer currencies.
FIGURE 25 Precious metal prices, monthly
Source: World Bank.Note: Last observation is December 2015.
FIGURE 26 Global silver production
Source: World Bureau of Metal Statistics.Note: Last observation is October 2015.
Silver prices continued to fall, in line with investor sentiment for gold, and weak industrial demand. The gold/silver price ratio ended the year at 76 (compared with an average of 66 the past three decades). Reduced silver intensity in the electronic and photovoltaic sec-tors, combined with declining trends in photographic applications, contributed to declining consumption. Mine supply is down owing to reductions in Austra-lia, but production continues to expand elsewhere (Figure 26). Platinum prices continued to fall more steeply than its peers—down a sixth straight quarter—as South Afri-can mine production ramped back to full capacity fol-lowing the labor unrest in 2014. Lower prices are prompting cuts of high-cost production. Demand from the auto sector remains buoyant, but the out-look for diesel vehicles, which mainly use platinum output in catalytic converters, has been dented by the Volkswagen diesel emissions scandal.Precious metals prices are projected to decline 8 per-cent in 2016, mainly due to reduced investment de-mand. The price of silver is expected to fall the most, dropping by 11 percent, since silver is more vulnera-ble than gold to shifts in industrial production. Plati-num prices are expected fall 10 percent on surplus supply. Gold prices are projected to fall 7 percent, largely driven by expectations of a rising dollar and a further tightening of U.S. monetary policy. Downside risks to the forecasts include faster mone-tary tightening and greater dollar appreciation than expected, while upside risks include significantly weaker U.S. growth (and the ramifications for the dollar and monetary policy), intensification of geopo-litical concerns, financial stress in key economies, and stronger demand from consumers, central banks, and investors. For platinum, the Volkswagen scandal poses additional risks to the forecast. It remains unclear how the company, its consumers, and government regula-tors will respond.
600
900
1,200
1,500
1,800
2,100
5
15
25
35
45
Jan-07 Jan-09 Jan-11 Jan-13 Jan-15
US$/toz US$/toz
Platinum (RHS)
Silver (LHS)
Gold (RHS)
0
500
1,000
1,500
2,000
2,500
Jan-95 Jan-98 Jan-01 Jan-04 Jan-07 Jan-10 Jan-13 Jan-16
Africa Oceania EuropeUS Canada Latin America Asia
Thousand metric tons
APPENDIX AHistorical commodity prices
Price forecasts

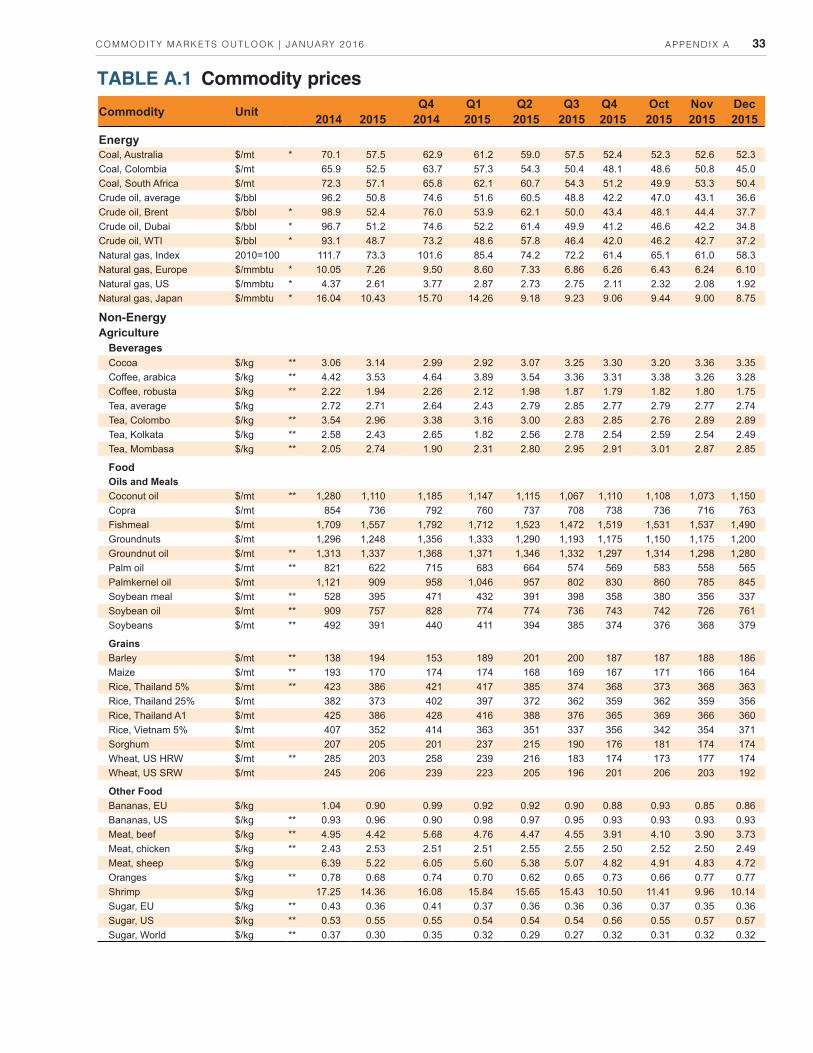
COMMODITY MARKETS OUTLOOK | JANUARY 2016 33APPENDIX A
TABLE A.1 Commodity prices
Commodity Unit Q4 Q1 Q2 Q3 Q4 Oct Nov Dec2014 2015 2014 2015 2015 2015 2015 2015 2015 2015
EnergyCoal, Australia $/mt * 70.1 57.5 62.9 61.2 59.0 57.5 52.4 52.3 52.6 52.3Coal, Colombia $/mt 65.9 52.5 63.7 57.3 54.3 50.4 48.1 48.6 50.8 45.0Coal, South Africa $/mt 72.3 57.1 65.8 62.1 60.7 54.3 51.2 49.9 53.3 50.4Crude oil, average $/bbl 96.2 50.8 74.6 51.6 60.5 48.8 42.2 47.0 43.1 36.6Crude oil, Brent $/bbl * 98.9 52.4 76.0 53.9 62.1 50.0 43.4 48.1 44.4 37.7Crude oil, Dubai $/bbl * 96.7 51.2 74.6 52.2 61.4 49.9 41.2 46.6 42.2 34.8Crude oil, WTI $/bbl * 93.1 48.7 73.2 48.6 57.8 46.4 42.0 46.2 42.7 37.2Natural gas, Index 2010=100 111.7 73.3 101.6 85.4 74.2 72.2 61.4 65.1 61.0 58.3Natural gas, Europe $/mmbtu * 10.05 7.26 9.50 8.60 7.33 6.86 6.26 6.43 6.24 6.10Natural gas, US $/mmbtu * 4.37 2.61 3.77 2.87 2.73 2.75 2.11 2.32 2.08 1.92Natural gas, Japan $/mmbtu * 16.04 10.43 15.70 14.26 9.18 9.23 9.06 9.44 9.00 8.75
Non-EnergyAgriculture
BeveragesCocoa $/kg ** 3.06 3.14 2.99 2.92 3.07 3.25 3.30 3.20 3.36 3.35Coffee, arabica $/kg ** 4.42 3.53 4.64 3.89 3.54 3.36 3.31 3.38 3.26 3.28Coffee, robusta $/kg ** 2.22 1.94 2.26 2.12 1.98 1.87 1.79 1.82 1.80 1.75Tea, average $/kg 2.72 2.71 2.64 2.43 2.79 2.85 2.77 2.79 2.77 2.74Tea, Colombo $/kg ** 3.54 2.96 3.38 3.16 3.00 2.83 2.85 2.76 2.89 2.89Tea, Kolkata $/kg ** 2.58 2.43 2.65 1.82 2.56 2.78 2.54 2.59 2.54 2.49Tea, Mombasa $/kg ** 2.05 2.74 1.90 2.31 2.80 2.95 2.91 3.01 2.87 2.85
FoodOils and MealsCoconut oil $/mt ** 1,280 1,110 1,185 1,147 1,115 1,067 1,110 1,108 1,073 1,150Copra $/mt 854 736 792 760 737 708 738 736 716 763Fishmeal $/mt 1,709 1,557 1,792 1,712 1,523 1,472 1,519 1,531 1,537 1,490Groundnuts $/mt 1,296 1,248 1,356 1,333 1,290 1,193 1,175 1,150 1,175 1,200Groundnut oil $/mt ** 1,313 1,337 1,368 1,371 1,346 1,332 1,297 1,314 1,298 1,280Palm oil $/mt ** 821 622 715 683 664 574 569 583 558 565Palmkernel oil $/mt 1,121 909 958 1,046 957 802 830 860 785 845Soybean meal $/mt ** 528 395 471 432 391 398 358 380 356 337Soybean oil $/mt ** 909 757 828 774 774 736 743 742 726 761Soybeans $/mt ** 492 391 440 411 394 385 374 376 368 379
GrainsBarley $/mt ** 138 194 153 189 201 200 187 187 188 186Maize $/mt ** 193 170 174 174 168 169 167 171 166 164Rice, Thailand 5% $/mt ** 423 386 421 417 385 374 368 373 368 363Rice, Thailand 25% $/mt 382 373 402 397 372 362 359 362 359 356Rice, Thailand A1 $/mt 425 386 428 416 388 376 365 369 366 360Rice, Vietnam 5% $/mt 407 352 414 363 351 337 356 342 354 371Sorghum $/mt 207 205 201 237 215 190 176 181 174 174Wheat, US HRW $/mt ** 285 203 258 239 216 183 174 173 177 174Wheat, US SRW $/mt 245 206 239 223 205 196 201 206 203 192
Other FoodBananas, EU $/kg 1.04 0.90 0.99 0.92 0.92 0.90 0.88 0.93 0.85 0.86Bananas, US $/kg ** 0.93 0.96 0.90 0.98 0.97 0.95 0.93 0.93 0.93 0.93Meat, beef $/kg ** 4.95 4.42 5.68 4.76 4.47 4.55 3.91 4.10 3.90 3.73Meat, chicken $/kg ** 2.43 2.53 2.51 2.51 2.55 2.55 2.50 2.52 2.50 2.49Meat, sheep $/kg 6.39 5.22 6.05 5.60 5.38 5.07 4.82 4.91 4.83 4.72Oranges $/kg ** 0.78 0.68 0.74 0.70 0.62 0.65 0.73 0.66 0.77 0.77Shrimp $/kg 17.25 14.36 16.08 15.84 15.65 15.43 10.50 11.41 9.96 10.14Sugar, EU $/kg ** 0.43 0.36 0.41 0.37 0.36 0.36 0.36 0.37 0.35 0.36Sugar, US $/kg ** 0.53 0.55 0.55 0.54 0.54 0.54 0.56 0.55 0.57 0.57Sugar, World $/kg ** 0.37 0.30 0.35 0.32 0.29 0.27 0.32 0.31 0.32 0.32
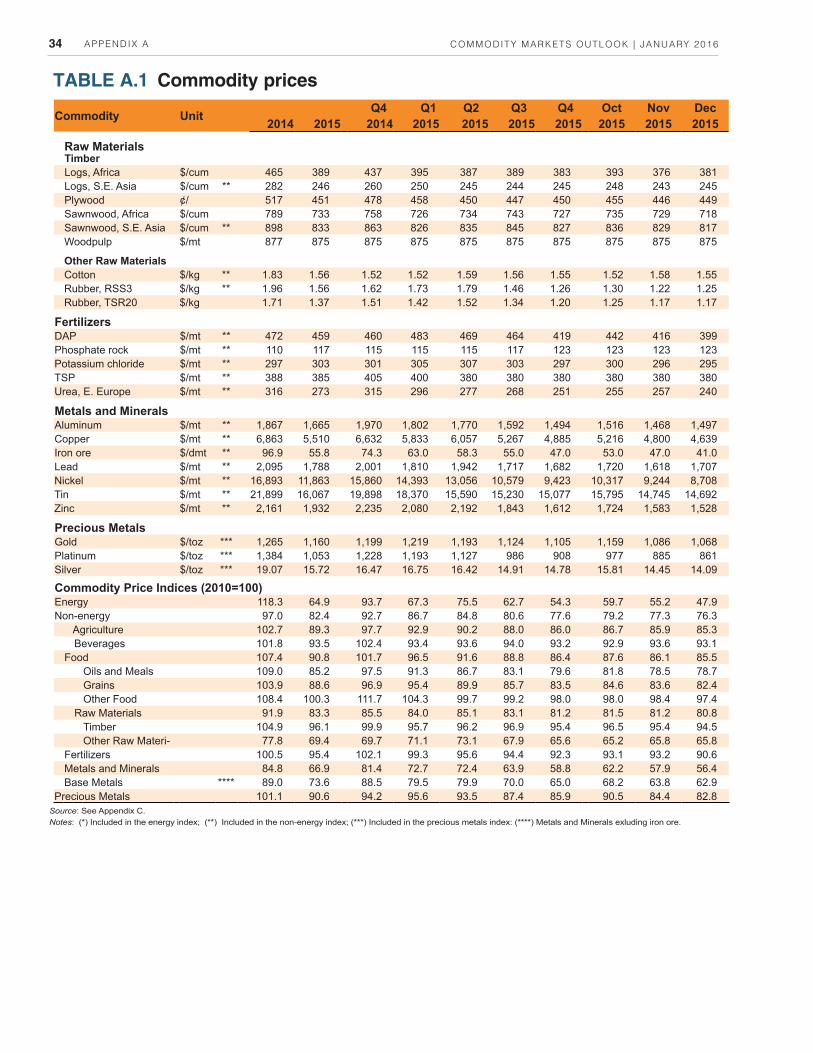
COMMODITY MARKETS OUTLOOK | JANUARY 2016 34 APPENDIX A
TABLE A.1 Commodity prices
Source: See Appendix C.Notes: (*) Included in the energy index; (**) Included in the non-energy index; (***) Included in the precious metals index: (****) Metals and Minerals exluding iron ore.
Commodity Unit Q4 Q1 Q2 Q3 Q4 Oct Nov Dec2014 2015 2014 2015 2015 2015 2015 2015 2015 2015
Raw MaterialsTimberLogs, Africa $/cum 465 389 437 395 387 389 383 393 376 381Logs, S.E. Asia $/cum ** 282 246 260 250 245 244 245 248 243 245Plywood ¢/ 517 451 478 458 450 447 450 455 446 449Sawnwood, Africa $/cum 789 733 758 726 734 743 727 735 729 718Sawnwood, S.E. Asia $/cum ** 898 833 863 826 835 845 827 836 829 817Woodpulp $/mt 877 875 875 875 875 875 875 875 875 875
Other Raw MaterialsCotton $/kg ** 1.83 1.56 1.52 1.52 1.59 1.56 1.55 1.52 1.58 1.55Rubber, RSS3 $/kg ** 1.96 1.56 1.62 1.73 1.79 1.46 1.26 1.30 1.22 1.25Rubber, TSR20 $/kg 1.71 1.37 1.51 1.42 1.52 1.34 1.20 1.25 1.17 1.17
FertilizersDAP $/mt ** 472 459 460 483 469 464 419 442 416 399Phosphate rock $/mt ** 110 117 115 115 115 117 123 123 123 123Potassium chloride $/mt ** 297 303 301 305 307 303 297 300 296 295TSP $/mt ** 388 385 405 400 380 380 380 380 380 380Urea, E. Europe $/mt ** 316 273 315 296 277 268 251 255 257 240
Metals and MineralsAluminum $/mt ** 1,867 1,665 1,970 1,802 1,770 1,592 1,494 1,516 1,468 1,497Copper $/mt ** 6,863 5,510 6,632 5,833 6,057 5,267 4,885 5,216 4,800 4,639Iron ore $/dmt ** 96.9 55.8 74.3 63.0 58.3 55.0 47.0 53.0 47.0 41.0Lead $/mt ** 2,095 1,788 2,001 1,810 1,942 1,717 1,682 1,720 1,618 1,707Nickel $/mt ** 16,893 11,863 15,860 14,393 13,056 10,579 9,423 10,317 9,244 8,708Tin $/mt ** 21,899 16,067 19,898 18,370 15,590 15,230 15,077 15,795 14,745 14,692Zinc $/mt ** 2,161 1,932 2,235 2,080 2,192 1,843 1,612 1,724 1,583 1,528
Precious MetalsGold $/toz *** 1,265 1,160 1,199 1,219 1,193 1,124 1,105 1,159 1,086 1,068Platinum $/toz *** 1,384 1,053 1,228 1,193 1,127 986 908 977 885 861Silver $/toz *** 19.07 15.72 16.47 16.75 16.42 14.91 14.78 15.81 14.45 14.09
Commodity Price Indices (2010=100)Energy 118.3 64.9 93.7 67.3 75.5 62.7 54.3 59.7 55.2 47.9Non-energy 97.0 82.4 92.7 86.7 84.8 80.6 77.6 79.2 77.3 76.3
Agriculture 102.7 89.3 97.7 92.9 90.2 88.0 86.0 86.7 85.9 85.3 Beverages 101.8 93.5 102.4 93.4 93.6 94.0 93.2 92.9 93.6 93.1Food 107.4 90.8 101.7 96.5 91.6 88.8 86.4 87.6 86.1 85.5
Oils and Meals 109.0 85.2 97.5 91.3 86.7 83.1 79.6 81.8 78.5 78.7Grains 103.9 88.6 96.9 95.4 89.9 85.7 83.5 84.6 83.6 82.4Other Food 108.4 100.3 111.7 104.3 99.7 99.2 98.0 98.0 98.4 97.4
Raw Materials 91.9 83.3 85.5 84.0 85.1 83.1 81.2 81.5 81.2 80.8Timber 104.9 96.1 99.9 95.7 96.2 96.9 95.4 96.5 95.4 94.5Other Raw Materi- 77.8 69.4 69.7 71.1 73.1 67.9 65.6 65.2 65.8 65.8
Fertilizers 100.5 95.4 102.1 99.3 95.6 94.4 92.3 93.1 93.2 90.6Metals and Minerals 84.8 66.9 81.4 72.7 72.4 63.9 58.8 62.2 57.9 56.4Base Metals **** 89.0 73.6 88.5 79.5 79.9 70.0 65.0 68.2 63.8 62.9
Precious Metals 101.1 90.6 94.2 95.6 93.5 87.4 85.9 90.5 84.4 82.8

COMMODITY MARKETS OUTLOOK | JANUARY 2016 35APPENDIX A
TABLE A.2 Price forecast in nominal U.S. dollars
Next update: April 2016.
Commodity Unit Forecasts2013 2014 2015 2016 2017 2018 2019 2020
EnergyCoal, Australia $/mt 84.6 70.1 57.5 50.0 51.9 53.9 55.9 58.1Crude oil, avg, spot $/bbl 104.1 96.2 50.8 37.0 48.0 51.4 54.9 58.8Natural gas, Europe $/mmbtu 11.79 10.05 7.26 6.00 6.19 6.40 6.60 6.82Natural gas, US $/mmbtu 3.73 4.37 2.61 2.50 3.00 3.50 3.68 3.88Natural gas, Japan $/mmbtu 15.96 16.04 10.43 8.50 8.75 9.00 9.26 9.53
Non-EnergyAgriculture
BeveragesCocoa $/kg 2.44 3.06 3.14 3.20 3.10 3.00 2.91 2.82Coffee, Arabica $/kg 3.08 4.42 3.53 3.40 3.41 3.42 3.43 3.44Coffee, robusta $/kg 2.08 2.22 1.94 1.80 1.81 1.82 1.83 1.84Tea, average $/kg 2.86 2.72 2.71 2.75 2.79 2.82 2.86 2.90
FoodOils and MealsCoconut oil $/mt 941 1,280 1,110 1,100 1,088 1,077 1,066 1,054Groundnut oil $/mt 1,773 1,313 1,337 1,300 1,339 1,380 1,422 1,465Palm oil $/mt 857 821 622 600 619 640 660 682Soybean meal $/mt 545 528 395 370 381 392 404 415Soybean oil $/mt 1,057 909 757 775 797 820 844 868Soybeans $/mt 538 492 391 400 412 424 437 449
GrainsBarley $/mt 202 138 194 195 195 196 197 197Maize $/mt 259 193 170 170 175 180 185 191Rice, Thailand, 5% $/mt 506 423 386 370 374 379 383 387Wheat, US, HRW $/mt 312 285 203 185 193 201 210 219
Other FoodBananas, EU $/kg 0.92 0.93 0.96 0.95 0.95 0.94 0.94 0.94Meat, beef $/kg 4.07 4.95 4.42 3.90 3.93 3.96 4.00 4.03Meat, chicken $/kg 2.29 2.43 2.53 2.50 2.46 2.43 2.40 2.36Oranges $/kg 0.97 0.78 0.68 0.75 0.77 0.79 0.81 0.83Shrimp $/kg 13.84 17.25 14.36 12.00 12.11 12.22 12.32 12.43Sugar, World $/kg 0.39 0.37 0.30 0.35 0.35 0.36 0.36 0.36
Raw MaterialsTimberLogs, Africa $/cum 464 465 389 398 409 419 430 441Logs, S.E. Asia $/cum 305 282 246 250 259 268 277 287Sawnwood, S.E. Asia $/cum 853 898 833 830 847 865 883 902Other Raw MaterialsCotton A $/kg 1.99 1.83 1.56 1.60 1.66 1.72 1.78 1.84Rubber, RSS3 $/kg 2.79 1.96 1.56 1.40 1.48 1.56 1.65 1.75Tobacco $/mt 4,589 4,991 4,941 5,000 4,942 4,884 4,827 4,771
FertilizersDAP $/mt 445 472 459 457 455 453 451 449Phosphate rock $/mt 148 110 117 120 119 118 117 115Potassium chloride $/mt 379 297 303 295 297 298 300 302TSP $/mt 382 388 385 380 378 375 373 371Urea, E. Europe $/mt 340 316 273 250 253 256 260 263
Metals and MineralsAluminum $/mt 1,847 1,867 1,665 1,550 1,612 1,675 1,742 1,811Copper $/mt 7,332 6,863 5,510 5,000 5,190 5,388 5,593 5,807Iron ore $/dmt 135.4 96.9 55.8 42.0 44.1 46.3 48.6 51.0Lead $/mt 2,140 2,095 1,788 1,775 1,818 1,862 1,907 1,953Nickel $/mt 15,032 16,893 11,863 10,000 10,801 11,665 12,599 13,608Tin $/mt 22,283 21,899 16,067 15,000 15,730 16,495 17,297 18,138Zinc $/mt 1,910 2,161 1,932 1,800 1,858 1,919 1,981 2,046
Precious MetalsGold $/toz 1,411 1,265 1,160 1,075 1,066 1,058 1,049 1,041Silver $/toz 23.85 19.07 15.72 14.00 14.21 14.42 14.64 14.86Platinum $/toz 1,487 1,384 1,053 950 999 1,051 1,106 1,164

COMMODITY MARKETS OUTLOOK | JANUARY 2016 36 APPENDIX A
TABLE A.3 Commodity price forecasts (2010=100)
Sources and Notes: See Appendix C.Next update: April 2016.
Commodity Unit Forecasts2013 2014 2015 2016 2017 2018 2019 2020
EnergyCoal, Australia $/mt 79.7 66.2 54.4 46.5 47.4 48.5 49.5 50.6Crude oil, avg, spot $/bbl 98.1 90.9 48.0 34.4 43.9 46.2 48.6 51.2Natural gas, Europe $/mmbtu 11.11 9.49 6.87 5.57 5.66 5.75 5.85 5.94Natural gas, US $/mmbtu 3.52 4.13 2.47 2.32 2.74 3.15 3.26 3.38Natural gas, Japan $/mmbtu 15.04 15.15 9.87 7.90 7.99 8.10 8.20 8.31
Non-EnergyAgriculture
BeveragesCocoa $/kg 2.30 2.89 2.97 2.97 2.83 2.70 2.57 2.45Coffee, Arabica $/kg 2.90 4.18 3.34 3.16 3.12 3.08 3.04 3.00Coffee, robusta $/kg 1.96 2.09 1.84 1.67 1.66 1.64 1.62 1.61Tea, average $/kg 2.70 2.57 2.56 2.55 2.55 2.54 2.53 2.53
Oils and MealsCoconut oil $/mt 887 1,209 1,050 1,022 995 969 943 919Groundnut oil $/mt 1,672 1,240 1,265 1,208 1,224 1,241 1,259 1,276Palm oil $/mt 808 776 589 557 566 575 585 594Soybean meal $/mt 514 499 374 344 348 353 357 362Soybean oil $/mt 996 859 716 720 729 738 747 756Soybeans $/mt 508 464 370 372 376 381 387 392
GrainsBarley $/mt 191 130 184 181 179 176 174 172Maize $/mt 245 182 161 158 160 162 164 166Rice, Thailand, 5% $/mt 477 399 365 344 342 340 339 337Wheat, US, HRW $/mt 294 269 192 172 176 181 186 191
Other FoodBananas, EU $/kg 0.87 0.88 0.91 0.88 0.87 0.85 0.83 0.82Meat, beef $/kg 3.84 4.67 4.19 3.62 3.59 3.57 3.54 3.51Meat, chicken $/kg 2.16 2.29 2.39 2.32 2.25 2.19 2.12 2.06Oranges $/kg 0.91 0.74 0.64 0.70 0.70 0.71 0.72 0.73Shrimp $/kg 13.05 16.29 13.59 11.15 11.07 10.99 10.91 10.84Sugar, World $/kg 0.37 0.35 0.28 0.33 0.32 0.32 0.32 0.32
TimberLogs, Africa $/cum 437 439 368 370 374 377 381 384Logs, S.E. Asia $/cum 288 266 233 232 236 241 245 250Sawnwood, S.E. Asia $/cum 804 848 789 771 774 778 782 786
Other Raw MaterialsCotton A $/kg 1.88 1.73 1.47 1.49 1.51 1.54 1.58 1.61Rubber, RSS3 $/kg 2.63 1.85 1.48 1.30 1.35 1.41 1.46 1.52Tobacco $/mt 4,327 4,714 4,677 4,645 4,517 4,393 4,274 4,158
FertilizersDAP $/mt 419 446 434 424 416 408 399 392Phosphate rock $/mt 140 104 111 111 109 106 103 101Potassium chloride $/mt 357 281 287 274 271 268 266 263TSP $/mt 360 367 364 353 345 338 330 323Urea, E. Europe $/mt 321 299 258 232 231 231 230 229
Metals and MineralsAluminum $/mt 1,741 1,764 1,576 1,440 1,473 1,507 1,542 1,578Copper $/mt 6,913 6,482 5,216 4,645 4,744 4,847 4,952 5,060Iron ore $/dmt 127.6 91.6 52.8 39.0 40.3 41.6 43.0 44.4Lead $/mt 2,018 1,979 1,692 1,649 1,661 1,675 1,688 1,702Nickel $/mt 14,173 15,955 11,228 9,291 9,871 10,493 11,155 11,859Tin $/mt 21,010 20,683 15,207 13,936 14,376 14,837 15,314 15,807Zinc $/mt 1,801 2,041 1,828 1,672 1,699 1,726 1,754 1,783
Precious MetalsGold $/toz 1,331 1,195 1,098 999 975 952 929 907Silver $/toz 22.49 18.01 14.88 13.01 12.99 12.97 12.96 12.95Platinum $/toz 1,402 1,307 997 883 913 946 979 1,014

COMMODITY MARKETS OUTLOOK | JANUARY 2016 37APPENDIX A
TABLE A.4 Commodity price index forecasts (2010=100)
Source: See Appendix C.
Notes: (*) Base metals plus iron ore; (**) Includes aluminum, copper, lead, nickel, tin and zinc; (***) MUV is the unit value index of manufacture exports. For other notes see Appendix C.
Next update: April 2016.
Commodity Forecasts2013 2014 2015 2016 2017 2018 2019 2020
Nominal US dollars (2010=100)Energy 127.4 118.3 64.9 48.9 61.5 66.0 70.3 74.9Non-energy 101.7 97.0 82.4 79.4 81.1 82.9 84.7 86.7
Agriculture 106.3 102.7 89.3 88.1 89.5 90.9 92.5 94.0Beverages 83.3 101.8 93.5 92.7 91.9 91.1 90.4 89.7Food 115.6 107.4 90.8 89.3 91.0 92.7 94.6 96.4
Oils and meals 115.9 109.0 85.2 83.4 85.7 88.2 90.7 93.4Grains 128.2 103.9 88.6 85.7 87.9 90.2 92.7 95.1Other food 103.9 108.4 100.3 100.3 100.6 101.0 101.3 101.7
Raw materials 95.4 91.9 83.3 82.8 84.6 86.4 88.4 90.4Timber 102.6 104.9 96.1 96.1 98.4 100.7 103.1 105.6Other Raw Materials 87.6 77.8 69.4 68.2 69.5 70.8 72.3 73.8
Fertilizers 113.7 100.5 95.4 91.7 92.0 92.3 92.5 92.8Metals and minerals * 90.8 84.8 66.9 60.1 62.6 65.2 68.0 70.8Base Metals ** 90.3 89.0 73.6 67.3 70.1 73.0 76.0 79.2
Precious Metals 115.1 101.1 90.6 83.4 83.1 82.9 82.7 82.4
Constant 2010 US dollars (2010=100), deflated by the MUV IndexEnergy 120.1 111.7 61.4 45.4 56.2 59.4 62.2 65.2Non-energy 95.9 91.6 78.0 73.7 74.1 74.5 75.0 75.5
Agriculture 100.2 97.0 84.5 81.8 81.8 81.8 81.9 81.9Beverages 78.5 96.1 88.5 86.1 84.0 82.0 80.0 78.2Food 109.0 101.4 86.0 82.9 83.2 83.4 83.7 84.0
Oils and meals 109.3 103.0 80.6 77.4 78.4 79.3 80.3 81.4Grains 120.9 98.1 83.9 79.6 80.4 81.2 82.0 82.9Other food 98.0 102.3 94.9 93.2 92.0 90.8 89.7 88.6
Raw materials 90.0 86.8 78.9 76.9 77.3 77.8 78.2 78.8Timber 96.7 99.0 90.9 89.3 89.9 90.6 91.3 92.0Other Raw Materials 82.6 73.5 65.7 63.4 63.5 63.7 64.0 64.3
Fertilizers 107.2 94.9 90.3 85.2 84.1 83.0 81.9 80.9Metals and minerals * 85.6 80.1 63.4 55.8 57.2 58.7 60.2 61.7Base Metals ** 85.2 84.1 69.7 62.6 64.1 65.7 67.3 69.0
Precious Metals 108.5 95.5 85.7 77.5 76.0 74.6 73.2 71.9
Inflation indices, 2010=100 MUV index *** 106.1 105.9 105.7 107.6 109.4 111.2 112.9 114.8
% change per annum -1.4 -0.2 -0.2 1.9 1.7 1.6 1.6 1.6US GDP deflator 105.4 106.9 108.5 110.7 113.0 115.3 117.6 120.0
% change per annum 1.5 1.3 1.6 2.0 2.0 2.0 2.0 2.0


APPENDIX BCommodity Balances
Energy
• Coal• Crude oil• Natural gas
Agriculture
• Cocoa• Coff ee• Soybeans• Palm oil & Soybean oil• Maize• Rice• Wheat• Sugar• Industrial roundwood
& Sawnwood• Wood-based panels &
Woodpulp• Cotton• Natural rubber
Metals
• Aluminum• Copper• Lead• Nickel• Tin• Zinc
Precious Metals
• Gold• Silver


COMMODITY MARKETS OUTLOOK | JANUARY 2016 41APPENDIX B 41
Coal
Source: BP Statistical Review.
Notes: n/a implies data not available. Production includes crude oil and natural gas liquids but excludes liquid fuels from other sources such as biomass and derivatives of coal and natural gas included in consumption.
Source: World Bank.Note: Last observation is December 2015.
Source: World Bank.Note: 2015-25 are forecasts.
0
50
100
150
200
Jan-04 Jan-06 Jan-08 Jan-10 Jan-12 Jan-14
Monthly Prices (US$/mt)
0
30
60
90
120
150
1970 1980 1990 2000 2010 2020
Constant 2010
Nominal
Annual Prices (US$/mt)
1981 1990 2000 2005 2010 2011 2012 2013 2014Production (million metric tons oil equivalent) China 311 540 707 1,241 1,665 1,853 1,872 1,894 1,845 United States 463 566 570 580 551 556 518 501 508 Indonesia 0 7 47 94 169 217 237 276 282 Australia 65 109 167 206 241 233 250 268 281 India 63 92 132 162 218 216 229 229 244 Russian Federation n/a 178 117 140 151 159 170 169 171 South Africa 75 100 127 138 144 143 147 145 148 Colombia 3 14 25 38 48 56 58 56 58 Kazakhstan n/a 68 38 44 54 56 59 58 55 Poland 98 94 71 69 55 57 59 58 55 Germany 149 125 61 57 46 47 48 45 44 Canada 23 40 39 35 35 35 36 37 37 Ukraine n/a 84 42 41 40 44 45 44 32 Vietnam 3 3 7 19 25 26 24 23 23 Turkey 7 12 12 11 18 18 17 15 18 Czech Republic 43 37 25 24 21 22 21 18 17 United Kingdom 76 55 19 12 11 11 10 8 7 Mexico 2 3 5 6 7 9 7 8 7 Greece 3 7 8 9 7 8 8 7 6 Bulgaria 5 5 4 4 5 6 6 5 5 Thailand 0 4 5 6 5 6 5 5 5 Romania 8 9 6 7 6 7 6 5 4 Brazil 3 2 3 2 2 2 3 3 3 Others n/a 111 71 72 79 83 79 86 80 World 1,855 2,265 2,310 3,018 3,604 3,869 3,913 3,961 3,933
Consumption (million metric tons oil equivalent) China 303 525 700 1,318 1,741 1,896 1,922 1,961 1,962 United States 401 483 569 574 525 495 438 455 453 India 63 95 144 184 260 270 302 324 360 Japan 64 76 99 121 124 118 124 129 127 South Africa 51 67 75 80 93 90 88 89 89 Russian Federation n/a 182 106 95 91 94 98 91 85 Korea, Rep. 15 24 43 55 76 84 81 82 85 Germany 144 132 85 81 77 78 80 82 77 Indonesia 0 3 13 24 39 47 53 58 61 Poland 91 80 58 56 56 56 54 56 53 Australia 27 37 48 54 51 50 47 45 44 Taiwan, China 4 11 29 38 40 41 41 41 41 Turkey 7 16 23 22 31 34 36 32 36 Kazakhstan n/a 40 23 27 32 34 37 36 35 Ukraine n/a 75 39 38 38 41 43 41 33 Others n/a 386 316 354 337 348 352 347 341 World 1,834 2,233 2,369 3,122 3,611 3,777 3,799 3,867 3,882

COMMODITY MARKETS OUTLOOK | JANUARY 2016 42 APPENDIX B
Crude oil
Source: BP Statistical Review.
Notes: n/a implies data not available. Production includes crude oil and natural gas liquids but excludes liquid fuels from other sources such as biomass and derivatives of coal and natural gas included in consumption.
Source: World Bank.Note: Last observation is December 2015.
Source: World Bank.Note: 2015-25 are forecasts.
1970 1980 1990 2000 2010 2011 2012 2013 2014Production (thousand barrels per day)
United States 11,297 10,170 8,914 7,732 7,556 7,861 8,904 10,069 11,644 Saudi Arabia 3,851 10,270 7,105 9,470 10,075 11,144 11,635 11,393 11,505 Russian Federation n/a n/a 10,342 6,583 10,366 10,516 10,640 10,777 10,838 Canada 1,473 1,764 1,968 2,703 3,332 3,515 3,740 3,977 4,292 China 616 2,122 2,778 3,257 4,077 4,074 4,155 4,216 4,246 United Arab Emirates 762 1,745 2,283 2,660 2,895 3,325 3,406 3,648 3,712 Iran, Islamic Rep. 3,848 1,479 3,270 3,852 4,352 4,373 3,742 3,525 3,614 Iraq 1,549 2,658 2,149 2,613 2,490 2,801 3,116 3,141 3,285 Kuwait 3,036 1,757 964 2,244 2,562 2,915 3,172 3,135 3,123 Mexico 487 2,129 2,941 3,456 2,959 2,940 2,911 2,875 2,784 Venezuela, RB 3,754 2,228 2,244 3,097 2,838 2,734 2,704 2,687 2,719 Nigeria 1,084 2,059 1,870 2,159 2,509 2,450 2,395 2,302 2,361 Brazil 167 188 650 1,271 2,137 2,193 2,149 2,114 2,346 Qatar 363 476 434 853 1,655 1,850 1,968 1,998 1,982 Norway 0 528 1,716 3,346 2,136 2,040 1,917 1,838 1,895 Angola 103 150 475 746 1,863 1,726 1,784 1,799 1,712 Kazakhstan n/a n/a 571 740 1,672 1,684 1,662 1,720 1,701 Algeria 1,052 1,139 1,347 1,549 1,689 1,642 1,537 1,485 1,525 Colombia 226 131 446 687 786 915 944 1,004 990 Oman 332 285 695 961 865 885 918 942 943 India 140 193 715 726 882 916 906 906 895 Indonesia 854 1,577 1,539 1,456 1,003 952 918 882 852 United Kingdom 4 1,676 1,933 2,714 1,361 1,116 949 867 850 Others n/a n/a 8,037 10,051 11,128 9,413 9,977 9,280 8,857 World 48,056 62,959 65,385 74,925 83,190 83,980 86,150 86,579 88,673
Consumption (thousand barrels per day)United States 14,710 17,062 16,988 19,701 19,180 18,882 18,490 18,961 19,035 China 556 1,690 2,320 4,766 9,266 9,791 10,231 10,664 11,056 Japan 3,876 4,905 5,240 5,542 4,442 4,439 4,688 4,521 4,298 India 391 644 1,213 2,261 3,319 3,488 3,685 3,727 3,846 Brazil 523 1,163 1,478 2,056 2,701 2,813 2,860 3,048 3,229 Russian Federation n/a n/a 5,042 2,542 2,895 3,096 3,137 3,179 3,196 Saudi Arabia 408 607 1,158 1,578 2,793 2,838 2,991 3,000 3,185 Korea, Rep. 162 476 1,042 2,263 2,370 2,394 2,458 2,455 2,456 Germany 2,774 3,020 2,689 2,746 2,445 2,369 2,356 2,408 2,371 Canada 1,472 1,898 1,747 2,043 2,316 2,404 2,372 2,383 2,371 Iran, Islamic Rep. 222 591 1,070 1,457 1,874 1,910 1,928 2,038 2,024 Mexico 412 1,048 1,580 1,965 2,014 2,043 2,063 2,020 1,941 Indonesia 138 396 653 1,137 1,458 1,567 1,599 1,615 1,641 France 1,867 2,221 1,895 1,994 1,763 1,730 1,676 1,664 1,615 United Kingdom 2,030 1,647 1,754 1,704 1,588 1,532 1,520 1,494 1,501 Others n/a n/a 20,868 23,112 27,442 27,679 27,789 28,065 28,320 World 45,348 61,233 66,737 76,868 87,867 88,974 89,846 91,243 92,086
0
30
60
90
120
150
Jan-04 Jan-06 Jan-08 Jan-10 Jan-12 Jan-14
Monthly Prices (US$/bbl)
0
30
60
90
120
150
1970 1980 1990 2000 2010 2020
Constant 2010
Nominal
Annual Prices (US$/bbl)

COMMODITY MARKETS OUTLOOK | JANUARY 2016 43APPENDIX B
Natural gas
Source: BP Statistical Review.Note: n/a implies data not available.
Source: World Bank.Note: Last observation is December 2015.
Source: World Bank.Note: 2015-25 are forecasts.
1970 1980 1990 2000 2010 2011 2012 2013 2014Production (billion cubic metres)
United States 595 549 504 543 604 649 681 689 728 Russian Federation n/a n/a 590 529 589 607 592 605 579 Qatar 1 5 6 24 126 161 170 176 177 Iran, Islamic Rep. 4 5 26 60 152 160 166 164 173 Canada 57 75 109 182 160 160 156 156 162 China 3 15 16 28 99 109 114 125 134 Norway 0 25 25 50 107 101 115 109 109 Saudi Arabia 2 10 34 50 88 92 99 100 108 Algeria 3 14 49 84 80 83 82 82 83 Indonesia 1 19 44 70 86 81 77 72 73 Turkmenistan n/a n/a 79 43 42 60 62 62 69 Malaysia 0 2 17 47 63 62 62 67 66 Mexico 11 26 27 38 58 58 57 58 58 United Arab Emirates 1 8 20 38 51 52 54 55 58 Uzbekistan n/a n/a 37 51 54 57 57 57 57 Netherlands 27 76 61 58 71 64 64 69 56 Australia 2 11 21 31 46 47 52 53 55 Egypt, Arab Rep. 0 2 8 21 61 61 61 56 49 Thailand 0 0 7 20 36 37 41 42 42 Trinidad & Tobago 2 3 5 16 45 43 43 43 42 Pakistan 3 7 12 22 42 42 44 43 42 Nigeria 0 2 4 12 37 41 43 36 39 United Kingdom 10 35 45 108 57 45 39 36 37 Others n/a n/a 236 293 448 443 450 454 464 World 992 1,435 1,983 2,416 3,203 3,316 3,380 3,409 3,461
Consumption (billion cubic metres)United States 599 563 543 661 682 693 723 740 759 Russian Federation n/a n/a 408 360 414 425 416 413 409 China 3 15 16 25 110 135 151 171 185 Iran, Islamic Rep. 3 5 24 63 153 162 162 159 170 Japan 3 24 48 72 95 105 114 114 112 Saudi Arabia 2 10 34 50 88 92 99 100 108 Canada 36 52 67 93 95 101 100 104 104 Mexico 10 23 28 41 72 77 80 85 86 Germany 15 57 60 79 83 75 78 82 71 United Arab Emirates 1 5 17 31 61 63 66 67 69 United Kingdom 11 45 52 97 94 78 74 73 67 Italy 14 25 43 65 76 71 69 64 57 Thailand 0 0 7 22 45 47 51 52 53 India 1 1 12 26 63 64 59 51 51 Uzbekistan n/a n/a 36 46 41 48 47 47 49 Others n/a n/a 565 686 1,021 1,030 1,057 1,058 1,042 World 980 1,436 1,958 2,418 3,194 3,265 3,346 3,381 3,393
0
5
10
15
20
Jan-04 Jan-06 Jan-08 Jan-10 Jan-12 Jan-14
Monthly Prices (US$/mmbtu)
Japan
Europe
US
0
5
10
15
20
1980 1990 2000 2010 2020
Japan
US
Annual Constant Prices (US$/mmbtu)
Europe

COMMODITY MARKETS OUTLOOK | JANUARY 2016 44 APPENDIX B
Cocoa
Source: Quarterly Bulletin of Cocoa Statistics.Notes: n/a implies data not available. 1970/71 data are average of 1968-1972.
Source: World Bank.Note: Last observation is December 2015.
Source: World Bank.Note: 2015-25 are forecasts.
0
2
4
6
8
1970 1980 1990 2000 2010 2020
Constant 2010
Nominal
Annual Prices (US$/kg)
1970/71 1980/81 1990/91 2000/01 2010/11 2011/12 2012/13 2013/14 2014/15Production (thousand metric tons)
Côte d’Ivoire 179.6 417.2 804.4 1,212.4 1,511.3 1,485.9 1,449.0 1,746.2 1,750.0 Ghana 406.0 258.0 293.4 395.0 1,024.6 879.3 835.5 896.9 695.7 Indonesia 1.7 12.4 150.0 385.0 440.0 440.0 410.0 375.0 350.0 Ecuador 71.6 86.7 111.1 88.9 160.5 198.0 191.5 234.0 250.0 Cameroon 112.0 117.1 115.0 133.0 228.5 206.5 225.0 211.0 230.0 Brazil 182.4 353.0 368.1 162.8 199.8 220.0 185.3 228.2 230.0 Nigeria 304.8 155.9 160.0 180.0 240.0 245.0 238.0 248.0 210.0 Peru 2.0 7.0 11.0 16.9 54.4 60.6 69.8 76.3 78.0 Dominican Republic 34.6 34.5 42.0 44.9 54.3 72.2 68.0 70.0 70.0 Colombia 21.0 38.3 52.0 37.1 35.2 42.6 48.4 48.8 51.0 Others 212.3 213.9 399.8 195.5 360.6 245.2 224.7 235.7 243.1 World 1,528.0 1,694.0 2,506.8 2,851.5 4,309.0 4,095.4 3,945.2 4,370.1 4,157.7
Grindings (thousand metric tons)Côte d’Ivoire 34.7 60.0 118.1 285.0 360.9 430.7 471.1 519.4 560.0 Netherlands 116.4 139.6 267.7 451.9 540.0 500.0 545.0 528.5 515.5 United States 278.7 185.6 267.9 444.7 401.3 386.9 429.2 446.0 406.0 Germany 150.7 180.0 294.2 226.6 438.5 407.0 402.0 412.0 404.0 Indonesia 1.2 10.0 32.0 83.0 190.0 270.0 257.0 322.0 312.0 Brazil 66.6 191.3 260.0 194.5 239.1 242.5 241.2 239.6 220.0 Others 782.7 799.5 1,084.8 1,355.4 1,768.2 1,734.7 1,794.3 1,836.1 1,713.6 World 1,431.0 1,566.0 2,324.7 3,041.1 3,938.1 3,971.8 4,139.7 4,303.5 4,131.1
Exports (thousand metric tons)Côte d’Ivoire 138.0 405.6 688.1 903.4 1,079.3 1,000.0 1,045.2 1,191.8 n/a Ghana 347.6 181.8 245.2 306.8 694.4 684.4 600.6 709.2 n/a Ecuador 46.5 19.0 55.9 57.2 135.7 166.1 165.4 196.8 n/a Nigeria 215.5 75.9 142.0 149.4 219.0 199.8 182.9 190.1 n/a Cameroon 74.6 96.0 96.3 101.6 204.1 172.7 186.4 160.0 n/a Indonesia 0.6 6.3 113.4 326.5 275.2 183.8 173.6 99.0 n/a Others 296.2 315.3 396.2 141.9 388.3 310.4 288.7 371.7 n/a World 1,118.9 1,099.8 1,737.1 1,986.7 2,995.9 2,717.1 2,642.9 2,918.5 n/a
Imports (thousand metric tons)Netherlands 116.2 167.0 267.0 549.0 805.5 677.1 671.9 632.5 n/a United States 269.0 246.3 319.7 354.7 472.0 419.8 427.9 475.2 n/a Germany 154.7 187.4 299.9 228.2 433.8 376.6 272.6 318.2 n/a Malaysia 0.9 n/a 0.9 109.6 320.4 356.3 305.4 315.4 n/a Belgium 18.4 28.0 49.7 101.3 193.8 192.0 224.6 258.0 n/a France 41.7 58.8 74.1 157.2 149.2 133.2 114.0 141.3 n/a Spain 33.8 36.9 45.4 48.8 87.9 90.9 99.0 107.5 n/a Italy 41.2 31.7 56.2 72.2 85.7 88.2 87.7 89.5 n/a Turkey 1.2 2.0 5.9 39.1 71.1 84.6 78.3 87.8 n/a Singapore 2.6 21.8 126.6 67.0 87.8 85.5 79.9 80.7 n/a Others 459.7 418.2 516.0 682.3 649.4 682.5 635.0 659.3 n/a World 1,139.4 1,198.1 1,761.4 2,409.5 3,356.6 3,186.8 2,996.2 3,165.5 n/a
1
2
3
4
Jan-04 Jan-06 Jan-08 Jan-10 Jan-12 Jan-14
Monthly Prices (US$/kg)

COMMODITY MARKETS OUTLOOK | JANUARY 2016 45APPENDIX B
Coffee
Source: U.S. Department of Agriculture (January 2016 update).Note: n/a implies data not available.
Source: World Bank.Note: Last observation is December 2015.
Source: World Bank.Note: 2015-25 are forecasts.
0
2
4
6
8
Jan-04 Jan-06 Jan-08 Jan-10 Jan-12 Jan-14
Monthly Prices (US$/kg)
Arabica
Robusta
0
3
6
9
12
1970 1980 1990 2000 2010 2020
Arabica
Robusta
Annual Constant Prices (US$/kg)
1970/71 1980/81 1990/91 2000/01 2010/11 2012/13 2013/14 2014/15 2015/16Production (thousand 60kg bags)
Brazil 11,000 21,500 31,000 34,100 54,500 57,600 57,200 54,300 49,400 Vietnam 56 77 1,200 15,333 19,415 26,500 29,833 27,400 29,300 Colombia 8,000 13,500 14,500 10,500 8,525 9,927 12,075 13,300 13,400 Indonesia 2,330 5,365 7,480 6,495 9,325 10,500 9,500 8,800 10,605 Ethiopia 2,589 3,264 3,500 2,768 6,125 6,325 6,345 6,475 6,500 Honduras 545 1,265 1,685 2,821 3,975 4,725 4,400 5,000 5,900 India 1,914 1,977 2,970 5,020 5,035 5,303 5,075 5,440 5,300 Uganda 2,667 2,133 2,700 3,097 3,212 3,600 3,850 3,550 3,800 Mexico 3,200 3,862 4,550 4,800 4,000 4,650 3,950 3,300 3,400 Guatemala 1,965 2,702 3,282 4,564 3,960 4,010 3,515 3,365 3,315 Peru 1,114 1,170 1,170 2,824 4,100 4,300 4,250 2,900 3,000 Nicaragua 641 971 460 1,610 1,740 1,925 2,000 2,100 2,200 Malaysia 66 88 75 700 1,100 1,400 1,500 1,750 1,800 Costa Rica 1,295 2,140 2,565 2,502 1,575 1,675 1,450 1,400 1,350 Côte d’Ivoire 3,996 6,090 3,300 5,100 1,600 1,750 1,675 1,400 1,325 Tanzania, United Rep. 909 1,060 763 809 1,050 1,180 800 800 900 Thailand 19 201 785 1,692 850 850 850 900 900 Papua New Guinea 401 880 964 1,041 865 825 855 810 850 Kenya 999 1,568 1,455 864 710 660 850 780 840 Others 15,496 16,361 15,777 10,577 8,755 7,053 5,698 5,765 6,037 World 59,202 86,174 100,181 117,217 140,417 154,758 155,671 149,535 150,122
Consumption (thousand 60kg bags)European Union n/a n/a n/a n/a 41,350 43,275 41,475 43,630 43,850 United States n/a n/a n/a n/a 22,383 23,027 23,811 23,577 24,067 Brazil 8,890 7,975 9,000 13,100 19,420 20,110 20,210 20,330 20,330 Japan n/a n/a n/a n/a 7,015 7,505 7,750 7,825 8,125 Canada n/a n/a n/a n/a 4,245 4,230 4,605 4,505 4,800 Philippines 496 432 810 900 2,825 4,405 3,630 4,265 4,600 Russian Federation n/a n/a n/a n/a 4,355 4,130 4,230 4,050 4,075 Indonesia 888 1,228 1,295 1,335 1,690 2,670 2,790 3,050 3,090 Ethiopia 1,170 1,600 1,900 1,667 2,860 3,055 3,120 2,985 2,972 Vietnam 31 35 100 417 1,337 1,825 2,008 2,217 2,600 Korea, Rep. n/a n/a n/a n/a 1,910 1,825 2,160 2,305 2,350 Algeria n/a n/a n/a n/a 1,815 1,945 2,300 2,155 2,280 Mexico 1,512 1,500 1,400 978 2,470 2,030 2,331 1,776 2,173 China n/a n/a n/a n/a 965 1,560 1,705 1,940 1,925 Australia n/a n/a n/a n/a 1,445 1,660 1,615 1,775 1,800 Thailand 93 118 160 500 683 1,130 1,260 1,700 1,550 Switzerland n/a n/a n/a n/a 1,570 1,500 1,410 1,445 1,450 Colombia 1,349 1,825 1,615 1,530 1,120 1,200 1,300 1,515 1,350 India 665 887 1,224 959 1,231 1,100 1,200 1,200 1,250 Others n/a n/a n/a n/a 13,698 14,089 13,843 13,276 13,630 World n/a n/a n/a n/a 134,387 142,271 142,753 145,521 148,267

COMMODITY MARKETS OUTLOOK | JANUARY 2016 46 APPENDIX B
Soybeans
Source: U.S. Department of Agriculture (January 2016 update).Notes: The trade year is January-December of the later year of the split. For example, 1970/71 refers to calendar year 1971.
Source: World Bank.Note: Last observation is December 2015.
Source: World Bank.Note: 2015-25 are forecasts.
200
400
600
800
Jan-04 Jan-06 Jan-08 Jan-10 Jan-12 Jan-14
Monthly Prices (US$/mt)
0
200
400
600
800
1000
1970 1980 1990 2000 2010 2020
Constant 2010
Nominal
Annual Prices (US$/mt)
1970/71 1980/81 1990/91 2000/01 2010/11 2012/13 2013/14 2014/15 2015/16Production (million metric tons)
United States 30.7 48.9 52.4 75.1 90.7 82.8 91.4 106.9 107.0 Brazil 0.0 15.2 15.8 39.5 75.3 82.0 86.7 96.2 100.0 Argentina 0.0 3.5 11.5 27.8 49.0 49.3 53.5 61.4 57.0 China 8.7 7.9 11.0 15.4 15.1 13.1 12.0 12.2 12.0 Paraguay 0.1 0.6 1.3 3.5 7.1 8.2 8.2 8.1 8.8 India 0.0 0.4 2.6 5.3 10.1 12.2 9.5 8.7 8.0 Canada 0.3 0.7 1.3 2.7 4.4 5.1 5.4 6.0 6.2 Ukraine n/a n/a 0.1 0.1 1.7 2.4 2.8 3.9 3.8 Uruguay 0.0 0.0 0.0 0.0 1.9 3.7 3.3 3.1 3.1 Bolivia 0.0 0.0 0.4 1.2 2.3 2.6 2.4 2.7 3.1 Others 2.4 3.5 7.9 5.4 6.8 7.5 7.8 9.7 10.0 World 42.1 80.9 104.3 175.8 264.3 268.8 282.9 318.8 319.0
Crushings (million metric tons)China 1.5 1.5 3.9 18.9 55.0 65.0 68.9 74.5 80.7 United States 20.7 27.8 32.3 44.6 44.9 46.0 47.2 51.0 51.4 Argentina 0.0 0.9 7.0 17.3 37.6 33.6 36.2 40.2 42.9 Brazil 0.0 13.8 14.2 22.7 36.3 35.2 36.9 39.9 40.0 European Union 7.3 14.1 13.0 16.8 12.4 13.2 13.4 14.2 14.8 India 0.0 0.4 2.4 4.5 9.3 9.9 8.3 7.0 6.5 Mexico 0.3 1.5 1.9 4.5 3.6 3.7 4.0 4.2 4.4 Paraguay 0.1 0.0 0.3 0.9 1.6 3.0 3.4 3.7 4.1 Russian Federation n/a n/a 0.4 0.4 2.2 2.4 3.5 3.9 4.0 Bolivia 0.0 0.0 0.3 0.9 1.8 2.2 2.3 2.5 2.7 Others 12.7 23.8 24.1 15.0 16.5 16.1 17.4 21.7 24.0 World 42.5 83.9 99.7 146.4 221.2 230.1 241.3 262.7 275.3
Exports (million metric tons)Brazil 0.0 1.8 2.5 15.5 30.0 41.9 46.8 50.6 57.0 United States 11.8 19.7 15.2 27.1 41.0 36.1 44.6 50.2 46.0 Argentina 0.0 2.7 4.5 7.3 9.2 7.7 7.8 10.6 11.8 Paraguay 0.0 0.6 1.0 2.5 5.2 5.5 4.8 4.4 4.6 Canada 0.0 0.1 0.2 0.7 2.9 3.5 3.5 3.9 4.2 Others 0.5 0.4 2.1 0.7 3.4 6.0 5.3 6.4 6.2 World 12.3 25.3 25.4 53.8 91.7 100.8 112.8 126.0 129.8
Imports (million metric tons)China 0.0 0.5 0.0 13.2 52.3 59.9 70.4 78.4 80.5 European Union 7.4 13.6 13.2 17.7 12.5 12.5 13.3 13.4 13.7 Mexico 0.1 1.4 1.4 4.4 3.5 3.4 3.8 3.8 4.1 Japan 3.2 4.2 4.4 4.8 2.9 2.8 2.9 3.0 2.9 Taiwan, China 0.5 1.1 2.2 2.3 2.5 2.3 2.3 2.5 2.6 Turkey 0.0 0.0 0.0 0.4 1.4 1.2 1.6 2.2 2.4 Thailand 0.0 0.0 0.0 1.3 2.1 1.9 1.8 2.4 2.4 Others 8.8 19.0 17.6 9.0 11.6 11.9 15.6 16.5 18.7 World 20.0 39.8 38.8 53.1 88.8 95.9 111.8 122.2 127.2

COMMODITY MARKETS OUTLOOK | JANUARY 2016 47APPENDIX B
Palm oil and Soybean oil
Source: U.S. Department of Agriculture (January 2016 update).Notes: The trade year is January-December of the later year of the split. For example, 1970/71 refers to calendar year 1971.
Source: World Bank.Note: Last observation is December 2015.
Source: World Bank.Note: 2015-25 are forecasts.
200
600
1,000
1,400
1,800
Jan-04 Jan-06 Jan-08 Jan-10 Jan-12 Jan-14
Monthly Prices (US$/mt)
Soybean oil
Palm oil
200
600
1000
1400
1800
2200
1970 1980 1990 2000 2010 2020
Soybean oil
Palm oil
Annual Constant Prices (US$/mt)
1970/71 1980/81 1990/91 2000/01 2010/11 2012/13 2013/14 2014/15 2015/16Palm oil: production (thousand metric tons)
Indonesia 248 752 2,650 8,300 23,600 28,500 30,500 33,000 33,000 Malaysia 589 2,692 6,031 11,937 18,211 19,321 20,161 19,879 20,500 Thailand 0 19 200 580 1,832 2,135 2,000 1,800 2,200 Colombia 36 80 252 520 753 974 1,041 1,110 1,130 Nigeria 432 520 600 730 971 970 970 970 970 Papua New Guinea 0 45 145 336 488 520 500 520 580 Ecuador 5 44 150 222 380 540 565 485 510 Ghana 21 19 24 108 426 471 493 495 500 Honduras 0 18 64 148 320 425 460 470 490 Guatemala 0 0 6 124 231 365 434 448 470 Others 591 707 912 1,234 2,027 2,201 2,259 2,255 2,325 World 1,922 4,896 11,034 24,239 49,239 56,422 59,383 61,432 62,675
Palm oil: consumption (thousand metric tons)India 1 431 259 4,100 7,090 8,250 8,412 9,009 9,925 Indonesia 29 561 1,330 3,263 6,414 7,852 9,020 7,620 8,620 European Union 595 607 1,509 2,790 5,110 6,560 6,790 6,700 6,850 China 53 16 1,194 2,028 5,797 6,389 5,669 5,726 5,750 Malaysia 8 420 914 1,571 2,204 2,451 2,868 2,950 3,280 Pakistan 1 231 800 1,245 2,077 2,285 2,490 2,820 3,185 Others 1,707 3,104 6,658 8,618 19,125 21,363 22,688 23,730 24,790 World 2,394 5,370 12,664 23,615 47,817 55,150 57,937 58,555 62,400
Soybean oil: production (thousand metric tons)China 181 183 599 3,240 9,840 11,626 12,335 13,347 14,458 United States 3,749 5,112 6,082 8,355 8,568 8,990 9,131 9,706 9,945 Argentina 0 158 1,179 3,190 7,181 6,364 6,785 7,687 8,150 Brazil n/a 2,601 2,669 4,333 6,970 6,760 7,070 7,660 7,680 European Union 1,260 2,478 2,317 3,033 2,362 2,501 2,553 2,698 2,810 India 2 69 425 805 1,646 1,752 1,478 1,245 1,150 Paraguay 10 6 56 174 300 564 640 697 783 Mexico 52 255 330 795 648 653 720 745 780 Others 2,205 4,191 4,425 2,888 3,835 3,890 4,310 5,206 5,702 World 7,459 15,053 18,082 26,813 41,350 43,100 45,022 48,991 51,458
Soybean oil: consumption (thousand metric tons)China 179 256 1,055 3,542 11,409 12,545 13,657 14,126 15,228 United States 2,854 4,134 5,506 7,401 7,506 8,522 8,576 8,616 8,890 Brazil n/a 1,490 2,075 2,932 5,205 5,534 5,705 6,275 6,365 India 79 708 445 2,080 2,610 2,950 3,300 4,050 4,700 Argentina 0 56 101 247 2,520 2,275 2,729 2,601 2,440 European Union 1,170 1,926 1,879 2,186 2,530 1,908 1,970 2,000 2,000 Mexico 52 305 404 863 840 860 890 1,001 1,020 Iran, Islamic Rep. 95 343 431 873 620 600 630 720 800 Others 2,699 5,120 5,417 6,335 7,351 7,430 7,719 8,588 9,126 World 7,128 14,338 17,313 26,459 40,591 42,624 45,176 47,977 50,569

COMMODITY MARKETS OUTLOOK | JANUARY 2016 48 APPENDIX B
Maize
Source: U.S. Department of Agriculture (January 2016 update).
Notes: n/a implies data not available. The trade year is January-December of the later year of the split. For example, 1970/71 refers to calendar year 1971.
Source: World Bank.Note: Last observation is December 2015.
Source: World Bank.Note: 2015-25 are forecasts.
0
100
200
300
400
Jan-04 Jan-06 Jan-08 Jan-10 Jan-12 Jan-14
Monthly Prices (US$/mt)
0
100
200
300
400
1970 1980 1990 2000 2010 2020
Constant 2010
Nominal
Annual Prices (US$/mt)
1970/71 1980/81 1990/91 2000/01 2010/11 2012/13 2013/14 2014/15 2015/16Production (million metric tons)
United States 105.5 168.6 201.5 251.9 315.6 273.2 351.3 361.1 345.5 China 33.0 62.6 96.8 106.0 177.2 205.6 218.5 215.6 224.6 Brazil 14.1 22.6 24.3 41.5 57.4 81.5 80.0 85.0 81.5 European Union 29.8 42.5 36.6 51.9 58.3 58.9 64.6 75.8 57.8 Argentina 9.9 12.9 7.7 15.4 25.2 27.0 26.0 26.5 25.6 Ukraine n/a n/a 4.7 3.8 11.9 20.9 30.9 28.5 23.5 Mexico 8.9 10.4 14.1 17.9 21.1 21.6 22.9 25.5 23.5 India 7.5 7.0 9.0 12.0 21.7 22.3 24.3 23.7 21.0 Canada 2.6 5.8 7.1 7.0 12.0 13.1 14.2 11.5 13.6 Russian Federation n/a n/a 2.5 1.5 3.1 8.2 11.6 11.3 13.0 Indonesia 2.8 4.0 5.0 5.9 6.8 8.5 9.1 8.8 9.6 South Africa 8.6 14.9 8.6 8.0 10.9 12.4 14.9 10.8 8.0 Philippines 2.0 3.1 5.1 4.5 7.3 7.3 7.5 7.7 7.8 Others 73.1 96.9 95.6 64.4 107.0 109.2 115.6 116.8 113.0 World 297.9 451.3 518.6 591.8 835.5 869.5 991.4 1,008.5 967.9
Stocks (million metric tons)China 8.9 42.8 82.8 102.4 49.4 67.6 81.3 100.5 113.5 United States 16.8 35.4 38.6 48.2 28.6 20.9 31.3 44.0 45.8 Brazil 2.0 1.3 0.8 2.7 6.3 9.2 14.0 10.1 7.7 European Union 2.3 4.8 3.7 3.2 5.2 5.1 6.8 9.3 6.1 Iran, Islamic Rep. n/a 0.1 0.0 0.9 2.8 3.2 4.5 5.8 5.0 Others 8.4 22.9 19.1 17.8 30.7 26.7 36.7 37.6 30.9 World 38.4 107.4 145.1 175.3 123.1 132.6 174.6 207.2 208.9
Exports (million metric tons)United States 12.9 60.7 43.9 49.3 46.5 18.5 48.8 47.4 43.2 Brazil 0.9 0.0 0.0 6.3 8.4 24.9 21.0 32.5 25.5 Argentina 6.4 9.1 4.0 9.7 16.3 18.7 17.1 17.5 16.0 Ukraine n/a n/a 0.4 0.4 5.0 12.7 20.0 19.7 15.5 Russian Federation n/a n/a 0.4 0.0 0.0 1.9 4.2 3.2 3.8 Paraguay 0.0 0.0 0.0 0.6 1.6 2.8 2.4 2.9 2.3 Serbia n/a n/a n/a n/a 2.0 0.6 1.7 3.0 1.7 Others 11.9 10.5 9.8 10.5 11.4 14.9 15.9 11.7 8.7 World 32.2 80.3 58.4 76.7 91.3 95.1 131.1 137.8 116.7
Imports (million metric tons)European Union 18.9 26.6 5.7 3.7 7.4 11.4 16.0 8.8 16.0 Japan 5.2 14.0 16.3 16.3 15.6 14.4 15.1 14.7 14.7 Mexico 0.1 3.8 1.9 6.0 8.3 5.7 11.0 11.3 11.0 Korea, Rep. 0.3 2.4 5.6 8.7 8.1 8.2 10.4 10.2 10.0 Egypt, Arab Rep. 0.1 1.0 1.9 5.3 5.8 5.1 8.7 7.8 8.0 Iran, Islamic Rep. 0.0 0.4 0.8 1.3 3.5 3.7 5.5 6.2 4.5 Colombia 0.0 0.1 0.0 1.9 3.5 3.3 4.4 4.5 4.5 Others 22.6 52.6 31.9 31.7 40.4 48.1 52.9 59.5 55.9 World 47.3 100.9 64.3 74.9 92.6 99.8 123.9 122.9 124.6

COMMODITY MARKETS OUTLOOK | JANUARY 2016 49APPENDIX B
Rice
Source: U.S. Department of Agriculture (January 2016 update).
Notes: The trade year is January-December of the later year of the split. For example, 1970/71 refers to calendar year 1971.
Source: World Bank.Note: Last observation is December 2015.
Source: World Bank.Note: 2015-25 are forecasts.
0
200
400
600
800
1000
Jan-04 Jan-06 Jan-08 Jan-10 Jan-12 Jan-14
Monthly Prices (US$/mt)
0
300
600
900
1200
1500
1970 1980 1990 2000 2010 2020
Constant 2010
Nominal
Annual Prices (US$/mt)
1970/71 1980/81 1990/91 2000/01 2010/11 2012/13 2013/14 2014/15 2015/16Production (million metric tons)
China 77.0 97.9 132.5 131.5 137.0 143.0 142.5 144.6 145.8 India 42.2 53.6 74.3 85.0 96.0 105.2 106.6 104.8 100.0 Indonesia 13.1 22.3 29.0 33.0 35.5 36.6 36.3 35.6 36.3 Bangladesh 11.1 13.9 17.9 25.1 31.7 33.8 34.4 34.5 34.6 Vietnam 6.4 7.7 12.4 20.5 26.4 27.5 28.2 28.2 28.2 Thailand 9.0 11.5 11.3 17.1 20.3 20.2 20.5 18.8 16.4 Burma 5.1 6.7 7.9 10.8 11.1 11.7 12.0 12.6 12.2 Philippines 3.4 5.0 6.4 8.1 10.5 11.4 11.9 11.9 11.5 Brazil 3.7 5.9 6.8 6.9 9.3 8.0 8.3 8.5 8.0 Japan 11.5 8.9 9.6 8.6 7.8 7.9 7.9 7.8 7.9 Pakistan 2.2 3.1 3.3 4.8 4.8 5.5 6.8 7.0 6.9 United States 2.8 4.8 5.1 5.9 7.6 6.3 6.1 7.1 6.1 Cambodia 2.5 1.1 1.6 2.5 4.2 4.7 4.7 4.7 4.4 Others 22.9 27.6 33.3 39.4 48.3 50.5 52.4 52.2 51.9 World 213.0 269.9 351.4 399.3 450.4 472.5 478.5 478.3 470.1
Stocks (million metric tons)China 11.0 28.0 94.0 93.0 42.6 46.8 46.8 47.7 47.7 India 6.0 6.5 14.5 25.1 23.5 25.4 22.8 17.7 11.2 Thailand 1.2 2.0 0.9 2.2 5.6 12.8 11.7 10.1 5.0 Indonesia 0.6 3.0 2.1 4.6 7.1 6.5 5.5 3.9 3.9 Japan 6.1 4.0 1.0 2.6 2.9 2.9 3.1 3.2 3.4 Philippines 0.6 1.5 1.8 2.8 2.5 1.5 1.7 2.2 2.5 Others 3.4 7.6 12.4 16.4 15.9 14.6 15.9 19.2 16.2 World 28.8 52.6 126.7 146.7 100.0 110.5 107.5 103.9 89.7
Exports (million metric tons)Thailand 1.6 3.0 4.0 7.5 10.6 6.7 11.0 9.2 10.3 India 0.0 0.9 0.7 1.7 2.8 10.9 10.1 11.9 8.5 Vietnam 0.0 0.0 1.0 3.5 7.0 6.7 6.3 6.5 7.3 Pakistan 0.2 1.2 1.3 2.4 3.4 3.6 3.2 4.0 4.6 United States 1.5 3.1 2.3 2.6 3.5 3.4 3.0 3.2 3.2 Others 5.2 4.2 2.8 6.2 7.7 8.1 8.1 8.2 8.2 World 8.5 12.4 12.1 24.0 35.1 39.3 41.7 43.0 42.2
Imports (million metric tons)China 0.0 0.2 0.1 0.3 0.5 3.1 4.0 4.3 4.7 Nigeria 0.0 0.4 0.2 1.3 2.4 2.8 2.8 3.5 2.5 Philippines 0.0 0.0 0.4 1.4 1.3 1.4 1.2 1.8 2.0 Indonesia 0.5 0.5 0.2 1.5 3.1 0.7 1.2 1.1 2.0 Iran, Islamic Rep. 0.1 0.6 0.6 0.8 2.0 2.1 1.6 1.4 1.6 Saudi Arabia 0.2 0.4 0.5 1.0 1.1 1.3 1.4 1.5 1.6 European Union 0.9 0.5 0.7 1.2 1.4 1.4 1.5 1.7 1.5 Iraq 0.1 0.4 0.3 1.0 1.2 1.4 1.0 1.1 1.2 Others 6.8 8.8 8.3 13.7 20.0 22.4 23.6 24.0 22.8 World 8.6 11.8 11.3 22.1 33.0 36.6 38.4 40.4 39.9

COMMODITY MARKETS OUTLOOK | JANUARY 2016 50 APPENDIX B
Wheat
Source: U.S. Department of Agriculture (January 2016 update).
Notes: n/a implies data not available. The trade year is January-December of the later year of the split. For example, 1970/71 refers to calendar year 1971.
Source: World Bank.Note: Last observation is December 2015.
Source: World Bank.Note: 2015-25 are forecasts.
100
200
300
400
500
Jan-04 Jan-06 Jan-08 Jan-10 Jan-12 Jan-14
Monthly Prices (US$/mt)
0
100
200
300
400
500
1970 1980 1990 2000 2010 2020
Constant 2010
Nominal
Annual Prices (US$/mt)
1970/71 1980/81 1990/91 2000/01 2010/11 2012/13 2013/14 2014/15 2015/16Production (million metric tons)
European Union 62.5 93.3 125.0 132.7 136.7 133.9 144.6 156.5 158.0 China 29.2 55.2 98.2 99.6 115.2 121.0 121.9 126.2 130.2 India 20.1 31.8 49.9 76.4 80.8 94.9 93.5 95.9 88.9 Russian Federation n/a n/a 49.6 34.5 41.5 37.7 52.1 59.1 61.0 United States 36.8 64.8 74.3 60.6 58.9 61.3 58.1 55.1 55.8 Canada 9.0 19.3 32.1 26.5 23.3 27.2 37.5 29.4 27.6 Ukraine n/a n/a 30.4 10.2 16.8 15.8 22.3 24.8 27.0 Australia 7.9 10.9 15.1 22.1 27.4 22.9 25.3 23.7 26.0 Pakistan 7.3 10.9 14.4 21.1 23.3 23.5 24.2 26.0 25.5 Turkey 8.0 13.0 16.0 18.0 17.0 16.0 18.8 15.3 19.5 Kazakhstan n/a n/a 16.2 9.1 9.6 9.8 13.9 13.0 14.0 Iran, Islamic Rep. 3.8 5.9 8.0 8.1 13.5 13.8 14.5 13.0 14.0 Argentina 4.9 7.8 11.0 16.3 17.2 9.3 10.5 12.5 10.5 Egypt, Arab Rep. 1.5 1.8 4.3 6.4 7.2 8.5 8.3 8.3 8.1 Others 178.0 214.5 169.4 41.7 60.9 62.7 69.9 67.2 69.3 World 369.1 529.2 713.8 583.3 649.3 658.3 715.4 725.9 735.4
Stocks (million metric tons)China 7.2 31.7 49.9 91.9 59.1 54.0 65.3 74.1 87.3 United States 22.4 26.9 23.6 23.8 23.5 19.5 16.1 20.5 25.6 European Union 8.6 13.0 22.5 17.9 11.9 10.7 9.9 13.5 19.3 India 5.0 4.0 5.8 21.5 15.4 24.2 17.8 17.2 11.9 Iran, Islamic Rep. 0.7 1.2 3.2 2.9 2.9 5.1 7.2 7.8 7.3 Russian Federation n/a n/a 16.4 1.5 13.7 5.0 5.2 6.3 7.1 Others 45.2 48.8 72.2 47.0 72.1 58.6 72.5 73.4 73.5 World 89.1 125.6 193.7 206.5 198.7 177.0 194.0 212.8 232.0
Exports (million metric tons)European Union 6.7 17.5 23.8 15.7 23.1 22.8 32.0 35.4 32.5 Russian Federation n/a n/a 1.2 0.7 4.0 11.3 18.6 22.8 23.5 United States 20.2 41.2 29.1 28.9 35.1 27.5 32.0 23.2 21.8 Canada 11.8 16.3 21.7 17.3 16.6 19.0 23.3 24.1 20.5 Australia 9.1 9.6 11.8 15.9 18.6 18.6 18.6 16.6 18.0 Ukraine n/a n/a 2.0 0.1 4.3 7.2 9.8 11.3 15.5 Others 15.3 23.1 38.0 22.6 31.0 31.0 31.7 31.0 29.8 World 63.2 107.6 127.7 101.3 132.7 137.4 165.9 164.4 161.6
Imports (million metric tons)Egypt, Arab Rep. 2.8 5.4 5.7 6.1 10.6 8.3 10.2 11.1 11.5 Indonesia 0.5 1.2 2.0 4.1 6.6 7.1 7.4 7.5 8.1 Algeria 0.6 2.3 4.4 5.6 6.5 6.5 7.5 7.3 7.7 Brazil 1.7 3.9 4.4 7.2 6.7 7.4 7.1 5.4 6.3 European Union 19.6 10.4 3.7 3.5 4.6 5.3 4.0 6.0 6.0 Japan 4.8 5.8 5.6 5.9 5.9 6.6 6.1 5.9 5.8 Others 45.3 70.8 76.9 67.0 91.1 104.2 116.2 115.8 114.3 World 75.4 99.9 102.7 99.3 132.0 145.4 158.4 158.8 159.7

COMMODITY MARKETS OUTLOOK | JANUARY 2016 51APPENDIX B
Sugar
Source: U.S. Department of Agriculture (January 2016 update).
Notes: The trade year is January-December of the later year of the split. For example, 1970/71 refers to calendar year 1971.
Source: World Bank.Note: Last observation is December 2015.
Source: World Bank.Note: 2015-25 are forecasts.
0.0
0.2
0.4
0.6
0.8
Jan-04 Jan-06 Jan-08 Jan-10 Jan-12 Jan-14
Monthly Prices (US$/kg)
0.0
0.5
1.0
1.5
2.0
1970 1980 1990 2000 2010 2020
Constant 2010
Nominal
Annual Prices (US$/kg)
1970/71 1980/81 1990/91 2000/01 2010/11 2012/13 2013/14 2014/15 2015/16Production (million metric tons)
Brazil 5.1 8.5 7.9 17.1 38.4 38.6 37.8 36.0 35.0 India 4.5 6.5 13.7 20.5 26.6 27.3 26.6 30.2 28.5 European Union 15.4 19.0 23.2 22.1 15.9 16.7 16.0 16.8 16.1 Thailand 0.5 1.7 4.0 5.1 9.7 10.0 11.3 10.8 10.8 China 2.1 3.2 6.8 6.8 11.2 14.0 14.3 11.0 10.6 United States 5.6 5.6 6.3 8.0 7.1 8.1 7.7 7.8 8.0 Mexico 2.5 2.5 3.9 5.2 5.5 7.4 6.4 6.3 6.4 Pakistan 0.0 0.9 2.1 2.6 3.9 5.0 5.6 5.2 5.4 Australia 2.7 3.3 3.6 4.2 3.7 4.3 4.4 4.7 5.0 Russian Federation n/a n/a 2.6 1.6 3.0 5.0 4.4 4.4 4.7 Guatemala 0.2 0.5 1.0 1.6 2.0 2.8 2.9 2.9 3.0 Turkey 0.6 0.9 1.9 2.8 2.3 2.1 2.3 2.1 2.3 Others 46.5 54.8 60.6 55.3 33.0 36.3 35.9 36.9 36.3 World 85.7 107.6 137.6 152.9 162.2 177.6 175.6 175.1 172.1
Stocks (million metric tons)India 1.8 1.1 3.6 12.0 6.3 9.4 8.2 9.9 8.9 China 0.3 0.7 1.4 1.0 1.6 6.8 8.8 7.3 5.8 Thailand 0.0 0.2 0.2 0.6 3.0 3.6 5.3 5.5 4.9 United States 2.9 1.4 1.4 2.0 1.3 2.0 1.6 1.6 1.7 Pakistan 0.0 0.1 0.3 0.4 1.5 0.9 1.3 1.2 1.6 Mexico 0.7 0.7 2.4 1.5 0.8 1.5 0.9 0.9 1.0 Others 14.4 13.4 13.2 22.4 15.1 18.3 17.7 17.1 15.6 World 20.2 17.6 22.4 39.9 29.5 42.5 43.8 43.6 39.6
Exports (million metric tons)Brazil 1.2 2.3 1.3 7.7 25.8 27.7 26.2 24.0 23.8 Thailand 0.2 1.0 2.7 3.4 6.6 6.7 7.2 8.0 8.8 Australia 1.8 2.6 2.8 3.1 2.8 3.1 3.2 3.6 3.7 India 0.3 0.1 0.2 1.4 3.9 1.3 2.8 2.4 2.5 Guatemala 0.1 0.2 0.7 1.2 1.5 1.9 2.1 2.2 2.4 European Union 2.7 6.5 8.1 7.3 1.1 1.7 1.6 1.6 1.5 Others 17.7 22.2 26.1 21.6 12.2 13.2 14.6 12.4 12.1 World 24.0 34.9 42.0 45.6 53.9 55.5 57.6 54.1 54.7
Imports (million metric tons)China 0.4 1.1 1.1 1.1 2.1 3.8 4.3 5.1 5.5 Indonesia 0.1 0.6 0.2 1.6 3.1 3.6 3.6 3.1 3.2 United States 4.8 4.4 2.6 1.4 3.4 2.9 3.4 3.2 3.1 European Union 5.4 3.8 4.1 3.3 3.8 3.8 3.3 2.6 2.8 United Arab Emirates 0.0 0.1 0.1 1.1 2.0 2.6 2.1 2.4 2.5 Malaysia 0.0 0.5 0.9 1.3 1.8 2.0 1.9 2.1 2.1 Bangladesh 0.0 0.0 0.0 0.8 1.5 1.5 2.1 2.0 2.1 Korea, Rep. 0.0 0.8 1.2 1.6 1.7 1.8 1.9 1.9 1.9 Others 12.0 20.8 25.9 31.4 29.7 30.0 28.7 28.2 29.0 World 22.7 32.0 36.2 43.6 49.1 52.0 51.2 50.4 52.2

COMMODITY MARKETS OUTLOOK | JANUARY 2016 52 APPENDIX B
Industrial roundwood and Sawnwood
Source: Food and Agriculture Organization of the United Nations.
Notes: n/a implies data not available. Industrial roundwood, reported in cubic meters solid volume underbark (i.e. exclusing bark), is an aggregate comprising sawlogs and veneer logs; pulpwood, round and split; and other industrial roundwood except wood fuel. Sawnwood, reported in cubic meters solid volume, includes wood that has been produced from both domestic and imported roundwood, either by sawing lengthways or by a profile-chipping process and that exceeds 6mm in thickness.
Source: World Bank.Note: Last observation is December 2015.
Source: World Bank.Note: 2015-25 are forecasts.
0
200
400
600
800
1000
1200
1970 1980 1990 2000 2010 2020
Sawnwood, constant 2010
Sawnwood, nominal
Annual Constant Prices (US$/mt)
1970 1980 1990 2000 2010 2011 2012 2013 2014Industrial roundwood: production (million cubic meters)
United States 312.7 327.1 427.2 420.6 336.1 354.7 347.1 354.9 356.8 Russian Federation n/a n/a n/a 145.6 161.6 175.6 177.5 180.4 188.3 China 42.2 79.2 91.2 96.0 161.8 160.9 159.6 168.7 168.7 Canada 117.5 150.8 156.0 198.9 138.8 146.7 146.7 147.8 149.9 Brazil 23.9 61.7 74.3 103.0 128.4 140.0 146.8 144.5 144.5 Sweden 56.7 44.8 49.1 57.4 66.3 66.0 63.6 63.7 64.2 Indonesia 12.7 30.9 38.4 48.8 54.1 60.7 62.6 62.6 62.6 India 12.7 19.7 35.1 41.2 48.8 49.5 49.5 49.5 49.5 Others 698.2 731.8 838.1 572.9 606.2 614.4 615.1 627.9 643.5 World 1,276.4 1,446.0 1,709.2 1,684.4 1,702.1 1,768.6 1,768.5 1,799.9 1,828.1
Industrial roundwood: imports (million cubic meters)China 2.0 8.3 7.2 15.7 35.4 43.3 38.7 45.9 53.6 Germany 5.2 3.8 2.0 3.5 7.7 7.0 6.6 8.4 8.3 Sweden 0.6 3.1 2.0 11.7 6.3 6.7 6.9 7.5 8.1 India 0.0 0.0 1.3 2.2 5.3 6.3 6.5 6.5 7.4 Austria 2.0 3.7 4.4 8.5 8.0 7.4 7.3 8.2 7.3 Finland 2.3 3.8 5.2 9.9 6.3 5.7 5.5 6.7 6.3 Belgium n/a n/a n/a 4.0 4.2 4.3 4.3 4.5 4.5 Japan 39.4 37.6 27.6 15.9 4.8 4.6 4.5 4.6 4.4 Others 31.7 35.2 32.8 43.8 32.0 35.4 32.7 34.7 36.7 World 83.1 95.4 82.6 115.3 109.9 120.9 112.9 127.1 136.6
Sawnwood: production (million cubic meters)United States 63.7 65.3 86.1 91.1 60.0 63.2 67.5 71.1 74.8 China 14.8 21.2 23.6 6.7 37.2 44.6 55.7 63.0 68.4 Canada 19.8 32.8 39.7 50.5 38.7 38.9 40.6 42.8 43.4 Russian Federation n/a n/a n/a 20.0 28.9 31.2 32.2 33.5 33.9 Germany 11.6 13.0 14.7 16.3 22.1 22.6 21.1 21.5 21.8 Sweden 12.3 11.3 12.0 16.2 16.8 16.5 16.3 16.1 17.5 Brazil 8.0 14.9 13.7 21.3 17.5 16.2 15.2 15.4 15.4 Finland 7.4 10.3 7.5 13.4 9.5 9.8 9.4 10.4 10.9 Others 251.6 252.1 265.6 149.4 146.6 147.4 148.9 149.0 152.7 World 389.1 420.9 463.0 384.8 377.1 390.4 406.9 422.9 438.8
Sawnwood: imports (million cubic meters)China 0.1 0.3 1.3 6.1 16.2 23.1 22.0 25.5 27.3 United States 10.6 17.0 22.5 34.4 16.6 16.4 17.4 20.5 22.2 Japan 3.0 5.6 9.0 10.0 6.4 6.8 6.6 7.5 6.8 United Kingdom 9.0 6.6 10.7 7.9 5.7 4.9 5.2 5.5 6.4 Egypt, Arab Rep. 0.4 1.6 1.6 2.0 4.8 4.7 4.5 4.4 4.7 Italy 4.0 5.8 6.0 8.4 6.1 6.0 4.9 4.7 4.6 Germany 6.0 6.9 6.1 6.3 4.4 4.6 4.4 4.5 4.5 Netherlands 3.1 3.2 3.5 3.7 2.8 2.7 2.6 2.5 2.5 Others 16.5 24.6 23.8 36.9 45.1 47.5 46.1 47.5 48.4 World 52.6 71.5 84.5 115.6 108.0 116.8 113.5 122.5 127.4
500
600
700
800
900
1,000
Jan-04 Jan-06 Jan-08 Jan-10 Jan-12 Jan-14
Monthly Prices (US$/mt)
Sawnwood

COMMODITY MARKETS OUTLOOK | JANUARY 2016 53APPENDIX B
Wood-based panels and Woldpulp
Source: Food and Agriculture Organization of the United Nations.
Notes: n/a implies data not available. Wood-based panels, reported in cubic meters solid volume, is an aggregate comprising veneer sheets, plywood, particle board and fiberboard. Woodpulp, reported in metric tons air-dry weight (i.e. with 10% moisture content), is an aggregate comprising mechanical woodpulp; semi-chemical woodpulp; chemical woodpulp; and dissolving woodpulp.
Source: World Bank.Note: Last observation is December 2015.
Source: World Bank.Note: 2015-25 are forecasts.
300
600
900
1200
1979 1989 1999 2009
Woodpulp, constant 2010
Woodpulp, nominal
Annual Constant Prices (US$/mt)
1970 1980 1990 2000 2010 2011 2012 2013 2014Wood-based panels: production (million cubic meters)
China 0.9 2.3 3.0 19.3 109.2 134.0 149.3 177.0 189.2 United States 23.0 26.4 37.0 45.7 32.6 32.0 31.5 33.5 34.0 Russian Federation n/a n/a n/a 4.8 10.1 12.1 12.8 12.7 13.1 Canada 3.3 4.8 6.4 15.0 9.9 10.5 11.1 11.7 12.4 Germany 5.8 8.3 9.6 14.1 12.6 12.1 12.1 12.2 12.2 Brazil 0.8 2.5 2.9 5.8 9.5 9.4 10.6 11.2 11.3 Turkey 0.2 0.4 0.8 2.4 6.6 7.4 8.1 8.8 9.6 Poland 1.0 2.0 1.4 4.6 8.2 8.4 8.5 9.0 9.4 Others 34.7 54.6 67.9 74.7 88.7 89.5 89.3 90.8 93.2 World 69.8 101.3 129.0 186.3 287.5 315.5 333.3 366.9 384.5
Wood-based panels: imports (million cubic meters)United States 2.5 2.1 4.2 13.9 8.1 8.2 9.2 9.2 10.0 Germany 1.0 2.3 3.3 4.1 4.6 5.1 5.3 5.1 5.1 Japan 0.6 0.3 3.8 6.2 4.2 5.0 4.8 5.0 4.9 Canada 0.2 0.2 0.5 1.5 3.0 2.9 2.9 2.8 3.7 China 0.1 0.3 3.2 6.6 3.0 3.0 2.9 3.2 3.6 United Kingdom 2.0 2.4 3.3 3.3 2.7 2.8 2.6 3.0 3.3 Italy 0.1 0.8 0.9 1.7 3.0 2.4 2.2 2.4 2.8 Russian Federation n/a n/a n/a 0.4 1.1 1.4 2.1 3.0 2.7 Others 3.5 7.1 11.1 22.1 38.2 40.2 40.2 42.0 41.7 World 10.0 15.7 30.3 59.9 67.9 71.1 72.2 75.7 77.7
Woodpulp: production (million metric tons)United States 37.3 46.2 57.2 57.8 50.9 51.1 50.2 49.1 47.8 Canada 16.6 19.9 23.0 26.7 18.9 18.3 17.8 18.1 17.7 Brazil 0.8 3.4 4.3 7.3 14.5 14.3 14.3 15.5 16.8 Sweden 8.1 8.7 10.2 11.5 11.9 11.9 12.0 11.7 11.5 Finland 6.2 7.2 8.9 12.0 10.5 10.4 10.2 10.5 10.5 China 1.2 1.3 2.1 3.7 7.5 8.9 8.8 9.6 10.4 Japan 8.8 9.8 11.3 11.4 9.5 9.1 8.7 8.8 9.1 Russian Federation n/a n/a n/a 5.8 7.4 7.9 7.7 7.2 7.5 Others 22.5 29.1 37.8 34.9 39.5 41.8 41.9 41.1 40.7 World 101.6 125.7 154.8 171.3 170.6 173.6 171.7 171.5 171.9
Woodpulp: imports (million metric tons)China 0.1 0.4 0.9 4.0 12.1 15.2 17.2 17.6 18.7 United States 3.2 3.7 4.4 6.6 5.6 5.5 5.2 5.5 5.8 Germany 1.8 2.6 3.7 4.1 5.1 5.0 4.8 5.0 4.8 Italy 1.4 1.8 2.1 3.2 3.4 3.5 3.3 3.5 3.4 Netherlands 0.6 0.6 0.6 0.9 1.2 1.6 1.6 2.5 2.5 Korea, Rep. 0.2 0.5 1.1 2.1 2.5 2.5 2.4 2.4 2.4 France 1.3 1.8 1.9 2.4 1.9 1.9 2.0 2.1 2.0 Japan 0.9 2.2 2.9 3.1 1.8 1.9 1.8 1.7 1.8 Others 7.0 7.0 7.6 11.4 14.3 14.6 15.7 16.6 17.0 World 16.6 20.6 25.2 37.8 48.1 51.6 54.0 56.9 58.3
400
600
800
1,000
Jan-04 Jan-06 Jan-08 Jan-10 Jan-12 Jan-14
Monthly Prices (US$/mt)
Woodpulp

COMMODITY MARKETS OUTLOOK | JANUARY 2016 54 APPENDIX B
Cotton
Source: World Bank.Note: Last observation is December 2015.
Source: World Bank.Note: 2015-25 are forecasts.
0
1
2
3
4
5
6
Jan-04 Jan-06 Jan-08 Jan-10 Jan-12 Jan-14
Monthly Prices (US$/kg)
0
1
2
3
4
5
6
1970 1980 1990 2000 2010 2020
Constant 2010
Nominal
Annual Prices (US$/kg)
1970/71 1980/81 1990/91 2000/01 2010/11 2012/13 2013/14 2014/15 2015/16Production (thousand metric tons)
India 909 1,322 1,989 2,380 5,865 6,095 6,371 6,262 6,381 China 1,995 2,707 4,508 4,505 6,400 7,300 6,700 6,003 5,403 United States 2,219 2,422 3,376 3,742 3,942 3,770 2,802 3,077 3,046 Pakistan 543 714 1,638 1,816 1,948 2,204 2,076 2,069 2,050 Brazil 594 623 717 939 1,960 1,310 1,644 1,652 1,479 Uzbekistan n/a 1,671 1,593 975 910 1,000 920 1,005 921 Turkey 400 500 655 880 594 858 843 722 812 Australia 19 99 433 804 898 1,002 933 937 560 Burkina Faso 8 23 77 116 141 260 247 254 272 Turkmenistan n/a n/a 437 187 380 335 329 327 263 Mexico 312 353 175 72 157 231 193 206 255 Greece 110 115 213 421 180 248 280 308 247 Others n/a n/a 3,141 2,688 2,034 2,265 2,363 2,341 2,215 World 11,740 13,831 18,951 19,524 25,408 26,878 25,699 25,163 23,904
Stocks (thousand metric tons)China 412 476 1,589 3,755 2,087 9,607 11,511 11,890 11,756 India 376 491 539 922 1,850 1,681 1,922 1,946 2,198 Brazil 321 391 231 755 1,400 852 852 852 1,043 United States 915 581 510 1,306 566 848 539 539 973 Turkey 24 112 150 283 412 785 821 809 695 Pakistan 55 131 313 608 316 452 422 414 684 Others 2,502 2,969 3,428 2,984 2,832 3,669 3,974 4,419 3,439 World 4,605 5,151 6,761 10,614 9,463 17,895 20,041 20,869 20,788
Exports (thousand metric tons)United States 848 1,290 1,697 1,467 3,130 2,902 2,330 2,256 2,331 India 34 140 255 24 1,085 1,685 1,393 1,157 1,184 Brazil 220 21 167 68 435 938 767 814 726 Uzbekistan n/a n/a n/a 750 600 653 680 585 595 Australia 4 53 329 849 545 1,345 1,033 776 424 Burkina Faso 9 22 73 112 136 215 253 243 264 Others n/a n/a n/a 2,535 1,786 2,341 2,264 2,342 2,153 World 3,875 4,414 5,069 5,805 7,717 10,078 8,719 8,173 7,677
Imports (thousand metric tons)China 108 773 480 52 2,609 4,426 3,089 2,179 1,632 Bangladesh 0 45 80 248 843 593 857 899 967 Vietnam 33 40 31 84 350 548 656 676 927 Indonesia 36 106 324 570 471 683 661 656 797 Turkey 1 0 46 381 760 804 635 849 699 Pakistan 1 1 0 101 314 430 463 541 463 Thailand 46 86 354 342 383 329 369 398 372 Korea, Rep. 121 332 447 304 230 286 311 285 276 Others 3,741 3,172 3,458 3,682 1,797 1,729 1,680 1,690 1,544 World 4,086 4,555 5,220 5,764 7,756 9,827 8,719 8,173 7,677
Source: International Cotton Advisory Committee (January 2016 update).Note: n/a implies data not available.

COMMODITY MARKETS OUTLOOK | JANUARY 2016 55APPENDIX B
Natural rubber
Source: International Rubber Study Group (January 2016 update).
Source: World Bank.Note: Last observation is December 2015.
Source: World Bank.Note: 2015-25 are forecasts.
0
1
2
3
4
5
6
7
Jan-04 Jan-06 Jan-08 Jan-10 Jan-12 Jan-14
Monthly Prices (US$/kg)
0
1
2
3
4
5
6
7
1970 1980 1990 2000 2010 2020
Constant 2010
Nominal
Annual Prices (US$/kg)
1970/71 1980/81 1990/91 2000/01 2010/11 2011/12 2012/13 2013/14 2014/15
Production (thousand metric tons)Thailand 287 501 1,275 2,346 3,252 3,569 3,778 4,170 4,324 Indonesia 815 822 1,261 1,501 2,736 2,990 3,012 3,237 3,153 Vietnam 28 46 94 291 752 789 877 949 954 China 46 113 264 445 687 727 802 865 857 India 90 155 324 629 851 893 919 796 705 Malaysia 1,269 1,530 1,291 928 939 996 923 827 668 Cote d’Ivoire 11 23 69 123 231 234 254 289 317 Brazil 25 28 31 88 136 166 171 187 185 Others 569 632 376 461 811 853 893 931 908 World 3,140 3,850 4,985 6,811 10,395 11,217 11,629 12,251 12,070
Consumption (thousand metric tons)China 250 340 600 1,150 3,668 3,622 3,857 4,210 4,760 European Union 991 1,007 1,012 1,293 1,136 1,242 1,077 1,060 1,139 India 86 171 358 638 944 957 988 962 1,012 United States 568 585 808 1,195 926 1,029 950 913 932 Japan 283 427 677 752 749 772 728 710 709 Indonesia 25 46 108 139 421 460 465 509 540 Thailand 8 28 99 243 459 487 505 521 541 Malaysia 20 45 184 364 458 402 441 434 447 Korea, Rep. 26 118 255 332 384 402 396 396 402 Brazil 37 81 124 227 378 382 343 409 413 Others 796 932 845 975 1,268 1,242 1,271 1,264 1,264 World 3,090 3,780 5,068 7,306 10,792 10,997 11,020 11,388 12,159
Exports (thousand metric tons)Thailand 279 457 1,151 2,166 2,866 2,890 3,024 3,649 3,615 Indonesia 790 976 1,077 1,380 2,369 2,566 2,525 2,770 2,662 Malaysia 1,304 1,482 1,322 978 1,245 1,239 1,291 1,332 1,192 Vietnam 23 33 80 273 782 817 1,023 1,076 1,067 Cote d’Ivoire 11 23 69 121 226 234 255 285 323 Others 413 299 263 359 533 582 589 661 814 World 2,820 3,270 3,962 5,277 8,022 8,327 8,707 9,773 9,672
Imports (thousand metric tons)China 178 242 340 820 2,590 2,665 3,176 3,652 3,809 European Union 1,071 1,068 1,072 1,474 1,427 1,664 1,459 1,451 1,546 India 3 1 61 11 187 158 250 336 402 United States 543 576 820 1,192 931 1,049 969 927 946 Japan 292 458 663 801 747 785 700 722 689 Malaysia 45 43 136 548 706 667 871 1,005 914 Korea, Rep. 26 118 254 331 388 402 397 396 403 Brazil 11 56 95 139 249 223 181 224 230 Others 641 673 1,328 1,065 1,157 1,170 1,310 1,235 1,263 World 2,810 3,235 4,769 6,380 8,382 8,784 9,314 9,948 10,202

COMMODITY MARKETS OUTLOOK | JANUARY 2016 56 APPENDIX B
Aluminum
Source: World Bureau of Metal Statistics.
Note: n/a implies data not available.
Source: World Bank.Note: Last observation is December 2015.
Source: World Bank.Note: 2015-25 are forecasts.
1980 1990 2000 2005 2010 2011 2012 2013 2014Bauxite Production (thousand metric tons)
Australia 27,179 40,697 53,801 59,959 68,535 69,977 76,282 81,119 80,300China 1,700 3,655 7,900 17,408 36,837 37,174 44,052 50,400 65,000Brazil 4,152 9,876 14,379 22,365 32,028 33,625 34,988 33,849 31,693India 1,785 5,277 7,562 12,385 12,662 13,000 15,320 20,421 20,688Guinea 13,911 16,150 17,992 19,237 16,427 17,695 19,974 18,763 17,602Jamaica 12,064 10,937 11,127 14,118 8,540 10,189 9,339 9,435 9,677Russian Federation n/a n/a 5,000 6,409 5,475 5,888 5,166 5,322 5,589Kazakhstan n/a n/a 3,729 4,815 5,310 5,495 5,170 5,193 4,515Surinam 4,903 3,267 3,610 4,757 3,097 3,236 2,873 2,706 2,708Indonesia 1,249 1,249 1,151 1,442 27,410 40,644 31,443 55,655 2,556Venezuela, RB 0 786 4,361 5,815 3,126 2,455 2,500 2,302 2,200Greece 3,286 2,496 1,991 2,495 1,902 2,324 1,815 1,844 2,100Dominican Republic 511 85 0 0 0 0 11 770 1,662Others n/a n/a 6,287 5,601 5,800 6,628 7,655 7,846 9,206World 93,326 114,835 138,889 176,807 227,150 248,330 256,590 295,624 255,495
Refined Production (thousand metric tons)China 358 854 2,647 7,759 16,244 18,135 20,251 22,046 24,382Russian Federation n/a n/a 3,258 3,647 3,947 3,992 4,024 3,724 3,488Canada 1,075 1,567 2,373 2,894 2,963 2,988 2,781 2,967 2,858United Arab Emirates 35 174 536 722 1,400 1,750 1,861 1,848 2,341Australia 304 1,233 1,761 1,903 1,928 1,945 1,864 1,778 1,773India 185 433 647 942 1,610 1,660 1,714 1,596 1,767United States 4,654 4,048 3,668 2,480 1,727 1,983 2,070 1,948 1,710Norway 662 867 1,026 1,376 1,090 1,201 1,111 1,155 1,154Brazil 261 931 1,271 1,498 1,536 1,440 1,436 1,304 978Bahrain 126 212 509 708 851 881 890 913 931Iceland 75 88 226 272 826 781 803 736 749South Africa 87 157 683 851 806 808 665 822 745Saudi Arabia 0 0 0 0 0 0 0 187 652Others n/a n/a 5,699 6,788 6,816 7,465 7,000 6,686 6,518World 16,036 19,362 24,304 31,841 41,745 45,030 46,470 47,710 50,047
Refined Consumption (thousand metric tons)China 550 861 3,352 7,072 15,854 17,702 20,224 21,955 24,069United States 4,454 4,330 6,161 6,114 4,242 4,060 4,875 4,632 5,250Germany 1,272 1,379 1,632 1,758 1,912 2,103 2,086 2,083 2,262Japan 1,639 2,414 2,223 2,276 2,025 1,946 1,982 1,772 2,034India 234 433 601 958 1,475 1,569 1,690 1,559 1,523Korea, Rep. 68 369 823 1,201 1,255 1,233 1,278 1,241 1,282Brazil 296 341 514 759 985 1,077 1,021 988 1,027Turkey 45 152 211 390 703 870 925 867 915United Arab Emirates 0 0 34 85 650 750 835 835 835Others 6,754 8,947 9,456 11,022 11,576 11,880 11,263 10,748 11,071World 15,312 19,227 25,007 31,636 40,677 43,190 46,179 46,680 50,267
500
1,000
1,500
2,000
2,500
3,000
3,500
1970 1980 1990 2000 2010 2020
Constant 2010
Nominal
Annual Prices (US$/mt)
1,000
1,500
2,000
2,500
3,000
3,500
Jan-04 Jan-06 Jan-08 Jan-10 Jan-12 Jan-14
Monthly Prices (US$/mt)

COMMODITY MARKETS OUTLOOK | JANUARY 2016 57APPENDIX B
Copper
Source: World Bank.Note: Last observation is December 2015.
Source: World Bank.Note: 2015-25 are forecasts.
Source: World Bureau of Metal Statistics.
Notes: n/a implies data not available. Refined production and consumption include significant recyled material.
1980 1990 2000 2005 2010 2011 2012 2013 2014Mine Production (thousand metric tons)
Chile 1,068 1,588 4,602 5,321 5,419 5,263 5,434 5,776 5,750 China 177 296 549 639 1,180 1,295 1,577 1,707 1,632 United States 1,181 1,587 1,440 1,157 1,129 1,138 1,196 1,279 1,383 Peru 367 318 553 1,010 1,247 1,235 1,299 1,376 1,380 Congo, DR 460 356 33 98 378 480 608 817 1,003 Australia 244 327 832 930 870 960 914 999 970 Zambia 596 496 249 441 732 784 782 839 759 Russian Federation n/a n/a 580 805 703 714 720 720 720 Canada 716 794 634 595 522 569 580 632 696 Mexico 175 291 365 391 270 444 500 480 514 Kazakhstan n/a n/a 433 436 404 433 491 538 501 Poland 343 370 454 523 425 427 427 429 421 Indonesia 59 169 1,006 1,064 871 543 398 494 366 Others n/a n/a 1,476 1,619 1,985 2,006 2,095 2,252 2,409 World 7,864 8,997 13,207 15,029 16,135 16,291 17,021 18,338 18,502
Refined Production (thousand metric tons)China 314 562 1,312 2,566 4,540 5,163 5,879 6,839 8,008 Chile 811 1,192 2,669 2,824 3,244 3,092 2,902 2,755 2,729 Japan 1,014 1,008 1,437 1,395 1,549 1,328 1,516 1,468 1,554 United States 1,686 2,017 1,802 1,257 1,093 1,031 1,001 1,040 1,095 Russian Federation n/a n/a 824 968 900 910 887 874 874 India 23 39 265 518 647 662 689 619 764 Congo, DR 144 173 29 3 254 349 453 643 742 Zambia 607 479 226 465 767 740 700 629 739 Germany 425 533 709 639 704 709 686 680 683 Korea, Rep. 79 187 471 527 556 593 590 604 604 Poland 357 346 486 560 547 571 566 565 577 Australia 182 274 484 471 424 477 461 480 509 Spain 154 171 316 308 347 354 408 351 428 Others n/a n/a 3,731 4,135 3,637 3,834 3,617 3,737 3,704 World 9,390 10,809 14,761 16,635 19,211 19,814 20,356 21,284 23,011
Refined Consumption (thousand metric tons)China 286 512 1,869 3,621 7,385 7,881 8,896 9,830 11,352 United States 1,868 2,150 2,979 2,264 1,760 1,755 1,758 1,826 1,841 Germany 870 1,028 1,309 1,115 1,312 1,247 1,114 1,136 1,173 Japan 1,158 1,577 1,351 1,229 1,060 1,003 985 996 1,085 Korea, Rep. 85 324 862 868 856 784 721 722 759 Italy 388 475 674 680 619 608 570 552 622 Russian Federation n/a n/a 183 667 457 586 490 484 568 Taiwan, China 85 265 628 638 532 457 432 437 465 Turkey 33 103 248 319 369 421 429 453 453 Others n/a n/a 4,992 5,246 4,989 4,834 4,738 4,566 4,456
World 9,385 10,780 15,096 16,649 19,340 19,576 20,133 21,002 22,774
0
2,000
4,000
6,000
8,000
10,000
Jan-04 Jan-06 Jan-08 Jan-10 Jan-12 Jan-14
Monthly Prices (US$/mt)
0
2,000
4,000
6,000
8,000
10,000
1970 1980 1990 2000 2010 2020
Constant 2010
Nominal
Annual Prices (US$/mt)

COMMODITY MARKETS OUTLOOK | JANUARY 2016 58 APPENDIX B
Lead
Source: World Bureau of Metal Statistics.
Notes: n/a implies data not available. Refined production and consumption include significant recyled material.
Source: World Bank.Note: Last observation is December 2015.
Source: World Bank.Note: 2015-25 are forecasts.
1980 1990 2000 2005 2010 2011 2012 2013 2014Mine Production (thousand metric tons)
China 160 364 660 1,142 1,981 2,406 2,613 3,048 2,853 Australia 398 570 678 767 712 621 622 711 728 United States 562 493 447 437 356 334 336 343 385 Peru 189 188 271 319 262 230 249 266 278 Mexico 146 174 138 134 192 224 238 253 249 Russian Federation n/a n/a 13 36 97 123 147 143 194 India 15 26 38 60 91 94 115 106 105 Bolivia 16 20 10 11 73 100 81 82 82 Sweden 72 84 107 61 68 62 64 60 71 Turkey 8 18 16 19 39 40 54 78 65 Korea, Dem. People’s Rep. 125 70 26 20 27 29 38 59 53 Iran, Islamic Rep. 12 9 17 22 32 29 36 40 46 Poland 48 45 51 51 48 41 73 74 45 Others n/a n/a 610 372 396 410 429 393 396 World 3,595 3,150 3,080 3,453 4,374 4,741 5,096 5,655 5,550
Refined Production (thousand metric tons)China 175 297 1,100 2,359 4,157 4,604 4,591 4,475 4,221 United States 1,151 1,291 1,431 1,293 1,255 1,248 1,221 1,308 1,128 Korea, Rep. 15 80 222 254 321 423 460 470 633 India 26 39 57 56 366 380 461 462 473 Germany 392 394 387 342 405 429 426 400 380 United Kingdom 325 329 328 304 301 275 312 329 330 Canada 231 184 284 230 273 282 278 288 281 Japan 305 327 312 275 267 253 259 252 240 Mexico 149 238 332 272 257 247 244 236 233 Australia 234 229 223 267 210 232 207 233 232 Italy 134 171 237 211 150 150 138 180 180 Spain 121 124 120 110 163 170 160 160 162 Brazil 85 76 86 121 115 138 165 152 152 Others 2,083 1,683 1,582 1,572 1,485 1,547 1,503 1,615 1,608 World 5,424 5,460 6,701 7,665 9,726 10,377 10,426 10,561 10,253
Refined Consumption (thousand metric tons)China 210 244 660 1,974 4,171 4,618 4,618 4,467 4,199 United States 1,094 1,275 1,660 1,490 1,430 1,410 1,360 1,750 1,650 Korea, Rep. 54 80 309 376 382 427 429 498 564 India 33 147 56 139 420 420 524 428 517 Germany 433 448 390 330 343 374 381 392 337 United Kingdom 296 302 301 288 211 211 229 274 271 Japan 393 416 343 291 224 236 273 255 254 Spain 111 115 219 279 262 263 244 257 245 Italy 275 258 283 262 245 233 195 235 229 Others 2,451 2,063 2,270 2,348 2,012 2,051 2,059 2,089 1,985 World 5,348 5,348 6,491 7,777 9,700 10,243 10,312 10,646 10,252
0
1,000
2,000
3,000
4,000
Jan-04 Jan-06 Jan-08 Jan-10 Jan-12 Jan-14
Monthly Prices (US$/mt)
0
500
1,000
1,500
2,000
2,500
3,000
1970 1980 1990 2000 2010 2020
Constant 2010
Nominal
Annual Prices (US$/mt)

COMMODITY MARKETS OUTLOOK | JANUARY 2016 59APPENDIX B
Nickel
Source: World Bank.Note: Last observation is December 2015.
Source: World Bank.Note: 2015-25 are forecasts.
Source: World Bureau of Metal Statistics.
Note: n/a implies data not available.
1980 1990 2000 2005 2010 2011 2012 2013 2014Mine Production (thousand metric tons)
Philippines 38 16 17 27 184 319 318 316 411 Australia 74 67 170 186 170 215 244 256 246 Russian Federation n/a n/a 266 289 274 270 269 242 238 Canada 189 196 191 200 160 219 212 223 235 New Caledonia 87 85 129 112 130 131 132 150 178 Indonesia 41 69 117 156 216 227 622 811 144 China 11 33 51 59 80 90 93 98 98 Brazil 3 13 32 38 54 75 90 74 86 Cuba 38 41 71 74 65 69 65 62 61 South Africa 26 30 37 42 40 43 46 51 55 Colombia 0 0 28 53 49 38 52 49 41 Madagascar 0 0 0 0 0 0 6 25 37 Guatemala 7 0 0 0 0 0 2 9 34 Others n/a n/a 82 120 108 128 123 134 127 World 749 888 1,191 1,356 1,531 1,823 2,272 2,503 1,991
Refined Production (thousand metric tons)China 11 28 52 97 314 470 591 711 644 Russian Federation n/a n/a 242 264 263 266 256 246 246 Japan 109 103 161 164 166 157 170 178 178 Australia 35 43 112 122 102 110 129 142 138 Canada 145 127 134 140 105 142 140 137 115 Norway 37 58 59 85 92 92 92 91 91 Brazil 3 13 23 30 28 43 59 56 73 New Caledonia 33 32 44 47 40 41 45 48 62 Finland 13 17 54 41 49 49 46 44 43 Colombia 0 18 28 53 49 38 52 49 41 United Kingdom 19 27 38 38 32 37 34 40 38 Madagascar 0 0 0 0 0 0 6 25 37 South Africa 18 28 37 42 34 36 33 32 35 Others n/a n/a 127 166 163 184 192 184 180 World 743 858 1,110 1,288 1,437 1,665 1,843 1,985 1,920
Refined Consumption (thousand metric tons)China 18 28 58 197 489 703 805 909 761 Japan 122 159 192 180 177 174 159 159 161 United States 142 127 153 128 119 134 126 123 152 Korea, Rep. 0 24 91 118 101 100 108 107 100 Taiwan, China 0 18 106 84 73 53 57 53 66 Germany 78 93 102 116 100 88 89 66 62 Italy 27 27 53 85 62 66 65 59 60 Spain 9 21 32 48 29 29 32 32 33 South Africa n/a n/a 35 47 41 34 32 35 31 Others n/a n/a 329 315 235 281 257 255 268 World 717 842 1,150 1,317 1,427 1,661 1,729 1,798 1,695
0
10,000
20,000
30,000
40,000
50,000
1970 1980 1990 2000 2010 2020
Constant 2010
Nominal
Annual Prices (US$/mt)
0
20,000
40,000
60,000
Jan-04 Jan-06 Jan-08 Jan-10 Jan-12 Jan-14
Monthly Prices (US$/mt)

COMMODITY MARKETS OUTLOOK | JANUARY 2016 60 APPENDIX B
Tin
Source: World Bureau of Metal Statistics.
Notes: n/a implies data not available. Refined production and consumption include significant recyled material.
Source: World Bank.Note: Last observation is December 2015.
Source: World Bank.Note: 2015-25 are forecasts.
1980 1990 2000 2005 2010 2011 2012 2013 2014Mine Production (thousand metric tons)
China 16 42 88 113 130 127 116 149 177Indonesia 33 39 52 120 84 78 90 84 70Peru 1 5 36 43 34 29 26 24 23Bolivia 23 17 13 19 20 20 20 19 20Myanmar 1 1 2 1 1 2 2 9 17Brazil 7 39 14 12 10 11 14 14 14Australia 12 7 9 3 19 15 6 6 7Vietnam 0 1 2 5 5 5 5 5 5Rwanda 2 1 0 3 3 5 3 4 4Congo, DR 3 2 0 8 7 3 2 5 4Malaysia 61 29 6 3 3 3 4 4 4Nigeria 3 0 2 1 1 2 2 3 2Lao People’s DR 1 0 0 1 0 0 1 1 1Others 72 42 10 3 1 1 1 1 1World 231 225 234 333 318 303 292 327 349
Refined Production (thousand metric tons)China 15 36 110 112 149 155 148 159 187Indonesia 31 38 46 78 64 73 80 63 68Malaysia 71 49 26 39 39 40 38 33 37Peru 0 0 17 38 36 30 25 24 26Thailand 35 16 17 29 24 24 23 23 16Bolivia 18 13 9 16 15 15 14 15 15Brazil 9 38 14 9 9 9 12 12 12Belgium 3 6 9 8 10 10 11 10 10Vietnam 0 2 2 2 3 4 5 6 6India 0 0 4 4 4 4 4 4 4Poland 0 0 0 0 1 1 1 2 2Japan 1 1 1 1 1 1 1 2 2Russian Federation n/a n/a 5 4 1 1 1 1 1Others n/a n/a 2 1 2 2 2 1 1World 245 248 262 341 357 369 365 353 386
Refined Consumption (thousand metric tons)China 13 26 49 109 154 176 176 168 193United States 47 37 51 42 32 32 31 29 29Japan 31 35 25 33 36 27 28 28 27Germany 19 22 21 19 17 20 18 18 19Korea, Rep. 2 8 15 18 17 14 16 15 14India 2 2 6 8 11 10 10 10 12Netherlands 5 7 4 4 5 5 5 7 7Spain 5 4 4 7 6 6 3 5 6Vietnam 0 0 1 1 2 2 2 4 5Others 100 98 101 97 88 85 70 70 67World 223 238 277 339 369 377 358 354 379
0
5,000
10,000
15,000
20,000
25,000
30,000
35,000
1970 1980 1990 2000 2010 2020
Constant 2010
Nominal
Annual Prices (US$/mt)
0
10,000
20,000
30,000
40,000
Jan-04 Jan-06 Jan-08 Jan-10 Jan-12 Jan-14
Monthly Prices (US$/mt)

COMMODITY MARKETS OUTLOOK | JANUARY 2016 61APPENDIX B
Zinc
Source: World Bank.Note: Last observation is December 2015.
Source: World Bank.Note: 2015-25 are forecasts.
Source: World Bureau of Metal Statistics.
Note: n/a implies data not available.
1980 1990 2000 2005 2010 2011 2012 2013 2014Mine Production (thousand metric tons)
China 150 763 1,780 2,061 3,842 4,050 4,859 5,391 5,445 Australia 495 940 1,420 1,367 1,480 1,516 1,542 1,523 1,560 Peru 488 584 910 1,202 1,470 1,256 1,281 1,351 1,319 United States 349 571 829 748 748 769 738 788 831 India 32 70 208 447 740 733 725 817 729 Mexico 243 307 401 476 570 632 660 643 676 Bolivia 50 108 149 160 411 427 390 407 493 Canada 1,059 1,203 1,002 667 649 612 612 426 353 Kazakhstan n/a n/a 322 364 405 377 371 361 347 Ireland 229 167 263 429 354 344 338 327 283 Sweden 167 160 177 216 199 194 188 177 222 Russian Federation n/a n/a 132 186 269 282 259 209 217 Turkey 23 35 26 19 196 158 206 200 211 Others n/a n/a 1,204 1,228 1,176 1,185 1,211 1,202 1,344 World 6,172 7,176 8,823 9,569 12,510 12,535 13,380 13,822 14,029
Refined Production (thousand metric tons)China 155 552 1,957 2,725 5,209 5,212 4,881 5,302 5,827 Korea, Rep. 76 248 473 650 750 828 877 895 915 India 44 79 176 266 701 788 691 773 698 Canada 592 592 780 724 690 662 649 652 648 Japan 735 688 654 638 574 545 571 587 583 Spain 152 253 386 501 517 527 528 529 529 Australia 301 309 489 457 498 507 498 498 482 Peru 64 118 200 166 223 314 319 346 336 Mexico 145 199 337 334 322 322 324 323 326 Kazakhstan n/a n/a 263 357 319 320 320 320 325 Finland 147 175 223 282 307 307 315 312 302 Netherlands 170 208 217 225 264 261 257 275 290 Russian Federation n/a n/a 241 206 260 246 247 262 265 Others n/a n/a 2,757 2,587 2,285 2,305 2,086 2,021 1,998 World 6,159 6,698 9,153 10,119 12,919 13,145 12,563 13,095 13,525
Refined Consumption (thousand metric tons)China 200 369 1,402 3,040 5,350 5,460 5,396 5,995 6,420 United States 810 992 1,315 1,080 907 939 892 939 962 Korea, Rep. 68 230 419 448 540 544 553 578 644 India 95 135 224 389 538 556 561 640 636 Japan 752 814 674 602 516 501 479 498 503 Germany 474 530 532 514 494 515 474 479 474 Belgium 155 178 394 256 321 256 239 222 388 Russian Federation n/a n/a 138 166 203 202 222 265 242 Italy 236 270 377 373 339 338 247 245 240 Others n/a n/a 3,414 3,527 3,313 3,267 3,096 3,138 3,169 World 6,131 6,568 8,889 10,396 12,521 12,579 12,159 13,000 13,678
0
1,000
2,000
3,000
4,000
5,000
Jan-04 Jan-06 Jan-08 Jan-10 Jan-12 Jan-14
Monthly Prices (US$/mt)
0
1,000
2,000
3,000
4,000
5,000
1970 1980 1990 2000 2010 2020
Constant 2010
Nominal
Annual Prices (US$/mt)

COMMODITY MARKETS OUTLOOK | JANUARY 2016 62 APPENDIX B
Gold
Source: World Bank.Note: Last observation is December 2015.
Source: World Bank.Note: 2015-25 are forecasts.
0
300
600
900
1200
1500
1800
Jan-04 Jan-06 Jan-08 Jan-10 Jan-12 Jan-14
Monthly Prices (US$/toz)
0
300
600
900
1,200
1,500
1,800
1970 1980 1990 2000 2010 2020
Constant 2010
Nominal
Annual Prices (US$/toz)
1995 2000 2005 2009 2010 2011 2012 2013 2014Production (metric tons) China 136 175 209 314 341 361 403 428 452 Australia 247 296 263 223 260 258 252 267 274 Russian Federation 128 144 163 205 201 185 183 230 249 United States 317 353 256 223 231 234 235 230 210 Canada 152 156 121 97 91 100 105 125 152 South Africa 522 428 297 205 191 187 154 169 152 Peru 56 134 206 184 164 164 162 151 141 Ghana 53 72 67 91 93 88 99 95 136 Mexico 20 24 30 62 79 89 103 120 118 Uzbekistan 70 88 84 73 90 91 93 98 102 Brazil 64 61 38 60 62 65 67 80 78 Argentina 1 26 28 49 64 59 55 52 72 Indonesia 63 125 158 128 106 77 69 60 69 Colombia 22 37 36 48 54 56 66 56 57 Papua New Guinea 52 73 67 68 67 62 58 63 53 Kazakhstan 11 27 18 23 30 37 40 42 49 Chile 44 54 40 41 39 45 50 49 46 Mali 8 29 44 43 39 36 41 41 45 Tanzania 0 15 48 39 39 37 40 43 41 Others 206 242 291 300 352 404 439 470 555 World 2,174 2,560 2,464 2,477 2,594 2,635 2,713 2,868 3,049
Fabrication (metric tons) India 426 704 695 571 783 761 736 716 771 China 217 213 277 431 523 651 698 1,058 732 Turkey 126 228 303 111 109 136 114 178 156 United States 245 277 219 173 179 167 147 160 150 Japan 189 161 165 141 158 147 126 124 119 Italy 458 522 290 135 126 103 96 92 96 Russian Federation n/a 34 61 58 61 66 72 74 70 South Korea 82 107 83 65 68 62 54 49 47 Switzerland 47 54 56 38 41 48 48 48 46 Indonesia 133 99 87 46 39 39 44 52 45 Egypt, Arab Rep. 61 107 71 45 43 30 39 42 42 Malaysia 78 86 74 45 44 37 35 45 41 Saudi Arabia 156 153 125 54 47 37 33 41 37 Germany 71 64 52 38 41 39 36 37 36 United Arab Emirates 30 50 55 36 33 28 28 38 36 Brazil 27 32 26 25 30 29 30 33 34 Canada 28 25 27 48 44 45 32 45 32 Iran, Islamic Rep. 37 46 41 38 39 37 37 42 32 Singapore 22 26 30 23 25 24 22 25 27 Others 862 772 590 404 363 342 312 340 317
World 3,294 3,761 3,325 2,524 2,795 2,828 2,738 3,238 2,864 Sources: World Bureau of Metal Statistics and Thomson Reuters.Notes: n/a implies data not available. Fabrication includes the use of scrap. Fabrication of "Saudi Arabia" includes Saudi Arabia and Yemen in 1995 and 2000.

COMMODITY MARKETS OUTLOOK | JANUARY 2016 63APPENDIX B
Silver
Source: World Bank.Note: Last observation is December 2015.
Source: World Bank.Note: 2015-25 are forecasts.
0
10
20
30
40
50
Jan-04 Jan-06 Jan-08 Jan-10 Jan-12 Jan-14
Monthly Prices (US$/toz)
0
10
20
30
40
50
1970 1980 1990 2000 2010 2020
Constant 2010
Nominal
Annual Prices (US$/toz)
Sources: World Bureau of Metal Statistics and Thomson Reuters.Notes: n/a implies data not available. Fabrication: jewelry and silverware including the use of scrap.
1995 2000 2005 2009 2010 2011 2012 2013 2014Production (metric tons) Mexico 2,334 2,483 2,894 3,554 4,411 4,778 5,358 5,821 5,766 Peru 1,881 2,418 3,193 3,854 3,640 3,414 3,481 3,674 3,777 China 1,000 1,600 2,500 2,900 3,085 3,232 3,639 3,673 3,673 Australia 920 2,060 2,417 1,633 1,880 1,725 1,728 1,840 1,847 Chile 1,036 1,245 1,400 1,301 1,276 1,311 1,151 1,174 1,572 Russian Federation 250 400 1,350 1,313 1,145 1,134 1,400 1,412 1,412 Bolivia 425 434 420 1,326 1,259 1,214 1,207 1,287 1,345 Poland 1,001 1,164 1,262 1,207 1,183 1,167 1,149 1,403 1,200 United States 1,565 2,017 1,230 1,250 1,280 1,120 1,060 1,050 1,160 Kazakhstan 371 927 883 618 552 651 963 964 982 Argentina 48 78 264 533 723 641 750 768 905 Guatemala 0 0 7 129 195 273 205 284 857 Canada 1,285 1,204 1,124 631 596 572 705 618 493 Sweden 268 329 310 289 302 302 309 341 401 India 38 40 32 138 165 203 374 367 338 Morocco 204 290 186 210 243 227 230 255 277 Turkey 70 110 80 352 348 292 236 187 187 Finland 29 24 47 70 65 73 128 101 148 Dominican Republic 21 n/a n/a 19 23 19 23 80 128 Others 1,436 1,372 1,099 1,002 1,069 1,042 1,088 1,061 954 World 14,183 18,194 20,697 22,328 23,440 23,389 25,185 26,362 27,422
Fabrication (metric tons) India n/a n/a 1,333 1,164 1,233 1,194 1,196 2,248 3,058 China n/a n/a 1,054 1,457 1,681 1,952 2,029 2,266 1,642 Italy n/a n/a 1,230 806 802 599 540 559 614 Thailand n/a n/a 1,145 946 947 798 662 692 611 United States n/a n/a 487 362 400 370 342 381 419 Mexico n/a n/a 511 355 344 450 428 281 261 Russian Federation n/a n/a 138 263 291 240 228 225 223 Indonesia n/a n/a 140 150 168 190 207 215 206 Turkey n/a n/a 258 175 153 134 139 162 192 South Korea n/a n/a 147 150 167 179 183 186 167 Germany n/a n/a 213 166 169 159 147 134 131 Brazil n/a n/a 50 57 64 50 50 94 82 Japan n/a n/a 64 65 70 69 72 75 70 France n/a n/a 55 59 64 73 67 56 54 Vietnam n/a n/a 32 40 45 49 50 49 52 Israel n/a n/a 59 46 42 32 29 34 37 Iran, Islamic Rep. n/a n/a 50 44 43 40 37 39 34 Spain n/a n/a 61 41 37 37 32 29 30 Bangladesh n/a n/a 46 45 43 41 40 28 30 Others n/a n/a 886 784 774 683 676 674 667 World n/a n/a 7,959 7,175 7,537 7,339 7,154 8,427 8,580


APPENDIX CDescription of price series
Technical notes


COMMODITY MARKETS OUTLOOK | JANUARY 2016 67APPENDIX C
Description of Price Series
ENERGY
Coal (Australia). Thermal, f.o.b. piers, Newcastle/Port Kembla, 6,700 kcal/kg, 90 days forward delivery.Coal (Colombia). Thermal, f.o.b. Bolivar, 6,450 kcal/kg, (11,200 btu/lb), less than .8% sulfur, 9% ash, 90 days forward delivery.Coal (South Africa). Thermal, f.o.b. Richards Bay, 6,000 kcal/kg, 90 days forward delivery.Crude oil. Average price of Brent (38° API), Dubai Fateh (32° API), and West Texas Intermediate (WTI, 40° API). Equally weighed.Natural Gas Index (Laspeyres). Weights based on five-year consumption volumes for Europe, U.S. and Japan (LNG), updated every five years.Natural gas (Europe). Average import border price with a component of spot price, including U.K.Natural gas (U.S.). Spot price at Henry Hub, Louisiana.Natural gas (Japan). LNG, import price, cif; recent two months' averages are estimates. NON-ENERGYBeverages
Cocoa (ICCO). International Cocoa Organization daily price, average of the first three positions on the terminal markets of New York and London, nearest three future trading months.Coffee (ICO). International Coffee Organization indicator price, other mild Arabicas, average New York and Bremen/Hamburg markets, ex-dock.Coffee (ICO). International Coffee Organization indicator price, Robustas, average New York and Le Havre/Marseilles markets, ex-dock. Tea. Average three auctions, average of quotations at Kolkata, Colombo, and Mombasa/Nairobi.Tea (Colombo). Sri Lankan origin, all tea, average of weekly quotes.Tea (Kolkata). leaf, include excise duty, average of weekly quotes.Tea (Mombasa/Nairobi). African origin, all tea, average of weekly quotes.
Oils and meals
Coconut oil (Philippines/Indonesia). Bulk, c.i.f. Rotterdam. Copra (Philippines/Indonesia). Bulk, c.i.f. N.W. Europe.
Groundnuts (U.S.). Runners 40/50, shelled basis, c.i.f. Rotterdam.Groundnut oil (any origin). C.i.f. Rotterdam.Fishmeal (any origin). 64-65%, c&f Bremen, esti-mates based on wholesale price.Palm oil (Malaysia). 5% bulk, c.i.f. N. W. Europe.Palmkernel Oil (Malaysia). C.i.f. Rotterdam.Soybean meal (any origin), Argentine 45/46% ex-traction, c.i.f. Rotterdam.Soybean oil (any origin). Crude, f.o.b. ex-mill Netherlands.Soybeans (U.S.). C.i.f. Rotterdam.
Grains
Barley (U.S.). Feed, No. 2, spot, 20 days to-arrive, delivered Minneapolis.Maize (U.S.). No. 2, yellow, f.o.b. US Gulf ports.Rice (Thailand). 5% broken, white rice (WR), milled, indicative price based on weekly surveys of export transactions, government standard, f.o.b. Bangkok.Rice (Thailand). 25% broken, WR, milled indicative survey price, government standard, f.o.b. Bangkok.Rice (Thailand). 100% broken, A.1 Super, indicative survey price, government standard, f.o.b. Bangkok.Rice (Vietnam). 5% broken, WR, milled, weekly indicative survey price, minimum export price, f.o.b. Hanoi.Sorghum (U.S.). No. 2 milo yellow, f.o.b. Gulf ports.Wheat (U.S.). No. 1, hard red winter (HRW), ordinary protein, export price delivered at the US Gulf port for prompt or 30 days shipment.Wheat (U.S.). No. 2, soft red winter (SRW), export price delivered at the U.S. Gulf port for prompt or 30 days shipment.
Other food
Bananas (Central and South America). Major brands, free on truck (f.o.t.) Southern Europe, including duties. Bananas (Central and South America). Major brands, US import price, f.o.t. US Gulf ports.Meat, beef (Australia/New Zealand). Chucks and cow forequarters, frozen boneless, 85% chemical lean, c.i.f. U.S. port (east coast), ex-dock.Meat, chicken (U.S.). Broiler/fryer, whole birds, 2-1/2 to 3 pounds, USDA grade "A", ice-packed, Georgia Dock preliminary weighted average, wholesale.Meat, sheep (New Zealand). Frozen whole carcasses Prime Medium (PM) wholesale, Smithfield, London.

COMMODITY MARKETS OUTLOOK | JANUARY 2016 68 APPENDIX C
Oranges (Mediterranean exporters). Navel, EEC indicative import price, c.i.f. Paris.Shrimp (Mexico). West coast, frozen, white, No. 1, shell-on, headless, 26 to 30 count per pound, wholesale price at New York.Sugar (EU). European Union negotiated import price for raw unpackaged sugar from African, Caribbean, and Pacific (ACP), c.i.f. European ports.Sugar (U.S.). Nearby futures contract, c.i.f.Sugar (world). International Sugar Agreement (ISA) daily price, raw, f.o.b. and stowed at greater Caribbean ports.
Timber
Logs (West Africa). Sapele, high quality (loyal and marchand), 80 centimeter or more, f.o.b. Douala, Cameroon.Logs (Southeast Asia). Meranti, Sarawak, Malaysia, sale price charged by importers, Tokyo.Plywood (Africa and Southeast Asia). Lauan, 3-ply, extra, 91 cm x 182 cm x 4 mm, wholesale price, spot Tokyo.Sawnwood (West Africa). Sapele, width 6 inches or more, length 6 feet or more, f.a.s. Cameroonian ports.Sawnwood (Southeast Asia). Malaysian dark red se-raya/meranti, select and better quality, average 7 to 8 inches; length average 12 to 14 inches; thickness 1 to 2 inches; kiln dry, c. & f. UK ports, with 5% agents commission including premium for products of certi-fied sustainable forest.Woodpulp (Sweden). Softwood, sulphate, bleached, air-dry weight, c.i.f. North Sea ports.
Other raw materials
Cotton (Cotton Outlook "CotlookA index"). Middling 1-3/32 inch, traded in Far East, C/F.Rubber (Asia). RSS3 grade, Singapore Commodity Exchange Ltd (SICOM) nearby contract.Rubber (Asia). TSR 20, Technically Specified Rubber, SICOM nearby contract.
Fertilizers
DAP (diammonium phosphate). Standard size, bulk, spot, f.o.b. US Gulf.Phosphate rock (Morocco). 70% BPL, contract, f.a.s. Casablanca.Potassium chloride (muriate of potash). Standard grade, spot, f.o.b. Vancouver.
TSP (triple superphosphate). Bulk, spot, granular, f.o.b. Tunisia.Urea (Black Sea). Bulk, spot, f.o.b. Black Sea (primarily Yuzhnyy).
Metals and minerals
Aluminum (LME). London Metal Exchange, unalloyed primary ingots, standard high grade, physical settlement.Copper (LME). Standard grade A, cathodes and wire bar shapes, physical settlement. Iron ore (any origin). Fines, spot price, c.f.r. China, 62% Fe.Lead (LME). Refined, standard high grade, physical settlement.Nickel (LME). Cathodes, standard high grade, physical settlement.Tin (LME). Refined, standard high grade, physical settlement.Zinc (LME). Refined, standard special high grade, physical settlement.
PRECIOUS METALS
Gold (U.K.). 99.5% fine, London afternoon fixing, average of daily rates.Platinum (U.K.). 99.9% refined, London afternoon fixing.Silver (U.K.). 99.9% refined, London afternoon fixing.

COMMODITY MARKETS OUTLOOK | JANUARY 2016 69APPENDIX C
Technical Notes
Definitions and explanations
Constant prices are prices which are deflated by the Manufacturers Unit Value Index (MUV).
MUV is the unit value index in U.S. dollar terms of manufactures exported from fifteen countries: Brazil, Canada, China, Germany, France, India, Italy, Japan, Mexico, Republic of Korea, South Africa, Spain, Thailand, United Kingdom, and United States.
Price indices were computed by the Laspeyres formula. The Non-Energy Price Index is comprised of 34 commodities. U.S. dollar prices of each commodity is weighted by 2002-2004 average export values. Base year reference for all indexes is 2010. Countries included in indexes are all low- and middle-income, according to World Bank income classifications.
Price index weights. Trade data as of May 2008 comes from United Nations' Comtrade Database via the World Bank WITS system, Food and Agriculture Organization FAOSTAT Database, International Energy Agency Database, BP Statistical Review of World Energy, World Metal Statistics, World Bureau of Metal Statistics, and World Bank staff estimates. The weights can be found in the table on the next page.
Reporting period. Calendar vs. crop or marketing year refers to the span of the year. It is common in many agricultural commodities to refer to production and other variables over a twelve-month period that begins with harvest. A crop or marketing year will often differ by commodity and, in some cases, by country or region.
Abbreviations
$ = U.S. dollarbbl = barrelbcf/d = billion cubic feet per daycif = cost, insurance, freightcum = cubic meterdmt = dry metric tonf.o.b. = free on boardf.o.t. = free on trackkg = kilogrammb/d = million barrels per daymmbtu = million British thermal unitsmt = metric ton (1,000 kilograms)toz = troy oz
AcronymsBRICS Brazil, Russian Federation, India, China, and
South AfricaDAP diammonium phosphateEIA Energy Information Administration
EMDE emerging and developing economiesFAVAR factor augmented vector autoregressionGDP gross domestic productGVAR global vector autoregressionIAEA International Atomic Energy AgencyIEA International Energy AgencyLME London Metal ExchangeLNG liquefied natural gasNPI nickel pig ironOECD Organization of Economic Cooperation and
DevelopmentOPEC Organization of Petroleum Exporting CountriesS/U stocks-to-use ratioTSP triple superphosphateUN United NationsUSDA United States Department of AgricultureVAR vector autoregressionWTI West Texas Intermediate
Data sources
Baker HughesBloombergBP Statistical Review of World EnergyCotton OutlookFertilizer WeekINFOFISHINTERFEL Fel Actualités HebdoInternational Cocoa Organization (ICCO)International Coffee Organization (ICO)International Energy Agency (IEA)International Fertilizer Association (IFA)International Rubber Study Group (IRSG)International Tea Committee (ITC)International Tropical Timber Organization (ITTO)International Sugar Organization (ISO)ISTA Mielke GmbH Oil WorldJapan Lumber JournalMLA Meat & Livestock WeeklyPlatts International Coal ReportSingapore Commodity ExchangeSopisco NewsSri Lanka Tea BoardU.S. Department of AgricultureU.. Energy Information Administration (EIA)U.S. NOAA Fisheries ServiceWorld Bureau of Metal StatisticsWorld Gas Intelligence

COMMODITY MARKETS OUTLOOK | JANUARY 2016 70 APPENDIX C
Weights for commodity price indices Commodity group
Share of energy and non-energy indices
Share of sub-group indices
ENERGY 100.0 100.0 Coal 4.7 4.7 Crude Oil 84.6 84.6 Natural Gas 10.8 10.8
NON-ENERGY 100.0 Agriculture 64.9
Beverages 8.4 100.0 Coffee 3.8 45.7 Cocoa 3.1 36.9 Tea 1.5 17.4
Food 40.0 Grains 11.3 100.0
Rice 3.4 30.2 Wheat 2.8 25.3 Maize (includes sorghum) 4.6 40.8 Barley 0.5 3.7
Oils and Meals 16.3 100.0 Soybeans 4.0 24.6 Soybean Oil 2.1 13.0 Soybean Meal 4.3 26.3 Palm Oil 4.9 30.2 Coconut Oil 0.5 3.1 Groundnut Oil (includes groundnuts) 0.5 2.8
Other Food 12.4 100.0 Sugar 3.9 31.5 Bananas 1.9 15.7 Meat, beef 2.7 22.0 Meat, chicken 2.4 19.2 Oranges (includes orange junice) 1.4 11.6
Agricultural Raw Materials 16.5 Timber 8.6 100.0
Hardwood 8.6 100.0 Logs 1.9 22.1 Sawnwood 6.7 77.9
Other Raw Materials 7.9 100.0 Cotton 1.9 24.7 Natural Rubber 3.7 46.7 Tobacco 2.3 28.7
Metals and Minerals 31.6 100.0Aluminum 8.4 26.7Copper 12.1 38.4Iron Ore 6.0 18.9Lead 0.6 1.8Nickel 2.5 8.1Tin 0.7 2.1Zinc 1.3 4.1
Fertilizers 3.6 100.0Natural Phosphate Rock 0.6 16.9Phosphate 0.8 21.7Potassium 0.7 20.1Nitogenous 1.5 41.3
PRECIOUS METALS 100.0 Gold 77.8 Silver 18.9 Platinum 3.3
Notes: Index weights are based on 2002-04 developing countries' export values. Precious metals are not included in the non-energy index.


Commodity prices continued to fall in the fourth quarter of
2015 refl ecting abundant supplies, weaker growth prospects
in emerging economies, and a strong U.S. dollar. One of the
largest declines was in crude oil, which fell from $51 per barrel
in early October to less than $30 in mid-January. For 2015 as
a whole, average energy prices plunged 45 percent from 2014,
while non-energy prices declined 15 percent. Relative to their
peaks in 2011, the main industrial commodity price indices in
December were down substantially—two-thirds for energy
and more than one-half for metals. Agricultural prices also fell
despite intensifi cation of El Niño. Most price forecasts have
been revised down for 2016. Separately, this edition examines
the implications of emerging market economic growth on
commodity prices and concludes that weaker growth prospects
could have sizeable adverse eff ects on prices.
The World Bank’s Commodity Markets Outlook is published
quarterly, in January, April, July, and October. The report
provides detailed market analysis for major commodity groups,
including energy, metals, agriculture, precious metals, and
fertilizers. Price forecasts to 2025 for 46 commodities are also
presented, together with historical price data. Commodity price
data updates are published separately at the beginning of each
month.
The report and data can be accessed at:
www.worldbank.org/commodities