a weekly update from smc wise m · pdf filemalad (west), mumbai 400064 tel: 91-22-67341600,...
TRANSCRIPT

2013: Issue 368, Week: 29th April - 02nd MayA Weekly Update from SMC(For private circulation only)
WISE M NEY
Bra
nd
sm
c 1
91
®

(Saurabh Jain)
Contents
Equity 4-7
Derivatives 8-9
Commodity 10-13
Currency 14
IPO 15
Fixed Deposit 16
Mutual Fund 17-18
EDITORIAL STAFF
Editor Saurabh Jain
Executive Editor Jagannadham Thunuguntla
+Editorial Team
Dr. R.P. Singh Nitin Murarka
Vandana Bharti Tejas Seth
Sandeep Joon Dinesh Joshi
Vineet Sood Shitij Gandhi
Dhirender Singh Bisht Subhranil Dey
Parminder Chauhan Ajay Lakra
Mudit Goyal
Content Editor Kamla Devi
Graphic Designer Pramod Chhimwal
REGISTERED OFFICES:
11 / 6B, Shanti Chamber, Pusa Road, New Delhi 110005.
Tel: 91-11-30111000, Fax: 91-11-25754365
MUMBAI OFFICE:
Dheeraj Sagar, 1st Floor, Opp. Goregaon sports Club, Link Road
Malad (West), Mumbai 400064
Tel: 91-22-67341600, Fax: 91-22-28805606
KOLKATA OFFICE:
18,Rabindra Sarani, Poddar Court, Gate No-4, 4th & 5th Floor,
Kolkata-700001
Tel : 91-33-39847000/39801300, Fax No : 91-33-39847004
AHMEDABAD OFFICE :
10/A, 4th Floor, Kalapurnam Building, Near Municipal Market,
C G Road, Ahmedabad-380009, Gujarat
Tel : 91-79-26424801 - 05, 40049801 - 03
CHENNAI OFFICE:
2nd Floor, Mookambika Complex, 4, Lady Desikachari Road,
Mylapore, Chennai-600004
Tel: 91- 44 - 39109100 Fax: 91- 44 - 39109111
SECUNDERABAD OFFICE:
206, 3rd Floor, above CMR Exclusive, Bhuvana Towers, S.D.Road,
Secunderabad - 500003
Tel: 91-40-30780298/99, 39109536
DUBAI OFFICE:
312, Belshalat Building, Al Karama, Dubai, P.O. Box 117210, U.A.E.
Tel: 97143963120, Mobile : 971502612483
Fax : 9714 3963122
Email ID : [email protected]
Printed and Published on behalf of
Mr. Saurabh Jain @ Publication Address
11/6B, Shanti Chamber, Pusa Road, New Delhi-110005
Website: www.smcindiaonline.com
Investor Grievance : [email protected]
Printed at: KOZMIC STYLE OFFSET
D-137, Okhla Industrial Area, Phase-I, New Delhi - 110020 (India)
Ph.: +91-11- 46251190, Email: [email protected]
n the week gone by the global stock market largely traded on a positive note due to
fall in commodity prices and the continuation of monetary stimulus by the major Icountries. The Bank of Japan in its monetary policy meeting indicated that
inflation would rise to its target of 2% in the next two years as a result of its massive
stimulus. Japanese stocks are seeing a phase of consolidation after seeing a multi-
year high on the optimism of a sharp recovery after a huge monetary stimulus and a
sharp deceleration in Yen. It can be said that in a short run Japanese markets just went
ahead of themselves reflecting future growth and corporate earnings. Chinese stock
market remained on a weaker note mirroring the lowering economic growth
trajectory and it is perceived that the economic growth will remain lower as the
government is focusing more on restructuring the economy.
Back at home, Indian stock markets have witnessed a renewed buying interest by the
investors in the last two weeks as the optimism rose that the country's major concern
pertaining to the widening Current Account Deficit (CAD) and fiscal deficit would be
addressed on the back of huge drop in crude and gold prices. Our markets also seem to
have priced in a cut in the Repo rate by 25 bps to 7.25% in the ensuing Reserve Bank of
India (RBI) monetary policy review meeting on 3rd May 2013. The Central Statistics
Office (CSO) has projected a 5% growth for 2012-13, significantly below the RBI trend
level and even lower than its projection of 5.5%. Given the drop in the headline
inflation to sub-6% levels along with moderation in the commodity prices particularly
crude and gold, RBI may opt to cut interest rate as lower interest rates plays a critical
role in reviving the investment demand, which is crucial for reviving growth. The
Government in its effort to revive growth to a higher trajectory recently cleared 25 of
the 31 oil and gas blocks that were held up for various reasons. The Prime Minister
Economic review for the current fiscal has estimated normal monsoon this year and
has given a forecast of growth and inflation at 6.4% and 6% respectively.
On the commodities front, the smart gains being witnessed in the past week in the
bullions counter are short covering as the prices have fallen off the cliff very sharply.
But in the near term the expectation of the euro zone nations to use their gold
reserves to repay their debt and the speculation about to the quantitative easing in US
coming to an end will affect the overall sentiments. Recently, the U.S. economic
growth likely rebounded in the first quarter after almost stalling at the end of 2012 as
Americans shrugged off higher taxes and stepped up spending, but the trend is likely
temporary. Crude oil will be affected by the global recovery and tensions in the Middle
East. This week various economic indicators such as the Euro zone CPI, unemployment
rate and interest rate meeting will be closely watched by the investors. Moreover the
FOMC meeting on Tuesday and Chinese manufacturing PMI data will have big impact on
the metal and energy price movements. In agro pack, bearishness may persist in
sugar as the country has a higher production of about 240-245 lakh tonnes and imports
of over 10 lakh tonnes while the local demand is about 225-230 lakh tonnes.
From The Desk Of Editor

4
NOTES:
1) These levels should not be confused with the daily trend sheet, which is sent every morning by e-mail in the name of "Morning Mantra ".
2) S1 & S2 indicate first support & second support respectively & R1 & R2 indicate first resistance and second resistance respectively.
3) Sometimes you will find the stop loss to be too far but if we change the stop loss once, we will find more strength coming into the stock. At the moment, the stop loss will be far as we are seeing the graphs on weekly basis and taking a long-term view and not a short-term view.
TREND SHEET
STOCKS CLOSING TREND DATE RATE S1 R1 S2 R2 CL.
PRICE TREND TREND S/L
CHANGEDCHANGED
SENSEX 19407 DOWN 26.03.13 18705 19300 19500 19730
S&P NIFTY 5916 DOWN 26.03.13 5642 5850 5900 5950
CNX IT 6060 DOWN 17.04.13 6236 6600 6900 7000
CNX BANK 12727 UP 25.04.13 12727 12000 11800 11500
ACC 1255 DOWN 17.01.13 1359 1230 1260 1300
BHARTIAIRTEL 304 DOWN 14.02.13 311 300 310 320
BHEL 193 DOWN 01.11.12 227 195 205 210
CIPLA 407 UP 11.04.13 406 385 375 370
DLF 242 DOWN 21.03.13 239 255 260 265
HINDALCO 98 DOWN 07.02.13 113 100 105 110
ICICI BANK 1177 UP 25.04.13 1177 1120 1090 1060
INFOSYS 2228 DOWN 17.04.13 2284 2475 2650 2700
ITC 320 UP 04.03.11 172 300 290 285
L&T 1519 UP 25.04.13 1519 1450 1420 1400
MARUTI 1591 UP 17.04.13 1494 1500 1450 1400
NTPC 155 DOWN 13.12.12 151 - 150 - 155 160
ONGC 327 UP 17.04.13 329 315 300 295
RELIANCE 820 DOWN 28.02.13 814 840 860 870
TATASTEEL 313 DOWN 07.02.13 390 340 350 360
NEWS
MEETING DATE SYMBOL PURPOSE
29-Apr-13 STER Results/Dividend
29-Apr-13 HINDUNILVR Results/Dividend
29-Apr-13 KPIT Results/Dividend
29-Apr-13 INGVYSYABK Results/Dividend
29-Apr-13 HEXAWARE Results/Dividend
29-Apr-13 EXIDEIND Results/Dividend
30-Apr-13 TVSMOTOR Results/Dividend
30-Apr-13 PETRONET Results/Dividend
30-Apr-13 TAJGVK Results/Dividend
30-Apr-13 MARICO Results/Dividend
30-Apr-13 DABUR Results/Dividend
30-Apr-13 CHAMBLFERT Results/Dividend
30-Apr-13 GODREJCP Results/Dividend
1-May-13 IDFC Results/Dividend
2-May-13 ORIENTBANK Results/Dividend
2-May-13 SYNDIBANK Results/Dividend
2-May-13 KOTAKBANK Results/Dividend
2-May-13 BHARTIARTL Results
2-May-13 ANDHRABANK Results/Dividend
2-May-13 CANBK Results/Dividend
3-May-13 ACC Results
3-May-13 TITAN Results/Dividend
3-May-13 AMBUJACEM Results
4-May-13 GRASIM Results/Dividend
6-May-13 ADANIPORTS Results
FORTHCOMING EVENTS
DOMESTIC NEWS
Healthcare
·Fortis Healthcare plans to open three new hospitals in the next one year, including two new hospitals at Ludhiana and one in Chennai.
Pharmaceuticals
·Lupin expects its sales to continue growing at around 25% globally, for the next three years with contributions coming from all the markets where it is present.
Aviation
·Jet Airways (India) and Etihad Airways have forged strategic alliance under FDI policy of Government of India (GoI). Etihad Airways of the United Arab Emirates has agreed to subscribe for 27,263,372 new shares in Jet Airways at a price of ̀ 754.74 per share.
Oil & Gas
·Petronet LNG has executed a preliminary conditional agreement with United LNG (a US based firm) for supply of around 4 MMTPA of LNG for supply for 20 years through the main pass energy hub, which is been jointly developed by United LNG and Freeport McMoRan Energy. The binding LNG SPA is yet to be executed and is expected by the end of this year.
Retail
·Shoppers Stop has announced that company's 51% subsidiary company - Hypercity Retail (India) has opened its third store in Bangalore. With the opening of this store, there are now 13 'Hypercity' stores.
Capital Goods
·ABB said it will acquire US-based solar energy company Power-One for over $1 billion (around `5,400 crore) to become a global leader in solar photo-
voltaic inverters.
Realty/ Construction
·IL&FS Engineering and Construction Company Ltd has received a letter of Intent (LoI) from IPTF, Fujairah, FZC for oil pipeline work at Port of Fujairah for an amount of ̀ 71.4 crore.
INTERNATIONAL NEWS
·US durable goods orders tumbled by 5.7 percent in March following a revised 4.3 percent increase in February. Economists had expected orders to drop by 2.8 percent compared to the 5.6 percent increase that had been reported for the previous month.
·US new home sales rose 1.5 percent to an annual rate of 417,000 in March from the February rate of 411,000. Economists had expected sale to climb to an annual rate of 419,000.
·According to a report released Monday by the National Association of Realtors (NAR), NAR said US existing home sales fell 0.6 percent to an annual rate of 4.92 million in March after inching up by 0.2 percent to a downwardly revised 4.95 million in February.
·US leading economic index edged down by 0.1 percent in March following a 0.5 percent increase in February. Economists had expected the index to increase by 0.3 percent. Ken Goldstein, an economist at the Conference Board, said, "Data for March reflect an economy that has lost some steam."
·US initial jobless claims fell to 339,000, a decrease of 16,000 from the previous week's revised figure of 355,000. Economists had expected jobless claims to show a more modest decrease, dipping to 350,000 from the 352,000 originally reported for the previous week.
·According to data from the State Administration of Foreign Exchange, China's capital and financial account surplus surged to $101.8 billion in the first quarter, reflecting huge inflow of capital from developed nations. The surplus figure compares with a $20 billion surplus in the fourth quarter of 2012 and $56.1 billion in the same period of last year.
·Consumer prices in Japan posted the sharpest decline in two years in March, suggesting that the central bank is still way far from its target of attaining 2 percent inflation. The core consumer price index, that excludes fresh food, fell 0.5 percent year-on-year in March. This marked the fifth straight monthly fall in prices and was faster than a 0.4 percent decline expected.
·Hong Kong's exports bounced back at a stronger-than-expected pace in March, the latest figures from the Census and Statistics Department. Exports increased 11.2 percent over a year earlier to HK$291.7 billion in March. This comes after a 16.9 percent decrease in February. Economists had forecast a growth of 9.3 percent.
®
5
BSE SENSEX GAINERS & LOSERS TOP (% Change) NSE NIFTY GAINERS TOP & LOSERS (% Change)
SECTORAL INDICES (% Change)
SMC Trend
SMC Trend
FMCGHealthcare
FTSE 100CAC 40
Auto BankRealty
Cap GoodsCons Durable
Oil & GasPower
NasdaqDow jonesS&P 500
NikkeiStrait times
Hang SengShanghai
INSTITUTIONAL ACTIVITY (Equity) (` Crore)
ITMetal
Down SidewaysUp
SMC Trend
Nifty BSE Midcap Nifty JuniorSensex BSE Smallcap S&P CNX 500
GLOBAL INDICES (% Change)
INDIAN INDICES (% Change)
®
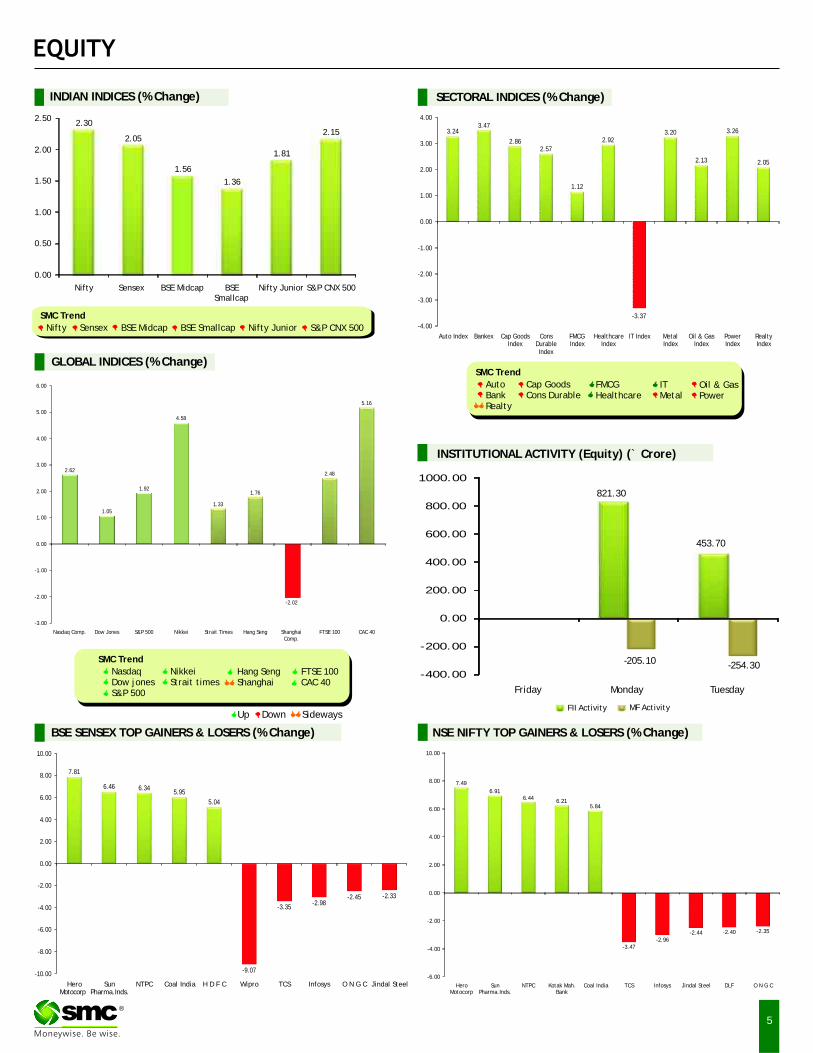
821.30
453.70
-205.10 -254.30-400.00
-200.00
0.00
200.00
400.00
600.00
800.00
1000.00
Friday Monday Tuesday
FII Activity MF Activity
7.81
6.46 6.345.95
5.04
-9.07
-3.35-2.98
-2.45 -2.33
-10.00
-8.00
-6.00
-4.00
-2.00
0.00
2.00
4.00
6.00
8.00
10.00
Hero Motocorp
Sun Pharma.Inds.
NTPC Coal India H D F C Wipro TCS Infosys O N G C Jindal Steel
7.49
6.916.44
6.215.84
-3.47-2.96
-2.44 -2.40 -2.35
-6.00
-4.00
-2.00
0.00
2.00
4.00
6.00
8.00
10.00
Hero Motocorp
Sun Pharma.Inds.
NTPC Kotak Mah. Bank
Coal India TCS Infosys Jindal Steel DLF O N G C
2.30
2.05
1.56
1.36
1.81
2.15
0.00
0.50
1.00
1.50
2.00
2.50
Nifty Sensex BSE Midcap BSE Smallcap
Nifty Junior S&P CNX 500
-3.37
3.243.47
2.862.57
1.12
2.923.20
2.13
3.26
2.05
-4.00
-3.00
-2.00
-1.00
0.00
1.00
2.00
3.00
4.00
Auto Index Bankex Cap Goods Index
Cons Durable Index
FMCG Index
Healthcare Index
IT Index Metal Index
Oil & Gas Index
Power Index
Realty Index
2.62
1.05
1.92
4.58
1.33
1.76
-2.02
2.48
5.16
-3.00
-2.00
-1.00
0.00
1.00
2.00
3.00
4.00
5.00
6.00
Nasdaq Comp. Dow Jones S&P 500 Nikkei Strait Times Hang Seng Shanghai Comp.
FTSE 100 CAC 40

Above calls are recommended with a time horizon of 1 year.
Beat the street - Fundamental Analysis
6®
Face Value (`) 2.00
52 Week High/Low 144.10 / 105.00
M.Cap (` Cr.) 6013.49
EPS (`) 17.28
P/E Ratio (times) 7.65
P/B Ratio (times) 1.29
Stock Exchange BSE
VALUE PARAMETERS
% OF SHARE HOLDING
UNITED PHOSPHOROUS LIMITED CMP: 132.15 Upside: 23%Target Price: 163
Investment Rationale Ankleshwar to scale up new formulation
compositions and processes and for making larger ·The management of the company expects that the quantities of formulations for field trials.revenue of the company will grow by 12% - 15%
and margin by 100 bps in FY14. The management ·During the year ended March 2013, the domestic
is also hopeful of positive market condition in revenue contribution of the company stood at 19%
FY14 across the world and has the firm believe while revenue from the international market
that India too will improve along with world stood at 81%. North America account for 20% of
economy. It has the capex of around `400 – 450 the total revenue, revenue contribution from the
crore for FY14. Europe is 18%, Latin America account for 27% of
the total revenue and revenue from rest of the ·According to the management the global market world is 12% of the total revenue.has grown by 6% - 7% in 2012. There has been
significant volume growth in number of regions ·For whole of FY13, the OPM was almost stagnant
and some modest price hike. at 18.1%. However during the quarter ended
March 2013, the OPM was up by 65 bps to 19% due ·The company's inventory days has come down to fall in raw material cost by 101 bps to 51.43% from 87 days to 84 days, receivables from 116 days and employee cost by 76 bps to 8.15% as to 109 days and net working capital from 113 days percentage of net sales.to 89 days. Payable has improved from 90 to 103
Valuationdays. The management expects all these days to
remain in between 90 to 100 days.
·The company has acquired 100% stake in SD
Agchem Europe, a subsidiary of Punjab Chemicals
and Crop Protection (Punjab Chemicals). The
acquired company has good market reach in
Europe and has interesting range of products with
good number of products on field trial too. The
company intends to leverage these strengths of
the acquired company to penetrate deeper in
European market.
·The company has set up new pilot plant at
` in cr
Particular Mar 2012 Mar 2013E Mar 2014E
Revenue 9,010.22 9,623.02 10,681.65
EBITDA 1,661.83 1,726.82 1,927.17
EBIT 1,308.11 1,379.14 1,480.14
Pre-Tax Profit 943.88 1,058.44 1,238.02
Net Profit 774.60 814.23 945.58
EPS 17.12 18.14 20.62
BVPS 110.24 120.49 137.90
ROE 18.37 15.97 16.15
P/BV Chart
Face Value (`) 10.00
52 Week High/Low 392.20/253.80
M.Cap (` Cr.) 20123.54
EPS (`) 49.43
P/E Ratio (times) 6.83
P/B Ratio (times) 0.98
Stock Exchange BSE
` in cr
Particular Mar 2012 Mar 2013E Mar 2014E
Net Total Income 11,634.61 12,661.11 14,746.60
Pre-Tax Profit 3,577.52 3,743.95 4,842.76
Net Profit 2,677.52 2,882.79 3,515.49
EPS(GAAP) 48.98 50.15 60.38
BVPS 364.58 389.08 434.51
ROE 14.00 13.23 14.30
VALUE PARAMETERS
% OF SHARE HOLDING
Investment Rationale the economic situation improves.
·The business of the bank increased 16% YoY to ·The bank has restructured `2206.2 crore of `629473 crore at end December 2012, showing advances during the quarter ended December improvement in growth from 15% at end 2012, while the reductions were lower at ̀ 1922.6 September 2012. Deposits increased 14% to crore pushing up the net outstanding restructured `349117 crore, while advances moved up 20% to assets book to ̀ 18135.8 crore (6.47% of advances) `280356 crore at end December 2012. at end December 2012 from ̀ 17852.2 crore (6.86%
of advances) at end September 2012. ·The Current Account Savings Account (CASA) ratio improved to 33.8% at end December 2012 up from ·The Capital Adequacy ratio stood at 10.59% with 32.8% at end September 2012 and 32.4% at end Tier I of 7.64% at end of December 2012. December 2011. · The Provision coverage ratio was nearly steady at
·The Net Interest Margin (NIM) is stood at 2.36% in 60.74% at end of December 2012 compared to Q3FY2013. The bank expects the domestic NIM to 60.87% a year ago and 60.96% a quarter ago. be maintained between 2.9%-3.0% for FY13 and Valuationforeign NIM at 1.25%, yielding the global NIM at Considering the improving prospects, consistent growth 2.6% for FY2013. in earnings is expected. The bank continues to deliver
·The Gross Non-Performing Assets (NPA) increased healthy performance on the business growth and NIM. On 35% YoY, while declined 3% QoQ to `8625.1 crore, the estimated book value of `434.51 for FY14E and two while the Net NPA advanced 33% YoY and 4% QoQ to year average P/BV of 1.02x, we expect the stock to see a `5455.48 crore at end December 2012. The %GNPA price target of 443 in one year time frame. eased to 3.08% at end December 2012 compared to 3.42% at end September 2012 and 2.74% at end December 2011. The %NNPA was higher at 1.97% at end December 2012 against 1.78% at end December 2011, while declined from 2.04% a quarter ago.
·The total slippages from the restructured book to NPA increased to `4175.8 crore (constituting 18.7% of the total restructured assets) at end December 2012 from ̀ 3630.3 crore (16.95% of the total restructured assets) at end September 2012. The bank expects the slippage from the restructured book to decline to around 12% after
P/E Chart
BANK OF INDIA CMP: 337.70 Upside: 31%Target Price: 443
Source: Company Website Reuters Capitaline

Charts by Spider Software India Ltd
7
The stock closed at ̀ 191.60 on 25th April 2013. It made a 52-week low at ̀ 100.10
on 27th July 2012 and a 52-week high at ̀ 204.90 on 07th January 2013. The 200
days Exponential Moving Average (EMA) of the stock on the weekly chart is
currently at ̀ 145.78.
As we can see on the charts there is a V shaped recovery in this particular scrip,
which shows that it has a tendency to keep its uptrend intact. It is almost near to
its weekly resistance of 200 levels but looking at the increase in volumes and
price we anticipate that it may overcome its resistance levels and reach our
desired targets. One can Buy in the range of 184-187 levels with closing below
stop loss of 175 levels for the target of 200-205 levels.
EQUITY
Above calls are recommended with a time horizon of 1-2 months
The stock closed at ̀ 298.40 on 25th April 2013. It made a 52-week low at ̀ 267.70
on 28th March 2013 and a 52-week high of ̀ 367 on 17th September 2012. The 200
days Exponential Moving Average (EMA) of the stock on the weekly chart is
currently at ̀ 299.20.
After a marginal fall, it took support at 269 levels and rebounded further. Last
week it was successful in closing above its 200 EMA which is an indication that
the buyers are in strong hold to keep the northward moment intact in the near
term. One can Buy in the range of 294-296 levels with closing below stop loss of
286 levels for the target of 310-315 levels.
The stock closed at ̀ 330.85 on 25th April 2013. It made a 52-week low at ̀ 142.10
on 18st May 2012 and a 52-week high at ̀ 340.90 on 04th December 2012. The 200
days Exponential Moving Average (EMA) of the stock on the weekly chart is
currently at ̀ 183.80.
In last two months there was aggressive buying in this particular scrip due to
which it is almost near to its all time high, 379 levels. Right now it has paused
near its 52 week high of around 341 levels but it is anticipated that it will
continue its upward trend with marginal retracements. One can Buy in the range
of 323-327 levels with closing below stop loss of 304 levels for the target of 360-
365 levels.
AURO PHARMA
PVR CINEMAS
CAIRN INDIA
®

DERIVATIVES
BASIS GAP IN NIFTY
ABIRLANUVO (MAY FUTURE)
Buy: Around 1025
Target:
Stop loss: 1015
`
`1045
`
LICHSGFIN ( FUTURE)
Buy: Around 248
Target: `254
Stop loss: `245
MAY
`
LT
Buy 1550 CALL 53.00
Sell 1600 CALL 33.00
Lot size: 250
BEP: 1570.00
Max. Profit: 7500.00 (30.00*250)
Max. Loss: 5000.00 (20.00*250)
MAY
MAY
`
`
OPTIONSTRATEGY
FUTURESTRATEGY
HDFCBANKBuy MAY 700 CALL 19.00Buy 680 PUT 13.00
Lot size: 500Upside BEP: 732.00Downside BEP: 648.00Max. Profit: UnlimitedMax. Loss: 16000.00 (32.00*500)
MAY
`
DLF ( FUTURE)
Sell: Below 236
Target: 230
Stop loss: 239
MAY
`
`
`
Nifty May future closed with the rollover of more than 65%, which is better than the last three month averages. The overall market cost-of-carry ended
positive. Nifty future closed at a premium of 20 points indicating long carry forward. In April expiry, both derivative volume and open interest increased
indicating return of interest in the market which could give some clear direction to the May expiry. Nifty is expected to remain in the range of 5700-6000 levels
this week with the positive bias. The options concentration continues to be at 5700-strike put option with an open interest of above 45 lakh shares. This is
followed by the 5900-strike call option with above 46 lakh shares. Above discussed option data indicates put writing at 5700 strikes and call writing at 5900
strike. The put-call ratio of open interest increased and closed at 1.18 levels. The Implied Volatility (IV) of call options closed lower 13.80% while the average IV
of put options ended at 14.12%. Nifty VIX has dropped and is expected to remain range bound in the short term. Nifty VIX decreased to 13.96% from 16.00%.
WEEKLY VIEW OF THE MARKET
NIFTY TOTAL OPEN INTEREST (in share)
FIIs ACTIVITY IN F&O IN LAST TEN SESSIONS
(Derivative segment) `(Cr)
FIIs ACTIVITY IN F&O IN LAST WEEK
(Derivative segment)
BHARTIARTL
Buy 330 CALL 9.55
Sell 340 CALL 6.05
Lot size: 1000
BEP: 333.50
Max. Profit: 6500.00 (6.50*1000)
Max. Loss: 3500.00 (3.50*1000)
MAY
MAY
`
`
VOLATILITY STRATEGY BULLISH STRATEGY
DERIVATIVE STRATEGIES
®
467350740800
11662501344750
2696000
3486250
4166900
3329050
2422750
1607950 15071001302300
3319000
4053350
3528200
4565150 4866400
2920900
1115750
417800707800
184150
0
1000000
2000000
3000000
4000000
5000000
6000000
5300 5400 5500 5600 5700 5800 5900 6000 6100 6200 6300
Call Put
-2
-1
0
1
2
3
4
5
6
7
8
09-Apr 10-Apr 11-Apr 12-Apr 15-Apr 16-Apr 17-Apr 18-Apr 22-Apr 23-Apr 25-Apr
95.07
2163.38
-859.72
106.38
1948.11
647.98
1274.65 1272.66
545.25
3672.63
-1500.00
-1000.00
-500.00
0.00
500.00
1000.00
1500.00
2000.00
2500.00
3000.00
3500.00
4000.00
10-Apr 11-Apr 12-Apr 15-Apr 16-Apr 17-Apr 18-Apr 22-Apr 23-Apr 25-Apr
BUY51.2%
SELL48.8%
8

9
BHARTIARTL 6887000 4804000 -30.25 2.18 1.05 -1.13 35.88 36.32 0.44
DLF 12544000 13774000 9.81 0.88 0.37 -0.51 41.68 43.86 2.18
HINDALCO 27016000 28148000 4.19 0.62 0.60 -0.02 33.72 35.30 1.58
HINDUNILVR 6126500 5725500 -6.55 0.94 1.16 0.22 24.18 28.31 4.13
ICICIBANK 8603250 4772500 -44.53 1.02 0.66 -0.36 32.56 37.89 5.33
IDEA 10536000 10172000 -3.45 0.91 0.37 -0.54 37.41 35.85 -1.56
INFY 3317750 3216000 -3.07 0.46 0.34 -0.12 24.34 25.11 0.77
ITC 19227000 11707000 -39.11 0.89 0.56 -0.33 24.84 22.25 -2.59
JPASSOCIAT 46328000 44296000 -4.39 1.27 0.57 -0.70 47.07 48.70 1.63
NTPC 11296000 8624000 -23.65 0.23 0.51 0.28 21.47 30.49 9.02
ONGC 8717000 6475000 -25.72 1.11 0.47 -0.64 30.93 23.91 -7.02
RANBAXY 3214000 2841000 -11.61 0.67 0.46 -0.21 26.56 26.87 0.31
RCOM 39900000 37204000 -6.76 0.99 0.80 -0.19 68.92 62.81 -6.11
RELIANCE 7825500 7746000 -1.02 0.68 0.51 -0.17 27.15 22.70 -4.45
NIFTY 17589700 15017650 -14.62 1.34 1.18 -0.16 13.47 14.12 0.65
SAIL 14076000 12788000 -9.15 0.44 0.36 -0.08 41.86 47.07 5.21
SBIN 4475750 3744750 -16.33 1.49 0.61 -0.88 33.42 34.86 1.44
TATASTEEL 18665000 15667000 -16.06 0.39 0.76 0.37 35.00 31.19 -3.81
UNITECH 50080000 52780000 5.39 0.59 0.39 -0.20 59.18 59.67 0.49
IMPORTANT INDICATORS OF NIFTY AND OTHER ACTIVE FUTURE CONTRACTS
OPEN INTEREST PCR RATIO IMPLIED VOLATILITY
SCRIPTS PREV.* CURRENT ** % PREV.* CURRENT ** PREV. CURRENT WEEK WEEK CHANGE WEEK WEEK CHANGE WEEK WEEK CHANGE
DERIVATIVES
Put Call Ratio Analysis : The Put-Call open interest ratio of Nifty has decreased
to 1.18 from 1.34. At the end of the week, the maximum stocks had a negative of
change in put call open interest ratio.
Implied Volatility Analysis : The Implied Volatility (IV) for Nifty futures this week
has increased to 14.12% from 13.47%. The IV of the stock futures has changed this
week ranging from -7.02% to 9.02%.
Open Interest Analysis : The open interest for the index at the end of this week
has decreased by 14.62% as compared to the previous week. All future stocks saw
changes in their open interest ranging from -44.53% to 9.81%. ICICIBANK has the
maximum decrease in open interest as compared to other stocks.
Statistical Analysis·
Open 5719.90 High 5924.35
Low 5685.45 Close 5916.30
NIFTY & IV CHART NIFTY ANALYSIS
®
13
14
15
16
17
5700
5800
5900
6000
6100
18-Apr 22-Apr 23-Apr 25-Apr
Nifty Close IV
Apr. Series May Series

10®
Turmeric futures (May) will possibly make an attempt to breach 6400 levels. A lack of export orders from the Northern pockets due to the onset of summer & the increasing availability at the spot markets, may add to the bearish sentiments. The exporters and local traders are buying limited stocks to fulfill their old commitments. Jeera futures (May) is expected to fall below 12800 levels on the prospects of a higher supply & a good output this season. The production scenario in Syria is not clear due to the civil war in the country. Meanwhile, there are reports that the yield in Turkey may be normal and output might be around 8,000-10,000 tonnes. Pepper futures (May) is expected to consolidate in a thin range between 35600-34800 levels. Weak demand at spot as well as international markets may keep the counter in bearish zone. There are reports that during the first quarter of 2013 India could manage to export only 5000 MT and that too with the help of 2000 MT imported from Vietnam alone. Cardamom futures (May) is likely to trade in the range of 740-810 levels. Factors such as heavy arrivals at the auctions & inflow of inferior quality may keep the upside capped. Chilli futures may trade with a bearish bias owing to lack of sufficient fresh buying. Meanwhile, new red chilli stock in cold storage around Guntur is around 55 lakh bags and 14 lakh bags is stored in other storages.
SPICES
Soybean futures (May) is likely to maintain its bullish trend supported by the depreciation in rupee. Inquiries from countries such as Iran, Japan and other South-East Asian countries are ongoing, which continue to lend support the India meal prices. Preference for non-GMO meal, trade and logistic advantages will further remain supportive for the Indian meal. In days to come, market participants would be eyeing to crucial resistance at 4150 levels. On the international market, U.S soybean futures (May) will continue to witness consolidation within the range of 1400-1440 levels. Meanwhile, market participants are on alert for further old-crop soybean cancellations with more than 2.5 million tonnes of 2012/13 sales yet to be shipped. USDA reported 281,500 tonnes in old-crop cancellations by China last week. On the other hand, CME Group declared force majeure at terminals on the Illinois River, allowing a delay of contracted corn and soybean deliveries, as flooding halted barge loading. Mustard futures (May) might continue to manage to take support above 3450 levels. However, the upside may remain limited near 3580 levels, as there is an adequate stock of mustard seeds with millers. Moreover, with the onset of summer in the country, the physical demand for mustard oil has remained slack. CPO futures are expected to trade range bound with downside getting restricted. The positive sentiments on the Malaysian market on the back of encouraging export data may cushion the domestic prices.
OIL AND OILSEEDS
OTHER COMMODITIES
The downside trend may continue in sugar futures on slack demand and ample availability of the sweetener. The current month contract (May) is likely to trade in the range of 2970-2840 levels. The sugar recoveries, in the current season, in Western & Central Uttar Pradesh have been reported higher as compared to the last year. In other parts of the country, this year the sugarcane crushing season is coming o an end. On the international bourse, sugar prices are near to the lowest level since July 2010. There are reports that Brazil will report a record crop this year, leading to a huge global surplus. Wheat futures (May) is expected to consolidate in the range of 1450-1530 levels. The downside may remain capped as the stockists are buying aggressively and the farmers are also holding some crop in the anticipation of higher prices. Procurement of wheat by Government agencies has picked up as arrivals have gained momentum in states such as Punjab and Haryana. On the contrary, according to the FCI, exports are feasible as global prices are firming up. Inventories pile up at the granaries stood at 24.2 MT as on April 1, and by June 1, the stocks are expected to rise to 62 MT. A weak tone might continue to prevail over cotton futures on the back of weak export and domestic demand. The announcement of offloading from China's state reserve, the Cotton Corporation of India is likely to keep a lid on any short covering.
The base metals complex may remain in range on mixed fundamentals. Recently signs of slowing economic growth in China added to the concerns that the demand for industrial metals will decline. Red metal copper can trade in the range of 365-395. Smelters across Asia are charging the highest fees in five months to process copper concentrate, cashing in on the regional oversupply after India closed its top smelter over environmental concerns. Chinese buyers usually step up spot purchases in the first and second quarters, tightening the supply/demand balance and putting downward pressure on spot TC/RCs, but this year is different, partly due to the supply glut. The importers in China have paid spot premiums of about $115-$135 per tonne last week over cash LME copper prices, which is the highest since late 2011 for the metal in bonded warehouses in Shanghai and forward shipments due to arrive in the coming few weeks. Lead can trade in the range of 107-113. Nickel prices can trade in the range of 810-860 in MCX. Steel sector demand for nickel can give some support to the prices. Aluminum prices may move in the range of 100-106 levels while Zinc prices can hover in the range of 101-105 in MCX. Financing deals with zinc as collateral creates shortage of the metal in spot markets whereas a sign of slowdown in the global economic growth and the restriction of China on its property market will cap on the upside. Meanwhile as long as the aluminium industry stays in excess supply, aluminium forward curve will remain in contango thus encouraging inventory financing.
BASE METALS
The bullion counter is expected to trade on a volatile path as the recent short covering seen on the bourses can be short lived. This week investors will keenly eye the outcome of the FOMC meeting and the ECB meeting for the further direction. Gold may trade in the range of $1350-1500 at COMEX and 26000-27600 at MCX. White metal silver can also trade in a wide range of 43000-47000 in the near term. On the domestic bourses, some strength in the local currency can cap the recovery. Investors in gold backed Exchange Traded Funds (ETFs) deserted bullion in droves after the proposed disposal of Cyprus' gold holdings to help its bailout fanned fears that the other indebted central banks in Europe might do the same. Support for holding gold in a low interest rate environment has also been undermined by a brightening global economic backdrop and uncertainty over the future of the U.S. monetary policy stimulus. SPDR Gold Trust, the world's largest gold-backed exchange traded fund, holdings fell to nearly 1090 tonnes last week as its current holdings are at multi year lows. Premiums for gold bars in Hong Kong jumped to their highest level since October 2011 this week, at up to $3 an ounce to spot London prices, partly because of an increase in buying interest from China, the world's second-largest consumer after India. Gold was also supported by the prospects of more central bank buying after Russia and Turkey raised their gold reserves in March increasing their holdings ahead of a spectacular plunge in the prices this month.
BULLIONS
The Middle East tensions, euro zone crises and the FED meeting are the key factors to influence the direction of crude oil, which has bounced off sharply from its lows. Crude oil prices can trade in the range of 4800-5250 in MCX and $88-95 in NYMEX. Iran is ready to resume talks with world powers on its disputed nuclear programme and awaits word from the European Union on timing and details. Global spare oil inventories tightened over the last two months. The WTI and Brent spread narrowed down drastically from nearly $22 to below $10.This differential has narrowed amid the restoration of North Sea output, lower global demand estimates and diminished concern that the Middle East political tension will disrupt supplies. WTI has risen this year as expanded pipeline capacity helps relieve a glut at the nation's storage hub in Cushing, Oklahoma, the delivery point for New York-traded contracts. . The Organization of Petroleum Exporting Countries, which supplies about 40 percent of the world's oil, will boost exports by 0.3 percent to 23.61 million barrels a day in the four weeks to May 11 and will increase shipments by 60,000 barrels a day through the middle of May because of rising demand in Asia, according to 'Oil Movements', a tanker tracker. Natural gas may slip lower on mild weather conditions and can trade in the range of 220-233 in MCX. Commodity Weather Group LLC, a private weather forecaster, said that the mild weather across the U.S. over the next two weeks will limit the gas-fired heating demand and also keep the demand for air conditioning muted.
ENERGY COMPLEX

Closing as on 25.04.13
11
NOTES : 1) Buy / Sell 25% of Commodity at S1/R1 respectively & rest 75% at S2/R2 respectively.2) S1 & S2 indicate first support & second support & R1 & R 2 indicate first resistance & second resistance. 3) Sometimes you will find the stop loss to be too far but if we change the stop loss once, we will find more strength coming into the commodity. At the moment, the stop loss will be far as we are seeing the graphs on weekly
basis and taking a long-term view and not a short-term view.4) These levels should not be confused with the daily trend sheet, which is sent every morning by e-mail in the name of Daily report- commodities.
TECHNICAL RECOMMENDATIONS
EXCHANGE CONTRACT CLOSING DATE TREND
CHANGED
SOYABEAN (MAY) 4072.50 07.03.13 UP 3421.50 3700.00 - 3600.00 - 3500.00
JEERA (MAY) 12965.00 11.04.13 UP 13795.00 12000.00 - 11500.00 - 11000.00
PEPPER(MAY) 35250.00 27.03.13 SIDEWAYS - - - - - -
RED CHILLI (JUNE) 6328.00 17.04.13 DOWN 6362.00 - 7200.00 - 7600.00 8000.00
RM SEEDS (MAY) 3474.00 11.04.13 UP 3586.00 3200.00 - 3100.00 - 3000.00
MENTHA OIL (MAY) 955.70 21.03.13 DOWN 1141.30 - 1060.00 - 1100.00 1150.00
CARDAMOM (MAY) 785.00 28.02.13 DOWN 965.00 - 860.00 - 900.00 930.00
SILVER (MAY) 45174.00 20.12.12 DOWN 57351.00 - 46000.00 - 49000.00 49500.00
GOLD (JUNE ) 27041.00 14.02.13 DOWN 30463.00 - 27200.00 - 28000.00 28300.00
COPPER (JUNE) 393.05 20.12.12 DOWN 432.95 - 406.00 - 415.00 420.00
LEAD (MAY) 111.75 21.03.13 DOWN 118.45 - 112.00 - 115.00 118.00
ZINC (MAY) 104.55 21.03.13 DOWN 105.65 - 105.00 - 107.00 109.00
NICKEL(MAY) 840.40 21.02.13 DOWN 920.30 - 900.00 - 910.00 920.00
ALUMINUM(MAY) 105.10 21.02.13 DOWN 112.95 - 106.00 - 109.00 112.00
CRUDE OIL (MAY) 5059.00 25.04.13 SIDEWAYS - - - - - -
NATURAL GAS (MAY) 230.30 28.02.13 UP 191.10 216.00 - 210.00 - 204.00
TREND RATE TREND S1 R1 S2 R2 CLOSING
PRICE CHANGED STOP/LOSS*
TREND SHEET
COMMODITY
ALUMINIUM MCX (MAY) contract closed at `105.10 on 25th April '13. The contract made its high of
`106.45 on 28th March '13 and a low of ̀ 99.60 on 15th April '13. The 18-day Exponential Moving Average
of the commodity is currently at ̀ 103.90. On the daily chart, the commodity has Relative Strength Index (14-day) value of 52.35. One can Buy in
the range 104-103 with the stop loss of ̀ 101.50 for a target of ̀ 108.
NICKEL MCX (MAY) contract closed at ̀ 840.40 on 25th April '13. The contract made its high of ̀ 930.00 on
28th March '13 and a low of `819.00 on 20th April '13.The 18-day Exponential Moving Average of the
Commodity is currently at ̀ 855.
On the daily chart, the commodity has Relative Strength Index (14-day) value of 35. One can Buy in the
range 830-820 with the stop loss of ̀ 805 for target of ̀ 860.
SOYABEAN NCDEX (JUNE) contract closed at `3824.50 on 25th April '13.The contract made its high of
`4045.00 on 10th April '13 and a low of `3170.00 on 26th February '13.The 18-day Exponential Moving
Average of the Commodity is currently at ̀ 3794.
On the daily chart, the commodity has Relative Strength Index (14-day) value of 65.65. One can Buy in
the range 3940-3920 with the stop loss of ̀ 3890 for a target of ̀ 4050.
®
ALUMINIUM MCX (MAY)
NICKEL MCX (MAY)
SOYABEAN NCDEX (JUNE)

12
COMMODITY
NEWS DIGEST
The bullion counter has shown a sharp recovery after the last two weeks' selloff as the investors flocked to take advantage of the battered down prices at the lower levels. Gold headed for its best week since October 2011 as its demand rose after the worst slump in three decades. Silver was set for the best week since November. Lower prices increased the coin demand, which prompted lower level buying. Coin sales by the U.S. Mint were the highest since 2009 and Russia and Kazakhstan expanded gold reserves for sixth months in March. Crude oil also managed to bounce back from lows in the week gone by as the prices scaled higher after testing below ̀ 4700 recently in MCX while below $90 in NYMEX. A decline in greenback and a hope of global recovery supported the bullish sentiments. It was certainly the biggest weekly gain since June last year. Investors are very cautious over the tepid outlook for growth in the world's two largest oil consumers, the United States and China. Weak economic data from China and the euro zone have weighed on Brent, while better than expected U.S. data and the easing of a supply glut at Cushing, Oklahoma, the delivery point for U.S. crude futures, have buoyed the U.S. market. Natural gas managed to remain range bound on mixed fundamentals. Base metals complex also witnessed some lower level buying on bargain hunting. Copper has rebounded from one and a half year lows at LME and MCX on registering the biggest weekly gain since mid September of 2012. The most recent economic data has come on the heels of weak global manufacturing sector reports, which showed wobbly recoveries in the U.S. and Europe and cast doubts on the pace of revival in top metals consumer China.
On the agro commodities front, spice complex witnessed a combined effect of selling pressure & profit booking from higher levels. The upside in turmeric futures remain limited tracking subdued demand at spot markets. Lack of upcountry orders with the exporters curtailed fresh buying in the yellow spice. Jeera futures continued to face resistance as the market participants kept an eye on the inflow of fresh arrivals hitting the Rajasthan mandies. Even the domestic exporters' demand was seen limited. Bearish sentiments sustained over pepper futures. The unavailability of forward month contract on the national bourse has added a word of caution amongst the investors. In the international market, Vietnam maintained to be the world's top pepper exporter, according to the Vietnam Pepper Association. In the oilseeds complex, soybean futures rebounded, supported by lower level buying & a weaker rupee added to the bullish sentiments. CPO futures remained stable following steady Malaysian prices, after better than expected exports lured investors back to the futures market. On CBOT, soybean prices consolidated on concerns about slowed Chinese demand due to the ongoing bird flu situation. Cotton prices plunged as compared to the previous week on reports that the Cotton Corporation of India (CCI) would start offloading stocks in the domestic market. Chana prices witnessed a downfall owing to profit booking from higher levels & higher inflow of pulses in the spot markets.
WEEKLY COMMENTARY
WEEKLY STOCK POSITIONS IN WAREHOUSE (NCDEX)
COMMODITY UNIT 16.04.13 23.04.13 DIFFERENCE
QTY.
BARLEY MT 1793 7382 5589
CASTOR SEED MT 125024 131434 6410
CHANA MT 11383 22940 11557
CHILLI MT 9750 12947 3197
COTTONSEED OILCAKE MT 149860 151106 1246
MAIZE MT 2074 2074 0
RAPE MUSTARD SEED MT 17313 31636 14323
SOYA BEAN SEEDS MT 10372 10993 621
SUGAR M MT 18536 15161 -3375
WHEAT MT 3494 3494 0
COMMODITY UNIT 17.04.13 25.04.13 DIFFERENCE
QTY. QTY.
CARDAMOM MT 59.40 54.50 -4.90
COTTON BALES 156200.00 156200.00 0.00
GOLD KGS 439.00 339.00 -100.00
GOLD MINI KGS 174.10 64.00 -110.10
GOLD GUINEA KGS 275.97 270.80 -5.17
MENTHA OIL KGS 665183.75 616577.65 -48606.10
MILD STEEL MT 4165.95 3724.08 -441.87
SILVER (30 KG Bar) KGS 47536.42 37247.00 -10289.42
·The CME Group, parent of the NYMEX, recently
lowered initial margins for crude oil futures and
raised the same for iron ore futures.
·Japan's oil imports from Iran fell around 51
percent in March from a year ago.
·Operations at world No. 1 copper producer
Codelco's massive Chilean mines returned to
normal last week.
·Wheat procurement in Punjab reached 43.26 lakh
tonne in the ongoing rabi marketing season.
·India's sugar production in the current marketing
year reached 24.1 million tonnes as on April 15,
down 2% from 24.5 million tonnes in the same
period last year.
·The first quarter of 2013 saw Vietnam exporting
around 39,000 MT of the spice where as India could
manage only a meagre 5000 MT and that too with
the help of 2000 MT imported from Vietnam alone.
·India's pulses production in 2012-13 is estimated
17.7 million tonnes, up from last year's 17.1
million tonnes. Annual imports of pulses are
estimated at 30 lakh tonnes.
WEEKLY STOCK POSITIONS IN WAREHOUSE (MCX)
®
NCDEX TOP GAINERS & LOSERS (% Change) MCX TOP GAINERS & LOSERS (% Change)
7.52
6.56
5.23 5.044.64
-5.81
-4.42 -4.37
-2.77 -2.61
-8.00
-6.00
-4.00
-2.00
0.00
2.00
4.00
6.00
8.00
10.00
SHANKAR KAPAS
CRUDE OIL GOLD NEW SOYABEAN SILVER NEW
TURMERIC COTTON SD O.C (AKL)
CHANA JEERALONG
6.15 5.96
4.38
3.473.01
-4.26-3.84
-3.00-2.53 -2.34
-6.00
-4.00
-2.00
0.00
2.00
4.00
6.00
8.00
CRUDE OIL GOLD M SILVER LEAD ALMOND KAPASKHALI NATURAL GAS
SUGAR M (KOL)
STEEL RPR COTTON

PULSE………. Strong Protein Sources For Vegetarian
13
SPOT PRICES (% change)
COMMODITY
WEEKLY STOCK POSITIONS IN LME (IN TONNES)
COMMODITY STOCK POSITION STOCK POSITION DIFFERENCE
17.04.13 25.04.13
ALUMINIUM 5199000 5167075 -31925
COPPER 611925 620375 8450
NICKEL 168594 175860 7266
LEAD 259675 258800 -875
ZINC 1127175 1092550 -34625
INTERNATIONAL COMMODITY PRICES
COMMODITY EXCHANGE CONTRACT UNIT 18.04.13 25.04.13 CHANGE (%)
Soya CBOT MAY Cent per Bushel 1430.50 1423.50 -0.49
Maize CBOT MAY Cent per Bushel 644.50 645.25 0.12
CPO BMD JUNE MYR per MT 2304.00 2322.00 0.78
Sugar LIFFE MAY 10 cents per MT 502.70 498.60 -0.82
COMMODITY EXCHANGE CONTRACT 18.04.13 25.04.13 CHANGE%
ALUMINIUM LME 3 MONTHS 1912.00 1941.00 1.52
COPPER LME 3 MONTHS 7088.00 7180.00 1.30
LEAD LME 3 MONTHS 2014.00 2076.50 3.10
NICKEL LME 3 MONTHS 15550.00 15415.00 -0.87
ZINC LME 3 MONTHS 1889.00 1936.00 2.49
GOLD COMEX JUNE 1392.50 1462.00 4.99
SILVER COMEX MAY 2324.50 2414.00 3.85
LIGHT CRUDE OIL NYMEX JUNE 88.00 93.64 6.41
NATURAL GAS NYMEX JUNE 4.43 4.20 -5.23
PRICES OF METALS IN LME/ COMEX/ NYMEX (in US $)
India is World's largest producer, consumer and importer of pulses. Pulses are an important constituent of the diets and strong protein sources for the predominantly vegetarian Indian population. Due to the increasing demand and purchasing power of Indian consumers, market prices of pulses in the last few years have been relatively high as compared to other food groups (despite increasing import volumes).
Production of pulses
India pulses accounts about 25 per cent of global production. According to 2nd Advance Estimates by MOA, The total production of pulses during 2012-13 is estimated at around 175.8 lakh tonnes, an increase of nearly 2.86 per cent over the 170.9 lakh tonnes in 2011-12. However, this is still lower than the 182.4 lakh tonnes of 2010-11.
According to 2nd Advance Estimates by MOA , tur production is pegged at 2.75 million tonnes, urad at 1.74 million tonnes and moong at 1.27 million tonnes. Chana harvest is pegged at 8.57 mt. Last year, chana output stood at 7.7 mt.
The Government of India has launched a special plan to boost output to 190 lakh tonnes during 2013-14 across 16 States. A number of initiatives have been taken in recent years to increase production of pulses, including raising MSP of main pulses crops significantly and special schemes to encourage farmers to adopt modern agronomic practices in pulses production.
Madhya Pradesh, Uttar Pradesh, Maharashtra, Andhra Pradesh, and Karnataka together account for over 70 percent of the country's total pulse production, with Madhya Pradesh alone contributing around 24 percent.
Consumption
Pulse consumption in India accounts about 27 per cent of global consumption. Assocham estimates India's pulses demand at 21 mt in 2012-13, which might go up to 21.42 mt in 2013-14 and 21.91 mt in 2014-15. According to a Working Group on the 12th Plan, the total demand for pulses is estimated at around 220 lakh tonnes compared with supply of between 180 and 210 lakh tones. So to bridge the demand-production mismatch India have to import pulses.
India's pulse imports
As per official data, India's pulse import rose by 23 per cent to 3.31 million tonnes worth $1,821.95 million in the year to march 2012. The country imported around 29 lakh tonnes of pulses during the first nine months (April-December) of 2012-13. India's annual imports of pulses in 2012-13 are estimated at about 30 lakh tonnes valued at over `9,000 crore. India's pulse imports in financial year 2010-11, are estimated approximately 2.75 million tonnes, down a fifth from the previous year's record 3.6 million tones on improved domestic production and lower domestic prices.
According to USDA, pulse imports in MY 2012/13 are estimated to increase to a record 4.0 million tonnes on continued strong domestic demand, and forecast to increase further in MY 2013/14 provided international prices and the value of Indian rupee remain stable. Imports consist mainly of yellow peas, arhar and chickpeas from countries such as Australia, Canada, Myanmar, Tanzania and the Mozambique.
India imports around 85 per cent of the pulses produced in Myanmar. In respect of Tur Dal, 95 to 98 per cent of the Myanmar production is imported into India. To keep a lid on prices of pulses, the Government has allowed duty-free import of pulses for the first time in June 2006. Government has extended the duty-free import until March 31, 2014.
®
-4.43
-3.41
-3.34
-2.90
-2.86
-2.65
-1.13
-1.00
-0.69
-0.56
-0.47
-0.34
-0.15
0.00
0.08
0.16
0.36
1.23
1.48
2.95
5.06
-6.00 -4.00 -2.00 0.00 2.00 4.00 6.00
MENTHA OIL (CHANDAUSI)
RAW JUTE (KOLKATA)
CHANA (DELHI)
CARDAMOM (VANDANMEDU)
TURMERIC (NIZAMABAD)
CORIANDER (KOTA)
MASOOR (INDORE)
RUBBER (KOCHI)
CRUDE PALM OIL (KANDLA)
MUSTARD (JAIPUR)
SILVER (DELHI)
JEERA (UNJHA)
PEPPER MALABAR GAR (KOCHI)
MILD STEEL INGOTS (GHAZIABAD)
WHEAT (DELHI)
GUR (MUZAFFARNGR.)
CHILLI (GUNTUR)
BARLEY (JAIPUR)
REFINED SOYA OIL (INDORE)
SOYABEAN (INDORE)
GOLD KG (MUMBAI)
Pulse production in India (in MT)
Source: MOA
6.4
4.694.2
7.12
6.06
7.12
5.48
8.36
9.8810.46
11.12 11.03 11.12
12.09
0
2
4
6
8
10
12
14
2007 -08 2008 -09 2009 -10 2010 -11 2011 -12 2012 -13 target
2010 -11 2nd adv. Est.
kharif Rabi

CURRENCY
Currency Table
Currency Pair Open High Low Close
USD/INR 53.99 54.44 53.93 54.20
EUR/INR 70.50 71.00 70.50 70.86
GBP/INR 82.50 83.72 82.22 83.72
JPY/INR 54.18 55.22 54.11 54.69
(Source: Thomson Reuters, Open: Friday (Prior) 9.00 AM IST, Close: Thursday 5.00 PM IST)
News Flows of last week
23rd Apr: Factory data a new sign of slowing U.S. economic growth
24th Apr: UK retail sales fell unexpectedly in April - CBI
24th Apr: Orders for long-lasting U.S. manufactured goods recorded their
biggest drop in seven months
25th Apr: Britain avoided recession with faster-than-expected growth
25th Apr: Fed balance sheet grew to record again in latest week
25th Apr: Jobless claims fell, labor market recovery advanced
USD/INR (MAY) contract closed at ̀ 54.43 on 25th April'13. The contract made its high of `54.71 on 23rd April'13 and a low of ̀ 54.22 on 23rd April'13 (Weekly Basis).The 14-day Exponential Moving Average of the USD/INR is currently at ̀ 54.67.
On the daily chart, the USD/INR has Relative Strength Index (14-day) value of 43.70. One can Buy above 54.75 for a target of 55.70 with the stop loss of 54.25.
EUR/INR (MAY) contract closed at ̀ 71.10 on 25th April. The contract made its high of ̀ 71.35 on 23rd April'13 and a low of ̀ 70.70 on 25th April'13 (Weekly Basis). The 14-day Exponential Moving Average of the EUR/INR is currently at ̀ 71.24.
On the daily chart, EUR/INR has Relative Strength Index (14-day) value of 43.84. One can Sell below 70.60 for a target of 69.60 with the stop loss of 71.10.
GBP/INR JPY/INR
JPY/INR (MAY) contract closed at `54.96 on 25th April'13. The contract made its
high of ̀ 55.51 on 23rdApril'13 and a low of ̀ 54.45 on 22ndApril'13 (Weekly Basis).
The 14-day Exponential Moving Average of the JPY/INR is currently at ̀ 55.79.
On the daily chart, JPY/INR has Relative Strength Index (14-day) value of 39.79.
One can Buy above 55.90 for a target of ̀ 56.90 with the stop loss of ̀ 55.40.
GBP/INR (MAY) contract closed at ̀ 84.01 on 25th April'13. The contract made its
high of ̀ 84.01 on 25th April'13 and a low of ̀ 82.66 on 22nd April'13 (Weekly Basis).
The 14-day Exponential Moving Average of the GBP/INR is currently at ̀ 83.60.
On the daily chart, GBP/INR has Relative Strength Index (14-day) value of 57.14.
One can Buy above 84.55 for a target of ̀ 85.50 with the stop loss of ̀ 84.00.
USD/INR EUR/INR
Market Stance
The week gone by remain subdued for the local currency as market traded in a
range bound manner. The rupee rose on Thursday, snapping two sessions of
losses, on hopes of renewed foreign fund inflows on the back of a buoyant
stock market, which gained for a fourth straight session. Foreign funds have
poured in over $500 million in equities in the last four sessions, according to
the latest data from the capital market regulator. The inflows will bring some
relief to the currency after they seemed to taper off in the early part of this
month. The rupee may also get some support from inflows related to the stake
sale by Jet Airways to Gulf carrier Etihad Airways. Moreover on the contrary,
rupee's gains were however kept in check by dollar demand from importers,
particularly oil, which normally picks up during month-end.
Economic gauge for the next week
Date Currency Event PREVIOUS
29th Apr EUR EUR German Consumer Price Index (YoY) 1.40%
29th Apr EUR EUR German Consumer Price Index - EU Harmonised (YoY) 1.80%
29th Apr USD USD Personal Consumption Expenditure Core (YoY) 1.30%
30th Apr USD USD Federal Reserve FOMC Meeting
30th Apr EUR EUR German Unemployment Change 13K
30th Apr EUR EUR Euro-Zone Unemployment Rate 12.00%
30th Apr USD USD Consumer Confidence 59.7
01st May USD USD ISM Manufacturing 51.3
01st May USD USD Federal Open Market Committee Rate Decision 0.25%
02nd May EUR EUR European Central Bank Rate Decision 0.75%
03rd May EUR EUR Euro-Zone Producer Price Index (YoY) 1.30%
03rd May USD USD Change in Non-farm Payrolls 88K
03rd May USD USD Unemployment Rate 7.60%
Technical Recommendation
14
®
IPOIPO
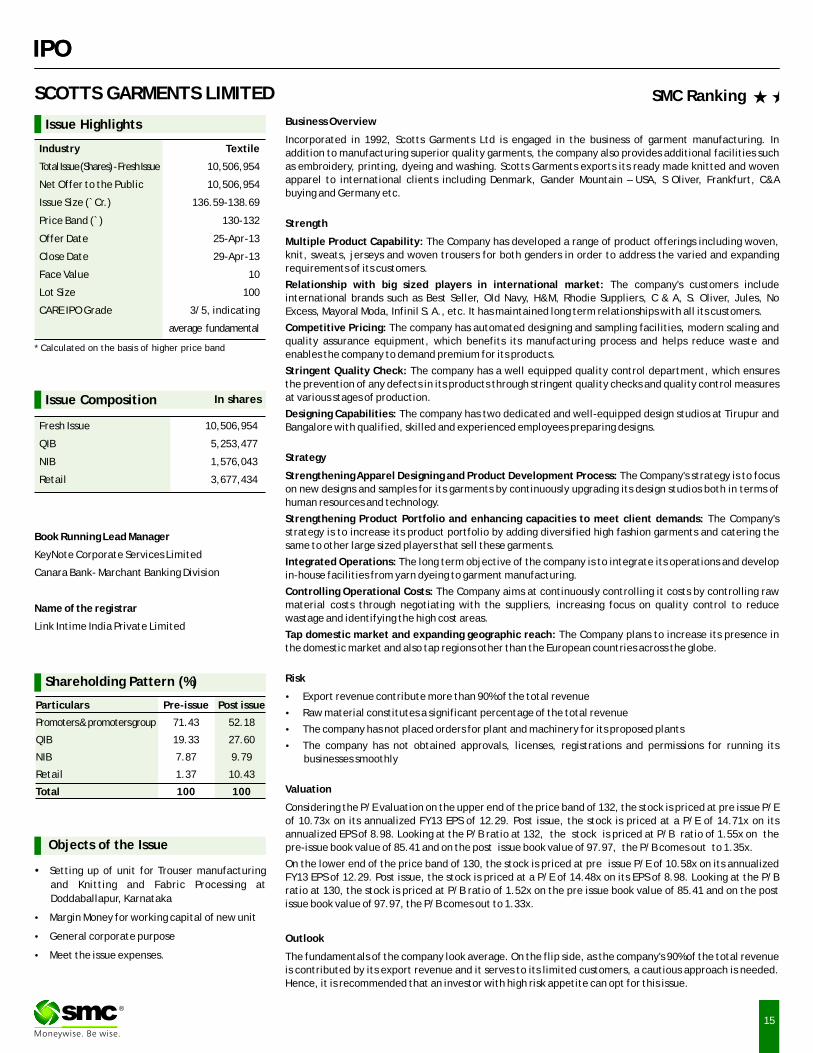
Issue Composition
Fresh Issue 10,506,954
QIB 5,253,477
NIB 1,576,043
Retail 3,677,434
In shares
Business Overview
Incorporated in 1992, Scotts Garments Ltd is engaged in the business of garment manufacturing. In
addition to manufacturing superior quality garments, the company also provides additional facilities such
as embroidery, printing, dyeing and washing. Scotts Garments exports its ready made knitted and woven
apparel to international clients including Denmark, Gander Mountain – USA, S Oliver, Frankfurt, C&A
buying and Germany etc.
Strength
Multiple Product Capability: The Company has developed a range of product offerings including woven,
knit, sweats, jerseys and woven trousers for both genders in order to address the varied and expanding
requirements of its customers.
Relationship with big sized players in international market: The company's customers include
international brands such as Best Seller, Old Navy, H&M, Rhodie Suppliers, C & A, S. Oliver, Jules, No
Excess, Mayoral Moda, Infinil S. A., etc. It has maintained long term relationships with all its customers.
Competitive Pricing: The company has automated designing and sampling facilities, modern scaling and
quality assurance equipment, which benefits its manufacturing process and helps reduce waste and
enables the company to demand premium for its products.
Stringent Quality Check: The company has a well equipped quality control department, which ensures
the prevention of any defects in its products through stringent quality checks and quality control measures
at various stages of production.
Designing Capabilities: The company has two dedicated and well-equipped design studios at Tirupur and
Bangalore with qualified, skilled and experienced employees preparing designs.
Strategy
Strengthening Apparel Designing and Product Development Process: The Company's strategy is to focus
on new designs and samples for its garments by continuously upgrading its design studios both in terms of
human resources and technology.
Strengthening Product Portfolio and enhancing capacities to meet client demands: The Company's
strategy is to increase its product portfolio by adding diversified high fashion garments and catering the
same to other large sized players that sell these garments.
Integrated Operations: The long term objective of the company is to integrate its operations and develop
in-house facilities from yarn dyeing to garment manufacturing.
Controlling Operational Costs: The Company aims at continuously controlling it costs by controlling raw
material costs through negotiating with the suppliers, increasing focus on quality control to reduce
wastage and identifying the high cost areas.
Tap domestic market and expanding geographic reach: The Company plans to increase its presence in
the domestic market and also tap regions other than the European countries across the globe.
Risk
�Export revenue contribute more than 90% of the total revenue
�Raw material constitutes a significant percentage of the total revenue
�The company has not placed orders for plant and machinery for its proposed plants
�The company has not obtained approvals, licenses, registrations and permissions for running its
businesses smoothly
Valuation
Considering the P/E valuation on the upper end of the price band of 132, the stock is priced at pre issue P/E
of 10.73x on its annualized FY13 EPS of 12.29. Post issue, the stock is priced at a P/E of 14.71x on its
annualized EPS of 8.98. Looking at the P/B ratio at 132, the stock is priced at P/B ratio of 1.55x on the
pre-issue book value of 85.41 and on the post issue book value of 97.97, the P/B comes out to 1.35x.
On the lower end of the price band of 130, the stock is priced at pre issue P/E of 10.58x on its annualized
FY13 EPS of 12.29. Post issue, the stock is priced at a P/E of 14.48x on its EPS of 8.98. Looking at the P/B
ratio at 130, the stock is priced at P/B ratio of 1.52x on the pre issue book value of 85.41 and on the post
issue book value of 97.97, the P/B comes out to 1.33x.
Outlook
The fundamentals of the company look average. On the flip side, as the company's 90% of the total revenue
is contributed by its export revenue and it serves to its limited customers, a cautious approach is needed.
Hence, it is recommended that an investor with high risk appetite can opt for this issue.
SCOTTS GARMENTS LIMITED
Book Running Lead Manager
KeyNote Corporate Services Limited
Canara Bank- Marchant Banking Division
Name of the registrar
Link Intime India Private Limited
Shareholding Pattern (%)
Particulars Pre-issue Post issue
Promoters & promoters group 71.43 52.18
QIB 19.33 27.60
NIB 7.87 9.79
Retail 1.37 10.43
Total 100 100
Issue Highlights
Industry Textile
Total Issue (Shares) - Fresh Issue 10,506,954
Net Offer to the Public 10,506,954
Issue Size (`Cr.) 136.59-138.69
Price Band (`) 130-132
Offer Date 25-Apr-13
Close Date 29-Apr-13
Face Value 10
Lot Size 100
CARE IPO Grade 3/5, indicating
average fundamental
* Calculated on the basis of higher price band
SMC Ranking
Objects of the Issue
�Setting up of unit for Trouser manufacturing
and Knitting and Fabric Processing at
Doddaballapur, Karnataka
�Margin Money for working capital of new unit
�General corporate purpose
�Meet the issue expenses.
15
®

16®

MUTUAL FUND
NEWS
ICICI Prudential MF introduces Fixed Maturity Plan-Series 67-366 Days Plan J
ICICI Prudential Mutual Fund has launched the New Fund Offer (NFO) of ICICI Prudential Fixed Maturity Plan-Series 67-366 Days Plan J, a close ended
income scheme. The NFO opens for subscription on April 22, 2013 and closes on April 29, 2013. The investment objective of the scheme is to generate
income by investing in a portfolio of fixed income securities/debt instruments maturing on or before the maturity of the Scheme. However, there can
be no assurance that the investment objective of the Scheme will be realized.
JPMorgan MF introduces India Fixed Maturity Plan – Series 20
JPMorgan Mutual Fund launched the New Fund Offer (NFO) of JPMorgan India Fixed Maturity Plan – Series 20, a close ended income scheme. The NFO
opens for subscription on April 22, 2013 and closes on April 30, 2013. The investment objective of the Scheme is to generate income through
investments in Debt Securities/Money Market Instruments and Government of India Securities (“GoI Securities”) maturing on or before the maturity
date of the Scheme. However, there can be no assurance that income can be generated, regular or otherwise, or that the investment objective of the
Scheme will be realized.
Motilal Oswal MF introduces MOSt Focused 25 Fund
Motilal Oswal Mutual Fund launched the New Fund Offer (NFO) of Motilal Oswal MOSt Focused 25 Fund, an open ended growth scheme. The NFO opens
for subscription on April 22, 2013 and closes on May 6, 2013. The investment objective of the Scheme is to achieve long term capital appreciation by
investing in upto 25 companies with long term sustainable competitive advantage and growth potential. However, there can be no assurance or
guarantee that the investment objective of the Scheme will be achieved.
Sundaram Mutual Fund files offer document with SEBI for Capital Protection Oriented Fund 3 Years
Sundaram Mutual Fund files offer document with SEBI to Sundaram Capital Protection Oriented Fund 3 Years (Series 10), a closed-end capital protection
oriented scheme with tenure of three years with capital protection orientation at maturity. The investment objective of the scheme is to seek income
and minimize the risk of capital loss by investing in a portfolio of fixed-income securities.
Escorts MF declares dividend under Short Term Debt Fund
Escorts Mutual Fund has declared dividend under the Escorts Short Term Debt Fund. The record date for the dividend is April 29, 2013. The rate of
dividend will be `0.11 per unit on the face value of `10 per unit. The investment objective of the Scheme is to generate local income through
investment in a portfolio comprising substantially of Floating Rate Debt Securities (including floating rate securitized debt, Money Market Instruments
and Fixed Rate Debt Instruments swapped for floating rate returns.
Escorts MF declares dividend under Income Plan
Escorts Mutual Fund has declared dividend under the Escorts Income Plan. The record date for the dividend is April 29, 2013.The rate of dividend will be
`0.092 per unit on the face value of ̀ 10 per unit. The investment objective of the Scheme is to generate current income by investing predominantly in a
well diversified portfolio of Fixed Income Securities and Money Market Instruments with moderate risk levels.
DSP BlackRock FMP - Series 47 - 12M declares dividend
DSP BlackRock Mutual Fund has declared dividend under the dividend payout option of DSP BlackRock FMP - Series 47 -12M , a close ended income
scheme. The record date for the dividend is April 29, 2013. The quantum of dividend will be upto 100% of distributable surplus as on record date on the
face value of ̀ 10 per unit. Also the maturity date of the scheme is April 29, 2013.
17®
NFOs WATCH
Fund Name NFO NFO Scheme Objective Fund Type Fund Class Fund Manager MinimumOpens on Closes on Amount
16-Apr-2013 30-Apr-2013 Close-Ended Growth `5000/-BNP Paribas Capital Protection Oriented Fund - SrI (38M) (G)
Puneet Pal / Shreyash Devalkar
To seek capital protection by investing in fixed income securities maturing on or before the maturity of the scheme and seeking capital appreciation by investing in premium of exchange traded options.
18-Apr-2013 29-Apr-2013 Open-Ended Growth `5000/-BNP Paribas Government Securities Fund (G)
Puneet PalTo generate income and capital appreciation by investing in a portfolio of government securities of various maturities issued by Central & State Government.
16-Apr-2013 30-Apr-2013 Close-Ended Dividend `5000/-ICICI Prudential Multiple Yield Fund - Series 3 - Plan B - Direct Plan (D)
Rajat Chandak / Rahul Goswami
To seek to generate income by investing in a portfolio of fixed income securities/ debt instruments. The secondary objective of the Scheme is to generate long term capital appreciation by investing a portion of the Scheme\'s assets in equity and equity related instruments.

18
MUTUAL FUND Performance Charts
Returns (%) Risk Market Cap (%)
Scheme Name NAV Launch AUM 3M 6M 1Y 3Y Since Std.Dev Beta Jenson LARGE MID SMALL DEBT &
(`) Date (` Cr.) Launch CAP CAP CAP OTHER
Birla Sun Life Frontline Equity F-Plan A-G 99.10 30-Aug-2002 3043.60 -2.50 6.10 20.50 6.30 24.00 1.90 0.90 0.10 78.1896 12.3537 -- 9.4566
Reliance Equity Opp. Fund - Growth 42.30 31-Mar-2005 4995.30 -4.30 0.90 15.30 9.80 19.60 1.90 0.80 0.10 40.6673 46.892 4.702 7.7388
ICICI Prudential Focused Bluechip Equity F-Ret-G 18.20 23-May-2008 4330.70 -4.20 4.10 13.70 8.10 12.90 1.70 0.80 N.A 81.0344 7.1166 -- 11.849
Franklin India Bluechip-Growth 232.90 01-Dec-1993 5150.20 -4.40 4.00 12.90 5.90 24.40 1.70 0.80 N.A 80.091 3.8915 -- 16.0174
IDFC Premier Equity Fund-Reg-Growth 37.40 28-Sep-2005 3462.80 -5.00 2.20 12.30 8.70 19.00 1.70 0.60 0.10 32.5675 48.0217 4.4948 14.916
UTI Opportunities Fund - Growth 31.40 20-Jul-2005 3511.10 -2.50 1.10 12.10 8.60 15.90 1.70 0.80 N.A 79.38 10.75 0.01 9.86
HDFC Top 200 - Growth 220.70 11-Sep-1996 12016.90 -5.10 2.30 11.50 5.60 22.00 2.20 1.10 N.A 80.5236 10.3654 -- 9.1109
EQUITY (Diversified)
BALANCED
INCOME FUND
Note: Indicative corpus are including Growth & Dividend option. The above mentioned data is on the basis of 25/04/2013Beta, Sharpe and Standard Deviation are calculated on the basis of period: 1 year, frequency: Weekly Friday, RF: 7%
ULTRA SHORT TERM
SHORT TERM FUND
Due to their inherent long term nature, the following 3 categories have been sorted on the basis of 1 year returns
Due to their inherent short term nature, the following 2 categories have been sorted on the basis of 6month returns
Returns (%) Risk Market Cap (%)
Scheme Name NAV Launch AUM 3M 6M 1Y 3Y Since Std.Dev Jenson LARGE MID SMALL DEBT &
(`) Date (` Cr.) Launch CAP CAP CAP OTHER
SBI Magnum Balanced Fund - Growth 55.97 09-Oct-1995 374.07 -2.66 4.58 17.61 4.16 15.64 1.67 -0.21 27.7627 31.3372 4.8332 36.067
Birla Sun Life 95 - Growth 345.27 10-Feb-1995 575.99 -2.01 4.43 14.14 6.66 21.46 1.55 -0.21 53.1842 11.5141 0.325 34.9767
Reliance RSF - Balanced - Growth 24.71 08-Jun-2005 547.51 -4.34 1.56 13.64 5.47 12.16 1.80 -0.17 47.7322 11.2684 4.8472 36.1523
ICICI Prudential Balanced - Growth 55.37 03-Nov-1999 447.50 -3.42 5.05 13.42 9.95 13.53 1.48 -0.20 44.9104 16.1665 1.0754 37.8477
Tata Balanced Fund - Plan A - Growth 96.68 08-Oct-1995 508.47 -2.06 1.35 13.37 7.59 15.82 1.64 -0.13 46.4202 21.8455 3.3078 28.4265
Kotak Balance 18.73 25-Nov-1999 114.23 -0.91 3.85 12.90 6.28 15.47 1.59 -0.19 57.8811 7.8934 0.4829 33.7426
FT India Balanced Fund - Growth 54.45 10-Dec-1999 212.45 -2.62 4.03 12.47 6.01 13.50 1.51 -0.23 48.1463 16.6059 1.361 33.8869
Returns (%) RiskAverage Yield till
Scheme Name NAV Launch AUM Since Std. SharpeMaturity (Days) Maturity
1W 2W 1M 6M 1Y 3Y(`) Date (`Cr.) Launch Dev.
SBI Magnum Income Fund - Growth 29.60 25-Nov-1998 3018.90 18.10 26.60 21.50 13.30 14.30 9.50 7.80 14.90 0.40 1456.00 8.90
Birla Sun Life Income Plus - DAP 13.70 06-Mar-2009 2901.30 27.30 41.70 31.20 14.70 13.10 8.80 8.00 15.70 0.30 N.A 8.90
Birla Sun Life Income Plus - Growth 54.50 21-Oct-1995 2901.30 27.20 41.70 31.20 14.70 13.10 8.80 10.20 15.70 0.30 N.A 8.90
ICICI Prudential Income Fund -Growth 38.10 09-Jul-1998 2927.50 29.70 44.60 32.40 13.30 13.00 8.10 9.40 15.70 0.30 3621.00 8.60
Reliance Dynamic Bond Fund - Growth 16.00 16-Nov-2004 4182.40 15.40 32.90 26.00 12.80 12.90 9.80 5.70 15.30 0.30 3435.00 7.90
Kotak Bond Deposit - Growth 32.30 25-Nov-1999 5104.00 10.70 28.90 25.30 11.90 12.80 9.40 9.10 16.00 0.30 2800.00 9.00
Kotak Bond Scheme - Plan A - Growth 34.60 25-Nov-1999 5104.00 10.40 28.60 24.70 11.70 12.70 9.40 9.70 15.90 0.30 2800.00 9.00
Annualised
Returns (%) Risk Average Yield tillScheme Name NAV Launch AUM Since Std. Sharpe Maturity (Days) Maturity
1W 2W 1M 6M 1Y 3Y(`) Date (`Cr.) Launch Dev.
ICICI Prudential Blended-Plan B-Option I-G 17.80 31-May-2005 948.70 21.20 26.40 22.60 12.50 10.60 8.80 7.60 7.10 0.40 N.A 8.50
UTI Short Term Income F- Ret-Growth 20.60 23-Jun-2003 2280.00 9.30 14.50 14.20 10.90 11.30 9.30 7.60 6.30 0.60 610.00 N.A
Birla Sun Life Short Term Opp. F-G 18.80 24-Apr-2003 401.50 10.10 12.60 14.20 10.40 11.80 9.50 6.50 5.30 0.80 N.A 11.30
Templeton India STIP - Growth 2384.70 31-Jan-2002 5744.80 11.70 17.10 16.40 10.20 10.80 8.60 8.00 5.10 0.70 949.00 10.70
Kotak Bond Short Term Plan - Growth 22.40 02-May-2002 1414.00 11.10 17.00 15.90 10.20 10.50 7.80 7.60 5.20 0.60 818.00 9.50
Tata Short Term Bond Fund-Plan A-G 21.90 08-Aug-2002 261.80 10.20 16.10 14.20 10.10 10.20 8.30 7.60 5.00 0.60 518.00 9.30
Reliance Short Term Fund - Growth 22.20 23-Dec-2002 2726.90 13.50 17.00 17.20 10.00 10.60 8.10 8.00 5.20 0.60 810.00 9.00
Annualised
Returns (%) Risk Average Yield tillScheme Name NAV Launch AUM Since Std. Sharpe Maturity (Days) Maturity
1W 2W 1M 6M 1Y 3Y(`) Date (`Cr.) Launch Dev.
IDFC D B F- Plan A - Growth 24.10 25-Jun-2002 3993.70 16.90 22.30 19.70 14.00 13.30 10.10 8.50 14.20 0.40 1172.00 9.00
Indiabulls Ultra Short Term F-Growth 1133.60 06-Jan-2012 615.60 9.00 9.20 12.00 9.50 9.90 N.A 10.10 1.90 1.40 123.00 9.80
Templeton India Low Duration F-Growth 12.80 26-Jul-2010 2803.70 9.20 10.40 11.90 9.40 10.00 N.A 9.40 2.30 1.20 175.00 10.50
DWS Treasury Fund-Investment-Reg-G 13.10 09-Oct-2009 240.20 8.50 12.20 11.40 9.20 9.70 8.20 8.00 3.60 0.70 376.00 8.90
JM Money Manager Fund-Reg-Growth 16.40 27-Sep-2006 207.60 8.20 9.20 9.40 9.20 9.70 9.10 7.80 0.70 3.30 40.00 9.60
Kotak Floater-LT-Growth 18.80 13-Aug-2004 4289.60 8.20 9.40 11.60 9.20 9.60 8.70 7.50 1.70 1.30 193.00 9.30
DWS Cash Opp. Fund - Reg - Growth 15.80 22-Jun-2007 375.70 8.70 10.00 11.40 9.10 9.70 8.50 8.10 2.20 1.10 150.00 10.00
Annualised
®

