a weekly update from smc 2014: issue 430, week: 7th - 10th ... · wise m ney b r a n d s m c 2 5 3...
TRANSCRIPT

WISE M NEY
Bra
nd
sm
c 2
53
2014: Issue 430, Week: 7th - 10th JulyA Weekly Update from SMC
(For private circulation only)

(Saurabh Jain)
Contents
Equity 4-7
Derivatives 8-9
Commodity 10-13
Currency 14
IPO 15
Fixed Deposit 16
Mutual Fund 17-18
EDITORIAL STAFF
Editor Saurabh Jain
Executive Editor Jagannadham Thunuguntla
+Editorial Team
Dr. R.P. Singh Nitin Murarka
Vandana Bharti Sandeep Joon
Dinesh Joshi Vineet Sood
Shitij Gandhi Dhirender Singh Bisht
Subhranil Dey Parminder Chauhan
Ajay Lakra Mudit Goyal
Content Editor Kamla Devi
Graphic Designer Pramod Chhimwal
Research Executive Sonia Bamba
REGISTERED OFFICES:
11 / 6B, Shanti Chamber, Pusa Road, New Delhi 110005.
Tel: 91-11-30111000, Fax: 91-11-25754365
MUMBAI OFFICE:
Dheeraj Sagar, 1st Floor, Opp. Goregaon sports Club, Link Road
Malad (West), Mumbai 400064
Tel: 91-22-67341600, Fax: 91-22-28805606
KOLKATA OFFICE:
18,Rabindra Sarani, Poddar Court, Gate No-4,
5th Floor, Kolkata-700001
Tel : 91-33-39847000 Fax No : 91-33-39847004
AHMEDABAD OFFICE :
10/A, 4th Floor, Kalapurnam Building, Near Municipal Market,
C G Road, Ahmedabad-380009, Gujarat
Tel : 91-79-26424801 - 05, 40049801 - 03
CHENNAI OFFICE:
Salzburg Square, Flat No.1, III rd Floor, Door No.107, Harrington Road,
Chetpet, Chennai - 600031.
Tel: 044-39109100, Fax -044- 39109111
SECUNDERABAD OFFICE:
206, 3rd Floor, above CMR Exclusive, Bhuvana Towers, S.D.Road,
Secunderabad - 500003
Tel: 91-40-30780298/99, 39109536
DUBAI OFFICE:
312, Belshalat Building, Al Karama, Dubai, P.O. Box 117210, U.A.E.
Tel: 97143963120, Mobile : 971502612483
Fax : 9714 3963122
Email ID : [email protected]
Printed and Published on behalf of
Mr. Saurabh Jain @ Publication Address
11/6B, Shanti Chamber, Pusa Road, New Delhi-110005
Website: www.smcindiaonline.com
Investor Grievance : [email protected]
Printed at: S&S MARKETING
102, Mahavirji Complex LSC-3, Rishabh Vihar, New Delhi - 110092 (India)
Ph.: +91-11- 43035012, 43035014, Email: [email protected]
lobal stock markets strengthened during the week on the back of positive
economic data out of two biggest economies namely; U.S. and China and Galso as crude prices came off from the highs amid speculation that oil
supplies would remain uninterrupted from Iraq. Manufacturing activity saw fastest
expansion in China in the month of June this year. Six nations including U.S., Russia,
China, Germany, France and the U.K are negotiating with Iran to reach an
agreement for crude supplies to eliminate the risks of disruption of supplies from
Iraq due to fighting. Japanese markets too advanced during the week as companies
increase their capital spending plans to 7.4 percent this fiscal up by 0.1% they
signaled three months back as they perceive inflation to remain firm in the
economy.
Back at home, monsoon so far is lower to the extent of 40 percent for the nation as a
whole. Indian meteorological department has already predicted 7% lower rains
below the long period average for this year. As a matter of fact India receives only 18
percent of the rains in the month of June, 31 percent in the month of July, 29
percent in the month of August and remaining in the month of September. It is
expected that some of the shortfall for the month of June may be get covered in the
month of July. Indian stock markets made fresh highs before the budget to be
announced on 10th July on the anticipation that higher allocations may be done for
the infrastructure sector like roads, power, ports, etc. There could be case that
because of the fiscal limitations, no major allocations may be done but markets
would focus on the intent of the government and investors would try to gauge what
could be in offing in the budget to be presented in February 2015 for the fiscal year
2015 – 2016. Other key areas that investors want to know is the government intent
and action on the subsidies, fiscal prudence, implementation of goods and services
tax and last but not the least the public sector banks recapitalisation.
Geopolitical tension along with movement of greenback and ETF demand will give
direction to the bullion counter in near term. Iraq tensions along with hurricane
concerns will give clues to the crude oil traders. Additionally, the Tropical Storm
Arthur is expected to cause further trouble along with Atlantic coastline with the
Eastern and Northeast points likely to be the hardest hit. Libya is reopening two oil
export terminals in the country's east after taking control from rebels who have
blocked oil shipments for the past year. Fighting in Iraq still hasn't spread to the
south, home to more than three-quarters of its output. In Iraq, oil exports have been
unaffected by an Islamist insurgency in the north. The country will ship 2.8 million
barrels a day this month, close to a record high, Some data's and events are also
likely to influence the prices of commodities and some of them are; PPI of China,
Fed Releases Minutes from June 17-18 FOMC Meeting, New Yuan Loans , Employment
Change of Australia, Bank of England Rate Decision, Unemployment Rate of Canada
etc.
From The Desk Of Editor
NEWS
DOMESTIC NEWSEconomy•The government has deferred hike in LPG and kerosene prices in states
including Karnataka, Madhya Pradesh and Kerala due to increase in local levies in these states that has led to higher fuel prices. The Oil Ministry has deferred hike on pending consultations with the state governments on state specific levies.
•According to the data from Markit Economics, India's manufacturing sector maintained growth momentum in June on robust domestic and foreign demand. The HSBC Purchasing Managers' Index rose to 51.5 in June from 51.4 in May. Operating conditions improved for the eighth month in succession, although modestly.
Information Technology•Tech Mahindra has inked a Joint Venture Agreement (JVA) with Midad
Holding, which is a subsidiary of Al Fozan, a preeminent group with diversified business interest in Saudi Arabia. The JV will be called 'Tech Mahindra Arabia'. Tech Mahindra will have 51% ownership, while Midad will own 49% stake.
Tyre•Apollo Tyres has received an approval for expansion of the Truck & Bus
radial tyre capacity at the Chennai plant from the present 6,000 tyres per day to 8,900 tyres per day and conversion of the company's leased operations at Kalamassery plant from bias truck tyres to speciality/industrial tyres involving capex of $340 million.
Telecom•Bharti Airtel is planning to roll out 4G services in Andhra Pradesh and
Telangana this fiscal. Moreover, Hyderabad, Vijayawada and Visakhapatnam are on the priority list for the company.
Realty & Construction•HDIL has sold its multiplex business to Carnival Films for Rs 105 crore. HDIL
has sold its 100% in HDIL Entertainment, which runs 33 multiplexes under the brand name Kulraj Broadway to Carnival films.
•Larsen & Toubro announced that L&T Constructions has won new orders worth `2002 crore across various business segments in June 2014. These include ̀ 1547 crore worth of orders secured by the heavy civil infrastructure business and `392 crore worth of domestic and international orders bagged by the power transmission business. Additional orders have been received from an ongoing job of water and renewable energy business.
Capital Goods•Alstom T&D India has been awarded a contract worth `27.7 crore by
Himachal Pradesh Power Transmission Corporation to supply a 66 Kv gas insulated substation in Urni, Himachal Pradesh. The project aims to transmit power from new generation sources into the Kinnaur district of Himachal Pradesh, paving way towards harnessing 23,000 MW of hydro power potential in the state.
•Siemens has sold the land parcel located in Bangalore on July 03, 2014 to Prestige City Properties. The proceeds of the sale is approximately `345 crore. The company has taken this step as part of its continuous asset optimization exercise.
INTERNATIONAL NEWS•US trade deficit narrowed to $44.4 billion in May from a revised $47.0
billion in April. Economists expected the trade deficit to narrow to $45.1 billion. The decrease in the size of the deficit nearly offset the jump seen in the previous month, with the deficit pulling back near the $44.2 billion seen in March.
•US jobless claims edged up to 315,000, an increase of 2,000 from the previous week's revised level of 313,000. Economists had been expecting claims to inch up to 314,000 from the 312,000 originally reported for the previous week.
•US factory orders fell by 0.5 percent in May after climbing by an upwardly revised 0.8 percent in April. Economists had expected orders to dip by about 0.3 percent compared to the 0.7 percent increase that had been reported for the previous month.
•US non-manufacturing index edged down to 56.0 in June from 56.3 in May, although a reading above 50 indicates continued growth in the service sector. Economists had been expecting the index to come in unchanged.
•The European Central Bank left its interest rates unchanged, after taking the historic move of cutting the deposit rate to negative territory and unveiling a raft of liquidity measures last month, amid the lingering deflationary worries in the euro area.
•Eurozone retail sales were flat monthly, following a 0.2 percent decline in April, revised from a 0.4 percent gain reported earlier. Economists had forecast 0.3 percent sales growth for May.
•Hong Kong retail sales value fell 4.1 percent year-on-year in May, following the 9.9 percent drop in April. Economists had expected a 4 percent decrease in sales. Sales value shrunk for the fourth straight month.
EX-DATE SYMBOL PURPOSE
7-JUL-14 JSWSTEEL DIVIDEND - RS 11/- PER SHARE
8-JUL-14 NCC DIVIDEND - RE 0.20/- PER SHARE
8-JUL-14 SOUTHBANK DIVIDEND - RE 0.80/- PER SHARE
9-JUL-14 TATAMOTORS DIVIDEND - RS 2/- PER SHARE
9-JUL-14 CAIRN DIVIDEND RS. 6.50/- PER SHARE
10-JUL-14 LLOYDELENG DIVIDEND - RE 1/- PER SHARE
10-JUL-14 THERMAX DIVIDEND - RS 6/- PER SHARE
10-JUL-14 BIOCON FINAL DIVIDEND - RS 5/- PER SHARE
10-JUL-14 POLARIS FINAL DIVIDEND - RS 6.25/- PER SHARE
10-JUL-14 GLENMARK DIVIDEND - RS 2/- PER SHARE
10-JUL-14 ZEEL DIVIDEND - RS 2/- PER SHARE
10-JUL-14 KTKBANK DIVIDEND - RS 4/- PER SHARE
11-JUL-14 EXIDEIND FINAL DIVIDEND - RE 0.70/- PER SHARE
11-JUL-14 DRREDDY FINAL DIVIDEND - RS 18/- PER SHARE
11-JUL-14 CENTURYTEX DIVIDEND - RS 5.50/- PER SHARE
11-JUL-14 JSWENERGY DIVIDEND - RS 2/- PER SHARE
14-JUL-14 COROMANDEL DIVIDEND RS.4.50 PER SHARE
14-JUL-14 TATASTEEL DIVIDEND - RS.10/- PER ORDINARY SHARE
MEETING DATE SYMBOL PURPOSE
7-JUL-14 ICRA RESULTS/OTHERS
7-JUL-14 RSYSTEMS BUYBACK
9-JUL-14 INDUSINDBK RESULTS
11-JUL-14 INFY RESULTS
12-JUL-14 UNICHEMLAB RESULTS
16-JUL-14 KOTAKBANK RESULTS
16-JUL-14 BAJFINANCE RESULTS
16-JUL-14 BAJAJFINSV RESULTS
17-JUL-14 BAJAJ-AUTO RESULTS
FORTHCOMING EVENTS
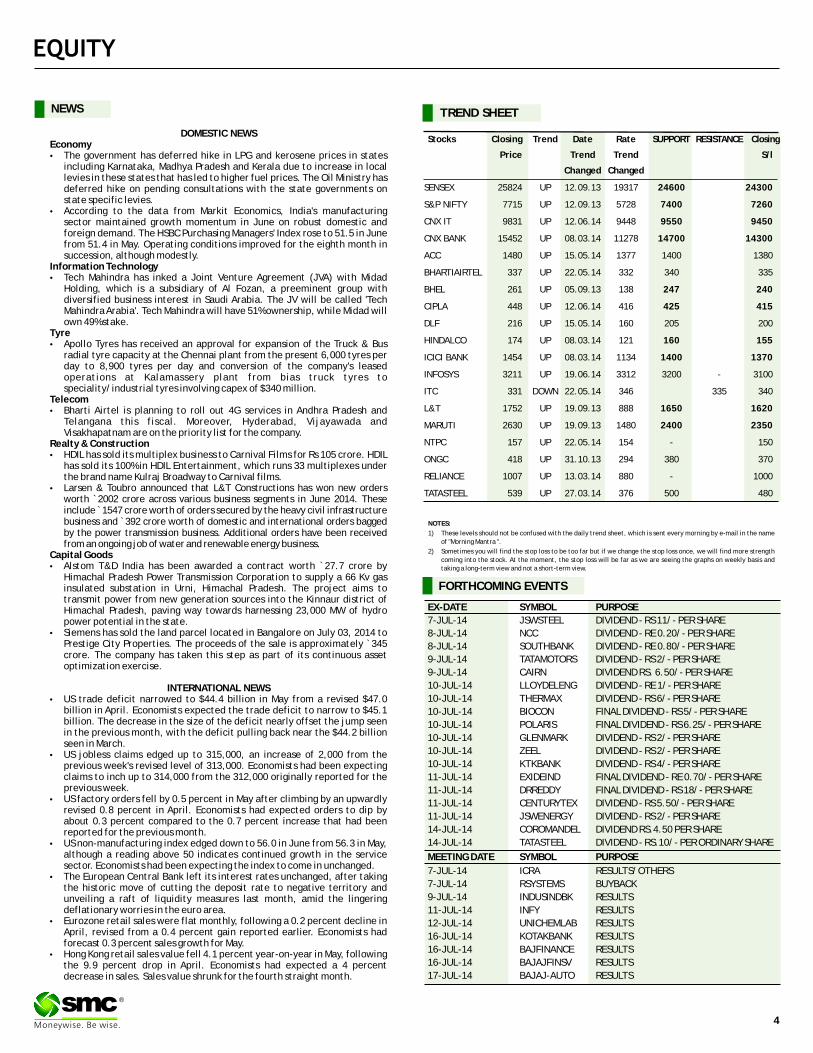
NOTES:
1) These levels should not be confused with the daily trend sheet, which is sent every morning by e-mail in the name
of "Morning Mantra ".
2) Sometimes you will find the stop loss to be too far but if we change the stop loss once, we will find more strength
coming into the stock. At the moment, the stop loss will be far as we are seeing the graphs on weekly basis and
taking a long-term view and not a short-term view.
TREND SHEET
Stocks Closing Trend Date Rate SUPPORT RESISTANCE Closing
Price Trend Trend
Changed Changed
SENSEX 25824 UP 12.09.13 19317 24600 24300
S&P NIFTY 7715 UP 12.09.13 5728 7400 7260
CNX IT 9831 UP 12.06.14 9448 9550 9450
CNX BANK 15452 UP 08.03.14 11278 14700 14300
ACC 1480 UP 15.05.14 1377 1400 1380
BHARTIAIRTEL 337 UP 22.05.14 332 340 335
BHEL 261 UP 05.09.13 138 247 240
CIPLA 448 UP 12.06.14 416 425 415
DLF 216 UP 15.05.14 160 205 200
HINDALCO 174 UP 08.03.14 121 160 155
ICICI BANK 1454 UP 08.03.14 1134 1400 1370
INFOSYS 3211 UP 19.06.14 3312 3200 - 3100
ITC 331 DOWN 22.05.14 346 335 340
L&T 1752 UP 19.09.13 888 1650 1620
MARUTI 2630 UP 19.09.13 1480 2400 2350
NTPC 157 UP 22.05.14 154 - 150
ONGC 418 UP 31.10.13 294 380 370
RELIANCE 1007 UP 13.03.14 880 - 1000
TATASTEEL 539 UP 27.03.14 376 500 480
S/l
4
®

BSE SENSEX GAINERS & LOSERS TOP (% Change) NSE NIFTY GAINERS TOP & LOSERS (% Change)
SECTORAL INDICES (% Change)
SMC Trend
SMC Trend
FMCGHealthcare
FTSE 100CAC 40
Auto BankRealty
Cap GoodsCons Durable
Oil & GasPower
NasdaqDow jonesS&P 500
NikkeiStrait times
Hang SengShanghai
ITMetal
Down SidewaysUp
SMC Trend
Nifty BSE Midcap S&P CNX 500
GLOBAL INDICES (% Change)
INDIAN INDICES (% Change)
BSE SmallcapSensex Nifty Junior
5
®
2.74 2.883.10
3.96
4.55
3.04
0.00
0.50
1.00
1.50
2.00
2.50
3.00
3.50
4.00
4.50
5.00
Nifty Sensex BSE Midcap BSE Smallcap
Nifty Junior S&P CNX 500
5.89
2.99
5.17
3.49
2.51
4.47
0.25
4.79
0.68
4.25
0.991.00
2.00
3.00
4.00
5.00
6.00
7.00
Auto Index Bankex Cap Goods Index
Cons Durable Index
FMCG Index Healthcare Index
IT Index Metal Index Oil & Gas Index
Power Index Realty Index
0.00
2.00
1.28 1.25
1.68
0.06
1.33 1.31
1.59
1.19
0.00
0.50
1.00
1.50
2.00
2.50
Nasdaq Comp. Dow Jones S&P 500 Nikkei Strait Times Hang Seng Shanghai Comp.
FTSE 100 CAC 40
INSTITUTIONAL ACTIVITY (Equity) (` Crore)
226.85 0.00
2257.78
-4126.29
239.70576.40
-222.10
72.00
-5000.00
-4000.00
-3000.00
-2000.00
-1000.00
0.00
1000.00
2000.00
3000.00
Friday Monday Tuesday Wednesday Thursday
FII / FPI Activity MF Activity
8.65
7.99
7.34 7.14 7.11
-1.32-1.01
-0.58 -0.55 -0.51
-2.00
0.00
2.00
4.00
6.00
8.00
10.00
Tata Motors Hindalco Inds.
Sesa Sterlite Maruti Suzuki
M & M Hero Motocorp
HCL Technologies
Tech Mahindra
Reliance Inds.
Asian Paints
8.467.95
7.36 7.35 7.12
-1.30
-0.59 -0.57 -0.35
-2.00
0.00
2.00
4.00
6.00
8.00
10.00
Tata Motors Hindalco Inds.
Sesa Sterlite Maruti Suzuki
M & M Hero Motocorp
Reliance Inds.
Bajaj Auto Infosys

Beat the street - Fundamental Analysis
Above calls are recommended with a time horizon of 1 year. Source: Company Website Reuters Capitaline
VALUE PARAMETERS
% OF SHARE HOLDING
Investment Rationale •The company has expanded its horizons and has •SJVN is a joint venture between the Central drawn up ambitious plans to develop into a fully-
government and Himachal Pradesh state diversified trans-national power sector company government. The company owns and operates having presence in various conventional and non-India's largest 1500 MW Nathpa Jhakri Hydro Power conventional forms of energy. Station in Himachal Pradesh. •Company's consolidated net profit rose 5.9% to
•The company, in joint Venture (JV) with Druk Green `1114.50 crore in the quarter ended March 2013 as Power Corporation Limited of Bhutan, is setting up against `1052.34 crore during the previous quarter 600 MW Kholongchu HE Project in Bhutan. SJVN and ended March 2012. Sales increased by 11.2% to Druk Green Power Corporation Limited shall have `1868.92 crore in the quarter ended March 2013 as equal shareholding in the joint venture of the against `1680.42 crore during the previous quarter Company. On completion the project will generate ended March 2012.2568.52 GWh of energy. In terms of the agreement Valuationthe project shall be financed under a debt equity Company has successfully commissioned the 412 MW ratio of 70:30. Rampur Hydro Electric Project and will begin energy
•SJVN's thermal project of 1,320 megawatt known as generation in 2014-15. Company foresees generation Buxar Thermal Power Plant is going on in full swing of around 800 million units of electricity from FY15. and company is hopeful of getting the land very We expect the stock to see a price target of ̀ 28 in one shortly within few months. Then company can start year time frame on a target P/E of 10x and FY15 (E) all its activities. earnings of ̀ 2.82.
•The company has commissioned 47.6MW Khirvere Wind Power Project comprising of total 56 Wind Energy Generators (WEG) each having capacity of 850kW. Recently, the company has successfully synchronized three units -- Unit 1, 2 & 5 -- of 412 MW Rampur Hydro Electric Project.
•Rampur Hydroelectric Project comprises of six units of 68.67 megawatt and is designed for annual energy of 1770 million unit. In terms of megawatt, during 2013-2014, 206 megawatt is to be connected to the grid. Out of that it had already commissioned two machines successfully. Third is in the pipeline. SJVN which has already diversified in the field of Wind Power, Thermal Power and Power Transmission is presently generating 2000 MW of electricity in FY15.
` in cr
Actual Estimate
FY Mar-14 FY Mar-15 FY Mar-16
Revenue 1868.90 2285.90 2601.80EBITDA 1604.30 1977.10 2258.10EBIT 1129.80 1591.30 1795.00Pre-tax Profit 1338.10 1519.10 1685.80Net Profit 1114.50 1165.20 1242.10EPS 2.69 2.82 3.06BVPS 21.88 23.62 25.28ROE 12.80 12.40 12.30
Face Value (`) 10.00
52 Week High/Low 27.65/18.30
M.Cap (`Cr.) 10155.40
EPS (`) 2.69
P/E Ratio (times) 9.13
P/B Ratio (times) 1.12
Dividend Yield (%) 3.91
Stock Exchange BSE
SJVN LIMITED CMP: 24.55 Upside: 15%Target Price: 28
P/E Chart
Face Value (`) 2.00
52 Week High/Low 184.00/94.00
M.Cap (`Cr.) 70858.28
EPS (`) 13.85
P/E Ratio (times) 12.11
P/B Ratio (times) 1.89
Dividend Yield (%) 2.09
Stock Exchange BSE
` in cr
Actual Estimate
FY Mar-14 FY Mar-15 FY Mar-16
Revenue 13459.00 14173.80 15048.20
EBITDA 6961.50 7233.80 7488.40
EBIT 6176.90 8314.60 8854.00
Pre-tax Profit 8031.40 8516.40 8910.10
Net Profit 6966.30 7215.20 7424.60
EPS 16.48 17.01 17.90
BVPS 88.56 101.45 114.52
ROE 20.00 17.60 15.90
% OF SHARE HOLDING
Investment Rationale annum and a leading producer of silver.
•Hindustan Zinc, a Vedanta Group company, is the •As the government plans to divest its 29.5 percent
one of the largest integrated producers of zinc- stake in the company, it has shortlisted IFCI, SPA
lead. The Company is self-sufficient in power Capital, RBSA Valuation Advisers and Resurgent
with an installed base of 474 MW coal-based India to value that stake.
captive power plants. Additionally, it has green Valuationpower capacity of 309 MW including 274 MW of Company expects Rampura Agucha would continue to wind power and 35 MW of waste heat power. provide majority of mined metal in FY15. The
•The company's has maintained its next phase of Rampura Agucha underground mine is now starting to the growth plan to increase mined metal ramp up in line with expectation. In FY15, mined production capacity to 1.2m tpa with US$250 metal and integrated refined metals production million annual capex for the next five years. including silver is expected to be marginally higher
•Company's Kayad and Rampura Agucha from FY14. The cost of production is expected to
underground mine projects commenced remain stable. The tax rate is expected to gradually
commercial production during FY14 and after move up, but likely to remain below the MAT rate. We
initial difficulties, are now ramping up well. expect the stock to see a price target of `204 in one
Sindesar Khurd expansion project is ahead of year time frame on a target P/E of 12x and FY15 (E)
schedule. During the year ended March 2014, earnings of ̀ 17.01.
total mine development increased by over 75%,
marking the beginning of transition from open-
cast to underground mining. At end-FY14,
reserves and resources were 365 million MT.
•As on March 31, 2014, the Company had cash and
cash equivalents of `25,535 crore, out of which
`20,527 crore was invested in debt mutual funds,
`1977 crore in bonds and `3020 crore were in
fixed deposits with banks. The Company follows a
conservative investment policy and invests in high
quality debt instruments.
•It is is the one of the largest integrated producers
of zinc-lead with a capacity of 1.0 million MT per
P/E Chart
HINDUSTAN ZINC LIMITED CMP: 167.7 Upside: 22%Target Price: 204
VALUE PARAMETERS
2.121.75 0.64
64.92
30.58
Foreign
Institutions
Non Promoter Corporate Holding
Promoters
Public & Others
1.77 5.17 0.9
89.97
2.2 Foreign
Institutions
Non Promoter Corporate Holding
Promoters
Public & Others
6
®

Charts by Spider Software India Ltd
7
The stock closed at `134.20 on 04thJuly 2014. It made a 52-week low at `76.10
on 28th August 2013 and a 52-week high at `147.20 on 26th May 2014. The 200
days Exponential Moving Average (EMA) of the stock on the weekly chart is
currently at ̀ 128.61.
It has formed higher high and higher lows formation and last week managed to
sustain above its 200 EMA which is a positive sign. So, one can initiate long in
range of 133-134 levels for the upside target of 142-143 levels with closing below
SL of 128.
EQUITY
Above calls are recommended with a time horizon of 1-2 months
The stock closed at ̀ 181.00 on 04thJuly 2014. It made a 52-week low at ̀ 118.05
on 03rd July 2013 and a 52-week high at ̀ 189.50 on 22nd January 2014. The 200
days Exponential Moving Average (EMA) of the stock on the weekly chart is
currently at ̀ 115.26.
This particular scrip is in uptrend and after a marginal fall, it again started its
upward journey. Moreover, last week it rose almost 7 percent which is a positive
sign. So, one can initiate long in range of 177-179 levels for the upside target of
192-195 levels with closing below SL of 172.
The stock closed at 56.65 on 04thJuly 2014. It made a 52-week low at 33.35 on
28th August 2013 and a 52-week high of `58.75 on 26th May 2014. The 200 days
Exponential Moving Average (EMA) of the stock on the weekly chart is currently
at ̀ 50.92.
After forming double bottom at lower levels it rebounded sharply and sustained
on higher side. Moreover, it has formed a sort of flag formation in last few weeks
which is bullish in nature so in the near term more upside is expected. One can
initiate long in range of 55-56 levels for the upside target of 65-67 levels with
closing below SL of 52.
` `
IDFC
VIJAYA BANK
KPIT
®

DERIVATIVES
BASIS GAP IN NIFTY
Nifty recovered from intraday low of 7660 and closed at weekly high at 7757. Nifty future closed at a premium of 37 points indicating long carry forward. In July
expiry, both derivative volume and open interest have increased indicating more participation. Nifty is expected to remain in the range of 7600-7900 levels this
week with positive bias. The options concentration continues to be at 7500-strike put option with an open interest of above 40 lakh shares. This is followed by the
8000-strike call option with above 70 lakh shares. Above discussed option data indicates put writing at 7500 strikes. On the call side data indicates call buying in
8000 strike instead of writing. The PCR OI consolidated during the week and closed at 0.94. The implied volatility (IV) of call options closed 17.12% while the
average IV of put options ended at 16.92%. The Nifty VIX closed at 18.15%. Almost all the derivative data is positive and FIIs are continuously buying since last 4
trading session in both cash and derivative segments. They bought around ̀ 4500 crores in cash segment in last 4 trading sessions. Nifty has strong support around
7600 levels as we have observed put writing in 7600 strike put options. Nifty can test 7900 level this week.
WEEKLY VIEW OF THE MARKET
NIFTY TOTAL OPEN INTEREST (in share)
®
FIIs ACTIVITY IN F&O IN LAST TEN SESSIONS
(Derivative segment) `(Cr)
CANBK (JUL FUTURE)
Buy: Above `455
Target: `469
Stop loss: `450
HEROMOTOCO
Buy JUL 2550. PUT 59.00
Sell JUL 2500. PUT 43.00
Lot size: 125
BEP: 2534.00
Max. Profit: 4250.00 (34.00*125)
Max. Loss: 2000.00 (16.00*125)
OPTIONSTRATEGY
FUTURESTRATEGY
LICHSGFIN
Buy JUL 340. CALL 12.20
Sell JUL 350. CALL 9.10
Lot size: 1000
BEP: 343.10
Max. Profit: 6900.00 (6.90*1000)
Max. Loss: 3100.00 ( 3.10*1000)
RELIANCE
Buy JUL 1060. CALL 26.00
Sell JUL 1100. CALL 14.00
Lot size: 250
BEP: 1072.00
Max. Profit: 7000.00 (28.00*250)
Max. Loss: 3000.00 (12.00 *250)
BULLISH STRATEGY
DERIVATIVE STRATEGIES
TATAPOWER (JUL FUTURE)
Buy: Above `107
Target: `115
Stop loss: `104
CAIRN (JUL FUTURE)
Sell: `354
Target: `342
Stop loss: `358
Below
BEARISH STRATEGY
FIIs ACTIVITY IN INDEX FUTURE (F&O) IN LAST WEEK
(Derivative segment) `(Cr)
560.98
-10.15
-324.23
-47.41
-266.88-400.00
-300.00
-200.00
-100.00
0.00
100.00
200.00
300.00
400.00
500.00
600.00
700.00
27-Jun 30-Jun 01-Jul 02-Jul 03-Jul
207.65
-343.95
515.87
-1012.25
-76.20
121.20
-158.11
999.92
1240.81
-1203.95-1500.00
-1000.00
-500.00
0.00
500.00
1000.00
1500.00
20-Jun 23-Jun 24-Jun 25-Jun 26-Jun 27-Jun 30-Jun 01-Jul 02-Jul 03-Jul
0.00
5.00
10.00
15.00
20.00
25.00
30.00
35.00
40.00
45.00
19-Jun 20-Jun 23-Jun 24-Jun 25-Jun 26-Jun 27-Jun 30-Jun 01-Jul 02-Jul 03-Jul
1093650
217250410050 473500
1201300
1912350
2539650
3863850
3218700
7205750
2070350
3795400
2736600
31898003135850
4391300
2835600
1432100
887150
270600
799150
104000
1000000
2000000
3000000
4000000
5000000
6000000
7000000
8000000
7000 7200 7300 7400 7500 7600 7700 7800 7900 8000 8100
Call Put
8

9
BHARTIARTL 15044000 14648000 -2.63 0.36 0.30 -0.06 30.59 30.86 0.27
DLF 33176000 33194000 0.05 0.59 0.49 -0.10 46.39 53.49 7.10
HINDALCO 25328000 31486000 24.31 0.48 0.58 0.10 39.97 46.02 6.05
HINDUNILVR 6625500 6143000 -7.28 0.23 0.23 0.00 25.96 28.26 2.30
ICICIBANK 13219750 10986000 -16.90 0.48 0.82 0.34 29.84 36.87 7.03
IDEA 40354000 38390000 -4.87 0.40 0.42 0.03 34.20 35.79 1.59
INFY 3184750 3307625 3.86 0.54 0.54 0.00 32.99 40.70 7.71
ITC 28739000 24978000 -13.09 0.63 0.84 0.21 27.65 30.89 3.24
JPASSOCIAT 125336000 150592000 20.15 0.52 0.40 -0.11 53.75 60.59 6.84
NTPC 66162000 65962000 -0.30 0.27 0.25 -0.02 34.59 36.14 1.55
ONGC 25557000 23751000 -7.07 0.47 0.42 -0.05 36.49 38.33 1.84
RANBAXY 6689000 6598000 -1.36 0.43 0.65 0.22 33.31 34.15 0.84
RCOM 51708000 57806000 11.79 0.37 0.35 -0.03 49.33 50.48 1.15
RELIANCE 21249000 22858500 7.57 0.46 0.40 -0.06 25.76 27.92 2.16
NIFTY 14052900 14353000 2.14 0.92 0.94 0.02 17.04 17.12 0.08
SAIL 52728000 53628000 1.71 0.38 0.31 -0.08 44.67 49.75 5.08
SBIN 4508250 4921625 9.17 0.65 0.75 0.09 31.16 37.23 6.07
TATASTEEL 16492000 17713000 7.40 0.64 0.56 -0.08 32.57 37.09 4.52
IMPORTANT INDICATORS OF NIFTY AND OTHER ACTIVE FUTURE CONTRACTS
OPEN INTEREST PCR RATIO IMPLIED VOLATILITY
# SCRIPTS PREV. CURRENT % PREV. CURRENT PREV. CURRENT WEEK WEEK CHANGE WEEK WEEK CHANGE WEEK WEEK CHANGE
#
DERIVATIVES
Put Call Ratio Analysis : The Put-Call open interest ratio of Nifty has increased to
0.94 from 0.92. At the end of the week, the maximum stocks had a negative of
change in put call open interest ratio.
Implied Volatility Analysis : The Implied Volatility (IV) for Nifty futures this week
has increased to 17.12% from 17.04%. The IV of the stock futures has changed this
week ranging from 0.08 to 7.71%.
Open Interest Analysis : The open interest for the index at the end of this week
has increased by 2.14% as compared to the previous week. All future stocks saw
changes in their open interest ranging from -16.90% to 24.31%. HINDALCO has the
maximum increase in open interest as compared to other stocks.
Statistical Analysis·
Open 7550.00 High 7773.90
Low 7512.30 Close 7736.05
NIFTY & IV CHART NIFTY ANALYSIS
®# 30 Days ATM IV
12
15
18
21
24
27
7400
7500
7600
7700
7800
27-Jun 30-Jun 01-Jul 02-Jul 03-Jul
Nifty Close IV

Chilli futures (July) is expected to turn hotter & rise towards 10400 levels, pushed up by lower stocks & delayed sowing. Lower cold storage stocks reported in the domestic market mainly Guntur is around 30 - 35 lakh bags (1 bag = 40kgs) as compared to the 50 lakh bags stored normally. It is reported that in Andhra Pradesh, as of now deficient rains have no impact on the sowing progress, in the core chilli growing areas; however land preparation and transplanting activity likely to delay by 15 – 20 days in some parts. Cardamom futures (Aug) is likely to trade on a bullish note & test 1000 levels. The weather conditions have not improved as expected in major cardamom growing tracts such as Kumily, Kattappana and Vandanmettu. The deficient southwest monsoon has created apprehensions about a possible delay in the new crop. It is estimated that cardamom production as per current situation may be around 24,000 tons during 2014 -15 year. On the other hand, due to lower arrivals the auctioneers have decided to suspend the auction till July 11. Jeera futures (July) would probably consolidate in the range of 10950-11500 levels. The bearish fundamentals of higher production during the current year and carry forward stocks might continue to pressurize the counter. Turmeric futures (July) is likely to witness a consolidation in the range of 6100-6700 levels. Good quality of yellow spice continues to fetch good price, while the average is getting lukewarm demand in Erode markets. The local traders are buying Salem hybrid, Erode hybrid and Erode sanna (thin) variety turmeric. On the supply side, sowing may get delayed & commence by mid-July in growing regions like Andhra Pradesh, Tamil Nadu, Maharashtra.
SPICES
Volatile movement may continue in bullion counter which may remain in range in near term. Geopolitical tensions in Middle East and Ukraine coupled with decline in greenback will continue to support its prices. Meanwhile economic data in US have capped the upside. U.S. added more jobs last month than forecast, curbing demand for safe haven asset gold. According to latest labor department figures “U.S. employers added 288,000 workers in June, pushing down the jobless rate to 6.1 percent, a level the Fed didn't expect to see before the end of the year” On domestic bourses movement of local currency rupee will impact the bullion counter which can move in range of 59.40-60.3. Gold may move in the range of 27000-28000 in MCX. White metal silver can hover in the range of 43000-46000. COMEX gold has advanced 9.8 percent this year as the Federal Reserve stated that it will keep interest rates low for a considerable time after ending bond purchases, while unrest in Iraq and Ukraine spurred demand for a haven. The metal plunged 28 percent in 2013, the most in three decades, as the U.S. economy gained traction. According to World Gold Council “Asia's gold demand will likely pick up through the rest of the year as China's economy improves and hopes grow that India will lift its import curbs”. China's demand grew to a record 1,100 metric tonnes last year, while India, the world's No. 2 consumer, was estimated at around 975 tonnes.
BULLIONS
10
®
Base metals pack may remain with upside bias as better data from US and China along with dwindling stockpiles can assist its prices. China's official data indicated stronger manufacturing activity for the fourth straight month in June and looks set to rise in coming months, due to stimulus measures. Red metal copper can trade in the range of 415-435. Battery metal lead can move in the range of 124-133 in MCX. Zinc can hover in range of 126-135. Good auto sales numbers have also supported the price of zinc and lead recently. U.S. auto sales hit levels in June not seen since before the financial crisis that led to the bankruptcy of two American automakers, posting the best annualized figures in eight years. Nickel prices may hover in range of 1080-1180 in MCX. According to a latest update from the International Nickel Study Group (INSG), global Nickel consumption will continue to increase this year, although at a lower rate than in recent years, with China being the main growth market. The implementation of the Indonesian export ban on nickel ore which took effect in January 2014 is expected to reduce production in that country and could result in a further increase in nickel ore exports from the Philippines. Aluminum can move in the range of 110-117. Investigation by authorities in China into alleged fraud at Qingdao Port isn't having a broader impact on the industry. Inquiry into allegations that copper and aluminum stockpiles may have been pledged multiple times as collateral for loans involves only very small part of the overall stockpiles.
BASE METALS
Geopolitical uncertainty and movement of local currency rupee can give further direction to the crude oil prices .Meanwhile any increase in Iraq and Ukraine tensions can cap the downside. Crude oil prices may trade in range of 6100-6400 in MCX and $102-108 in NYMEX. Fighting in Iraq has been concentrated in the north, where insurgents from a breakaway al-Qaeda group, now known as the Islamic State, captured the city of Mosul in June. The nation, the second-largest producer in the Organization of Petroleum Exporting Countries, will ship 2.8 million barrels a day this month, close to a record high. Libya will start shipping from Es Sider and Ras Lanuf at full capacity after taking back control from rebels, according to National Oil Corp. The country has become OPEC's smallest producer the past year because of unrest. Natural gas prices may move on mixed note in range of 250-275 in MCX. According to U.S. Energy Information Administration “natural gas storage in the U.S. in the week ended June 27 rose by 100 billion cubic feet, in line with expectations “. The five year average change for the week is an increase of 68 billion cubic feet. This week's weather forecast calls for a warming trend over the eastern Midwest, the Southeast and parts of the Southwest. Somewhat cooler temperatures are expected in the western part of the Midwest and in the Northwest. Storm Arthur which has been upgraded to a Category 1 hurricane is expected to hit the larger part of East Coast in the US in this week.
ENERGY COMPLEX
Mustard futures (Aug) is expected to take support above 3450 levels. It is reported that the arrival of the seeds have declined at the spot markets. Moreover, the delay in monsoon has boosted mustard oil prices in the domestic markets. Mustard prices are ruling flat in Indore mandis for the past some time however, have gained to `4,200-`4,250/quintal. Similarly, raida has also gained & quoting at `3,000-`3,100/quintal. The downside in soybean futures (Oct) might get extended towards 3640 levels, breaching 3710 levels. The news of monsoon strengthening at the start of the key planting month may bring big relief to the soybean growers. Moreover, the negative factor such as demand diversion of international meal buyers towards South-America due to their competitive prices & bearish sentiments hovering in the CBOT market may pull down the bean prices on the national bourse. The recent report from the U.S Dept. of Agriculture cited that estimated farmers will plant a record 84.84 million acres this year. Market participants may remain cautious with series of data scheduled to be released in the week ahead. These are as follows: Weekly Export Sales (10th July), crop production, weekly weather & crop bulletin & World Agricultural Supply and Demand Estimates Report (11th July), crop progress report (14th July). CPO futures (July) is likely to consolidate in the range of 515-535 levels. Malaysian palm oil prices are seen to remain in bearish zone as the buyers interest has curbed because the ringgit has hit its highest in more than seven months. The investors would be closely watching the data on Malaysia's end June palm oil stocks, exports and production on July 10 to gauge supply and global demand for the tropical oil.
OIL AND OILSEEDS
OTHER COMMODITIES
Kapas futures (Apr) is expected to trade higher to test 1010 levels, taking support above 960 levels. The forecast of exports for the crop year ending September has been raised by 27% with demand strong for overseas buyers. The countries such as Bangladesh, Turkey, Indonesia and Cambodia are fast lapping up cotton from India to feed their export-focused garment industries. The exports are pegged at 114 lakh bales (101 lakh bales) this year. The total demand may touch 401 lakh bales against 385 lakh bales in the same period last year. The one sided fall in mentha oil futures (July) might get extended towards 670 levels on reports of higher availability. The spot prices at Chandausi are hovering around Rs.690-695 per kg. Harvesting has been progressing in districts of U.P, Bihar, Punjab and Haryana. It is reported that around 85-90% harvesting has been done in Chandausi, Sambhal, Barabanki and Rampur region of Uttar Pradesh. On a global front, mint consuming segments are shifting towards synthetic Mentha oil and the bulk consumers have turned to Synthetic one as it is cheaper to natural mentha. Chana futures (Aug) is likely to extend the bearish downtrend to test 2730 levels. At the spot markets, the pulses prices are under selling pressure as the stockists are releasing their inventories on apprehension of further fall in prices as the Government is taking action to control the inflation. Sugar futures (Aug) might consolidate in the range of 3050-3180 levels. The sweetener is under pressure of ample supply at the spot markets & hence facing lukewarm demand from the stockiest as they are keeping away from bulk buying. Currently, the Vashi wholeslale market carries about 115- 120 truckloads of inventories.

11
TECHNICAL RECOMMENDATIONS
COMMODITY
CRUDE OIL MCX (JULY) contract closed at `6210.00 on 3rd July '14. The contract made its high of
`6499.00 on 23rd June '14 and a low of ̀ 5950.00 on 5th May '14. The 18-day Exponential Moving Average
of the commodity is currently at ̀ 6291. On the daily chart, the commodity has Relative Strength Index (14-day) value of 46. One can buy in the
range 6210-6190 with the stop loss of ̀ 6160 for a target of ̀ 6320.
NATURAL GAS MCX (JULY) contract closed at 261.60 on 3rd July '14. The contract made its high of
`290.50 on 18th June '14 and a low of ̀ 258.00 on 27th May '14.The 18-day Exponential Moving Average of
the Commodity is currently at ̀ 270.19.
On the daily chart, the commodity has Relative Strength Index (14-day) value of 39.One can buy in the
range 260-257 with the stop loss of ̀ 252 for target of ̀ 270.
`
NICKEL MCX (JULY) contract closed at 1181.80 on 3rd July '14. The contract made its high of 1193.70
on 3rd July '14 and a low of `1052.90 on 12th June '14.The 18-day Exponential Moving Average of the
Commodity is currently at ̀ 1143.
On the daily chart, the commodity has Relative Strength Index (14-day) value of 62.50. One can buy in
the range 1165-1155 with the stop loss of ̀ 1140 for a target of ̀ 1220.
` `
®
CRUDE OIL MCX (JULY)
NATURAL GAS MCX (JULY)
NICKEL MCX (JULY)
NOTES : 1) These levels should not be confused with the daily trend sheet, which is sent every morning by e-mail in the name of Daily report- commodities (Morning Mantra).
2) Sometimes you will find the stop loss to be too far but if we change the stop loss once, we will find more strength coming into the commodity. At the moment, the stop loss will be far as we are seeing the graphs on weekly basis and taking a long-term view and not a short-term view.
EXCHANGE COMMODITY CONTRACT CLOSING DATE TREND TREND RATE TREND SUPPORT RESISTANCE CLOSING
PRICE CHANGED CHANGED STOP/LOSS
NCDEX SOYABEAN JULY 3962.00 05.06.14 DOWN 4401.00 - 4150.00 4280.00
NCDEX JEERA JULY 11200.00 22.05.14 UP 11125.00 10600.00 - 10300.00
NCDEX CHANA JULY 2807.00 15.05.14 DOWN 3233.00 - 3000.00 3100.00
NCDEX RM SEEDS JULY 3488.00 06.03.14 UP 3564.00 3400.00 - 3300.00
MCX MENTHA OIL JULY 701.80 29.05.14 SIDEWAYS
MCX CARDAMOM JULY 959.60 29.05.14 DOWN 907.60 - 970.00 980.00
MCX SILVER SEP 44847.00 19.06.14 UP 44311.00 42500.00 - 41000.00
MCX GOLD AUG 27464.00 19.06.14 UP 27611.00 27000.00 - 26200.00
MCX COPPER AUG 434.60 26.06.14 UP 424.95 420.00 - 410.00
MCX LEAD JULY 133.50 12.06.14 SIDEWAYS
MCX ZINC JULY 130.15 23.04.14 UP 126.45 127.00 - 124.00
MCX NICKEL JULY 1181.80 03.07.14 UP 1181.80 1120.00 - 1080.00
MCX ALUMINUM JULY 114.40 01.05.14 DOWN 106.35 - 115.00 116.00
MCX CRUDE OIL JULY 6210.00 12.06.14 UP 6290.00 6190.00 - 6150.00
MCX NATURAL GAS JULY 261.60 15.05.14 SIDEWAYS
TREND SHEET
Closing as on 03.07.14

COMMODITY
NEWS DIGEST
Bullion counter traded on positive note with mixed bias. SPDR gold holdings performance was steady with investment in ETF was a tad higher from 782 tonnes to 785 tonnes. Physical demand from China and India the two largest consumers in the world have been continuously lower. Recent data showed China's gold imports from Hong Kong dropped in May to the lowest level since January last year with Net gold inflows into China from Hong Kong fell 22% to 52.6 MT in May. Crude oil counter ended the week on negative note extending last week losses tracking stronger greenback. Libya's government said it had reached a deal with a rebel leader controlling oil ports involving the handover of the last two terminals, potentially making an extra 500,000 barrels per day (bpd) of crude available for export. Base metal counter extended last week gains on tight supply and firm demand along with good economic data. Positive manufacturing number, the inventory numbers from LME, especially for Aluminum was supportive so we saw a good amount of price movement in the white metal. Good payroll data gave support to the base metals counter last week.US Non-Farm Employment Change gained by 64,000 to 288,000 in June as against a rise of 224,000 in May. Trade Balance at a deficit of $44.4 billion in May from earlier deficit of $47 billion a month ago. Unemployment Claims rose marginally by 2,000 to 315,000 for the week ending on 27th June 2014 with respect to 313,000 in prior week. Unemployment Rate fell to 6.1 percent in June when compared to 6.3 percent in May. ISM Non-Manufacturing PMI slipped by 0.3 points to 56 mark in June from 56.3-level in May. Recently Spanish Services Purchasing Managers' Index (PMI) dropped by 0.9 points to 54.8-mark in June as against a rise of 55.7-level in May. In agri complex, mentha oil prices on the national bourse fell the most by 8.48%.Weak demand against ample inventories, following higher supplies from producing regions at spot market weighed on the counter. Among other losers were cotton & chana pressurized by their bearish fundamentals. The Cotton Advisory Board estimated the output to rise 7% to 390 lakh bales (of 170 kg each) in the cotton season ending September 2014. It was also reported that the all India average yield has gone up to 565.36 kg/ha (518.03 kg/ha). Chana prices faced selling pressure as the stockists are releasing their inventories on apprehension of further fall in prices as the Government is taking action to control the inflation. Guar complex traded with a negative bias as on export front, demand of guar products are decreasing in line with appreciation in Rupee. Also, demand of guar products among major importers is also weak. Giving a snapshot of the spot market, turmeric prices rose on the back of demand for hybrid variety & stockiest quoting higher price for the same. Coriander prices gained on reports of lower stocks. In Kota Mandi, current year stocks reported 3 – 4 lakh bags as compared to the last year 10 lakh bags. Oilseeds complex traded with a negative bias tracking weak sentiments of the international markets with USDA raising the prospects of higher crop this season.
WEEKLY COMMENTARY
WEEKLY STOCK POSITIONS IN WAREHOUSE (NCDEX)
COMMODITY UNIT 26.06.14 03.07.14 DIFFERENCEQTY. QTY.
BARLEY MT 9237 8388 -849CASTOR SEED MT 152898 156520 3622CHANA MT 121293 123112 1819CORIANDER MT 500 500 0COTTONSEED OILCAKE MT 53574 46359 -7215GUARGUM MT 7012 7527 515GUARSEED MT 5141 4318 -823JEERA MT 1596 1596 0MAIZE MT 19907 20254 347RAPE MUSTARD SEED MT 82685 81548 -1137SOYABEAN MT 39737 39757 20SUGAR MT 26184 25115 -1069TURMERIC MT 550 570 20WHEAT MT 7659 7659 0
COMMODITY UNIT 26.06.14 02.07.14 DIFFERENCE
QTY. QTY.
CARDAMOM MT 16.70 9.10 -7.60
COTTON BALES 85600.00 83800.00 -1800.00
KAPASIA KHALLI MT 99.10 99.10 0.00
GOLD KGS 45.00 45.00 0.00
GOLD MINI KGS 6.50 445.80 439.30
GOLD GUINEA KGS 16.96 8.15 -8.81
MENTHA OIL KGS 1500825.40 1797836.80 297011.40
SILVER (30 KG Bar) KGS 8749.25 8749.25 0.00
•India's central bank has sought quotes from banks to
swap gold in its own vaults for international standard
gold, aiming to improve the management of its
reserves.
•The Perth Mint's sales of gold coins and bars climbed to
a four-month high in June.
•Japanese aluminium buyers will mostly pay record high
premiums of $400-$408 per tonne over London Metal
Exchange prices for July-September shipments.
•Japan's crude steel output is expected to rise 0.9
percent in the July-September quarter from a year
earlier.
•London house prices soared 26 percent over the past
year in the biggest annual jump since 1987.
•India's monsoon rainfall in the month of June was 43%
below average, making it the worst first month since
2009, when the season turned out to be the driest since
1972.
•The Cotton Advisory Board has estimated cotton output
to rise seven per cent to 390 lakh bales (of 170 kg each)
in the cotton season ending September 2014.
•Live storage available in 85 important reservoirs of the
country as on July 3, 2014 was 36.873 BCM which is 24%
of total live storage capacity of these reservoirs. This
storage is 83% of the storage of corresponding period of
last year and 112% of storage of average of last ten
years.
WEEKLY STOCK POSITIONS IN WAREHOUSE (MCX)
12
®
NCDEX TOP GAINERS & LOSERS (% Change) MCX TOP GAINERS & LOSERS (% Change)
8.29
4.09
2.56 2.54
1.82
-8.48
-3.12
-2.42
-1.25-0.93
-10.00
-8.00
-6.00
-4.00
-2.00
0.00
2.00
4.00
6.00
8.00
10.00
POTATO NICKEL M COPPER SILVER 1000 ALUMINIUM MENTHA OIL COTTON CRUDE OIL NATURAL GAS GOLD M
4.11
3.23
2.09
1.35
0.97
-3.87 -3.78 -3.69
-2.49 -2.44
-5.00
-4.00
-3.00
-2.00
-1.00
0.00
1.00
2.00
3.00
4.00
5.00
CORIANDER SOYAMEAL COPPER MAIZE KHARIF CHILLI TEJA BAJRA GUAR SEED GUAR GUM COTTON SEED CHANA 1 MT

COMMODITY
COMMODITY EXCHANGE CONTRACT 27.06.14 03.07.14 CHANGE%
ALUMINIUM LME 3 MONTHS 1885.00 1935.00 2.65
COPPER LME 3 MONTHS 6945.00 7175.00 3.31
LEAD LME 3 MONTHS 2161.00 2195.50 1.60
NICKEL LME 3 MONTHS 18920.00 19875.00 5.05
ZINC LME 3 MONTHS 2185.00 2239.00 2.47
GOLD COMEX AUG 1320.00 1320.60 0.05
SILVER COMEX SEPT 21.13 21.14 0.01
LIGHT CRUDE OIL NYMEX AUG 105.74 104.06 -1.59
NATURAL GAS NYMEX AUG 4.41 4.41 -0.07
PRICES OF METALS IN LME/ COMEX/ NYMEX (in US $)
WEEKLY STOCK POSITIONS IN LME (IN TONNES)
COMMODITY STOCK POSITION STOCK POSITION DIFFERENCE
26.06.14 03.07.14
ALUMINIUM 5066250 5066400 150
COPPER 156825 156775 -50
NICKEL 305862 305394 -468
LEAD 192175 193700 1525
ZINC 668775 666775 -2000
INTERNATIONAL COMMODITY PRICES
COMMODITY EXCHANGE CONTRACT UNIT 27.06.14 03.07.14 CHANGE(%)
Soya CBOT NOV Cent per Bushel 1228.00 1141.50 -7.04
Maize CBOT JULY Cent per Bushel 443.00 418.50 -5.53
CPO BMD SEPT MYR per MT 2445.00 2424.00 -0.86
Sugar LIFFE AUG 10 cents per MT 481.10 470.10 -2.29
13
®
SPOT PRICES (% change) Kharif sowing staggering below normal (as on 27 June)
Monsoon has a strong hold on India's agricultural output. Majority of the crops in India
are dependent on the monsoon. But this year, According to Met Department forecast,
the monsoon rainfall was below normal for fourth year in 2014 out of last six years.
The southwest monsoon (June-September) rainfall at 41% below normal till 26 June
2014 has mainly impacted the kharif crop sowing in the current season.
As per the latest reports of sowing of kharif crops, kharif sowing area touched 131 lakh
hectares as on 27 June, sharply below the normal coverage of 158 lakh hectares as on
date. The delayed southwest monsoon rainfall has hit sowing progress of kharif crops.
According to ministry of Agriculture, the rice sowing has declined by almost 45 per
cent to 21.91 lakh hectares stands sharply below the normal coverage of 40.46 lakh
hectares. Maximum decline in area under paddy is witnessed in Punjab, where as on
date the main kharif crop has been planted in 9.15 lakh hectares as compared to
14.30 lakh hectares last season. It is followed by Chattisgarh, where acreage under
paddy has come down to 0.41 lakh hectares from 5.30 lakh hectares last season.
However, the pulses sowing at 4.30 lakh hectares and coarse cereals sowing at 19.54
lakh hectares was above normal coverage of 2.1 lakh hectares and 17.2 lakh hectares
as on date.
The area under oilseeds crops at 4.79 lakh hectares was also sharply below normal
level of 14 lakh hectares as on 27 June.
The planting of sugarcane and cotton is in progress. Sugarcane has been planted in
43.92 lakh hectares and cotton in 29.07 lakh hectares. Further, the area under jute
and mesta stood at 7.47 lakh hectares as on 27 June 2014.
However, according to Met Department forecast, there will be a good rainfall after
July 7 Impact of El-nino is also expected to be subdued than what was expected
earlier. Met department has forecasted monsoon to be below normal at 93 per cent
of the long period average.
The government has asked the states to keep aside 10 per cent of funds available
under Rashtriya Krishi Vikas Yojana (RKVY) for undertaking appropriate interventions
to mitigate drought like situation, if any, arising out of deficient rainfall.
-2.59
-2.08
-1.74
-0.82
-0.47
-0.36
-0.27
-0.24
-0.16
-
0.54
0.61
0.87
1.26
1.77
1.96
3.07
4.32
-3.00 -2.00 -1.00 0.00 1.00 2.00 3.00 4.00 5.00
CRUDE PALM OIL (KANDLA)
RAW JUTE (KOLKATA)
RUBBER (KOCHI)
PEPPER MALABAR GAR (KOCHI)
GUAR SEED (JODHPUR)
GOLD 10 GMS (MUMBAI)
REFINED SOYA OIL (INDORE)
GUR (MUZAFFARNGR.)
MUSTARD (JAIPUR)
CHANA (DELHI )
GUAR GUM (JODHPUR)
SILVER 5 KG (DELHI)
JEERA (UNJHA)
MASOOR (INDORE)
TURMERIC (NIZAMABAD)
BARLEY (JAIPUR)
SOYABEAN (INDORE)
CORIANDER (KOTA)
Kharif Crops (June-Sept) Sowing Progress as on 27 June(in lakh ha.)
Crop Normal as on 2014-15 2013-14 2012-13
27 June
Rice 40.46 21.91 39.12 29.66
Pulses 2.10 4.30 10.52 N.A
Coarse Cereals 17.19 19.54 29.33 5.59
Oilseeds 14.02 4.79 9.01 11.82
Sugarcane 47.05 43.92 47.43 49.35
Cotton 29.28 29.07 55.76 31.38
jute & Mesta 8.07 7.47 8.15 8.07
Total 158.17 131.00 199.32 135.87
Source: Ministry of Agriculture

CURRENCY
Currency Table
Currency Pair Open High Low Close
USD/INR 60.31 60.60 59.90 60.02
EUR/INR 82.16 82.85 81.60 81.90
GBP/INR 102.81 103.57 102.58 102.75
JPY/INR 59.54 59.82 58.70 58.90
(Source: FX Central, Open: Monday 9.00 AM IST, Close: Thursday (5.00 PM IST)
News Flows of last week
02nd July The number of Americans filing new claims for unemployment benefits rose marginally last week.
02nd July The pace of growth in the U.S. services sector slowed slightly in June
03rd July Euro zone economy still at risk, interest rates to stay low: Draghi
03rd July Global economy ends first half on a high: PMI
03rd July U.S. trade deficit narrows as exports hit record high
03rd July ECB says measures will push inflation up, but money-printing still possible
03rd July U.S. job growth surges, unemployment rate near six-year low
EUR/INR (JULY) contract closed at 81.90 on 03rd July'14. The contract made its high of `82.85 on 01st July'14 and a low of `81.60 on 03rdJuly'14 (Weekly Basis). The 14-day Exponential Moving Average of the EUR/INR is currently at ̀ 81.85.
On the daily chart, EUR/INR has Relative Strength Index (14-day) value of 46.61. One can sell below 81.00 for a target of 80.00 with the stop loss of 81.55
`
JPY/INR (JULY) contract closed at 58.90 on 03rdJuly'14. The contract made its high of 59.82 on 30th June'14 and a low of `58.70 on 03rd July'14 (Weekly Basis). The 14-day Exponential Moving Average of the JPY/INR is currently at ̀ 59.02
On the daily chart, JPY/INR has Relative Strength Index (14-day) value of 59.11. One can sell below 58.50 for a target of 57.50 with the stop loss of 59.05.
Market Stance
Indian rupee rose sharply in the week gone by and tested three week high as
sentiment remain positive for local currency on upbeat global and local
equities. Indian share market hit it's all time high on hope of continuation of
foreign fund inflows. FII's continued to pump money into Indian stocks and
bonds in a search of high yielding assets, with yields and volatility at all time
lows globally. The strong PMI's across the globe also added to the positive
sentiment. India's HSBC Manufacturing PMI came in strong at 51.5 as against
51.4 in the previous month, showing a continued expansion in manufacturing.
Moreover, India's central bank last week restored the overseas investment
limit of Indian companies to 400 per cent of the firm's net worth after the
rupee rebounded from last year's record high levels against the dollar.
EUR/INR
USD/INR (JULY) contract closed at ̀ 60.02 on 03rd July'14. The contract made its high of ̀ 60.60 on 30th July'14 and a low of ̀ 59.90 on 02nd July'14 (Weekly Basis). The 14-day Exponential Moving Average of the USD/INR is currently at ̀ 60.10.
On the daily chart, the USD/INR has Relative Strength Index (14-day) value of 50.80. One can sell below 59.65 for a target of 58.65 with the stop loss of 60.10.
GBP/INR (JULY) contract closed at 102.75 on 03rd July'14. The contract made its high of 103.57 on 01st July'14 and a low of ̀ 102.58 on 03rd July'14 (Weekly Basis). The 14-day Exponential Moving Average of the GBP/INR is currently at ̀ 102.40.
On the daily chart, GBP/INR has Relative Strength Index (14-day) value of 63.35. One can buy above 103.25 for a target of 104.50 with the stop loss of 102.60.
`
USD/INRTechnical Recommendation
GBP/INR JPY/INR
Economic gauge for the next week
Date Currency Event PREVIOUS
07th July EUR German Industrial Production n.s.a. and w.d.a. (YoY) 1.80%
08th July EUR German Trade Balance (euros) 17.4B
08th July GBP Manufacturing Production (YoY) 4.40%
08th July GBP Industrial Production (YoY) 3.00%
09th July USD Fed Releases Minutes from June 17-18 FOMC Meeting
10th July EUR ECB Publishes Monthly Report
10th July GBP Total Trade Balance (Pounds) -£2543
10th July GBP BOE Asset Purchase Target 375B
10th July GBP Bank of England Rate Decision 0.50%
10th July USD Initial Jobless Claims
11th July EUR German Consumer Price Index (YoY) 1.00%
11th July GBP Construction Output s.a. (YoY) 4.60%
14
®®

IPO
IPO NEWSIPO NEWS
Lavasa Corporation files DRHP with SEBI
Lavasa Corporation, the real estate subsidiary of Hindustan Construction Company (HCC), has filed draft red herring prospectus (DRHP) with capital markets regulator Securities and Exchange Board of India (SEBI) for its public issue.
The company has filed its DRHP in order to undertake an initial public offering of its equity shares of ̀ 10 each aggregating to ̀ 750 crore. The issue is subject to receipt of requisite regulatory approvals, market conditions and other considerations.
HCC holds a 65 percent stake in Lavasa. Gautam Thapar-controlled Avantha Group is the second-largest shareholder with a 16 percent stake. Other shareholders are Venkatesh Hatcharies (13 percent) and Pune-based investor Vinay Maniar (6 percent). In 2010, Lavasa had planned to raise ̀ 2,000 crore by selling 10 percent of promoter's stake but that was abandoned due to the weakness in market.
Videocon d2h likely to bring IPO this fiscal
Direct to home service provider Videocon d2h is likely to go ahead with its proposed public float (IPO) plan this financial year. The company had received the permission from market regulator Sebi in March 2013 for its proposed ̀ 700-crore IPO but did not launch the same due to bad market conditions. The satellite TV arm of the diversified Videocon group today formally announced the change of its name from Bharat Business Channel to Videocon d2h. The company expects an uptick in the sales of 4K or UHD panels in the festive season and it would be targeting its existing customer base. The company caters to 11 million customers and has been growing at 40 percent CAGR.
Coffee Day Resorts to raise up to ̀ 1,500 crore via IPO
The holding company of Cafe Coffee Day, India's biggest cafe chain, is gearing up to mop up ̀ 1,200-1,500 crore through a proposed initial public offering (IPO) in about nine to 12 months.
IndiGo IPO gathers steam
Several bankers are meeting Indigo management in Paris to compete for about ̀ 2400 crores IPO that the company is planning to do. Indigo is in talks with several bankers including, JM Financial, Deustche Bank, Axis Capital and some global bankers to discuss structure and way forward for the IPO. It is likely to be the fourth and the latest entrant in the space of listed aviation companies in India. CAPA says that the airline, which is number-2 in terms of market share, is looking at a listing in the third quarter.
15
®*Closing prices as on 03-07-2014
IPO TRACKER
Wonderla Holidays Entertainment 1244.71 181.25 9-May-14 125 164.75 200.55 60.44
Just Dial service provider 10402.12 950.11 5-Jun-13 530.00 590.00 1482.45 179.71
Repco Home Fin Finance 2945.14 270.39 1-Apr-13 172.00 165.00 473.8 175.47
V-Mart Retail Trading 693.35 123.00 20-Feb-13 210.00 216.00 386.05 83.83
Bharti Infra. Telecom 50482.97 4533.60 28-Dec-12 220.00 200.00 267.1 21.41
PC Jeweller Jewellary 2420.54 609.30 27-Dec-12 135.00 135.50 135.15 0.11
CARE Rating Agency 3165.93 540.00 26-Dec-12 750.00 949.00 1091.7 45.56
Tara Jewels Jewellary 274.02 179.50 6-Dec-12 230.00 242.00 111.3 -51.61
VKS Projects Engineering 28.35 55.00 18-Jul-12 55.00 55.80 0.45 -99.18
Speciality Rest. Restaurants 699.47 181.96 30-May-12 150.00 153.00 148.95 -0.70
T B Z Jewellary 1391.11 210.00 9-May-12 120.00 115.00 208.5 73.75
NBCC Construction 4705.2 124.97 12-Apr-12 106.00 100.00 392.1 269.91
MT Educare Miscellaneous 468.77 99.00 12-Apr-12 80.00 86.05 117.8 47.25
Olympic card. Media 38.9 24.75 28-Mar-12 30.00 29.95 23.85 -20.50
Multi Comm. Exc. Exchange 3437.05 663.31 9-Mar-12 1032.00 1387.00 673.8 -34.71
Indo Thai Sec. Finance 20.2 29.60 2-Nov-11 74.00 75.00 20.2 -72.70
Vaswani Inds. Steel 12.26 49.00 24-Oct-11 49.00 33.45 4.28 -91.27
Flexituff Intl. Packaging 614.54 104.63 19-Oct-11 155.00 155.00 247 59.35
Prakash Constro. Construction 46.63 60.00 4-Oct-11 138.00 145.00 3.71 -97.31
PG Electro. Consumer Durables 257.64 120.65 26-Sep-11 210.00 200.00 157 -25.24
SRS Jewellary 418.57 203.00 16-Sep-11 58.00 55.00 30.05 -48.19
TD Power Sys. Capital Goods 1074.65 227.00 8-Sep-11 256.00 251.60 323.3 26.29
Tree House Edu. Miscellaneous 1368.28 112.06 26-Aug-11 135.00 132.80 365.85 171.00
Company Sector M.Cap(In ̀ Cr.) Issue Size(in `Cr.) List Date Issue Price List Price Last Price %Gain/Loss(from Issue price)
*

16
®

MUTUAL FUND
NEWS
SBI Mutual Fund files offer document for Equity Opportunities Fund - Series I to IIISBI Mutual Fund has filed offer document with SEBI to launch a three year close ended equity scheme named as “SBI Equity Opportunities Fund-Series I to III”. The New Fund Offer price is ̀ 10 per unit. The investment objective of the scheme is to generate capital appreciation from a diversified portfolio of equity & equity related instruments.
Kotak Mutual Fund files offer document for Banking ETFKotak Mutual Fund has filed offer document with SEBI to launch an open ended exchange traded fund named as "Kotak Banking ETF". The New Fund Offer price is `10 per unit. The investment objective of the scheme is to provide returns before expenses that closely correspond to the total returns of stocks as represented by the CNX Bank Index subject to tracking errors.
Kotak Mutual Fund files offer document for Hybrid Fixed Term Plan Series 3 – 4Kotak Mutual Fund has filed offer document with SEBI to launch a close ended debt scheme named as “Kotak Hybrid Fixed Term Plan Series 3 - 4”. The New Fund Offer price is `10 per unit. The investment objective of the scheme is to generate income and minimize interest rate volatility by investing in Debt & Money Market securities that mature on or before the maturity of the scheme, and also to generate capital appreciation by investing in equity/ equity related instruments.
Deutsche MF introduces Fixed Maturity Plan - Series 73 (2 years)Deutsche Mutual Fund has launched the New Fund Offer (NFO) of DWS Fixed Maturity Plan - Series 73 (2 years), a close ended income scheme. The NFO opens for subscription on Jul 01, 2014 and closes on Jul 10, 2014. The investment objective of the scheme is to generate income by investing in debt and money market instruments maturing on or before the date of the maturity of the Scheme.
Religare Invesco MF introduces Fixed Maturity Plan-Series 24-Plan A-(735 Days)Religare Invesco Mutual Fund has launched the New Fund Offer (NFO) of Religare Invesco Fixed Maturity Plan - Series 24 - Plan A - (735 Days), a close ended income scheme. The NFO opens for subscription on Jul 04, 2014 and closes on Jul 10, 2014. The investment objective of the scheme is to generate income by investing in a portfolio of debt and money market instruments maturing on or before the date of maturity of the Scheme.
ICICI Prudential MF introduces Fixed Maturity Plan - Series - 74 - 367 Days Plan ZICICI Prudential Mutual Fund has launched the New Fund Offer (NFO) of ICICI Prudential Fixed Maturity Plan - Series - 74 - 367 Days Plan Z, a close ended income scheme. The NFO opens for subscription on Jul 03, 2014 and closes on Jul 10, 2014. The investment objective of the scheme is to generate income by investing in a portfolio of fixed income securities/ debt instruments maturing on or before the maturity of the Scheme.
Reliance MF introduces Fixed Horizon Fund XXVI- Series 33Reliance Mutual Fund has launched the New Fund Offer (NFO) of Reliance Fixed Horizon Fund XXVI- Series 33, a close ended income scheme. The NFO opens for subscription on Jul 03, 2014 and closes on Jul 07, 2014. The investment objective of the scheme is to generate returns and growth of capital by investing in a diversified portfolio of the following securities maturing on or before the date of maturity of the scheme with the objective of limiting interest rate volatility-Central and State Government securities and other fixed income/ debt securities.
17
®
NFOs WATCH
Fund Name NFO NFO Scheme Objective Fund Type Fund Class Fund Manager MinimumOpens on Closes on Amount
25-Jun-2014 16-Jul-2014 Close-Ended Growth `5000Sundaram TOP 100 - Series III - Regular Plan (G)
Venkatesan JTo generate capital appreciation from a portfolio that is substantially constituted of equity securities specified as eligible securities for Rajiv Gandhi Equity Savings Scheme, 2012. The Scheme may also invest a certain portion of its corpus in cash & cash equivalent and money market instruments from time to time of Sundaram TOP 100.
26-Jun-2014 08-Jul-2014 Close-Ended Growth `5000HDFC Fixed Maturity Plan - 750D - June 2014 Series 31 (1) Regular Plan (G)
Shobhit
Mehrotra /
Rakesh Vyas
The investment objective of the Plans under the Scheme is to generate income through investments in Debt / Money Market Instruments and Government Securities maturing on or before the maturity date of the respective Plan(s).
01-Jul-2014 10-Jul-2014 Close-Ended Growth `5000DWS Fixed Maturity Plan - Series 73 (2 years) - Regular Plan (G)
Rakesh SuriTo generate income by investing in debt and money market instruments maturing on or before the date of the maturity of the Scheme.
27-Jun-2014 10-Jul-2014 Close-Ended Growth `5000ICICI Prudential Capital Protection Oriented-Sr VI Plan D (1100D)-Reg (G)
Ashwin Jain /
Rahul Goswami
/Aditya Pagaria
/Vinay Sharma
to seek to protect capital by investing a portion of the portfolio in highest rated debt securities and money market instruments and also to provide capital appreciation by investing the balance in equity and equity related securities. The debt securities would mature on or before the maturity of the Scheme.

18
MUTUAL FUND Performance Charts
Returns (%) Risk Market Cap (%)
Scheme Name NAV Launch QAAUM 3M 6M 1Y 3Y Since Std.Dev Beta Jenson LARGE MID SMALL DEBT &
(`) Date (` Cr.) Launch CAP CAP CAP OTHER
Reliance Small Cap Fund - Growth 19.60 16-Sep-2010 566.20 44.50 59.40 114.50 26.00 19.40 N.A. N.A. 4.40 0.72 58.18 30.95 10.15
HSBC Midcap Equity Fund - Growth 31.30 19-May-2005 127.70 37.40 58.00 106.80 16.20 13.30 N.A. N.A. 2.70 8.46 73.88 11.64 6.02
Birla Sun Life Pure Value Fund - Growth 34.40 27-Mar-2008 109.20 52.60 79.50 105.20 26.50 21.80 N.A. N.A. 2.80 21.41 58.54 12.79 7.27
ICICI Prudential MidCap Fund - Growth 56.10 28-Oct-2004 329.40 37.50 52.30 97.00 20.40 19.50 N.A. N.A. 1.90 25.59 63.79 7.42 3.20
Sundaram SMILE Fund - Reg - Growth 52.20 15-Feb-2005 335.90 49.90 63.50 95.70 19.10 19.30 N.A. N.A. 2.90 6.37 64.17 28.04 1.41
UTI Mid Cap Fund - Growth 59.60 09-Apr-2004 964.00 32.80 51.30 87.40 23.10 20.10 N.A. N.A. 4.00 19.83 66.24 8.95 4.98
DSP BlackRock Micro Cap Fund - Reg - G 27.90 14-Jun-2007 522.40 38.20 51.80 85.90 21.60 15.70 N.A. N.A. 3.10 N.A. 63.26 24.43 12.31
EQUITY (Diversified)
BALANCED
INCOME FUND
Note: Indicative corpus are including Growth & Dividend option. The above mentioned data is on the basis of 03/07/2014Beta, Sharpe and Standard Deviation are calculated on the basis of period: 1 year, frequency: Weekly Friday, RF: 7%
ULTRA SHORT TERM
SHORT TERM FUND
Due to their inherent long term nature, the following 3 categories have been sorted on the basis of 1 year returns
Due to their inherent short term nature, the following 2 categories have been sorted on the basis of 6month returns
Returns (%) Risk Market Cap (%)
Scheme Name NAV Launch QAAUM 3M 6M 1Y 3Y Since Std.Dev Jenson LARGE MID SMALL DEBT &
(`) Date (` Cr.) Launch CAP CAP CAP OTHER
HDFC Prudence Fund - Growth 344.60 01-Feb-1994 5833.90 28.50 41.50 55.80 16.40 20.50 N.A. 0.90 33.83 31.25 8.87 26.05
HDFC Balanced Fund - Growth 91.70 11-Sep-2000 1502.70 22.10 32.30 52.00 16.60 17.40 N.A. 1.00 26.96 40.60 3.13 29.32
ICICI Prudential Balanced - Growth 79.00 03-Nov-1999 777.20 19.30 28.10 43.80 18.20 15.10 N.A. 1.10 42.07 26.75 1.57 29.62
L&T India Prudence Fund - Growth 15.90 07-Feb-2011 60.00 20.00 27.70 43.40 16.20 14.60 N.A. 1.00 35.46 34.58 3.96 26.00
Reliance RSF - Balanced - Growth 34.20 08-Jun-2005 570.60 20.60 29.80 42.90 15.20 14.50 N.A. 1.20 53.15 13.49 5.79 27.57
Tata Balanced Fund - Plan A - Growth 137.20 08-Oct-1995 648.50 22.50 29.90 42.60 17.50 16.90 N.A. 1.20 42.99 30.10 1.72 25.18
Canara Robeco Balance - Growth 94.50 01-Feb-1993 214.00 20.40 28.20 40.40 15.10 11.20 N.A. 1.10 37.56 35.55 0.62 26.27
Returns (%) RiskAverage Yield till
Scheme Name NAV Launch QAAUM Since Std. SharpeMaturity (Days) Maturity
1W 2W 1M 6M 1Y 3Y(`) Date (`Cr.) Launch Dev.
UTI Dynamic Bond Fund - Growth 14.4 23-Jun-2010 408.70 9.80 14.80 11.00 14.00 10.10 10.10 9.40 N.A. N.A. 2816.71 N.A.
Franklin India Cor. Bond Oppor. Fund - G 13 07-Dec-2011 6224.10 11.30 7.50 9.10 11.80 9.40 N.A. 10.80 N.A. N.A. 941.70 10.50
Axis Banking Debt Fund - Growth 1198.7 08-Jun-2012 487.30 11.30 9.60 9.10 9.60 9.30 N.A. 9.20 N.A. N.A. 262.80 8.92
Franklin India Income Oppor. Fund - G 14.9 11-Dec-2009 3991.60 11.60 7.90 9.40 11.00 9.00 9.70 9.10 N.A. N.A. 744.60 10.29
Reliance RSF - Debt - Growth 17.7 09-Jun-2005 4506.70 12.70 9.90 10.20 10.90 8.80 9.30 6.40 N.A. N.A. 598.60 10.50
UTI Income Opportunities Fund - G 11.5 19-Nov-2012 554.50 17.70 11.40 10.70 11.50 8.60 N.A. 9.20 N.A. N.A. 803.88 N.A.
ICICI Prudential Regular Savings Fund - G 13.6 03-Dec-2010 4335.60 10.80 8.60 8.10 10.80 8.50 9.00 8.90 N.A. N.A. 719.05 10.18
Annualised
Returns (%) Risk Average Yield tillScheme Name NAV Launch QAAUM Since Std. Sharpe Maturity (Days) Maturity
1W 2W 1M 6M 1Y 3Y(`) Date (`Cr.) Launch Dev.
Birla Sun Life Dynamic Bond Fund - Ret - G 22.00 24-Sep-2004 9289.9 26.70 10.60 6.00 12.20 7.10 9.50 8.40 N.A N.A N.A 8.79
Birla Sun Life Medium Term Plan - Reg - G 15.70 25-Mar-2009 2957.6 15.40 10.40 11.10 12.20 9.90 10.70 9.00 N.A N.A N.A 10.56
ICICI Prudential STP - Growth 26.60 25-Oct-2001 2880.9 13.00 8.20 9.20 11.50 8.10 9.10 8.00 N.A N.A 1054.85 9.50
Kotak Income Opportunities Fund - G 13.90 11-May-2010 891.9 11.30 8.70 9.40 11.20 8.70 9.20 8.30 N.A N.A 989.15 10.50
Birla Sun Life Short Term Oppor. Fund - Reg - G 21.20 24-Apr-2003 3393.7 13.00 9.00 9.60 11.10 9.50 10.50 6.90 N.A N.A N.A 9.76
Reliance Short Term Fund - Growth 24.30 23-Dec-2002 3319.7 11.40 8.50 9.00 11.10 8.30 9.20 8.00 N.A N.A 821.25 9.26
HDFC HIF - S T P - Growth 25.60 06-Feb-2002 1422.7 12.30 8.50 8.20 11.00 8.10 9.00 7.90 N.A N.A 974.55 9.34
Annualised
Returns (%) Risk Average Yield tillScheme Name NAV Launch QAAUM Since Std. Sharpe Maturity (Days) Maturity
1W 2W 1M 6M 1Y 3Y(`) Date (`Cr.) Launch Dev.
Birla Sun Life Tre. Optimizer Plan - Ret - G 239.80 19-Apr-2002 700.70 12.20 8.80 9.40 11.80 10.80 9.80 7.40 N.A. N.A. N.A. 9.25
Franklin India Low Duration Fund - G 14.30 26-Jul-2010 2032.10 10.00 9.10 9.20 10.00 9.70 9.90 9.50 N.A. N.A. 120.45 9.60
Kotak Banking and PSU Debt Fund - G 29.20 29-Dec-1998 960.00 9.10 8.70 8.80 10.00 10.70 9.10 7.10 N.A. N.A. 69.35 9.00
Birla Sun Life Savings Fund - Ret - G 243.70 27-Nov-2001 6314.40 9.60 8.30 8.40 9.70 9.70 9.40 7.30 N.A. N.A. N.A. 9.20
IDFC Ultra Short Term Fund - Reg - G 18.30 17-Jan-2006 2204.40 10.60 9.40 9.00 9.70 9.70 9.80 7.40 N.A. N.A. 128.00 8.86
DWS Treasury Fund - Investment - G 14.50 09-Oct-2009 1813.40 10.80 9.60 8.90 9.70 8.80 9.20 8.10 N.A. N.A. 288.35 8.85
ICICI Pru. Ultra Short Term Plan - Ret - G 14.30 12-Jun-2009 1655.00 10.90 9.10 8.20 9.70 8.80 8.70 7.40 N.A. N.A. 291.90 9.01
Annualised
®

Mr. Anurag Bansal (Director, SMC Group) addressing the audience during Investor Awareness Meet organised by SMC at Bhopal.
Mr Ajay Garg (Director, SMC group) addressing the audience during Investor Awareness Meet organised by SMC at Jammu.
