a water soluble fret-based ratiometric chemosensor for hg(ii) and s2− applicable in living cell...
TRANSCRIPT

RSC Advances
PAPER
Publ
ishe
d on
31
Janu
ary
2014
. Dow
nloa
ded
by U
nive
rsity
of
Hou
ston
on
28/0
9/20
14 0
4:08
:54.
View Article OnlineView Journal | View Issue
aDepartment of Chemistry, The University o
India. E-mail: [email protected]; Fax:
ext. 424bDepartment of Chemistry, Sambhu Nath C
IndiacMolecular Biology and Genetics Labora
University, India
† Electronic supplementary informationtables, schemes, gures, characterizatio10.1039/c3ra47800a
Cite this: RSC Adv., 2014, 4, 14919
Received 19th December 2013Accepted 30th January 2014
DOI: 10.1039/c3ra47800a
www.rsc.org/advances
This journal is © The Royal Society of C
A water soluble FRET-based ratiometricchemosensor for Hg(II) and S2� applicable in livingcell staining†
Buddhadeb Sen,a Manjira Mukherjee,a Siddhartha Pal,a Koushik Dhara,b
Sushil Kumar Mandal,c Anisur Rahman Khuda-Bukhshc and Pabitra Chattopadhyay*a
A new highly sensitive and selective Hg(II) probe, 2-(rhodamine-b-hydrazido)-N-(quinolin-8-yl)acetamide
(L1) was developed and characterized. L1 specifically binds to Hg(II) in the presence of a large excess of
other competing ions with visually observable changes in both electronic and fluorescence spectral
behaviour to make possible the naked eye detection of Hg(II) at a very low level (up to 4.5 � 10�7 M)
through a fluorescence resonance energy transfer (FRET) process in HEPES buffer (1 mM, pH 7.4; 2%
EtOH) at 25 �C. The theoretical and experimental kinetic study also support the binding of Hg(II) ion to
induce the opening of the spirolactam ring in L1 for enabling the FRET process. Further studies reveal
that the selective dissociation of the L–Hg complex in the presence of sulphide anions to restore the
native structure of L1 is also useful in the detection of sulfide anions with a detection limit of a
submicromolar range in the same medium of HEPES buffer (1 mM, pH 7.4; 2% EtOH) at 25 �C. L1 couldbe employed as a FRET based time dependent reversible chemosensor for imaging Hg(II) in living cells
and whole bodies, and also could be used as an imaging probe for the detection of sulfide anions in
HeLa cells.
Introduction
Hg(II) is considered as one of the most hazardous and ubiqui-tous pollutants.1 It is widely distributed in the air, water, soil,and anthropogenic materials2 through different processes, suchas volcanic emissions, mining, solid waste incineration, and thecombustion of fossil fuels.3 Inorganic mercury and itscompounds can be accumulated in the body, and easily passesthrough biological membranes,4 such as skin, gastrointestinaland respiratory tissues and shows a high affinity for thiolgroups in proteins.5 Very low levels of mercury ions is known tocause neurological, reproductive, cardiovascular, and develop-mental disorders, DNA damage, Minamata disease,5 somekinds of autism and damage to the brain, kidneys, centralnervous system, immune system and endocrine system.4–6
In general, several traditional methods7 for the detection ofmercury ions in various samples have been developed,
f Burdwan, Golapbag, Burdwan 713104,
+91-342-2530452; Tel: +91-342-2558554
ollege, Labpur, Birbhum 731303, W.B.,
tory, Department of Zoology, Kalyani
(ESI) available: Experimental section,n data, and some spectra. See DOI:
hemistry 2014
including atomic absorption spectroscopy (AAS),8 inductivelycoupled plasma mass spectroscopy (ICP-MS),9 inductivelycoupled plasma-atomic emission spectrometry (ICP-AES),10
capillary electrophoresis-ICP-MS11 and high performance liquidchromatography-ICP-MS.12 Although these methods are quan-titative, most of these methods require expensive instrumentsand so are not well-suited for the quick in-eld detection ofHg(II) or for in vivo studies of Hg(II) in biology and toxicology.
Fluorescence techniques have become powerful tools forsensing and imaging metal ions in trace amounts because oftheir simplicity, high sensitivity and real-time monitoring witha short response time.13 Generally, Hg(II) ions are known toproduce uorescence quenching when binding to uorophoremolecules via the spin–orbit coupling effect. In consequence,the turn-off is the usual response upon binding in mostinstances. But the sensors with uorescence enhancement(turn-on response) through Fluorescence Resonance EnergyTransfer (FRET) are of considerable interest as FRET is adistance dependent radiationless transfer of energy from anexcited donor uorophore to a suitable acceptor uorophore toinvestigate the molecular level interactions. However to date, alot of rhodamine-based uorescent probes for Hg(II) have beenreported.14–16 Of these sensors, most of them are performed inorganic solvent or water with organic cosolvent,15 only a few ofthem work well in aqueous buffer solutions containing lessthan 20% organic cosolvent.16 As a result, there is an increasingdemand to develop a rhodamine based probe for Hg(II)
RSC Adv., 2014, 4, 14919–14927 | 14919

RSC Advances Paper
Publ
ishe
d on
31
Janu
ary
2014
. Dow
nloa
ded
by U
nive
rsity
of
Hou
ston
on
28/0
9/20
14 0
4:08
:54.
View Article Online
detection in a medium containing a much smaller amount oforganic cosolvent with a proper molecular level interactionthrough FRET.
Anion recognition and sensing has received considerableinterest because of the pivotal role it plays in the areas ofbiology, environmental hazards, medicine, catalysis, etc.17
Among the anions, sulde is one of the most biologically andenvironmentally important anions, as sulde anions aregenerated not only as a byproduct in industrial processes, butalso in biosystems due to the microbial reduction of sulfate byanaerobic bacteria and the formation of sulfur-containingamino acids in meat proteins.18 Continuous exposure tosulde anion can cause gradual and cumulative damage, suchas loss of consciousness, irritation of mucous membranes,and suffocation.19 Once protonated, sulde anions becomeHS� or H2S which are more toxic and caustic than the suldeitself. However, recent studies have demonstrated thatprotonated sulde can cause a reduction in blood pressure,mediation of neurotransmission, inhibition of insulinsignaling and regulation of inammation.20 In addition, H2Slevels are important in several diseases, such as Alzheimer'sdisease,21 Down's syndrome,22 diabetes,23 and liver cirrhosis.24
Therefore, the development of a quick and sensitive methodfor sulde anion detection in aqueous media and in biologicalsystems is very important for the treatments and helpfultowards understanding the mechanisms of action andregulation.
In this paper, we have designed and synthesized a newrhodamine-based chemosensor (L1) which behaves as a highlyselective and ratiometric FRET-based uorescent probe forHg(II) in HEPES buffer (1 mM, pH 7.4; 2% EtOH) at 25 �C. Theuorescence spectrum of L1 excited at 330 nm exhibits a uo-rescence maximum at 440 nm which decreases along with thegradual increase of a new peak at 575 nm upon the addition ofHg(II). This phenomenon due to the ring-opening of the spi-rolactam system of rhodamine gives rise to strong uorescenceemission and also a visual color change from colorless to violetto pink. Ratiometric responses are more attractive because theratio between the two emission intensities can be used tomeasure the analyte concentration and sensor moleculeconcentration, providing a built-in correction for environ-mental effects and stability under illumination.13b,c,25 Interest-ingly, the presence of an excess of the biologically relevant (Na+,K+, Ca2+ etc.) and other metal (Cr3+, Mn2+, Fe3+ etc.) ions doesnot affect the “switch ON” behaviour of the receptor L1 observedin the presence of Hg(II) ions due to the formation of the L–Hgcomplex which is reversible in nature. But the reversibility of theL–Hg system to regenerate L1 is only in the presence of S2�
anions and it results in “ON–OFF” behavior to sense sulphideanion in the same medium of HEPES buffer (1 mM, pH 7.4; 2%EtOH) at 25 �C. The kinetics study of the reaction of Hg(II) withL1 showed two consecutive steps and it clearly indicated that theopening of the spirolactam-ring was operated to producexanthenes, formed aer the chelation of L1 with Hg(II). Fluo-rescence microscopic studies conrmed that L1 could also beused as an imaging probe for detection of the uptake of bothions in HeLa cells and whole bodies.
14920 | RSC Adv., 2014, 4, 14919–14927
Experimental sectionMaterials and methods
High-purity HEPES, 8-aminoquinoline, 2-chloroacetyl chlorideand mercury(II) nitrate monohydrate and mercury(II) chloridewere purchased from Sigma Aldrich (India) and rhodamine Bfrom E. Merck. The solvents used were of spectroscopic grade.All the metal salts were used as either their nitrate or theirchloride salts. Other chemicals were of analytical reagent gradeand used without further purication except when specied.Milli-Q, 18.2 MU cm�1 water was used throughout the experi-ments. A Shimadzu (model UV-1800) spectrophotometer wasused for recording the electronic spectra. FTIR spectra wererecorded using a Perkin Elmer FTIR model RX1 spectrometerpreparing KBr disk. The 1HNMR spectra were obtained on aBruker Avance DPX 400 MHz spectrometer using DMSO-d6solution and for 13C NMR it was 500 MHz. Electrospray ioni-zation (ESI) mass spectra were recorded on a Qtof Micro YA263mass spectrometer. A Systronics digital pH meter (model 335)was used to measure the pH of the solution and the adjustmentof the pH was done using either 50 mM HCl or NaOH solution.Steady-state uorescence emission and excitation spectra wererecorded with a Perkin Elmer LS 55 spectrouorimeter. Time-resolved uorescence lifetime measurements were performedusing a HORIBA JOBIN Yvon picosecond pulsed diode laser-based time-correlated single-photon counting (TCSPC) spec-trometer from IBH (UK) at lex ¼ 340 nm and MCP-PMT as adetector. Emission from the sample was collected at a rightangle to the direction of the excitation beam maintainingmagic angle polarization (54.71). The full width at half-maximum (FWHM) of the instrument response function was250 ps, and the resolution was 28.6 ps per channel. The data wastted to multiexponential functions aer deconvolution of theinstrument response function by an iterative reconvolutiontechnique using IBH DAS 6.2 data analysis soware in whichreduced w2 and weighted residuals serve as parameters for thegoodness of t.
Synthesis of the probe (L1)
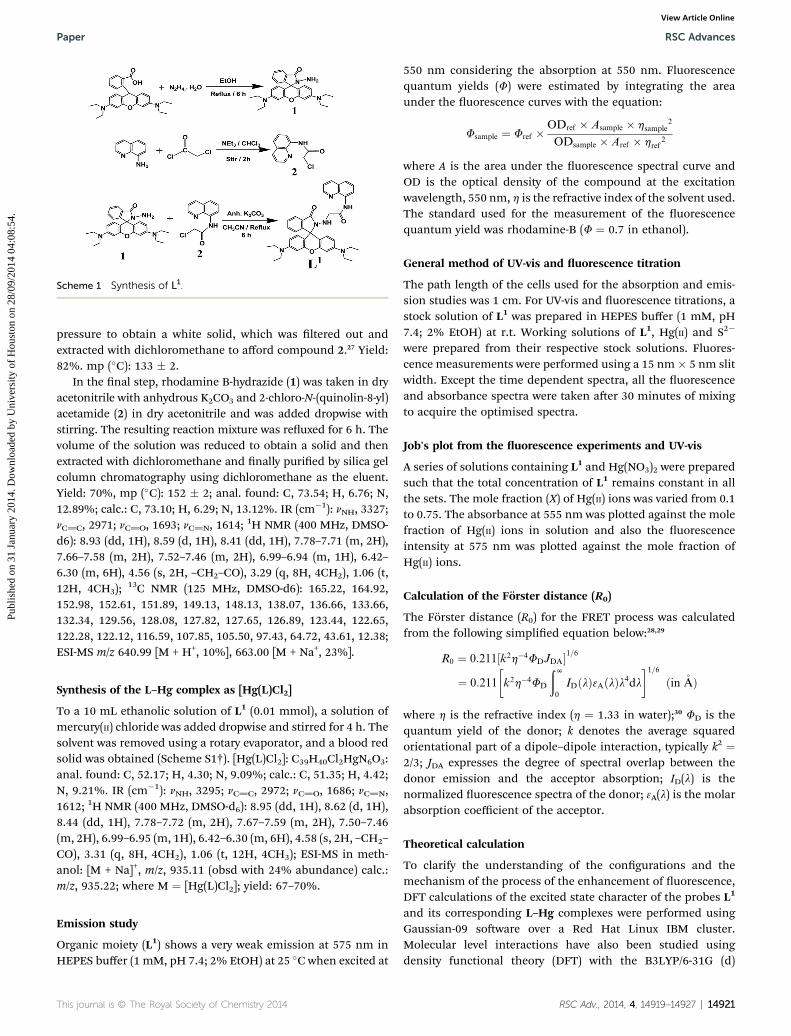
The probe L1 was synthesised by a 3 step reaction (Scheme 1).At rst, the rhodamine B-hydrazide (1) was prepared
following a literature method.26 In brief, 85% hydrazine hydrate(4 mL) was added to a solution of rhodamine B (1 g, 2.09 mmol)in ethanol (40 mL). The solution was reuxed for 6 h. Then, thereaction mixture was evaporated under reduced pressure to givean orange oil, which was then recrystallized from methanol–water to afford rhodamine B-hydrazide as a light-orange crystal(77%).
Then 2-chloro-N-(quinol-8-yl)acetamide (2) was preparedfrom the reaction of 2-chloroacetyl chloride and 8-amino-quinoline as follows-
2-Chloroacetyl chloride (5.31 mL) was dissolved in chloro-form (5 mL) and then added dropwise to a cooled stirred solu-tion of 8-aminoquinoline (2.88 g, 20 mmol) and Et3N (3.0 mL) inchloroform (10 mL) within 1 h. Aer being stirred for 2 h atroom temperature, the mixture was removed under reduced
This journal is © The Royal Society of Chemistry 2014
Scheme 1 Synthesis of L1.
Paper RSC Advances
Publ
ishe
d on
31
Janu
ary
2014
. Dow
nloa
ded
by U
nive
rsity
of
Hou
ston
on
28/0
9/20
14 0
4:08
:54.
View Article Online
pressure to obtain a white solid, which was ltered out andextracted with dichloromethane to afford compound 2.27 Yield:82%. mp (�C): 133 � 2.
In the nal step, rhodamine B-hydrazide (1) was taken in dryacetonitrile with anhydrous K2CO3 and 2-chloro-N-(quinolin-8-yl)acetamide (2) in dry acetonitrile and was added dropwise withstirring. The resulting reaction mixture was reuxed for 6 h. Thevolume of the solution was reduced to obtain a solid and thenextracted with dichloromethane and nally puried by silica gelcolumn chromatography using dichloromethane as the eluent.Yield: 70%, mp (�C): 152 � 2; anal. found: C, 73.54; H, 6.76; N,12.89%; calc.: C, 73.10; H, 6.29; N, 13.12%. IR (cm�1): nNH, 3327;nC]C, 2971; nC]O, 1693; nC]N, 1614;
1H NMR (400 MHz, DMSO-d6): 8.93 (dd, 1H), 8.59 (d, 1H), 8.41 (dd, 1H), 7.78–7.71 (m, 2H),7.66–7.58 (m, 2H), 7.52–7.46 (m, 2H), 6.99–6.94 (m, 1H), 6.42–6.30 (m, 6H), 4.56 (s, 2H, –CH2–CO), 3.29 (q, 8H, 4CH2), 1.06 (t,12H, 4CH3);
13C NMR (125 MHz, DMSO-d6): 165.22, 164.92,152.98, 152.61, 151.89, 149.13, 148.13, 138.07, 136.66, 133.66,132.34, 129.56, 128.08, 127.82, 127.65, 126.89, 123.44, 122.65,122.28, 122.12, 116.59, 107.85, 105.50, 97.43, 64.72, 43.61, 12.38;ESI-MS m/z 640.99 [M + H+, 10%], 663.00 [M + Na+, 23%].
Synthesis of the L–Hg complex as [Hg(L)Cl2]
To a 10 mL ethanolic solution of L1 (0.01 mmol), a solution ofmercury(II) chloride was added dropwise and stirred for 4 h. Thesolvent was removed using a rotary evaporator, and a blood redsolid was obtained (Scheme S1†). [Hg(L)Cl2]: C39H40Cl2HgN6O3:anal. found: C, 52.17; H, 4.30; N, 9.09%; calc.: C, 51.35; H, 4.42;N, 9.21%. IR (cm�1): nNH, 3295; nC]C, 2972; nC]O, 1686; nC]N,1612; 1H NMR (400 MHz, DMSO-d6): 8.95 (dd, 1H), 8.62 (d, 1H),8.44 (dd, 1H), 7.78–7.72 (m, 2H), 7.67–7.59 (m, 2H), 7.50–7.46(m, 2H), 6.99–6.95 (m, 1H), 6.42–6.30 (m, 6H), 4.58 (s, 2H, –CH2–
CO), 3.31 (q, 8H, 4CH2), 1.06 (t, 12H, 4CH3); ESI-MS in meth-anol: [M + Na]+, m/z, 935.11 (obsd with 24% abundance) calc.:m/z, 935.22; where M ¼ [Hg(L)Cl2]; yield: 67–70%.
Emission study
Organic moiety (L1) shows a very weak emission at 575 nm inHEPES buffer (1 mM, pH 7.4; 2% EtOH) at 25 �C when excited at
This journal is © The Royal Society of Chemistry 2014
550 nm considering the absorption at 550 nm. Fluorescencequantum yields (F) were estimated by integrating the areaunder the uorescence curves with the equation:
Fsample ¼ Fref �ODref � Asample � hsample
2
ODsample � Aref � href2
where A is the area under the uorescence spectral curve andOD is the optical density of the compound at the excitationwavelength, 550 nm, h is the refractive index of the solvent used.The standard used for the measurement of the uorescencequantum yield was rhodamine-B (F ¼ 0.7 in ethanol).
General method of UV-vis and uorescence titration
The path length of the cells used for the absorption and emis-sion studies was 1 cm. For UV-vis and uorescence titrations, astock solution of L1 was prepared in HEPES buffer (1 mM, pH7.4; 2% EtOH) at r.t. Working solutions of L1, Hg(II) and S2�
were prepared from their respective stock solutions. Fluores-cence measurements were performed using a 15 nm� 5 nm slitwidth. Except the time dependent spectra, all the uorescenceand absorbance spectra were taken aer 30 minutes of mixingto acquire the optimised spectra.
Job's plot from the uorescence experiments and UV-vis
A series of solutions containing L1 and Hg(NO3)2 were preparedsuch that the total concentration of L1 remains constant in allthe sets. The mole fraction (X) of Hg(II) ions was varied from 0.1to 0.75. The absorbance at 555 nm was plotted against the molefraction of Hg(II) ions in solution and also the uorescenceintensity at 575 nm was plotted against the mole fraction ofHg(II) ions.
Calculation of the Forster distance (R0)
The Forster distance (R0) for the FRET process was calculatedfrom the following simplied equation below:28,29
R0 ¼ 0:211½k2h�4FDJDA�1=6
¼ 0:211
�k2h�4FD
ðN0
IDðlÞ3AðlÞl4dl�1=6
ðin �AÞ
where h is the refractive index (h ¼ 1.33 in water);30 FD is thequantum yield of the donor; k denotes the average squaredorientational part of a dipole–dipole interaction, typically k2 ¼2/3; JDA expresses the degree of spectral overlap between thedonor emission and the acceptor absorption; ID(l) is thenormalized uorescence spectra of the donor; 3A(l) is the molarabsorption coefficient of the acceptor.
Theoretical calculation
To clarify the understanding of the congurations and themechanism of the process of the enhancement of uorescence,DFT calculations of the excited state character of the probes L1
and its corresponding L–Hg complexes were performed usingGaussian-09 soware over a Red Hat Linux IBM cluster.Molecular level interactions have also been studied usingdensity functional theory (DFT) with the B3LYP/6-31G (d)
RSC Adv., 2014, 4, 14919–14927 | 14921

Fig. 1 UV-vis titration spectra of L1 (10 mM) upon the incrementaladdition of Hg(II) concentrations (0–30 mM) in HEPES buffer (1 mM, pH7.4; 2% EtOH) at 25 �C.
Fig. 2 Color change detected by the naked eye with time, (A) probeonly, (B) immediately and (C) 30 min after the addition of Hg(II) ions inHEPES buffer (1 mM, pH 7.4; 2% EtOH) at 25 �C.
RSC Advances Paper
Publ
ishe
d on
31
Janu
ary
2014
. Dow
nloa
ded
by U
nive
rsity
of
Hou
ston
on
28/0
9/20
14 0
4:08
:54.
View Article Online
functional model and basis set for the probe, L1 and LANL2DZfor the corresponding L–Hg complex.
Kinetic measurements
The kinetic studies were done on a Shimadzu UV 1601 PCspectrophotometer attached to a thermoelectric cell tempera-ture controller (Model TCC 240A, accuracy �0.1 �C). Theabsorption due to the ligand was subtracted by using an equi-molar ratio of ligand–HEPES buffer (1 mM, pH 7.4; 2% EtOH)mixture in the reference cell. The progress of the reaction wasfollowed by monitoring the increase in absorbance at 550 nm. Aconventional mixing technique was followed and pseudo rstorder conditions with respect to probe concentration weremaintained throughout the course of the reaction.
Preparation of cell and in vitro cellular imaging with L1
Human cervical cancer cell, HeLa cell line was purchased fromthe National Center for Cell Science (NCCS), Pune, India andwas used throughout the study. Cells were cultured in Dulbec-co's modied Eagle's medium (DMEM, Gibco BRL) supple-mented with 10% FBS (Gibco BRL), and 1% antibiotic mixturecontaining penicillin, streptomycin and neomycin (PSN, GibcoBRL), at 37 �C in a humidied incubator with 5% CO2. Forexperimental study, the cells were grown to 80–90% conuence,harvested with 0.025% trypsin (Gibco BRL) and 0.52 mMEDTA (Gibco BRL) in PBS (phosphate-buffered saline, SigmaDiagnostics) and plated at the desired cell concentration andallowed to re-equilibrate for 24 h before any treatment. Cellswere rinsed with PBS and incubated with DMEM-containing L1
(10 mM, 1% DMSO) for 30 min at 37 �C. All the experimentswere conducted in DMEM containing 10% FBS and 1%PSN antibiotic. The imaging system was composed of a uo-rescence microscope (ZEISS Axioskop 2 plus) with an objectivelens [10�].
To nd out the applicability of this sensor (L1) for the visualdetection of mercury in sh, an experiment was carried out withChanda nama sh. The sh were treated with aqueous Hg(II)(10 mM) for 30 min, washed with PBS to remove any Hg2+
adhering to the surface, and were subsequently treated with asolution of L1 (10 mM in DMSO) for 20 min, and then washedwith PBS. The visual images were taken with a digital camera.
Cell cytotoxicity assay
To test the cytotoxicity of L1, MTT [3-(4,5-dimethyl-thiazol-2-yl)-2,S-diphenyl tetrazolium bromide] assay was performed by theprocedure described earlier.31 Aer treatment of the probes (5,10, 20, 50, and 100 mM), 10 mL of the MTT solution (10 mg mL�1
PBS) was added in each well of a 96-well culture plate andincubated continuously at 37 �C for 6 h. All mediums wereremoved from wells and replaced with 100 mL of acidic iso-propanol. The intracellular formazan crystals (blue-violet)formed were solubilized with 0.04 N acidic isopropanol and theabsorbance of the solution was measured at 595 nm wavelengthwith a microplate reader. The values are means � S.D. of threeindependent experiments. The cell cytotoxicity was calculatedas percent cell cytotoxicity ¼ 100% cell viability.
14922 | RSC Adv., 2014, 4, 14919–14927
Results and discussionSynthesis and characterisation
The synthesis of L1 rst involves the conversion of rhodamine Bto rhodamine B-hydrazide and then 2-chloro-N-(quinolin-8-yl)acetamide was prepared from the reaction of 2-chloroacetylchloride and 8-aminoquinoline in chloroform medium in thepresence of NEt3 (Scheme 1). Then the probe, L1 was isolatedfrom the reaction of rhodamine B-hydrazide and 2-chloro-N-(quinolin-8-yl)acetamide in a dry acetonitrile solution in thepresence of anhydrous K2CO3. The formulation of L1 wasconrmed by physico-chemico and spectroscopic methods(Fig. S1A–G†).
UV-vis spectroscopic studies of L1
UV-vis spectra of L1 was recorded in HEPES buffer (1 mM, pH7.4; 2% EtOH) at 25 �C showing an absorption maximum at 314nm which may possibly be attributed to the intramolecular p–p* charge transfer (CT) transition. The absorption of L1 at 314nm gradually increased, accompanied by the formation of a newabsorption peak at 555 nm (Fig. 1) as the Hg(II) concentrationwere increased stepwise (0–30 mM) and the solution turned fromcolorless to pink (Fig. S2†) via an intermediate color change toblue violet with time (Fig. 2).
On account of the complexity of the intracellular environ-ment, an additional examination of the probe was performed todetermine whether other ions were potential interferents or not.To establish this fact, metal ion selectivity assays were
This journal is © The Royal Society of Chemistry 2014
Paper RSC Advances
Publ
ishe
d on
31
Janu
ary
2014
. Dow
nloa
ded
by U
nive
rsity
of
Hou
ston
on
28/0
9/20
14 0
4:08
:54.
View Article Online
performed while keeping the other experimental conditionsunchanged. No signicant change in the UV-vis spectral patternwas observed upon the addition of 10 equivalents excess ofrelevant metal ions i.e. Na(I), K(I), Ca(II), Mg(II), Al(III), Cr(III),Mn(II), Fe(III), Co(II), Ni(II), Zn(II), Cd(II), and Pb(II).
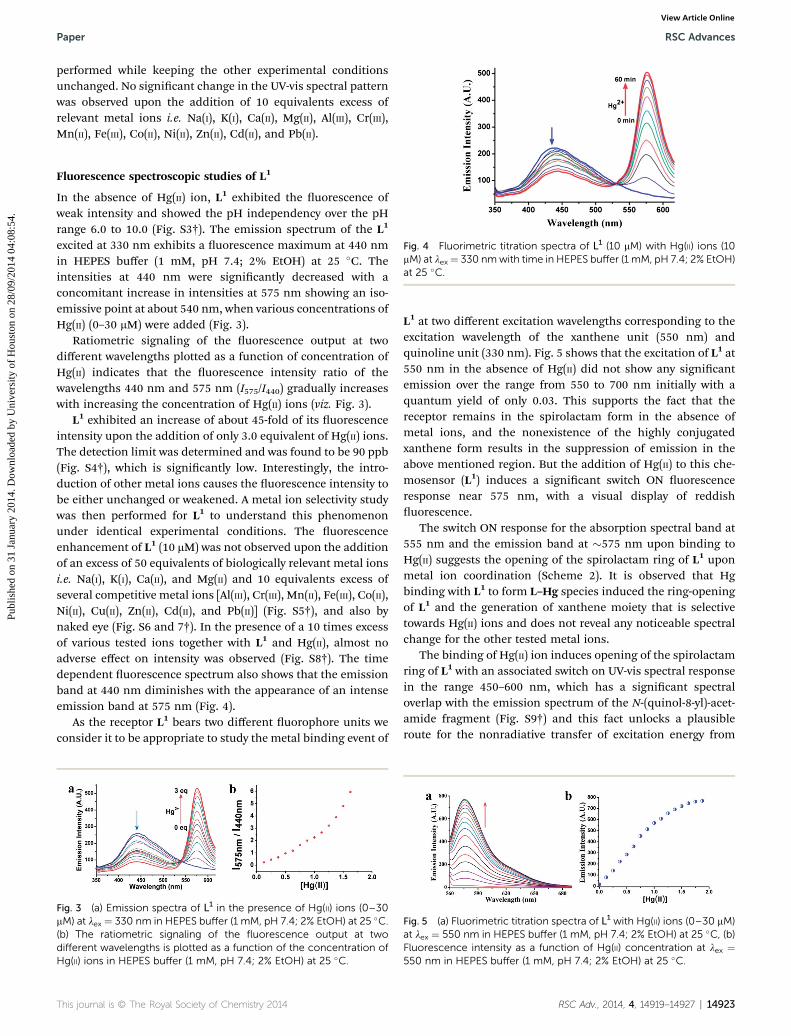
Fig. 4 Fluorimetric titration spectra of L1 (10 mM) with Hg(II) ions (10mM) at lex¼ 330 nmwith time in HEPES buffer (1 mM, pH 7.4; 2% EtOH)at 25 �C.
Fluorescence spectroscopic studies of L1
In the absence of Hg(II) ion, L1 exhibited the uorescence ofweak intensity and showed the pH independency over the pHrange 6.0 to 10.0 (Fig. S3†). The emission spectrum of the L1
excited at 330 nm exhibits a uorescence maximum at 440 nmin HEPES buffer (1 mM, pH 7.4; 2% EtOH) at 25 �C. Theintensities at 440 nm were signicantly decreased with aconcomitant increase in intensities at 575 nm showing an iso-emissive point at about 540 nm, when various concentrations ofHg(II) (0–30 mM) were added (Fig. 3).
Ratiometric signaling of the uorescence output at twodifferent wavelengths plotted as a function of concentration ofHg(II) indicates that the uorescence intensity ratio of thewavelengths 440 nm and 575 nm (I575/I440) gradually increaseswith increasing the concentration of Hg(II) ions (viz. Fig. 3).
L1 exhibited an increase of about 45-fold of its uorescenceintensity upon the addition of only 3.0 equivalent of Hg(II) ions.The detection limit was determined and was found to be 90 ppb(Fig. S4†), which is signicantly low. Interestingly, the intro-duction of other metal ions causes the uorescence intensity tobe either unchanged or weakened. A metal ion selectivity studywas then performed for L1 to understand this phenomenonunder identical experimental conditions. The uorescenceenhancement of L1 (10 mM) was not observed upon the additionof an excess of 50 equivalents of biologically relevant metal ionsi.e. Na(I), K(I), Ca(II), and Mg(II) and 10 equivalents excess ofseveral competitive metal ions [Al(III), Cr(III), Mn(II), Fe(III), Co(II),Ni(II), Cu(II), Zn(II), Cd(II), and Pb(II)] (Fig. S5†), and also bynaked eye (Fig. S6 and 7†). In the presence of a 10 times excessof various tested ions together with L1 and Hg(II), almost noadverse effect on intensity was observed (Fig. S8†). The timedependent uorescence spectrum also shows that the emissionband at 440 nm diminishes with the appearance of an intenseemission band at 575 nm (Fig. 4).
As the receptor L1 bears two different uorophore units weconsider it to be appropriate to study the metal binding event of
Fig. 3 (a) Emission spectra of L1 in the presence of Hg(II) ions (0–30mM) at lex ¼ 330 nm in HEPES buffer (1 mM, pH 7.4; 2% EtOH) at 25 �C.(b) The ratiometric signaling of the fluorescence output at twodifferent wavelengths is plotted as a function of the concentration ofHg(II) ions in HEPES buffer (1 mM, pH 7.4; 2% EtOH) at 25 �C.
This journal is © The Royal Society of Chemistry 2014
L1 at two different excitation wavelengths corresponding to theexcitation wavelength of the xanthene unit (550 nm) andquinoline unit (330 nm). Fig. 5 shows that the excitation of L1 at550 nm in the absence of Hg(II) did not show any signicantemission over the range from 550 to 700 nm initially with aquantum yield of only 0.03. This supports the fact that thereceptor remains in the spirolactam form in the absence ofmetal ions, and the nonexistence of the highly conjugatedxanthene form results in the suppression of emission in theabove mentioned region. But the addition of Hg(II) to this che-mosensor (L1) induces a signicant switch ON uorescenceresponse near 575 nm, with a visual display of reddishuorescence.
The switch ON response for the absorption spectral band at555 nm and the emission band at �575 nm upon binding toHg(II) suggests the opening of the spirolactam ring of L1 uponmetal ion coordination (Scheme 2). It is observed that Hgbinding with L1 to form L–Hg species induced the ring-openingof L1 and the generation of xanthene moiety that is selectivetowards Hg(II) ions and does not reveal any noticeable spectralchange for the other tested metal ions.
The binding of Hg(II) ion induces opening of the spirolactamring of L1 with an associated switch on UV-vis spectral responsein the range 450–600 nm, which has a signicant spectraloverlap with the emission spectrum of the N-(quinol-8-yl)-acet-amide fragment (Fig. S9†) and this fact unlocks a plausibleroute for the nonradiative transfer of excitation energy from
Fig. 5 (a) Fluorimetric titration spectra of L1 with Hg(II) ions (0–30 mM)at lex ¼ 550 nm in HEPES buffer (1 mM, pH 7.4; 2% EtOH) at 25 �C, (b)Fluorescence intensity as a function of Hg(II) concentration at lex ¼550 nm in HEPES buffer (1 mM, pH 7.4; 2% EtOH) at 25 �C.
RSC Adv., 2014, 4, 14919–14927 | 14923
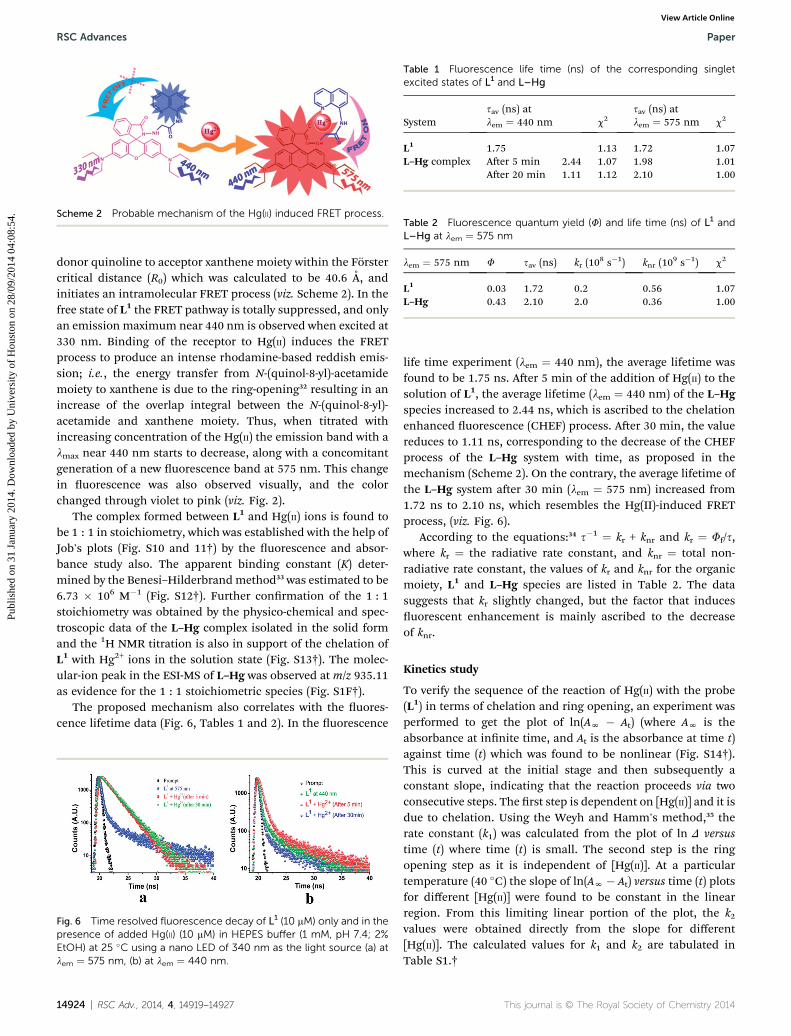
Scheme 2 Probable mechanism of the Hg(II) induced FRET process.
Table 1 Fluorescence life time (ns) of the corresponding singletexcited states of L1 and L–Hg
Systemsav (ns) atlem ¼ 440 nm c2
sav (ns) atlem ¼ 575 nm c2
L1 1.75 1.13 1.72 1.07L–Hg complex Aer 5 min 2.44 1.07 1.98 1.01
Aer 20 min 1.11 1.12 2.10 1.00
Table 2 Fluorescence quantum yield (F) and life time (ns) of L1 andL–Hg at lem ¼ 575 nm
lem ¼ 575 nm F sav (ns) kr (108 s�1) knr (10
9 s�1) c2
L1 0.03 1.72 0.2 0.56 1.07L–Hg 0.43 2.10 2.0 0.36 1.00
RSC Advances Paper
Publ
ishe
d on
31
Janu
ary
2014
. Dow
nloa
ded
by U
nive
rsity
of
Hou
ston
on
28/0
9/20
14 0
4:08
:54.
View Article Online
donor quinoline to acceptor xanthene moiety within the Forstercritical distance (R0) which was calculated to be 40.6 A, andinitiates an intramolecular FRET process (viz. Scheme 2). In thefree state of L1 the FRET pathway is totally suppressed, and onlyan emission maximum near 440 nm is observed when excited at330 nm. Binding of the receptor to Hg(II) induces the FRETprocess to produce an intense rhodamine-based reddish emis-sion; i.e., the energy transfer from N-(quinol-8-yl)-acetamidemoiety to xanthene is due to the ring-opening32 resulting in anincrease of the overlap integral between the N-(quinol-8-yl)-acetamide and xanthene moiety. Thus, when titrated withincreasing concentration of the Hg(II) the emission band with almax near 440 nm starts to decrease, along with a concomitantgeneration of a new uorescence band at 575 nm. This changein uorescence was also observed visually, and the colorchanged through violet to pink (viz. Fig. 2).
The complex formed between L1 and Hg(II) ions is found tobe 1 : 1 in stoichiometry, which was established with the help ofJob's plots (Fig. S10 and 11†) by the uorescence and absor-bance study also. The apparent binding constant (K) deter-mined by the Benesi–Hilderbrandmethod33 was estimated to be6.73 � 106 M�1 (Fig. S12†). Further conrmation of the 1 : 1stoichiometry was obtained by the physico-chemical and spec-troscopic data of the L–Hg complex isolated in the solid formand the 1H NMR titration is also in support of the chelation ofL1 with Hg2+ ions in the solution state (Fig. S13†). The molec-ular-ion peak in the ESI-MS of L–Hg was observed at m/z 935.11as evidence for the 1 : 1 stoichiometric species (Fig. S1F†).
The proposed mechanism also correlates with the uores-cence lifetime data (Fig. 6, Tables 1 and 2). In the uorescence
Fig. 6 Time resolved fluorescence decay of L1 (10 mM) only and in thepresence of added Hg(II) (10 mM) in HEPES buffer (1 mM, pH 7.4; 2%EtOH) at 25 �C using a nano LED of 340 nm as the light source (a) atlem ¼ 575 nm, (b) at lem ¼ 440 nm.
14924 | RSC Adv., 2014, 4, 14919–14927
life time experiment (lem ¼ 440 nm), the average lifetime wasfound to be 1.75 ns. Aer 5 min of the addition of Hg(II) to thesolution of L1, the average lifetime (lem ¼ 440 nm) of the L–Hgspecies increased to 2.44 ns, which is ascribed to the chelationenhanced uorescence (CHEF) process. Aer 30 min, the valuereduces to 1.11 ns, corresponding to the decrease of the CHEFprocess of the L–Hg system with time, as proposed in themechanism (Scheme 2). On the contrary, the average lifetime ofthe L–Hg system aer 30 min (lem ¼ 575 nm) increased from1.72 ns to 2.10 ns, which resembles the Hg(II)-induced FRETprocess, (viz. Fig. 6).
According to the equations:34 s�1 ¼ kr + knr and kr ¼ Ff/s,where kr ¼ the radiative rate constant, and knr ¼ total non-radiative rate constant, the values of kr and knr for the organicmoiety, L1 and L–Hg species are listed in Table 2. The datasuggests that kr slightly changed, but the factor that inducesuorescent enhancement is mainly ascribed to the decreaseof knr.
Kinetics study
To verify the sequence of the reaction of Hg(II) with the probe(L1) in terms of chelation and ring opening, an experiment wasperformed to get the plot of ln(AN � At) (where AN is theabsorbance at innite time, and At is the absorbance at time t)against time (t) which was found to be nonlinear (Fig. S14†).This is curved at the initial stage and then subsequently aconstant slope, indicating that the reaction proceeds via twoconsecutive steps. The rst step is dependent on [Hg(II)] and it isdue to chelation. Using the Weyh and Hamm's method,35 therate constant (k1) was calculated from the plot of ln D versustime (t) where time (t) is small. The second step is the ringopening step as it is independent of [Hg(II)]. At a particulartemperature (40 �C) the slope of ln(AN � At) versus time (t) plotsfor different [Hg(II)] were found to be constant in the linearregion. From this limiting linear portion of the plot, the k2values were obtained directly from the slope for different[Hg(II)]. The calculated values for k1 and k2 are tabulated inTable S1.†
This journal is © The Royal Society of Chemistry 2014
Paper RSC Advances
Publ
ishe
d on
31
Janu
ary
2014
. Dow
nloa
ded
by U
nive
rsity
of
Hou
ston
on
28/0
9/20
14 0
4:08
:54.
View Article Online
The overall pseudo rst-order kinetic plot of the reaction ofL1 (10 mM) with Hg(II) ((0.1–1.0 mM)) in HEPES buffer (1 mM,pH 7.4; 2% EtOH) at 25 �C was also done from the uorescenceemission intensity, and from the slope the overall rate constant,k0 was found to be 9.66 � 10�4 s�1 (Fig. S15†).
Spectroscopic studies of the L–Hg complex in the presenceof S2�
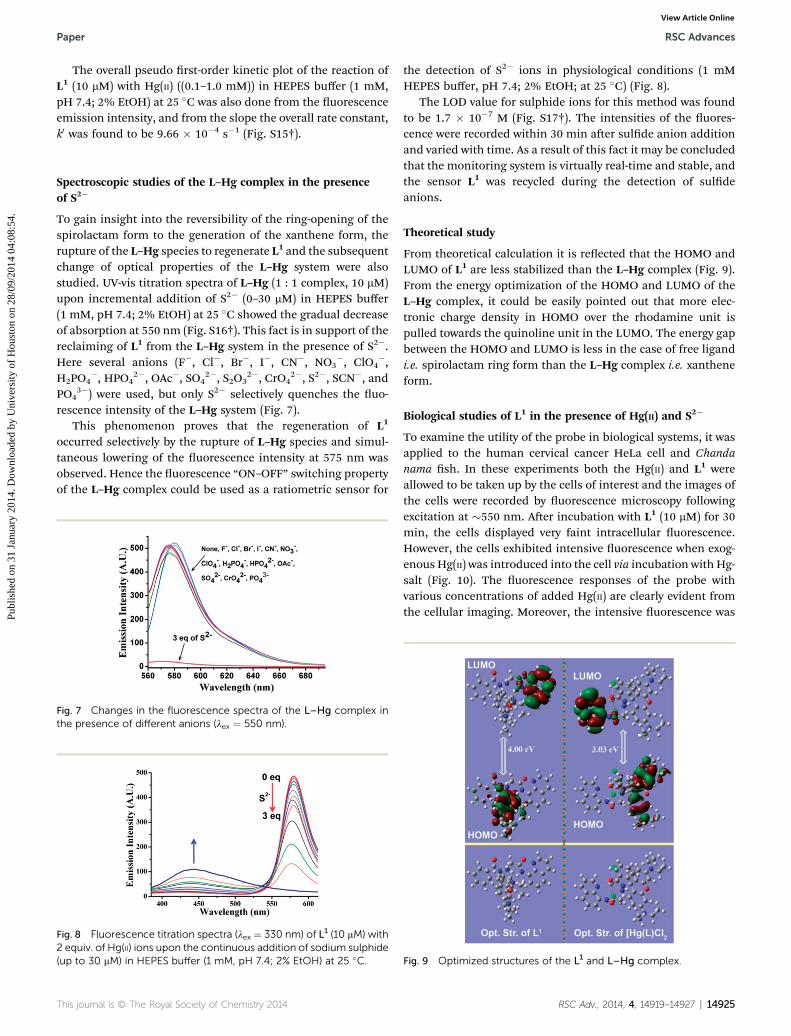
To gain insight into the reversibility of the ring-opening of thespirolactam form to the generation of the xanthene form, therupture of the L–Hg species to regenerate L1 and the subsequentchange of optical properties of the L–Hg system were alsostudied. UV-vis titration spectra of L–Hg (1 : 1 complex, 10 mM)upon incremental addition of S2� (0–30 mM) in HEPES buffer(1 mM, pH 7.4; 2% EtOH) at 25 �C showed the gradual decreaseof absorption at 550 nm (Fig. S16†). This fact is in support of thereclaiming of L1 from the L–Hg system in the presence of S2�.Here several anions (F�, Cl�, Br�, I�, CN�, NO3
�, ClO4�,
H2PO4�, HPO4
2�, OAc�, SO42�, S2O3
2�, CrO42�, S2�, SCN�, and
PO43�) were used, but only S2� selectively quenches the uo-
rescence intensity of the L–Hg system (Fig. 7).This phenomenon proves that the regeneration of L1
occurred selectively by the rupture of L–Hg species and simul-taneous lowering of the uorescence intensity at 575 nm wasobserved. Hence the uorescence “ON–OFF” switching propertyof the L–Hg complex could be used as a ratiometric sensor for
Fig. 7 Changes in the fluorescence spectra of the L–Hg complex inthe presence of different anions (lex ¼ 550 nm).
Fig. 8 Fluorescence titration spectra (lex ¼ 330 nm) of L1 (10 mM) with2 equiv. of Hg(II) ions upon the continuous addition of sodium sulphide(up to 30 mM) in HEPES buffer (1 mM, pH 7.4; 2% EtOH) at 25 �C.
This journal is © The Royal Society of Chemistry 2014
the detection of S2� ions in physiological conditions (1 mMHEPES buffer, pH 7.4; 2% EtOH; at 25 �C) (Fig. 8).
The LOD value for sulphide ions for this method was foundto be 1.7 � 10�7 M (Fig. S17†). The intensities of the uores-cence were recorded within 30 min aer sulde anion additionand varied with time. As a result of this fact it may be concludedthat the monitoring system is virtually real-time and stable, andthe sensor L1 was recycled during the detection of suldeanions.
Theoretical study
From theoretical calculation it is reected that the HOMO andLUMO of L1 are less stabilized than the L–Hg complex (Fig. 9).From the energy optimization of the HOMO and LUMO of theL–Hg complex, it could be easily pointed out that more elec-tronic charge density in HOMO over the rhodamine unit ispulled towards the quinoline unit in the LUMO. The energy gapbetween the HOMO and LUMO is less in the case of free ligandi.e. spirolactam ring form than the L–Hg complex i.e. xantheneform.
Biological studies of L1 in the presence of Hg(II) and S2�
To examine the utility of the probe in biological systems, it wasapplied to the human cervical cancer HeLa cell and Chandanama sh. In these experiments both the Hg(II) and L1 wereallowed to be taken up by the cells of interest and the images ofthe cells were recorded by uorescence microscopy followingexcitation at �550 nm. Aer incubation with L1 (10 mM) for 30min, the cells displayed very faint intracellular uorescence.However, the cells exhibited intensive uorescence when exog-enous Hg(II) was introduced into the cell via incubation with Hg-salt (Fig. 10). The uorescence responses of the probe withvarious concentrations of added Hg(II) are clearly evident fromthe cellular imaging. Moreover, the intensive uorescence was
Fig. 9 Optimized structures of the L1 and L–Hg complex.
RSC Adv., 2014, 4, 14919–14927 | 14925
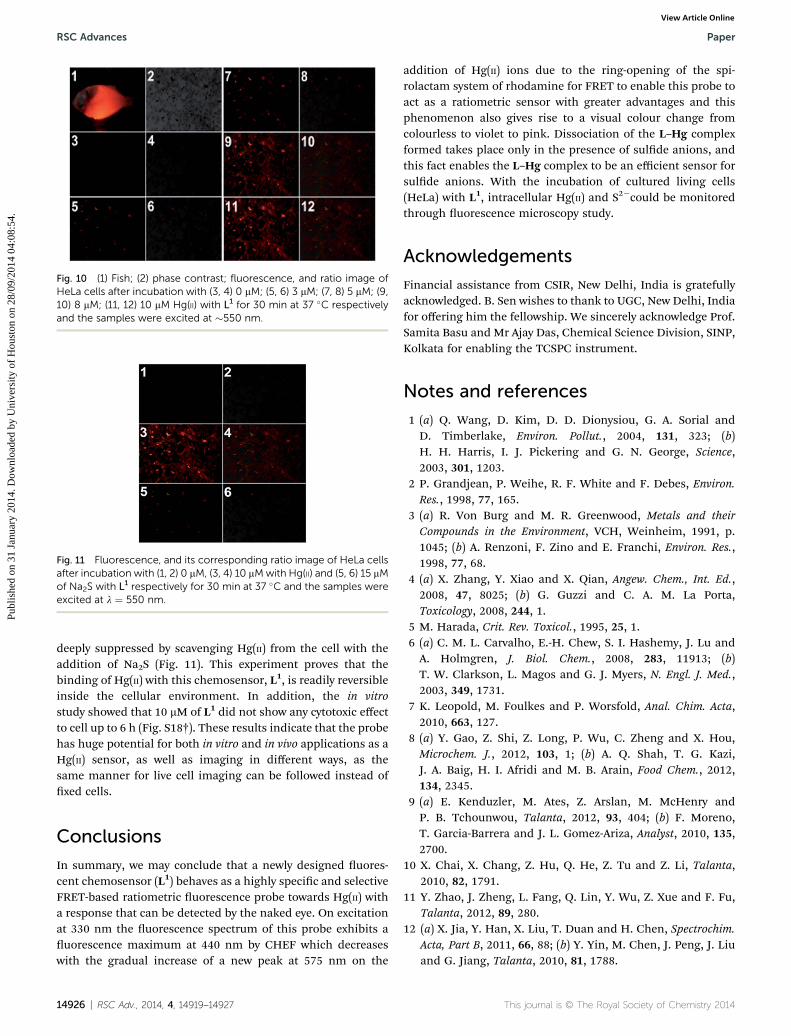
Fig. 10 (1) Fish; (2) phase contrast; fluorescence, and ratio image ofHeLa cells after incubation with (3, 4) 0 mM; (5, 6) 3 mM; (7, 8) 5 mM; (9,10) 8 mM; (11, 12) 10 mM Hg(II) with L1 for 30 min at 37 �C respectivelyand the samples were excited at �550 nm.
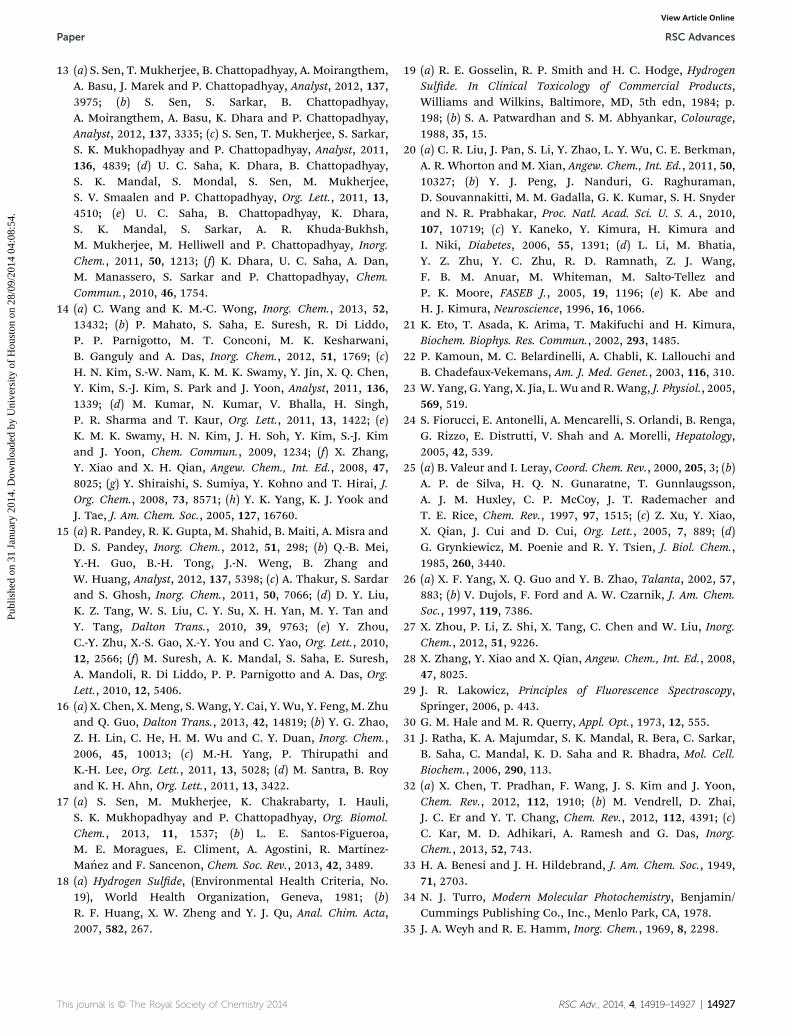
Fig. 11 Fluorescence, and its corresponding ratio image of HeLa cellsafter incubation with (1, 2) 0 mM, (3, 4) 10 mMwith Hg(II) and (5, 6) 15 mMof Na2S with L1 respectively for 30 min at 37 �C and the samples wereexcited at l ¼ 550 nm.
RSC Advances Paper
Publ
ishe
d on
31
Janu
ary
2014
. Dow
nloa
ded
by U
nive
rsity
of
Hou
ston
on
28/0
9/20
14 0
4:08
:54.
View Article Online
deeply suppressed by scavenging Hg(II) from the cell with theaddition of Na2S (Fig. 11). This experiment proves that thebinding of Hg(II) with this chemosensor, L1, is readily reversibleinside the cellular environment. In addition, the in vitrostudy showed that 10 mM of L1 did not show any cytotoxic effectto cell up to 6 h (Fig. S18†). These results indicate that the probehas huge potential for both in vitro and in vivo applications as aHg(II) sensor, as well as imaging in different ways, as thesame manner for live cell imaging can be followed instead ofxed cells.
Conclusions
In summary, we may conclude that a newly designed uores-cent chemosensor (L1) behaves as a highly specic and selectiveFRET-based ratiometric uorescence probe towards Hg(II) witha response that can be detected by the naked eye. On excitationat 330 nm the uorescence spectrum of this probe exhibits auorescence maximum at 440 nm by CHEF which decreaseswith the gradual increase of a new peak at 575 nm on the
14926 | RSC Adv., 2014, 4, 14919–14927
addition of Hg(II) ions due to the ring-opening of the spi-rolactam system of rhodamine for FRET to enable this probe toact as a ratiometric sensor with greater advantages and thisphenomenon also gives rise to a visual colour change fromcolourless to violet to pink. Dissociation of the L–Hg complexformed takes place only in the presence of sulde anions, andthis fact enables the L–Hg complex to be an efficient sensor forsulde anions. With the incubation of cultured living cells(HeLa) with L1, intracellular Hg(II) and S2�could be monitoredthrough uorescence microscopy study.
Acknowledgements
Financial assistance from CSIR, New Delhi, India is gratefullyacknowledged. B. Sen wishes to thank to UGC, New Delhi, Indiafor offering him the fellowship. We sincerely acknowledge Prof.Samita Basu and Mr Ajay Das, Chemical Science Division, SINP,Kolkata for enabling the TCSPC instrument.
Notes and references
1 (a) Q. Wang, D. Kim, D. D. Dionysiou, G. A. Sorial andD. Timberlake, Environ. Pollut., 2004, 131, 323; (b)H. H. Harris, I. J. Pickering and G. N. George, Science,2003, 301, 1203.
2 P. Grandjean, P. Weihe, R. F. White and F. Debes, Environ.Res., 1998, 77, 165.
3 (a) R. Von Burg and M. R. Greenwood, Metals and theirCompounds in the Environment, VCH, Weinheim, 1991, p.1045; (b) A. Renzoni, F. Zino and E. Franchi, Environ. Res.,1998, 77, 68.
4 (a) X. Zhang, Y. Xiao and X. Qian, Angew. Chem., Int. Ed.,2008, 47, 8025; (b) G. Guzzi and C. A. M. La Porta,Toxicology, 2008, 244, 1.
5 M. Harada, Crit. Rev. Toxicol., 1995, 25, 1.6 (a) C. M. L. Carvalho, E.-H. Chew, S. I. Hashemy, J. Lu andA. Holmgren, J. Biol. Chem., 2008, 283, 11913; (b)T. W. Clarkson, L. Magos and G. J. Myers, N. Engl. J. Med.,2003, 349, 1731.
7 K. Leopold, M. Foulkes and P. Worsfold, Anal. Chim. Acta,2010, 663, 127.
8 (a) Y. Gao, Z. Shi, Z. Long, P. Wu, C. Zheng and X. Hou,Microchem. J., 2012, 103, 1; (b) A. Q. Shah, T. G. Kazi,J. A. Baig, H. I. Afridi and M. B. Arain, Food Chem., 2012,134, 2345.
9 (a) E. Kenduzler, M. Ates, Z. Arslan, M. McHenry andP. B. Tchounwou, Talanta, 2012, 93, 404; (b) F. Moreno,T. Garcia-Barrera and J. L. Gomez-Ariza, Analyst, 2010, 135,2700.
10 X. Chai, X. Chang, Z. Hu, Q. He, Z. Tu and Z. Li, Talanta,2010, 82, 1791.
11 Y. Zhao, J. Zheng, L. Fang, Q. Lin, Y. Wu, Z. Xue and F. Fu,Talanta, 2012, 89, 280.
12 (a) X. Jia, Y. Han, X. Liu, T. Duan and H. Chen, Spectrochim.Acta, Part B, 2011, 66, 88; (b) Y. Yin, M. Chen, J. Peng, J. Liuand G. Jiang, Talanta, 2010, 81, 1788.
This journal is © The Royal Society of Chemistry 2014
Paper RSC Advances
Publ
ishe
d on
31
Janu
ary
2014
. Dow
nloa
ded
by U
nive
rsity
of
Hou
ston
on
28/0
9/20
14 0
4:08
:54.
View Article Online
13 (a) S. Sen, T. Mukherjee, B. Chattopadhyay, A. Moirangthem,A. Basu, J. Marek and P. Chattopadhyay, Analyst, 2012, 137,3975; (b) S. Sen, S. Sarkar, B. Chattopadhyay,A. Moirangthem, A. Basu, K. Dhara and P. Chattopadhyay,Analyst, 2012, 137, 3335; (c) S. Sen, T. Mukherjee, S. Sarkar,S. K. Mukhopadhyay and P. Chattopadhyay, Analyst, 2011,136, 4839; (d) U. C. Saha, K. Dhara, B. Chattopadhyay,S. K. Mandal, S. Mondal, S. Sen, M. Mukherjee,S. V. Smaalen and P. Chattopadhyay, Org. Lett., 2011, 13,4510; (e) U. C. Saha, B. Chattopadhyay, K. Dhara,S. K. Mandal, S. Sarkar, A. R. Khuda-Bukhsh,M. Mukherjee, M. Helliwell and P. Chattopadhyay, Inorg.Chem., 2011, 50, 1213; (f) K. Dhara, U. C. Saha, A. Dan,M. Manassero, S. Sarkar and P. Chattopadhyay, Chem.Commun., 2010, 46, 1754.
14 (a) C. Wang and K. M.-C. Wong, Inorg. Chem., 2013, 52,13432; (b) P. Mahato, S. Saha, E. Suresh, R. Di Liddo,P. P. Parnigotto, M. T. Conconi, M. K. Kesharwani,B. Ganguly and A. Das, Inorg. Chem., 2012, 51, 1769; (c)H. N. Kim, S.-W. Nam, K. M. K. Swamy, Y. Jin, X. Q. Chen,Y. Kim, S.-J. Kim, S. Park and J. Yoon, Analyst, 2011, 136,1339; (d) M. Kumar, N. Kumar, V. Bhalla, H. Singh,P. R. Sharma and T. Kaur, Org. Lett., 2011, 13, 1422; (e)K. M. K. Swamy, H. N. Kim, J. H. Soh, Y. Kim, S.-J. Kimand J. Yoon, Chem. Commun., 2009, 1234; (f) X. Zhang,Y. Xiao and X. H. Qian, Angew. Chem., Int. Ed., 2008, 47,8025; (g) Y. Shiraishi, S. Sumiya, Y. Kohno and T. Hirai, J.Org. Chem., 2008, 73, 8571; (h) Y. K. Yang, K. J. Yook andJ. Tae, J. Am. Chem. Soc., 2005, 127, 16760.
15 (a) R. Pandey, R. K. Gupta, M. Shahid, B. Maiti, A. Misra andD. S. Pandey, Inorg. Chem., 2012, 51, 298; (b) Q.-B. Mei,Y.-H. Guo, B.-H. Tong, J.-N. Weng, B. Zhang andW. Huang, Analyst, 2012, 137, 5398; (c) A. Thakur, S. Sardarand S. Ghosh, Inorg. Chem., 2011, 50, 7066; (d) D. Y. Liu,K. Z. Tang, W. S. Liu, C. Y. Su, X. H. Yan, M. Y. Tan andY. Tang, Dalton Trans., 2010, 39, 9763; (e) Y. Zhou,C.-Y. Zhu, X.-S. Gao, X.-Y. You and C. Yao, Org. Lett., 2010,12, 2566; (f) M. Suresh, A. K. Mandal, S. Saha, E. Suresh,A. Mandoli, R. Di Liddo, P. P. Parnigotto and A. Das, Org.Lett., 2010, 12, 5406.
16 (a) X. Chen, X. Meng, S. Wang, Y. Cai, Y. Wu, Y. Feng, M. Zhuand Q. Guo, Dalton Trans., 2013, 42, 14819; (b) Y. G. Zhao,Z. H. Lin, C. He, H. M. Wu and C. Y. Duan, Inorg. Chem.,2006, 45, 10013; (c) M.-H. Yang, P. Thirupathi andK.-H. Lee, Org. Lett., 2011, 13, 5028; (d) M. Santra, B. Royand K. H. Ahn, Org. Lett., 2011, 13, 3422.
17 (a) S. Sen, M. Mukherjee, K. Chakrabarty, I. Hauli,S. K. Mukhopadhyay and P. Chattopadhyay, Org. Biomol.Chem., 2013, 11, 1537; (b) L. E. Santos-Figueroa,M. E. Moragues, E. Climent, A. Agostini, R. Martınez-Manez and F. Sancenon, Chem. Soc. Rev., 2013, 42, 3489.
18 (a) Hydrogen Sulde, (Environmental Health Criteria, No.19), World Health Organization, Geneva, 1981; (b)R. F. Huang, X. W. Zheng and Y. J. Qu, Anal. Chim. Acta,2007, 582, 267.
This journal is © The Royal Society of Chemistry 2014
19 (a) R. E. Gosselin, R. P. Smith and H. C. Hodge, HydrogenSulde. In Clinical Toxicology of Commercial Products,Williams and Wilkins, Baltimore, MD, 5th edn, 1984; p.198; (b) S. A. Patwardhan and S. M. Abhyankar, Colourage,1988, 35, 15.
20 (a) C. R. Liu, J. Pan, S. Li, Y. Zhao, L. Y. Wu, C. E. Berkman,A. R. Whorton and M. Xian, Angew. Chem., Int. Ed., 2011, 50,10327; (b) Y. J. Peng, J. Nanduri, G. Raghuraman,D. Souvannakitti, M. M. Gadalla, G. K. Kumar, S. H. Snyderand N. R. Prabhakar, Proc. Natl. Acad. Sci. U. S. A., 2010,107, 10719; (c) Y. Kaneko, Y. Kimura, H. Kimura andI. Niki, Diabetes, 2006, 55, 1391; (d) L. Li, M. Bhatia,Y. Z. Zhu, Y. C. Zhu, R. D. Ramnath, Z. J. Wang,F. B. M. Anuar, M. Whiteman, M. Salto-Tellez andP. K. Moore, FASEB J., 2005, 19, 1196; (e) K. Abe andH. J. Kimura, Neuroscience, 1996, 16, 1066.
21 K. Eto, T. Asada, K. Arima, T. Makifuchi and H. Kimura,Biochem. Biophys. Res. Commun., 2002, 293, 1485.
22 P. Kamoun, M. C. Belardinelli, A. Chabli, K. Lallouchi andB. Chadefaux-Vekemans, Am. J. Med. Genet., 2003, 116, 310.
23 W. Yang, G. Yang, X. Jia, L. Wu and R.Wang, J. Physiol., 2005,569, 519.
24 S. Fiorucci, E. Antonelli, A. Mencarelli, S. Orlandi, B. Renga,G. Rizzo, E. Distrutti, V. Shah and A. Morelli, Hepatology,2005, 42, 539.
25 (a) B. Valeur and I. Leray, Coord. Chem. Rev., 2000, 205, 3; (b)A. P. de Silva, H. Q. N. Gunaratne, T. Gunnlaugsson,A. J. M. Huxley, C. P. McCoy, J. T. Rademacher andT. E. Rice, Chem. Rev., 1997, 97, 1515; (c) Z. Xu, Y. Xiao,X. Qian, J. Cui and D. Cui, Org. Lett., 2005, 7, 889; (d)G. Grynkiewicz, M. Poenie and R. Y. Tsien, J. Biol. Chem.,1985, 260, 3440.
26 (a) X. F. Yang, X. Q. Guo and Y. B. Zhao, Talanta, 2002, 57,883; (b) V. Dujols, F. Ford and A. W. Czarnik, J. Am. Chem.Soc., 1997, 119, 7386.
27 X. Zhou, P. Li, Z. Shi, X. Tang, C. Chen and W. Liu, Inorg.Chem., 2012, 51, 9226.
28 X. Zhang, Y. Xiao and X. Qian, Angew. Chem., Int. Ed., 2008,47, 8025.
29 J. R. Lakowicz, Principles of Fluorescence Spectroscopy,Springer, 2006, p. 443.
30 G. M. Hale and M. R. Querry, Appl. Opt., 1973, 12, 555.31 J. Ratha, K. A. Majumdar, S. K. Mandal, R. Bera, C. Sarkar,
B. Saha, C. Mandal, K. D. Saha and R. Bhadra, Mol. Cell.Biochem., 2006, 290, 113.
32 (a) X. Chen, T. Pradhan, F. Wang, J. S. Kim and J. Yoon,Chem. Rev., 2012, 112, 1910; (b) M. Vendrell, D. Zhai,J. C. Er and Y. T. Chang, Chem. Rev., 2012, 112, 4391; (c)C. Kar, M. D. Adhikari, A. Ramesh and G. Das, Inorg.Chem., 2013, 52, 743.
33 H. A. Benesi and J. H. Hildebrand, J. Am. Chem. Soc., 1949,71, 2703.
34 N. J. Turro, Modern Molecular Photochemistry, Benjamin/Cummings Publishing Co., Inc., Menlo Park, CA, 1978.
35 J. A. Weyh and R. E. Hamm, Inorg. Chem., 1969, 8, 2298.
RSC Adv., 2014, 4, 14919–14927 | 14927