a vision for uk freight trends towards 20 8 and beyond a...
TRANSCRIPT

Page �
A vision for UK freight trends towards 20�8 and beyond
A vision for UK freight trends towards 2018 and beyond

© 2008, Sea and Water
Apart from any fair dealing for the purposes of research, private study, criticism or review, as permitted under the UK Copyright Designs and Patents Act, �988, this publication may not be reproduced, stored, or transmitted, in any form or by any means, without the prior permission in writing of Sea and Water.

Contents
5 Executive summary
9 The past: a brief history of transport and freight in the United Kingdom
�� The present: current freight trends
�4 The environment: green consumption
�7 Transport policy: how do the UK government and the EU see trends developing?
20 Planning policy: the spanner in the works?
22 The cost: what will drive demand and costs towards 20�8 and beyond?
24 The case for water
26 UK freight map: ten to twenty years down the road
27 Conclusion
30 References
March 2008

Sea and Water
Maximising the use of water freight requires a supportive UK and European framework. Sea and Water acts independently of Government, and so is able to influence UK, European and developed government policy in relevant areas.
Sea and Water Queen Anne’s Business Centre 28 Broadway London SW�H 9JX
Tel: + 44 (0) 20 7340 953� Fax: + 44 (0) 20 7340 9530
[email protected] www.seaandwater.org
Page 5
A vision for UK freight trends towards 20�8 and beyond
Executivesummary
The United Kingdom is an island. Its development owes a huge amount to the role coastal shipping has played since the beginning of its history. One does not have to think too hard to conjure images of the Tyneside colliers that kept London warm, coasters that fed Liverpool with Welsh produce, or of an age when people preferred to travel from London to Edinburgh by sea rather than by land.
The UK’s rise as an economic power came about not only through its maritime prowess but as a direct result of its entrepreneurial approach to freight. In the �6th century, the merchant venturers brought back the untapped wealth of the new world, a prospect that became far less risky after English clockmaker John Harrison solved the longitude problem with his revolutionary maritime clock. The British manufacturing and engineering entrepreneurs of the �8th century envisaged and built our canal system, the superhighway that supported the world’s first industrial revolution. The age of steam in the �9th century brought new opportunities and a rash of rail companies whose rapid development convincingly outperformed the canals. With the 20th century came the invention of the internal combustion engine and so began our love affair with road haulage. What remained of the canal network as well as the railways was nationalised after the second world war and our creative attention shifted towards other matters.
The 2�st century has dawned with the stark realisation that we must act to reduce carbon emissions. Congestion too has become an increasingly serious issue. The RAC says that one in nine journeys is affected. Growth in consumer demand has contributed to road traffic levels that threaten the performance of the economy and the reliability of the modern freight industry. And there is the likelihood that the age of cheap fuel might be over.
But there is also good news. The age of information technology, which has helped mitigate the impact of carbon emissions and congestion, has made trade and communication cheaper and easier.
This report sets out the more recent trends in freight within the UK. It then examines climate change’s impact on the industry, consumers, policy makers and regulators. It offers some case studies to illustrate a significant shift towards innovative logistical ideas, both from within the industry and by policy makers at a national and European level.
The carbon issueThe carbon issue

Page 6
A vision for UK freight trends towards 20�8 and beyond
Having set the scene, the report then examines the drivers for change and how compelling these might be, as well as the options available to diversify haulage modes and create efficiencies. It concludes with some predictions about which direction trends might go and some strategic suggestions about how we might get there.
The tendency is simple enough. Goods are making longer journeys, often from the far east, to supply our demands, creating an economy of scale which favours large ports to berth big ships. From the �950s, just after the canals and railways were nationalised and a huge road building programme was implemented, goods have increasingly been shipped-on domestically by road from the big sea ports in the south east. The proportion of all freight now carried by road stands at 64% (by tonne kilometre) and because of increasing congestion this dominance has almost become a threat to the reliability of road haulage itself.� The fact that the goods we consume increasingly transfer mode in passing through ports, opens up the opportunity for onward domestic distribution by feeder services to the much larger network of smaller, secondary ports.
Perhaps it is unsurprising that, in the last few years, we have seen increasing evidence of people seriously considering new ways to diversify their operations. Policy makers, both in the UK and Brussels, are also alive to the threats posed by congestion and pollution and envisage a co-modal approach to address them. To implement their policies, they look to the time-honoured regulatory toolkit of carrots and sticks: initiatives, incentives and economic instruments to change behaviours have all been introduced and it appears that more are on the way.
Shippers of bulk, non time-sensitive, low value goods have always maintained a large operational ability in water and rail. Yet, they have recently been boosting this side of their operations. More tellingly, in the last few years, we have seen major retail multiples experimenting in the diversification of their supply chains. In addition, market leaders in the road logistics industry have been developing their services to include rail and water.
It is not just congestion and the threat it presents to economic growth that is leading policy makers and operators to consider more efficient ways of hauling goods. There can be no doubt that this move stems from an urgent desire to respond to climate change. Perhaps the motivation is in part to satisfy the modern governance expectation for sound, visible corporate social responsibility. Yet is it evident that the trend is equally being driven by economic expedience.
The geopolitical landscape is significantly conspiring to re-shape our thinking. Aspiring middle classes in China, India and other parts of the far east are having an inflationary impact upon manufacturing. Moreover, global growth in consumption is leading to additional energy demand. This is creating complex tensions between food
Change driversChange drivers
Retailers enter the waterRetailers enter the water
GeopoliticsGeopolitics
Page 7
A vision for UK freight trends towards 20�8 and beyond
supply and power generation, which now find themselves competing for the same resources. Biofuels are now competing directly for staple grain. As a result, wheat prices are already up by over �00% this year, although this spike is also attributed to low-yielding harvests associated with abnormal weather. Oil has held at over $90 a barrier for some months and more recently convincingly broken the $�00 barrier.
Politicians the world over have good cause to be concerned. The history of food riots goes back to Roman times and in recent years has again reared its head. Pasta protests in Italy, tortilla rallies in Mexico and onion demonstrations in India all attest to this. It does not help that as the middle class emerges in the east, the established western middle class is beginning to feel relatively poorer. There will be enormous political, commercial and social pressure to reduce the cost of freight and of food in particular. The freight industry can respond through improved carbon efficiencies. A reduced carbon footprint burns less fuel. It is cheaper.
Of course, we hope advances in renewables and hydrogen cell technology may ease some of the pressure. But we cannot yet be certain when this will occur, and even when we have solved the carbon issue, we will still be left with congestion.
Some mistakes have been made in the past by not maintaining much of the infrastructure needed to support an efficient co-modal transport system. In some cases, key strategic sites have been lost to other uses such as residential property development. There has also been significant underinvestment in new infrastructure that would help to create a modern network.
However, there is some good news. Significant money is now being earmarked to expand the rail network’s capacity and capability to accommodate freight. The 2007 Rail White Paper recommended the doubling of network capacity by 2030 and planning consents have been granted for a number of major new port container terminals.2 Regional planners are beginning to require that major new freight generators (often warehouses) are on rail or water connected sites. Some key water connected sites, not currently in use, have been safeguarded, especially on the Thames. Additionally, the industry is waking up to the need to diversify its skills and competencies, so it will be better placed to rise to the new business opportunities that are on offer. And despite the challenges of the current credit squeeze there is no shortage of money available to invest in sound infrastructure schemes.
The forecast horizon adopted by the DfT for the ports industry is 2030. By that year, the final origin or destination of more than 40% of all goods being moved within the UK will be abroad, most passing through gateway hub ports.3 Anticipated growth will put particular strain on the road and rail infrastructure serving these
Investment in rail and waterInvestment in rail and water

Page 8
A vision for UK freight trends towards 20�8 and beyond
ports, making it all the more important to make the maximum use of waterborne transport to relieve congestion, whilst also providing the market opportunity for waterborne freight to expand its role. The report also forecasts that even without real increases in fuel costs or the introduction of road pricing, rail market share will rise from 8% to �4% and reduce road share from 64% to 58%.4 However, that will require significant enchancement of rail capacity. The parallel expansion of port capacity, the development of port-based distribution parks and waterway upgrades, could allow waterborne freight to make a corresponding contribution and to expand its share from 24% to 32%, so that road freight in the UK would be reduced to a 50% share. It is evident that the realisation of such a goal will require a favourable and enlightened planning environment.
This report attempts to provide a vision for how the UK freight industry might perform within �0 years if the drivers underlying longer term forecasts could be accelerated by radical policy action. Land use planning is particularly important, as is the development of distribution via UK ports.
This horizon represents an entire economic cycle, and given the environmental, geopolitical and economic unknowns, not to mention the planning issue, there are likely to be any number of factors that accelerate or frustrate the rate of change. We believe that were the freight industry, the government and the planning community to set it as a goal, half of all tonne kilometres could be moved by rail, sea or water by 20�8. However, if any of these forces let us down such a target will be out of reach.
Achieving this outcome would call for an increasingly joined up and fertile policy, regulatory and planning landscape. All of these will need to be conducive to the shift towards efficient co-modality. The message must be unambiguous. We need a transport system that is fit for purpose in the 2�st century. It must make the most efficient use of road, rail, air, sea, water and information technologies.
It is then for the UK’s freight industry to respond by working better with the resources available now, embracing new ideas, investing in new infrastructure and training its people. We are again at one of those pivotal moments where a paradigm shift is clearly taking place. We have been here before, when we discovered the New World, thought to invest in the canal system, and developed steam and the internal combustion engine. For the freight industry, by fully understanding and responding to the complexities of what is driving this change, there is an opportunity to get ahead and stay ahead.
The message must be unambiguous. We need a transport system that is fit for purpose in the 21st century. It must make the most efficient use of road, rail, air, sea, water and information technologies, and harness the capabilities of each mode.
The message must be unambiguous. We need a transport system that is fit for purpose in the 21st century. It must make the most efficient use of road, rail, air, sea, water and information technologies, and harness the capabilities of each mode.
Page 9
A vision for UK freight trends towards 20�8 and beyond
Thepast:abriefhistoryoftransportandfreightintheUnitedKingdom
As an island nation, coastal shipping has played a key role in our development since the beginning of our history. Coal from Newcastle to London and food from Wales to Liverpool both reflect its significance. In fact, nowhere on this island is more than one hundred miles from the sea.
But the history of UK freight can be divided into three key eras:
• the canal era (�760-�840) • the railway era (�840-�945) • the road era (post-�945)
The canal era flourished in conjunction with the Industrial Revolution. Canals first burgeoned as manufacturers discovered that they provided an economic opportunity to transport goods to a larger market. As their popularity grew, increasing sums were invested in canal building. Between �770 and �830, the canal system rapidly expanded to over 6,400 kilometres in length. Thanks to this rapid growth and a lack of competition, the UK’s inland waterways became the central mode of transport for �8th and early �9th century haulage.
However, this monopoly did not remain intact for long. In �80�, the UK’s first rail company was established and, given its successes, others soon followed. The Stockton and Darlington Railway became the first to use freight wagons to transport goods along the rail network. The decade between �840 and �850 saw a radical transformation in the UK’s railway map as the length of the network more than quadrupled. Faced with increased competition, the canal network struggled to sustain itself. A modal haulage war ensued but rail offered competitive pricing and faster deliveries. The railway companies found themselves buying out the canal companies, whose assets conveniently offered ready made and topographically flat corridors of land. The UK’s waterways remained vibrant, even into the early part of the twentieth century, but the railway network came to dominate UK freight. Between �870 and �9�0 the volume of rail freight traffic increased threefold as the railway network reached its zenith.5
In �948, the government nationalised most of the UK’s rail and canal networks. Unfortunately, the consequence of centrally planned railways and waterways, combined with an aggressive road building programme, was for both water and rail to fall into decline. Rail freight shrank by half between the �950s and �980s.6 For the waterways it was even worse. Meanwhile, under limited governmental restriction,
Increasing dominance of railIncreasing dominance of rail

Page �0
A vision for UK freight trends towards 20�8 and beyond
road transport and road haulage flourished. In fact, as the volume of freight continued to increase, more and more was shifted onto the road network. By �962, roads lifted 8�% of all goods (in tonnes), compared to �5% for rail. Additionally, in the �980s, the road network was massively expanded. Energy used in transport trebled between �952 and �992, with freight responsible for half of this increase. 7
Since the �960s, water, rail and road have been joined by pipeline and air. In the �980s came the invention of the fax machine along with the internet, email and subsequent investment in infrastructure such as broadband cable and mobile phone networks. Logistics professionals have never had the luxury of so much choice in how they design their operations. We find ourselves at a pivotal moment in freight history.
Today, the UK freight map finds itself again in a state of flux. Much of the inland waterway network, parts of which fell into dereliction during the �950s and �960s, is still publicly owned by British Waterways and the Environment Agency, as well as large private sector owners such as Port of London Authority and Peel Holdings. It continues to play an important and increasing role in UK freight, although most of the volume is to be found on the privately managed waterways. The rail network, privatised again in �993, has seen a 60% rise in freight volume over the last ten years.8 Meanwhile, the road network continues to dominate the freight map, moving close to 64% by tonne kilometre of all goods in the UK (against 24% by water, much of it North Sea oil related and mostly coastal, 8% by rail and 4% by pipe).9 The roads have remained in public ownership, administrated by the Highways Agency and have benefited from a long period of exceptional public spending to secure their development. However, there are no major publicly funded road expansions planned. Nor are there any plans for any increased capacity in pipeline.
New entrantsNew entrants
0
50
100
150
200Pipeline
Water
Rail
Road
20052000199519901985198019751970196519601955
History of tonne kilometres by mode (billion tonne km)
Source: DfT

Page ��
A vision for UK freight trends towards 20�8 and beyond
Thepresent:currentfreighttrends
Here are some current statistics from the Department for Transport’s Transport Statistics for Great Britain to offer an overview of freight trends between road, rail, water and air.�0
• Goods are being moved further than in the past, a trend attributed to a number of factors including changes in distribution patterns and the types of goods lifted.
• Domestic freight moved increased from �75 to 252 billion tonne kilometres between �980 and 2006, an increase of 44%.
• Foreign import tonnages through UK ports increased by 44% between �996 and 2006 (DfT port statistics).�� This growth was led by imports of consumer goods and coal during this period. Meanwhile, foreign exports fell by 8% over the same period. For unitised tonnages (goods in containers and trailers) there was an overall growth of around 46%.
• UK industry spends in excess of £80 billion per year on transporting goods by road, rail and water.
By road
• Most freight is moved by road which remains the mode of choice for commodities. Road currently accounts for 64% of all goods moved (tonne kilometres) and 82% of those lifted, suggesting rail and water are moving more goods for longer journeys.
By rail
• Between �994 and 2006, goods moved by rail increased by 70% and rail accounted for 8% of all goods moved.
• In 2006, rail moved 22 billion tonne kilometres of goods.
• Rail is responsible for the movement of most coal.
How much, how far and from where?How much, how far and from where?
Water
Pipeline
Rail
Road
64%
8%
4%
24%
82%
5%
7%6%
Goods lifted (tonnes) Goods moved (tonne kilometers)
Water
Pipeline
Rail
Road
64%
8%
4%
24%
82%
5%
7%6%
Goods lifted (tonnes) Goods moved (tonne kilometers)
Domestic tonne kilometres by mode 2006
Source: DfT

Page �2
A vision for UK freight trends towards 20�8 and beyond
By water
• Water’s market share fluctuates from year to year. Between �980 to 2006, a low of 48.� billion tonne kilometres was reached in �997 whilst a high of 67.4 billion tonne kilometres was reached in 2000. Much of this variation is explained by the rise of North Sea oil and the effective banning of waste disposal at sea.
• Excluding North Sea oil and sea dredged aggregates, water currently accounts for 9% of goods moved.
• Water is responsible for most liquid oil and petroleum product movements.
• Goods moved by water have the longest average length of haul although this can largely be attributed to the distribution of North Sea oil to refineries.
• Waterborne freight dominates UK international trade. In 2006, 96% of all goods by volume arrived in the UK by sea.
• Between �988 and 2006, the volume of imports moving through UK ports increased by 64% and the volume of exports increased by �3%.
By air
• A quarter of the UK’s visible trade goes by air.
• Over the last twenty years, international air freight tonnes lifted have grown more quickly than domestic air freight tonnes lifted, reflecting the growth in international air freight.
• Air cargo and mail tonne kilometres moved by UK airlines increased by 56% between �996 and 2006.
• 2.6 million tonnes of air freight were moved in 2006 and it is increasing.
• Aviation delivers one third (by value) of the UK’s exports at £�3 billion.
Nonetheless, the face of UK freight is currently undergoing a gradual transformation and the freight transport system may look rather different in �0 to 20 years time.
The key factors most likely to influence this transformation are the environment, the cost of food and fuel and UK and EU policy.
The key factors most likely to influence this transformation of UK freight are the environment, the cost of food and fuel and UK and EU policy.

Page �3
A vision for UK freight trends towards 20�8 and beyond
10-30 million>30 million
<10 million
RoadSea TonnesRail
Coastal shipping and overland freight 2006
Source: Sea and Water

Page �4
A vision for UK freight trends towards 20�8 and beyond
Theenvironment:greenconsumption
Environmental concerns have already begun to reshape UK freight. As a society we have accepted that human activity is a cause of accelerated climate change. We learn more month by month about how our behaviour impacts the planet and respond by paying increasing attention to methods through which we might reduce our impact and restore the environment to better health. Transport is responsible for approximately �4% of C02 emissions and so finds itself front and centre of the debate.�2 For the most part, the industry agrees that modifying the current transport system has become critical to fulfilling the goals that have been set to address climate change under the Kyoto Protocol.
Consumers also play an important role in modifying behaviour. Increasingly aware of their purchasing power, individuals wield influence over retailers as they demand green consumption options on the high street. In their study Consumers and the Environment, the National Consumer Council determined that a significant proportion of the UK population is interested in environmental issues and many people are starting to put these ideals into practice when shopping.�3
Tesco found that 69% of their customers want climate change information on products so they can make informed purchases that will reduce their personal carbon footprint.�4
Non-governmental organisations routinely launch ethical consumption initiatives to encourage retailers to meet green consumers’ demands. Much of this campaigning is designed to encourage businesses to modify their supply chains. For example, the Women’s Institute launched a campaign which demanded that retailers use less packaging for their products. This initiative also advocated the purchase of goods from suppliers within a 30-mile radius to cut down on food miles.
UK companies are responding. There is no longer anything radical about ‘going green’ to attract the more environmentally conscious consumers. It has become mainstream marketing. In fact, findings indicate that sustainability is fast becoming a mass-market phenomenon – with even lower-end retailers embracing a greener approach.
Tesco chief executive, Sir Terry Leahy, recently stated that we are on the threshold of ‘nothing less than a revolution in green consumption’.�5 The retail giant has launched a number of initiatives, including the Sustainable Consumption Institute to fund research
Tesco found that 69% of their customers want climate change information on products so they can make informed purchases that will reduce their personal carbon footprint.Chief executive, Sir Terry Leahy, recently stated that we are on the threshold of “nothing less than a revolution in green consumption.”
Page �5
A vision for UK freight trends towards 20�8 and beyond
on green consumption. Asda recently sponsored the Green Awards, backed by the UN Environment Program, to showcase sustainable development through marketing and communications. As we will see later in this report, each of these retail multiples have also made recent changes to their supply chain that demonstrate they mean business.
Many UK businesses, across every sector are reconsidering their logistics strategies in a direct response to consumer demand. Many are restructuring their supply chains to meet new sustainability goals. Both Asda and Waitrose recently teamed up with Envirowise (a government-funded programme that offers free advice to UK businesses to increase profitability and reduce environmental impact), to work on green supply chain initiatives. Other companies are also exploring opportunities to introduce water and rail into their supply chains. For example, in January 2007, Sainsbury’s conducted a trial on the river Thames in London to test water as a modal option. The trial moved food by barge from Sainsbury’s distribution centre in south east London to a west London store. Although the trial has not yet led to a comprehensive scheme, it is indicative of a growing corporate interest in water freight transport. Tesco has been delighted by their September 2007 initiative to transport their new world wine by sea and water all the way to their bottling plant at Irlam on the Manchester Ship Canal. In 2006, they teamed up with Stobarts to bring rail into their UK supply chain. Indeed, several of the main supermarkets have been using third party carriers to move goods by rail to and from Scotland for several years.
Road hauliers have been taking steps to reduce their own environmental impact. Many major operators are switching to ‘greener’ vehicles to reduce high levels of carbon emissions. For example, Sainsbury’s is gradually switching to electric vans for its online customer deliveries. The company aims to have 20% of its online business delivered by electric vans by the end of this year.�6 The Co-operative Group has taken significant steps to increase road haulage efficiency. In 2003, it launched a trial in which it converted 60 Foden articulated lorries to run on the bi fuel format of compressed natural gas and diesel. The company now utilises 40 double-decker trailers. These are fitted with a pair of solar panels which charge the batteries that power the moving deck and reduce the need for charging at the distribution depot. �7
These are all fine examples of growing effort on behalf of the private sector to create more efficient logistics strategies. Although they do not reflect a sea change, a number of key trends are developing. First, some companies are shifting away from air freight transportation. Consumers know that air, the most fuel- and carbon-intensive mode of transport, produces about one hundred times more carbon per tonne kilometre than sea. So therefore companies are moving towards more efficient modes to make their suply chains more
Case study Sainsbury’s green Initiative
As a part of their overall strategy to make their supply chain more sustainable, Sainsbury’s is developing its online business with electric delivery vans and other initiatives. They have set the following targets:
• To ensure that 20% of online shopping deliveries are delivered by electric vans by the end of this year.
• To ensure that �00% of online shopping deliveries in urban areas are delivered by electric vans in 20�0.
• To reduce the distance travelled by its fleet and suppliers by five million kilometres by 20�0.
• To reduce carbon emissions per case of bulk by 5% by March 2009.
• To source 70% of organic produce from the UK by the end of 2006.
• To investigate the concept of ‘food miles’ and ensure that future haulage policies reflect the results of these findings.24
Page �6
A vision for UK freight trends towards 20�8 and beyond
sustainable. Tesco has even committed to a specific target for airfreight, restricting air transport to less than �% of its products. Morrisons and Marks and Spencer now label air-freighted produce to allow their customers to make more informed decisions about the environmental impact of their purchases.�8
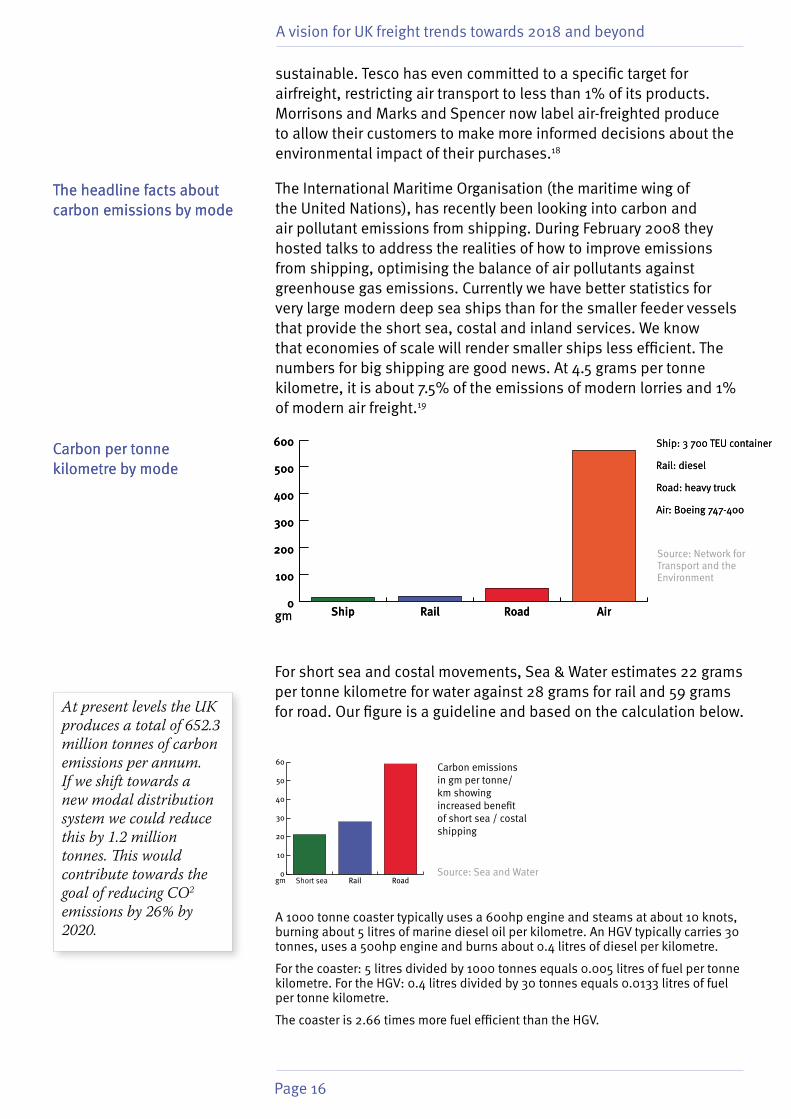
The International Maritime Organisation (the maritime wing of the United Nations), has recently been looking into carbon and air pollutant emissions from shipping. During February 2008 they hosted talks to address the realities of how to improve emissions from shipping, optimising the balance of air pollutants against greenhouse gas emissions. Currently we have better statistics for very large modern deep sea ships than for the smaller feeder vessels that provide the short sea, costal and inland services. We know that economies of scale will render smaller ships less efficient. The numbers for big shipping are good news. At 4.5 grams per tonne kilometre, it is about 7.5% of the emissions of modern lorries and �% of modern air freight.�9
The headline facts about carbon emissions by modeThe headline facts about carbon emissions by mode
0
100
200
300
400
500
600
AirRoadRailShip
Carbon per tonne kilometre by mode
gm
Ship: 3 700 TEU container
Rail: diesel
Road: heavy truck
Air: Boeing 747-400
0
100
200
300
400
500
600
AirRoadRailShip
Carbon per tonne kilometre by mode
gm
Ship: 3 700 TEU container
Rail: diesel
Road: heavy truck
Air: Boeing 747-400
gm0
10
20
30
40
50
60
RoadRail
A �000 tonne coaster typically uses a 600hp engine and steams at about �0 knots, burning about 5 litres of marine diesel oil per kilometre. An HGV typically carries 30 tonnes, uses a 500hp engine and burns about 0.4 litres of diesel per kilometre.
For the coaster: 5 litres divided by �000 tonnes equals 0.005 litres of fuel per tonne kilometre. For the HGV: 0.4 litres divided by 30 tonnes equals 0.0�33 litres of fuel per tonne kilometre.
The coaster is 2.66 times more fuel efficient than the HGV.
For short sea and costal movements, Sea & Water estimates 22 grams per tonne kilometre for water against 28 grams for rail and 59 grams for road. Our figure is a guideline and based on the calculation below.
Short sea
Carbon emissions in gm per tonne/ km showing increased benefit of short sea / costal shipping
Source: Network for Transport and the Environment
Source: Sea and Water
At present levels the UK produces a total of 652.3 million tonnes of carbon emissions per annum. If we shift towards a new modal distribution system we could reduce this by 1.2 million tonnes. This would contribute towards the goal of reducing CO2 emissions by 26% by 2020.
Page �7
A vision for UK freight trends towards 20�8 and beyond
Transportpolicy:howdotheUKgovernmentandtheEUseetrendsdeveloping?
Both United Kingdom and European Union policy makers are shaping the transformation of the UK freight map. The focus in transport has shifted towards inter-modality. The intention is to develop a highly efficient system enabling goods to be transported in containers that are easily interchangeable between multiple modes of transport. At its best, it offers the seamless transfer between modes by purpose built lifting gear. It is fast, efficient and above all cheap. But it requires a cooperative approach with shippers, freight operators and customers all accepting strict industry standards in container design, and investment to meet those standards with the appropriate infrastructure. Everyone should benefit from a reduction in cargo handling, damage and loss, improved security and, in many cases, cutbacks in cost.
Since the �980s there has been growing concern over both road congestion and preservation of the environment. The concept of inter-modality has been gaining momentum since the late �990s. The �998 White Paper A New Deal for Transport was the first major document to outline an inter-modal framework for the UK freight transport system. The report presented the case for a multi-modal system that would prove safer, cleaner and fairer than the mono-modal system that still dominates. The Transport Act of 2000 consolidated the government’s vision of an integrated transport system.
Inter-modality remains central to today’s UK transport agenda. In their 2004 paper The Future of Transport: A Network for 2030 the Department for Transport set out the need for an integrated approach to freight transport. This vision requires road, rail, inland waterways, coastal shipping, ports and airports to all play their part in enabling a vibrant economy by minimising congestion, reducing pollution and greenhouse gas emissions, and improving safety. The document states that moving more freight by rail, sea and water can reduce congestion on the road network, so increasing safety levels. The Department encourages links between industry, local government and the community to deliver a strategy for sustainable, integrated transport. Additionally it has introduced grants schemes to encourage a smooth, cost-effective transition to inter-modality.
Between now and 20�4, the Government will invest more than £�0 billion to increase rail capacity (although much of this will go towards improving passenger services).20
Grants available from the DfT
• Freight Facilities Grants (FFG) to offset the capital cost of providing rail and water freight handling facilities.
• Rail Environmental Benefit Procurement Scheme (REPS) to assist companies with the operating costs associated with running rail freight transport instead of road
• Waterborne Freight Grant scheme (WFG) to assist companies with the operating costs, for up to three years, associated with running water freight transport instead of road (where water is more expensive than road).

Page �8
A vision for UK freight trends towards 20�8 and beyond
We expect to see the longer term vision reaffirmed though a consultation exercise during the summer of 2008 leading to a White Paper on sustainable transport later in the year.
The European Union has also shifted its attention towards inter-modality. The recent White Paper European Transport Policy for 2010: time to decide emphasises a need to move towards an integrated freight transport system. The report notes that both rail and water have massive potential and virtually unlimited capacity in the European community. In terms of rail, the report calls for the re-examination of rail networks and infrastructure to ensure they have the capacity to maintain a 35% share of the freight market in 20�0. In terms of shipping, the report encourages freight transport along both inland waterways and the short-sea network. It asserts that sea transport is a real and competitive alternative to land transport.
The European Union has also undertaken a number of initiatives to promote inter-modality. One example is the comprehensive Marco Polo programme, established in 200�. This scheme was created to support inter-modal initiatives and alternatives to road transport in the early stages to ensure their commercial viability. With a budget of €30m, the aim was to encourage business proposals in the European community that would shift freight away from road to more environmentally-friendly modes of transport. The European Commission also vowed to provide the necessary fleets to ensure the success of the programme. More recently, the EU renewed funding for a Marco Polo II programme which will run until 20�3. Much like the first initiative, its core aims are to reduce congestion, improve environmental performance and increase inter-modality. Outputs from Marco Polo have included Motorways of the Sea and Shortsea XML.
Shortsea XML is free software designed to smooth out administrative and self imposed differences between short sea and road freight. The Marco Polo project recently determined that a staggering 25 documents are required for submission by a vessel, or its agent, for each port visit a ship makes. In addition, a plethora of other forms are required to cover customs clearance, loading and discharge, onboard supplies, waste disposal and other activities. Together, this administration and form filling account for 20-30% of the total cost of the supply chain. These costs are not replicated in a road-based supply chain. Further investigation revealed that this information, whilst broadly similar in content, is non-standard in format and is being exchanged by a range of differing technologies. The Shortsea XML initiative is working with ports, owners and shippers to reduce this burden through the creation of a series of standardised messages developed using open and modern technology. If widely adopted, this new standard will reduce costs and go some way to levelling the playing field between road and short sea.
So what about implementation. How do we get there?
‘Motorways of the Sea’ aims to introduce new inter-modal maritime-based logistics chains in Europe, which should bring about a structural change in transport organisation. These chains are to be more sustainable and commercially efficient than road-only transport. ‘Motorways of the Sea’ encourages fuller use of maritime transport resources, rail and inland waterways. The programme outlines four key motorways in the European community, two of which directly benefit UK freight operators.

Page �9
A vision for UK freight trends towards 20�8 and beyond
Planningpolicy:thespannerintheworks?
In the real world, policy has little prospect of being realised without having the right infrastructure in the right places. Infrastructure is the key factor in any efficient freight system. Operators can respond by improving their operations using short sea or coastal feeder services and rail. To secure the fullest benefits of inter-modality, they may decide to build their new distribution centre closer to a local port or rail terminal with easy access to the road network. Planning policy has an essential role to play in enabling this to happen. Or not. Too many recent experiences demonstrate that consents either cannot be secured or can take up to a decade to be granted. Much needed larger schemes have been delayed or thwarted because of protracted and expensive public inquiries. Building the infrastructure itself might take only a few months but getting to the point where work begins on site can take many years and often serves as an insurmountable disincentive.
Realising transport policy objectives will require considerable infrastructure development at both regional and local levels. Government is working on a new Planning Bill which should make applications for larger infrastructure schemes less moribund. Streamlining the process should mean that an independent planning commission will oversee applications for larger infrastructure projects, deciding on issues of primacy early on and so allowing public inquiries to focus on relevant local matters (such as environmental impact assessments). The group of categories for qualifying schemes might include inland rail depots larger than 60 hectares, port terminals having an annual throughput in excess of 500,000 TEUs (twenty foot equivalent units) and Roll-On / Roll-Off ports handling over 250,000 trailers per annum. It will also include other large plannign applications such as nuclear power stations. Hopefully this will make the planning stage of infrastructure development more efficient.
For our industry to realise transport policy objectives it will also be essential for regional development agencies to work with local and unitary planning authorities, to clearly identify the key locations to be reserved for inter-modal infrastructure. Sea and Water does not expect the construction of massive new inland waterways in the UK. But to maximise the opportunities that our existing large scale inland waterways might offer, we should consider developing a number of strategic inland ports. These need to be located at sites on the broad rivers and canals, and close to major conurbations. They must also be capable of accepting reasonably large and preferably sea-going vessels, and easily linked with the highway and railway
How can our planning system help our industry to plan for the future? Of the total tonnes lifted shown in the Department for Tranport’s ‘Transport Statistics for Great Britain’, many are double counted because most consumer goods move at least three times before reaching the shop. Actual tonnes moved in the UK are approximately �.3 billion. If we ignore most of the iron ore and crude oil landing at our ports and we add Channel Tunnel tonnage, we reach about 420 million tonnes of transit port traffic. This means that one third of all goods getting from A to B within the UK have an overseas origin or destination. Official forecasts suggest this figure will reach over 40%, or an additional �50 million tonnes of extra port traffic, by 2030.2� Therefore, most of the growth in goods to be distributed will actually change mode on the coast and, herein lies the opportunity. If we locate the distribution facilities (warehousing, etc.) needed to accommodate the anticipated growth in imports at and around our sea ports, goods can be shipped-on more easily by water and rail. The tonnages we can plan for are huge. The key is a planning policy that allows this to happen.
How can our planning system help our industry to plan for the future? Of the total tonnes lifted shown in the Department for Tranport’s ‘Transport Statistics for Great Britain’, many are double counted because most consumer goods move at least three times before reaching the shop. Actual tonnes moved in the UK are approximately �.3 billion. If we ignore most of the iron ore and crude oil landing at our ports and we add Channel Tunnel tonnage, we reach about 420 million tonnes of transit port traffic. This means that one third of all goods getting from A to B within the UK have an overseas origin or destination. Official forecasts suggest this figure will reach over 40%, or an additional �50 million tonnes of extra port traffic, by 2030.2� Therefore, most of the growth in goods to be distributed will actually change mode on the coast and, herein lies the opportunity. If we locate the distribution facilities (warehousing, etc.) needed to accommodate the anticipated growth in imports at and around our sea ports, goods can be shipped-on more easily by water and rail. The tonnages we can plan for are huge. The key is a planning policy that allows this to happen.
Page 20
A vision for UK freight trends towards 20�8 and beyond
networks. There is an important role for RDAs - assisted by industry - to play in identifying these sites. Moreover, once identified they need to be protected, much like important wharves have been in London. Realising large schemes takes time and there will inevitably be competition from other uses for sites, particularly waterside locations. Once these key locations are lost they are usually lost forever. If this is allowed to happen the chances of realising transport policies are seriously curtailed.
However, new infrastructure projects do get built. In East London, the Bow Back Rivers run directly past the site of the Olympic stadium and village at Stratford. They have not been used for commercial freight for many years and had fallen into a state of neglect. To make them usable meant building a new water control structure, to be called the Prescott Lock (after Major Prescott, who was a member of the Lee Conservancy Board which undertook the construction of the eponymous flood conveyance channel in the �930s). In 2007, after much discussion and commendable co-operation between various agencies, a funding partnership was formed between the Olympic Delivery Authority, London Thames Gateway Development Corporation, Transport for London, Department for Transport and British Waterways to meet the project cost of £�8.9m. The Prescott Lock will open later this year.
British Waterways says ‘It will create a green gateway for barges entering the Olympic Park, helping to remove up to �,000 lorry journeys a week from local roads. Water transport is greener, cleaner and more sustainable than road haulage, using less than a third of fuel and emitting less than a sixth of the pollution. The new lock will improve local air quality, save 4,000 tonnes of carbon dioxide in the build up to the Olympics and create a green transport network for future movement of waste and recyclables by barge’.
This initiative will serve far more than just the Olympic construction effort. Over the next 20 years spoil from London’s Crossrail will be transported out of the capital by water.
Case study Prescott Lock: bringing the Bow Back Rivers into play
The Prescott Lock is a textbook example of co-modal infrastructures being properly connected together. Throughout the construction of the Olympic stadium and village (and thereafter the Crossrail construction project), millions of lorry movements will be avoided. The busy streets of East London will be less congested. The environmental benefits for the local community will be enormous. It demonstrates how joined up policy and planning initiatives can achieve great things. To achieve co-modality we need more schemes as well thought out as the Prescott Lock

Page 2�
A vision for UK freight trends towards 20�8 and beyond
Thecost:whatwilldrivedemandandcoststowards2018andbeyond?
A �0-year horizon represents an entire economic cycle. There are many environmental, geopolitical and economic unknowns that can and will change over the duration, not to mention the constraints of a moribund planning regime. There are also likely to be any number of factors that accelerate or frustrate the rate of change. Looking at the big picture these might include the following:
Geopolitical
• The rise of the middle classes in China, India and the far east, with likely inflationary effects as their aspirations rise and they can no longer be looked upon to provide cheap labour.
• Disaffection towards leadership by western middle classes who are likely to be feeling relatively poorer. Mervyn King, Governor of the Bank of England is already bracing people for this in the UK.
• As cheap goods from the far east become less competitive, we might eventually see a resurgence of manufacturing in the west, changing the balance of imports and exports. It would be impressive were even the first murmurings of this shift to be felt within the next �0 years but it may well be something trend spotters are paying attention to by 20�8.
• Increasing competition for energy resources keeping the cost of oil at current levels of over $90 a barrel or worse.
• Increasing competition between bio fuel makers and food suppliers for grain staples leading to rapid inflation in grain prices (wheat increased by 50% during January 2008 alone). The governments of the day will feel obliged to take whatever measures they can to keep the cost of basic foods as reasonable as possible. It isn’t difficult to imagine enormous pressure being applied to the retail and haulage industry to avoid social disquiet over food prices or availability.
Environmental
• Increasing pressure to reduce carbon emissions.
• Abnormal weather causing crop failure has also been a contributory factor to unprecedented increases in wheat prices globally during 2007.
• Purchasing habits changing in response to changing weather patterns.
Page 22
A vision for UK freight trends towards 20�8 and beyond
• Good news in the form of a technological breakthrough in addressing climate change, such as commercially viable fuel cell technology.
Economic
• Spiralling fuel costs.
• Pressure from customers to reduce transport costs to keep retail prices low.
• The freight industry being hamstrung by congestion as the cycle returns to higher growth. For example, Transport for London expects freight volumes in London to increase by �5% in the next few years.22
• Road pricing initiatives or other economic instruments. We are not currently expecting a national road charging scheme but we are expecting more local congestion calming initiatives in larger cities and perhaps charging on some major roads before 20�5.
Globalisation has brought huge gateway challenges. Two thirds of global container traffic goes through just 60 or 70 ports worldwide.23 The local impact, especially on roads is enormous and forecast to grow. Again, the risks of not building greater diversity into our supply chains are carbon and congestion. Onward distribution by water offers a part of the solution but, where it is possible, we must extend the coast inland for ships. Smaller-scale operations using barges will help but will not be sufficient. Additionally, all our ports, the big hubs and the smaller regional operations will need plenty of space for storage.
So perhaps it is unsurprising that in the last few years we have already seen increasing evidence of people seriously considering new ways to diversify their operations. Policy makers, both in the UK and Brussels, are also alive to the potential impacts of things happening on the other side of the world. As we have seen, they envisage off-setting risk with a more co-modal system where rail and water work in greater cooperation with road and vice versa. To implement their policies, they will look to the time-honoured regulatory toolkit of carrots and sticks: initiatives, incentives and economic instruments to change behaviour have all been introduced and it appears that more are on the way.
In September 2006 market leaders Eddie Stobarts launched their first rail service and in August 2007 they diversified into their first port operation. They are watching closely at which way the wind is blowing and acting prudently in developing their skills base to respond to the opportunities that co-modality will bring. Wincanton offer a fully inter-modal range of services to clients and are in fact the third biggest barge operator on the Rhine. A diverse supply chain will prove more robust when one or another component is for some reason not functioning optimally. Diversity offers choice and reduces risk.
Policy makers, both in the UK and Brussels, are also alive to the potential impacts of things happening on the other side of the world.
Globalization has brought huge gateway challenges. Two thirds of global container traffic goes through about 60 or 70 ports worldwide.

Page 23
A vision for UK freight trends towards 20�8 and beyond
Thecaseforwater
Conventional wisdom tells us that the goods best suited to water are bulk, low value and non time-sensitive. That may have been true when oil was still $50 a barrel but, as has already been discussed, we are not expecting to see that again any time soon. Several economic commentators are expecting prices to reach $200 a barrel in the medium term. So how much are we moving by water and where is it going?
The tonnage of big, slow, low value goods moved by sea is enormous. However, with efficient feeder services already operating from the south coast up both the eastern and western seaboards, and new services regularly coming on line, this is far from being the whole story. Few people realise that a quarter of freight moving between the south east and Scotland goes by ship. If you can move 50 lorries worth in one movement and it is much more fuel efficient, you cannot help but consider the practicalities of water as an alternative. We are seeing increasingly diverse cargos travelling shorter distances between the most unexpected destinations. In November 2007, Costal Bulk Shipping moved �,300 tonnes of wheat the fifty odd miles between Littlehampton and Southampton.
Conversely in Japan, two rather than one islands admittedly, but with a similar sized population and economy, they move 40% of domestic freight around by water26. Japan is also blighted by a lack of effective, broad inland waterways but this has not stopped the Japanese from exploiting the obvious opportunities for coastal feeder freight movements.
We have already looked at the Prescott Lock scheme in east London. It is worth looking also at some other UK examples:
• B&Q used to bring far east containers into Southampton and then deliver them by road to their regional distribution centres at Doncaster and Warrington. Now the containers go to Rotterdam and are feedered to Immingham from where they are sent by road to the regional distribution centres. This way B&Q reduces the risk of delays caused by congestion.
• 75% of ASDA’s deep-sea ambient imports now come in via their new Regional Distribution Centre at Teesport. They say lorries can deliver north of Birmingham quicker than from Southampton, because there is less congestion.
• Over 50% of all the aggregate used in London arrives by water.
• To supply increasing demand for more feeder services, Peel Ports are planning Port Salford to handle 500,000 TEUs per annum by
Case study Tesco use water for wine
In October 2007 Tesco, unveiled a new haulage scheme, transporting its new world wine imports by sea to Liverpool and then via the Manchester Ship Canal to their bottling plant at Irlam.
The scheme, which involves three journeys a week, moves an estimated 600,000 litres of wine along a 40-mile stretch of the Manchester Ship Canal from Liverpool to Manchester.The containers of wine are then transported to a nearby bottling plant where they are packed for Tesco supermarkets across the country.
This initiative takes fifty lorries off UK roads every week. Compared to the retailer’s former freight strategy, the new scheme cuts carbon emissions by 80%. The scheme has been so successful that Tesco intends to increase volume in 2008, saving 3,500 lorry movements by the end of this year.
It is worth noting that reduced storage from more time at sea and outsourced warehousing have been factors in making this initiative work financially for Tesco.
Page 24
A vision for UK freight trends towards 20�8 and beyond
water and rail. A significant business driver for them is the many Regional Distribution Centres in the nearby north west Manchester area with good motorway links. Peel Ports are already feedering containers from Southampton to Irlam in preparation for this development.
• Kimberly Clark used to bring raw materials from Holland to Tilbury and then deliver them by road to their Workington mill in Cumbria. Now, they ship direct to Workington. This is more reliable and presumably cheaper.
• Molasses from Le Havre go by ship directly to Silloth in Cumbria (not to Southampton and then cross country by road). Again, in this instance it is simpler, cheaper and more reliable.
Where water is convenient to the local or regional distribution depot it can prove to be highly cost effective. This is because of reduced fuel costs and reduced manning requirements. Even a fairly small ship will take a payload equivalent to fifty loaded lorries. This is why deciding where to build new Regional Distribution Centres is crucial. To get the best of all worlds and keep logistics options open, build by a decent sized waterway or a small port.
There is never any congestion at sea. There are never any roadworks. If another ship breaks down it is never a problem to alter course and steam past it. You can not get stuck behind another ship. If delivery speeds are slowed down due to poor weather the same is likely to be happening on the highways and railways.
However, over reliance on too few major ports does carry its own risks, as has been seen this year from the delays caused by the failure of just one crane at Southampton. Robust supply chains avoid pinch points where possible. That is why it is essential for the large necklace of smaller ports to be able to develop capacity and improve inter-modal infrastructure. As well as increased capacity at Felixstowe and Southampton, there are also significant plans at Liverpool, Thamesport, Bristol, Tilbury, London Gateway, Bathside Bay and Teesport.
Case study Moving London’s waste by river, saving 100,000 lorry movements per annum
Cory Environmental are one of the UK’s leading recycling and waste management companies. In London, working with partners Western Riverside Waste Authority, Corporation of London, Westminster City Council, London Borough of Tower Hamlets and the Port of London Authority, they have secured the long term commitment needed to put the necessary infrastructure in place to best address London’s waste management for the next 30 years. Cory have been moving waste out of London by river for generations, working with partners to secure the necessary sites and put in place the infrastructure needed to move 700,000 tonnes to landfill and recycling. The landfill facility at Mucking has been reaching capacity but Cory has been working well in advance to successfully secure planning consent to build a new Riverside Resource Recovery facility at Belvedere. This plant which will generate 66 MW of power annually from the incineration of 585,000 tonnes of waste. London will continue to benefit by averting �00,000 lorry movements that would only increase congestion.
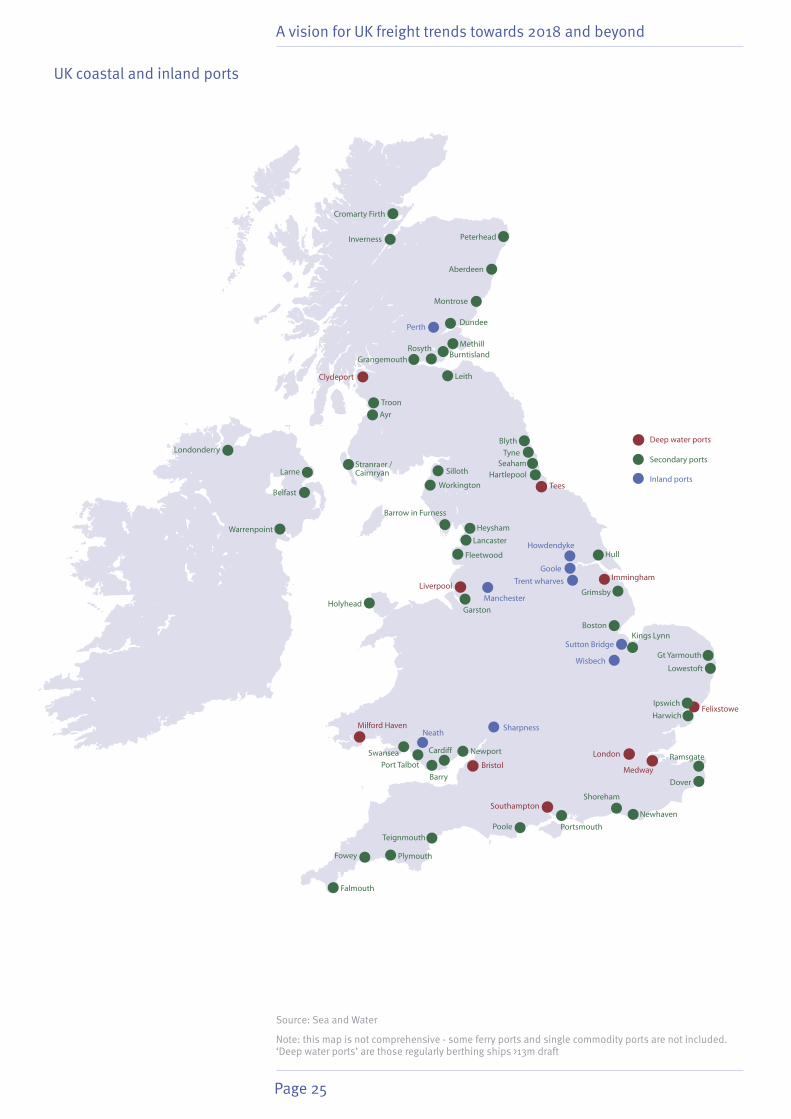
Page 25
A vision for UK freight trends towards 20�8 and beyond
Source: Sea and Water
Note: this map is not comprehensive - some ferry ports and single commodity ports are not included. ‘Deep water ports’ are those regularly berthing ships >�3m draft
UK coastal and inland ports
Liverpool
Southampton
London
Medway
Tees
Felixstowe
Bristol
Deep water ports
Clydeport
Milford Haven
Immingham
Garston
Barrow in Furness
Fleetwood
Port Talbot
CardiffSwansea
Gt Yarmouth
Heysham
Barry
Newport
Lowestoft
Ipswich
Kings Lynn
Grimsby
Plymouth
TeignmouthPortsmouth
Dover
Falmouth
HartlepoolSillothStranraer /Cairnryan
Belfast
Tyne
Aberdeen
GrangemouthBurntisland
Leith
Ayr
Troon
Rosyth Methill
Dundee
Hull
Secondary ports
Harwich
Poole
Shoreham
Boston
Ramsgate
Londonderry
Larne
Warrenpoint
Holyhead
Inverness
Newhaven
Workington
Cromarty Firth
Montrose
Peterhead
Blyth
Seaham
Fowey
Lancaster
Inland ports
Neath
Trent wharves
Perth
Sutton Bridge
Howdendyke
Wisbech
Sharpness
Manchester
Goole

Page 26
A vision for UK freight trends towards 20�8 and beyond
UKfreightmap:tentotwentyyearsdowntheroad
The Department for Transport’s projections are based on a 2030 horizon and assume a ‘do nothing’ environment with no road charging or radical rises in fuel costs.25 They suggest that if water maintains its market share, the split would be water 24%, pipe 4%, road 58% and rail �4%.
A reduction in the use of coal for electricity generation is likely to lead to a �0 million tonne reduction in rail freight volumes between 2006 and 2030. However, this is more than offset by the predicted demand growth from other sectors.
Volumes of non-bulk domestic and inter-modal rail freight volumes (ie consumer goods moved by rail) are anticipated to see a fourteen-fold and four-fold increase respectively between 2006 and 2030.
The construction sector will also make more use of rail; a 42% increase in freight volume is predicted between 2006 and 2030.
Demand for services in the south east of England and on the east and west coast main lines is predicated to rise substantially over the next 25 years.
Recommendations for freight operators:
• Look carefully into your options. You may have more choices available than you realise.
• Experiment with other modes. Run a pilot project to learn how other modes work.
• When evaluating the relative costs consider the whole picture. When Tesco switched to water for their new world wine supply chain they found additional savings in reduced storage charges.
• Deciding where to build new Regional Distribution Centres is crucial. To get the best of all worlds and keep logistics options open, build by a decent sized waterway or a small port.
• Develop your people and ensure that your staff have the appropriate skills and competencies to go multi modal.
2006 20�5 2030 Change�
Rail Total tonnes (million) �23.7 �30.3 �97.8 +2.0%Of which not coal 72.3 94.7 �56.7 +3.3%Of which coal 5�.4 35.7 4�.� -0.9%Tonne km (billion) 23.5 3� 50.4 +3.2%Trains (thousand) 409 434 634 +�.8%Indices for tonne km: �00 �32 2�5 +3.2%
Road Total tonnes (million) �,720 �,8�2 �,968 +0.6%Total km (billion) �62.9 �8� 2�2.2 +�.�%Indices for tonne km: �00 ���.� �30.3 +�.�%
Rail plus road Total tonnes (million) �,848 �,942 2,�66 +0.7%Tonne km (billion) �86.4 2�2 262.6 +�.4%Indices for tonne km �00 ��3.7 �40.9 +�.4%
Ports Total tonnes (million) 575 625 76� +�.2%Lolo containers (m tonnes) 52 79 �22 +3.6%Roro (m tonnes) �003 �3� �95 +2.8%Bulk liquids (m tonnes) 249 267 282 +0.5%Other dry cargo2 (m tonnes) �74 �48 �62 -0.3%
� per annum | 2 including minor ports | 3 inc Eurotunnel Unitised cargo weights as reported in Maritime Statistics
Source: MDS Transmodal
GB freight forecast 2006 - 2030
Page 27
A vision for UK freight trends towards 20�8 and beyond
Conclusion
Achieving the multi-modal world envisaged by policy makers will be a steep learning curve for many. It does not help that mistakes have been made in the past by failing to maintain much of the infrastructure needed to support an efficient co-modal transport system. In some cases, key strategic sites have been lost to other uses such as residential property development. There has also been significant underinvestment in new infrastructure that would help to create a modern network. But there is some good news. Significant money is now being spent on new rail track and sea port terminals. Regional planners are beginning to insist that they are connected. Some key sites, not currently in use, have been preserved, especially in London. Additionally, the industry is waking up to the need to diversify its skills and competencies so it will be better placed to rise to new business opportunities that are on offer. And despite the challenges of the current credit squeeze there is no shortage of money available to invest in sound infrastructure schemes.
When considering modal options, it is worth remembering a significant but frequently overlooked fact. We are on an island. 96% of all goods that arrive here do so by sea. Most of them move through a handful of major ports who process a vast tonnage for shipping on. But there are more than 50 smaller ports around the UK that would happily take feeder freight services by sea from major ports. In many cases these ports are within a few miles of regional distribution centres. And there is potential to develop a number of strategic inland ports to take those feeder services even closer to where they are needed.
Time for a reality check. If the whole logistics industry decided to move everything possible by water and rail, would the water and rail freight industries be able to cope? No, they would not. Not overnight. From the Sea & Water perspective, there are currently not enough suitable ships, barges, wharves or trained crews. But these shortfalls are being addressed. That is why companies like Stobarts are learning about water and why new vocational college courses are being established; these ensure that young people can pursue a career in the water side of the modern logistics industry, doing apprenticeships and acquiring their boat master licences. Rail faces similar issues and is also responding to meet the challenge.
Efficient inter-modal solutions often require purpose designed and built vehicles. This will be an evolution over a period of time. It has already started, especially in the waste management field where ideas have moved through to production and application.
The coordination challenge:
The Stern report of 2006 addresses envonmental policy
The Eddington report of 2006 addresses transport pollicy
The Barker report of 2007 addresses planning policy

Page 28
A vision for UK freight trends towards 20�8 and beyond
We will all need to work together to achieve this end. As a result, new commercial opportunities will emerge.
As well as industry standards in co-modal infrastructure, intermodality also benefits from increased warehousing being available at sea ports and rail terminals. Outsourcing storage is being recognised as a cost saving that can swing the balance in favour of a multi-modal supply chain. Rail and water have a key role to play in achieving co-modality. Neither will ever be the answer, that is not what co-modality offers. Each will be a part of the solution.
So when might we arrive at this co-modal idyll? The 2007 Rail White Paper states ‘As with passenger growth, it is not possible to forecast with confidence the amount of freight moved by rail over 30 years’ time. Given planning and financing timescales, forecasts on private sector acquisition of ports also tend to be vague and based on a 30 year time horizon. To be sure, such forward timelines help the water and rail freight industries to develop confidence within the distribution industry, as it invests in railside and waterside sites. But we could aspire to be more ambitious, and may yet find ourselves increasingly incentivised to do so.
The forecast horizon adopted by the Department for Transport for the ports industry is 2030. By that year, the final origin or destination of more than 40% of all goods being moved within Great Britain will be abroad, most passing through ‘gateway’ hub ports. Such growth will put particular strain on the road and rail infrastructure serving these ports and make it all the more important to use waterborne transport. This will relieve pressure and provide the market opportunity for waterborne freight to expand its role. The model forecasts that even without real increases in fuel or the introduction of road pricing, rail market share will rise from 8% to �4% and reduce road share from 64% to 58%. However, that will require significant rail network capacity enhancement. The parallel expansion of port capacity, the development of port-based distribution parks and waterway upgrades, could allow waterborne freight to expand its share from 24% to 32% so that road freight in the UK would be reduced to just a 50% share. It is evident that the realisation of such a goal will require a favourable and enlightened planning environment.
This report attempts to predict trends in the UK freight industry and to best-guess what it will look like in ten years time. This horizon represents an entire economic cycle and given the environmental, geopolitical and economic unknowns, not to mention the planning issue, there are likely to be any number of factors that accelerate or frustrate the rate of change. We believe that were the industry and the planning community to set it as a goal, half of all tonne kilometres could be moved by rail, sea or water by 20�8. If the industry resists change or the planning system lets us down we will surely miss this target.
The likely drivers for change:• Reducing exposure to very high oil prices• The inflationary impact of a developing middle class in the far east• Domestic disenchantment, especially about food prices• Reducing carbon emissions• Avoiding congestion and congestion calming economic instruments• A fertile policy and (hopefully planning) landscape

Page 29
A vision for UK freight trends towards 20�8 and beyond
Achieving this outcome would call for an increasingly joined up and fertile policy, regulatory and planning landscape. All of these will need to be conducive to the shift towards efficient co-modality. The message must be unambiguous. We need a transport system that is fit for purpose in the 2�st century. It must make the most efficient use of road, rail, air, sea, water and information technologies, and harness the capabilities of each mode.
It is then for the UK’s freight industry to respond by working better with the resources available now, embracing new ideas, investing in new infrastructure and training its people. We are again at one of those pivotal moments where a paradigm shift is clearly taking place. We have been here before, when we discovered the New World, thought to invest in the canal system, and developed steam and the internal combustion engine. For the freight industry, by fully understanding and responding to the complexities of what is driving this change, there is an opportunity to get ahead and stay ahead.
Page 30
A vision for UK freight trends towards 20�8 and beyond
References
� Department for Transport 2007, Transport Statistics for Great Britain, London
2 Department for Transport 2007, Delivering a Sustainable Railway, London
3 Department for Transport, Update of UK Port Demand Forecasts to 2030 & Economic Value of Transhipment Study, London
4 Department for Transport, Update of UK Port Demand Forecasts to 2030 & Economic Value of Transhipment Study, London
5 Thalmann, P. 2004, The Dynamics of Freight Transport Development, Ashgate Publishing Ltd, United Kingdom
6 Thalmann, P. 2004, The Dynamics of Freight Transport Development, Ashgate Publishing Ltd, United Kingdom
7 Thalmann, P. 2004, The Dynamics of Freight Transport Development, Ashgate Publishing Ltd, United Kingdom
8 Department for Transport 2007, Transport Statistics for Great Britain, London
9 Department for Transport 2007, Transport Statistics for Great Britain, London
�0 Department for Transport 2007, Transport Statistics for Great Britain, London
�� Department for Transport, Update of UK Port Demand Forecasts to 2030 & Economic Value of Transhipment Study, London
�2 HM Treasury 2006, The Stern Review Report on the Economics of Climate Change
�3 National Consumer Council 2002, Green consuming: enabling customers to contribute to environmental improvement, London
�4 Futureye 2007, Futureye Thinkpiece : Is green consumption about to take-off and evolve beyond tokenism or will the promised green revolution fizzle into a fad?, Melbourne
�5 Futureye 2007, Futureye Thinkpiece : Is green consumption about to take-off and evolve beyond tokenism or will the promised green revolution fizzle into a fad?, Melbourne
�6 J Sainsbury plc 2007, Corporate Responsibility Report 2007, London
�7 The Co-operative Group (2006) Sustainable Report 2006, Manchester
�8 National Consumer Council 2006, Green grocers: how supermarkets can help make greener shopping easier, London
�9 DfT guidelines, http://www.dft.gov.uk/ActOnCO2/
20 Department for Transport 2004, The Future of Transport: a network for 2030, London
2� Department for Transport, Update of UK Port Demand Forecasts to 2030 & Economic Value of Transhipment Study, London
22 Transport for London 2007, London Freight Plan sustainable freight distribution: a plan for London, London
23 Department for Transport, Update of UK Port Demand Forecasts to 2030 & Economic Value of Transhipment Study, London
24 J Sainsbury plc 2007, Corporate Responsibility Report 2007, London
25 MDS Transmodal 2006, GB Freight Report 2006, Chester
26 DfT guidelines, http://www.dft.gov.uk/ActOnCO2/

Page 32
A vision for UK freight trends towards 20�8 and beyond