a vision for simulia what analysis opportunities can be ... vision for simulia what... · a...

1
A Vision for Simulia What analysis opportunities can be opened up by HPC capability? Alison McMillan Professor in Aerospace Technology, Glyndwr University The availability of High Performance Computing and the parallelization of solvers obviously makes it possible to run ever bigger analysis jobs, BUT the purpose of this poster is to suggest the next three paradigm shifts. Now is the time to use Simulia to tackle a range of problems that in the past would never have been approached this way. Going beyond the current formulation The Second Paradigm shift is slightly less obvious: Finite Element Method is a well established technique. There is a competitive marketplace, with vendors vying to best meet the customer demands. The customer expecta- tions are mainly analysis accuracy, ease of use, and the ability to solve a broad range of problems. Particular vendors’ niche capabilities are generally additional features enhancing capability around these expectations. This tends to lead to incremental improvement, because it is bounded by the customer imagination: a paradigm shift requires a fusion of understanding of the potential technolo- gy capability and the as yet unrecognised customer need. Post-processing – being clever about searching and manipulating analysis output data Routine linear elastic time-independent analysis provides analysis results in which the stress maxima are conveniently located on the surface of the component. As analyses become more sophisticated, it becomes rather more difficult to establish which results are critical and should be assessed. The idea illustrated here in the figure on the right is to use 1D fractal based search paths to explore the 3D results domain [3]. Solvers which reflect geometrical uncertainty Engineering component stress analysis is invariably based on as-designed, or minimum tolerance geometry, but where an as manufactured high value component departs from design allowables it can be time consuming for it to be re-analysed. Radically different computational solvers might present an alternative approach to standard finite element method, with approaches such as sub-structuring, Mesh-free methods and XFEM already main-stream. Other formulations could provide the key to fast geometry update and re-analysis, as well as critical stress location identification [4]. Direct modelling of elastic wave propagation The first paradigm shift is perhaps rather an obvious one: gaining new perspectives on previously unwieldy problems using known methods. Explicit Finite Element is capable of capturing dynamic events, where the elastic wave frequency that can be modelled is limited by the element size, which must be an order of magnitude smaller than the wavelength of vibration. Thus, by choosing appropriate element sizes and making ap- propriate modelling choices, it is possible to verify the classical mathematical predictions of wave propagation [1], or to run an analysis on a structure with ap- propriate initial conditions to en- sure vibration is initiated, but with sufficient duration that the standing waves form. This figure shows a simulation of high frequency elastic wave propagation through a solid block with a central hole. The wave deformation is visualised on the external surfaces of the block [2]. In principle, a modelling process such as this could be used to simu- late ultra sound based Non-Destructive Test results. Used in tandem with shape optimisation methods, this could provide a technique for enhanced interpretation of results for improved prediction and quantification of flaw size, distribution and location. Heterogeneous Materials The third Paradigm shift proposed here is the development of modelling capability that reflects the heterogene- ity of materials. Until now, engineers have been obliged to assume material homogeneity, and to adopt pragmatic models for such phenomena as plastic flow, fracture mechanics, and creep. Developing a modelling methodology that can represent a more realistic level of heterogeneity is the starting point to discovering a physical basis for many of the material behaviour rules that are currently determined empirically, and character- ised by test. Ideally, results obtained this way should change the engineering perspective on materials characterisation, but this represents a major undertaking. The obvious challenge is to create the methodology: the less obvious, but potentially far greater, challenge is to persuade the engineering fraternity that such an approach is credible and has the potential to reduce testing costs and lead to better understanding of material performance. Empirical vs. real-physics model geometry creation The challenge is to create realistic geometry for the representation of heterogeneous materials. There are three fundamentally different approaches to generate such geometry. The direct approach is to take a real physical artefact, and generate geometry by measurement. The development of CT imaging capability and the image processing tools means that this is now a genuinely feasible approach. Alternatively, geometry can be created empirically, using CAD drawing tools and lots of imagination. There are two major difficulties here: firstly finding a methodology that can produce realistic looking geometry automatically, and secondly having a algorithmic method for characterizing and validating the “empirical” geometry in comparison with “real” geometry. A third method is to make use of software embodying relevant physical models, and use the software to develop the model. For example, in Abaqus, a set of hollow spheres could be created, either as elastic solids, or more simply as rigid surfaces, and these could be “dropped” into a converging bucket. The physics of contact and mass under gravitational load would ensure that the spheres pack in a realistic way. Geometry tools could then be used to form a solid, with the insides of the sphere representing the porosity. Modelling porosity Currently, the approach adopted here is the second. The approach used is to use a random number generator to “seed” points throughout the domain, onto which geometrical features are then built. The crucial question is to control the random distribution of such seed points [5]. Poisson Disc method The two smaller figures shown to the right represent minimum and maximum packing densities, subject to a rule that no seed point can be closer to another than by an amount R, and that every available space is filled. Also shown is a typical result of a Python implementation of a Poisson disc algorithm in Abaqus. Notice that, even for a small number of seed points, it is not possible to predetermine the number necessary to obtain a “fully dense” packing. The measurements given in this figure demonstrate that the sparse regions are indeed too small to accommo- date an additional seed, and the fully dense packing can be verified by inspection. For larger numbers of seed points this scheme is no longer feasible. This is a convenient point at which to introduce the notion of “partial packing”. This may be quantified in terms of the ratio of actual seeds placed to the number of seeds required for either the theoretical maximum or minimum fully dense packing. To illustrate this, the figures the below represent the same number of seeds but different values of R. In this case, the seed points define the centres of small pores in a material, and a nominal biaxial stress field has been applied. The colours indicate stress levels. Notice how the stress pattern distribution becomes more homogeneous as the seed point distribution tends towards fully dense. Modelling heterogeneous polycrystalline materials In modelling polycrystalline material structure the same seed point approach can be used. For example, this may mimic the seeding of crystal formation in the solidification of a metal. Again a Poisson disc algorithm can be used to provide a quantified level of “heterogeneity”. Voronoi Tessellation While the solidification seed point of the crystal can be modelled by the Poisson disc random seed point together with a random crystal orientation, the individual crystal boundaries could be defined by Voronoi tessellation based on the set of seed points. Thus each Voronoi cell represents a single crystal with randomly prescribed orientation. This is equivalent to assuming that each crystal in a domain of material starts to solidify at the same time, at the same rate, and isotropically. In reality, different regions of material in a casting mould will cool at different rates, and crystal growth would be anisotropic, influenced by temperature gradient, crystal orientation, and crystal species. The most efficient method of creating a Voronoi tessellation is Fortune’s algorithm [6], but the figure shown to the top right demonstrates a growth based method. The figure below it shows the same seed points but assumes anisotropic growth and varying growth rates. In this case, the boundaries between crystals are not straight lines. Modelling Crack Propagation in Porosity Clusters Porosity is an inevitable consequence of the manufactur- ing processes of fibre rein- forced organic matrix composites. At low percentage voidage, porosity is consid- ered benign, but quantification of the strength knock-down is difficult [7]. While single crack propagation using Abaqus XFEM is now a well established capability, multiple crack growth in a porosity cluster is yet to be understood. Here a problem domain is defined as a 2D square of resin material, with a central cluster of randomly positioned ellip- tical voids. A python script is written to generate the geom- etry and partitioning, to enable automatic meshing. Unit traction loads are applied at the boundary to create a biaxial stress state with principal stresses aligned to the diagonals. In Abaqus analysis the loads are ramped up until conditions to initiate cracks are met. Stress levels in some regions are similarly high, and while XFEM [8, 9] is a powerful tool, some care must be taken to ensure all relevant cracks are initiated. Varying the mesh is sufficient to high- light a problem with sensitivity of crack initiation condition threshold (figures left). While such small modifications might influence actual crack path, taken on balance, do the cracks modelled resemble reality? References [1]Achenbach, JD, “Wave Propagation in Elastic Solids,” North-Holland, Amster- dam, 1990. [2]McMillan AJ, “Computational modeling of ultrasound propagation using Abaqus explicit” SIMULIA UK RUM, Crewe, UK, 2013. [3]McMillan AJ, “Defect identification and characterisation algorithms for assess- ing effect on component strength”, 15ECCM, Italy, 2012. [4]McMillan AJ, Watson, G, “The use of wavelets to facilitate finite element post-processing”, Materials Science Forum, 2003 440 429-38. [5]McMillan AJ, Archer E, McIlhagger A, Lelong G, “Strength knock-down assess- ment of porosity in composites: modelling, characterising and specimen manufac- ture”, Journal of Physics: Conference Series, 2012 382 012027. [6]Fortune SJ, “A sweepline algorithm for Voronoi diagrams”, Algoithmica, 1987 2 153-74. [7]McMillan AJ, “Material strength knock-down resulting from multiple randomly positioned voids. Journal Reinforced Plastics and Composites”, 2012 31(1) 13-28. [8]Giner E, Sukumar N, Tarancon JE, Fuenmayor FJ, “An Abaqus implementation of the extended finite element method. Engineering Fracture Mechanics”, 2009 76(3) 347-68. [9]Web tutorials on XFEM by Matthew Pais, http://www.matthewpais.com/

Upload: lamkien

Post on 21-May-2018

217 views

Category:

Documents


0 download

TRANSCRIPT

A Vision for SimuliaWhat analysis opportunities can be opened up by HPC capability?

Alison McMillan Professor in Aerospace Technology, Glyndwr University

The availability of High Performance Computing and the parallelization of solversobviously makes it possible to run ever bigger analysis jobs, BUT the purpose of thisposter is to suggest the next three paradigm shifts.

Now is the time to use Simulia to tackle a range of problems that in the past wouldnever have been approached this way.

Going beyond the current formulationThe Second Paradigm shift is slightly less obvious: Finite Element Method is a well established technique. Thereis a competitive marketplace, with vendors vying to best meet the customer demands. The customer expecta-tions are mainly analysis accuracy, ease of use, and the ability to solve a broad range of problems. Particularvendors’ niche capabilities are generally additional features enhancing capability around these expectations.This tends to lead to incremental improvement, because it is bounded by the customerimagination: a paradigm shift requires a fusion of understanding of the potential technolo-gy capability and the as yet unrecognised customer need.Post-processing – being clever about searching and manipulating analysis output data

Routine linear elastic time-independent analysis provides analysis results in which the stress maxima areconveniently located on the surface of the component. As analyses become more sophisticated, itbecomes rather more difficult to establish which results are critical and should be assessed. The ideaillustrated here in the figure on the right is to use 1D fractal based search paths to explore the 3D results domain [3].

Solvers which reflect geometrical uncertainty

Engineering component stress analysis is invariably based on as-designed, or minimum tolerance geometry, but where an asmanufactured high value component departs from design allowables it can be time consuming for it to be re-analysed. Radicallydifferent computational solvers might present an alternative approach to standard finite element method, with approaches suchas sub-structuring, Mesh-free methods and XFEM already main-stream. Other formulations could provide the key to fastgeometry update and re-analysis, as well as critical stress location identification [4].

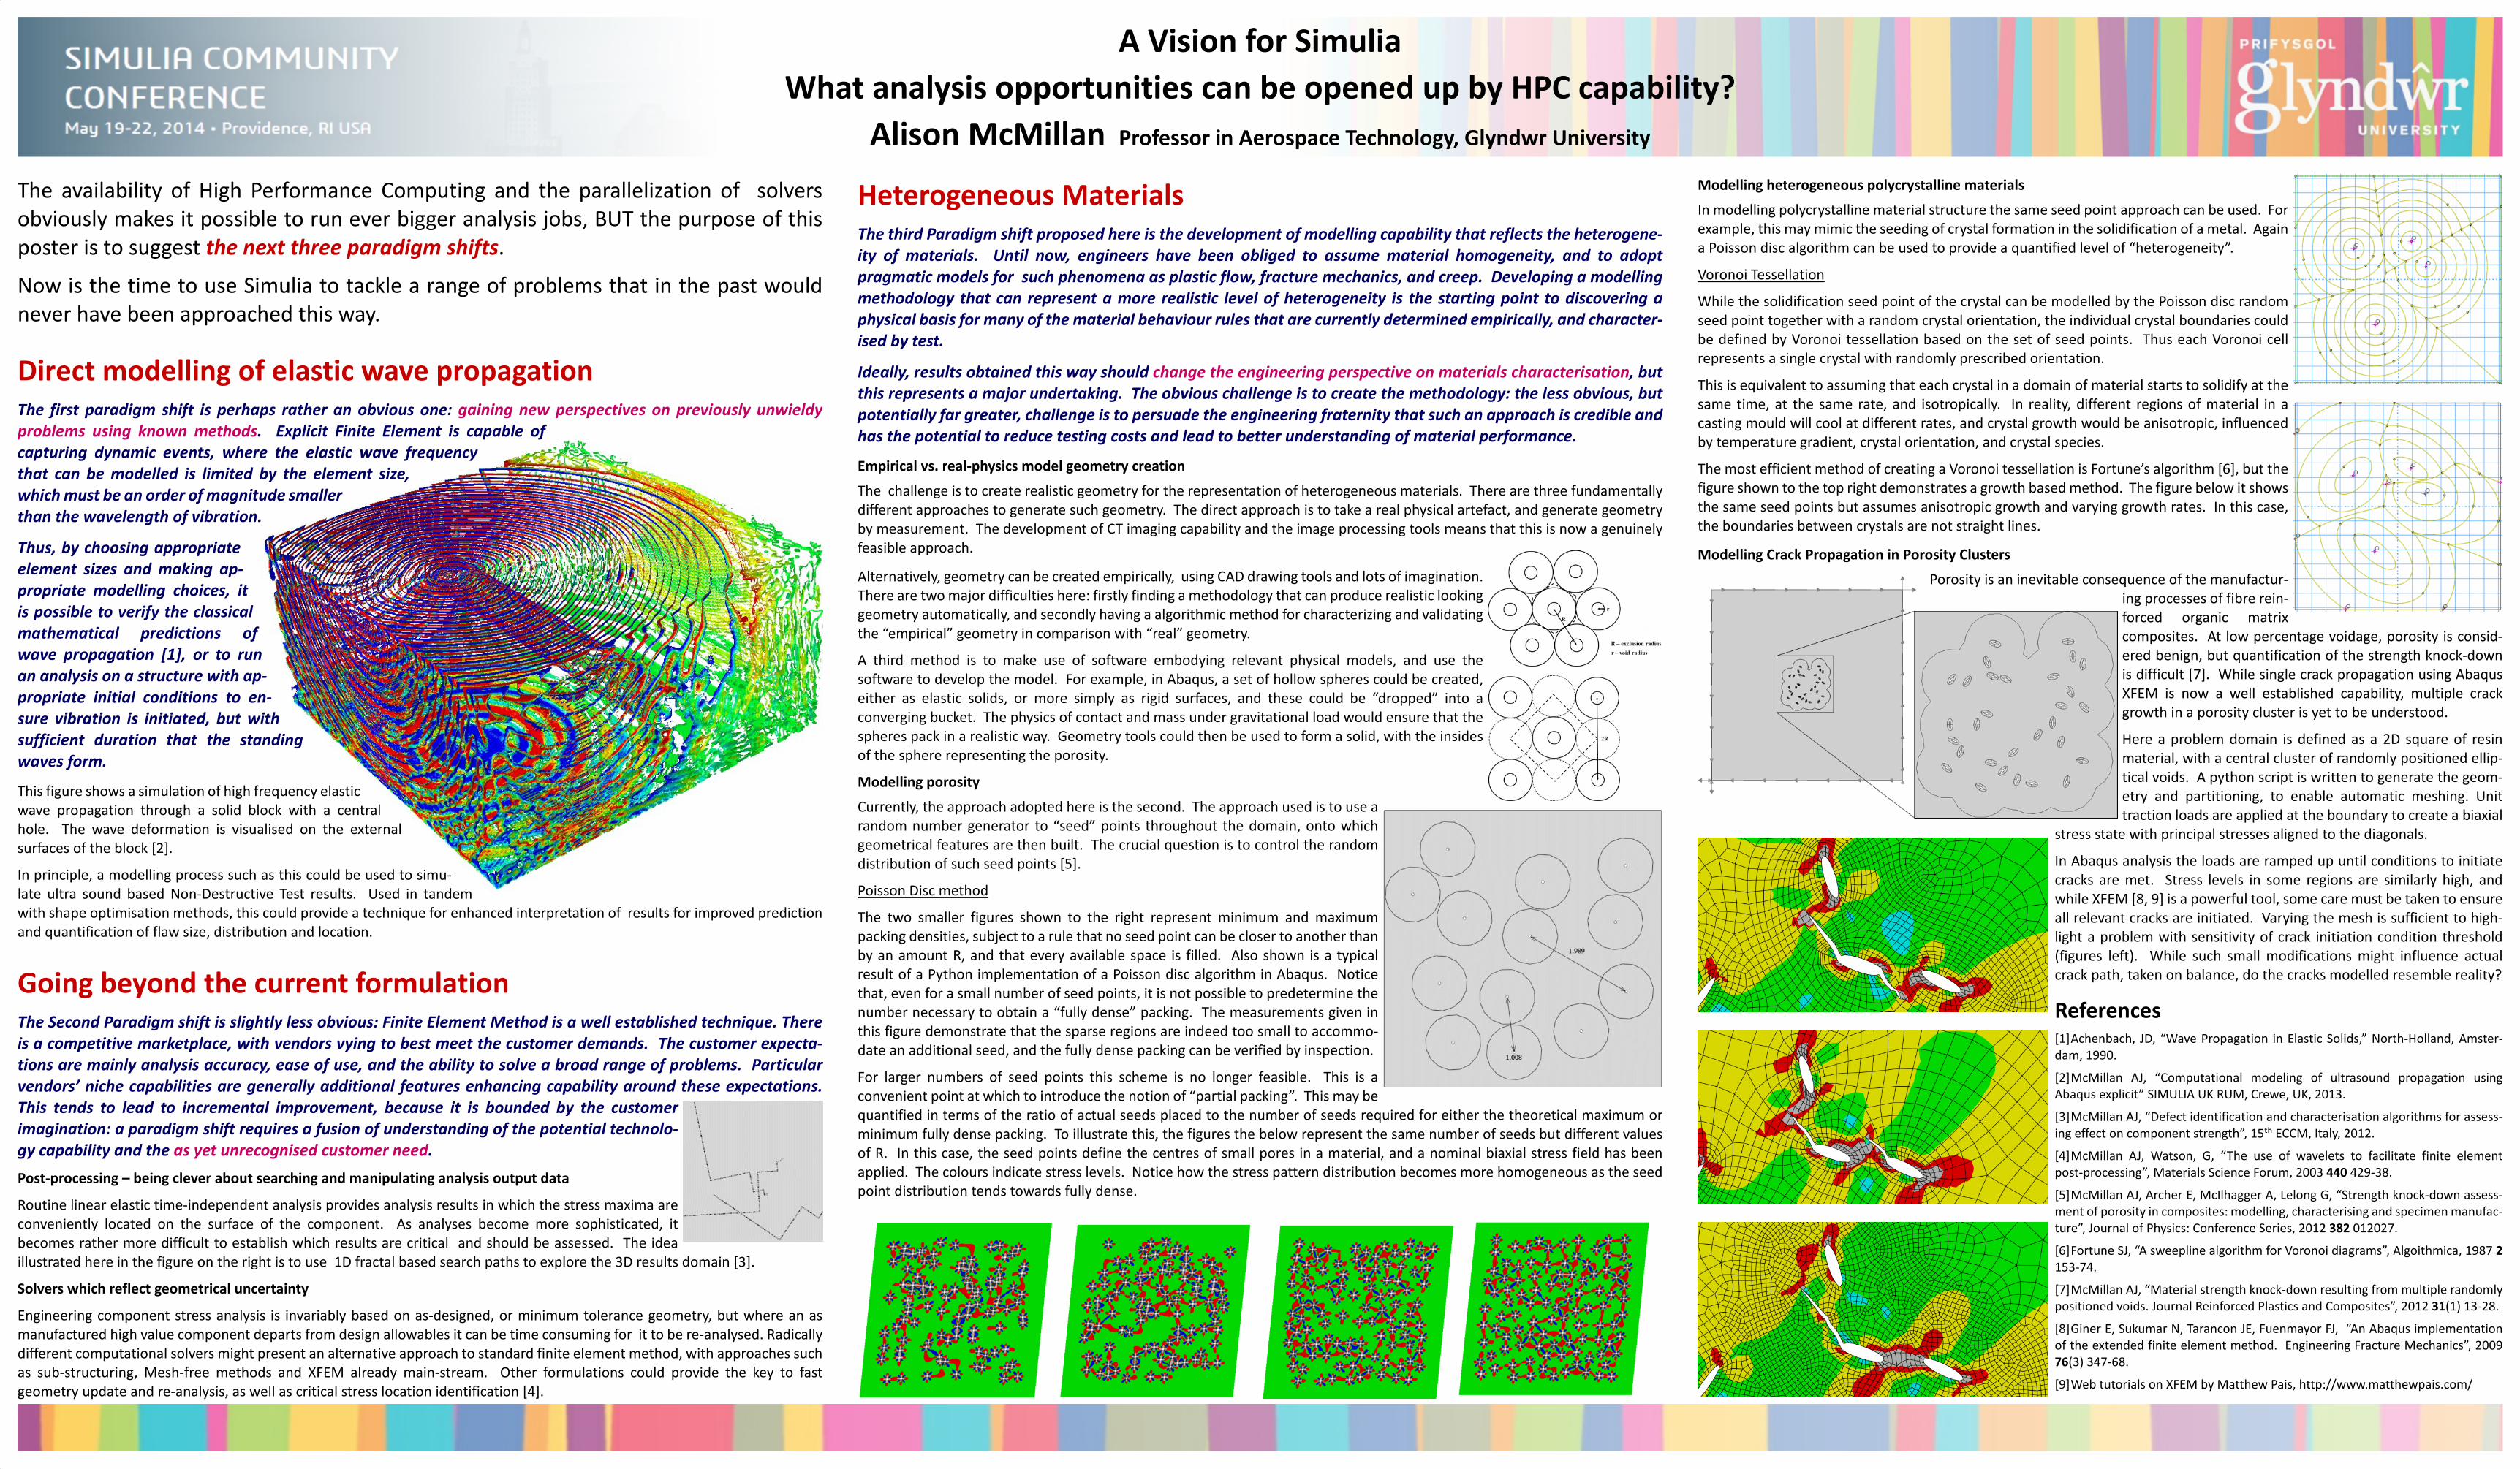
Direct modelling of elastic wave propagationThe first paradigm shift is perhaps rather an obvious one: gaining new perspectives on previously unwieldyproblems using known methods. Explicit Finite Element is capable ofcapturing dynamic events, where the elastic wave frequencythat can be modelled is limited by the element size,which must be an order of magnitude smallerthan the wavelength of vibration.

Thus, by choosing appropriateelement sizes and making ap-propriate modelling choices, itis possible to verify the classicalmathematical predictions ofwave propagation [1], or to runan analysis on a structure with ap-propriate initial conditions to en-sure vibration is initiated, but withsufficient duration that the standingwaves form.

This figure shows a simulation of high frequency elasticwave propagation through a solid block with a centralhole. The wave deformation is visualised on the externalsurfaces of the block [2].

In principle, a modelling process such as this could be used to simu-late ultra sound based Non-Destructive Test results. Used in tandemwith shape optimisation methods, this could provide a technique for enhanced interpretation of results for improved predictionand quantification of flaw size, distribution and location.

Heterogeneous MaterialsThe third Paradigm shift proposed here is the development of modelling capability that reflects the heterogene-ity of materials. Until now, engineers have been obliged to assume material homogeneity, and to adoptpragmatic models for such phenomena as plastic flow, fracture mechanics, and creep. Developing a modellingmethodology that can represent a more realistic level of heterogeneity is the starting point to discovering aphysical basis for many of the material behaviour rules that are currently determined empirically, and character-ised by test.

Ideally, results obtained this way should change the engineering perspective on materials characterisation, butthis represents a major undertaking. The obvious challenge is to create the methodology: the less obvious, butpotentially far greater, challenge is to persuade the engineering fraternity that such an approach is credible andhas the potential to reduce testing costs and lead to better understanding of material performance.

Empirical vs. real-physics model geometry creation

The challenge is to create realistic geometry for the representation of heterogeneous materials. There are three fundamentallydifferent approaches to generate such geometry. The direct approach is to take a real physical artefact, and generate geometryby measurement. The development of CT imaging capability and the image processing tools means that this is now a genuinelyfeasible approach.

Alternatively, geometry can be created empirically, using CAD drawing tools and lots of imagination.There are two major difficulties here: firstly finding a methodology that can produce realistic lookinggeometry automatically, and secondly having a algorithmic method for characterizing and validatingthe “empirical” geometry in comparison with “real” geometry.

A third method is to make use of software embodying relevant physical models, and use thesoftware to develop the model. For example, in Abaqus, a set of hollow spheres could be created,either as elastic solids, or more simply as rigid surfaces, and these could be “dropped” into aconverging bucket. The physics of contact and mass under gravitational load would ensure that thespheres pack in a realistic way. Geometry tools could then be used to form a solid, with the insidesof the sphere representing the porosity.

Modelling porosity

Currently, the approach adopted here is the second. The approach used is to use arandom number generator to “seed” points throughout the domain, onto whichgeometrical features are then built. The crucial question is to control the randomdistribution of such seed points [5].

Poisson Disc method

The two smaller figures shown to the right represent minimum and maximumpacking densities, subject to a rule that no seed point can be closer to another thanby an amount R, and that every available space is filled. Also shown is a typicalresult of a Python implementation of a Poisson disc algorithm in Abaqus. Noticethat, even for a small number of seed points, it is not possible to predetermine thenumber necessary to obtain a “fully dense” packing. The measurements given inthis figure demonstrate that the sparse regions are indeed too small to accommo-date an additional seed, and the fully dense packing can be verified by inspection.

For larger numbers of seed points this scheme is no longer feasible. This is aconvenient point at which to introduce the notion of “partial packing”. This may bequantified in terms of the ratio of actual seeds placed to the number of seeds required for either the theoretical maximum orminimum fully dense packing. To illustrate this, the figures the below represent the same number of seeds but different valuesof R. In this case, the seed points define the centres of small pores in a material, and a nominal biaxial stress field has beenapplied. The colours indicate stress levels. Notice how the stress pattern distribution becomes more homogeneous as the seedpoint distribution tends towards fully dense.

Modelling heterogeneous polycrystalline materials

In modelling polycrystalline material structure the same seed point approach can be used. Forexample, this may mimic the seeding of crystal formation in the solidification of a metal. Againa Poisson disc algorithm can be used to provide a quantified level of “heterogeneity”.

Voronoi Tessellation

While the solidification seed point of the crystal can be modelled by the Poisson disc randomseed point together with a random crystal orientation, the individual crystal boundaries couldbe defined by Voronoi tessellation based on the set of seed points. Thus each Voronoi cellrepresents a single crystal with randomly prescribed orientation.

This is equivalent to assuming that each crystal in a domain of material starts to solidify at thesame time, at the same rate, and isotropically. In reality, different regions of material in acasting mould will cool at different rates, and crystal growth would be anisotropic, influencedby temperature gradient, crystal orientation, and crystal species.

The most efficient method of creating a Voronoi tessellation is Fortune’s algorithm [6], but thefigure shown to the top right demonstrates a growth based method. The figure below it showsthe same seed points but assumes anisotropic growth and varying growth rates. In this case,the boundaries between crystals are not straight lines.

Modelling Crack Propagation in Porosity Clusters

Porosity is an inevitable consequence of the manufactur-ing processes of fibre rein-forced organic matrixcomposites. At low percentage voidage, porosity is consid-ered benign, but quantification of the strength knock-downis difficult [7]. While single crack propagation using AbaqusXFEM is now a well established capability, multiple crackgrowth in a porosity cluster is yet to be understood.

Here a problem domain is defined as a 2D square of resinmaterial, with a central cluster of randomly positioned ellip-tical voids. A python script is written to generate the geom-etry and partitioning, to enable automatic meshing. Unittraction loads are applied at the boundary to create a biaxial

stress state with principal stresses aligned to the diagonals.

In Abaqus analysis the loads are ramped up until conditions to initiatecracks are met. Stress levels in some regions are similarly high, andwhile XFEM [8, 9] is a powerful tool, some care must be taken to ensureall relevant cracks are initiated. Varying the mesh is sufficient to high-light a problem with sensitivity of crack initiation condition threshold(figures left). While such small modifications might influence actualcrack path, taken on balance, do the cracks modelled resemble reality?

References[1]Achenbach, JD, “Wave Propagation in Elastic Solids,” North-Holland, Amster-dam, 1990.

[2]McMillan AJ, “Computational modeling of ultrasound propagation usingAbaqus explicit” SIMULIA UK RUM, Crewe, UK, 2013.

[3]McMillan AJ, “Defect identification and characterisation algorithms for assess-ing effect on component strength”, 15�� ECCM, Italy, 2012.

[4]McMillan AJ, Watson, G, “The use of wavelets to facilitate finite elementpost-processing”, Materials Science Forum, 2003 440 429-38.

[5]McMillan AJ, Archer E, McIlhagger A, Lelong G, “Strength knock-down assess-ment of porosity in composites: modelling, characterising and specimen manufac-ture”, Journal of Physics: Conference Series, 2012 382 012027.

[6]Fortune SJ, “A sweepline algorithm for Voronoi diagrams”, Algoithmica, 1987 2153-74.

[7]McMillan AJ, “Material strength knock-down resulting from multiple randomlypositioned voids. Journal Reinforced Plastics and Composites”, 2012 31(1) 13-28.

[8]Giner E, Sukumar N, Tarancon JE, Fuenmayor FJ, “An Abaqus implementationof the extended finite element method. Engineering Fracture Mechanics”, 200976(3) 347-68.

[9]Web tutorials on XFEM by Matthew Pais, http://www.matthewpais.com/